Embed Size (px)
Citation preview

The New Zealand Refining Company
DisclaimerThis presentation contains forward looking statements that are subject to risks and uncertainties associated with the refining environment, including price and foreign currency fluctuations, production results, demand for NZRC’s services and other conditions. Actual results could vary materially.
Section 1: Our Company
Section 2: NZRC Results
Section 3: Global Refining Situation
Section 1: NZRC Results
Section 2: Growth Project Update
Section 3: Global Refining Situation
Section 4: Outlook Summary
Appendix I: Our Company

The New Zealand Refining Company
DisclaimerThis presentation contains forward looking statements that are subject to risks and uncertainties associated with the refining environment, including price and foreign currency fluctuations, production results, demand for NZRC’s services and other conditions. Actual results could vary materially.
Section 1: Our Company
Section 2: NZRC Results
Section 3: Global Refining Situation
Section 1:
NZRC Results6 months 30 June 2011

NZRC 2011 YTD Performance
Lowlights
Financial - weak US dollar- electricity price spike/UTS (March)
Operations - unplanned outages- production planning
Highlights
Safety - 456 days without an Lost time accident- Recordable injury = 1.8 per m hrs worked - BP risk management review
Financial - NPAT better than budget- refinery margins- debt repayment- insurance roll over- annual reporting ARA Gold award- risk management process
Operations - energy / Co2- “pit stop”
Strategy - approval of “growth project” feed - scenario testing- brand
People - 50th anniversary- leadership / talent development

Financial Results 30 June 2011
30 June 2010 Change
%
OPERATING RESULTS
Operating revenue ($000) 156,663 133,639 17.2Other Income 1,214 1,367 (11.2)Net profit before income tax ($000) 43,268 32,997 31.1Net profit after income tax ($000) 31,201 29,005 7.6 SHARE INDICATORS Net asset backing (per share) $2.16 $2.04 5.9Earnings per share (annualised) 22 cents 21 cents 4.8 NUMBERS Shareholders 3,863 3,770 2.5Employees 350 362 (3.3)

NPAT – 30 June 2010 -30 June 2011
NPAT Jun-10 to NPAT Jun-11 ($ Million)
0
10
20
30
40
50
60
Net P
roft After Tax Jun-10 (29)
Refining M
argin (21.8)Favourable
Exchange R
ate (-11.7)U
nfavourable
Intake Barrels P
rocessed (4.3)Favourable
Pipeline Incom
e (-1.3)U
nfavourable
Operating C
osts (-4.9)U
nfavourable
Depreciation &
Financing (-2.9)U
nfavourable
Electricity (1.8) Favourable
Taxation (-2.1) Unfavourable
Deferred tax release Jun-10 (-6)
Unfavourable
Other (3.1) Favourable
Net P
roft After Tax Jun-11
(31.2)$m
illio
n
Revenue
30 June 2011 30 June 2010 31 Dec 2010
KEY VARIABLES
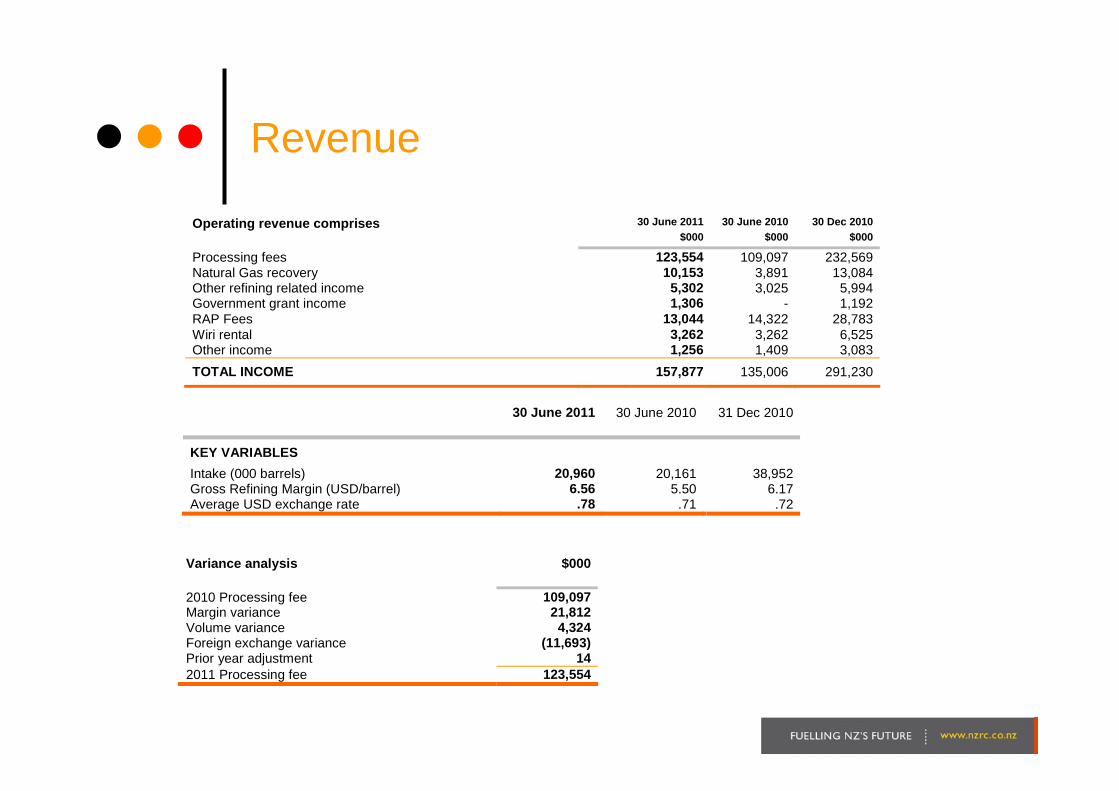
Intake (000 barrels) 20,960 20,161 38,952Gross Refining Margin (USD/barrel) 6.56 5.50 6.17Average USD exchange rate .78 .71 .72
Variance analysis $000
2010 Processing fee 109,097Margin variance 21,812Volume variance 4,324Foreign exchange variance (11,693)Prior year adjustment 142011 Processing fee 123,554
Operating revenue comprises 30 June 2011 30 June 2010 30 Dec 2010 $000 $000 $000
Processing fees 123,554 109,097 232,569Natural Gas recovery 10,153 3,891 13,084Other refining related income 5,302 3,025 5,994Government grant income 1,306 - 1,192RAP Fees 13,044 14,322 28,783Wiri rental 3,262 3,262 6,525Other income 1,256 1,409 3,083TOTAL INCOME 157,877 135,006 291,230

Expenses
Utilities and Chemicals- Up 31% on previous corresponding half year as a result of increased natural gas consumption (~7m), partly offset by lower electricity prices in 2011.
Materials and contractor payments –Increase in materials and contractors is largely due to the redeployment of contractors to capital works (shutdown) in 2010. Some additional maintenance required following severe weather (flooding) in late January 2011, and emerging maintenance completed on the Hydrogen Manufacturing Unit (Hydro-cracker shutdown for 10 days) in Mar/April period.
Net finance costs – Finance costs have decreased due to decreased borrowings (average $140.5 million Jan-June 2010, compared to $72.3 million for 2011).
Operating expenses comprises 2011 2010 $000 $000
Utilities and chemicals 29,089 22,132 Materials and contractors payments 11,590 8,773 Wages and salaries 20,891 21,750 Depreciation, amortisation and disposal costs 39,581 35,595 Administration costs 10,827 10,034 Net Finance costs 2,651 3,724
Total costs 114,629 102,008

Cash Generation-6 months ended 30 June 2011
Borrowings as at 30 June 2011 amount to $53.5m (30 June 2010: 152m)
Cash generated
Borrow ings$32 million
Operations$68 million
Dividends$28 million
Capital development$8 million
0
10
20
30
40
50
60
70
80
Cashflow from Cash used in
NZ$
M

Section 2:
Growth Project - Update

NZRC Strategic Plan

New Growth Projects
The Projects:New Greenfield Platforming Unit with continuous catalyst regeneration. Second project to revamp naptha hydrotreating unit (NHT), including new naptha splitter column.Strategically important, these projects would increase our market share of gasoline to ~65-80% of NZ market.Are affordable and attractive.Capital investment in the New Growth projects, would eliminate spends on refurbishing old 1960’s technology ( a re-life project). Management are undertaking a feasibility study on the platforming unit relife, should the growth option not proceed.
Board sanctioned $23m to progress FEED (front end engineering and design) in February 2011.
Contracts signed with Worley Parsons and UOP
On target to deliver:Detailed design specifications, +/- 10% Cost estimate Risk & Mitigation Project Execution PlanBusiness Case Validation (premises, deliverables, value-add)Financing Arrangements

Section 3:
Global Refining Situation

Highlights
International MarketsGlobal demand for oil products has continued to grow, driven almost entirely by non OECD countries.Product stocks have returned to “typical” levels.Crude oil prices continued to rise and has stabilised in a $100 - 120/bbl range. At the same time the US$ has weakend.Refining margins have remained at better than expected levels, ~$3/bbl in Singapore.Supply-demand fundamentals remain poor in the OECD countries. Global refinery utilisation remained at ~80%.The global response to close/sell refinery capacity and to restructure continued.China kept on growing, remaining the main driver behind the increasing oil consumption.
NZRCGRM of ~$6.56/bbl achieved. There was a dip in Q1 due to an unplanned outage of thehydrocracker (loss of upgrading margin).NZRC customers continued with full utilisation.
For the year to date…

Refining Fundamentals
Refining capacity additions continue to outpace expected demandCapacity additions during 2011 – 2016 continue at previously estimated levels.
Additional ~9.6 Mbbl/d crude distillation capacity.Additional ~6.9 Mbbl/d of upgrading capacity.
In the OECD countries rationalisation continues with 1.8 Mbbl/d of distillation capacity shut or due to be shut. Europe’s refining industry is facing a major restructuring due to declining demand. Since 2009, European refinery capacity has been cut by ~580 kbbl/d.A lull in refinery capacity additions in 2011, helped by refinery closures, resulted in shrinking surplus capacity.
Refinery utilisationGlobal refinery utilisation is seen declining from ~80% to ~78% by 2016.Rationalisation will need to continue.
Capacity Growth vs Demand Change (kbbl/d) and Utilisation (%)
0
1,000
2,000
3,000
4,000
5,000
6,000
2006-10 2011 2012 2013 2014 2015 201660.0%
65.0%
70.0%
75.0%
80.0%
85.0%
90.0%
Oil & NGL Demand Change Crude Distillation Capacity Upgrading CapacityUtilisation: OECD (%) - RH Utilisation: Non-OECD (%) - RH

Refining Margins – Singapore
Margin driversHydro-skimming margins weakened to well be low zero.Complex margins have been increasing on the back of an increasing Product Light-Heavy differential (upgrading margin).
Notes:1. Singapore Hydroskimming
reflects a generic simple refinery in Singapore processing Arab Light. Products are priced at MOPS with no quality premia.
2. Singapore Complex reflects a generic upgrading refinery in Singapore processing Arab Light. Products are priced at MOPS with no quality premia.
3. Product Light-Heavy = (MOPS Mogas 95 – MOPS Gasoil 0.5%S) / 2 – MOPS HFO.
4. For full definitions refer to Defintions & Terminology slide at the end of the presentation.
Margin Drivers (US$/bbl)
-4.00
-2.00
0.00
2.00
4.00
6.00
8.00
10.00
12.00
2002
2003
2004
2005
2006
2007
2008
2009
2010
2011
TD
10-Q
310
-Q4
11-Q
1
11-Q
2
-40
-20
0
20
40
60
80
100
120Singapore Hydroskimming (Arab Light)Singapore Complex (Arab Light)Crude Price (Dubai): RH AxisProduct Light-Heavy: RH Axis

Refining Margins – NZRC
Margin uplift elements NZRC has retained its margin uplift over the Singapore complex margin. Freight (location) advantage and product quality premia remains. Expectation that quality premia will weaken in future.The configuation/slate advantage declined due to an increasing differential beween light-sweet crude grades and Arab Light. NZRC processes ~40% light-sweet crude.
Notes:1. The Configuration/slate element
reflects difference between actual NZRC refinery and generic complex refinery in Singapore plus the effect of the feed/product slate vs. the generic refinery.
2. Location reflects freight advantage (product at import parity and crude at LR1/2 vs. VLCC into Singapore).
3. Product Quality reflects value of NZ quality products vs. MOPS Gasoline and 0.5% sulphur Diesel.
NZRC Margin Elements (USD/bbl)
-3
-2
-1
0
1
2
3
4
5
6
7
8
9
10
11
12
2002
2003
2004
2005
2006
2007
2008
2009
2010
2011
TD
10-Q
3
10-Q
4
11-Q
1
11-Q
2
Configuration/SlateLocationProduct QualitySingapore Complex (Arab Light)NZRC Margin
Impact of Hydrocracker outage

NZ Demand Outlook
Updated NZ transport fuels demand outlookMED’s published oil product forecasts (December 2010).Since 2004 transport demand growth has slowed to 0.8% p.a.
Key points:Gasoline:
NZRC supply at ~55% of demand.Future demand is expected to be flat in medium term and then slowly decline over the long term due to more fuel efficient vehicles and impact of electric cars and renewables.
Jet fuel:NZRC supply at close to 100% demand.Demand due to increased air travel is moderated by introduction of more fuel efficient planes.
Diesel:NZRC supply at close to 80% of demand.Demand follows GDP. Long term demand expected to be ~1.8% per year.

Demand Outlook – Distillate Products
With PFP comissioning NZRC’s share of total distillate product demand increased to ~72%. This will erode again over time.
NZRC vs NZ - All Distillates (kt per year)
0
2,000
4,000
6,000
8,000
10,000
12,000
1995
2000
2005
2010
2015
2020
30%
40%
50%
60%
70%
80%
90%
NZRC Production NZ Demand Range NZRC Supply vs NZ Demand (% of Ave)
PFP
PFP
Non hydrocarbon

Section 4:
Outlook Summary

Outlook Summary
80%
18
42
Plan -2011
We look on plan for the year although indication that overall NZ demand growth is less than anticipated for 2011.
Pipeline(Mbbls)
We are on plan to met target for the 2011 year. Refinery intake(Mbbls)
We are on plan to met target for the 2011 year.Market share
Better than expected refinery economics for first half of the year. Fundamentals remain weak due to ongoing surplus refining capacity and the worldwide economic outlook is uncertain:
Oil prices have remained at above $100 per barrel and Singapore margins have remained at tenable levels, despite latest market volatility. Refinery utilisation remains at around 80%.
Refinery closures and restructuring of the industry is expected to continue. This is positive from a long term perspective – inefficient players will be flushed out.
Margins(US$/bbl)
Has been significantly above our premise, currently ~0.84, but is very dependent on risk perception in international markets. Outlook is uncertain.
Exchange rate
Outlook
NZRC remains well placed to meet the needs of NZ (size, capability, integration into the NZ supply chain and competitiveness).

2011 Updated Profit Matrix
USD EXCH. RATE YTD (Jan-Jun) 0.7798 0.7798 0.7798 0.7798 0.7798 0.7798 0.7798 0.7798 0.7798
USD EXCH. RATE FORECAST (Jul-Dec) 0.60 0.65 0.70 0.75 0.80 0.85 0.90 0.95 1.00USD EXCH. RATE COMBINED (Jan-Dec) 0.69 0.71 0.74 0.76 0.79 0.81 0.84 0.86 0.89
MARGIN YTD MARGIN MARGIN NPAT NPAT NPAT NPAT NPAT NPAT NPAT NPAT NPAT
USD FORECAST COMBINED NZD $M NZD $M NZD $M NZD $M NZD $M NZD $M NZD $M NZD $M NZD $M
6.57 2.00 4.29 11 11 11 11 11 11 11 11 116.57 4.00 5.29 38 33 28 24 20 17 14 12 116.57 5.00 5.78 57 50 44 39 34 30 27 23 216.57 6.00 6.28 75 67 60 53 48 43 39 35 326.57 7.00 6.78 94 84 76 68 62 56 51 47 436.57 8.00 7.28 131 118 107 98 90 82 76 70 65
INTAKE: (BARRELS MILLIONS) 42NON PROCESS FEE REVNUE ($MILLIONS) 65NON CASH COST ($MILLIONS) 80
A revised Profit matrix has been issued by the Company based on the actual NPAT “banked” year-to-date, plus our latest estimate of costs and throughput for the year. Favourable electricity prices for 2011 underpin the revised cost estimates.
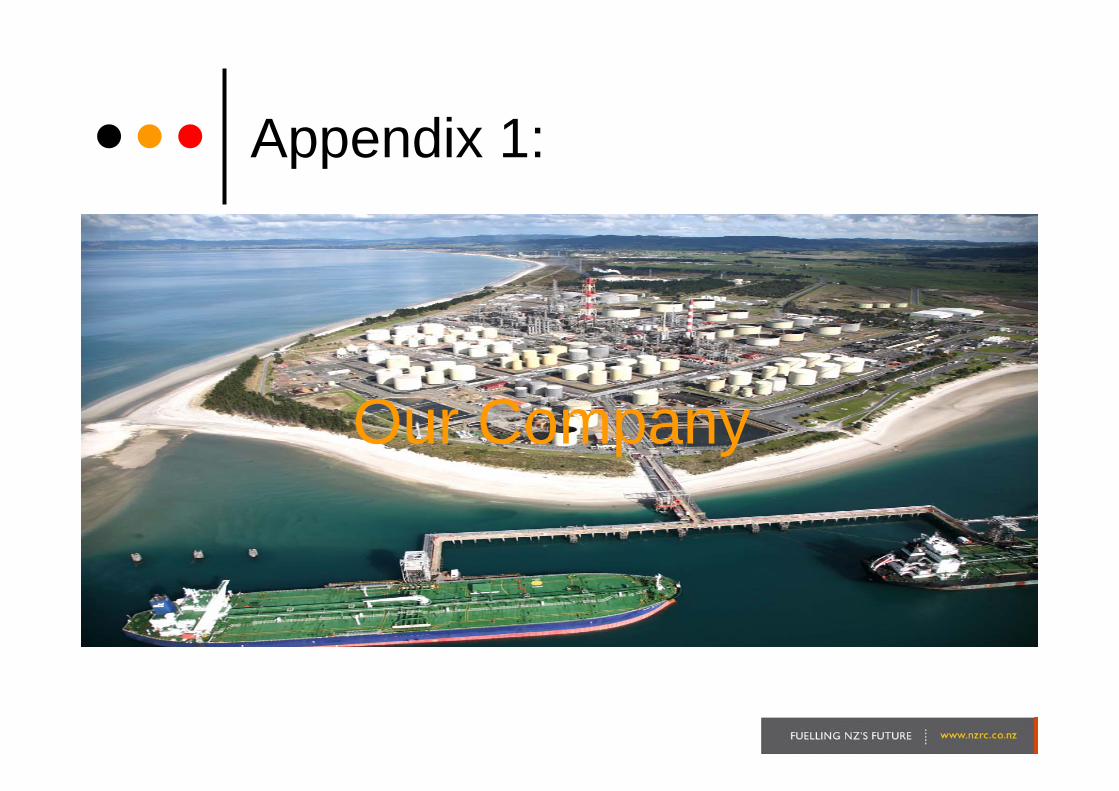
Appendix 1:
Our Company

NZRC Position in NZ Supply Chain
Feedstock purchase & delivery to NZRC
Imported product
purchase & delivery
International markets
21%
Product coastal distribution
79%
Product pipeline to Wiri
Exports & bunker fuel
Refining
44%50% 4%
Wiri terminal Truck loading
International companies
Coastal terminals
New Zealand supply chain
42 Mbbls
NZ Oil companiesNZRCLegend:
2%
Notes: - Values and percentages are projected NZRC production and market estimates for 2011.- Values include petrol, diesel, jet fuel & kerosene, fuel oil and roading bitumen.
35% 3%41%21%
New Zealand product market (~51.0 Mbbls)Petrol (40%), Jet fuel (16%), Diesel (36%), Fuel oil (6%), Bitumen (2%)

Revenue Streams
Oil Refining - Processing fee:70% of gross refining margin (GRM) generated (US$/bbl), based on:
Feedstock valued at landed price to refinery (FOB load port plus freight)Products valued at landed value at port in NZ (FOB Singapore plus freight)
Feedstock/products values based on typical market value & quotesPremia for product quality vs. Platts specificationsConverted to NZ$Subject to fee floor (~NZ$118 million in 2011) and GRM cap (US$9/bbl)
Distribution - Pipeline income:Volume related fee (NZ$ basis)Discounted fee for volumes into WaikatoFee is based on alternative transportation cost. (shipping/trucking)Wiri Terminal rental income

GRM Fundamentals
NZRC GRM follows the same dynamic as Singapore complex margins…
…plus NZRC refinery specific factors:Configuration: NZRC’s refinery configuration is not the same as the refinery configuration used for the calculation of reported indicator margins.
Feedstock/product slate: NZRC’s feedstock/product slate is not the same as the used for the calculation of indicator margins.
Location: There will be a freight differential in due to the location of NZRC compared with a refinery in Singapore. This is typically in NZRC’s favour.
Product quality: New Zealand has more stringent product quality specifications than typically used for calculating indicator margins. This results in GRM uplift.

NZRC Advantages
Location:Not reliant on export market.Very competitive with supplies into biggest market (Auckland) via pipeline.Freight cost in New Zealand’s favour.
Refinery and operation:Configuration: Hydrocracker allows bias towards middle distillates (jet fuel and diesel).Reliability: Top quartile refinery availability (Solomon benchmarking).Flexibility: Can run a large variety of crude oils.
Customer/shareholder base:Has long term customer base. Customers are financially sound.Customers are also large shareholders.
Exposure:Not exposed to absolute crude and product price movements and risk.Not exposed to inventory cost.

Definitions & Terminology
DifferentialsProduct Light-Heavy: Indication of upgrading value= (MOPS Mogas 95 + MOPS Gasoil 0.5%) /2 – MOPS HFO.
Indicator MarginsNZRC Indicator Singapore Complex Margin: Simplified margin for a generic complex (HCU) refinery in Singapore using Arab Light as feedstock with yields as per NZRC calculation. Products are valued at Mean of Platts (MOPS) with no quality premia. Feedstock freight is VLCC.Singapore Hydroskimming Margin: As above with but using simple refinery configuration.
TerminologyMED: Ministry of Economic Development.IEA: International Energy Agency.Distillates: Gasoline (mogas), naphtha, jet fuel and diesel (gasoil).Mogas: Petrol or gasoline.Gasoil: Diesel fuels.Kero: Jet fuel and kerosene.

Questions Questions