Embed Size (px)
Citation preview
MonthlyReportExecutive Update and Monthly Finance Report
January 2017

Graydens Rd
Hend
erso
ns R
d
Fran
ksto
n - F
linde
rs R
d
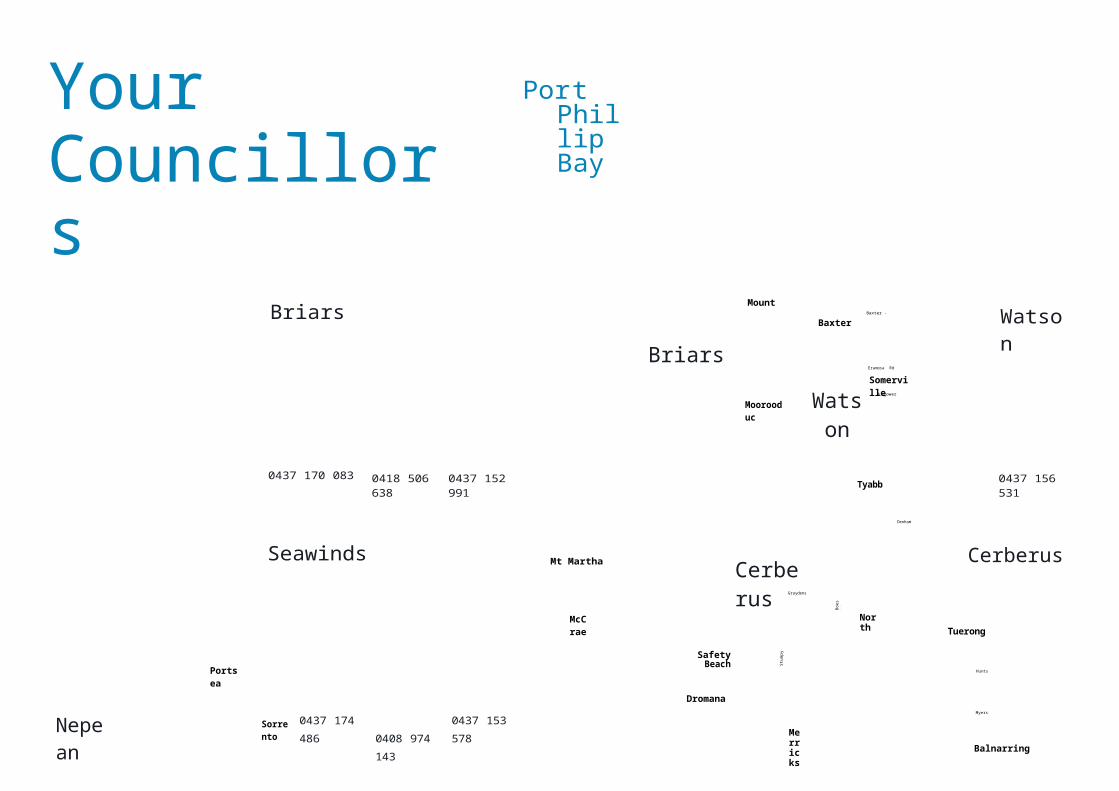
Your Councillors
Port Phillip Bay
Briars
Cr Sam Hearn Cr Bev Colomb Cr Rosie Clark
Briars
Moorooduc
Baxter
WatsonSomerville
Watson
Cr Julie Edge0437 170 083 0418 506
6380437 152 991
Tyabb 0437 156 531
Denham Rd
Seawinds Mt MarthaCerberus
Cerberus
Nepean
Portsea
Sorrento
Cr Simon Brooks 0437 174 486
Cr Antonella Celi 0408 974 143
Cr Frank Martin 0437 153 578
McCrae
Safety Beach
Dromana
Merricks North
Tuerong
Hunts Rd
Myers Rd
Balnarring
Hodgins
Rd
High St
HastingsReid Pde
Bittern
Disney St
Crib
Cr Kate Roper 0437 134 168
BlairgowrieTootgarook
Rosebud SeawindsEastbourne Rd
Arthurs Seat Red Hill Stanleys Rd
Somers
Point
Cr Hugh Fraser 0428 258 354
Cr Bryan Payne 0437 193 039
Red Hill
NepeanRye
St Andrews Beach
Capel Sound
FingalBoneo
Main Ridge
Red Hill
Red Hill South
Shoreham
Merricks
Pt Leo
Merricks Beach
Balnarring Beach
Hmas Cerberus
Western Port Bay
Mount ElizaBaxter - Tooradin Rd
Eramosa Rd East
Bungower Rd
Woolleys Rd
Bittern-Dromana Rd
Shands Rd
Rd
True
man
s Rd
Bone
o Rd
Bone
o Rd
Jetty
Rd
Mor
ning
ton
- Flin
ders
Rd
Stum
py G
ully
Rd
Cool
art
Rd
Boes
Rd
Briars
Watson
Cerberus
SeawindsNepean
Red Hill
Bass Strait Cr David Gill
0437 129 016 Cape Schanck
Flinders
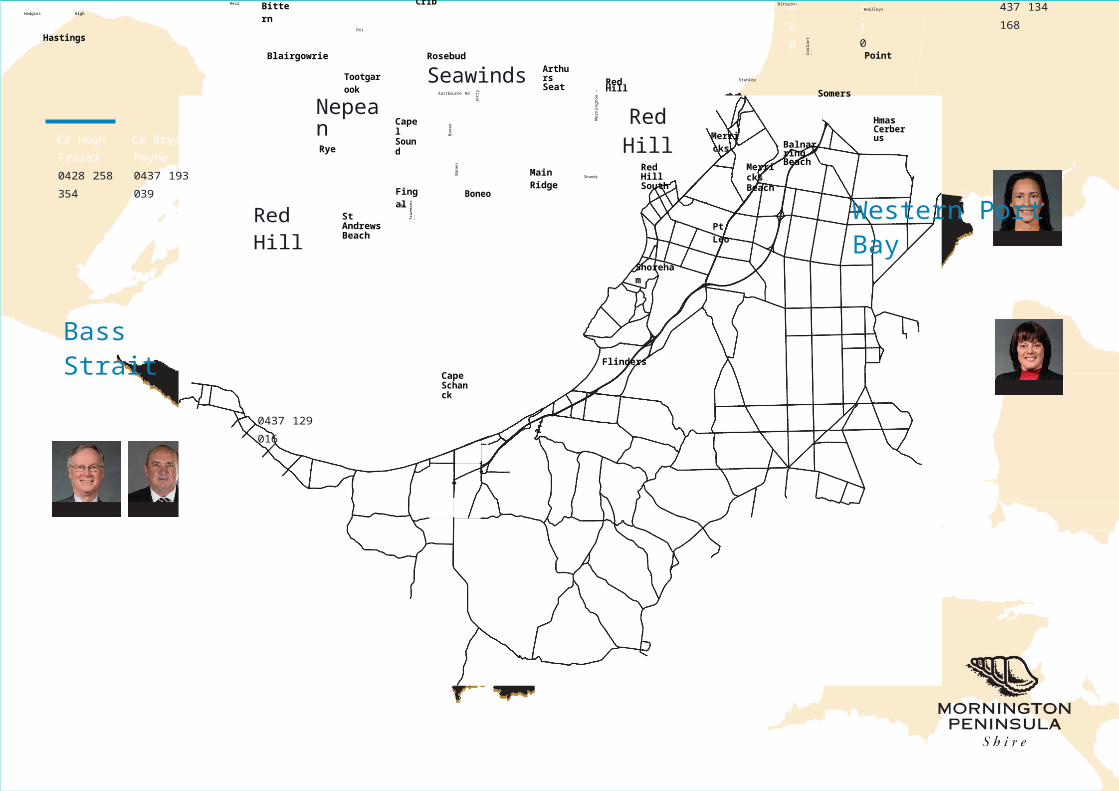
TABLE OF CONTENTS
Group Summaries
Chief Executive Officer’s Group...............................................................................1
Corporate Services Group.........................................................................................2
Infrastructure and Planning Group...........................................................................3
Finance Pack...............................................................................................................
The Executive Update summarises for the information of the community and other interested stakeholders, all of the many activities of the Shire for the preceding month, ranging from policy development and implementation through to service delivery, the provision of infrastructure, and the Shire’s financial position.
Any resident, ratepayer or other stakeholder seeking further information should contact the relevant Shire manager or director, or in the first instance can contact:
CommunicationsPh. 5950 1200
CHIEF EXECUTIVE OFFICER’S SUMMARY
Dear Ratepayers and Residents of Mornington Peninsula Shire,
January 2017 marks the beginning of the third quarter (Q3) of FY’17. Council continues its strong management of the Shires finances and officers were pleased to present a $2M surplus on operations to the Council for its consideration and subsequent distribution to a range of important community improvement initiatives.
This result follows on from a $2.8M surplus identified at the same time for the previous financial year, demonstrating Councils ongoing commitment and focus to optimize value for money for our ratepayers and residents.
Notwithstanding the 2% ‘rate cap’ for FY ’18 officers are working hard already on the draft budget to provide Council with as positive a financial position as possible.
On the advocacy front Council is continuing to advocate strongly with its neighbouring Councils for the Port of Hastings as the next container port for Victoria. As you may know Infrastructure Victoria are required to prepare a report for the Parliament on where they think the next port should be located. The tow options being considered are Port of Hastings and Bay West on the Geelong side of Port Phillip. Their draft report is due out for consideration in early March and that document is keenly awaited by all.
Significant work is ongoing within the Shire managing for the summer crowds which come to the Peninsula, it puts significant stress on Council resources but by and large the Shire officers and contract staff have responded well to the challenge of such a large influx of people. This is an ongoing budget issue for Council as they try to ensure that everyone can enjoy the Peninsula’s townships experience.
Australia Day celebrations were widely enjoyed by many thousands of Shire residents. It was a great pleasure to be part of the Australia Day Citizenship Ceremony, to welcome, congratulate and recognize the following people for their outstanding contributions to the community of the Mornington Peninsula Shire; “Citizen of the Year” Ms Bianca Appleford, for her inspiring work for the Light Up Autism Foundation which she set up for children with Autism Spectrum Disorder and other learning difficulties, “Young Citizen of the Year” Ms Steph Byrne, who works as a full time volunteer at Fusion, an organization committed to the cause of helping homeless young people. Mornington Peninsula Shire’s inaugural recipient of the Lifetime Achievement Award was presented to, Mr Barry Irving, for his extensive voluntary service to the community and the Shire’s inaugural Bravery Award was awarded to two young boys Ed Fuggle and Ben Brunton who saved the life of a jet-ski rider in the Bay.
We welcome any feedback or suggestions for improvement you care to give us and we will continue to strive for optimal performance in serving you. I commend the January 2017 Report to you.
1
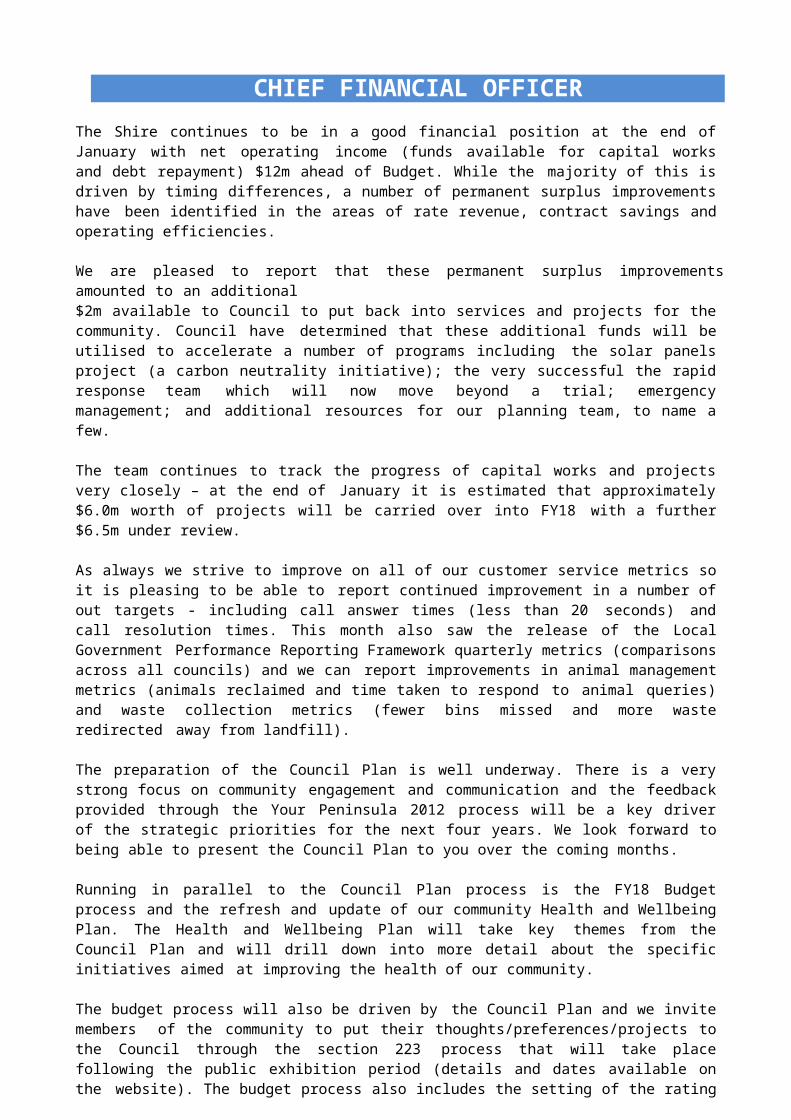
CHIEF FINANCIAL OFFICERThe Shire continues to be in a good financial position at the end of January with net operating income (funds available for capital works and debt repayment) $12m ahead of Budget. While the majority of this is driven by timing differences, a number of permanent surplus improvements have been identified in the areas of rate revenue, contract savings and operating efficiencies.
We are pleased to report that these permanent surplus improvements amounted to an additional$2m available to Council to put back into services and projects for the community. Council have determined that these additional funds will be utilised to accelerate a number of programs including the solar panels project (a carbon neutrality initiative); the very successful the rapid response team which will now move beyond a trial; emergency management; and additional resources for our planning team, to name a few.
The team continues to track the progress of capital works and projects very closely – at the end of January it is estimated that approximately $6.0m worth of projects will be carried over into FY18 with a further $6.5m under review.
As always we strive to improve on all of our customer service metrics so it is pleasing to be able to report continued improvement in a number of out targets - including call answer times (less than 20 seconds) and call resolution times. This month also saw the release of the Local Government Performance Reporting Framework quarterly metrics (comparisons across all councils) and we can report improvements in animal management metrics (animals reclaimed and time taken to respond to animal queries) and waste collection metrics (fewer bins missed and more waste redirected away from landfill).
The preparation of the Council Plan is well underway. There is a very strong focus on community engagement and communication and the feedback provided through the Your Peninsula 2012 process will be a key driver of the strategic priorities for the next four years. We look forward to being able to present the Council Plan to you over the coming months.
Running in parallel to the Council Plan process is the FY18 Budget process and the refresh and update of our community Health and Wellbeing Plan. The Health and Wellbeing Plan will take key themes from the Council Plan and will drill down into more detail about the specific initiatives aimed at improving the health of our community.
The budget process will also be driven by the Council Plan and we invite members of the community to put their thoughts/preferences/projects to the Council through the section 223 process that will take place following the public exhibition period (details and dates available on the website). The budget process also includes the setting of the rating strategy for next financial year– we note that the state government has set the rate cap for FY18 at 2.0%.
It was great to see the announcement during January that the Mornington Peninsula Shire has secured a significant event in the DreamWorks Lights show that will run at the Village Green in Rosebud during late March and April. This event was secured through our ongoing partnership with the Regional Tourism Board and the state government and will be the first time this significant event is being held in Australia – we hope the kids of the Shire will really enjoy seeing their favourite movie characters in a whole new way.
We are also pleased to report that the Shire Animal Shelter is undergoing a significant rebuild that will improve facilities for animals. The rebuild commenced in January and we will open the new shelter in the coming months.
There is a lot more going on around the Shire so please have a look at our website for more details and as always please feel free to give us a call or send an email if you have any questions, concerns or feedback.
2

CHIEF OPERATING OFFICER
The first month of 2017 has been an incredibly busy month for the Infrastructure and Planning Group with an array of services and projects progressing throughout this time.
The delivery of many of our services peaked in the first two weeks of January with the very high visitation levels we experience, particularly in the southern areas of the Mornington Peninsula. Ensuring that our cleansing services keep pace with peak visitation periods is a key focus for our Infrastructure Services team, with the frequency and effectiveness of our township litter collection, street sweeping, beach cleaning and high visibility township cleaners under constant evaluation. A particularly warm Saturday evening in the second weekend in January saw some instances of waste overflowing in bins located on the Rye foreshore on the Saturday evening. This incident has led to consideration of temperature dependent litter collection frequencies during the peak period. For example, where the temperature is predicted to be above 30 degrees Celsius on a weekend, the frequency of collection could be further increased later in the evening to increase capacity and accommodate the higher demand. Officers are working with our service provider partners to cost out these additional improvements so that they can be considered by Council.
The first Council meeting for 2017 was a Special Council meeting held on the 24th January to consider the management of the Mount Martha Pillars foreshore site. The meeting was scheduled in response to the concerns raised by local residents, who have been significantly impacted by the increasing visitation numbers to the Pillars. Previously a place only known to local residents, the popularity of the Pillars has dramatically increased in the past few years as a result of promotion articles on travel websites as a ‘must visit’ location and posts on social media (such as Facebook, Instagram and YouTube).
This increased visitation has contributed to a number of issues in the area including: Environmental and cultural heritage impacts of foot traffic accessing the Pillars including
erosion; Safety risks associated with accessing the Pillars (pedestrian movements on and across
public roads, steep and uneven cliff edges etc.); Risk of injury associated with jumping from the Pillars; Illegal and unsafe parking in the vicinity of the Pillars; Anti-social and offensive behaviour by some visitors to the Pillars including in nearby
streets.
Following consideration of the issues Council resolved to restrict access to the site via construction of a fence, with the addition of Authorised Officer to promote awareness and educate any visitors on the need to close the Pillars for safety/environmental/cultural heritage reasons) be implemented. Officers are currently preparing an Implementation Plan and a Communication and Media Plan to deliver on this Council resolution.
Finally, our Project Delivery Unit has continued to progress the delivery of the Capital Works Program with several projects moving from design to works delivery phase during January. Of particular note is the fact that Council accepted a tender for the $3.8M Citation Recreation Reserve Sports Pavilion project at its meeting held 30th January. This is one of the largest projects in this year’s Capital Works Program and it pleasing to see that it has progressed according to the planned timelines and budget.
3
Monthly Financial Report
January 2017
Monthly Financial ReportContents
Section 1 – Financial Performance1.1 Overview1.2 Corporate Performance Statement1.3 Capital & Priority Works1.4 Priority Projects1.5 Treasury
Section 2 – Financial Statements2.1 Income Statement2.2 Balance Sheet2.3 Cash Flow
AppendixA. Project Listing
2
100908070605040302010
0$’m
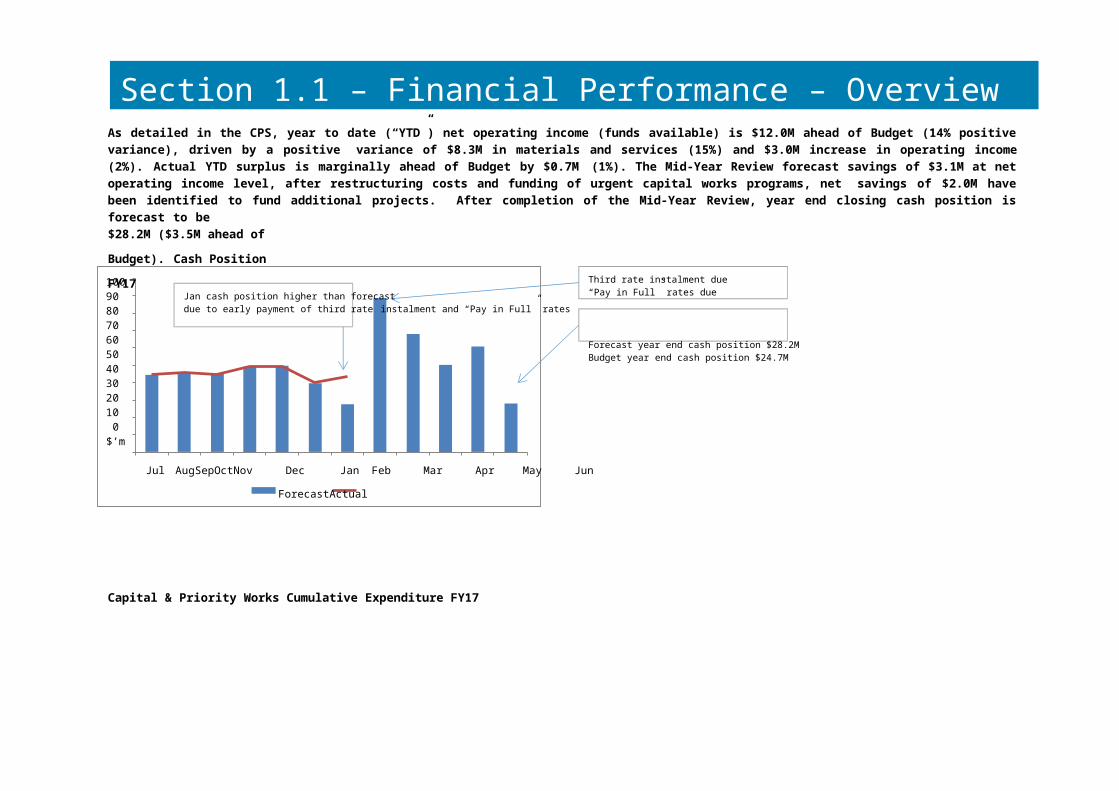
Jan cash position higher than forecastdue to early payment of third rate instalment and “Pay in Full” rates
Third rate instalment due“Pay in Full” rates due
Forecast year end cash position $28.2MBudget year end cash position $24.7M
Jul AugSepOctNov Dec Jan Feb Mar Apr May Jun
ForecastActual
70
60
50
40
30
20
10
0$’m JulAugSepOctNovDecJanFebMarAprMayJun
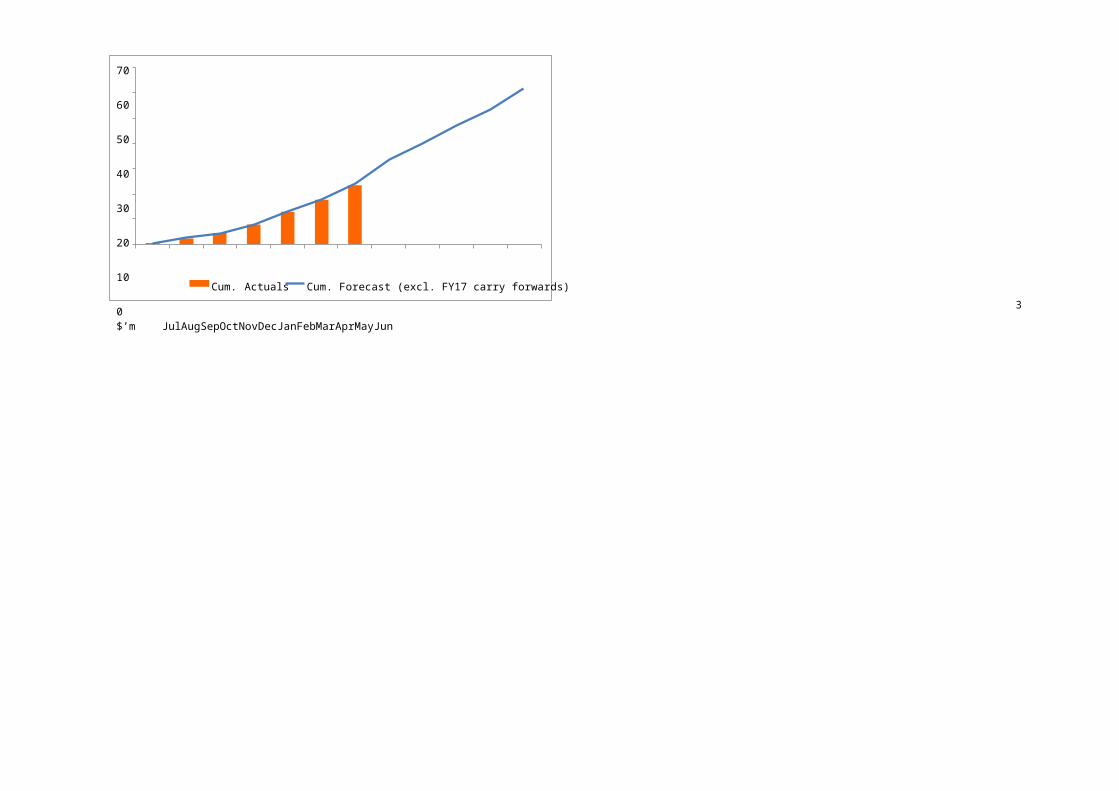
Cum. Actuals Cum. Forecast (excl. FY17 carry forwards)
Section 1.1 – Financial Performance – OverviewAs detailed in the CPS, year to date (“YTD”) net operating income (funds available) is $12.0M ahead of Budget (14% positive variance), driven by a positive variance of $8.3M in materials and services (15%) and $3.0M increase in operating income (2%). Actual YTD surplus is marginally ahead of Budget by $0.7M (1%). The Mid-Year Review forecast savings of $3.1M at net operating income level, after restructuring costs and funding of urgent capital works programs, net savings of $2.0M have been identified to fund additional projects. After completion of the Mid-Year Review, year end closing cash position is forecast to be$28.2M ($3.5M ahead of Budget). Cash Position FY17
Capital & Priority Works Cumulative Expenditure FY17
3
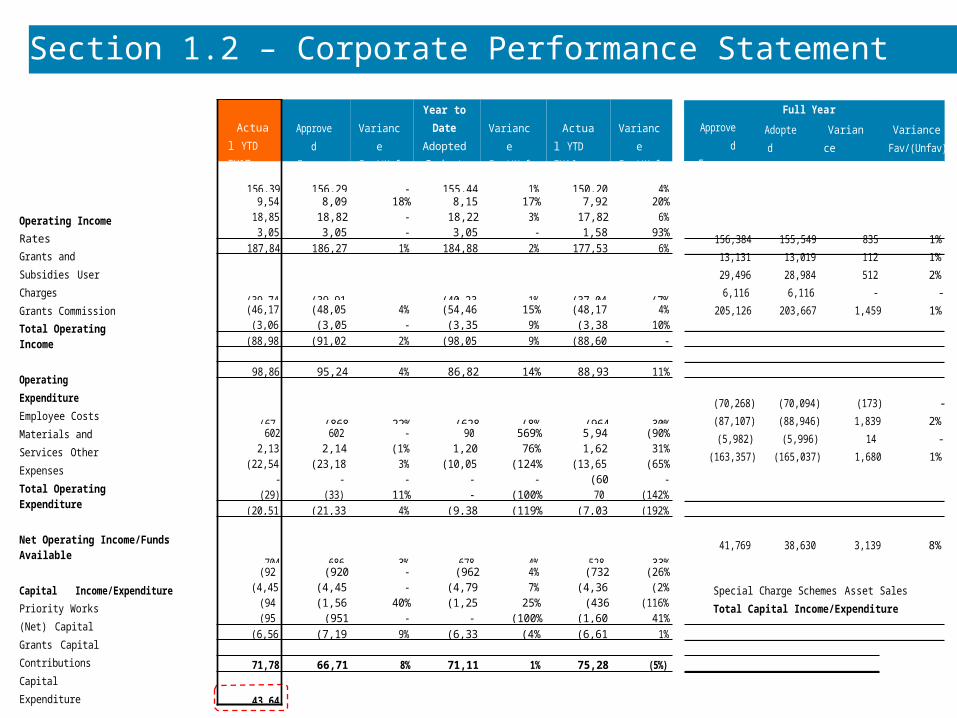
Section 1.2 – Corporate Performance Statement
Full YearApproved Forecast
Adopted Budget
Variance Fav/(Unfav)
Variance Fav/(Unfav)
Operating IncomeRatesGrants and Subsidies User ChargesGrants CommissionTotal Operating Income
$'000 $'000 $'000 %
156,384 155,549 835 1%13,131 13,019 112 1%29,496 28,984 512 2%6,116 6,116 - -
205,126 203,667 1,459 1%
Operating Expenditure Employee Costs Materials and Services Other ExpensesTotal Operating Expenditure
(70,268) (70,094) (173) -(87,107) (88,946) 1,839 2%(5,982) (5,996) 14 -
(163,357) (165,037) 1,680 1%
Net Operating Income/Funds Available 41,769 38,630 3,139 8%
Capital Income/ExpenditurePriority Works (Net) Capital Grants Capital Contributions Capital ExpenditureSpecial Charge Schemes Asset SalesTotal Capital Income/Expenditure
(3,580) (1,561) (2,019) (129%)7,962 3,960 4,002 101%2,899 2,273 626 28%
(69,527) (32,864) (36,663) (112%)2,108 - 2,108 100%6,717 - 6,717 100%
(53,421) (28,191) (25,230) (89%)
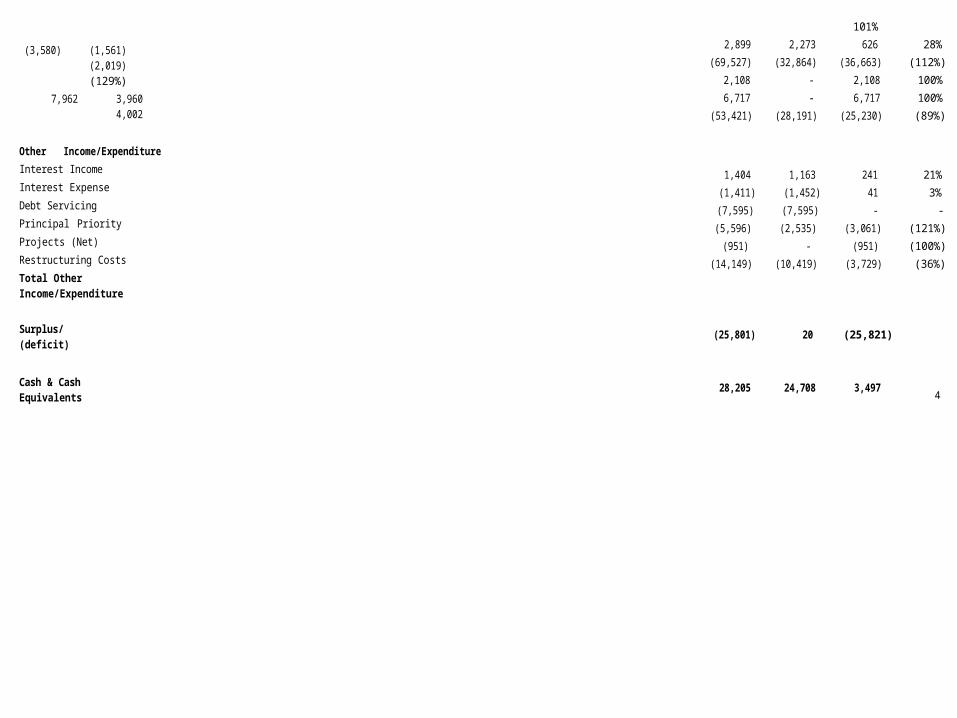
Other Income/ExpenditureInterest Income Interest ExpenseDebt Servicing Principal Priority Projects (Net) Restructuring CostsTotal Other Income/Expenditure
1,404 1,163 241 21%(1,411) (1,452) 41 3%(7,595) (7,595) - -(5,596) (2,535) (3,061) (121%)
(951) - (951) (100%)(14,149) (10,419) (3,729) (36%)
Surplus/(deficit) (25,801) 20 (25,821)
Actual YTD FY17
Approved Forecast
$'000
Variance Fav/(Unfav)
%
Year to Date
Adopted Budget
Variance Fav/(Unfav)
%
Actual YTD FY16
Variance Fav/(Unfav)
%
156,397 156,291 - 155,446 1% 150,202 4%9,543 8,099 18
%8,154 17% 7,926 20
%18,854 18,823 - 18,223 3% 17,824 6%3,051 3,058 - 3,058 - 1,584 93
%187,844 186,271 1% 184,882 2% 177,536 6%
(39,741) (39,913) - (40,235) 1% (37,042) (7%)(46,178) (48,058) 4% (54,462) 15% (48,174) 4%
(3,063) (3,054) - (3,356) 9% (3,387) 10%(88,983) (91,025) 2% (98,052) 9% (88,602) -
98,861 95,246 4% 86,829 14% 88,934 11%
(678) (868) 22%
(628) (8%) (964) 30%602 602 - 90 569% 5,947 (90%
)2,132 2,145 (1%) 1,209 76% 1,622 31%(22,543) (23,180) 3% (10,053) (124%) (13,650) (65%
)- - - - - (60) -(29) (33) 11
%- (100%) 70 (142%)
(20,516) (21,334) 4% (9,382) (119%) (7,034) (192%)
704 686 3% 678 4% 528 33%(920) (920) - (962) 4% (732) (26%
)(4,453) (4,453) - (4,797) 7% (4,368) (2%)(941) (1,560) 40
%(1,253) 25% (436) (116%)
(951) (951) - - (100%) (1,605) 41%(6,561) (7,198) 9% (6,334) (4%) (6,612) 1%
71,784 66,715 8% 71,114 1% 75,287 (5%)
43,649
Cash & Cash Equivalents 28,205 24,708 3,497 4
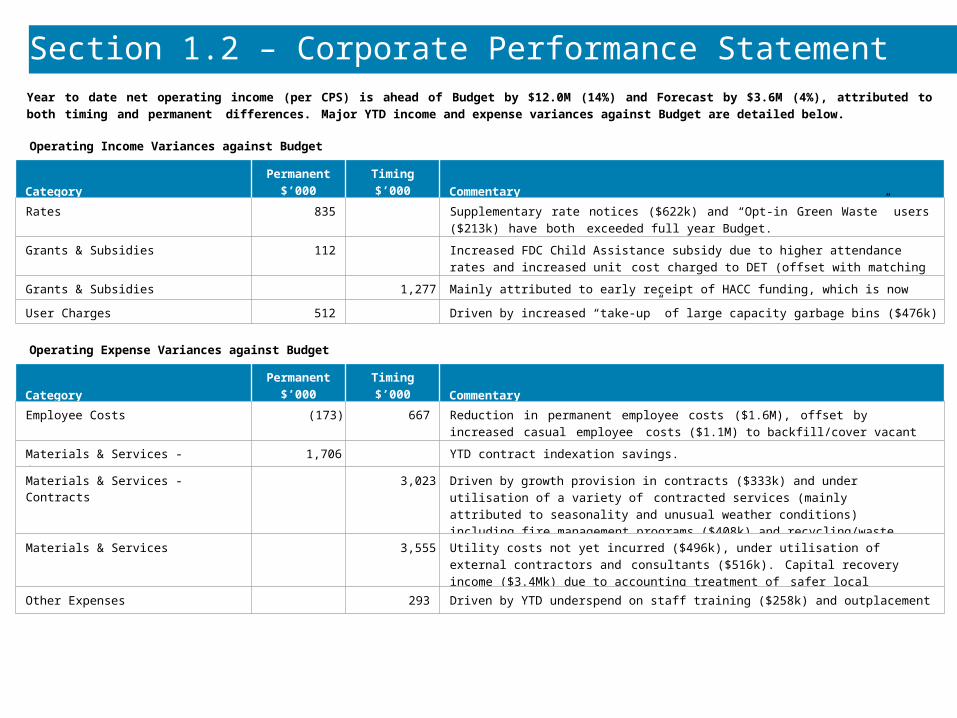
Section 1.2 – Corporate Performance StatementYear to date net operating income (per CPS) is ahead of Budget by $12.0M (14%) and Forecast by $3.6M (4%), attributed to both timing and permanent differences. Major YTD income and expense variances against Budget are detailed below.
Operating Income Variances against Budget
CategoryPermanent
$’000Timing$’000 Commentary
Rates 835 Supplementary rate notices ($622k) and “Opt-in Green Waste” users ($213k) have both exceeded full year Budget.
Grants & Subsidies 112 Increased FDC Child Assistance subsidy due to higher attendance rates and increased unit cost charged to DET (offset with matching expense).
Grants & Subsidies 1,277 Mainly attributed to early receipt of HACC funding, which is now paid quarterly in advance.
User Charges 512 Driven by increased “take-up” of large capacity garbage bins ($476k)
Operating Expense Variances against Budget
CategoryPermanent
$’000Timing$’000 Commentary
Employee Costs (173) 667 Reduction in permanent employee costs ($1.6M), offset by increased casual employee costs ($1.1M) to backfill/cover vacant positions.
Materials & Services - Contracts 1,706 YTD contract indexation savings.
Materials & Services - Contracts 3,023 Driven by growth provision in contracts ($333k) and under utilisation of a variety of contracted services (mainly attributed to seasonality and unusual weather conditions) including fire management programs ($408k) and recycling/waste costs not yet incurred ($328k).
Materials & Services 3,555 Utility costs not yet incurred ($496k), under utilisation of external contractors and consultants ($516k). Capital recovery income ($3.4Mk) due to accounting treatment of safer local roads (SLR) program (corrected during Mid-Year Review).
Other Expenses 293 Driven by YTD underspend on staff training ($258k) and outplacement services ($150k).
5

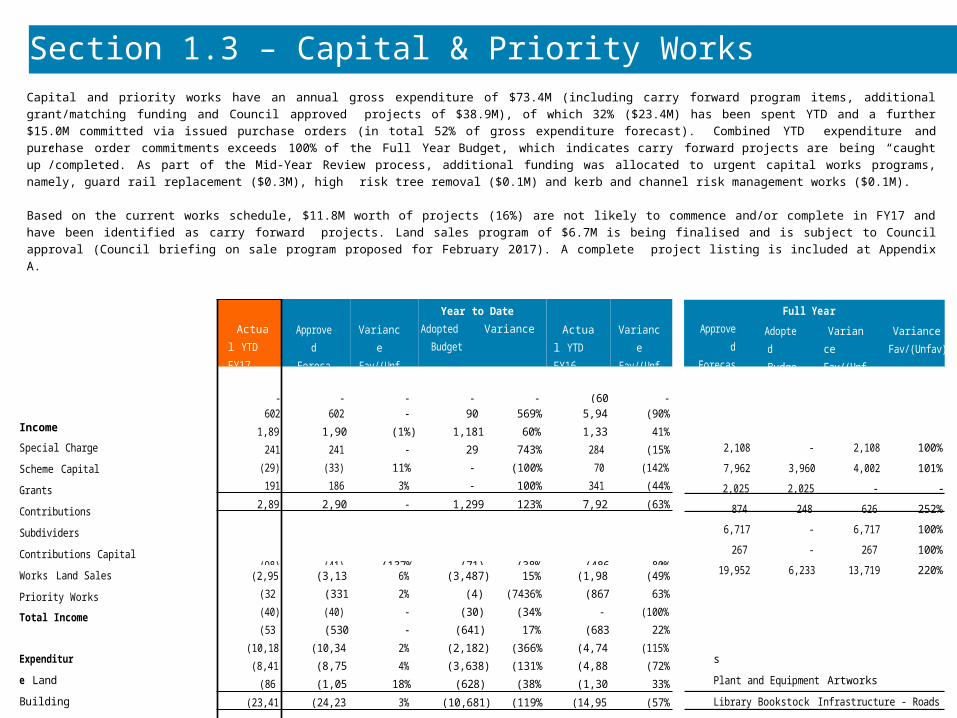
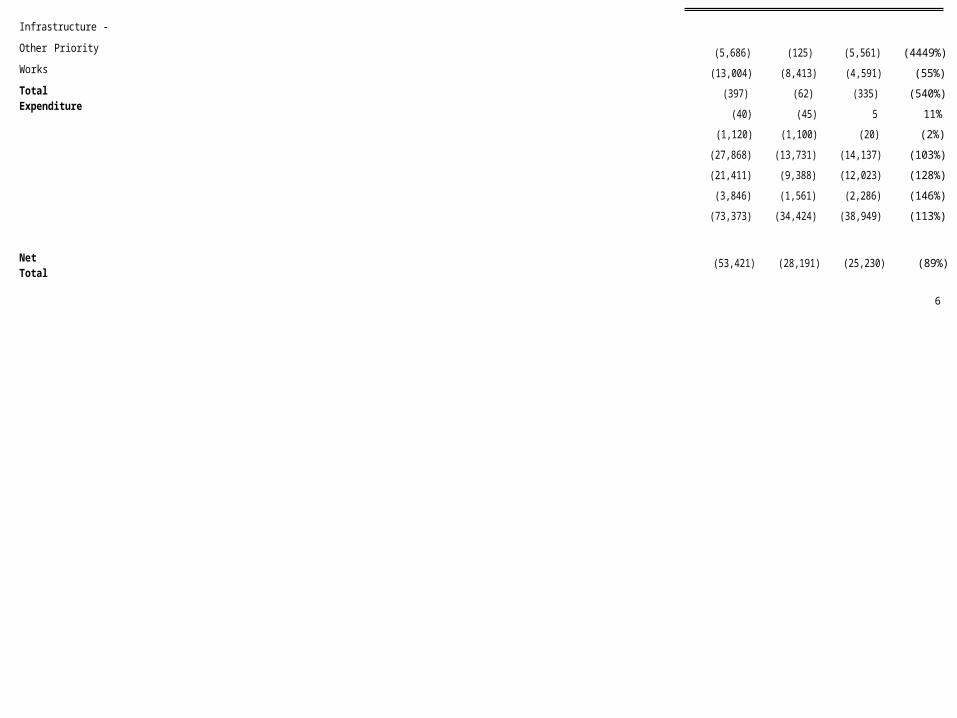
Section 1.3 – Capital & Priority WorksCapital and priority works have an annual gross expenditure of $73.4M (including carry forward program items, additional grant/matching funding and Council approved projects of $38.9M), of which 32% ($23.4M) has been spent YTD and a further $15.0M committed via issued purchase orders (in total 52% of gross expenditure forecast). Combined YTD expenditure and purchase order commitments exceeds 100% of the Full Year Budget, which indicates carry forward projects are being “caught up”/completed. As part of the Mid-Year Review process, additional funding was allocated to urgent capital works programs, namely, guard rail replacement ($0.3M), high risk tree removal ($0.1M) and kerb and channel risk management works ($0.1M).
Based on the current works schedule, $11.8M worth of projects (16%) are not likely to commence and/or complete in FY17 and have been identified as carry forward projects. Land sales program of $6.7M is being finalised and is subject to Council approval (Council briefing on sale program proposed for February 2017). A complete project listing is included at Appendix A.
Full YearApproved Forecast
Adopted Budget
Variance Fav/(Unfav)
Variance Fav/(Unfav)
IncomeSpecial Charge Scheme Capital Grants Contributions SubdividersContributions Capital Works Land SalesPriority WorksTotal Income
$'000 $'000 $'000 %
2,108 - 2,108 100%7,962 3,960 4,002 101%2,025 2,025 - -
874 248 626 252%6,717 - 6,717 100%
267 - 267 100%19,952 6,233 13,719 220%
Expenditure Land BuildingsPlant and Equipment ArtworksLibrary Bookstock Infrastructure - Roads Infrastructure - Other Priority WorksTotal Expenditure
(5,686) (125) (5,561) (4449%)(13,004) (8,413) (4,591) (55%)
(397) (62) (335) (540%)(40) (45) 5 11%
(1,120) (1,100) (20) (2%)(27,868) (13,731) (14,137) (103%)(21,411) (9,388) (12,023) (128%)
(3,846) (1,561) (2,286) (146%)(73,373) (34,424) (38,949) (113%)
Net Total (53,421) (28,191) (25,230) (89%)
6
Actual YTD FY17
$'000
Approved Forecast
$'000
Variance Fav/(Unfav)
%
Year to DateAdopted Variance
Budget Fav/(Unfav)$'000 %
Actual YTD FY16
Variance Fav/(Unfav)
%
- - - - - (60) -602 602 - 90 569% 5,947 (90%
)1,891 1,904 (1%) 1,181 60% 1,338 41%241 241 - 29 743% 284 (15%
)(29) (33) 11% - (100%) 70 (142%)191 186 3% - 100% 341 (44%
)2,895 2,900 - 1,299 123% 7,920 (63%)
(98) (41) (137%) (71) (38%) (486) 80%(2,952) (3,138) 6% (3,487) 15% (1,987) (49%
)(324) (331) 2% (4) (7436%) (867) 63%(40) (40) - (30) (34%) - (100%)
(530) (530) - (641) 17% (683) 22%(10,180) (10,342) 2% (2,182) (366%) (4,740) (115%)
(8,418) (8,757) 4% (3,638) (131%) (4,886) (72%)(868) (1,054) 18% (628) (38%) (1,305) 33
%(23,412) (24,234) 3% (10,681) (119%) (14,955) (57%)
(20,516) (21,334) 4% (9,382) (119%) (7,034) (192%)
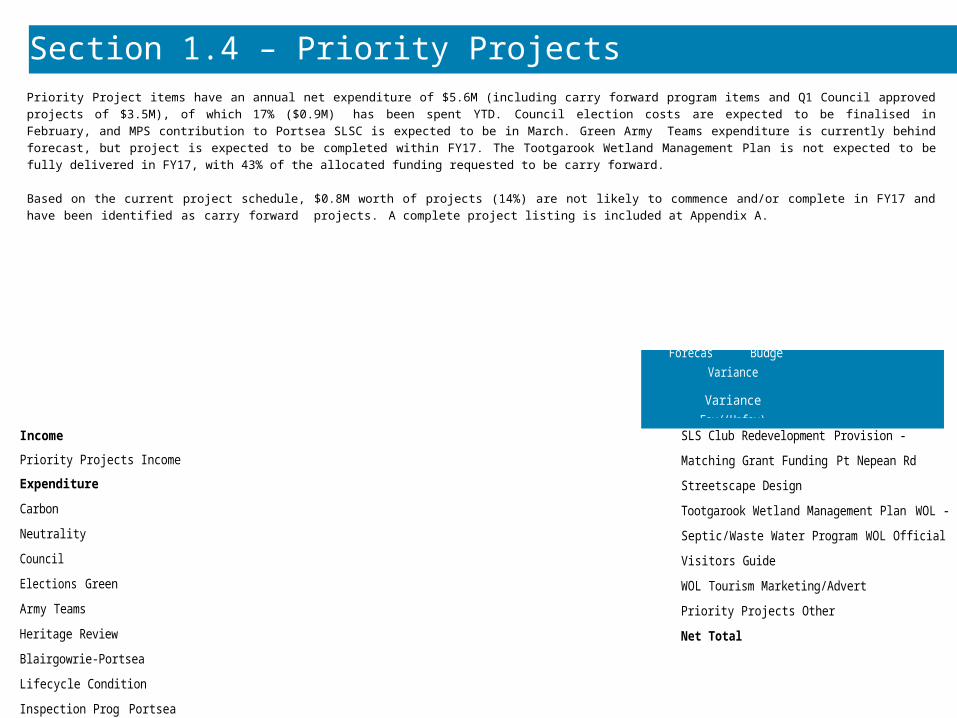
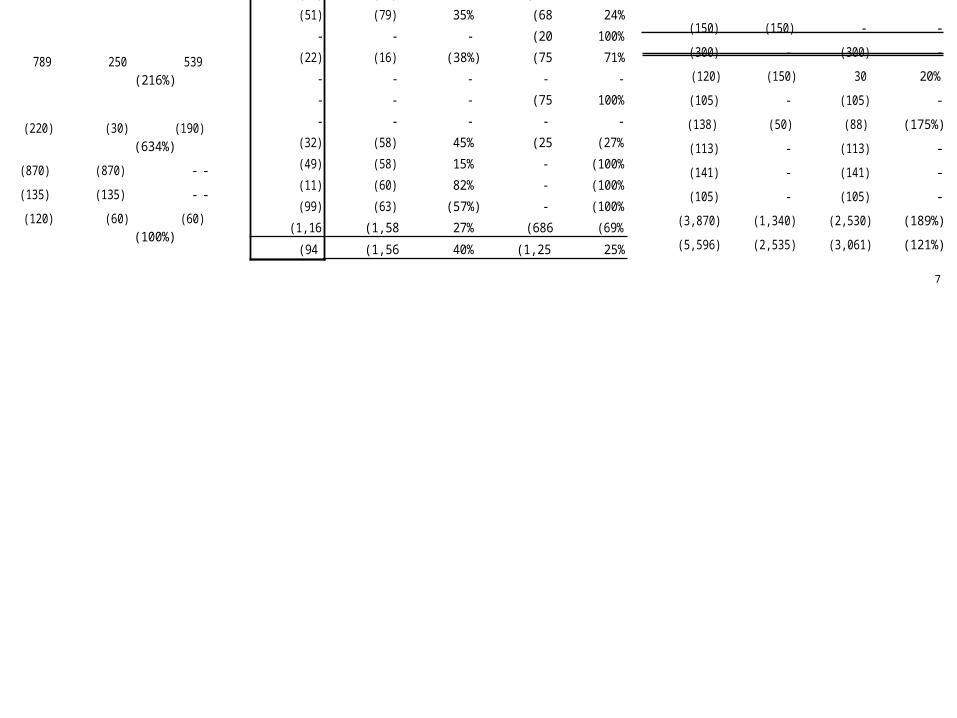
Section 1.4 – Priority ProjectsPriority Project items have an annual net expenditure of $5.6M (including carry forward program items and Q1 Council approved projects of $3.5M), of which 17% ($0.9M) has been spent YTD. Council election costs are expected to be finalised in February, and MPS contribution to Portsea SLSC is expected to be in March. Green Army Teams expenditure is currently behind forecast, but project is expected to be completed within FY17. The Tootgarook Wetland Management Plan is not expected to be fully delivered in FY17, with 43% of the allocated funding requested to be carry forward.
Based on the current project schedule, $0.8M worth of projects (14%) are not likely to commence and/or complete in FY17 and have been identified as carry forward projects. A complete project listing is included at Appendix A.
Full YearApprovedForecast
$'000
AdoptedBudget$'000
Variance VarianceFav/(Unfav) Fav/(Unfav)
$'000 %
IncomePriority Projects IncomeExpenditure Carbon Neutrality Council Elections Green Army TeamsHeritage Review Blairgowrie-Portsea Lifecycle Condition Inspection Prog Portsea SLS Club Redevelopment Provision - Matching Grant Funding Pt Nepean Rd Streetscape DesignTootgarook Wetland Management Plan WOL - Septic/Waste Water Program WOL Official Visitors GuideWOL Tourism Marketing/Advert Priority
Projects OtherNet Total
- - - (20) 100%(22) (16) (38%) (75) 71
%- - - - -- - - (75) 100%- - - - -
(32) (58) 45% (25) (27%)(49) (58) 15% - (100%)(11) (60) 82% - (100%)(99) (63) (57%) - (100%)
(1,160) (1,589) 27% (686) (69%)
(941) (1,560) 40% (1,253) 25%
789 250 539(216%)
(220) (30) (190)(634%)
(870) (870) - -(135) (135) - -
(120) (60) (60)(100%)
(150) (150) - -(300) - (300) -(120) (150) 30 20%(105) - (105) -(138) (50) (88) (175%)(113) - (113) -(141) - (141) -(105) - (105) -
(3,870) (1,340) (2,530) (189%)(5,596) (2,535) (3,061) (121%)
7
- - - (20) 100%(22) (16) (38%) (75) 71
%- - - - -- - - (75) 100%- - - - -
(32) (58) 45% (25) (27%)(49) (58) 15% - (100%)(11) (60) 82% - (100%)(99) (63) (57%) - (100%)
(1,160) (1,589) 27% (686) (69%)
(941) (1,560) 40% (1,253) 25%
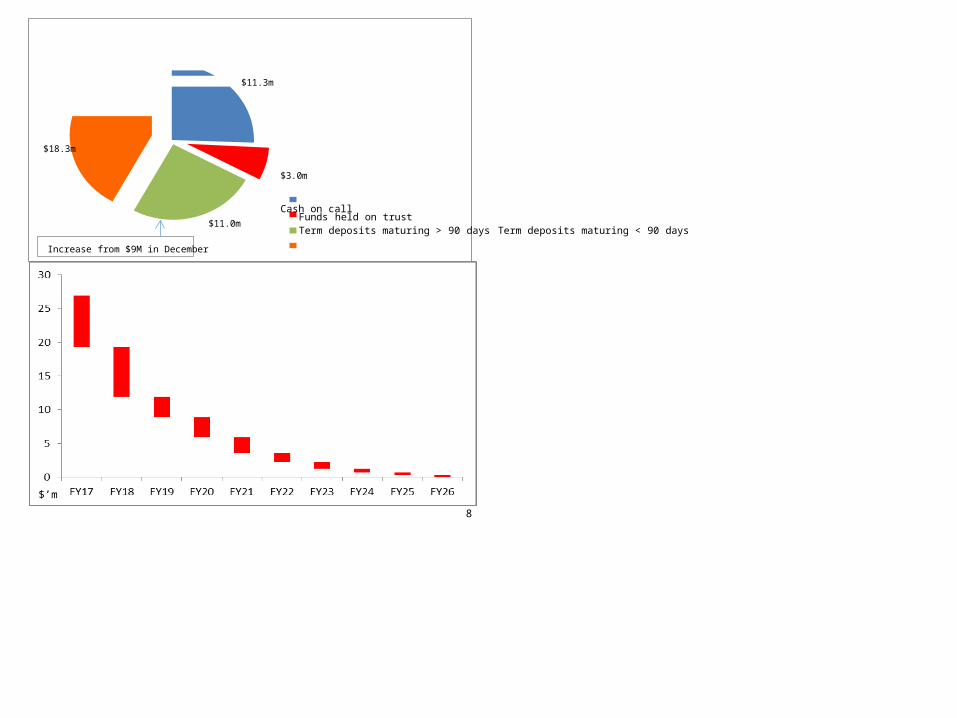
Section 1.5 – Treasury
$11.3m
$18.3m
$3.0m
Cash on call
$11.0m
Increase from $9M in December
Funds held on trustTerm deposits maturing > 90 days Term deposits maturing < 90 days
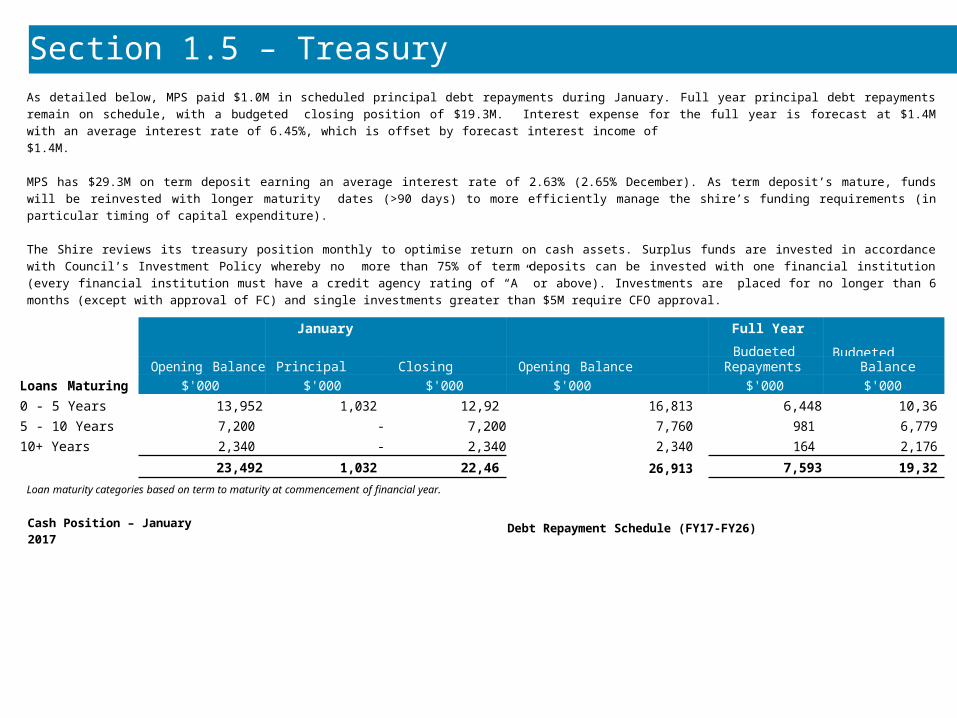
As detailed below, MPS paid $1.0M in scheduled principal debt repayments during January. Full year principal debt repayments remain on schedule, with a budgeted closing position of $19.3M. Interest expense for the full year is forecast at $1.4M with an average interest rate of 6.45%, which is offset by forecast interest income of$1.4M.
MPS has $29.3M on term deposit earning an average interest rate of 2.63% (2.65% December). As term deposit’s mature, funds will be reinvested with longer maturity dates (>90 days) to more efficiently manage the shire’s funding requirements (in particular timing of capital expenditure).
The Shire reviews its treasury position monthly to optimise return on cash assets. Surplus funds are invested in accordance with Council’s Investment Policy whereby no more than 75% of term deposits can be invested with one financial institution (every financial institution must have a credit agency rating of “A” or above). Investments are placed for no longer than 6 months (except with approval of FC) and single investments greater than $5M require CFO approval.
January Full YearBudgeted Budgeted Closing
Opening Balance Principal Repaid Closing Balance Opening Balance Repayments BalanceLoans Maturing $'000 $'000 $'000 $'000 $'000 $'0000 - 5 Years 13,952 1,032 12,920 16,813 6,448 10,3655 - 10 Years 7,200 - 7,200 7,760 981 6,77910+ Years 2,340 - 2,340 2,340 164 2,176
23,492 1,032 22,460 26,913 7,593 19,320Loan maturity categories based on term to maturity at commencement of financial year.
Cash Position – January 2017 Debt Repayment Schedule (FY17-FY26)
$’m
8
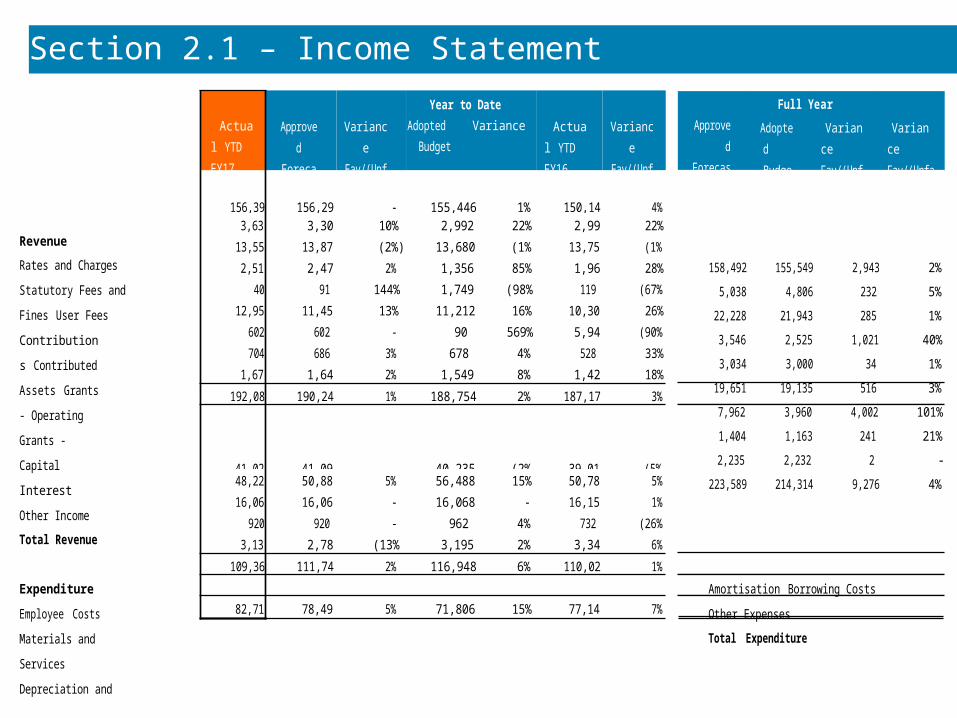
Section 2.1 – Income StatementFull Year
Approved Forecast
Adopted Budget
Variance Fav/(Unfav)
Variance Fav/(Unfav)
RevenueRates and Charges Statutory Fees and Fines User FeesContributions Contributed Assets Grants - Operating Grants - Capital InterestOther IncomeTotal Revenue
$'000 $'000 $'000 %
158,492 155,549 2,943 2%5,038 4,806 232 5%
22,228 21,943 285 1%3,546 2,525 1,021 40%3,034 3,000 34 1%
19,651 19,135 516 3%7,962 3,960 4,002 101%1,404 1,163 241 21%2,235 2,232 2 -
223,589 214,314 9,276 4%
Expenditure Employee Costs Materials and ServicesDepreciation and Amortisation Borrowing CostsOther ExpensesTotal Expenditure
71,576 70,094 (1,482) (2%)96,982 93,292 (3,690) (4%)27,556 27,556 - -1,411 1,452 41 3%5,710 5,721 12 -
203,234 198,116 (5,118) (3%)
Total Comprehensive Income
20,355 16,198 4,157 26%
Actual YTD FY17
$'000
Approved Forecast$'000
Variance Fav/(Unfav)
%
Year to DateAdopted Variance
Budget Fav/(Unfav)$'000 %
Actual YTD FY16
$'000
Variance Fav/(Unfav)
%
156,397 156,291 - 155,446 1% 150,142 4%3,639 3,309 10% 2,992 22% 2,991 22
%13,556 13,874 (2%) 13,680 (1%) 13,753 (1%)2,513 2,471 2% 1,356 85% 1,968 28
%40 91 144% 1,749 (98%) 119 (67%)12,957 11,454 13% 11,212 16% 10,308 26
%602 602 - 90 569% 5,947 (90%)704 686 3% 678 4% 528 33
%1,672 1,646 2% 1,549 8% 1,420 18%192,080 190,242 1% 188,754 2% 187,176 3%
41,026 41,098 - 40,235 (2%) 39,016 (5%)48,220 50,881 5% 56,488 15% 50,781 5%16,068 16,068 - 16,068 - 16,151 1%
920 920 - 962 4% 732 (26%)3,132 2,781 (13%) 3,195 2% 3,347 6%
109,367 111,748 2% 116,948 6% 110,028 1%
82,713 78,494 5% 71,806 15% 77,148 7%

9
Section 2.2 – Balance Sheet
January 2017
June 2016 Movem ent
Approved Forecast
Full Year Adopted Budget
Variance Fav/(Unfav)
$'000 $'000 $'000 $'000 $'000 $'000
Assets Current assetsCash and cash equivalents 43,649 53,729 (10,080) 28,205 24,708 3,497Trade and other receivables 111,071 13,449 97,622 16,605 18,467 (1,862)Inventories 138 138 - 138 132 6Non-current assets classified as held for sale 2,195 2,195 - 2,195 - 2,195Other assets 1,599 2,318 (719) 2,318 2,524 (206)Total current assets 158,652 71,829 86,823 49,461 45,831 3,630Non-current assetsTrade and other receivables 791 1,187 (396) 1,187 1,175 12Other financial assets 8 8 - 8 8 -Property, infrastructure, plant & equipment 2,035,901 2,029,649 6,252 2,064,903 2,059,012 5,891Inves tment property 9,360 9,360 - 9,360 - 9,360Intangible assets 1,080 1,150 (70) 1,028 1,272 (244)Total non-current assets 2,047,141 2,041,354 5,786 2,076,486 2,061,467 15,019Total assets 2,205,792 2,113,183 92,609 2,125,947 2,107,298 18,649LiabilitiesCurrent liabilitiesTrade and other payables 33,389 15,402 (17,987) 15,402 15,626 224Trust funds and deposits - 3,755 3,755 3,755 3,662 (93)Provis ions 10,770 11,465 695 11,465 13,430 1,965Interest-bearing loans and borrowings 2,803 7,257 4,454 7,430 7,430 -Total current liabilities 46,962 37,879 (9,083) 38,052 40,148 2,096Non-current liabilitiesProvis ions 4,769 3,951 (818) 3,951 4,046 95Interest-bearing loans and borrowings 19,657 19,657 - 11,889 11,915 26Total non-current liabilities 24,426 23,608 (818) 15,840 15,961 121Total liabilities 71,388 61,487 (9,901) 53,892 56,109 2,217Net assets 2,134,404 2,051,696 82,708 2,072,055 2,051,189 20,866EquityAccumulated surplus 1,033,849 951,415 82,434 971,774 985,554 (13,780)Reserves 1,100,555 1,100,281 274 1,100,281 1,065,635 34,646Total equity 2,134,404 2,051,696 82,708 2,072,055 2,051,189 20,866
10
Section 2.3 – Cash FlowYear to Date
ActualYTD FY17
$'000
ApprovedVarianceForecastFav/(Unfav)
$'000$'000
70,92721,6892,513
13,550715
6,337(40,854)(54,181)(2,759)(259)
17,678
70,82121,6512,471
12,047697
6,337(40,925)(56,841)(2,750)(259)
13,249
1063842
1,50318- 71
2,660(9)
-4,429
(22,331)(54)(22,385)
(22,967)(58)(23,025)
6364640
(920)(4,453)(5,373)
(10,080)53,72943,649
(920)(4,453)(5,373)
(15,149)53,72938,580
--
- 5,069-
5,069
ApprovedForecast
$'000
Full YearAdoptedVarianceBudgetFav/(Unfav)
$'000$'000
158,49227,2663,546
27,6131,4049,698
(71,576)(106,680)
(3,472)-
46,291
155,54926,7492,525
23,0951,1638,843
(70,094)(99,545)(3,487)
-44,798
2,943517
1,0214,518241855
(1,482)(7,135)
15-
1,493
(69,527)6,717(62,810)
(32,864)-
(32,864)
(36,663)6,717(29,946)
(1,411)(7,595)(9,006)
(25,525)53,73028,205
(1,452)(7,595)(9,047)2,887
21,82124,708
41-
41(28,412)
31,9093,497
Cash flows from operating activitiesRates and chargesUser charges and other Contributions - monetary Government grants Interest receivedNet GST refund / payment Employee costsMaterials and services Other receipts / (payments)Net movement in deposits and bonds
Net cash provided by/(used in) operating activities
Cash flows from investing activitiesPayments for property, infrastructure, plant and equipment
Proceeds from sale of property, infrastructure, plant and
equipment Net cash provided by/ (used in) investing activities
Cash flows from financing activitiesFinance costsRepayment of borrowings
Net cash provided by/(used in) financing activities
Net increase/(decrease) in cash & cash equivalentsCash and cash equivalents at the beginning of the financial year
Cash and cash equivalents at the end of the period
11
Appendix A – Project Listings (Expenditure Only)
Actual YTD FY17
Full Year Approved Forecast
Actual YTD FY17
Full Year Approved Forecast
Capital & Priority Works (Expenditure) $'000 $'000 Capital & Priority Works (Expenditure) $'000 $'000
17010. Plant & Equipment Replacement 189 204 17486. South Peninsula Aquatic Recreation 0 719
17012. Acquisition (splays, easements) 0 111 17489. Implement Rye Traffic Mgt Strategy 48 100
17016. Oval Rehab Program 154 227 17549. Bicycle Strategy 12 158
17027. Implement Public Toilet Strategy 793 1,549 17550. Kunyung Pre-school - Building Exten 17 50
17031. Provision of Library Books/Material 665 1,313 17552. Blackspot Program (Council contrib) 50 150
17032. MPRG Artworks - Acquisitions 40 40 17554. Skate & BMX Strategy 36 810
17038. Traffic Mgt Treatments (LATM) 184 1,276 17556. Soccer Strategy - Implementation 9 50
17044. Traffic & Transport Strategy 13 20 17558. Kerb and Channel Renewal 97 811
17050. Footpaths & Access Networks Renewal 428 1,772 17593. Local Integrated Drainage Strategy 1,437 2,900
17053. Drainage Rehabilitation 343 600 17624. SIMS2 Furniture & Signs 52 538
17054. Drainage Upgrades 209 450 17626. Foreshore Camping Areas - Amenities 860 863
17062. Signage - Traffic/Parking Areas 37 153 17630. Peninsula DriveSafe 7 30
17063. Signage 12 60 17638. Minor Renewal - Community Facilitie 375 947
17065. Marine Structures Renewal 165 1,344 17659. Urban Unmade Road Contributions 36 1,343
17187. Fruitgrowers Reserve Machinery Shed 14 234 17660. Pavilion Strategy Implementation 607 5,475
17260. Playground developments 71 644 17667. Sorrento Seawall 39 674
17261. Playspace Strategy Implementation 0 60 17671. Sorrento Streetscape Strategy 46 585
17263. Implement Recreation Master Plan 505 2,426 17672. Neighbourhood Activity Centre 195 504
17313. Equestrian & Mountain Bike Strategy 42 74 17673. Sporting Facilities Lighting 74 74
17322. Waste Disposal Cell- Rye Landfill 24 90 17675. Tennis Strategy Implementation 23 70
17362. Footpath Construction Strategy 986 5,225 17676. Netball Strategy Implementation 434 1,420
17401. Major Buildings - Renovations 158 1,602 17677. Blackspot Program 2,214 4,942
17402. Moderate Renewal Community Facility 216 1,200 17695. Roads to Recovery Programs 2,092 6,382
17465. Coastal Management MasterPlan 1,484 2,267 17696. Hastings Activity Centre Structure 217 730
17482. Safer Local Roads Program 3,627 4,000 17697. Rosebud Activity Ctr Structure Plan 2,098 3,365
12
Appendix A – Project Listings (Expenditure Only)
Actual YTD FY17
Full Year ApprovedForecast
Actual YTD FY17
Full Year ApprovedForecast
Capital & Priority Works (Expenditure) $'000 $'000 Capital & Priority Works (Expenditure) $'000 $'000
17699. Unmade Carpark Construct Strategy 86 198 56275. Coastal Management 383 668
17701. Active Sports Strategy - Impl 13 45 58302. Library Buildings Furn & Fittings 0 80
17718. Timber Structures Renewal 89 390 58308. The Briars Fera Exclusion Fence 0 6
17720. Road/Bridges & Culvert Renewal 0 40 58317. Marine Drive Safety Beach 0 466
17721. Residential Dwellings 0 79 58324. Place Making - Minor Works 0 133
17738. Police Point Management Plan 16 119 58337. Sorrento Seawall 0 60
17742. Pedestrian Treatments 10 400 58338. Implement Waste Management Strategy 0 60
17745. Strategic Water Tank Project 17 55 58340. Fire Management 0 190
17767. Somerville Community House Accom. 654 649 58342. Street Lighting Design - Program 0 60
17768. Land Acquisition - Purchase 75 5,485 58347. Dam Safety Works 0 37
17771. Resource Recovery Centre Upgrades 0 25 58348. High Public Risk & OHS Works 16 80
17773. Empire Street Mall Streetscape 28 600 23,412 73,373
17774. Wallaroo Rejuvenation 3 144
17775. Mornington Fire Brigade Competition 0 25
56003. Developer Wks - Drainage Upgrades. 0 35
56009. Conservation Works-MPRG. 16 27
56013. Street Lighting Improvem ents. 15 100
56030. Implement Dog free & leash areas 0 29
56044. Dredging of Boatramp at Hastings 12 75
56067. Coastal Reserves Biodiversity Cons. 41 254
56107. Building Renovations Misc. 117 517
56112. Risk Mgt Initiative former Landfill 83 691
56146. Infrastructure Upgrades - Landfills 50 75
56171. IT Systems Upgrades and Developm ent 208 439
56226. Landfill Cell Capping Provis ion 0 200
56228. Corporate Water Conservation 45 204
13
Appendix A – Project Listings (Expenditure Only)
Actual YTD FY17
Full Year ApprovedForecast
Actual YTD FY17
Full Year ApprovedForecast
Priority Projects (Expenditure) $'000 $'000 Priority Projects (Expenditure) $'000 $'000
6443. Performing Arts Program 10 20 6679. Rosebud Promotional Fund 2012-19 19 99
6459. Hastings Promotional Fund 20 56 6680. Mt Eliza Promotional Fund 2012-19 28 70
6462. Corporate Strategy 0 15 6718. Green Wedge Action Plan 0 15
6581. Events 0 0 6736. Careers Expo 12 10
6619. Family Violence Project 11 25 6915. Men's Sheds 11 25
6637. King St Hastings Master Plan 7 20 6923. Red Hill Character Assessment and D 0 41
6638. Rye Town Centre Plan 0 60 6926. Parking Precinct Plans 5 35
6639. Tootgarook Wetland Biodiversity Pln 0 25 6927. Port Phillip Urban Design Framework 0 35
6640. Sthn Pen Congestion Mmnt Project 0 25 6938. WOL Comty Arts-Metro Access Project 0 2
6641. Equity Land Trust Feasibility Study 0 20 6942. Councillor Induction Training 0 65
6642. French St Rye, Feasibility Study 12 25 6943. Councillor Tools & Equip Replacemnt 51 50
6643. Lifecycle Condition Inspection Prog 22 150 6944. Councillor Media Training 0 15
6644. Eco Living Centre - Community Engag 13 35 6945. Risk & OHS Compliance Framework 48 50
6645. Eco Living Centre - Innovations 8 30 6946. Archaeology Literacy Village Worksh 0 5
6646. Kerbside Bins Aus Stds Bin Lids 0 15 6947. Asset Mment Information System 16 89
6647. Resource Rec Cntr - Asset Mgmt Plan 0 20 6949. WOL Mt Martha North Beach Erosion 0 54
6648. Green Army Teams 51 135 6948. Portsea SLS Club Redevelopm ent 0 300
6649. Domestic Animal Management Plan 0 10 8501. SCS Mornington Main St Act 2015-20 81 135
6650. Privately Owned CCTV Rebates 12 24 8507. WOL Integrated Graffiti Prevention 12 11
6651. Rosebud Youth Hub 0 30 8508. WOL - Septic/Waste Water Program 49 113
6652. Home Library Service 0 15 8509. WOL Tourism Destination Developm ent 49 72
6653. Warringine Park Precinct Plan 0 5 8512. WOL MPT Tourism Industry Developm en 12 29
6654. Aboriginal Community Dev Symposium 0 5 8513. WOL Official Visitors Guide 11 141
6655. Community Gardens 11 15 8514. WOL RTB Operations 3 20
6665. Council Elections 24 870 8603. Local Housing and Settlement Strate 0 41
6672. Responsible Gaming Strategy 0 7 8606. Character Assessment and Design Gui 0 47
14
Appendix A – Project Listings (Expenditure Only)
Actual YTD FY17
Full Year Approved Forecast
Actual YTD FY17
Full Year Approved Forecast
Priority Projects (Expenditure) $'000 $'000 Priority Projects (Expenditure) $'000 $'000
8632. WOL School Focussed 68 109 8790. Music Bursary Program 0 45
8642. Sorrento Promotional Fund SCS 14-18 47 47 8793. Land Subject to Inundations Overlay 0 15
8646. Provision - Matching Grant Funding 0 120 8799. Ranelagh Conservation Man Plan Impl 9 18
8649. Parking Precinct Plan Mornington To 0 20 8803. WOL FREEZA (D&A Free Entertainment) 6 33
8654. Early Home Learning P'ship (PRC) 0 7 8809. MPS Business Tourism 6 19
8669. Spatial Employment Strategy 0 13 8811. WOL Universal Access Planning & Cha 0 9
8670. Mount Eliza Town Centre Plan 0 30 8829. WOL Local Landcare Facil Initiative 32 22
8671. Somerville Town Centre Plan 0 2 8845. WOL History of Rosebud West 16 16
8674. Biodiversity Action Plan Modelling 11 85 8847. Peninsula Planning Statement 0 30
8678. Township Design Guideline Brochures 0 15 8849. Tootgarook Wetland Management Plan 32 138
8679. Heritage Review - Area 2 0 4 8852. Coastal Geotechnical Risk Assessmen 0 27
8683. Road Network Development Strategy 4 30 8854. Marine Industrial Precinct Zone 0 40
8706. Land Management Overlay Implementat 0 15 8863. Climate Adaption Plan Priorities 37 40
8711. Validation of Infrastructure Assets 21 21 8871. Sus Communities Planning Framework 0 11
8724. Public Recreation Space Strategy 0 60 8877. WOL Smalltalk Program 0 10
8726. Dromana Activity Centre Structure P 5 27 8878. WOL Willum Warrain 59 65
8757. WOL Iron Bar Project 0 12 8899. WOL Schoolies Week Project 2 10
8759. WOL Equipment Pilot 14 91 8902. Tyabb Airfield Precinct Plan 0 30
8760. Visitor Information Ctre Staffing 50 60 8907. Management of Closed Landfills 0 54
8761. M/ton Peninsula Branded Produce 0 8 8909. Bay Trails and Strat Network Paths 0 90
8762. Police Point Houses 0 12 8914. Place Planning 6 4
8764. Mobility Maps (5) 0 8915. Let's Talk About Alcohol 4 4
8767. Review Ticket Machines 1 0 8918. Community Playgroup Initiative 0 12
8777. Creative Peninsula Program 31 67 8919. Southern Peninsula Arts Program 8 20
8778. Peninsula Reads 6 60 8920. Access & Equity Policy Implementati 4 9
8780. Local History Digitisation 24 46 8921. ANZAC Commemorative Naming Project 0 2
15
Appendix A – Project Listings (Expenditure Only)
Actual YTD FY17
Full Year Approved Forecast
Actual YTD FY17
Full Year Approved Forecast
Priority Projects (Expenditure) $'000 $'000 Priority Projects (Expenditure) $'000 $'000
8922. Baxter Township Plan 1 40 8972. Rye Foreshore Landscape Plan 0 2
8923. Pt Nepean Rd Streetscape Design 0 105 8975. Training for CTC Groups & Committee 9 10
8924. Heritage Review Blairgowrie-Portsea 0 120 8977. Community Harms Prevention Strategy 16 10
8925. Mt Martha Coastal Management Plan 20 50 8981. Chisholm SMP Connect Contribution 23 50
8926. Hastings Foreshore Landscape M/Plan 0 40 8982. Agricultural Land Use Fact Sheets 0 1
8927. iCAN Geomedia Smart Client 0 54 8992. WOL - A Place to Call Home 11 5
8928. Dam Safety Investigation & Analysis 27 40 8993. Tjaegan Wilson-Blow Reconcil Award 0 1
8929. Financial Analysis of Waste Portfol 0 50 8995. Contribution - Boardwalk Point Leo 16 16
8930. Waste - Litter Education Programs 0 5 8996. Tennis Aust Pro Tour Contribution 0 20
8931. Carbon Neutrality 60 220 1,508 6,386
8934. Peninsula Short Film Festival 30 358935. MPRG Redevelopment Plan 15 106
8938. Aboriginal Cultural Heritage W/shps 0 5
8939. Shire Strategic Plan 2017-2020 41 75
8940. Corporate Performance Reporting F/W 0 20
8943. WOL - Kindergarten Central Enrolmnt 0 7
8945. WOL A Healthy Childhood 6 55
8946. Mothers Beach Seawall (DELWP) 0 12
8948. WOL Peninsula Pride 14 12
8951. WOL Tourism Public Relations 0 40
8955. WOL Tourism Marketing/Advert 99 105
8962. WOL Walk To School 8 10
8966. WOL EPA Research Dumping 0 18
8967. Forshore Community Engagement Revie 7 8
8971. F/shore Srvc & All Abilities Access 0 80
16