Embed Size (px)
Citation preview

SECRETARY OF ENERGY ADVISORY BOARD
MEMORANDUM FOR: Secretary Ernest J. Moniz
FROM: John Deutch
Chair, Secretary of Energy Advisory Board
DATE: December 13, 2016
SUBJECT: Transmittal of SEAB Task Force Report on CO2 Utilization
and Negative Emissions Technologies
SEAB has approved the report of the Task Force on CO2 Utilization at its public meeting
of December 12, 2016 and is hereby transmitting it to you.
Your charge to the Task Force was to describe a framework for a DOE RD&D program
on CO2 utilization technologies that has the potential to reduce CO2 emissions and/or
introduce negative emissions at the gigatonne scale. The Task Force, under the leadership
of SEAB Vice Chairman Arun Majumdar, has painted a scientifically interesting agenda
for decarbonization that should be of interest to the scientific community writ large.

1
LETTER REPORT FOR: Secretary of Energy Ernest J. Moniz
FROM: SEAB CO2 Utilization Task Force
SUBJECT: Task Force on RD&D strategy for CO2 Utilization and/or
Negative Emissions at the gigatonne scale
DATE: December 12, 2016
You charged the SEAB CO2 Utilization Task Force (Appendix 1) to describe a framework
for a Department of Energy (DOE) Research, Development and Demonstration (RD&D)
program on CO2 utilization technologies that has the potential to reduce CO2 emissions
and/or introduce negative emissions at the gigatonne (Gt) scale (Appendix 2). This letter
report presents our findings based on Task Force deliberations and discussions with the
relevant offices within the DOE. This is an Interim Report, which has been reviewed by a
group of experts (Appendix 1) in this area who have offered suggestions that have
improved the report.
At the outset, it is important to define what negative emissions and CO2 utilization mean
and imply. We first note that global warming is caused by radiative forcing that depends
on the concentration of greenhouse gases (GHG) such as CO2 in the atmosphere. The
concentration increases when the rate of GHG emissions from the earth is higher than
the rate of GHG absorption by the earth, thus producing a net positive emission rate. In
this report, we will focus on those technologies that have the potential to introduce ~1
GtCO2 per year of net decrease in global emissions to the atmosphere. Currently, the total
global emissions are ~40 GtCO2/yr, and therefore 1 GtCO2/yr of reductions represent 2.5
percent. The net decrease in emissions must involve consideration of the whole global
system, natural and engineered, which is highlighted in this report.
Looking at the global energy system, it is increasingly clear that there are viable options
to reduce emissions in the electricity sector, although their implementation would require
serious combination of policy measures and technological advancements. However,
given the distributed nature of the emissions, lack of viable alternatives at scale and a
variety of other factors, it is more difficult to do the same for the transportation and the

2
industrial sectors. Hence, negative emissions and CO2 utilization are worth considering
as a counteractive measure as long as there is a net decrease in emissions. Furthermore,
if the atmospheric CO2 concentration rose above any dangerous threshold with zero net
emission rate, technologies for negative emissions could play an important role to reduce
the atmospheric concentration from increasing beyond that threshold.
Many options for CO2 utilization and negative emissions have been proposed. For
example, negative emissions using BECCS (Bio-energy conversion with CO2 Capture
and Storage (CCS)) involves using photosynthesis to capture CO2 from the air, biomass
conversion to energy, CO2 capture from the flue gas, and storage in deep geological
formations. Likewise, zero-net carbon CO2 utilization can be achieved by directly
separating CO2 from air using a chemical capture process and adding carbon-free energy
to convert it into a fuel. There are dozens of such pathways that have been proposed for
negative emissions and CO2 utilization. Instead of addressing each of the proposed
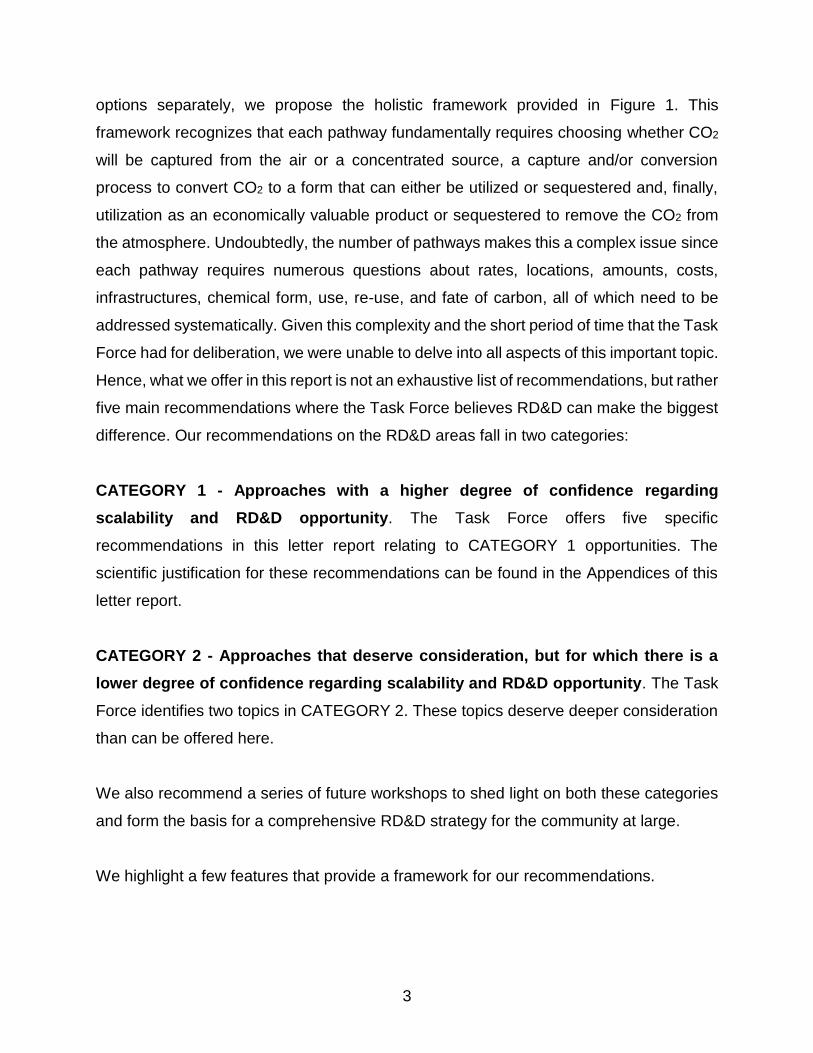
Figure 1. The negative emission and CO2 utilization option landscape. Options exist for the capture source, capture and conversion processes, capture product, sequestration repository, and the engineering approach to achieve negative emissions. Cross-cutting research opportunities exist across
the entire negative emissions landscape.
3
options separately, we propose the holistic framework provided in Figure 1. This
framework recognizes that each pathway fundamentally requires choosing whether CO2
will be captured from the air or a concentrated source, a capture and/or conversion
process to convert CO2 to a form that can either be utilized or sequestered and, finally,
utilization as an economically valuable product or sequestered to remove the CO2 from
the atmosphere. Undoubtedly, the number of pathways makes this a complex issue since
each pathway requires numerous questions about rates, locations, amounts, costs,
infrastructures, chemical form, use, re-use, and fate of carbon, all of which need to be
addressed systematically. Given this complexity and the short period of time that the Task
Force had for deliberation, we were unable to delve into all aspects of this important topic.
Hence, what we offer in this report is not an exhaustive list of recommendations, but rather
five main recommendations where the Task Force believes RD&D can make the biggest
difference. Our recommendations on the RD&D areas fall in two categories:
CATEGORY 1 - Approaches with a higher degree of confidence regarding
scalability and RD&D opportunity. The Task Force offers five specific
recommendations in this letter report relating to CATEGORY 1 opportunities. The
scientific justification for these recommendations can be found in the Appendices of this
letter report.
CATEGORY 2 - Approaches that deserve consideration, but for which there is a
lower degree of confidence regarding scalability and RD&D opportunity. The Task
Force identifies two topics in CATEGORY 2. These topics deserve deeper consideration
than can be offered here.
We also recommend a series of future workshops to shed light on both these categories
and form the basis for a comprehensive RD&D strategy for the community at large.
We highlight a few features that provide a framework for our recommendations.

4
1. Our recommendations are addressed to the scientific community at large, with the
hope that DOE will lead an effort in the future, involving other agencies and
organizations as appropriate.
2. The criterion of ~1 GtCO2/yr scale leads to some important considerations that are
worth stating (Appendix 3):
a. To appreciate the magnitude of GtCO2 per year, it is noteworthy that only a few
industries match that scale today, such as steel, concrete, agriculture, as well as
coal, oil and gas. These industries pervade our economy and have taken decades
to develop. Hence, creating the infrastructure needed to manage GtCO2 per year
presents an unprecedented significant challenge.
b. Any process that captures, transports, and converts ~1 GtCO2/yr will require
significant amounts of carbon-free energy1. Hence, the global demand for carbon-
free energy will increase faster than it would without the use of negative emissions
and CO2 utilization technologies.
c. There are some applications that may not be at the GtCO2/yr scale today, but are
close enough and of much higher carbon value to provide a pathway to the
GtCO2/yr scale for other applications2. Furthermore, it is unlikely that a technology
could be scaled to 1 GtCO2/yr if it would be a stretch for the technology to be scaled
to 0.1 GtCO2/yr. Hence, RD&D areas ought to focus on those technologies that
could reasonably easily be applied at least at the scale of 0.1 GtCO2/yr. All of these
considerations point to the need for a roadmap to achieve the GtCO2/yr scale.
1A barrel of oil equivalent contains about 6.1 GJ or 1.7 MWh of energy. Hence, to convert CO2 into a barrel
of oil equivalent, the lower bound for the amount of carbon-free energy needed will be 1.7 MWh. In 2015, the US used 7.08 billion barrels of oil. If all the carbon in this came from CO2, then the lower bound for the amount of carbon-free energy needed would be 12,000 TWh, which is about 41 Quads. As a comparison, the U.S. uses roughly 100 Quads per year of primary energy. Also, the total electricity generation in the US in 2014 was 4093 TWh, out of which 1340 TWh came from carbon-free sources (nuclear, wind, solar, hydroelectric). 2If CO2 was to be used as the source of all carbon in the global annual production of plastics (311 million
tonnes (MT) per year in 2014), it would consume about 0.8 GtCO2 per year. By 2030, the annual global plastic production is expected to rise to 700 MT, which would require roughly 490 MtC/yr or about 1.8 GtCO2/yr. See Appendix 6 for more details.

5
d. To achieve 1 GtCO2/yr, it is important to consider RD&D in a holistic way, one that
bridges fundamental science with systems engineering and includes the feedback
loops and iterations at various stages in between. The cost and economics of the
technology options are important considerations for RD&D (Appendix 3).
e. Deployment for a 1 GtCO2/yr scale requires capabilities and large-scale
investments that can only be achieved by the private sector. It also involves
regulatory compliance and business models, posing complex execution
challenges. The choice of how scaling is achieved and how this landscape is
navigated has implications for how rapidly the cost can be reduced down a techno-
economic learning curve and how risks are managed for large-scale investments
(Appendix 3). It is important to consider this context for RD&D since it will likely
be involved at almost all aspects of this landscape.
f. An endeavor at this scale will inevitably have consequences, intended and
unintended, on our biosphere. Many of these consequences are difficult to predict
a priori. It is critical that the RD&D has a continuous effort to understand the
consequences of the GtCO2/yr-scale of net decrease in emissions so as to
minimize the ill effects and maximize the positive impacts. This will require a robust
and widespread monitoring program of our climate and biosphere.
g. Such an endeavor will require a continuous supply of skilled people, implying that
education of a large workforce will be important.
h. Finally, it seems inevitable that to achieve 1 GtCO2/yr scale, there will need to be
a charge on CO2, either through a price or via regulations or a combination of both3.
3To achieve the scale of 1 GtCO2/yr, investments on the order of $100B or more will be needed, which will
likely come predominantly from the private sector. The private sector is unlikely to invest unless there are incentives to grow businesses and make profits for shareholders. The only way this could occur is when the price of a carbon-based product is higher than the cost of making it. For example, in the case of a product like plastics, the major cost is likely that of carbon-free/neutral energy and if that becomes sufficiently low, then capturing CO2 from point sources and converting that to plastics could occur without a price on carbon. However, such a process will have to compete with traditional processes that use fossil fuels as the source of carbon and energy. This is unlikely to occur at current global oil prices. For applications such carbon storage in geologic formation or a new type of enhanced-oil recovery, as described in this report, there is no incentive to do so without a charge on carbon (either via price or via regulation). Therefore, a charge on carbon seems like a necessary condition to achieve 1 GtCO2/yr scale.
6
We do not dwell on this issue at all in this report, since the policy landscape is still
evolving. Rather, we focus on the RD&D strategy that should be in place now in
order for the world to get prepared early and not wait for a carbon charge to be
created and adopted.
We note that negative emissions and CO2 utilization are not new topics for the scientific
community. There have been several recent noteworthy reports, articles and papers in
the past4,5, some resulting from past DOE workshops6. So what is new in this report?
Even though negative emissions and CO2 utilization technologies affect the carbon
balance on earth in different ways, rarely have they been jointly considered under a single
unifying framework. Most of the past reports focused on individual technologies (e.g.,
bioenergy and carbon capture and storage (BECCS); direct air capture of CO2; or
transforming CO2 into fuel) and estimated their multidimensional impact on land use,
water use, energy use, capital and operating costs, etc.7 This report addresses the issue
with a “systems approach” involving coupling between natural and engineered carbon
pathways, which are described in detail in Appendix 4. The systems approach is
essential to understand whether these technologies introduce a net decrease in global
CO2 emissions, and if so roughly how much. Furthermore, past works have typically
considered how current technologies will improve in cost and performance over time and
scale, i.e. going down a known techno-economic learning or experience curve. Following
your charge to this Task Force, we address the questions:
1. Where can RD&D make the biggest difference to create new techno-economic
learning curves or significantly expedite existing ones when scaled to ~ 1GtCO2/yr?
4 Fifth Assessment Report of the Intergovernmental Panel on Climate Change (2014) 5 M.K. McNutt et al., Climate Intervention: Carbon Dioxide Removal and Reliable Sequestration, National
Research Council Report, The National Academies Press (2015). 6 Carbon Cycling and Biosequestration – Integrating Biology and Climate Through Systems Science,
Report of the DOE Office of Biological and Environmental Research (2008) 7 P. Smith et al., “Biophysical and economic limits to negative CO2 emissions,” Nature Climate Change 6,
42–50 (2016).

7
2. What is the multidimensional framework for understanding the positive and negative
impacts for the choice of RD&D?
Here are the recommendations in Category 1.

8
Recommendation 1 – Systems Modeling: Carbon fluxes between the natural systems
- atmosphere, land, oceans – and commercial systems – electricity/heat, transportation,
industry – have to satisfy the laws of nature, with the commercial system having to satisfy
the imperatives of economics as well. While the laws of nature (thermodynamics, kinetics
of phase equilibria, carbon reactions, mass transport, etc.) are universal, the imperatives
of economics are designed by humans and vary across the world. The laws of nature and
economic relationships both invariably introduce non-linearity in the system, which could
be potentially ignored at small scale, but would be risky to do so at the GtCO2/yr-scale.
This makes predictions of the overall system behavior, such as net negative emissions,
very difficult. While our goal is to reduce overall emissions and decarbonize the
atmosphere at the GtCO2/yr-scale, the choices will likely have a wide range of ecological
consequences. Some environmental impacts will be positive and will be seen as co-
benefits; others will force trade-offs and may be seen as potential show-stoppers. New
scientific understanding is likely to be required in order to provide estimates of central
values and uncertainties in each area of environmental concern.
Given this complexity of both natural and engineering pathways for carbon in our
biosphere, the Task Force recommends intensification of research programs that build
on and expand today’s effort to create a constellation of systems models of the global
carbon balance at different degrees of spatial and temporal resolutions. This modeling
goes beyond today’s integrated assessment models, which do not consider the full impact
of all technological pathways in engineered systems at the GtCO2/yr scale. Such a tool
will be essential to:
a) Provide a framework to guide our holistic thinking about carbon management.
b) Model the complex interactions involved in the global carbon balance that could lead
to predictions of non-linear systems behavior that cannot be foreseen today.
c) Develop approaches to systematically study parametric sensitivity and quantify
uncertainties of different variables and their collective impact on policy making.
d) Allow researchers to explore “what if” scenarios and thereby identify individual or
combinations of technological pathways, both existing as well as new and disruptive,
that would produce large net positive (or negative) GtCO2/yr-scale effects on carbon

9
while minimizing the adverse ecological impact. Such an approach could use 0.1
GtCO2/yr as a filter to further evaluate the potential for scale up to 1 GtCO2/yr.
Furthermore, it could also identify multiplier effects as well as dead ends for various
technological pathways that may not be obvious otherwise.
e) Identify performance and cost targets that would shape a RD&D strategy for these
technological pathways.
f) Develop a roadmap to expedite scale-up of technologies and infrastructure to
accelerate negative emissions and CO2 utilization to the GtCO2/yr scale.
Complementary to the research effort in systems modeling, we also recommend to:
g) Emphasize or create an effort for global data collection and analysis to validate the
predictions of the models.
Details of the scientific justification can be found in Appendix 4. We also recommend that
the scientific community should be brought together in a workshop to identify the details
of the research program proposed here.
A systems approach that combines carbon science and systems engineering could
become an important tool for policy making. However, it would take time to develop and
refine. We should not wait for such a tool to be fully developed to identify some reasonably
obvious RD&D areas of interest. The Task Force recommends a few other RD&D topics
in Category 1 that should be initiated soon.

10
Recommendation 2 – Harnessing the Natural Biological Carbon Cycle: The largest
flux of carbon (~120 GtC/yr or 440 GtCO2/yr) between the atmosphere and land occurs
via photosynthesis in plants. Roughly 2-3 percent of this carbon remains stored on land
for decades, while the rest is emitted back to the atmosphere. Could this natural biological
carbon cycle be harnessed to absorb more carbon from the atmosphere, store more
carbon on land, or use a combination of both to produce negative emissions? Could this
be achieved as a positive co-benefit of increasing productivity of crops for food,
bioenergy, feed and fiber that the world will need, and thereby be of commercial value?
We believe that these questions deserve increased research to explore and develop the
following capabilities. The scientific justifications can be found in Appendix 5:
a) Increase the photosynthetic efficiency8 and optimize crops for food, bioenergy, feed,
and fiber, as well as trees used for bioenergy, reforestation and afforestation, with no
marginal increase in resource inputs, such as fresh water, fertilizers, and pesticides,
and preferably with reductions in each of these.
b) Rigorously evaluate the benefits and limitations of marine macroalgae as a bioenergy
feedstock for both land-based energy (e.g., for BECCS) as well as for liquid
transportation fuels.
c) Identify approaches to reduce decomposition of soil organic carbon and N2O emission
impact by taking into account the biology and chemistry of soil carbon decay.
Examples include creating roots that go deeper in the rhizosphere with higher lignin
content.
d) Optimize crops and management technology that stabilize organic carbon over longer
time frames including accelerating the transition to no-till agriculture, sustaining no-till
land after the transition is made and extending the period in which forests are net CO2
sinks.
e) Because of the complexity of the biosphere, intensify research in understanding the
ecological impact of harnessing the natural biological carbon cycle, including using
systems modeling (Appendix 4) to understand the net global carbon impact.
8 It should be noted that among the most innovative and potentially high-impact strategies to improve
photosynthesis in plants is to import carbon concentration mechanisms that operate in photosynthetic bacteria and algae. The opportunity is clear but the molecular technology to import these complex components is lacking, as is a full understanding of the biology of their assembly.

11
Recommendation 3 – Synthetic Transformations of CO2: Carbon dioxide can be
transformed into a variety of chemicals and fuels that have commercial value. The lower
bound for the energy needed to achieve this is the energy released from combusting
these chemical and fuels to form CO2. Hence, synthetic transformations of CO2 require
significant carbon-free/neutral energy in the form of heat and/or electricity, which can
often be the dominant cost. The commercial value of the chemicals and fuels determine
the upper bound for the energy and other feedstock costs. Furthermore, these
transformations need to follow one or a combination of chemical pathways –
electrochemical, photochemical, biochemical, thermochemical – with sufficient efficiency
and low infrastructure costs to produce market-competitive chemicals and fuels. To
achieve this, it is necessary to create a coherent RD&D program to:
a) Reduce the cost of delivered carbon-free/neutral exergy (electricity and high-
temperature heat) with a target range below 3 cents/kWh.
b) Focus on fundamentals of electrocatalysis and photoelectrocatalysis to identify
catalysts made of abundant elements that reduce the overpotentials required for redox
reactions (e.g., CO2 reduction and the O2 evolution reaction) at high reaction rates.
c) Identify materials for thermochemical redox reactions at lower temperatures,
preferably approaching 1000 oC, which will thereby enable compatibility with today’s
infrastructure in the chemical industry.
d) Identify and genetically manipulate biological organisms that use non-photosynthetic
biocatalysis for CO2 fixation into chemicals and fuels.
e) Create new systems architecture and designs for chemical reactors that leverage the
research on materials and organisms for CO2 transformations, and are scalable to the
GtCO2/yr scale while meeting the cost targets to make cost-competitive chemicals and
fuels.
f) Based on scaled engineered systems analysis in (f), use systems modeling of the
global carbon balance (Appendix 4) to identify opportunities and challenges for the
availability of feedstock, infrastructure, and processes (Appendix 8) needed for
GtCO2/yr scale impact.
Scientific details and follow-on workshop recommendations are in Appendix 6.
12
Recommendation 4 - Carbon Dioxide Sequestration in Geologic Formations:
Geological storage of CO2 is an important piece of the puzzle for negative emissions since
it has the potential to store at GtCO2/yr. Over the past decade, several programs have
been created to explore RD&D of CO2 storage in saline aquifers. By its very nature, this
has no commercial value. On the other hand, industry is using CO2 for traditional
enhanced oil recovery (EOR), which has commercial value for CO2. However, because
of the cost to purchase CO2, the incentives in EOR are aligned to minimize CO2 use and
maximize hydrocarbon recovery.
If the incentives were changed (e.g., via a carbon charge), would it be possible to create
a non-traditional EOR in a way that valued the CO2 storage (perhaps reaching GtCO2/yr
scale) and simultaneously retained the commercial value for the produced hydrocarbons?
Could such non-traditional EOR lead to net reduction in CO2 emissions? If the EOR sites
and saline aquifers are co-located, would such formations offer a continuum of
opportunities for CO2 storage while also creating value out of CO2? While these questions
have been asked before, they have not been fully addressed via RD&D programs.
Furthermore, while much research has focused on the fundamentals of CO2
mineralization in rocks, its scalability to the GtCO2/yr scale remains undeveloped.
In view of the importance of CO2 storage to create negative emissions and the possibility
of simultaneously creating value out of CO2, the Task Force makes the following
recommendation in four categories:
Cross-Cutting Issues:
a) Develop and execute on a roadmap for accelerating CO2 storage and reservoir
utilization from high-purity anthropogenic CO2 emission sources where there are some
immediate opportunities9.
9 Studies have identified that there are high-purity sources at the scale of 30 MtCO2 that can be captured
at $30/tCO2.http://energy.gov/sites/prod/files/2016/09/f33/DOE%20-%20Carbon%20Capture%20Utilization%20and%20Storage_2016-09-07.pdf

13
b) Create and support a Data Commons 10 as a shared resource for the research
community to document CO2 injection, storage, oil recovery, brine recovery and any
other relevant information that would be helpful to collectively understand and
investigate effective co-optimization and storage techniques.
c) Develop and implement a monitoring, measurement, and verification system capable
of accurately predicting multiple century CO2 leakage rates and environmental
impacts of carbon capture, utilization, and storage (CCUS) projects. This is essential
to increase the confidence needed by all stakeholders (e.g., project operators,
financers, regulators, insurers, and communities) to initiate and sustain the rapid
scale-up of GtCO2/yr scale reservoir utilization and saline formation storage.
Reservoir Utilization:
d) Intensify and expand the RD&D program to:
i. Continue to improve fundamental understanding of mechanisms of pore scale CO2
displacements, including immiscible displacements and other novel CO2-EOR
schemes, and flow in a broad class of reservoirs beyond CO2-EOR.
ii. Co-optimize CO2-EOR and CO2 storage in hydrocarbon reservoirs and underlying
saline formations.
iii. Develop an approach to estimate reservoir storage costs and operating parameters
for different types of reservoir systems.
iv. Estimate infrastructure needs such as pipelines between storage sites and CO2
sources, and create a roadmap in terms of costs, rates and timings for scale-up.
e) In the absence of a carbon emission charge, conduct jointly funded pilot-scale and
demonstration projects with the hydrocarbon industry and research community
(academic and national laboratory) to test co-optimization techniques and expand the
range of hydrocarbon reservoirs where CO2 storage is attractive. Put all of the quality
assured data from these projects into the Data Commons consistent with the
requirements of the contract.
10 Data sharing could be obligatory for all government contracts and joint studies involving government
funding. Special provisions need to be made to protect propriety data from oil and gas-field operators. Responsibilities of data users should be clearly spelled out in access agreements. Compliance on the part of data generators and users should be monitored for compliance with the access policies

14
Saline Formations:
f) Continue and strengthen the R&D program to understand and harness secondary
trapping mechanisms, site characterization, and geomechanical effects to assure safe
and effective GtCO2/yr-scale storage on century to millennium time scales.
g) Address important questions on leakage (or integrity of seals), accuracy of models for
long-term performance, risk of seismicity, efficacy of monitoring to detect leakage and
groundwater contamination.
In-Situ Mineralization
h) An expanded R&D effort is needed to determine whether or not our fundamental
understanding of CO2 mineralization offers GtCO2/year potential for carbon
sequestration. Convening a team of scientists and engineers to identify the full range
of opportunities and challenges is a logical first start.
The scientific justifications for these recommendations are provided in Appendix 7.
15
Recommendation 5 – Carbon Dioxide Capture and other Separation Technologies:
It is important to create pure feedstocks of CO2 and other forms of carbon for both
utilization and storage. However, CO2 generally comes in mixtures with other gases, such
as in the exhaust of fossil-fuel power plants or the atmosphere. To overcome the entropy
of mixing, the separation of CO2 from a gaseous mixture or the separation of carbon in
liquid form (e.g., methanol) from a mixture of miscible liquids can become highly energy
intensive. Depending on the source or application, the capital and operating costs of
separation can often dominate the total cost of CO2 transformation (Appendix 6) or
storage (Appendix 7). The Task Force makes the following recommendation for RD&D
to reduce these costs:
a) Identify new, low-cost CO2 sorbents made of abundant elements that have a binding
enthalpy |H| < 70 kJ/mol, binding rate constant kf > 12000 M-1s-1, and kf >> kr, where
kr is the rate constant for the unbinding or dissociative reaction. A lower enthalpy
correlates to lower energy costs whereas higher binding rate constant correlates to
smaller plant size and thereby lower capital costs. Current sorbents are have either:
(a) high rate constants and high binding enthalpy, and thereby high energy costs; or
(b) low rate constants and low enthalpy, and thereby high capital costs.
b) Identify new, low-cost, noncorrosive, non-viscous liquid solutions with lower heat
capacity than water that selectively bind CO2 with the characteristics in (a).
c) Discover new materials and processes to separate miscible liquid mixtures optimized
for low capital and operating costs.
d) Design, build and demonstrate scalable reactor designs that offer the possibility to
substantially reduce carbon capture and separation costs.
The scientific justifications for these recommendations are provided in Appendix 8.

16
Below are the topics in Category 2 that the Task Force feels are worth deeper exploration
in the future.
1. Direct Air Capture (DAC) of CO2 Using Chemicals: This topic has received recent
attention from the scientific community11 where it was estimated that it could cost
about $600/tCO2 to capture CO2 directly from the air. The Task Force believes that it
is worth exploring through research the practical lower limits of DAC costs. Since
today’s sorbents lead to cost estimates of $600/tCO2, this will necessarily involve
research into high-performance sorbents. Without advances in sorbent performance,
it is highly unlikely that the costs will be substantially reduced. The scientific
foundations of this are well described in Appendix 8. Another aspect of this challenge
relates to systems integration and the capital and operating costs associated with it.
This is described in Appendix 9. If overall DAC costs could be credibly brought down
below $200/tCO2 at scale through R&D, DAC could potentially become cost effective
for negative emissions if the carbon is utilized to create high-valued products such as
plastics, where the cost of energy could be significant.
2. Mineralization in Oceans: There have been suggestions that one could induce CO2
mineralization in oceans at the GtCO2/yr scale. The reaction of CO2 + H2O H+ +
HCO3- does not require any energy input. The bicarbonate anion (HCO3
-) can react
with cations such as Na+ or Ca++ to form bicarbonate or carbonate salts. However, the
remaining proton (H+) reduces pH, which manifests as ocean acidification. This is
thought to represent a threat to the marine environment that could potentially be
mitigated by the introduction of alkaline materials into the ocean 12 . Scalable
approaches to form bicarbonate or carbonate materials would require large supplies
of alkaline salts to neutralize the acidity. While alkaline rocks such as basalt and
serpentine do exist, getting the alkaline materials to mix with water and form salts
11 R. Socolow et al., Direct Air Capture of CO2 with Chemicals, APS Report (2011).
http://www.aps.org/policy/reports/assessments/upload/dac2011.pdf 12 R. Albright, Hosfelt J., Kwiatkowski L., Maclaren J.K., Mason B.M., Nebuchina Y., Ninokawa A.,
Pongratz J., Ricke K.L., Rivlin T., Schneider K., Sesboüé M., Shamberger K., Silverman J., Wolfe K., Zhu K., Caldeira K. (2016). Reversal of ocean acidification enhances net coral reef calcification. Nature. DOI 10.1038/nature17155

17
requires significant infrastructure and materials at scale. This has been well covered
by a recent NRC report5. The Task Force did not have adequate time to explore other
routes to induce mineral formation without acidifying the oceans. Hence, we feel this
topic deserves a deeper look. But it is worth emphasizing that we must be very
cautious in modifying the ecology of the oceans, since the complex interactions with
our food chain and our environment are not completely understood.
Below is a list of all the Appendices accompanying this letter report.
Appendix Title Page #s
1 People 18-19
2 Charge to the Task Force 20
3 Roadmap from RD&D to Gigatonne Scale 21-27
4 Unifying Framework for Negative Emissions and CO2 Utilization 28-36
5 Harnessing the Natural Biological Carbon Cycle 37-45
6 Synthetic Transformations of CO2 46-59
7 CO2 Sequestration in Geologic Formations 60-70
8 CO2 Capture and other Separation Technologies 71-76
9 Direct Air Capture of CO2 with Chemicals 77-80
18
APPENDIX 1 PEOPLE
Task Force Members
Sally Benson, Stanford University
Rafael Bras, Georgia Tech**
Emily Carter, Princeton University
John Deutch, MIT**
Arun Majumdar, Stanford University** (Task Force Chair)
Don Ort, University of Illinois, Urbana Champaign
Michael Ramage, formerly Exxon-Mobil
Robert Socolow, Princeton University
Eric Toone, Duke University
George Whitesides, Harvard University
Mark Wrighton, Washington University
DOE Technical Representatives
Adam Cohen, Office of the Undersecretary of Science and Energy
Doug Hollett and John Lytinski, Office of Fossil Energy
Harriet Kung, Office of Basic Energy Sciences
Reuben Sarkar, Sunita Satyapal and Eric Miller, Office of Energy Efficiency and
Renewable Energy
Sharlene Weatherwax, Office of Biological and Environmental Research
Ellen Williams, ARPA-E
DOE SEAB Support Group
Karen Gibson
Maria Callejas
Max Bonardi
Review Committee
Ken Caldeira, Carnegie Institute for Science

19
Michael Celia, Princeton University
Steven Koonin, New York University**
Nathan Lewis, California Institute of Technology
Venkatesh Narayanamurti, Harvard University
Edward Rubin, Carnegie Mellon University
Chris Somerville, University of California, Berkeley
Ellen Stechel, Arizona State University
**SEAB members

20
APPENDIX 2
CHARGE TO THE TASK FORCE

21
APPENDIX 3 ROADMAP FROM RD&D TO GIGATONNE SCALE
The journey of any energy and environmental technology from a research laboratory to
gigatonne (GtCO2/yr) scale impact involves many stages and facets – science,
engineering, economics, finance, pilot demonstration, regulatory compliance, supply
chain development, infrastructure development, business models, market structures as
well as federal, state and local policies. While there are exceptions to the rule, this journey
generally takes 10-20 years and involves large amounts of financial capital. The activity
in the stages are not linear but interrelated, so this needs continuous use of science and
engineering to de-risk a technology and reduce its cost down a techno-economic learning
curve. While such curves generally follow a decreasing cost curve with scale, as shown
in Fig. A3.1, this is not always true (see below). Hence, it is worth exploring what
determines the shape of this curve and where does RD&D play a role.
Figure A3.1 Process of scaling for any technology from research to gigatonne scale expressed as techno-economic learning curves. New technologies can out-compete current technologies if they are less costly, or have superior performance or offer new services and capabilities. Research based on science and
engineering is needed at all stages of this scaling process.
22
Early-stage fundamental research, which is needed for discoveries and inventions, is
mostly funded by the federal government. The scientific community as a whole pursues
a portfolio of approaches in this “proof of concept” phase with the hope that a few of them
would lead to major advances in technologies. The research occurs largely at universities
and national laboratories, but some are conducted in research laboratories of
corporations as well. Each research project may last about 3 years and cost $1-5M.
There are typically a hundreds of such projects at any given time, such that the total
investment for any technology is typically about $500M. While much of this fundamental
research may not directly result in breakthrough technologies, they produce much-
needed insights, understanding, shared learning and a scientific knowledge base that is
of immense value to the whole scientific community and is utilized in ways that are often
unforeseen. Hence, continued funding of such fundamental research is a key ingredient
for a vibrant ecosystem.
When a few of the these “proof of concept” breakthroughs show promise, a team of
scientists and engineers builds a first prototype of an engineered system that offers
insights into future viability in terms of performance and costs. This “proof of system” also
occurs in laboratories of universities, national laboratories and corporations. Out of the
hundreds of “proof of concept” projects for a technology, typically 20-50 “proof of system”
projects emerge, and each such project requires about 2-5 years and costs roughly $5-
10M. Hence, the total investment at this stage is on the order of $500M. These
investments are often shared between the federal government and the private sector. It
is at the end of this stage that the private sector can identify commercial value of a
technology by envisioning products and services. Out of the 10-50 “proof of system”
projects focused on a technology, perhaps 5-10 may graduate to the “proof of scalability”
stage. If this occurs, the private sector is best positioned to advance this technology to
show proof of scalability via pilot projects. Such a development requires investments of
$10-100M and needs about 2-5 years as well. Hence, the total cost is also about $500M.
This stage is best led by the private sector with enabling science and engineering coming
from national laboratories and universities. The U.S. is very productive in the proof of
concept, proof of system and the pilot demonstration phases compared to other countries.
23
Many observe that the U.S. is better at creating new technology options than scaling and
implementing them.
If the pilot demonstration is successful, the next stage involves roughly 3-5 competing
approaches for supply chain development; first-of-a-kind commercial plant design,
construction, and operation; meeting regulatory compliance (e.g., National Environmental
Policy Act); and further cost reduction for market competitiveness. This stage can take
about 5-10 years and can cost $100M-1B per approach. As has been proposed, this is
best achieved by the private sector, perhaps through partnerships between companies in
a supply chain such that the costs, risks, and rewards are shared (Majumdar et al, 2016).
A private sector innovation project is much more likely to lead to deployment of the
technology than one run by the federal government. The reason is that the federal
government does not have the experience or “feel” of private market investment decision-
making and operations management.
At the end of this stage, an infrastructure that is commensurate with commercial scale
deployment at the GtCO2 scale can be built. By its very nature, such a deployment must
involve products and services in a market and generate revenues to pay for the upfront
and operating costs. GtCO2-scale deployment requires large-scale financing of multiple
projects, with each project on the order of $1B. The cost of capital is a key element of the
cost of products and services. Furthermore, they have long tenors. Such large-scale,
low-cost, and long-term financing involves access to private and public capital markets,
which are influenced by federal and state tax policies. For example, master limited
partnerships (MLPs) have been widely used to aggregate capital in the public stock
market to finance infrastructure construction (e.g., pipelines) in the fossil fuel sector. The
tax policy involved in MLPs enables financing at very low cost of capital. Such a provision
needs to be broadened beyond the fossil fuel sector to enable low-cost financing of low-
carbon technologies that should include negative emissions and CO2 utilization projects.
24
Deployment will also be influenced by federal and state policies on promoting low-carbon
technologies, which could occur through a carbon charge - either via a carbon price in a
market, via regulations on carbon emissions, or via a combination of both. Since capital
formation and market deployment occurs largely by the private sector, it is very important
that the federal and state policies on finance, markets, and regulations are predictable
and have long-term certainty so that the private sector can plan accordingly. If the rules
are uncertain, committing capital is risky and thus it will not occur.
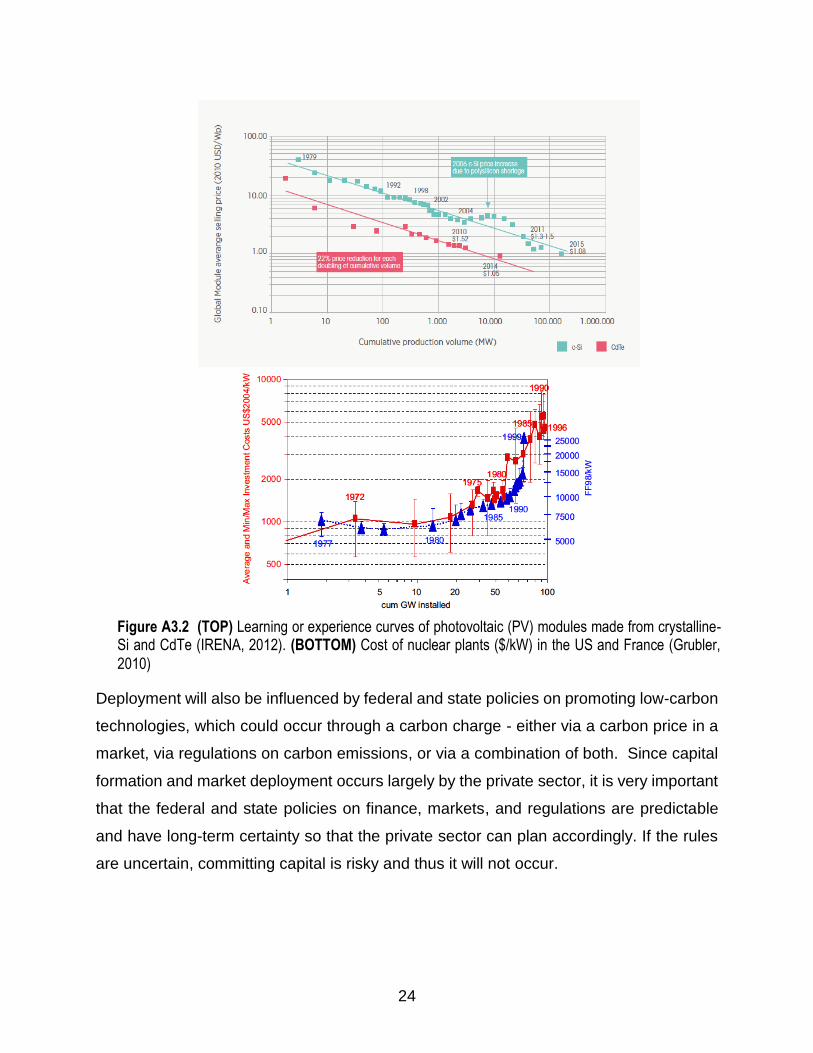
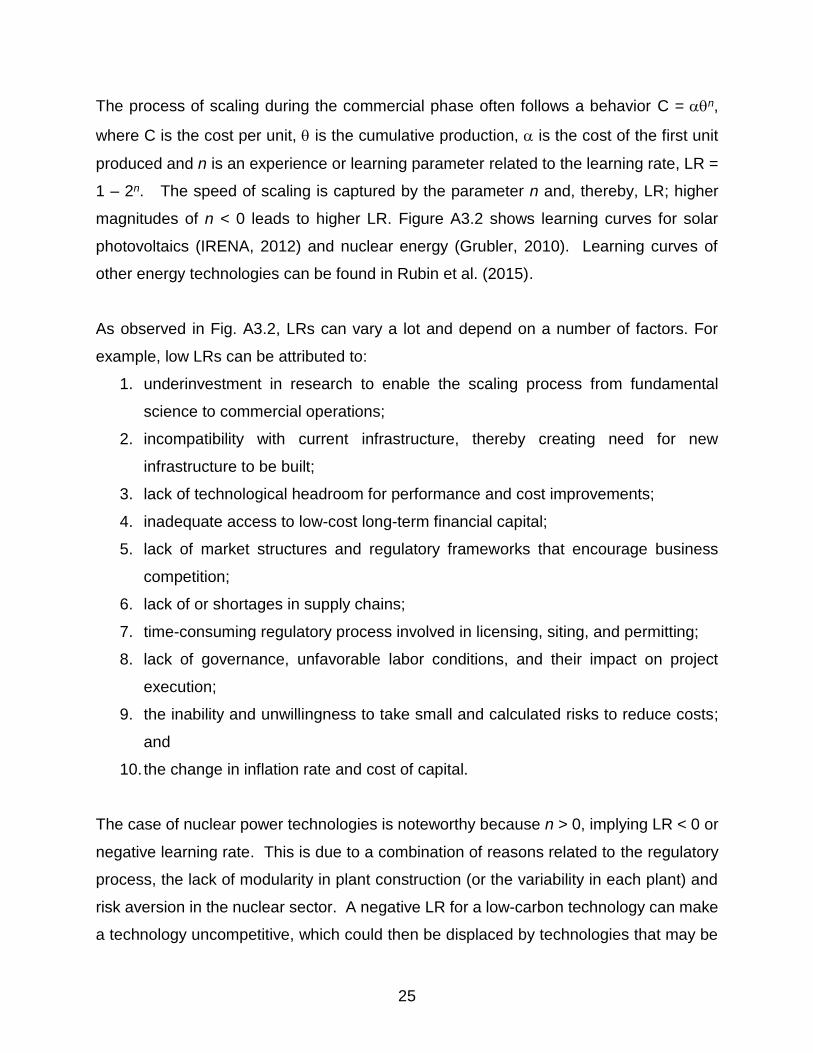
Figure A3.2 (TOP) Learning or experience curves of photovoltaic (PV) modules made from crystalline-Si and CdTe (IRENA, 2012). (BOTTOM) Cost of nuclear plants ($/kW) in the US and France (Grubler,
2010)
25
The process of scaling during the commercial phase often follows a behavior C = n,
where C is the cost per unit, is the cumulative production, is the cost of the first unit
produced and n is an experience or learning parameter related to the learning rate, LR =
1 – 2n. The speed of scaling is captured by the parameter n and, thereby, LR; higher
magnitudes of n < 0 leads to higher LR. Figure A3.2 shows learning curves for solar
photovoltaics (IRENA, 2012) and nuclear energy (Grubler, 2010). Learning curves of
other energy technologies can be found in Rubin et al. (2015).
As observed in Fig. A3.2, LRs can vary a lot and depend on a number of factors. For
example, low LRs can be attributed to:
1. underinvestment in research to enable the scaling process from fundamental
science to commercial operations;
2. incompatibility with current infrastructure, thereby creating need for new
infrastructure to be built;
3. lack of technological headroom for performance and cost improvements;
4. inadequate access to low-cost long-term financial capital;
5. lack of market structures and regulatory frameworks that encourage business
competition;
6. lack of or shortages in supply chains;
7. time-consuming regulatory process involved in licensing, siting, and permitting;
8. lack of governance, unfavorable labor conditions, and their impact on project
execution;
9. the inability and unwillingness to take small and calculated risks to reduce costs;
and
10. the change in inflation rate and cost of capital.
The case of nuclear power technologies is noteworthy because n > 0, implying LR < 0 or
negative learning rate. This is due to a combination of reasons related to the regulatory
process, the lack of modularity in plant construction (or the variability in each plant) and
risk aversion in the nuclear sector. A negative LR for a low-carbon technology can make
a technology uncompetitive, which could then be displaced by technologies that may be
26
economically competitive but have high emissions. On the other hand, modular
technologies such as photovoltaics (PVs) are generally more tolerant to risks since the
size of investments in modules is relatively low compared to those involved in gigaWatt-
scale plants. This allows for more trial-and-error iterations and rapid learning to improve
the technology. Furthermore, competition in the market can dramatically increase the LR.
Part of the PV favorable cost experience has been a progressive decline in unit margins
due to increased competition. Science and engineering research is used as a competitive
advantage. Its utilization is often more effective when directly applied to improve small
and modular technologies, something that is very difficult to achieve when large-scale
plants are designed, constructed and operated. This also leads to rapid learning (high
value of LR). But unforeseen events, such as accidents caused by natural forces or
intentional/unintentional human intervention, can also stymie a whole sector, as has been
observed in nuclear power.
Hence, when one is thinking of RD&D strategies to achieve GtCO2/yr-scale in an
expedited way, it is very important to consider creating an ecosystem with plenty of
feedback loops of information and knowledge flowing back and forth along this process.
For example, although fundamental research focuses largely on deepening and
broadening our scientific understanding, they must be conducted in the context of solving
a GtCO2/yr-scale problem in order to identify and expedite the translation process to
reduce cost and/or improve performance. Furthermore, the late-stage technology
development ought to include mechanisms whereby fundamental understanding can
accelerate cost reduction and performance improvements at the pilot and commercial
stages. The use of such contextual RD&D can accelerate progress down a techno-
economic learning curve.
What is the role of government policy? It should be evident from Fig. A3.1 that it plays
multiple roles. Government funding of early-stage fundamental research in the proof of
concept and proof of system stages is critical. Government policy on carbon price or
regulation or a combination of both can create demand and competition for low-carbon
technologies, thus driving the whole ecosystem. Government policy on finance (e.g., tax

27
policy) can enable low-cost, long-term financing that is needed to build infrastructure.
Finally, its role in convening and working closely with the private sector to expedite
regulatory compliance (e.g., NEPA) as well as catalyze partnerships and ecosystems is
important as well.
References
Grubler, A., 2010. The costs of the French nuclear scale-up: A case of negative learning by doing. Energy Policy 38, pp. 5174-5188.
IRENA 2012. Renewable energy technologies: Cost analysis series – Solar Photovoltaics, Vol. 1, Issue 4/5. Report from the International Renewable Energy Agency.
Majumdar, A., J.M Deutch, N.R. Augustine, G.P. Shultz, 2016. Energy innovation needs new private sector push, Bloomberg View, Feb 11.
Rubin, E.S., I.M.L. Azevedo, P. Jaramillo, S. Yeh, 2015. A review of learning rates for electricity supply technologies. Energy Policy 86, pp. 198-218.
28
APPENDIX 4 UNIFYING FRAMEWORK FOR NEGATIVE EMISSIONS AND CO2 UTILIZATION
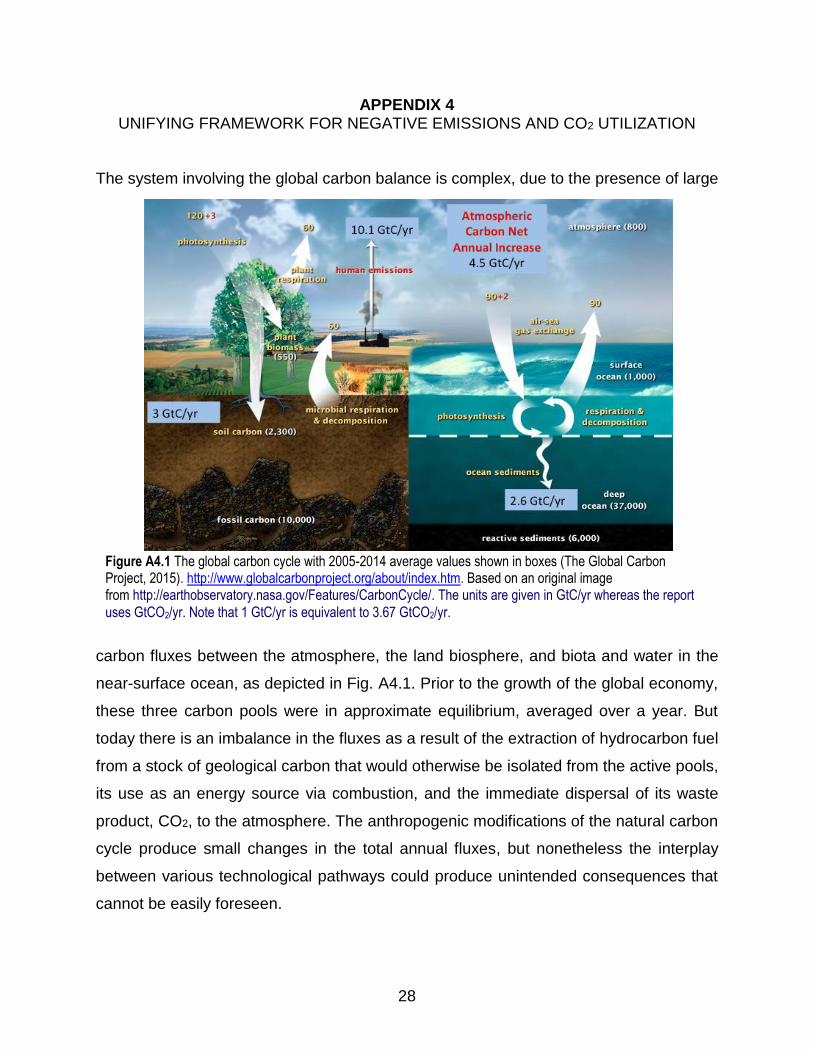
The system involving the global carbon balance is complex, due to the presence of large
carbon fluxes between the atmosphere, the land biosphere, and biota and water in the
near-surface ocean, as depicted in Fig. A4.1. Prior to the growth of the global economy,
these three carbon pools were in approximate equilibrium, averaged over a year. But
today there is an imbalance in the fluxes as a result of the extraction of hydrocarbon fuel
from a stock of geological carbon that would otherwise be isolated from the active pools,
its use as an energy source via combustion, and the immediate dispersal of its waste
product, CO2, to the atmosphere. The anthropogenic modifications of the natural carbon
cycle produce small changes in the total annual fluxes, but nonetheless the interplay
between various technological pathways could produce unintended consequences that
cannot be easily foreseen.
Figure A4.1 The global carbon cycle with 2005-2014 average values shown in boxes (The Global Carbon Project, 2015). http://www.globalcarbonproject.org/about/index.htm. Based on an original image from http://earthobservatory.nasa.gov/Features/CarbonCycle/. The units are given in GtC/yr whereas the report
uses GtCO2/yr. Note that 1 GtC/yr is equivalent to 3.67 GtCO2/yr.
29
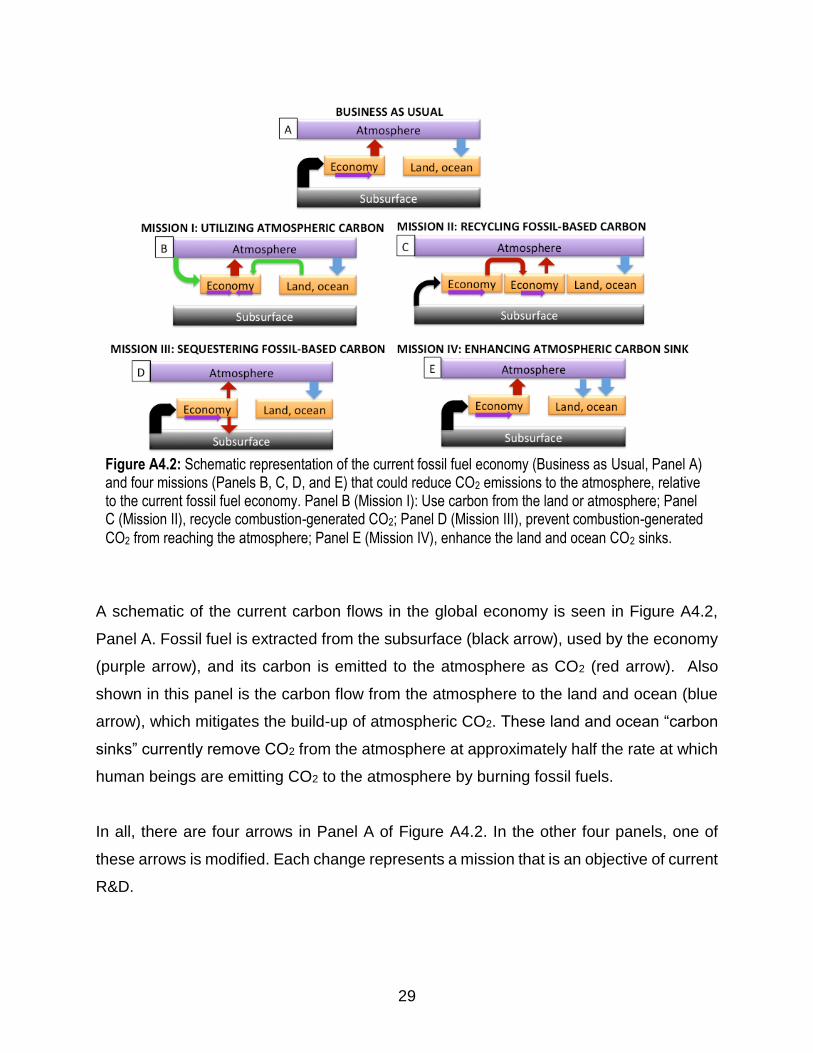
A schematic of the current carbon flows in the global economy is seen in Figure A4.2,
Panel A. Fossil fuel is extracted from the subsurface (black arrow), used by the economy
(purple arrow), and its carbon is emitted to the atmosphere as CO2 (red arrow). Also
shown in this panel is the carbon flow from the atmosphere to the land and ocean (blue
arrow), which mitigates the build-up of atmospheric CO2. These land and ocean “carbon
sinks” currently remove CO2 from the atmosphere at approximately half the rate at which
human beings are emitting CO2 to the atmosphere by burning fossil fuels.
In all, there are four arrows in Panel A of Figure A4.2. In the other four panels, one of
these arrows is modified. Each change represents a mission that is an objective of current
R&D.
Figure A4.2: Schematic representation of the current fossil fuel economy (Business as Usual, Panel A) and four missions (Panels B, C, D, and E) that could reduce CO2 emissions to the atmosphere, relative to the current fossil fuel economy. Panel B (Mission I): Use carbon from the land or atmosphere; Panel C (Mission II), recycle combustion-generated CO2; Panel D (Mission III), prevent combustion-generated
CO2 from reaching the atmosphere; Panel E (Mission IV), enhance the land and ocean CO2 sinks.

30
a) Mission I (Panel B) features extraction of carbon feedstock from the land biosphere or
the atmosphere, rather than from fossil fuels. An example is the use of biomass
instead of fossil fuel for energy – the carbon in the biomass having been fixed from
atmospheric CO2 by photosynthesis.
b) Mission II (Panel C) enables the recycling of the CO2 after combustion so that
emission to the atmosphere is delayed and CO2 emissions from another sector is
displaced. An example is the capture of CO2 at the exit of a fossil-fuel plant or an
industrial facility and converting it into carbon-based fuels for transportation, thus
using the carbon in fossil fuels twice. The external energy required to convert CO2
back to hydrocarbons (reversing combustion) must come from a low-carbon source.
Moreover, the system as a whole must have net advantages over using the same low-
carbon energy source to either: 1) displace the fossil-fuel based power generation,
letting the transportation fuel be made from petroleum; or 2) produce a suitable low-
carbon transportation fuel directly (e.g., solar hydrogen), letting the fossil-fuel plant
emit its CO2 without capture. Regardless of which pathway one adopts, the
transportation fuel (liquid fuel or electricity) must be competitive in the market.
c) Mission III (Panel D) directs CO2 emissions to a destination other than the
atmosphere, such as below ground. An example is the capture of CO2 from the flue
gas at a coal or natural gas power plant and its sequestration in a geological formation.
d) Mission IV (Panel E) increases the strength of the land or ocean carbon sink. An
example is the deliberate modification of agriculture to store additional carbon in the
soil.
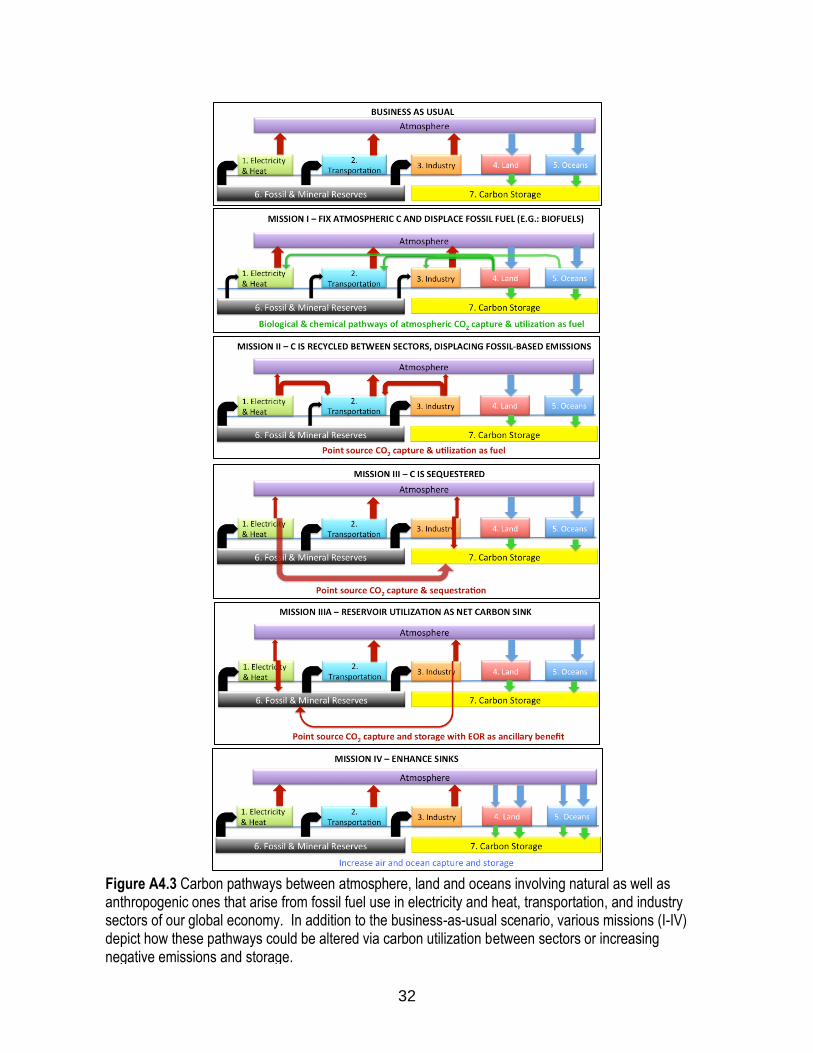
Business as usual and the four missions are elaborated in Figure A4.3. There are seven
boxes. The global economy is represented as three boxes instead of one: “electricity and
heat” (Box 1, largely, for residential and commercial buildings), transportation (Box 2),
and industry (Box 3). The land sink (Box 4) and the ocean sink (Box 5) are presented
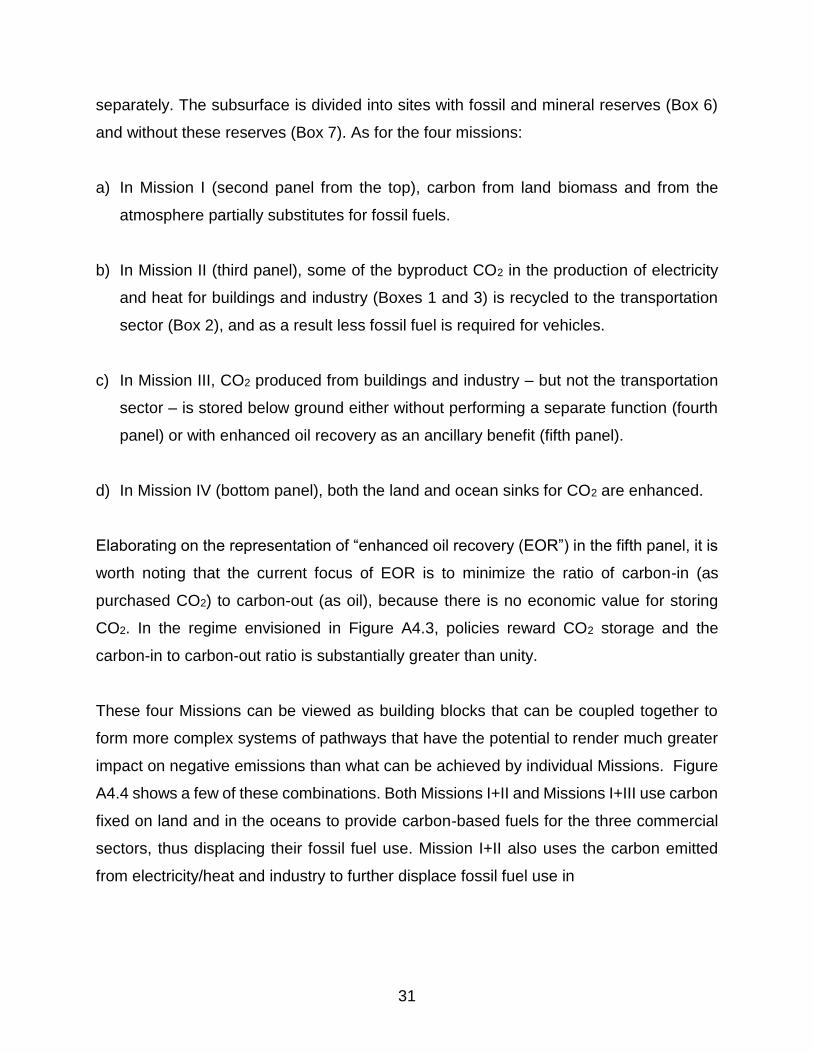
31
separately. The subsurface is divided into sites with fossil and mineral reserves (Box 6)
and without these reserves (Box 7). As for the four missions:
a) In Mission I (second panel from the top), carbon from land biomass and from the
atmosphere partially substitutes for fossil fuels.
b) In Mission II (third panel), some of the byproduct CO2 in the production of electricity
and heat for buildings and industry (Boxes 1 and 3) is recycled to the transportation
sector (Box 2), and as a result less fossil fuel is required for vehicles.
c) In Mission III, CO2 produced from buildings and industry – but not the transportation
sector – is stored below ground either without performing a separate function (fourth
panel) or with enhanced oil recovery as an ancillary benefit (fifth panel).
d) In Mission IV (bottom panel), both the land and ocean sinks for CO2 are enhanced.
Elaborating on the representation of “enhanced oil recovery (EOR”) in the fifth panel, it is
worth noting that the current focus of EOR is to minimize the ratio of carbon-in (as
purchased CO2) to carbon-out (as oil), because there is no economic value for storing
CO2. In the regime envisioned in Figure A4.3, policies reward CO2 storage and the
carbon-in to carbon-out ratio is substantially greater than unity.
These four Missions can be viewed as building blocks that can be coupled together to
form more complex systems of pathways that have the potential to render much greater
impact on negative emissions than what can be achieved by individual Missions. Figure
A4.4 shows a few of these combinations. Both Missions I+II and Missions I+III use carbon
fixed on land and in the oceans to provide carbon-based fuels for the three commercial
sectors, thus displacing their fossil fuel use. Mission I+II also uses the carbon emitted
from electricity/heat and industry to further displace fossil fuel use in
32
Figure A4.3 Carbon pathways between atmosphere, land and oceans involving natural as well as anthropogenic ones that arise from fossil fuel use in electricity and heat, transportation, and industry sectors of our global economy. In addition to the business-as-usual scenario, various missions (I-IV) depict how these pathways could be altered via carbon utilization between sectors or increasing negative emissions and storage.

33
transportation, while Missions I+III captures the carbon from the electricity/heat and
industrial sectors and stores it deep below ground (e.g. in saline aquifers). Note that the
process widely known as bioenergy carbon capture and storage (BECCS) is essentially
Missions I+III.
As is evident, using the Missions as building blocks, one can develop complex systems
of pathways that can have much larger impact on negative emissions than individual
Figure A4.4 Combinations of various missions can be utilized to amplify carbon utilization between
sectors and overall negative emissions.

34
ones. To achieve the GtCO2/yr scale, such combinations may be necessary. It is worth
noting that the carbon fluxes between the natural systems - atmosphere, land, and
oceans – and commercial systems – electricity/heat, transportation, and industry – have
to satisfy the laws of nature, with the commercial system having to satisfy the laws of
economics as well. While the laws of nature (thermodynamics, kinetics of phase
equilibria, carbon reactions, mass transport, etc.) are universal, the laws of economics
are human-designed and vary across the world. These sets of laws invariably introduce
non-linearity in the system, which could be potentially ignored at small scale, but would
be risky to do so at the GtCO2/yr-scale. This makes predictions of the overall system
behavior, such as net negative emissions, very difficult.
While our goal is to reduce overall emissions and decarbonize the atmosphere at the
GtCO2/yr-scale, the choice of individual Missions or combinations of them can be
expected to have a wide range of ecological consequences. Nearly all interventions will
have impacts on land and soil, water, biota and ecosystems, and albedo. For some
proposed interventions, the infiltration of genetically modified organisms may be
consequential. Some environmental impacts will be positive and will be seen as co-
benefits; others will force trade-offs and may be seen as potential show-stoppers. New
scientific understanding is likely to be required in order to provide estimates of central
values and uncertainties in each area of environmental concern. In some areas, the
appropriate methodology may be risk assessment.
Societal impacts will also require study and response. Issues range from selective impact
on vulnerable populations to mainstream societal acceptance, and from legitimation of
top-down decision-making to facilitation of broad participation. Policy instruments
enabling interventions, both fiscal and regulatory, will require assessment.
It should become abundantly clear that because of the complexity of the system, it is
imperative that the modeling of the system, including both natural and human-made
pathways for carbon, should be a research effort in itself. Today’s integrated assessment
models do not capture all the pathways depicted in Figs. A4.3 and A4.4.
35
This leads to the following Recommendation:
Systems Modeling: Given the complexity of both natural and engineering pathways for
carbon in our biosphere, intensify research programs that build on and expand today’s
systems modeling of the global carbon balance that includes carbon mass transport,
reactions, phase equilibria and various thermodynamic and kinetic effects for both natural
as well as engineered systems. This modeling goes beyond today’s integrated
assessment models, which do not consider the full impact of all technological pathways
in engineered systems at the GtCO2/yr scale. Such a tool will be essential to:
a) Provide a framework to guide our holistic thinking about carbon management.
b) Model the complex interactions involved in the global carbon balance that could lead
to predictions of non-linear systems behavior that cannot be foreseen today.
c) Develop approaches to systematically study parametric sensitivity and quantify
uncertainties of different variables and their collective impact on policy making.
d) Allow researchers to explore “what if” scenarios and thereby identify individual or
combinations of technological pathways, both existing as well as new and disruptive,
that would produce large net positive (or negative) GtCO2/yr-scale effects on carbon
while minimizing the adverse ecological impact. Such an approach could use 0.1
GtCO2/yr as a filter to further evaluate the potential for scale-up to 1 GtCO2/yr.
Furthermore, it could also identify multiplier effects as well as dead ends for various
technological pathways that may not be obvious otherwise.
e) Identify performance and cost targets that would shape a RD&D strategy for these
technological pathways.
f) Develop a roadmap to expedite scale-up of technologies and infrastructure to
accelerate negative emissions and CO2 utilization to the GtCO2/yr scale.
Complementary to the research effort in systems modeling, we also recommend:
g) Emphasize or create an effort for global data collection and analysis to validate the
predictions of the models.

36
We also recommend that the scientific community should be brought together in a
workshop to identify the details of the research program proposed here.
37
APPENDIX 5
HARNESSING THE NATURAL BIOLOGICAL CARBON CYCLE
Introduction: Human activities are currently producing ~39 GtCO2/yr with about 18
GtCO2/yr, or about 2 ppm/yr, accumulating in the atmosphere. The remaining ~21
GtCO2/yr is consumed by the ocean and the terrestrial biosphere, demonstrating that the
Earth’s biological carbon cycle has an enormous CO2 absorption capacity. Since it is
evident that perturbations to the natural biological carbon cycle can result in significant
net removal of CO2 from the atmosphere, are there opportunities to achieve even greater
uptake? The terrestrial biosphere is responsible for ~11 GtCO2/yr of this uptake and
removal of CO2 from air, which is driven by changes in the nature of the terrestrial carbon
sinks and perhaps by the rate of carbon input into those sinks, by the stimulation of C3
photosynthesis by elevated CO2 concentrations that have risen from 270 ppm to 400 ppm
during the 200 years since the beginning of the Industrial Era. Higher atmospheric CO2
concentrations stimulate C3 photosynthesis because past and current CO2
concentrations are not saturating substrate levels for the primary C3 plant carboxylase
Rubisco (Ribulose-1,5-bisphosphate carboxylase/oxygenase) and because higher CO2
concentrations competitively suppress the “reverse photosynthesis” oxygenation reaction
that Rubisco also catalyzes. Much of the ~11 GtCO2/yr uptake by the terrestrial biosphere
is attributed to forest regrowth; in particular, the eastern North American forest and
secondary tropical forest regrowth. While it has been difficult to resolve CO2 fertilization
of photosynthesis at the global scale, enhancing photosynthesis in other ways in principle
has GtCO2/yr potential.
Although primary producers in the ocean are responsible for nearly half of biospheric
photosynthetic carbon capture, they represent only 0.2% of global primary producer
biomass because of a greater than three orders of magnitude faster turnover time of the
photosynthetically produced organic matter in the oceans (average residence time of 2-6
days) than in the terrestrial biosphere (average of ~19 years). Because of the rapid
turnover of oceanic organic biomass, even large increases in carbon capture rate may
not be expected to result in substantial carbon storage through changes in phytoplankton

38
standing stock, unless the rate of carbon export to greater depths is significantly
accelerated over what they are now (Field et al. 1998). By contrast, in terrestrial systems,
even modest increases in carbon capture rate could potentially result in substantial
carbon storage in plants and soils.
Terrestrial Carbon Cycle: Annual terrestrial net primary productivity (NPP) is estimated at
~220 GtCO2 (60 GtC) (see Figure A5.1). Crop NPP contributes ~30 GtCO2 (8 GtC) and
pasture NPP ~48 GtCO2 (13 GtC). There is a range of strategies to improve the
photosynthetic efficiency of both C3 and C4 plants (Zhu et al., 2010; Ort et al. 2015) and
thereby increase NPP on lands where improved crop or pasture plants replace the extant
genotypes. An upper bound on atmospheric CO2 concentration reduction that might be
achieved by improving photosynthetic efficiency can be visualized by supposing that crop
and pasture NPP were increased by 25% through the engineering of plants with higher
photosynthetic efficiency.
Figure A5.1 Annual Terrestrial Carbon Cycle, expressed in GtC/yr, noting that 1 GtC/yr is about 3.67 GtCO2/yr when the carbon is in the form of CO2. About 50% of the initial uptake of carbon through photosynthesis [gross primary production (GPP)] is used by plants for growth and maintenance. The remaining carbon is net primary production (NPP), the majority of which is shed as litter and enters the soil, where it decomposes, releasing nutrients to the soil and CO2 to the atmosphere. The remaining carbon after these emissions is net ecosystem production (NEP), the majority of which is lost to nonrespiratory disturbance processes such as fire, insect damage, and harvest. The remaining carbon is net biome production (NBP) representing just 2 to 3% of the initial uptake of CO2 from the atmosphere. NBP is the most relevant parameter to consider for decadal or longer carbon storage. About two-thirds of the terrestrial carbon stock is in the rhizosphere. Adapted from Science 280, 1393-1394 (1998).

39
This example suggests that a 25% improvement in NPP on all crop and pasture lands
globally could offset 7% of global anthropogenic carbon emissions. However, the ~10%
conversion efficiency of NEP to NBP assumed here is a significant overestimate for
annual crop plants, where as much as 50% of the biomass is removed in the food/feed
harvest and the majority of the crop residue decomposes quickly. Thus in order to use
enhanced crop NPP as a carbon reduction strategy it would need to be coupled with novel
strategies to enhance carbon sequestration in the soil and improve the resilience of crop
residue with respect to decomposition. Because soil carbon decomposition decays
exponentially with depth in the rhizosphere, these would include opportunities to grow
deeper roots as well as roots with higher lignin content that would decompose more slowly
(Paustian et al. 2015).
Crops: Agricultural production has led to a net transfer of terrestrial carbon to the
atmosphere. Over the 10,000-year history of agriculture, soil carbon has decreased
globally by an estimated 840 GtCO2 (Lal, 2001). CO2 emissions associated with U.S.
Corn Belt crop production and agricultural lime application were ~26 MtCO2 for 2004
(West et al. 2010). No-till agriculture is one proven strategy to improve net soil carbon
sequestration on croplands. It has been estimated that a change from conventional tillage
to no-till agriculture could result in net soil carbon sequestration on U.S. farms as much
as 1.2 GtCO2/yr (Marland et al. 2003). Bernacchi et al. (2005) estimated that current
corn/soybean agriculture in the US releases ~ 26 MtCO2 annually, with no-till
sequestering ~8 MtCO2 and conventional-till releasing ~34 MtCO2. The complete
conversion of the U.S. corn/soybean ecosystem to no-till practices could potentially result
in ~80 MtCO2 sequestered annually, representing a net C flux difference of ~ 106 MtCO2
offsetting 2% of annual US carbon emissions. Based on past soil carbon losses and the
availability of land over the next 50 years, physical potential soil carbon sequestration
ranges between 110 and 180 GtCO2 (Lal, 2004).
Biochar: Biochar, that is biomass-derived charcoal, used as a soil amendment has been
promoted as an option to sequester soil organic carbon and thereby contribute to

40
atmospheric decarbonization. The amendment impact on soil properties, agronomic yield,
gaseous emission, and recalcitrance to decomposition varies among different sources
with as much as 35 to 85% of biochar C resistant to biological and general chemical
degradation far exceeding the stability of raw biomass. There are published estimates
that biochar has the potential capacity to sequester multiple GtCO2 (e.g., Lehmann et al.,
2006; Skackley et al. 2009) but these claims are based largely on greenhouse or
laboratory studies (Gurwick et al. 2013). There are too few long-term field experiments to
substantiate meaningful soil carbon sequestration due to the soil application of biochar
and claims of universally beneficial impacts of its application on soil quality and ability to
support improved plant growth and yield are also not consistent with available data (Lal,
2015). Both climate mitigation effects and soil quality effects of biochar depend on an
array of intricate and interdependent factors for which a great deal of uncertainty exists
(Lorenz and Lal, 2014).
Forests: Improving NPP in forests as a method to decarbonize the atmosphere may be
more promising than for crop and pasture plants due to the much greater portion of the
NPP that is captured in slowly decomposing lignocellulose. Globally combined broadleaf
and needle leaf forests account for an annual NPP of ~33 GtCO2 (9 GtC). The restoration
of forest on recently deforested land (reforestation) and the restoration of forest on land
that has been deforested for >50 years (afforestation) currently have a net uptake of about
~1 GtCO2/y (Baumert et al., 2005) even while deforestation is the largest source of land-
use-change greenhouse emissions. Significant and sustained removal of CO2 from the
atmosphere by increasing forest NPP would have a large land footprint. For example,
removing 3.7 GtCO2/yr through tropical afforestation is estimated to require land use
change of at least 7 Mha/yr or about 70000 square kilometers per year (Torn, 2013). The
amount of carbon that can be removed from the atmosphere through reforestation and
afforestation has biologically constrained limits. As a forest matures, the rate of CO2
uptake is balanced by respiration and the decay of dead organic matter causing the rate
of net uptake to decline to zero in the timeframe of 30-40 years although this depends on
forest type and site. By estimating land availability over the next 100 years,
afforestation/reforestation may have a global cumulative potential of 380 GtCO2 (Nilsson
41
and Schopfhauser, 1995), which is roughly nine years of delay at current rates of global
emissions.
Water Use Efficiency: Without improvements in water use efficiency (WUE),
improvements in NPP may have limited potential. Fortunately, some strategies to
improve photosynthetic efficiency would also result in improved WUE because of the very
tight relationship between CO2 uptake and water loss by leaves. For example, any
designs that reduce Rubisco oxygenation or the energetic costs of subsequent
photorespiration will improve WUE, as would the introduction of bacterial/algal
CO2 concentrating mechanisms (mimicking the higher WUE in C4 plants). While both C3
and C4 plants reduce water loss when grown in elevated CO2 concentrations by reducing
stomatal aperture, C4 plants appear not to reduce it enough. At 400 ppm atmospheric
CO2 concentrations, the internal CO2 concentration is ~30% over that needed to saturate
photosynthesis, thereby reducing WUE; this opportunity becomes greater as CO2
concentrations continues to rise. Further reducing stomatal aperture in C3 plants would
reduce photosynthesis because, without the C4 carbon concentrating mechanism, the
internal CO2 concentration is not saturating for photosynthesis. However, there is a
resistance to the internal CO2 diffusion in C3 plants between the intercellular airspace
and the site of carboxylation by Rubisco in the chloroplast that is as large as the stomatal
resistance. Reducing this resistance (often referred to as mesophyll resistance) would
increase photosynthesis without any additional loss of water, thereby improving
WUE. There are more examples of modifications that could be made that would be
expected to both increase photosynthetic and water use efficiency.
Marine Biomass: The use of marine biomass, such as macroalgae, as a biofuel feedstock
largely avoids the issue of water availability and WUE as well as concerns of land use
competition with crop plants. While macroalgae as a biofuel feedstock is not a negative
carbon strategy itself, as a component of a BECCS pipeline it becomes so. There is
already a non-U.S. commercial production of macroalgae, mainly for food products, which
42
is very small13 when compared with the scale of cultivation needed for macroalgae to be
considered a significant contributor to the biomass needed to meet EISA production
goals. Replacing 1% of the domestic gasoline supply using macroalgae feedstock would
require annual production an order of magnitude larger than current worldwide production
and require >10,000 km2 of ocean surface (Roesijadi et al., 2010). The marine biomass
resource potential for the United States is seemingly very high based on the surface area
of the U.S. coastal waters and known rates of macroalgae production in other parts of the
world but production of biofuel from seaweed is economically, energetically and
technically quite daunting at scale. That said, the measured biomass yield of macroalgae
per unit area can be quite high. For example, brown seaweeds grown ‘under cultured
conditions’ can attain yields of ~13.1 kg dry weight m−2 yr−1 (Rujkumar et al. 2014). While
it is frequently stated that macroalgae have higher photosynthetic solar energy conversion
efficiency than terrestrial C4 plants this is not experimentally well supported and difficult
to explain mechanistically. In order for macroalgae to fulfill its seemly high potential as a
biofuel feedstock, breakthrough improvements are needed in each of the process
operations of algal-derived fuel production: cultivation (including seedling production),
harvesting, post-harvest treatments including water removal, preservation, storage, and
energy extraction (Milledge and Harvey, 2016).
In conclusion, there is no doubt that enhancing NPP as a strategy to decarbonize the
atmosphere has significant potential and capacity; in fact, it is difficult imagine how
atmospheric CO2 levels can be maintained within acceptable boundaries without greater
net global NPP playing a major role. In all cases the scale is huge in terms of land, water
and plant nutritional requirements, putting increased carbon sequestration on a collision
course with society’s needs to produce more food, feed, and fiber, unless new
technologies can be developed and implemented or the potential of marine biomass can
be realized. It is further important to recognize that CO2 removed from the atmosphere
and sequestered in organic matter is intrinsically labile. For example to implement
enhanced photosynthesis as an effective strategy to decarbonize the atmosphere,
13 The global production is roughly 8 million tonnes per year (http://www.fao.org/docrep/006/y4765e/y4765e04.htm#fnB1).

43
fastidious management of the stored carbon is required. For example, mature forests that
are no longer net CO2 consumers must be maintained and no-till acreage must forever
stay no-till long after soil carbon is saturated, unless novel technologies are devised to
store and prevent the decomposition of the organic carbon.
Considering intervention in the biology of the global carbon cycle to achieve “negative
CO2” reveals critical gaps in our current knowledge and in technology that are research
imperatives. For example:
Converting crop lands from net CO2 producers to net carbon sinks requires a much
improved understanding of the biology and chemistry of resilient soil carbon.
Realizing macroalgae as a GtCO2/yr scale requires developing process operations
for each step of algal-derived fuel production.
While the potential impact of strategies to improve photosynthesis in plants is clear,
the molecular technology to redesign photosynthesis (e.g., importing in plants
carbon concentration mechanisms that operate in photosynthetic bacteria and
algae) is often lacking.
Based on this background, the Task Force feels that this topic deserves increased RD&D
attention to explore and develop the following capabilities:
a) Increase the photosynthetic efficiency14 and optimize crops for food, bioenergy, feed,
and fiber, as well as trees used for bioenergy, reforestation and afforestation, with no
marginal increase in resource inputs, such as fresh water, fertilizers, and pesticides,
and preferably with reductions in each of these.
b) Rigorously evaluate the benefits and limitations of marine macroalgae as a bioenergy
feedstock for both land-based energy (e.g., for BECCS) as well as for liquid
transportation fuels.
c) Identify approaches to reduce decomposition of soil organic carbon and N2O emission
impact by taking into account the biology and chemistry of soil carbon decay.
14 It should be noted that among the most innovative and potentially high-impact strategies to improve photosynthesis
in plants is to import carbon concentration mechanisms that operate in photosynthetic bacteria and algae. The opportunity is clear but the molecular technology to import these complex components is lacking, as is a full understanding of the biology of their assembly.

44
Examples include creating roots that go deeper in the rhizosphere with higher lignin
content.
d) Optimize crops and management technology that stabilize organic carbon over longer
time frames, including accelerating the transition to no-till agriculture, sustaining no-
till land after the transition is made, and extending the period in which forests are net
CO2 sinks.
e) Because of the complexity of the biosphere, intensify research in understanding the
ecological impact of harnessing the natural biological carbon cycle, including using
systems modeling (Appendix 4) to understand the net global carbon impact.
It is important to point out that BECCS has been highlighted by many reports as one of
the key strategies for negative emissions. The Task Force agrees with that assessment.
But, the Task Force notes that the net positive impact of BECCS can be significantly
increased through RD&D proposed in Recommendation 2.
While intervening in the natural biological carbon cycle to decarbonize the atmosphere
has the potential for GtCO2/yr scale impact, the Task Force cautions that this must be
undertaken thoughtfully and carefully because the consequences, intended and
unintended, of such an endeavor can be large and unpredictable.
References
Baumert, K., T. Herzog, and J. Pershing. 2005. Navigating the Numbers: Greenhouse Gases and International Climate Change Agreements. Washington, DC: World Resources Institute.
Bernacchi, C. J., S. E. Hollinger, and T. Meyers. 2005. The conversion of the corn/soybean ecosystem to no-till agriculture may result in a carbon sink. Global Change Biology 11, pp. 1867– 1872.
Field, C. B., M. J. Behrenfeld, J. T. Randerson, and P. Falkowski. 1998. Primary production of the biosphere: Integrating terrestrial and oceanic components. Science 281, pp. 237-240.
Lal, R. 2001. Soil degradation by erosion. Land Degradation & Development 12, pp. 519-539.
Lal, R. 2004. Soil carbon sequestration impacts on global climate change and food security. Science 304, pp. 1623-1627.

45
Lal, R. 2015. Biochar and soil carbon sequestration. In Agricultural and Environmental Applications of Biochar: Advances and Barriers. ed. M. Guo, Z. He and S. M. Uchimiya. Madison, WI, Soil Science Society of America, Inc., pp.175-198
Lehmann, J., J. Gaunt, and M. Rondon. 2006. Bio-char sequestration in terrestrial ecosystems—A review. Mitig. Adapt. Strategies Glob. Change 11, pp. 395–419.
Lorenz, K., and R. Lal. 2014. Biochar application to soil for climate change mitigation by soil organic carbon sequestration. J. Plant Nutr. Soil Sci. 177, pp. 651–670.
Milledge, J.J., P.J.Harvey 2016. Potential process ‘hurdles’ in the use of macroalgae as feedstock for biofuel production in the British Isles. Journal of Chemical Technology & Biotechnology DOI 10.1002/jctb.5003
Marland, G., T. O. West, B. Schlamadinger, and L. Canella. 2003. Managing soil organic carbon in agriculture: The net effect on greenhouse gas emissions. Tellus Series B: Chemical and Physical Meteorology 55, pp. 613-621.
Nilsson, S., and W. Schopfhauser. 1995. The carbon-sequestration potential of a global afforestation program. Climatic Change 30, pp. 267-293.
Ort, D.R., Merchant, S.S., Alric, J., Barkan, A., Blankenship, R.E., Bock, R., Croce, R., Hanson, M.R., Hibberd, J.M., Long, S.P., Moore, T.A., Moroney J.V., Niyogi, K.K., Parry, M.A.J., Peralta-Yahya, P.P., Prince, R.C., Redding, K.E., Spalding, M.H., van Wijk, K.J., Vermaas, W.F.J., von Caemmerer, S., Weber, A.P.M., Yeates, T.O., Yuan, J.S., and Zhu, X. 2015. Can photosynthesis be redesigned to sustainably meet global food and bioenergy demand? Proceeding of National Academy of Sciences USA. 112, pp. 8529-8536.
Paustian, K., Campbell, N., Dorich, C., Marx, E., and Swan, A. 2015. Assessment of potential greenhouse gas mitigation from changes to crop root mass and architecture. Report to ARPA-E. Accessible at: (https://arpa-e-foa.energy.gov/Default.aspx#FoaId40aa63a7-689b-4307-90b2-c1b98a2148a3)
Rajkumar R., Z. Yaakob, M.S. Takriff, 2014. Potential of the micro and macro algae for biofuel production: a brief review. BioResources 9, pp. 1606–1633.
Roesijadi, G., A.E. Copping, M.H. Huesemann, J. Forster, J.R. Benemann 2008. Techno-Economic Feasibility Analysis of Offshore Seaweed Farming for Bioenergy and Biobased Products, Battelle Pacific Northwest Division Report Number PNWD-3931.
Roesijadi, G., S.B. Jones, L.J. Snowden-Swan, Y. Zhu 2010. Macroalgae as a biomass feedstock: A preliminary analysis. https://www.researchgate.net/publication/255221448
Shackley, S., S. Sohi, S. Haszeldine, D. Manning and O. Masek. 2009. Biochar: reducing and removing CO2 while improving soils: A significant and sustainable response to climate change? Royal Society Geo-engineering Climate Enquiry. http://www.geosciences.ed.ac.uk/homes/sshackle/WP2.pdf
Torn, M. S., Kleber, M., Zavaleta, E. S., Zhu, B., Field, C. B., and Trumbore, S. E. 2013. A dual isotope approach to isolate carbon pools of different turnover times. Biogeosciences 10, pp. 8067-8081.
West et al. 2010. Cropland fluxes in the United States: increasing geospatial resolution of inventory-based carbon accounting. Ecological Applications 20, pp. 1074-1086.
Zhu, X-G., Long, S.P., and Ort D.R. 2010. Improving photosynthetic efficiency for greater yield. Annual Reviews of Plant Biology 61, pp. 235-261.

46
APPENDIX 6
SYNTHETIC TRANSFORMATIONS OF CO2
Carbon dioxide is at the lowest free energy state of carbon and any transformation of CO2
into something of value generally requires an input of energy such that the carbon is
chemically reduced.15 For example, if CO2 is transformed into hydrocarbon fuel, the
amount of energy needed is at the very least the energy that can be obtained by
combusting that fuel. The necessary reducing equivalents must come from sources that
are carbon neutral, or preferably carbon free. Figure A6.1 shows the potential pathways
for chemical transformation of CO2, either by direct reduction of CO2 or via production of
carbon-free/neutral H2 first and then using H2 to reduce CO2 and form various
hydrocarbons and alcohols.
To ensure that the chemical and fuels made from CO2 are market competitive and can
achieve the GtCO2/yr scale, it is important to first ensure that the feedstock (CO2, water,
energy) have the right scale and economics. We will then look at the various pathways
needed to transform CO2 into chemical and fuels.
GigaTonne Scale Applications: If we are to explore opportunities at the GtCO2/yr scale,
what are the applications that match this scale? Let us consider plastics and fuel. In
2014, the annual global production of plastics was 311MT (Plastics2015). Roughly 50
percent of plastics are made of polyethylene or polypropylene, for which the carbon
percentage by weight is about 85 percent. For the other dominant plastics such as PVC
and PTFE, the carbon percentage by weight is roughly 40 and 24 percent, respectively.
Using an approximate production-averaged weight percentage of carbon as 70 percent,
the carbon content by weight of 311MT of plastic is about 218MtC. If the source of all the
carbon were CO2, then it would require about 0.8 GtCO2 per year. This does not account
15 The reaction of CO2+H2O -> H+ + HCO3
- does not require any energy input. The bicarbonate anion (HCO3-) can
react with cations such as Na+ or Ca++ to form bicarbonate or carbonate salts. However, the remaining proton (H+), reduces pH, as is found when CO2 reacts with ocean water. Hence, scalable approaches to form bicarbonate or carbonate materials require large supplies of alkaline salts to neutralize the acidity. While alkaline rocks such as basalt and serpentine do exist, getting the alkaline materials to mix with water and form salts requires significant infrastructure and materials at scale. This has well covered by McNutt et al., Climate Intervention: Carbon Dioxide Removal and Reliable Sequestration, National Research Council Report, The National Academies Press (2015).

47
for the displacement of fossil fuels required to make these plastics, which includes both
the carbon and the energy needed to do so. Since the wholesale price of plastics is
roughly $2/kg (Kantchev & Ng, 2015) the value of carbon in plastics equates to about
$2.9/kg-C, or $0.78/kg-CO2 or $780/tCO2. Such a high price of CO2 offers sufficient
headroom for the CO2 cost to be lower, allowing manufacture of high-value products such
as plastics to offer a pathway to cost-effectively produce lower-value products such as
fuels that already have the GtCO2/yr scale. By 2030, the annual global plastic production
is expected to rise to 700 MT (Plastics2030), which would require roughly 490 MtC or
about 1.8 GtCO2. The only other application that really matches the scale is fuels. In
2015, the US transportation sector produced 1.8 GtCO2 (or 0.5 GtC), suggesting that
replacement of a large fraction of transportation fuels could have GtCO2/yr scale impact.
The production of liquid fuels from inorganic carbon requires both a source of carbon and
a source of energy. To be carbon neutral, that carbon should be derived from a post-
combustion source, and the reducing equivalents must themselves not release geologic
carbon as CO2.
Carbon Dioxide as a Feedstock: Carbon can be captured from concentrated waste
streams or from dilute sources,16 so-called direct air capture. Annually, the US produced
3.2 Gt of concentrated CO2 from 8,000 point sources; two-thirds of this CO2 was from
1,500 power plants. Carbon can be captured from point sources through post-
combustion, pre-combustion, or oxyfuel processes. The cost per ton of avoided CO2 for
these processes range from $60-70/tCO2 for coal-fired processes and $90-130/tCO2 for
gas-fired processes (see Appendix 8). As these sources are eliminated, dilute capture
from air will become increasingly important. Capture of CO2 from the atmosphere poses
significant technical and environmental challenges, with recent cost estimates (Socolow
et al, 2011) on the order of $600/tCO2, although research efforts are underway to reduce
the cost.
16 We note parenthetically that to satisfy our definition of negative CO2 production, this approach requires as an input
anthropogenic CO2 that would otherwise have been released to the atmosphere, from the burning of fossil fuels and industrial processes such as steel and cement/concrete production.

48
Perhaps the most plausible approach to direct air capture involves photosynthesis, a
process that both fixes atmospheric carbon and captures reducing equivalents in the form
of reduced carbon. The joint USDA/DOE Billion Ton study suggested that the United
States can produce 1.3B tons/year of dry biomass without impacting the country’s ability
to produce sufficient food, or on the order of 0.7 GtC/year, an amount sufficient to produce
Fig. A6.1 Chemical transformation of CO2 involves CO2 as a feedstock at $/tC cost, water, and carbon-free/neutral
energy at $/kWh. (A) CO2 could be directly transformed via electrochemical, photochemical, biochemical or
thermochemical pathways (or a combination of pathways) to produce hydrocarbons or alcohols at market competitive
costs (e.g., $2 per gallon of gasoline equivalent). (B) Alternatively, carbon-free/neutral energy could be used to split
water to produce H2 and O2, where H2 can be used in well-known thermochemical pathways (e.g., reverse water gas
shift plus Fischer-Tropsch) to produce various hydrocarbons and alcohols. The infrastructure for the latter at the
megatonne and potentially gigatonne scale is well known, but the pressure and heat for the latter would need to be
supplied from a carbon-neutral/free source. (C) Fossil-based energy can be used to react water with coal and/or
natural gas to produce H2, which can be made carbon-free by capturing and storing the CO2 from two sources - the
steam reforming reactions themselves and from fossil fuels burned to provide the energy for the endothermic reactions
involved steam reforming. H2 can be used in well-known thermochemical pathways (e.g., reverse water gas shift plus
Fischer-Tropsch) to produce various hydrocarbons and alcohols, subject to the need for carbon-neutral/free pressure
and heat required for these reactions

49
all US liquid transportation fuels. Biomass costs range from $30 to over $200/dry ton, or
$60 to over $400/ton C. Several important challenges regarding the implementation of
these strategies remain, including addressing chronic water shortages.
Although reduction of carbon capture cost is necessary for CO2 utilization, it may not be
the dominant one. For example, a $40/tCO2 price adds $0.37 to the production cost of a
gallon of gasoline17. Figure A6.1 shows that the additional cost in the process is the cost
of carbon-free/neutral energy.
Case for Hydrogen and the Cost of Energy: Liquid fuels serve as energy storage media,
and it is thus not surprising that energy costs represent the largest single contributor to
the costs of fuel. Significantly, CO2 costs are a relatively minor cost driver, as discussed
above. What should be the cost of energy to make fuels from CO2 cost competitive? We
will use H2, one key to transforming CO2 to fuels, as an example to highlight the cost of
energy.
Currently, H2 is a $100B per year global industry with about 50 million tons of H2 produced
annually, with the US producing roughly 10-12 million tons. About 40 percent of the H2 is
used for ammonia production that is used to make artificial fertilizers, and 20 percent for
hydrogenation in petrochemical refineries. The total GHG footprint of the chemical
industry (IEA 2013) is 1.2 GtCO2/yr. Decarbonizing this industry by producing carbon-
free/neutral H2 is itself a worthy goal, with the added benefit of decoupling from the global
oil market with its accompanying price fluctuations and market inefficiencies. But there is
a significant added benefit because of the versatility that H2 offers:
a) the chemical industry infrastructure already exists to use H2 to reduce CO2 and form
CO via the reverse water gas shift reaction (an endothermic reaction with an enthalpy
of 41 kJ/mol or 5.75 kWh/kg-H2), and then to use various ratios of CO and H2 to form
a variety of chemical and fuels (see Fig. A6.2). Hence, low-cost, carbon-free/neutral
H2 production could be one of the essential steps in CO2 utilization.
17 A useful way to remember the value of carbon in gasoline is that a CO2 price of $1/tCO2 will increase the cost of gasoline by approximately 1 cent per gallon of gasoline equivalent.
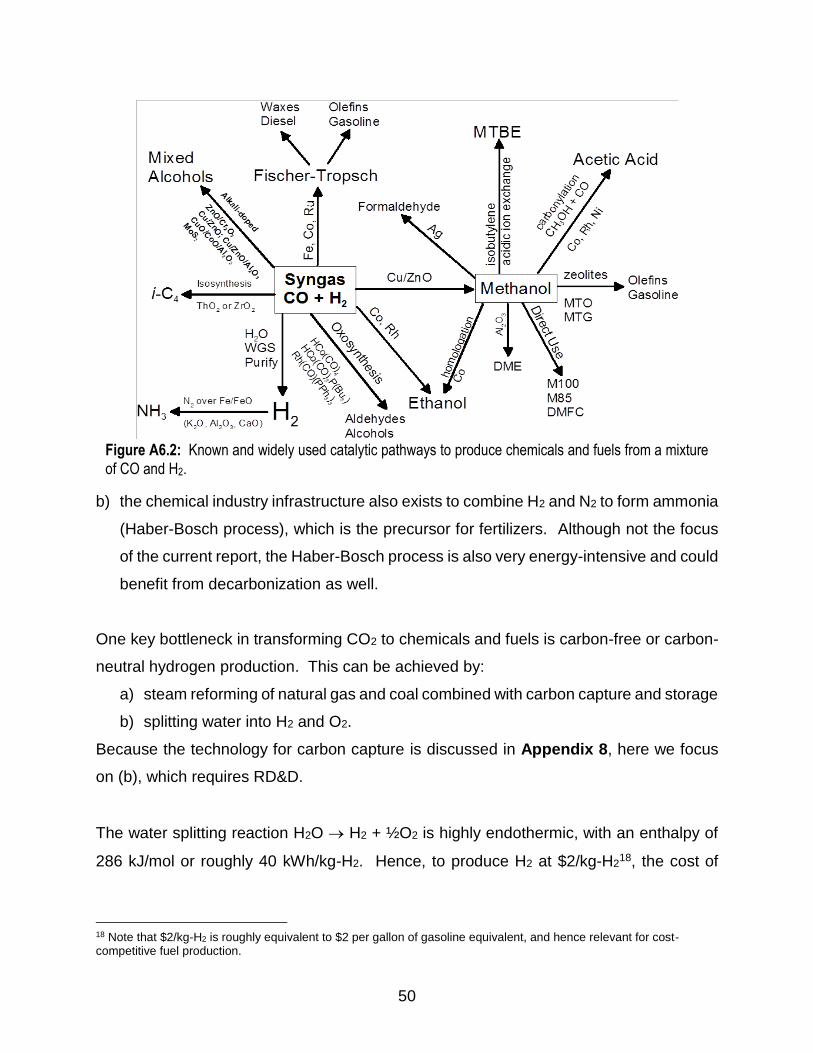
50
b) the chemical industry infrastructure also exists to combine H2 and N2 to form ammonia
(Haber-Bosch process), which is the precursor for fertilizers. Although not the focus
of the current report, the Haber-Bosch process is also very energy-intensive and could
benefit from decarbonization as well.
One key bottleneck in transforming CO2 to chemicals and fuels is carbon-free or carbon-
neutral hydrogen production. This can be achieved by:
a) steam reforming of natural gas and coal combined with carbon capture and storage
b) splitting water into H2 and O2.
Because the technology for carbon capture is discussed in Appendix 8, here we focus
on (b), which requires RD&D.
The water splitting reaction H2O H2 + ½O2 is highly endothermic, with an enthalpy of
286 kJ/mol or roughly 40 kWh/kg-H2. Hence, to produce H2 at $2/kg-H218, the cost of
18 Note that $2/kg-H2 is roughly equivalent to $2 per gallon of gasoline equivalent, and hence relevant for cost-competitive fuel production.
Figure A6.2: Known and widely used catalytic pathways to produce chemicals and fuels from a mixture
of CO and H2.
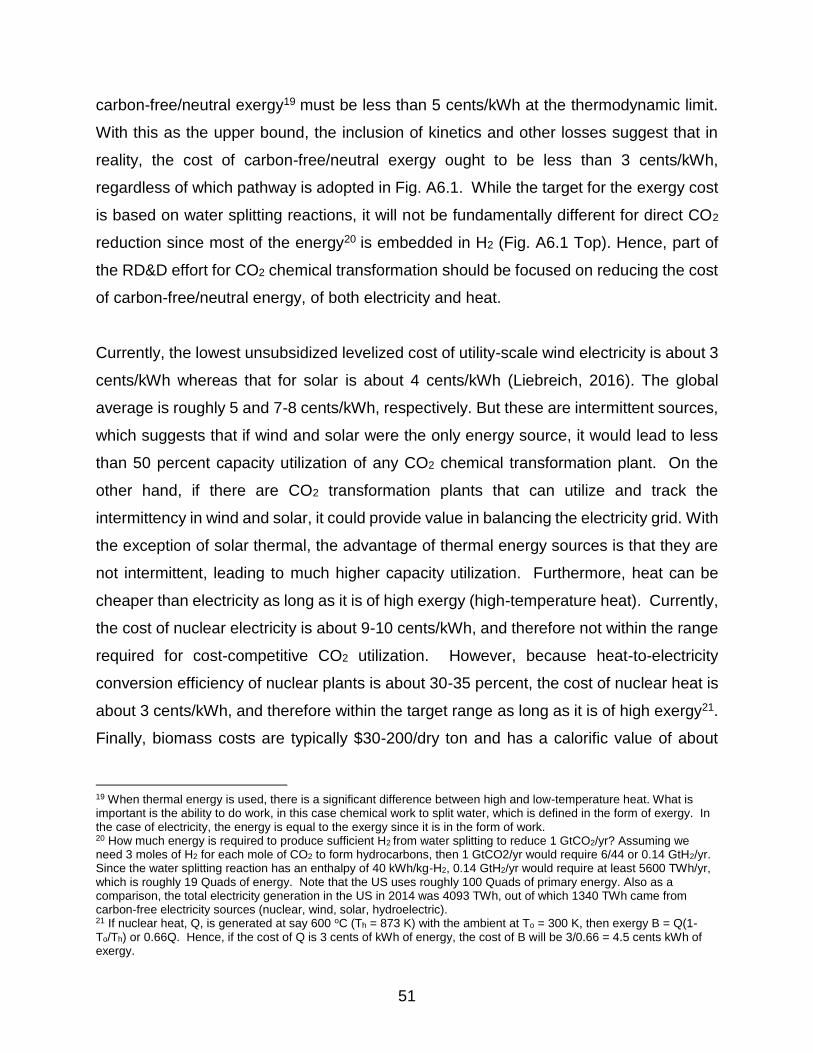
51
carbon-free/neutral exergy19 must be less than 5 cents/kWh at the thermodynamic limit.
With this as the upper bound, the inclusion of kinetics and other losses suggest that in
reality, the cost of carbon-free/neutral exergy ought to be less than 3 cents/kWh,
regardless of which pathway is adopted in Fig. A6.1. While the target for the exergy cost
is based on water splitting reactions, it will not be fundamentally different for direct CO2
reduction since most of the energy20 is embedded in H2 (Fig. A6.1 Top). Hence, part of
the RD&D effort for CO2 chemical transformation should be focused on reducing the cost
of carbon-free/neutral energy, of both electricity and heat.
Currently, the lowest unsubsidized levelized cost of utility-scale wind electricity is about 3
cents/kWh whereas that for solar is about 4 cents/kWh (Liebreich, 2016). The global
average is roughly 5 and 7-8 cents/kWh, respectively. But these are intermittent sources,
which suggests that if wind and solar were the only energy source, it would lead to less
than 50 percent capacity utilization of any CO2 chemical transformation plant. On the
other hand, if there are CO2 transformation plants that can utilize and track the
intermittency in wind and solar, it could provide value in balancing the electricity grid. With
the exception of solar thermal, the advantage of thermal energy sources is that they are
not intermittent, leading to much higher capacity utilization. Furthermore, heat can be
cheaper than electricity as long as it is of high exergy (high-temperature heat). Currently,
the cost of nuclear electricity is about 9-10 cents/kWh, and therefore not within the range
required for cost-competitive CO2 utilization. However, because heat-to-electricity
conversion efficiency of nuclear plants is about 30-35 percent, the cost of nuclear heat is
about 3 cents/kWh, and therefore within the target range as long as it is of high exergy21.
Finally, biomass costs are typically $30-200/dry ton and has a calorific value of about
19 When thermal energy is used, there is a significant difference between high and low-temperature heat. What is important is the ability to do work, in this case chemical work to split water, which is defined in the form of exergy. In the case of electricity, the energy is equal to the exergy since it is in the form of work. 20 How much energy is required to produce sufficient H2 from water splitting to reduce 1 GtCO2/yr? Assuming we need 3 moles of H2 for each mole of CO2 to form hydrocarbons, then 1 GtCO2/yr would require 6/44 or 0.14 GtH2/yr. Since the water splitting reaction has an enthalpy of 40 kWh/kg-H2, 0.14 GtH2/yr would require at least 5600 TWh/yr, which is roughly 19 Quads of energy. Note that the US uses roughly 100 Quads of primary energy. Also as a comparison, the total electricity generation in the US in 2014 was 4093 TWh, out of which 1340 TWh came from carbon-free electricity sources (nuclear, wind, solar, hydroelectric). 21 If nuclear heat, Q, is generated at say 600 oC (Th = 873 K) with the ambient at To = 300 K, then exergy B = Q(1-To/Th) or 0.66Q. Hence, if the cost of Q is 3 cents of kWh of energy, the cost of B will be 3/0.66 = 4.5 cents kWh of exergy.
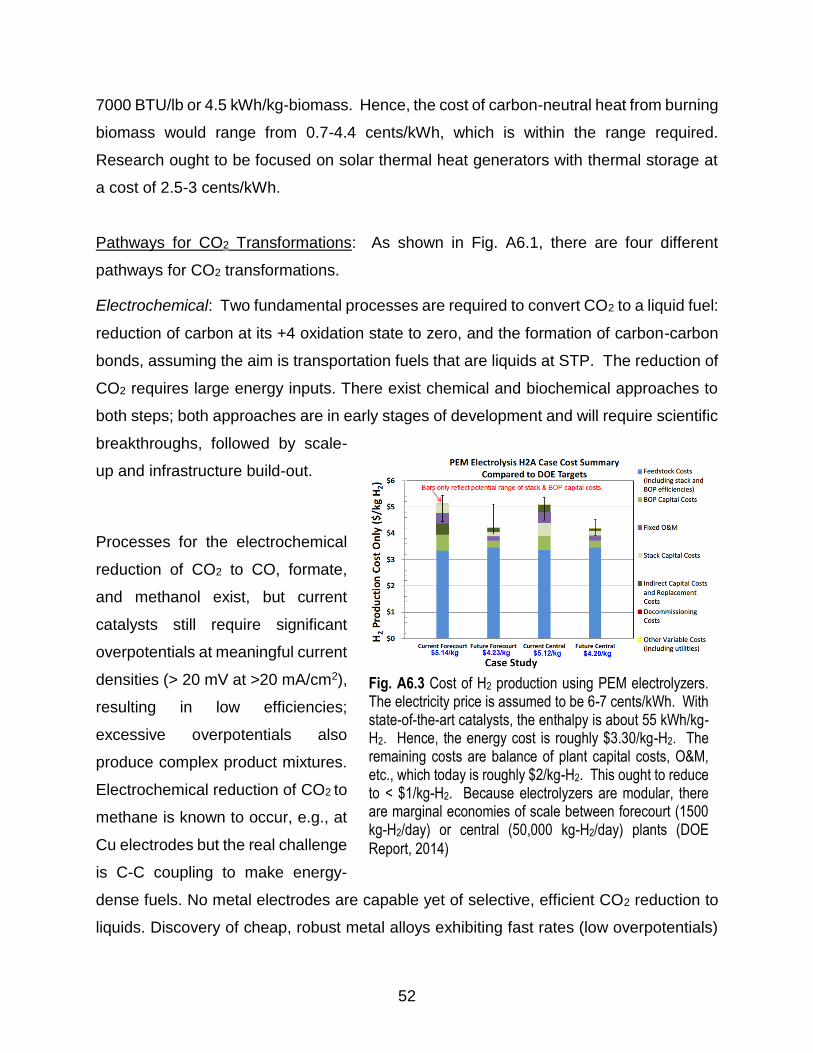
52
7000 BTU/lb or 4.5 kWh/kg-biomass. Hence, the cost of carbon-neutral heat from burning
biomass would range from 0.7-4.4 cents/kWh, which is within the range required.
Research ought to be focused on solar thermal heat generators with thermal storage at
a cost of 2.5-3 cents/kWh.
Pathways for CO2 Transformations: As shown in Fig. A6.1, there are four different
pathways for CO2 transformations.
Electrochemical: Two fundamental processes are required to convert CO2 to a liquid fuel:
reduction of carbon at its +4 oxidation state to zero, and the formation of carbon-carbon
bonds, assuming the aim is transportation fuels that are liquids at STP. The reduction of
CO2 requires large energy inputs. There exist chemical and biochemical approaches to
both steps; both approaches are in early stages of development and will require scientific
breakthroughs, followed by scale-
up and infrastructure build-out.
Processes for the electrochemical
reduction of CO2 to CO, formate,
and methanol exist, but current
catalysts still require significant
overpotentials at meaningful current
densities (> 20 mV at >20 mA/cm2),
resulting in low efficiencies;
excessive overpotentials also
produce complex product mixtures.
Electrochemical reduction of CO2 to
methane is known to occur, e.g., at
Cu electrodes but the real challenge
is C-C coupling to make energy-
dense fuels. No metal electrodes are capable yet of selective, efficient CO2 reduction to
liquids. Discovery of cheap, robust metal alloys exhibiting fast rates (low overpotentials)
Fig. A6.3 Cost of H2 production using PEM electrolyzers. The electricity price is assumed to be 6-7 cents/kWh. With state-of-the-art catalysts, the enthalpy is about 55 kWh/kg-H2. Hence, the energy cost is roughly $3.30/kg-H2. The remaining costs are balance of plant capital costs, O&M, etc., which today is roughly $2/kg-H2. This ought to reduce to < $1/kg-H2. Because electrolyzers are modular, there are marginal economies of scale between forecourt (1500 kg-H2/day) or central (50,000 kg-H2/day) plants (DOE
Report, 2014)

53
that preferentially reduce CO2 rather than water to liquid fuels or fuel precursors (that can
be converted as discussed above) is the game-changer that is required. Product
mixtures, as long as they are energy-dense, non-corrosive, and hit the sweet spot of chain
length, will be acceptable as drop-in fuels. However, cell design, relatively unimportant at
research scales, will be extraordinarily important in consideration of production scales of
any electrochemical process to produce fuels of the magnitude required.
Since electrocatalytic reduction of CO2 to make carbon-based products (e.g., fuels) with
high specificity is very challenging, as Fig. A6.1B suggests, it may be easier to split water
and produce hydrogen, and then use well-known approaches to react CO2 and H2 to
make carbon-based products. Electrolytic hydrogen can be synthesized via alkaline,
polymer electrolyte membrane (PEM) or solid-oxide electrolyzers. Current baseline costs
for hydrogen production from these approaches are $5.20/kg, $5.16/kg and $4.95/kg,
respectively, at an electricity cost of $62.40/MWh. What is the breakdown of these costs?
Figure A6.3 shows the data for PEM electrolyzers. While the thermodynamic limit for
water splitting is 40 kWh/kg-H2, the best performing catalysts offer an enthalpy of 55
kWh/kg-H2. Hence, with an electricity cost at 6 cents/kWh, the energy cost itself is about
$3.30/kg-H2. Furthermore, the levelized cost of balance of plant and remaining costs for
electrolyzers is roughly $2/kg-H2, making the total cost $5.30/kg-H2. Research is needed
in the following areas:
Identify catalysts to lower the overpotentials (voltage efficiency of within 75% of the
thermodynamic limit22) to below 50 kWh/kg-H2 at high reaction rates (1-2 A/cm2). The
key bottleneck is the catalyst for the oxygen evolution reaction (OER), a complicated
reaction involving electron transfer, proton transfer, and O-O bond formation. At least
four different mechanisms have been proposed for the OER, complicating catalyst
design. Many transition metal oxides or other ionic transition metal catalysts (e.g.,
phosphates) have been touted for OER, but in fact none meet requirements. While
Pt can be used for OER, its cost is prohibitive for scale up. Metal oxyhydroxides, most
22 For example, if the equilibrium potential required for water splitting is 1.23V, then 75% voltage
efficiency would mean an operating voltage of 1.64V.

54
commonly known as battery materials, are the latest to offer some promise. Basic
understanding of the mechanisms by which water loses electrons and protons and
ultimately forms O-O bonds is needed to help guide materials discovery.
Create systems architecture and designs to reduce the non-energy costs to < $1/kg-
H2.
Finally, infrastructure for electricity production required to produce hydrogen at the
requisite scales is lacking. Thus, for example, production of sufficient hydrogen to make
all US transportation fuels through a Fischer-Tropsch (FT) approach would require three
times the current nameplate capacity of the entire US electricity generation fleet, even
assuming an overpotential of only 25%.
Photochemical: Photochemical or photoelectrochemical approaches offer the very
significant advantage of direct use of photons, as opposed to initial conversion to
electricity. Coupling effectively the phenomena that occur in solar cells with
electrochemistry in one material, a photoelectrocatalyst, sounds attractive because one
does not suffer efficiency losses necessitated by coupling separate devices together. In
reality, requiring all the phenomena to work in concert in the same material requires that
all properties must be optimized at once – a very tall order. These properties include the
band edge positions (the conduction band edge for reduction and the valence band edge
for oxidation), the electron-hole pair lifetime, charge carrier mobility, and finally surface
kinetics, include rates of electron and proton transfer and chemical bond
formation/breaking. If all phenomena take place in the same material, one must also
match fluxes of photons and electrons with reaction rates. Not surprisingly then, this is an
area still very much in the basic research phase. The most promising material systems
yet are three different compound semiconductors (GaP, CdTe, CuInS2) in the presence
of an aromatic amine co-catalyst in acidified water, all of which have been reported to
photoelectrochemically reduce CO2 selectively to a liquid fuel (precursor), namely
methanol, at underpotentials (Barton et al., 2008; Jeon et al., 2014, Yuan et al., 2013).
Although highly selective, none of these systems is particularly active, with very low yields
55
observed. Understanding the complex chemistry and physics of all the phenomena
involved here is an active area of basic research that should continue.
In addition to the infrastructure issues outlined above, additional key framing questions in
these areas include:
Effective catalysts and photoactive charge-transport materials based on abundant
non-toxic elements are required to facilitate the requisite conversions in high yield and
purity.
Catalytic processes scale as catalyst area. Volumetric approaches that scale as
reactor volume are required.
Biochemical: Biological approaches offer the potential to both catalyze CO2 reduction
and to form carbon-carbon bonds. An extraordinarily large number of organisms occupy
ecological niches where they have access to neither sunlight or reduced carbon; such
autotrophs must assimilate energy through other means, including hydrogen, reduced
metal ions, nitrogen or, perhaps, electricity. The use of such organisms to convert
inorganic carbon and low-cost reducing equivalents could offer an important opportunity
to produce both chemicals and fuels. This was first explored through the ARPA-E
program called Electrofuels (ARPA, 2010), but much more research is needed to further
investigate this area. Critical research objectives include:
To understand the mechanisms and to measure rates of these processes to
determine if they would even be practical to consider, and then to determine how to
optimize them.
To gain a better understanding of the autotrophic microbiome, including the behavior
of symbiotic and commensal communities, is required.
To develop reactor designs suitable for large-scale production with autotrophic
organisms is required.
56
Thermochemical: Thermochemical approaches are particularly attractive since today’s
chemical industry at large scale is predominantly23 thermochemical. Furthermore, as
pointed out earlier, carbon-free/neutral heat is generally less expensive than electricity
and is non-intermittent, with the exception of high-temperature solar-thermal without any
thermal storage. Hence, CO2 transformations at the GtCO2/yr scale can be conceived if
the redox reactions are infrastructure compatible (Stechel and Miller, 2013).
Thermochemical redox reactions have been explored for many decades. Much of the
work has focused on using metal oxides based on the two-step reactions
𝑀𝑂𝑥 → 𝑀𝑂𝑥−𝛿 + 𝛿
2𝑂2 𝑎𝑡 𝑇ℎ (1)
𝑀𝑂𝑥−𝛿 + 𝛿𝐻2𝑂 → 𝑀𝑂𝑥 + 𝛿𝐻2 𝑎𝑡 𝑇𝑙 (2)
where M is a metal, Th is the high temperature for the O2 evolution reaction, and Tl is the
lower temperature for the H2 evolution reaction (or CO2 to CO reduction reaction). This
is essentially a heat engine, which absorbs heat at high temperature, rejects heat at low
temperature and produces work in the form of chemically stored energy. The most well-
studied systems use ferrites or CeO2 (Scheffe & Steinfeld, 2014; Agrafiotis et al., 2015).
Ferrites can work at lower temperatures than ceria but ceria exhibits much faster bond-
breaking rates. Furthermore, for ceria, Th > 1500 oC whereas Tl 600-700 oC. Much
research in the past has focused on reducing Th, with the hope of approaching 1000 oC,
in order to make it widely compatible with the current chemical industry. However, it has
been difficult to reduce Th. The lower bound for Th and the window of Th - Tl where the
reactions in equations (1) and (2) are possible depend strongly on the enthalpy, H, and
entropy changes, S, as well as the gas partial pressures during the reactions. To reduce
the lower bound of Th and increase the window of Th - Tl, the entropy change, S, of the
oxides must be strongly positive (Meredig and Wolverton, 2009; Miller et al., 2014).
However, most oxides tend to have S < 0 during the reduction process, except for a
class of materials that can accept a large range of oxygen stoichiometries. We need
research to identify materials for which S is strongly positive, preferably > 10 cal/(0.5
23 With the exception of aluminum manufacturing and chlorine synthesis, which are based on electrochemical redox
reactions.
57
mol O2)-K), perhaps through the use of phase transitions or via other means, which have
remained largely unexplored. Such materials could allow reduction processes at lower
temperatures than currently available. Additional research needs include developing
reactors systems to approach the promise while operationalizing this cycle.
Based on the above discussions, it is necessary create a coherent RD&D program to:
a) Reduce the cost of delivered carbon-free/neutral exergy (electricity and high-
temperature heat) with a target range below 3 cents/kWh.
b) Focus on fundamentals of electrocatalysis and photoelectrocatalysis to identify
catalysts made of abundant elements that reduce the overpotentials required for redox
reactions (e.g., CO2 reduction and the O2 evolution reaction) at high reaction rates.
c) Identify materials for thermochemical redox reactions at lower temperatures,
preferably approaching 1000 oC, which will thereby enable compatibility with today’s
infrastructure in the chemical industry.
d) Identify and genetically manipulate biological organisms that use non-photosynthetic
biocatalysis for CO2 fixation into chemicals and fuels.
e) Create new systems architecture and designs for chemical reactors that leverage the
research on materials and organisms for CO2 transformations, and are scalable to the
GtCO2/yr scale while meeting the cost targets to make cost-competitive chemicals and
fuels.
f) Based on scaled engineered systems analysis in (f), use systems modeling of the
global carbon balance (Appendix 4) to identify opportunities and challenges for the
availability of feedstock, infrastructure and processes (Appendix 8) needed for
GtCO2/yr scale impact.
We also propose that a workshop be held to bring together the science and engineering
communities that span the above topics to:
Identify synergies between seemingly disparate but relevant topics (e.g., carbon-
free/neutral exergy, catalysis and reactor design) that are important for CO2
transformations

58
Discuss systems integration and identify tradeoffs in the research goals and
targets to produce CO2 based fuels and chemicals cost competitively.
References
Agrafiotis, C., M. Roeb, and C. Sattler. 2015. A review on solar thermal syngas production via redox pair-based water/carbon dioxide splitting thermochemical cycles. Renewable and Sustainable Energy Reviews 42, pp. 254–285
ARPA-E 2010: https://arpa-e.energy.gov/?q=arpa-e-programs/electrofuels
Barton, E.; Rampulla, D. M.; Bocarsly, A. B. 2008. Selective Solar-Driven Reduction of CO2 to Methanol Using a Catalyzed p-GaP Based Photoelectrochemical Cell. J. Am. Chem. Soc. 130, pp. 6342-6344.
DOE Report, 2014. Annual Progress Report of DOE Hydrogen and Fuel Cell Program. https://www.hydrogen.energy.gov/annual_progress14.html
IEA 2013, Technology Roadmap: Energy and GHG Reductions in the Chemical Industry via Catalytic Processes, Report from the International Energy Agency, Internation, Council of Chemical Associations, Dechema
Jeon, J. H.; Mareeswaran, P. M.; Choi, C. H.; Woo, S. I. (2014). Synergism between CdTe semiconductor and pyridine - photo-enhanced electrocatalysis for CO2 reduction to formic acid. RSC Adv. 4, pp. 3016−3019
Kantchev, G. and S. Ng, (2015). Recycling Becomes a Tougher Sell as Oil Prices Drop, Wall Street Journal, April 5,
Liebreich, M., 2016, EMEA Future of the Industry, Bloomberg New Energy Finance, Oct. 11. https://about.bnef.com/presentations/liebreich-state-industry-keynote-emea-summit-2016/
Meredig, B., and C. Wolverton, 2009. First principles thermodynamic framework for the evaluation of thermochemical H2O- and CO2-splitting materials, Phys. Rev. B 80, 2458119.
Miller, J. E., A.H. McDaniel, M.D. Alendorf. 2014. Considerations in the design of materials for solar-driven fuel production using metal-oxide thermochemical cycles. Advanced Energy Materials 4, 1300469.
Plastics2015: “Plastics – The Facts 2015,” Plastics Europe, Brussels, Belgium. http://www.plasticseurope.org/plastics-industry/market-and-economics.aspx
Plastics2030: http://www.grida.no/graphicslib/detail/global-plastic-production-and-future-trends_b584
Scheffe, J. R. and A. Steinfeld. 2014. Oxygen exchange materials for solar thermochemical splitting of H2O and CO2: a review,” Materials Today 17, pp. 341-348
Socolow, R., et al. 2011. Direct Air Capture of CO2 with Chemicals: A Technology Assessment for the APS Committee on Public Affairs, APS Report. http://www.aps.org/policy/reports/assessments/upload/dac2011.pdf
Stechel, E.B. and J.E. Miller, 2013. Re- energizing CO2 to fuels with the sun: Issues of
efficiency, scale, and economics” Journal of CO2 Utilization”, Journal of CO2 Utilization 1, pp. 28 – 36.

59
Yuan, J.; Hao, C. 2013. Solar-driven photoelectrochemical reduction of carbon dioxide to methanol at CuInS2 thin film photocathode. Sol. Energy Mater. Sol. Cells 108, pp. 170−174
.
60
APPENDIX 7
CARBON DIOXIDE SEQUESTRATION IN GEOLOGIC FORMATIONS
Negative emissions will require sequestering carbon in repositories with long residence
times. CO2 utilization may also require GtCO2/yr-scale interim storage of CO2 to address
the mismatch between CO2 supply and demand for utilization. Presently, underground
geological reservoirs are the only option available for millennial time-scale, GtCO2/yr-
scale sequestration and hence are an essential element of any negative emissions
strategy (IPCC, 2005).
Hydrocarbon reservoirs, salt-water filled formations (saline formations), and possibly
ultramafic rocks, provide the opportunity for sequestration on the time scales of many
tens of thousands to millions of years if the sites are properly selected and managed
(IPCC, 2005). Key questions about the GtCO2/yr scalability and effectiveness of
underground storage include:
• What fraction of the prospective global and regional capacities for storage are
going to be available?
• Which are the most secure forms of storage?
• Are there co-benefits such as CO2-enhanced oil recovery (CO2-EOR) that could
enable rapid scaling of the technology?
• For sequestration on the scale of GtCO2/yr-scale, what are environmental risks
(e.g., leakage, groundwater contamination, induced seismicity) and societal risks
(e.g., impacts to land values)?
Here we highlight three opportunities in this regard: reservoir utilization; saline formation
storage; and in situ mineralization in ultramafic rocks.
Reservoir Utilization: “Reservoir Utilization” technology uses depleted oil reservoir
systems and the underlying salt-water filled aquifers (so-called saline formations) to
sequester CO2 and has the potential store over a GtCO2/yr. This opportunity is built on a
platform of conventional CO2 Enhanced Oil Recovery (CO2-EOR) and nascent
experience with pilot- to medium-sized CO2 storage projects in saline formations that
61
have taken place over the past 20 years. For CO2-EOR, where the value of incremental
oil production has been the economic driving force, the goal has been to minimize storage
and maximize utilization of CO2 to produce oil. If the incentives are changed, such as via
a sufficient cost to emit CO2 into the atmosphere, the goal would reverse to maximizing
CO2 storage. Without a carbon emission cost, this will be very difficult.
CO2-EOR Storage: In CO2 Enhanced Oil Recovery, CO2 is injected into a partially
depleted reservoir and increases the flow properties of the residual reservoir oil and thus
overall recovery. Through 40 years of extensive experience, the industry has learned how
to design CO2 EOR projects, operate and manage them in a safe and environmentally
sound way, and produce incremental oil economically. About half of the CO2 injected is
sequestrated within the reservoir and the remaining half is produced with the oil and
returned for reinjection, thus recycled. After the CO2 EOR Project is complete, the CO2
should remain sequestered underground unless is it intentionally removed for use
elsewhere or there is leakage up old wells (Norbotten et al., 2009) or weaknesses in the
reservoir seal. Understanding the pathways, magnitude, and risks of leakage up old wells
is an important issue that needs to be addressed as even small amount of leakage may
be significant over the long run.
Today, since CO2 is a cost to the project, current operations are designed to minimize the
sequestration of CO2. The value of the produced oil is the economic driving force. Today
with low oil prices, little CO2 EOR is being practiced compared to the potential if large
volumes of CO2 were available. However, 300,000 barrels of oil a day have been
produced globally from 140 projects, with a yield of approximately 3 Bbl oil per ton of CO2
injected into the reservoir. Most of this production has come from the US and particularly
from the Permian reservoirs in West Texas. The CO2 for current operations comes
primarily from naturally occurring volcanic formations, in particular from the McElmo
Dome and Sheep Mountain formations in the four corners area in the Rocky Mountains.
An extensive pipeline system consisting of over 50 individual pipelines and covering 4,500
miles has been developed to move CO2 from these formations to CO2-EOR projects24.
24 U.S DOE, 2015. A Review of CO2 Pipeline Infrastructure in the United States. DOE/NETL-2014/1681.

62
The pipeline infrastructure will need to be increased to accommodate more CO2-EOR and
CO2 storage.
These projects have been economic based on oil production because of the relatively
low-cost CO2 ($20-$30/tCO2). As the emphasis on anthropogenic climate change has
increased, 13 projects have utilized industrially produced CO2 for EOR projects (MIT,
2016). Carbon dioxide captured from industrial sources such as natural gas clean-up,
ammonia production, gasification, and most recently a coal-fired power plant, have
contributed to the CO2 supply, and now, more than 12 MT/year of the ~50 MT/year used
for CO2-EOR comes from anthropogenic sources. All of these are developing excellent
operating experience for anticipated future carbon pricing policies. The Weyburn-Midale
project in Southwest Saskatchewan Canada uses anthropogenic CO2 from coal
gasification for incremental oil production. The project is expected to produce at least
220 million barrels of incremental oil and permanently sequester about 40 MT of CO2.
However, in the future with the world targeting the GHG reductions of COP-21, there will
be significant incentive to sequester CO2 if an adequate price for carbon emission is in
place. For EOR systems, the economic penalty for emitting CO2 (and the economic value
of sequestering it) would transform the economic incentive from merely maximizing oil
production to co-optimizing oil/CO2 production. At very high CO2 costs, the objective
would be to maximize CO2 storage in the reservoir system, which includes not only the
oil pay zone, but the underlying aquifer as well. The process of co-optimizing was
modeled in 2005 at Stanford (Jessen et. al., 2005). They found that changing design
parameters such as maximizing the quantity of injection gas CO2, tailoring injection
profiles to reservoir character, and optimizing water injection could increase CO2 storage
significantly in the reservoir itself. Further enhancements could be obtained by CO2
injection into horizontal wells in the aquifers underlying the oil fields.
In IEA's 2015 study “Storing CO2 through Enhanced Oil Recovery,” reservoir/aquifer
storage was modeled further, and results indicated that storage could be increased by a
factor of 3 over a base case compared to conventional EOR provided there is a GHG

63
emissions charge (IEA, 2015). These high storage volumes could potentially be
accomplished by not re-reinjecting produced water into the reservoir and by injecting the
CO2 once through into both the reservoir (for oil recovery) and into the saline aquifer
below the reservoir - thus a Reservoir Utilization approach. The USGS and DOE have
estimated there are 60 -120 GtCO2 storage capacity in depleted reservoir systems in the
US and thus significant storage capacity exists (USGS, 2013; USDOE, 2012). Additional
storage capacity might be achieved through R&D strategies not considered in current
storage capacity estimates for depleted oil reservoirs. And the DOE-led Regional Carbon
Sequestration Partnership (RCSP) has mapped and assessed the potential EOR storage
sites in the US. Untapped and poorly understood opportunities exist in expanding the
range of reservoirs suitable for CO2 to include immiscible CO2 floods, CO2 exsolution,
and indeed, rejuvenate oilfields that are no longer productive (Alizadeh et al., 2011; Zuo
and Benson, 2013; Hatchell and Benson, 2016). R&D to develop these new concepts is
needed.
In the short term, to achieve GT/year rates of CO2 in reservoir systems, scale-up of the
number of CO2-EOR/storage projects by the oil and gas industry will be the limiting factor
in oil reservoirs. Many well-understood opportunities exist around the world (Godec et al.,
2011). Based on screening a data base of the world’s largest basins for CO2-EOR
potential, Godec et al. (2011) estimated that 470 billion barrels could be recovered from
fields favorable for miscible CO2-EOR, and could facilitate the storage of 140 GtCO2. For
reservoir systems, infrastructure for drilling wells, and operating experience and
permitting procedures already exist which can greatly accelerate scale up. There are
significant economies of scale and challenges in developing right-of-ways for pipeline
transport of CO2 (McCoy and Rubin, 2009). Developing a shared network linking CO2
sources to CO2 storage sites could accelerate scale-up, but the private sector is unlikely
to do this in the absence of a long-term and certain policy about a price on carbon
emissions.
Saline Formations: The largest prospective capacity for CO2 storage lies in saline
aquifers. An estimated 2,000 to 21,000 GtCO2 of prospective storage capacity exists in

64
saline formations in North America (NETL, 2015), but the precise amount of storage
capacity and the best locations for storing CO2 remain uncertain because most of these
storage formations have not been thoroughly characterized. Suitable storage reservoirs
have many requirements. They must be deep enough to store CO2 in the supercritical
phase (> 1 km deep), permeable enough (>10-14 m2) enough to inject CO2 at rates on the
order of 1 MT/year, porous enough (>10% porosity) to accommodate a reasonable
volume of CO2, have salinity exceeding 10,000 ppm (that is, not contain potable water)
and preferably multiple sealing formations (e.g. shale, anyhydrite, dolomite) without faults
and with a low enough permeability (<10-17 m2) and high enough capillary entry pressure
to prevent leakage (Miocic et al, 2016). Developing reliable, cost effective, and rapid
methods for characterizing storage sites is a big priority for accelerating the scale-up of
saline formation storage. Saline aquifers that meet these criteria are unlikely to
experience the long-term leakage rates of EOR projects because the lack the large
number of wells that are typically drilled into oil reservoirs.
In addition to the seal, storage security is further enhanced by secondary trapping
mechanisms such as dissolution into the saline fluids in the reservoir, residual gas
trapping, and mineralization. Over the past decade R&D support from governments and
industry has dramatically increased fundamental understanding of these processes (as
documented in Krevor et al., 2015, Emami-Meybodi et al., 2015, and Birkholzer et al.,
2015). DOE-supported EFRCs are using the most advanced nano- to micro-scale
techniques for understanding these processes. Supercomputers are being used to scale
up this knowledge to the reservoir scale. Still, questions remain about the coupled
interplay between these processes in inherently heterogeneous rocks over the timescale
of millennia. So, R&D is needed to increase confidence in these secondary trapping
processes, particularly to accelerate the pace of scale-up by expanding the range of
suitable sites to include those which fundamentally rely on them. This is important
government enabling R&D.
Some risks of geological storage also remain poorly understood. In particular, the
influence of regional pressure buildup caused by CO2 injection is uncertain. If CCS is

65
scaled up rapidly, it is likely that multiple storage projects will take place in the same saline
formation. The cumulative effect of multiple storage projects is likely to cause widespread
pressure buildup in the storage formation (Birkholzer et al., 2015). Under these
circumstances, induced seismicity such as has occurred in Oklahoma in association with
large scale water injection may occur. Similarly, shallow groundwater contamination by
brine displacement up abandoned wells or through large faults is another concern. The
potential for these to occur and mitigation actions to avoid them require R&D.
Finally, monitoring is another key component of assuring safe and effective storage. The
large number of pilot-scale projects supported by governments and commercial projects
supported by industry have resulted in an explosion of monitoring technology. Now, a
wide variety of monitoring tools are available for tracking CO2 plume migration in the
storage reservoir, detecting leakage in overlying aquifers, measuring changes in
groundwater quality, geomechanical deformation, induced seismicity, and surface
leakage. Drawing from the sophisticated suite of seismic, electrical resistivity, InSar, tilt,
pressure, chemical, tracer, and gas flux monitoring, “fit-for-purpose” monitoring programs
are being developed. In spite of this outstanding progress, new, better, and cheaper
techniques are emerging and in this era of big data, new low-cost sensors, satellite
observing systems and drones, there is a huge opportunity to support the rapid scale-up
of CCS up by new monitoring technologies and approaches and to help understand the
risk and extent of leakage from old wells.
This SEAB Task Force believes that CO2 storage in oil and gas reservoirs and saline
formations has potential for GT/year CO2 storage. Much progress has been made over
the past 20 years, but a 50-fold scale-up of the global CCS endeavor is required to get to
the GT/year scale (see Figure A7.1). But, it could be scaled up faster than most other
deep decarbonization technologies because it is built on a platform of existing operations
and infrastructure. From a RD&D standpoint, the program to accelerate scale-up would
need to proceed along parallel paths.
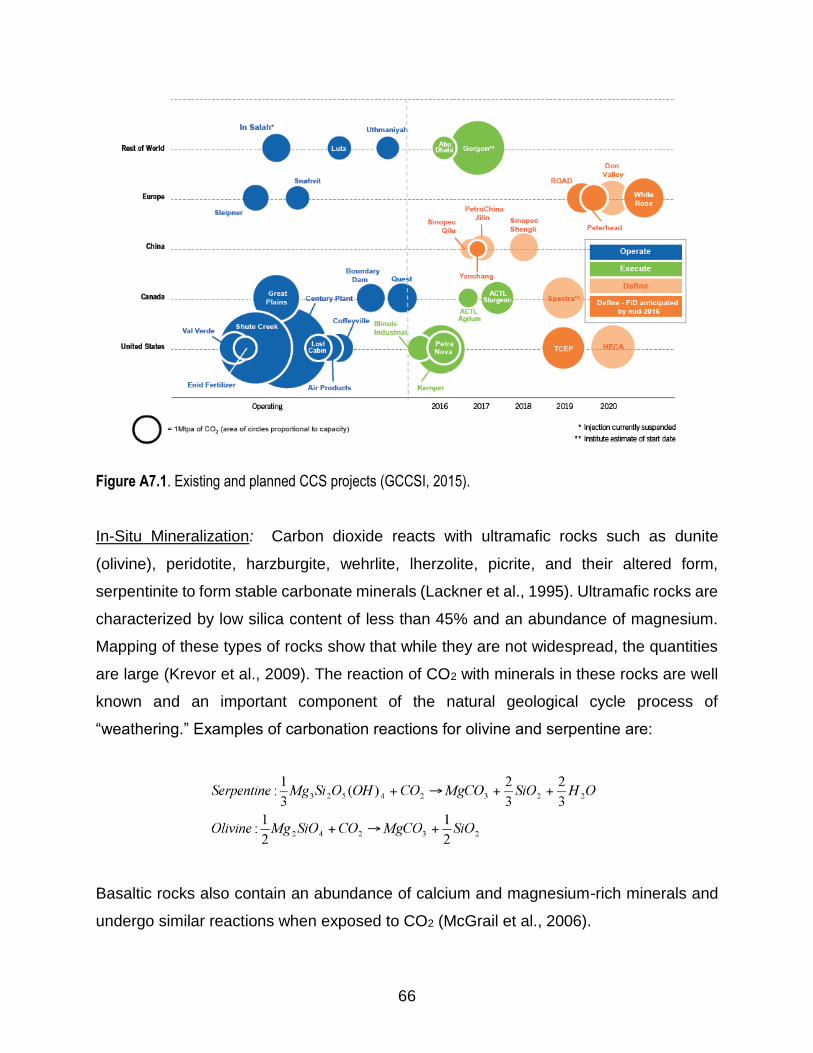
66
Figure A7.1. Existing and planned CCS projects (GCCSI, 2015).
In-Situ Mineralization: Carbon dioxide reacts with ultramafic rocks such as dunite
(olivine), peridotite, harzburgite, wehrlite, lherzolite, picrite, and their altered form,
serpentinite to form stable carbonate minerals (Lackner et al., 1995). Ultramafic rocks are
characterized by low silica content of less than 45% and an abundance of magnesium.
Mapping of these types of rocks show that while they are not widespread, the quantities
are large (Krevor et al., 2009). The reaction of CO2 with minerals in these rocks are well
known and an important component of the natural geological cycle process of
“weathering.” Examples of carbonation reactions for olivine and serpentine are:
Basaltic rocks also contain an abundance of calcium and magnesium-rich minerals and
undergo similar reactions when exposed to CO2 (McGrail et al., 2006).

67
There is considerable interest in storing CO2 by reacting it with ultramafic and basaltic
rocks because it provides carbon storage in stable carbonate minerals. In addition, some
regions of the world lack geological formations for conventional CO2 storage (e.g., much
of India) and basalts/ultramafic rocks may provide an alternative option for storage.
Early research on mineral carbonization focused largely on ex situ mineralization, but the
energy requirements, large volumes of rocks required for these reactions, and slow
kinetics made this impractical (IPCC, 2005).
Subsequently, the emphasis for mineral carbonation of CO2 switched to focus on in situ
mineralization. If CO2, or CO2 dissolved in water, could be injected into these rocks, and
remain underground long enough to undergo these reactions, this may provide a
promising option for C sequestration. A recent experiment conducted in the basaltic rocks
on Iceland produced encouraging results demonstrating that these reactions occurred
more quickly than expected (Matter et al., 2016). If practical engineering schemes could
be implemented to harness and sustain these in situ mineralization reactions, the
potential for carbon sequestration is large.
To date, the R&D efforts devoted to understanding the fundamental science and practical
approaches for in situ mineralization have been limited. An expanded R&D effort is
needed to determine whether or not this offers Gt/year potential for carbon sequestration.
The Task Force makes recommendations in four categories: cross-cutting; reservoir
utilization; saline formations; and in situ mineralization.
Cross-Cutting Issues:
a) Develop and execute a roadmap for accelerating CO2 storage and reservoir utilization
from high-purity anthropogenic CO2 emission sources where there are some
immediate opportunities25.
25 Studies have identified that there are high-purity sources at the scale of 30 MT-CO2 that can be captured at $30/tCO2.http://energy.gov/sites/prod/files/2016/09/f33/DOE%20-%20Carbon%20Capture%20Utilization%20and%20Storage_2016-09-07.pdf

68
b) Create and support a Data Commons 26 as a shared resource for the research
community to document CO2 injection, storage, oil recovery, brine recovery and any
other relevant information that would be helpful to collectively understand and
investigate effective co-optimization and storage techniques.
c) Develop and implement a monitoring, measurement, and verification system capable
of accurately predicting multiple century CO2 leakage rates and environmental
impacts of carbon capture, utilization, and storage (CCUS) projects. This is essential
to increase the confidence needed by all stakeholders (e.g., project operators,
financers, regulators, insurers, and communities) to initiate and sustain the rapid
scale-up of GtCO2/yr scale reservoir utilization and saline formation storage.
Reservoir Utilization:
d) Intensify and expand the RD&D program to:
i. Develop fundamental understanding of mechanisms of pore scale CO2
displacements, including immiscible displacements and other novel CO2-EOR
schemes, and flow in a broad class of reservoirs beyond CO2-EOR.
ii. Co-optimize of CO2-EOR and CO2 storage in hydrocarbon reservoirs and
underlying saline formations.
iii. Develop an approach to estimate reservoir storage costs and operating parameters
for different types of reservoir systems.
iv. Estimate infrastructure needs such as pipelines between storage sites and CO2
sources, and create a roadmap in terms of costs, rates and timings for scale up.
e) In the absence of a carbon emission charge, conduct jointly funded pilot-scale and
demonstration projects with the hydrocarbon industry and research community
(academic and national laboratory) to test co-optimization techniques and expand the
range of hydrocarbon reservoirs where CO2 storage is attractive. Put all of the quality
assured data from this project into the Data Commons consistent with the
requirements of the contract.
Saline Formations:
26 Data sharing could be obligatory for all government contracts and joint studies involving government funding.
Special provisions need to be made to protect propriety data from oil and gas-field operators. Responsibilities of data users should be clearly spelled out in access agreements. Compliance on the part of data generators and users should be monitored for compliance with the access policies
69
f) Continue and strengthen the R&D program to understand and harness secondary
trapping mechanisms, site characterization, and geomechanical effects to assure safe
and effective GtCO2/yr scale storage on century to millennium time scales.
g) Address important questions of leakage (or integrity of seals), accuracy of models for
long-term performance, risk of seismicity, efficacy of monitoring to detect leakage and
groundwater contamination.
In-Situ Mineralization
h) An expanded R&D effort is needed to determine whether or not our fundamental
understanding of CO2 mineralization offers GtCO2/year potential for carbon
sequestration. Convening a team of scientists and engineers to identify the full range
of opportunities and challenges is a logical first start.
References
Benson, S. M., K. Bennaceur, P. Cook, J. Davison, H. de Coninck, K. Farhat, A. Ramirez, D. Simbeck, T. Surles, P. Verma, and I. Wright. 2012. Carbon capture and storage. Chapter 13 in Global Energy Assessment-Toward a Sustainable Future. Cambridge, UK: Cambridge University Press.
Birkholzer, J. T., Oldenburg, C. M., & Zhou, Q. 2015. CO2 migration and pressure evolution in deep saline aquifers. International Journal of Greenhouse Gas Control, 40, pp. 203-220.
Emami-Meybodi, H., Hassanzadeh, H., Green, C. P., & Ennis-King, J. 2015. Convective dissolution of CO2 in saline aquifers: Progress in modeling and experiments. International Journal of Greenhouse Gas Control 40, pp. 238-266.
GCCSI, 2015. The Global Status of CCS, 2015. Godec, M., Kuuskraa, V., Van Leeuwen, T., Melzer, L. S., & Wildgust, N. (2011). CO 2
storage in depleted oil fields: the worldwide potential for carbon dioxide enhanced oil recovery. Energy Procedia 4, pp. 2162-2169.
Hepple, R. P., and S. M. Benson. 2005. Geologic storage of carbon dioxide as a climate change mitigation strategy: Performance requirements and the implications of surface seepage. Environmental Geology 47(4), pp. 576-585. DOI: 10.1007/ s00254-004-1181-2.
IEA. 2013. Technology Roadmap: Carbon Capture and Storage. Krevor, S. C., Graves, C. R., Van Gosen, B. S., & McCafferty, A. 2009. Mapping the
mineral resource base for mineral carbon-dioxide sequestration in the conterminous United States. US Geological Survey.
Matter, J. M., Stute, M., Snæbjörnsdottir, S. Ó., Oelkers, E. H., Gislason, S. R., Aradottir, E. S., ... & Axelsson, G. 2016. Rapid carbon mineralization for permanent disposal of anthropogenic carbon dioxide emissions. Science 352(6291), pp.1312-1314.

70
McGrail, B. P., Schaef, H. T., Ho, A. M., Chien, Y. J., Dooley, J. J., & Davidson, C. L. 2006. Potential for carbon dioxide sequestration in flood basalts. Journal of Geophysical Research: Solid Earth 111, B12201.
Metz, B., Davidson, O., De Coninck, H., Loos, M., & Meyer, L. 2005. Carbon dioxide capture and storage. IPCC Report Working Group III http://digital.library.unt.edu/ark:/67531/metadc12051/.
MIT 2016. https://sequestration.mit.edu/ NETL, 2015. 5th Carbon Storage Atlas. https://www.netl.doe.gov/research/coal/carbon-
storage/atlasv Nordbotten, J. M., Kavetski, D., Celia, M. A., & Bachu, S. 2009. Model for CO2 leakage
including multiple geological layers and multiple leaky wells. Environmental science & technology 43(3), pp. 743-749.
USDOE 2012. http://energy.gov/fe/articles/does-carbon-utilization-and-storage-atlas-estimates-least-2400
USGS 2013. https://www2.usgs.gov/blogs/features/usgs_top_story/the-gigaton-question-how-much-geologic-carbon-storage-potential-does-the-united-states-have/

71
APPENDIX 8
CO2 CAPTURE AND OTHER SEPARATION TECHNOLOGIES
Any separation of CO2 from a mixture of gases requires energy to overcome the entropy
of mixing. The predominant approach today is via binding reactions to sorbent molecules
(A + CO2 = A:CO2), followed by removal of the bound CO2 from the mixture, unbinding of
CO2 from the sorbent molecule (A), and finally reuse of the sorbent molecule (Wilcox,
2012; Smit et al, 2014). The thermodynamics of the binding and unbinding reactions are
governed by Gibb’s free energy G = H - TS, where H is the enthalpy of the reaction,
S is the entropy change, and T is the temperature. Since the binding reaction results in
S < 0, the reaction must necessarily be exothermic (H < TS < 0) for the reaction to
occur (G < 0). For the dissociation reaction S > 0 and H > 0 and hence one needs to
raise the temperature T such that TS > H such that again G < 0. The equilibrium
temperature for dissociation is therefore, Td = |H|/|S|.
While the thermodynamics of individual reactions is well understood, what is often
overlooked is the fact that CO2 has to compete with other molecules (D) in the mixture
(e.g., H2O) to bind to the sorbent (A). The selectivity of binding is related to the ratio
[CO2]KCO2/[D]KD where [CO2] and [D] are the concentrations of CO2 and the competing
molecule D, respectively, and K is the equilibrium constant K ∝ exp (-G/RT) where R is
the universal gas constant. As is evident, if the concentration [D] >> [CO2] and we want
selectivity to CO2 binding, then we must have [CO2]KCO2 >> [D]KD. Therefore, it is
necessary to have |GCO2| > |GD| for the sorbent to selectively bind to CO2. This
naturally suggests that for preferential binding to CO2, the reaction between A and CO2
should be highly exothermic (|HCO2| >> |HD|). However, this has the undesirable impact
that Td will be high, requiring high energy input for the dissociation reaction. This
increases the energy or the operating cost of CO2 capture and separation. One might
then conclude that relatively weak CO2 binding – still necessarily larger than D’s binding
- is preferable. However, the binding cannot be too weak, not only because of the
selectivity issue already mentioned, but also because the association-dissociation
equilibrium would then require increased partial pressures of CO2 to achieve sufficient

72
binding to effectively capture it. Increasing pressure on the front end raises the energy
requirement for operation, with the mechanical energy of compression as a new
consideration in the tradeoff of energy inputs for capture and release. Thus there is a
sweet spot, as indicated in the figure below, of preferred binding exothermicity.
The rates of reaction are also important for cost estimation, and are given by r = kf[A][CO2]
– kr[A:CO2] where kf (M-1s-1) and kr (s-1) are the rate constants for the forward and reverse
reactions, and K = kf/kr. If kf >> kr, the forward reaction is strongly favored and hence a
single pass through of CO2 over the sorbent will capture much more CO2 than if kf ∼ kr.
Therefore, to capture the same amount of CO2, the reactor size and the cost is lower if kf
>> kr. The key point to note is that the reactor size is inversely proportional to the reaction
rate constant, which has direct impact on the capital cost of a CO2 capture plant.
Thus, an ideal sorbent for CO2 is one that has high kf and moderate H. However, Fig.
A8.1 suggests that for current sorbents such as monoethanol amine (MEA), sodium
hydroxide (NaOH), and others, the rate constants and enthalpy are correlated. Currently,
there are no sorbents which possess kf > 12000 M-1s-1 and |H| < 70 kJ/mol. This ought
to be part of a research effort to identify sorbents in this thermodynamic and kinetic range.
Figure A8.1: Rate constant (liter/mol-sec) vs. absolute value of the reaction enthalpy (kJ/mol) for chemical sorbents. Source: APS Report, Figure 3B.1, p. 69.

73
Perhaps one option is to introduce weak (low H) multivalent or cooperative binding for
high selectivity, an approach often found in biology. But because CO2 is a small molecule
this is difficult, unless it is possible to exploit the quadrupole moment of CO2 molecules.
Selectivity of CO2 binding may also be able to take advantage of the -electron system of
CO2, to consider binding, e.g., to aromatic amines such as bipyridine (Benson et al., 2013;
Keith et al., 2013).
It is worth noting CO2 concentrations in the atmosphere are much lower than those of the
point sources (e.g., post-combustion capture from coal-fired or natural gas power plants).
Hence, the condition [CO2]KCO2 >> [D]KD is more difficult to be met for direct air capture
than that used for point sources. On the other hand, if R&D yields sorbents that satisfy
the condition for direct air capture, CO2 capture from point sources would be solved as
well.
While absorption in liquids offers a volumetric advantage that adsorption on solid surfaces
lacks, the conventional choices of alcohol amines or alkali hydroxides have the significant
disadvantage that they are dissolved in water, a substance with high heat capacity. As a
result, the Achilles heel of these solutions is the enormous amount of energy required
simply to heat up the water – that comprises the largest component of these solutions -
to release the CO2. Thus, R&D is needed to identify new liquid solutions with lower heat
capacity than water that can selectively bind CO2 in the sweet spot of rates and enthalpies
mentioned above. Such liquids need to be non-corrosive, non-viscous, and inexpensive.
Ionic liquids (ILs) have been pursued as alternatives, largely because of their potential
reduced energy demands during solvent regeneration (Boot-Handford et al., 2014). Other
positive features of ILs include tunability of both anions and cations to optimize
temperature/pressure swing absorption/desorption, increased solubility and diffusivity of
CO2 due to a potentially more open network nature, high thermal stability and low vapor
pressure that enables operation over a wide temperature range. Their main
disadvantages are higher viscosity – resulting in lower heat and mass transfer - and
simply the expense of designer materials at the scales required. Their high viscosity can
be overcome by using supported ion-liquid membranes (SILMs), which increase the
74
contact area while maintaining high stability; moreover, SILMs are easily regenerated and
pose less environmental hazards than the ILs themselves. For ILs and other novel
capture agents, materials discovery research that optimizes for physical properties
subject to actual costs at scale are needed.
SILMs are effectively one type of adsorption-based solids, which can retain a high heat
of adsorption to enhance selectivity and capture rate, while employing a medium with a
much lower heat capacity than aqueous solutions. Adsorbents ideally should be able to
work at low pressure, be selective, exhibit fast kinetics, and be stable mechanically,
thermally, and with respect to humidity. Synthesis and characterizations of nanoporous
carbons, amine-modified mesoporous silicas, zeolites, metal-organic frameworks
(MOFs), polymeric membranes, and other media that enable tuning of CO2 binding
enthalpies and rates (H and kf) are active areas of basic research that should be
continued, subject to the economic constraint mentioned above. MOFs offer, like ILs, a
veritable playground of tunability, because of the diverse building blocks of metals and
organic linkers that one can use to create them. They feature very high surface area that
enable increased adsorption. As with zeolites, tunability of gas separation selectivity is
outstanding due to fine control of molecular binding and transport. Activated carbons are
more stable hydrothermally than zeolites and have low heats of adsorption, but exhibit
less capacity and selectivity. In some instances, these tradeoffs may still favor their use.
Organic polymers possess versatility characteristics similar to MOFs and can be isolated
as solids. CO2 can be held in internal cavities via host-guest interactions optimized for
chemical selectivity, absorption capacity, and permeability.
Finally, we recommend continued research into the discovery of catalysts that accelerate
binding of CO2, including conversion of CO2 to carbonate or bicarbonate. Mimics of
carbonyl anhydrase are but one example. These could be used with both liquid and solid
absorbents.
Membrane separations have the potential to displace high-temperature, energy-intensive
processes such as distillation and evaporation. Key to separation of gas mixtures is a fine
75
balance between the membrane’s selectivity and permeability for CO2, as already alluded
to in the discussion of solid absorbents and SILMs above. Separation of liquid mixtures
containing molecules of similar polarity, as arises biofuel production and CO2 reduction
to alcohols, poses a particular challenge. While a variety of separation technologies exist
for ethanol-water and butanol-water mixtures, no successful process yet exists for
methanol-water mixtures that arise from photocatalytic reduction of CO2 by certain
compound semiconductors in the presence of aromatic amine co-catalysts (see
Appendix 6). An example of a promising separation technology is pervaporation, in which
both permeability and vapor pressure differences are exploited (Van der Bruggen and
Luis, 2014). More research into materials and process discovery for miscible liquid
mixture separations is clearly needed.
Based on this background the SEAB CO2 Task Force makes the following
recommendations. Create a research program to:
a) Identify new, low-cost CO2 sorbents made of abundant elements that have a binding
enthalpy |H| < 70 kJ/mol, binding rate constant kf > 12000 M-1s-1, and kf >> kr, where
kr is the rate constant for the unbinding or dissociative reaction. A lower enthalpy
correlates to lower energy costs whereas higher binding rate constant correlates to
smaller plant size and thereby lower capital costs. Current sorbents have either: (a)
high rate constants and high binding enthalpy, and thereby high energy costs; or (b)
low rate constants and low enthalpy, and thereby high capital costs.
b) Identify new, low-cost, noncorrosive, non-viscous liquid solutions with lower heat
capacity than water that selectively bind CO2 with the characteristics in (a).
c) Discover new materials and processes to separate miscible liquid mixtures optimized
for very low capital and operating costs.
d) Design, build and demonstrate scalable reactor designs that offer the possibility to
substantially reduce carbon capture and separation costs.
Benson, E. E., M. D. Sampson, K. A. Grice, J. M. Smieja, J. D. Froehlich, D. Friebel, J. A. Keith, E. A. Carter, A. Nilsson, and C. P. Kubiak, 2013. The Electronic States of Rhenium Bipyridyl Electrocatalysts for CO2 Reduction as Revealed by X-Ray

76
Absorption Spectroscopy and Computational Quantum Chemistry,” Angew. Chem. Int. Ed. 52, 4841-4844.
Boot-Handford, M. E., J. C. Abanades, E. J. Anthony, M. J. Blunt, S. Brandani, N. MacDowell, J. R. Fernandez, M.-C. Ferrari, R. Gross, J. P. Hallett, R. S. Haszeldine, P. Heptonstall, A. Lyngfelt, Z. Makuch, E. Mangano, R. T. J. Porter, M. Pourkashanian, G. T. Rochelle, N. Shah, J. G. Yao, and P. S. Fennell. 2014. Carbon capture and storage update, Energy Environ. Sci., 7, pp. 130-189.
Keith, J. A., K. A. Grice, C. P. Kubiak, and E. A. Carter. 2013. Elucidation of the Selectivity of Proton-Dependent Electrocatalytic CO2 Reduction by fac-Re(bpy)(CO)3Cl. J. Am. Chem. Soc. 135, pp. 15823-15829.
Smit, B., J. R. Reimer, C. M. Oldenburg and I. C. Bourg. 2014. Introduction to Carbon Capture and Sequestration, Imperial College Press, London.
Van der Bruggen, B. and P. Luis. 2014. Pervaporation as a tool in chemical engineering: a new era?, Curr. Op. Chem. Eng. 4, pp. 47-53.
Wilcox, J. 2012. Carbon Capture, Springer, New York.
77
APPENDIX 9
DIRECT AIR CAPTURE OF CO2 WITH CHEMICALS
Many chemicals can selectively remove CO2 from a gas mixture (see Appendix 8),
including from air. Direct Air Capture (DAC) describes these chemical approaches (Keith,
2009). To take a simple example, when air is blown over sodium hydroxide (NaOH), the
CO2 in the air selectively reacts to produce sodium carbonate (Na2CO3). Na2CO3 is
subsequently processed to produce CO2 at a higher concentration – as well as NaOH,
which is recycled. The net effect is to concentrate CO2 but not to change it chemically.
What happens subsequently to the concentrated CO2 is not part of DAC: it may be used
as CO2 in concentrated form, or transformed by chemical reactions into other molecules,
or sequestered. DAC in combination with sequestration is, in essence, a way of scrubbing
the atmosphere of some of its CO2 and lowering its concentration.
Biological approaches to CO2 capture are different from DAC, in that the selective removal
of CO2 from the air is accompanied by chemical reactions that change the CO2 into other
molecules (sugars, for example). The advantages of DAC accrue as a result of its not
involving biological processes and, thereby, not being in conflict with other uses of land –
to grow food and provide habitat, for example. DAC can be located at sites that are
unsuitable for biology. DAC does not have the seasonality of biological processes that
are characteristic of many locations, either.
DAC presents many challenges (Socolow et al., 2011). We distinguish here inevitable
problems, researchable problems distinct for DAC, and researchable problems widely
found across CO2 removal strategies.
Inevitable Problems: The principal inevitable problem with DAC is that a very large
amount of air must be intercepted. One GtCO2 is contained in about 1700 Gt air, since
CO2 is present at a molar concentration of 400 ppm, which is 600 ppm by weight; the air
occupies 1.4*1015 m3. If half of the CO2 passing over the absorbers is removed and half
passes through without reacting, then 2.8 *1015 m3 of air would need to pass over the
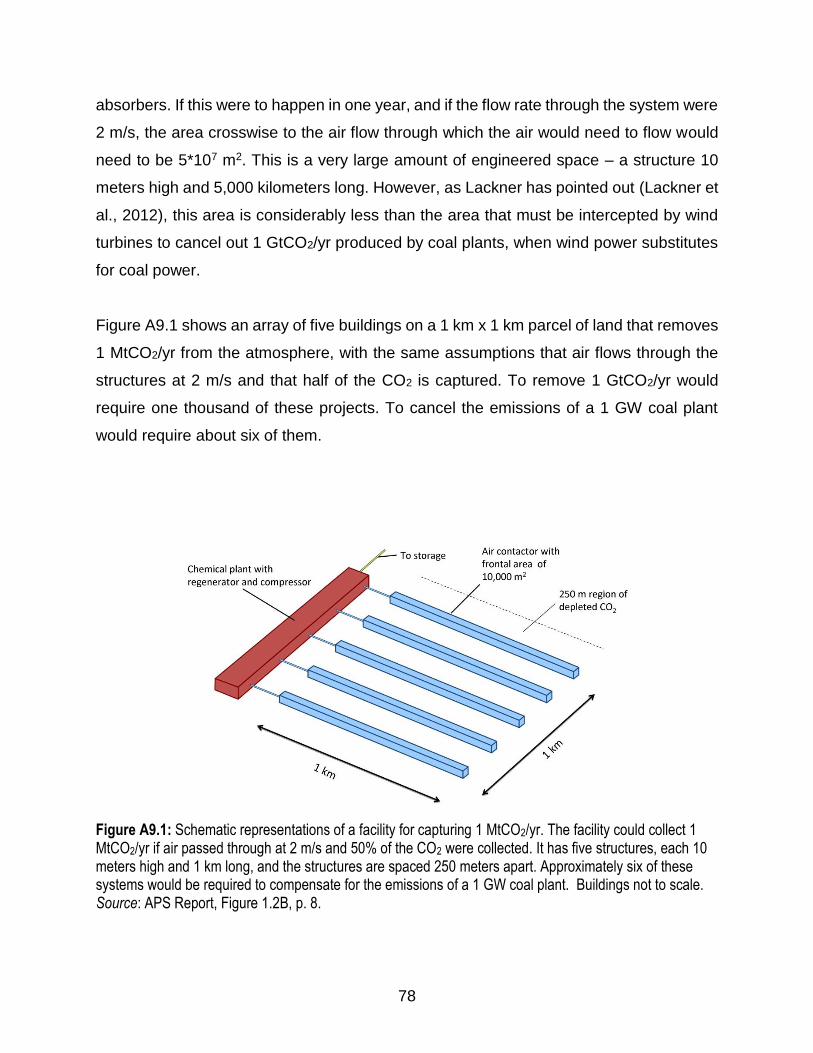
78
absorbers. If this were to happen in one year, and if the flow rate through the system were
2 m/s, the area crosswise to the air flow through which the air would need to flow would
need to be 5*107 m2. This is a very large amount of engineered space – a structure 10
meters high and 5,000 kilometers long. However, as Lackner has pointed out (Lackner et
al., 2012), this area is considerably less than the area that must be intercepted by wind
turbines to cancel out 1 GtCO2/yr produced by coal plants, when wind power substitutes
for coal power.
Figure A9.1 shows an array of five buildings on a 1 km x 1 km parcel of land that removes
1 MtCO2/yr from the atmosphere, with the same assumptions that air flows through the
structures at 2 m/s and that half of the CO2 is captured. To remove 1 GtCO2/yr would
require one thousand of these projects. To cancel the emissions of a 1 GW coal plant
would require about six of them.
Figure A9.1: Schematic representations of a facility for capturing 1 MtCO2/yr. The facility could collect 1 MtCO2/yr if air passed through at 2 m/s and 50% of the CO2 were collected. It has five structures, each 10 meters high and 1 km long, and the structures are spaced 250 meters apart. Approximately six of these systems would be required to compensate for the emissions of a 1 GW coal plant. Buildings not to scale. Source: APS Report, Figure 1.2B, p. 8.

79
Researchable Problems Distinct for DAC: The two most important steps in DAC are
achieving a large contact area for the capture reaction and regenerating the sorbent. Both
are research areas. To achieve large contact area, some concepts envision the passage
of air through large volumes of mesh, others envision passage through a porous ceramic.
The air velocity is an important independent variable.
The endpoint of a DAC system can be CO2 at various levels of concentration and purity.
In principle, concentration can be in stages (say from 400 ppm to 1 percent in one device
and from 1 percent to 99 percent in a second device).
As for sorbent regeneration, one can ask first if regeneration is necessary. In principle,
the sorbent can be discarded, bonded to CO2, rather than regenerated. But 1 GtCO2/yr
capture without regeneration will involve on the order of 1 Gt/yr of sorbent throughput,
which would entail huge materials flow in and out and have major implications for sorbent
fabrication and end-product disposal. So, almost surely, the sorbent must be recycled.
Further, the volume of sorbent required is enormous. For example, the quantity of
hydroxide required vastly exceeds US production.
Further research challenges specific to DAC address the impact of environmental
conditions on performance. Performance includes durability of materials, as well as
reaction rates and material flows. Many harsh environments can be imagined, from a dry
and cold arctic site to a moist and hot site in the tropics.
Another issue is CO2 replenishment after depletion, downstream of a collecting structure.
Figure A9.1 shows two identical systems, one of them 250 meters downstream from the
other. No modeling lies behind this choice of spacing.
Problems in common with all other CO2 removal strategies: “Net carbon” can be a severe
challenge for all systems that extract CO2 from the atmosphere. Numerous steps require
chemical, mechanical, electrical, or thermal energy. Biological systems may require
fertilizing, plowing, harvesting, drying, and transport. DAC may require fanpower, heating,
80
and drying. Both require the construction of buildings and equipment. How much CO2 is
released to the air during the provision of these functions is likely to be critically dependent
on the carbon intensity of the energy system providing these services. CO2 removal may
emit more CO2 than is captured, if conducted in the near term with a carbon-intensive
energy system, but be net negative even conducted in the same way but at a later time if
the energy system meanwhile becomes substantially less carbon-intensive.
The earth’s carbon cycle becomes involved when CO2 is removed from the atmosphere
(Appendix 4). Should one expect outgassing of the oceans, given that CO2 emissions to
the atmosphere produces CO2 flow from the atmosphere into the oceans? (If so, the
ocean pH would increase.) What about forests and other locations of terrestrial carbon
stock on land, which are currently increasing in mass – probably at least in part because
extra CO2 in the atmosphere promotes plant growth (carbon fertilization)? These are
researchable questions of broad importance for CO2 capture from air, no matter how
accomplished.
Additional remarks: The CO2 concentration in the flue gas at a coal power plant is about
12 percent by volume, 300 times greater than in air. For natural gas power plants, the
ratio is about 100. Although solutions for flue-gas capture and air capture may sometimes
apply to one system but not the other, one can expect cross-fertilization –even
unexpected discoveries intended for one system but of greater import for the other.
Keith, D.W. 2009. Why capture CO2 from air? Science 325, pp. 1654-1655. Lackner, K.S., S. Brennan, J.M. Matter, A-H. Alissa Park, A. Wright, B. van der Zwaan
2012. “The urgency of the development of CO2 capture from ambient air,” Proc. Natl. Acad. Sci 109, pp. 13156-13162.
Socolow, R., et al., 2011. Direct Air Capture of CO2 with Chemicals: A Technology Assessment for the APS Committee on Public Affairs, APS Report. http://www.aps.org/policy/reports/assessments/upload/dac2011.pdf