Embed Size (px)
Citation preview

Secondary School Data and Statistics on the NZQA Website
24 March 2010 Version 4.3
Secondary School Data and Statistics Version 4.3
New Zealand Qualifications Authority 2010 Page 2 of 37
Contents
1. Introduction .................................................................................................................. 3
1.1 What has changed?..................................................................................................... 3
2. Overview of the website ............................................................................................... 6
2.1 NCEA and other NQF Qualifications ........................................................................ 6
2.2 NCEA Endorsements ................................................................................................. 7
2.3 Results by Subject and Standard ................................................................................ 9
2.4 Scholarship Entries and Results ............................................................................... 11
2.5 Literacy and Numeracy requirements for NCEA Level 1........................................ 13
3. Creating Reports ........................................................................................................ 14
3.1 Data selection tools .................................................................................................. 15
3.2 School Selection....................................................................................................... 16
3.3 Candidate Selection.................................................................................................. 16
3.4 View Selection ......................................................................................................... 17
3.5 Sub-Report Links ..................................................................................................... 18
3.6 Navigating back to the report criteria selection screen ............................................ 18
4. Worked Examples of Creating Reports ...................................................................19
4.1 NCEA and other NQF Qualifications – single region.............................................. 19
4.2 NCEA and other NQF Qualifications – comparative regions.................................. 20
4.3 Results by Subject and Standard .............................................................................. 23
5. Building Reports for Specific Objectives ................................................................. 25
5.1 Longitudinal analyses............................................................................................... 26
5.2 Subject analyses ....................................................................................................... 29
5.3 School comparison analysis ..................................................................................... 31
6. Reporting on data analyses........................................................................................ 34
6.1 Introducing the report............................................................................................... 34
6.2 Visual presentation of data....................................................................................... 34
6.3 Discussion of data & critical thinking...................................................................... 34
7. Appendix 1 .................................................................................................................. 36
7.1 Individual Student Information for Schools............................................................. 36
Secondary School Data and Statistics Version 4.3
New Zealand Qualifications Authority 2010 Page 3 of 37
1. Introduction
The New Zealand Qualifications Authority (NZQA) website presents data illustrating the performance of secondary students in gaining qualifications and credits on the New Zealand Qualifications Framework (NQF) and in New Zealand Scholarship.
This guide is an accompaniment to the revised statistics pages, accessed via the statistics section of the NZQA website.
The website enables you to create reports to view data on student achievement at individual schools, groups of schools, and nationally. It also supports comparisons of data such as:
• Performance in assessments at one school or group of schools against another school or group of schools.
• The relative performances of groups of students with different demographic characteristics (e.g. boys and girls).
• Longitudinal analyses of achievement data; that is, comparing data across years.
This document is designed to provide an easy-to-follow guide to accessing, using and interpreting these data. The document includes:
An Overview of the Website, which describes the types of reports that the website can generate, and the achievement data that are included in each.
A guide to Creating Reports, aimed at getting you up and running as fast as possible and enabling you to use the data selection tools to create reports containing the data you want to see. Some worked examples of reports displaying and comparing data are also provided in this section, and data export functions are explained; that is, the tools that allow you to download data files so that you can view them using Microsoft Excel.
A guide to Building Reports for Specific Objectives, designed to assist you to get the most out of the data. It includes worked examples that illustrate how to use the website data to help you answer particular questions as well as some basic principles and techniques of statistical analysis.
A guide to Reporting on Data Analyses, which provides some recommendations on presenting analyses for various audiences.
1.1 What has changed?
The new design for the on-line delivery of secondary school achievement data differs from the old significantly. The changes are aimed at providing more useful and easily accessible data, and improving website navigation and the visual clarity of the data. The main changes are as follows:
A more meaningful method of calculating the percentages of students achieving NQF qualifications
Under the new design of the website, users can create tables of data in which denominators for percentages of students gaining qualifications are participation-based rather than roll-based. Users have a choice of two participation-based reports: the single year report and the cumulative report.
Secondary School Data and Statistics Version 4.3
New Zealand Qualifications Authority 2010 Page 4 of 37
In the single year report, the denominator (the bottom number in a fraction) for the percentage of students achieving a given level of NCEA is the number of students who, on the basis of their results prior to, and entries during, a selected year could potentially gain that qualification in that year. The numerator (the top number of a fraction) is the number of students who actually gained that qualification in that year.
In the cumulative report, the denominator for the percentage of students achieving a given level of NCEA is the number of students who, on the basis of their results prior to, and entries during, a selected year could potentially gain that qualification by the end of that year or who have already achieved it in a previous year. The numerator is the number of students who actually gained that qualification by the end of that year.
Reports based on a roll-based denominator (using the 1 July School roll figure) are still available. The participation-based denominators provide more accurate representations of achievement rates for NQF qualifications than the roll-based denominator, especially at schools in which there are substantial numbers of students not pursuing NCEA qualifications. There are two main categories of schools for which this is likely to be the case. The first comprises schools with a substantial proportion of their students having special needs or being part-time students. The second comprises schools with a substantial proportion of their students pursuing non-NQF qualifications.
Percentages rather than total number of results as the default view
As a default the new system will display data as percentages rather than as absolute numbers. The majority of analyses are more meaningful in this format. Reports showing absolute numbers are also still available.
The proportions of students achieving non-NCEA qualifications (e.g., National Certificate in Hospitality) are too small to give useful figures when expressed as percentages. For this reason, achievement data for other NQF qualifications are displayed as numbers only.
Direct comparison of reports on a single screen
A simplified, single-page interface allows users to run reports on a single screen rather than across multiple screens. Under the new system, base and comparison reports can be presented side-by-side. This allows users to run many different types of comparisons and present them in pairs, on the same screen.
Expanded capacity to filter data according to characteristics of students and schools
Whereas the old system was comparatively rigid with respect to its capacity to make comparisons, the new system is much more flexible. Examples include the following:
• One school or group of schools can be compared with another school or group of schools. Schools can be grouped by Decile, School Gender (boys’ schools, girls’ schools, and co-educational schools), and geographical region.
• National results can be compared with school results for standards in a selected subject.
• Students’ achievement data can be simultaneously broken down by gender and ethnicity.
• There is an enhanced capacity to make longitudinal comparisons; that is, to compare achievement rates over successive years.
Secondary School Data and Statistics Version 4.3
New Zealand Qualifications Authority 2010 Page 5 of 37
Arrangement of standards within subjects
Under the old design, results for standards could be grouped according to Learning Areas or NQF domains, but not by subject. Under the new design, results distributions are grouped by subjects, which are defined by Achievement Standard groupings. Unit standards belonging to Achievement Standard based subjects are also included in theses groupings. Unit standards not belonging to any Achievement Standard grouping are grouped according to their NQF sub-field.
Scholarship
A new format ‘Scholarship Entries and Results’ report, available in February, will show percentages and numbers of Not Achieved, Scholarship and Outstanding Scholarship results for New Zealand Scholarship examinations for 2009 and previous years.
Literacy and Numeracy
A new report, ‘Literacy and Numeracy requirements for NCEA Level 1’, will show percentages and numbers of Year 11 students on 1 July School roll achieving the literacy and numeracy requirements for NCEA Level 1 for 2009 and previous years.
Improved data export functionality
Users can download reports (tables of data) that they have created for use in Microsoft Excel.
Please Note:
The older format reports will still be accessible in the new ‘Archived Secondary School Statistics Views’ page but will only contain the statistics up to and including 2008.
The ‘NCEA and other NQF Qualifications – Participation Based’ report is being retired. This was an interim report pending the development of a fully cumulative view in 2009. It was archived in 2010 when it was superseded by the new cumulative report, ‘NCEA and other NQF Qualifications – Participation Based - Single year or cumulative’ (see above). For the purposes of consistency, the ‘NCEA and other NQF Qualifications – Participation Based’ report has been updated with 2009 data. It can be accessed in the new ‘Archived Secondary School Statistics Views’ page.

Secondary School Data and Statistics Version 4.3
New Zealand Qualifications Authority 2010 Page 6 of 37
2. Overview of the website
The website is organised as a series of customisable reports, each of which displays a different type of data. Two examples are the Qualifications Report, which shows percentages and numbers of students gaining NCEA and other qualifications, and the Results by Subject and Standard report, which shows the distributions of results for individual standards and appropriate groupings of standards.
The reports are customisable, meaning that data for specific schools and groups of schools (e.g., girls’ schools, Decile 6 schools), and specific groups of students (e.g., boys, Asian students) can be displayed by selecting appropriate options from drop-down menus.
The specific reports that are available are presented below, with a brief explanation of each.
2.1 NCEA and other NQF Qualifications
Reports show percentages and numbers of participating candidates; those candidates who, on the basis of results prior to and entries during, a selected year, could potentially obtain a given qualification by the end of a selected year; achieving NCEA Levels 1, 2, 3 and University Entrance. Data are broken down by secondary year levels 11, 12 and 13.
Two kinds of Qualifications reports are available. In participation-based reports, all percentages are based on participating candidates. These reports can be either single-year or cumulative. Single year reports show numbers and percentages of candidates achieving qualifications within a selected year. Cumulative reports show numbers and percentages of candidates achieving qualifications by the end of a selected year.
In roll-based reports, all percentages are based on the 1 July school roll figures in a selected year.
Reports displaying numbers rather than percentages will be the same in both participation- and roll-based formats.

Secondary School Data and Statistics Version 4.3
New Zealand Qualifications Authority 2010 Page 7 of 37
Figure 1. Criteria page for creating an NCEA and other Qualifications - Participation Based - Single year or cumulative report.
2.2 NCEA Endorsements
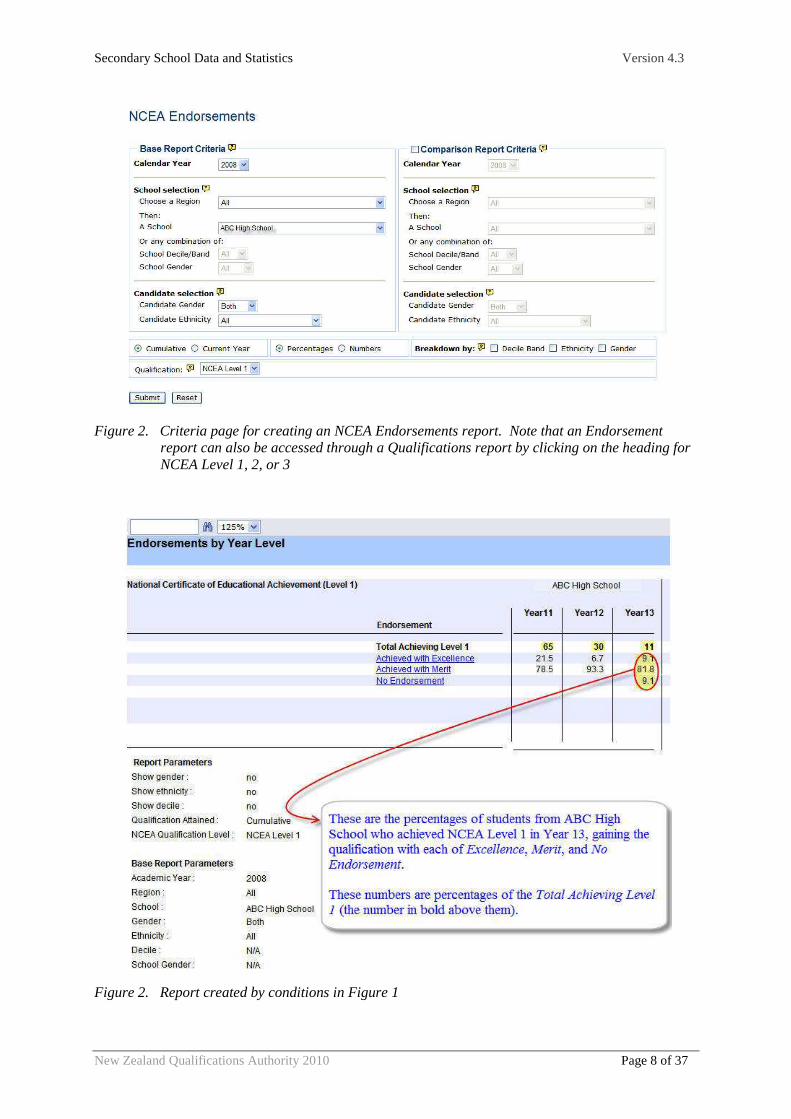
Reports show percentages and numbers of students achieving a selected level of NCEA with no endorsement, with a Merit endorsement and with an Excellence endorsement. Data are broken down by Year levels 11, 12 and 13 (figures 1 and 2 below).
Secondary School Data and Statistics Version 4.3
New Zealand Qualifications Authority 2010 Page 8 of 37
Figure 2. Criteria page for creating an NCEA Endorsements report. Note that an Endorsement
report can also be accessed through a Qualifications report by clicking on the heading for NCEA Level 1, 2, or 3
Figure 2. Report created by conditions in Figure 1
Secondary School Data and Statistics Version 4.3
New Zealand Qualifications Authority 2010 Page 9 of 37
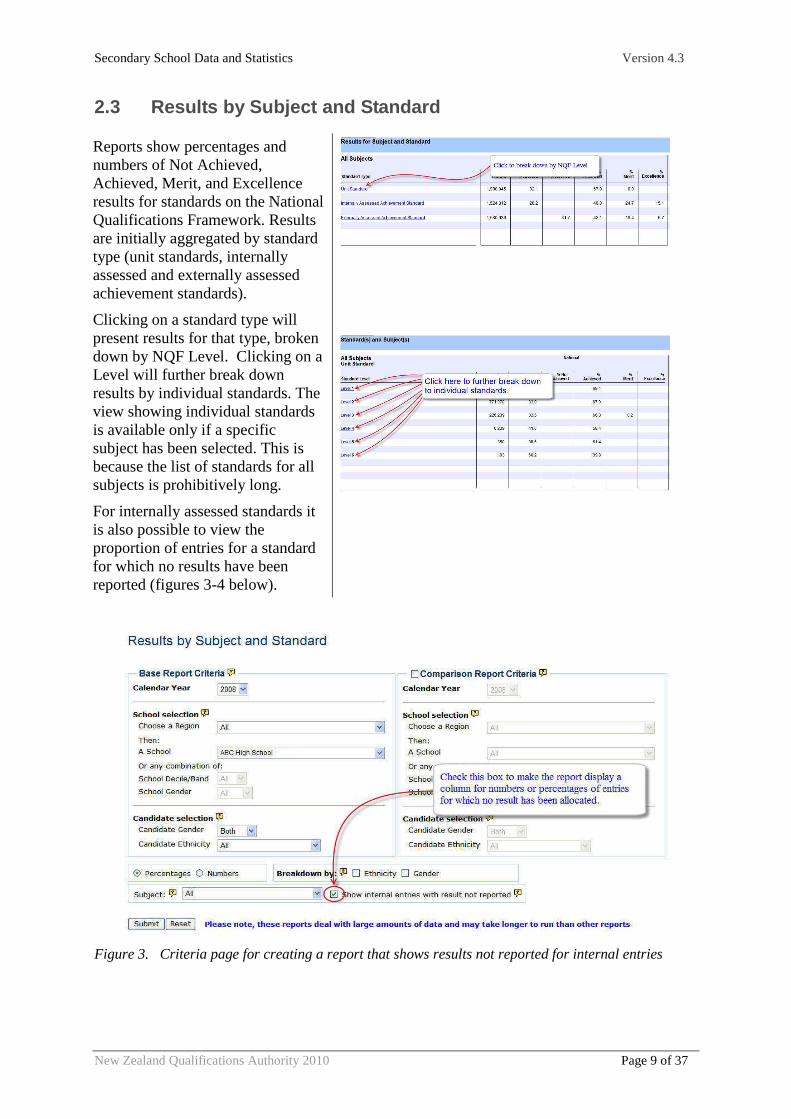
2.3 Results by Subject and Standard
Reports show percentages and numbers of Not Achieved, Achieved, Merit, and Excellence results for standards on the National Qualifications Framework. Results are initially aggregated by standard type (unit standards, internally assessed and externally assessed achievement standards).
Clicking on a standard type will present results for that type, broken down by NQF Level. Clicking on a Level will further break down results by individual standards. The view showing individual standards is available only if a specific subject has been selected. This is because the list of standards for all subjects is prohibitively long.
For internally assessed standards it is also possible to view the proportion of entries for a standard for which no results have been reported (figures 3-4 below).
Figure 3. Criteria page for creating a report that shows results not reported for internal entries

Secondary School Data and Statistics Version 4.3
New Zealand Qualifications Authority 2010 Page 10 of 37
Figure 4a. Report created by criteria in Figure 3 when ‘Show internal entries with no reported result’ checkbox is checked
Figure 4b. Report created by criteria in Figure 3 when ‘Show internal entries with no reported result’ checkbox is not checked
Secondary School Data and Statistics Version 4.3
New Zealand Qualifications Authority 2010 Page 11 of 37
2.4 Scholarship Entries and Results
Reports show data on participation and success in New Zealand Scholarship examinations.
The Participation table at the head of each report shows, across all subjects, the total number of Level 3 subject entries, the total number of valid scholarship results, scholarship results per subject entry, the total number of successful scholarship results, and successful scholarship results per subject entry.
The total number of Level 3 subject entries is the number of candidates included in Level 3 cohorts; that is, the numbers of students undertaking at least 14 credits at Level 3 in a given subject in the given year; totalled across all scholarship subjects. Note that this is not a count of individual students; most Year 13 students have more than one Level 3 subject entry. The total number of valid scholarship results is the total number of results of N, S or O totalled across all scholarship subjects. Scholarship results per subject entry is an estimate of the scholarship participation rate; that is, the average, across all subjects, of the proportion of candidates nominally participating in each subject in a given year, who also have a valid scholarship result in that subject, in that year.
The Candidate Performance table shows the total number of successful candidates, totalled across all subjects. Note that this is not a count of unique candidates; many candidates achieve successful scholarship results in more than one subject. This table also shows the average number of successful scholarship results for candidates with at least one successful result.
The main table on the Scholarship Entries and Results page shows data on entries and results for each subject, and summarised across all subjects in bold at the top of the table. The first three columns show numbers of entries, the percentages of entries for which candidates were absent from the examination (Absent), or submitted blank answer booklets (Standard Not Attempted – SNA). (Note that the latter two columns will show numbers rather than percentages if this option has been selected from the Report Criteria menu.)
The next four columns show the number of valid assessment outcomes for each subject; that is, the total number of results of N, S or O; and the percentage (or number if this option has been selected from the Report Criteria menu) of valid results falling into each of these three grade categories.

Secondary School Data and Statistics Version 4.3
New Zealand Qualifications Authority 2010 Page 12 of 37
Figure 5. Criteria page for creating a Scholarship Entries and Results report.
Secondary School Data and Statistics Version 4.3
New Zealand Qualifications Authority 2010 Page 13 of 37
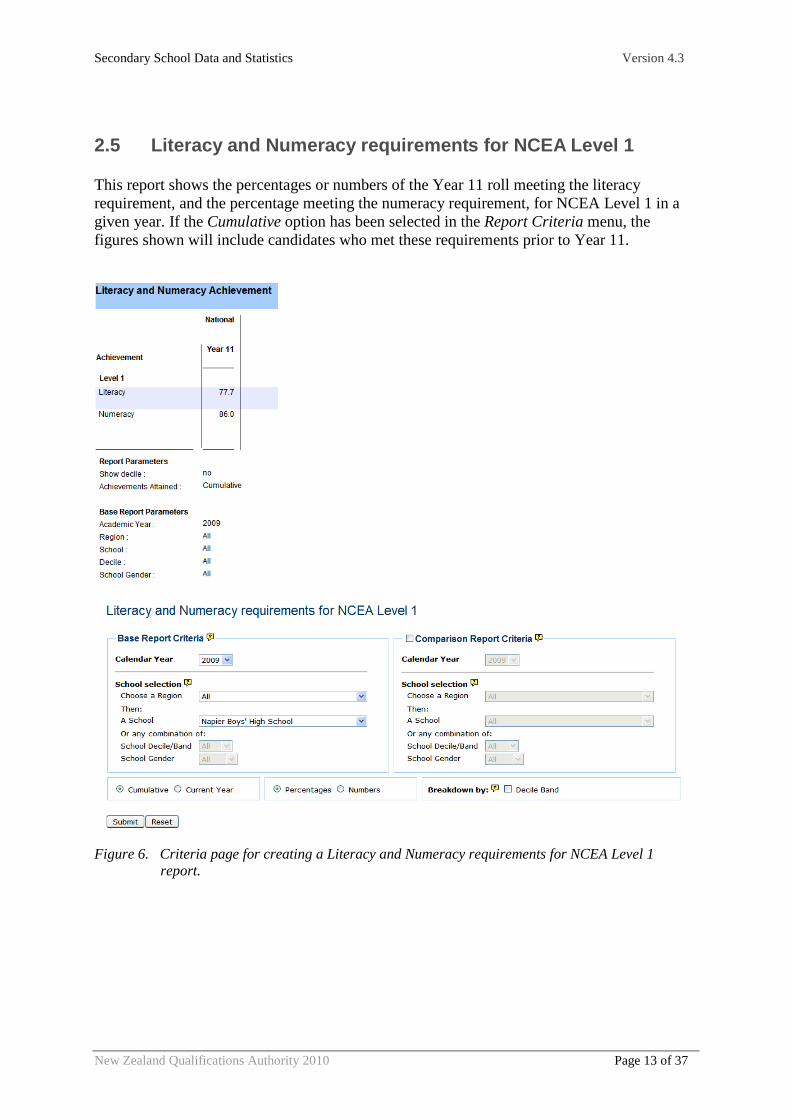
2.5 Literacy and Numeracy requirements for NCEA Lev el 1
This report shows the percentages or numbers of the Year 11 roll meeting the literacy requirement, and the percentage meeting the numeracy requirement, for NCEA Level 1 in a given year. If the Cumulative option has been selected in the Report Criteria menu, the figures shown will include candidates who met these requirements prior to Year 11.
Figure 6. Criteria page for creating a Literacy and Numeracy requirements for NCEA Level 1
report.
Secondary School Data and Statistics Version 4.3
New Zealand Qualifications Authority 2010 Page 14 of 37
3. Creating Reports
This section explains how to create a report using the new data and statistics website.
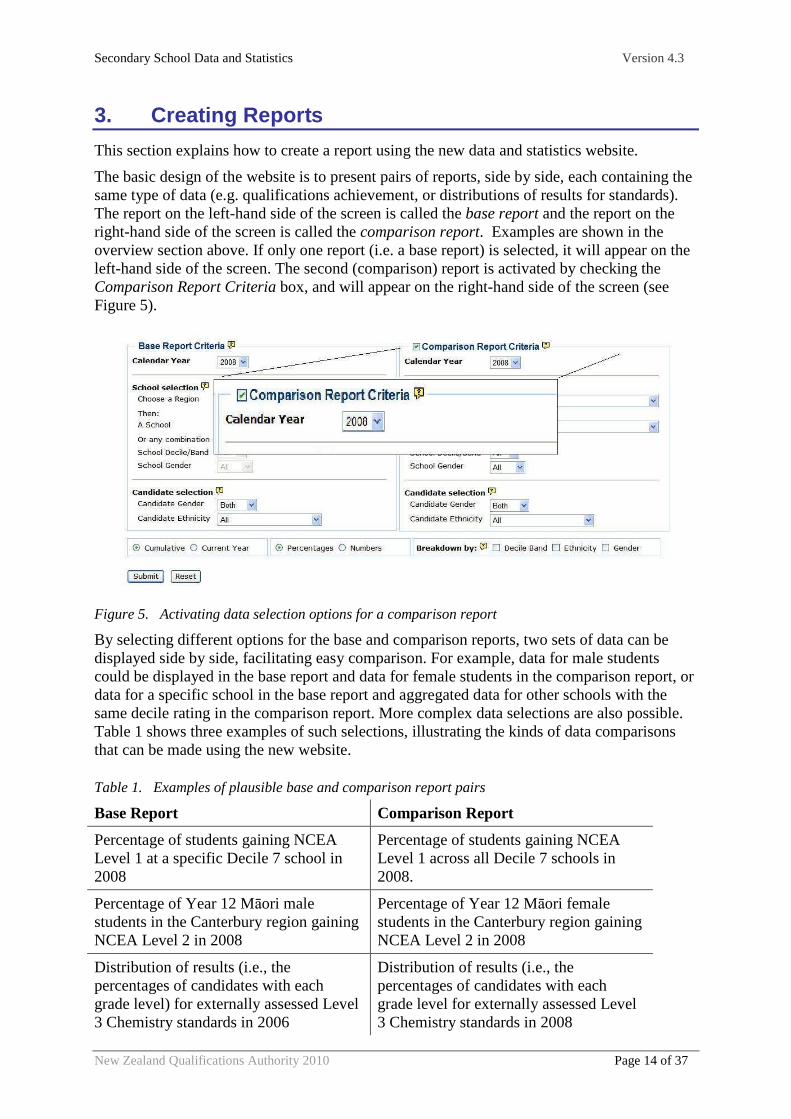
The basic design of the website is to present pairs of reports, side by side, each containing the same type of data (e.g. qualifications achievement, or distributions of results for standards). The report on the left-hand side of the screen is called the base report and the report on the right-hand side of the screen is called the comparison report. Examples are shown in the overview section above. If only one report (i.e. a base report) is selected, it will appear on the left-hand side of the screen. The second (comparison) report is activated by checking the Comparison Report Criteria box, and will appear on the right-hand side of the screen (see Figure 5).
Figure 5. Activating data selection options for a comparison report
By selecting different options for the base and comparison reports, two sets of data can be displayed side by side, facilitating easy comparison. For example, data for male students could be displayed in the base report and data for female students in the comparison report, or data for a specific school in the base report and aggregated data for other schools with the same decile rating in the comparison report. More complex data selections are also possible. Table 1 shows three examples of such selections, illustrating the kinds of data comparisons that can be made using the new website.
Table 1. Examples of plausible base and comparison report pairs
Base Report Comparison Report
Percentage of students gaining NCEA Level 1 at a specific Decile 7 school in 2008
Percentage of students gaining NCEA Level 1 across all Decile 7 schools in 2008.
Percentage of Year 12 Māori male students in the Canterbury region gaining NCEA Level 2 in 2008
Percentage of Year 12 Māori female students in the Canterbury region gaining NCEA Level 2 in 2008
Distribution of results (i.e., the percentages of candidates with each grade level) for externally assessed Level 3 Chemistry standards in 2006
Distribution of results (i.e., the percentages of candidates with each grade level for externally assessed Level 3 Chemistry standards in 2008

Secondary School Data and Statistics Version 4.3
New Zealand Qualifications Authority 2010 Page 15 of 37
*For more information regarding school decile and how it is calculated, please refer to the following page on the Ministry of Education website:
http://www.minedu.govt.nz/educationSectors/Schools/SchoolOperations/Resourcing/OperationalFunding/Deciles/DecilesInformation.aspx
3.1 Data selection tools
Figure 6 shows the layout of the tools for selecting data. These are arranged as a series of drop-down menus. One set, on the left-hand side of the screen, is used to make selections for the Base Report, and the other, on the right-hand side of the screen, is used to make selections for the Comparison Report. The menu options for Base and Comparison reports are identical. Selections can be made on the basis of Calendar Year, Geographic Region, Specific School, School Decile, School Gender, Students Gender, and Student Ethnicity.
Figure 6. Screenshot of the data selection window
For the Results by Subject and Standard report, there is a menu option to select results data for a specific subject. Curriculum-based or curriculum-related subjects are defined by achievement standard subject areas with related unit standards included in each. Standards that do not belong to achievement standard subjects are defined by their NQF sub-fields.
Figure 7. Screenshot of the subject menu within the criteria window for subject and standard reports

Secondary School Data and Statistics Version 4.3
New Zealand Qualifications Authority 2010 Page 16 of 37
The subject menu contains a list of all achievement standard subject areas and NQF-sub-fields for unit standards not belonging to these subjects. To select a specific subject, click the Subject selection list box, scroll to the relevant subject and click it.
3.2 School Selection
The school(s) selection menu is used to select data that pertain to specific schools, geographical regions, deciles and decile bands, or school genders (i.e., boys’ schools, girls’ schools or co-educational schools).
School Region
This filter is used to select data for schools in specific regions of New Zealand; for example, schools in the Wellington or Auckland regions. If All is selected, the report will show national data.
Specific School
This filter is used to select data for a specific school. It is easier to find a school if its region is selected first.
School Decile/Decile Band
This filter selects data for schools in specific deciles or decile bands. A decile is a rating allocated to schools for funding purposes, based on a range of socio-economic factors, and indicates the proportion of students at a school who live in households with low socio-economic circumstances. Thus the decile rating of a school gives an estimate of the socio-economic status of its students. However it is important to bear in mind that decile is a school-level variable, not an individual-level variable, and conveys no information about the socio-economic level of any given student.
Some data selections involving decile return very small numbers of data. Therefore, the filter allows a selection to be made across a band of deciles rather than on a single decile. The available bands are Deciles 1-3, 4-7, and 8-10.
School Gender
This filter allows data to be selected for particular school gender types; that is, boys’ schools, girls’ schools, co-ed schools or the default option of all school gender types.
3.3 Candidate Selection
The candidate selection menu allows data to be selected for students with specific demographic characteristics. These include:
Candidate Gender
This filter selects data for male or female students only; or both genders.
Candidate Ethnicity
This filter selects data for students of specific ethnicities. The available ethnic categories are Asian, NZ European, NZ Māori, Pasifika and other.
Secondary School Data and Statistics Version 4.3
New Zealand Qualifications Authority 2010 Page 17 of 37
3.4 View Selection
Below the data selection menus in the data selection window is the view selection bar. This contains several buttons and check-boxes that allow further customisation of the data that will be displayed. The following options are available on the view selection bar:
Percentages / Numbers
Data can be displayed as percentages (default) or as raw numbers. Note that in participation-based qualifications reports, all percentages are based on the number of participating candidates; that is, the number of candidates who, on the basis of results prior to, and entries during, a selected year, could potentially complete a given qualification by the end of the selected year. In roll-based qualifications reports, all percentages will be based on July roll figures in the selected year. Participation-based and roll-based reports displaying absolute numbers rather than percentages are always identical.
Breakdown by Decile, Ethnicity and / or gender
Data can be broken down (split) by School Decile, Candidate Ethnicity, Candidate Gender, or any combination of the three. For example, selecting Gender on the view customisation bar will result in data being shown separately for male and female students.
Submit
The Submit button will create a report based on all options currently selected.
Reset
The Reset button will reset all menu options to default settings.
View Bar (Breakdown by)
The view bar has slightly different options available depending on the report being run.
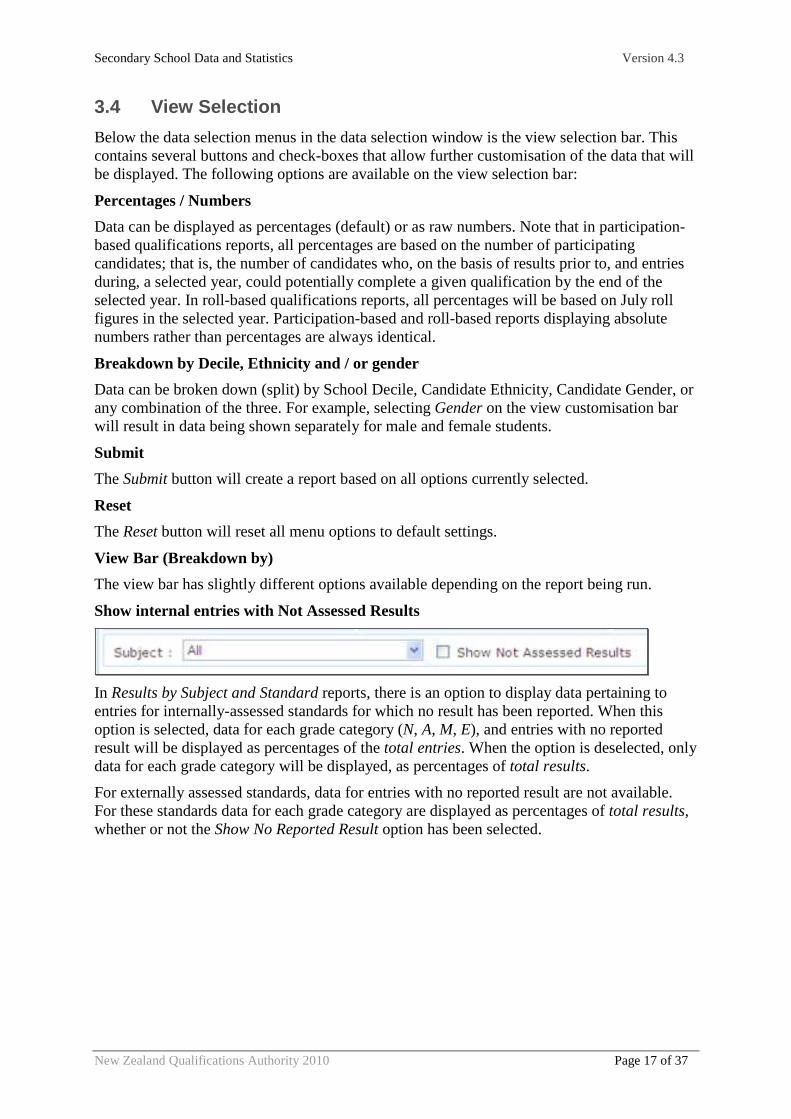
Show internal entries with Not Assessed Results
In Results by Subject and Standard reports, there is an option to display data pertaining to entries for internally-assessed standards for which no result has been reported. When this option is selected, data for each grade category (N, A, M, E), and entries with no reported result will be displayed as percentages of the total entries. When the option is deselected, only data for each grade category will be displayed, as percentages of total results.
For externally assessed standards, data for entries with no reported result are not available. For these standards data for each grade category are displayed as percentages of total results, whether or not the Show No Reported Result option has been selected.
Secondary School Data and Statistics Version 4.3
New Zealand Qualifications Authority 2010 Page 18 of 37
Exporting Data
After pressing the Submit button to generate a new report, export buttons are presented at the top of the screen. These buttons allow you to export the data as formatted Microsoft Excel files as displayed in Table 2. While the unformatted file is not strictly speaking an Excel file, it can be opened using Excel.
Table 2. Options for exporting data
Export Icon Use With
Microsoft Excel or compatible spreadsheet software
3.5 Sub-Report Links
After a report has been generated, you will notice that some elements of the data being displayed serve as a link to a sub-report. Sub-reports allow the more detailed information to be displayed at a lower level of report.
Links of this type are underlined and coloured blue. If you move your mouse over a sub-report link, your mouse cursor will change indicating that the link can be clicked and help text will appear, explaining what the sub-report will contain.
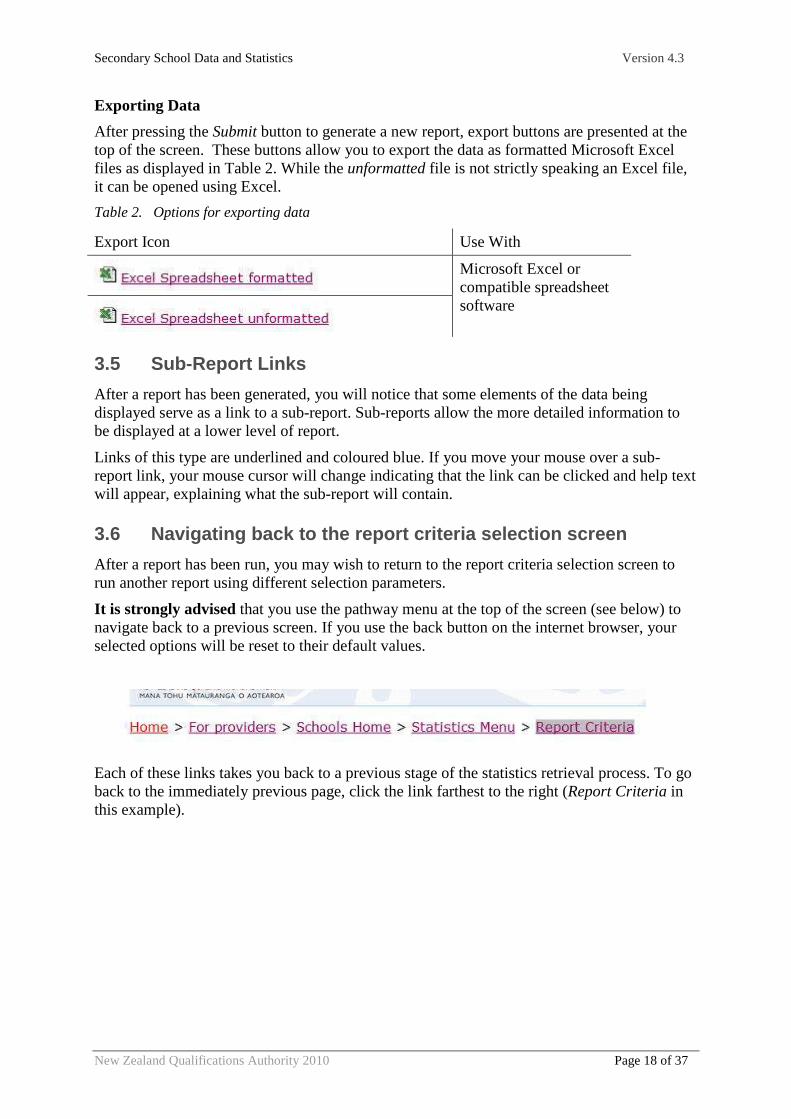
3.6 Navigating back to the report criteria selectio n screen
After a report has been run, you may wish to return to the report criteria selection screen to run another report using different selection parameters.
It is strongly advised that you use the pathway menu at the top of the screen (see below) to navigate back to a previous screen. If you use the back button on the internet browser, your selected options will be reset to their default values.
Each of these links takes you back to a previous stage of the statistics retrieval process. To go back to the immediately previous page, click the link farthest to the right (Report Criteria in this example).
Secondary School Data and Statistics Version 4.3
New Zealand Qualifications Authority 2010 Page 19 of 37
4. Worked Examples of Creating Reports
This section contains three examples illustrating how to select data to create reports. It is recommended that users follow each example as an exercise to gain familiarity with the data selection options and the report generation process.
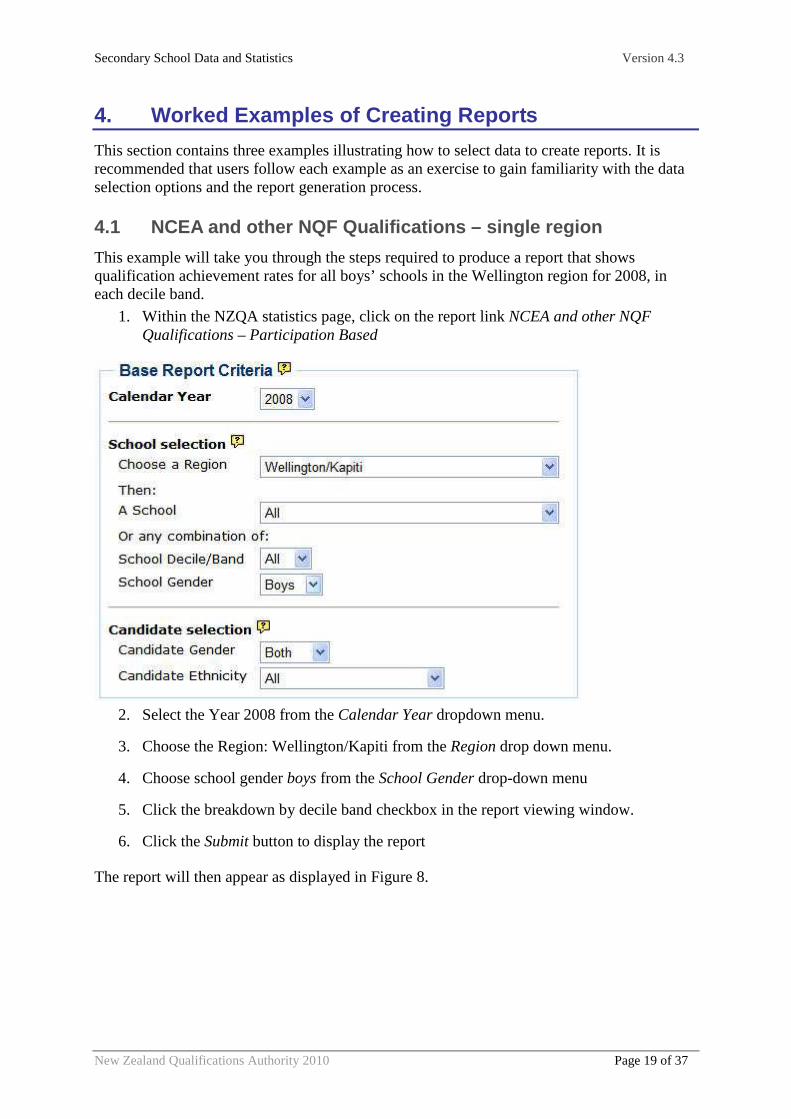
4.1 NCEA and other NQF Qualifications – single regi on
This example will take you through the steps required to produce a report that shows qualification achievement rates for all boys’ schools in the Wellington region for 2008, in each decile band.
1. Within the NZQA statistics page, click on the report link NCEA and other NQF Qualifications – Participation Based
2. Select the Year 2008 from the Calendar Year dropdown menu.
3. Choose the Region: Wellington/Kapiti from the Region drop down menu.
4. Choose school gender boys from the School Gender drop-down menu
5. Click the breakdown by decile band checkbox in the report viewing window.
6. Click the Submit button to display the report
The report will then appear as displayed in Figure 8.
Secondary School Data and Statistics Version 4.3
New Zealand Qualifications Authority 2010 Page 20 of 37
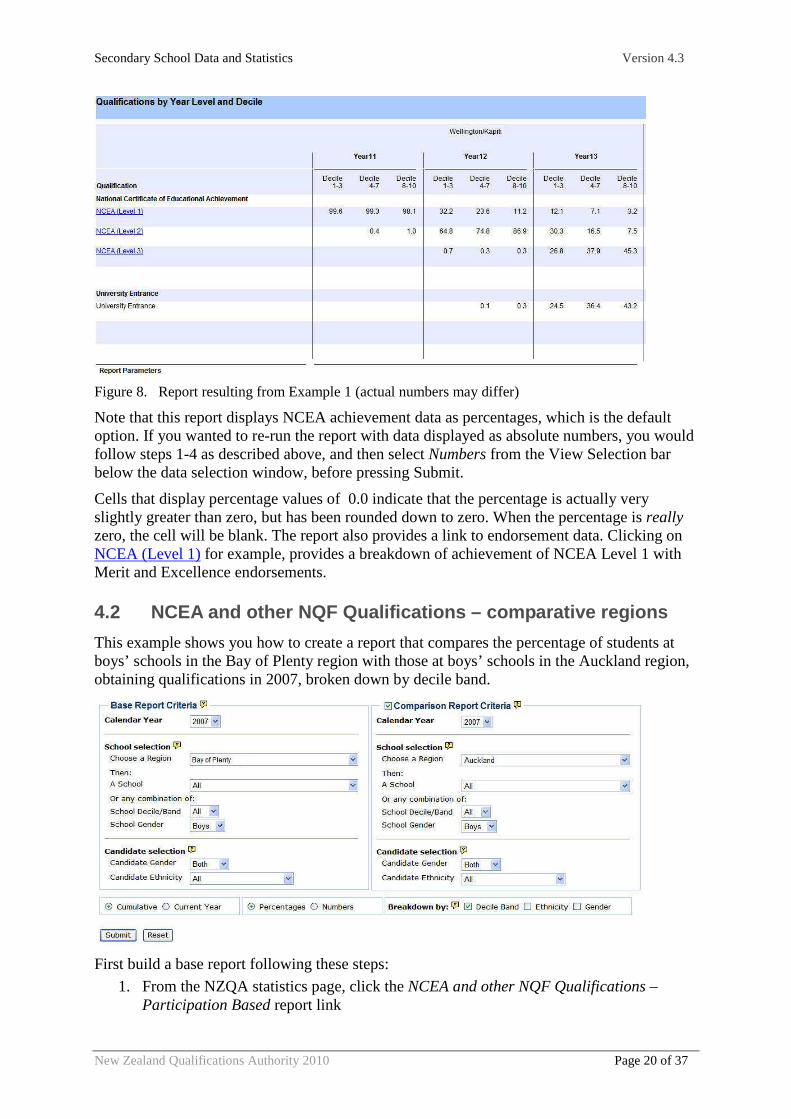
Figure 8. Report resulting from Example 1 (actual numbers may differ)
Note that this report displays NCEA achievement data as percentages, which is the default option. If you wanted to re-run the report with data displayed as absolute numbers, you would follow steps 1-4 as described above, and then select Numbers from the View Selection bar below the data selection window, before pressing Submit.
Cells that display percentage values of 0.0 indicate that the percentage is actually very slightly greater than zero, but has been rounded down to zero. When the percentage is really zero, the cell will be blank. The report also provides a link to endorsement data. Clicking on NCEA (Level 1) for example, provides a breakdown of achievement of NCEA Level 1 with Merit and Excellence endorsements.
4.2 NCEA and other NQF Qualifications – comparative regions
This example shows you how to create a report that compares the percentage of students at boys’ schools in the Bay of Plenty region with those at boys’ schools in the Auckland region, obtaining qualifications in 2007, broken down by decile band.
First build a base report following these steps:
1. From the NZQA statistics page, click the NCEA and other NQF Qualifications – Participation Based report link

Secondary School Data and Statistics Version 4.3
New Zealand Qualifications Authority 2010 Page 21 of 37
2. Select the Year 2007 from the Calendar Year field
3. Choose the Region: Bay of Plenty from the Region drop-down menu
4. Choose School Gender, Boys from the School Gender drop-down menu
Next, build a comparison report by:
5. Select the Comparison Report Criteria checkbox.
6. Select the Year 2007 from the Calendar Year field
7. Choose the Region: Auckland from the Region drop-down menu
8. Choose School Gender, Boys from the School Gender drop-down menu
Customise the view by:
9. Clicking the breakdown-by-decile-band checkbox in the report viewing window.
10. Click Submit to run the report. The report should look like this:

Secondary School Data and Statistics Version 4.3
New Zealand Qualifications Authority 2010 Page 22 of 37
Figure 9. Report resulting from Example 2 (actual numbers may vary)

Secondary School Data and Statistics Version 4.3
New Zealand Qualifications Authority 2010 Page 23 of 37
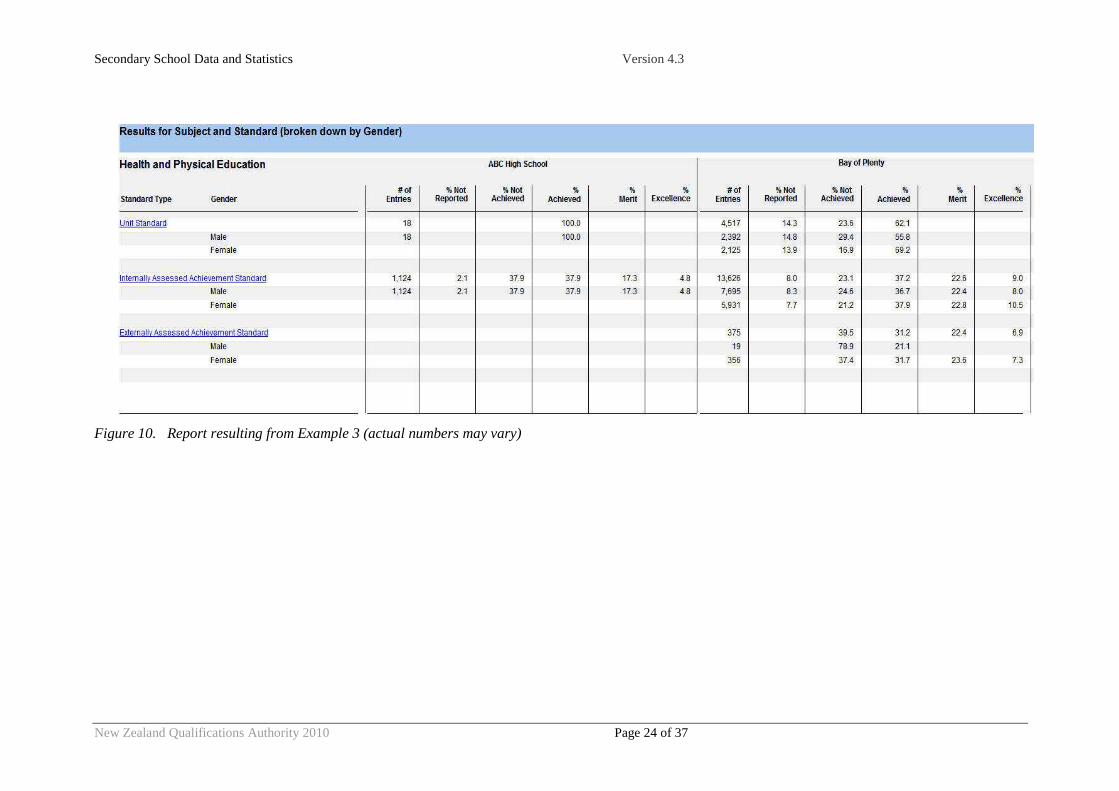
4.3 Results by Subject and Standard
This example shows you how to create a report comparing results, separately for boys and girls, for a standard at a specific school (ABC High School) with other schools in the same geographical region (assume it is Bay of Plenty).
1. From the NZQA statistics site, click the Results by Subject and Standard report
2. Base Report Criteria
a. Select Calendar Year 2007
b. Select School Region Bay of Plenty
c. Select a School (ABC High School) from the Dropdown list
3. Comparison Report Criteria
a. Select the comparison report criteria checkbox
b. Select Calendar Year 2007
c. Select School Region Bay of Plenty
4. Subject
a. Select a subject for comparison (e.g., Health and Physical Education)
5. Select the Percentages radio button in the display toolbar
6. Next further refine the information by selecting breakdown by Gender.
7. Click Submit
8. Export the data to Excel using the unformatted format.
Secondary School Data and Statistics Version 4.3
New Zealand Qualifications Authority 2010 Page 24 of 37
Figure 10. Report resulting from Example 3 (actual numbers may vary)
Secondary School Data and Statistics Version 4.3
New Zealand Qualifications Authority 2010 Page 25 of 37
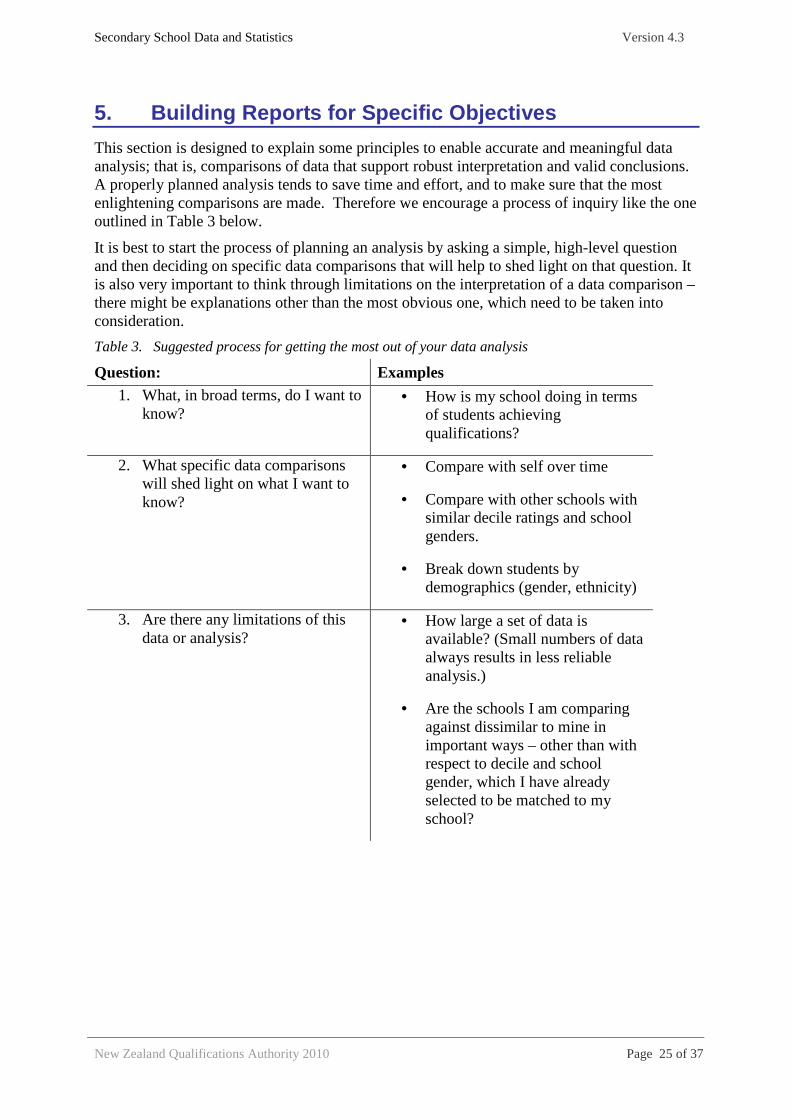
5. Building Reports for Specific Objectives
This section is designed to explain some principles to enable accurate and meaningful data analysis; that is, comparisons of data that support robust interpretation and valid conclusions. A properly planned analysis tends to save time and effort, and to make sure that the most enlightening comparisons are made. Therefore we encourage a process of inquiry like the one outlined in Table 3 below.
It is best to start the process of planning an analysis by asking a simple, high-level question and then deciding on specific data comparisons that will help to shed light on that question. It is also very important to think through limitations on the interpretation of a data comparison – there might be explanations other than the most obvious one, which need to be taken into consideration.
Table 3. Suggested process for getting the most out of your data analysis
Question: Examples 1. What, in broad terms, do I want to
know? • How is my school doing in terms
of students achieving qualifications?
2. What specific data comparisons will shed light on what I want to know?
• Compare with self over time
• Compare with other schools with similar decile ratings and school genders.
• Break down students by demographics (gender, ethnicity)
3. Are there any limitations of this data or analysis?
• How large a set of data is available? (Small numbers of data always results in less reliable analysis.)
• Are the schools I am comparing against dissimilar to mine in important ways – other than with respect to decile and school gender, which I have already selected to be matched to my school?
Secondary School Data and Statistics Version 4.3
New Zealand Qualifications Authority 2010 Page 26 of 37
Table 4 summarises some of the main kinds of specific analyses to consider using. The focus is on the uses and advantages of each kind of comparison, as well as factors that potentially complicate interpretation.
Please note that many analyses will include elements of more than one of the types described here. For example a subject analysis might also include a longitudinal component.
Table 4. Examples of questions and analyses that can be used with NCEA/NQF data and statistics
Type of question Type of analysis
How are patterns of results changing over time? Longitudinal analysis
What are the particular areas of strength and/or weaknesses in a teaching programme?
Subject analysis
How does a school compare with other similar schools in the performance of its students on the NQF?
School comparison analysis
How do students with particular demographics compare with other students in respect of their achievement?
Demographic Analysis
5.1 Longitudinal analyses
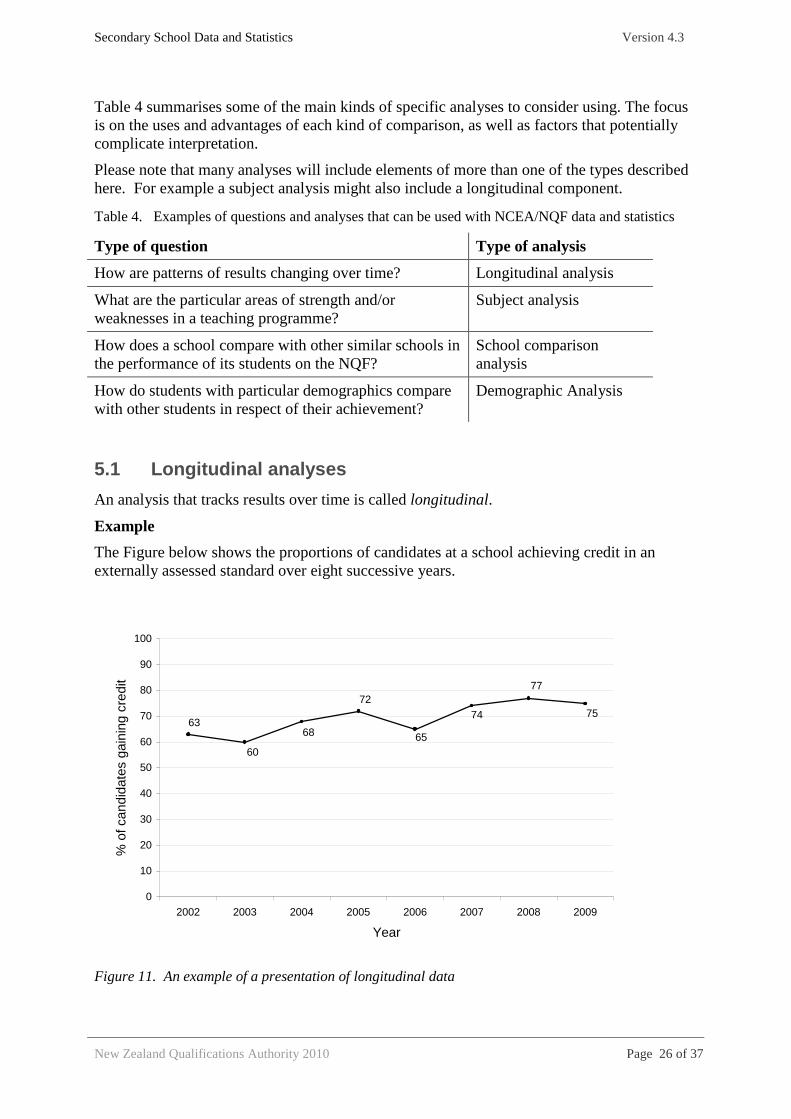
An analysis that tracks results over time is called longitudinal.
Example
The Figure below shows the proportions of candidates at a school achieving credit in an externally assessed standard over eight successive years.
63
60
68
72
65
74
77
75
0
10
20
30
40
50
60
70
80
90
100
2002 2003 2004 2005 2006 2007 2008 2009
Year
% o
f can
dida
tes
gain
ing
cred
it
Figure 11. An example of a presentation of longitudinal data
Secondary School Data and Statistics Version 4.3
New Zealand Qualifications Authority 2010 Page 27 of 37
Note that while the results shown in Figure 11 fluctuate from one year to the next, over the full time period, an upward trend of an increase in success over several years is clear. For this reason, changes in a profile of results from one year to the next, in either direction, should not necessarily be a cause for either concern or celebration. A particularly large change in a single year, however, may be a signal that something affecting assessment results in an important way has changed, e.g. a high turnover of teaching staff in a particular department, or the revision of one or more standards.
The appropriate basis for comparison in a longitudinal analysis is the performance of the same department or school in the past. This is one of the advantages of longitudinal analyses; that it is self-referenced and does not require a comparison with data from other departments or schools.
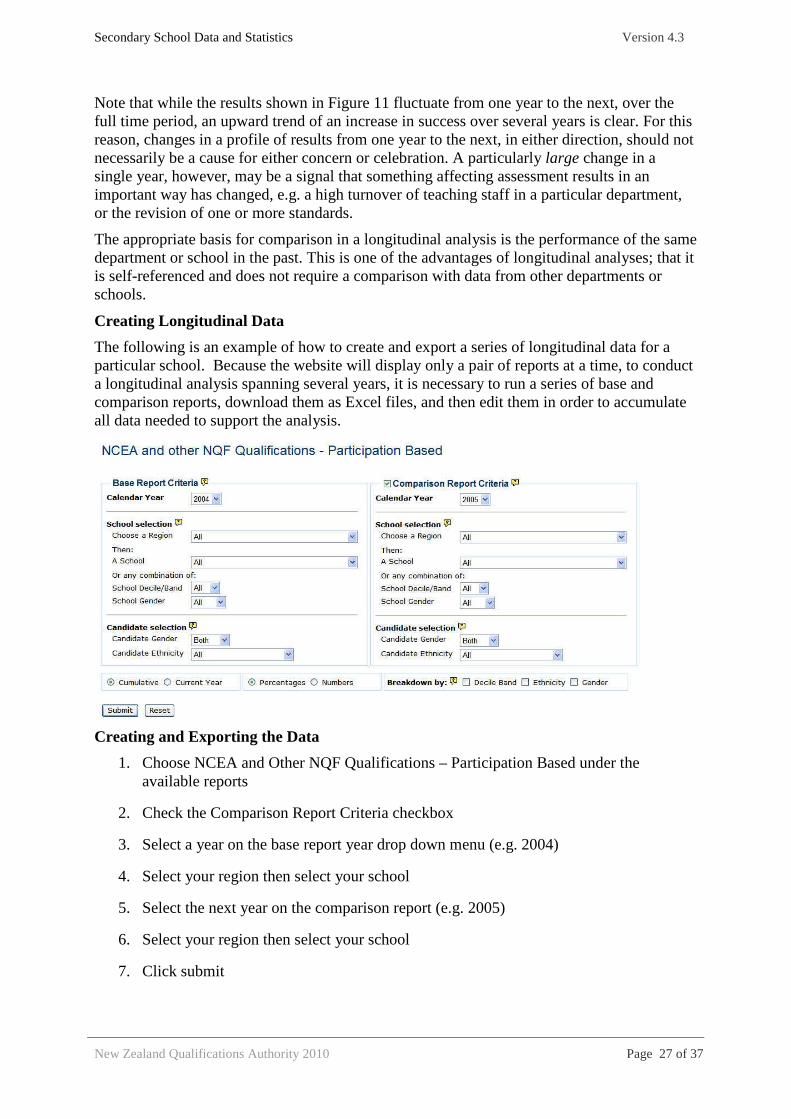
Creating Longitudinal Data
The following is an example of how to create and export a series of longitudinal data for a particular school. Because the website will display only a pair of reports at a time, to conduct a longitudinal analysis spanning several years, it is necessary to run a series of base and comparison reports, download them as Excel files, and then edit them in order to accumulate all data needed to support the analysis.
Creating and Exporting the Data
1. Choose NCEA and Other NQF Qualifications – Participation Based under the available reports
2. Check the Comparison Report Criteria checkbox
3. Select a year on the base report year drop down menu (e.g. 2004)
4. Select your region then select your school
5. Select the next year on the comparison report (e.g. 2005)
6. Select your region then select your school
7. Click submit
Secondary School Data and Statistics Version 4.3
New Zealand Qualifications Authority 2010 Page 28 of 37
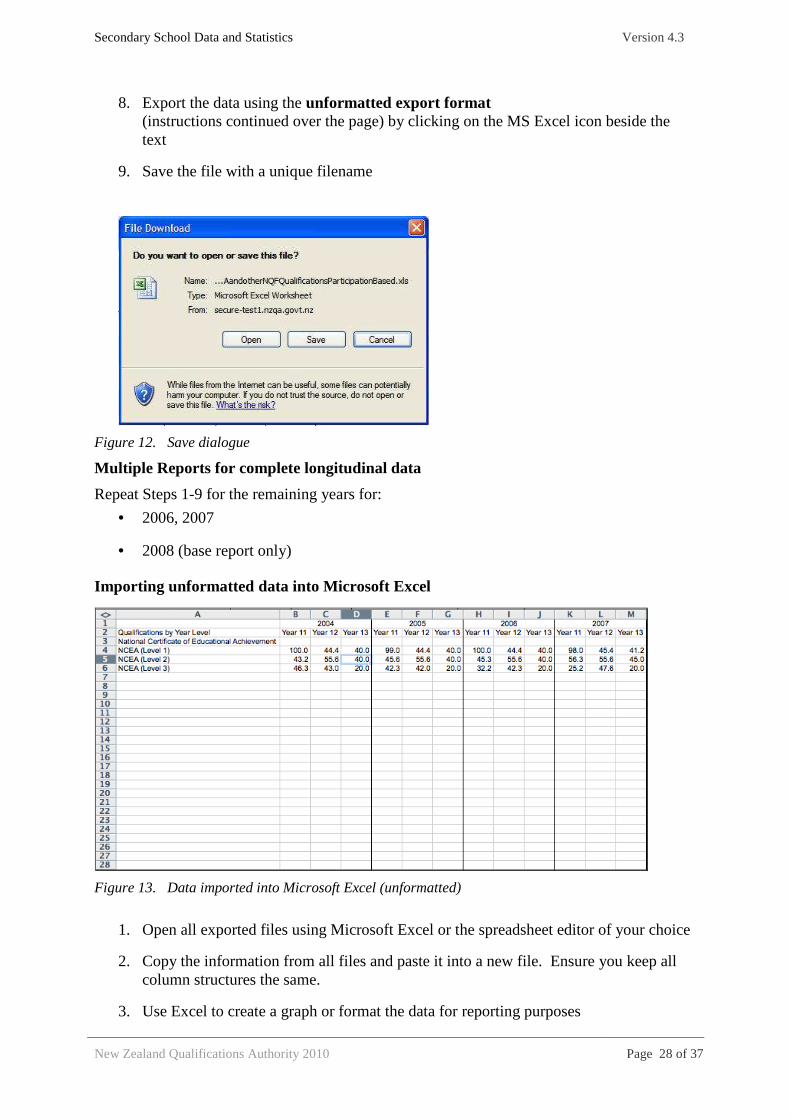
8. Export the data using the unformatted export format (instructions continued over the page) by clicking on the MS Excel icon beside the text
9. Save the file with a unique filename
Figure 12. Save dialogue
Multiple Reports for complete longitudinal data
Repeat Steps 1-9 for the remaining years for:
• 2006, 2007
• 2008 (base report only)
Importing unformatted data into Microsoft Excel
Figure 13. Data imported into Microsoft Excel (unformatted)
1. Open all exported files using Microsoft Excel or the spreadsheet editor of your choice
2. Copy the information from all files and paste it into a new file. Ensure you keep all column structures the same.
3. Use Excel to create a graph or format the data for reporting purposes
Secondary School Data and Statistics Version 4.3
New Zealand Qualifications Authority 2010 Page 29 of 37
5.2 Subject analyses
It can be useful, particularly for developing teaching programmes to analyse differences in results between standards within a particular subject area. Such analyses can shed light on specific strengths and weaknesses within a particular department.
Example
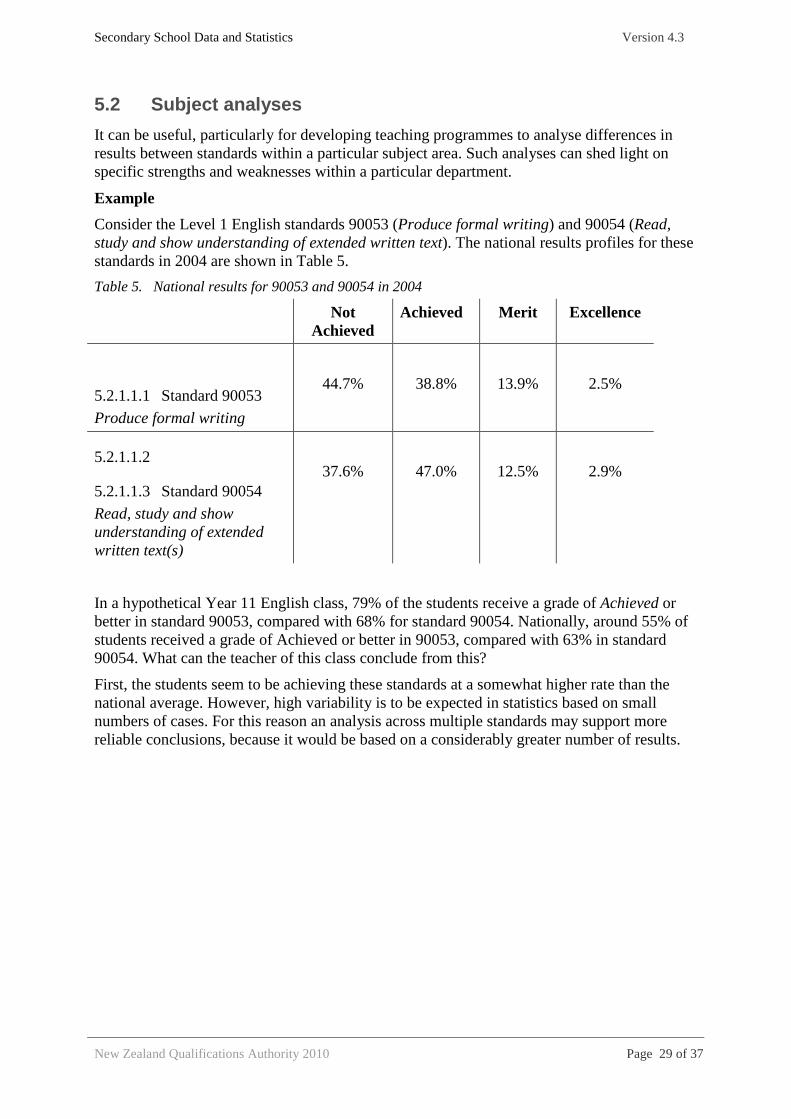
Consider the Level 1 English standards 90053 (Produce formal writing) and 90054 (Read, study and show understanding of extended written text). The national results profiles for these standards in 2004 are shown in Table 5.
Table 5. National results for 90053 and 90054 in 2004
Not Achieved
Achieved Merit Excellence
5.2.1.1.1 Standard 90053
Produce formal writing
44.7%
38.8%
13.9%
2.5%
5.2.1.1.2
5.2.1.1.3 Standard 90054
Read, study and show understanding of extended written text(s)
37.6%
47.0%
12.5%
2.9%
In a hypothetical Year 11 English class, 79% of the students receive a grade of Achieved or better in standard 90053, compared with 68% for standard 90054. Nationally, around 55% of students received a grade of Achieved or better in 90053, compared with 63% in standard 90054. What can the teacher of this class conclude from this?
First, the students seem to be achieving these standards at a somewhat higher rate than the national average. However, high variability is to be expected in statistics based on small numbers of cases. For this reason an analysis across multiple standards may support more reliable conclusions, because it would be based on a considerably greater number of results.

Secondary School Data and Statistics Version 4.3
New Zealand Qualifications Authority 2010 Page 30 of 37
Figure 14. Subject data analysis screenshot
Creating Data for a Subject Analysis
In this example we will perform a longitudinal analysis to compare a schools subject results with national results for the same subject.
Selecting the data 1. Choose the Results by Subject and Standard report
2. Create a base report
a. Select a Year
b. Select your region then select your school
c. Select a Subject from the subject field
3. Create a comparison report
a. Check the Comparison Reporting Criteria Checkbox
b. Select the same Year
c. Leave region and school unselected
4. Click submit
Importing the data into excel
Secondary School Data and Statistics Version 4.3
New Zealand Qualifications Authority 2010 Page 31 of 37
5. Export the data as an unformatted Excel file by clicking on the Microsoft Excel icon beside the text.
6. Save the file with a unique filename that will be useful for identifying the file later on
7. Repeat steps 2-5 for the years to be included in the analysis.
8. Copy the information from all files and paste it into a new file.
9. Use MS Excel to create a graph or format the data for reporting purposes
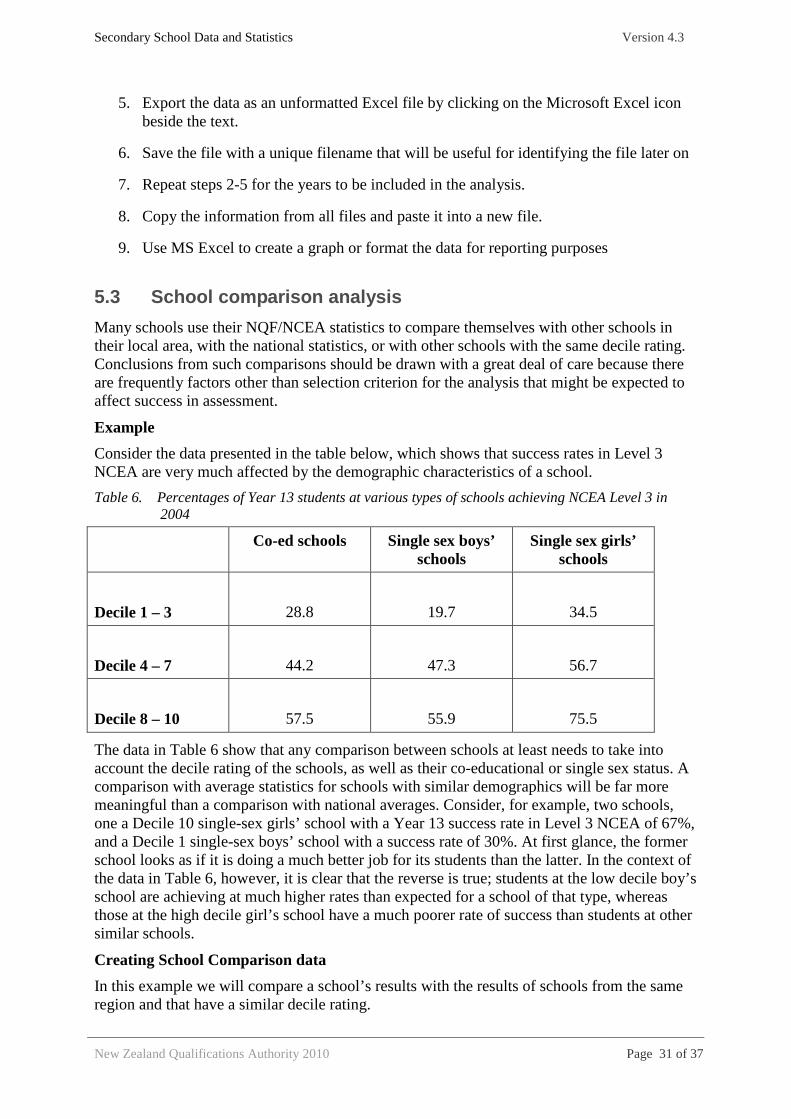
5.3 School comparison analysis
Many schools use their NQF/NCEA statistics to compare themselves with other schools in their local area, with the national statistics, or with other schools with the same decile rating. Conclusions from such comparisons should be drawn with a great deal of care because there are frequently factors other than selection criterion for the analysis that might be expected to affect success in assessment.
Example
Consider the data presented in the table below, which shows that success rates in Level 3 NCEA are very much affected by the demographic characteristics of a school.
Table 6. Percentages of Year 13 students at various types of schools achieving NCEA Level 3 in 2004
Co-ed schools Single sex boys’ schools
Single sex girls’ schools
Decile 1 – 3
28.8
19.7
34.5
Decile 4 – 7
44.2
47.3
56.7
Decile 8 – 10
57.5
55.9
75.5
The data in Table 6 show that any comparison between schools at least needs to take into account the decile rating of the schools, as well as their co-educational or single sex status. A comparison with average statistics for schools with similar demographics will be far more meaningful than a comparison with national averages. Consider, for example, two schools, one a Decile 10 single-sex girls’ school with a Year 13 success rate in Level 3 NCEA of 67%, and a Decile 1 single-sex boys’ school with a success rate of 30%. At first glance, the former school looks as if it is doing a much better job for its students than the latter. In the context of the data in Table 6, however, it is clear that the reverse is true; students at the low decile boy’s school are achieving at much higher rates than expected for a school of that type, whereas those at the high decile girl’s school have a much poorer rate of success than students at other similar schools.
Creating School Comparison data
In this example we will compare a school’s results with the results of schools from the same region and that have a similar decile rating.
Secondary School Data and Statistics Version 4.3
New Zealand Qualifications Authority 2010 Page 32 of 37
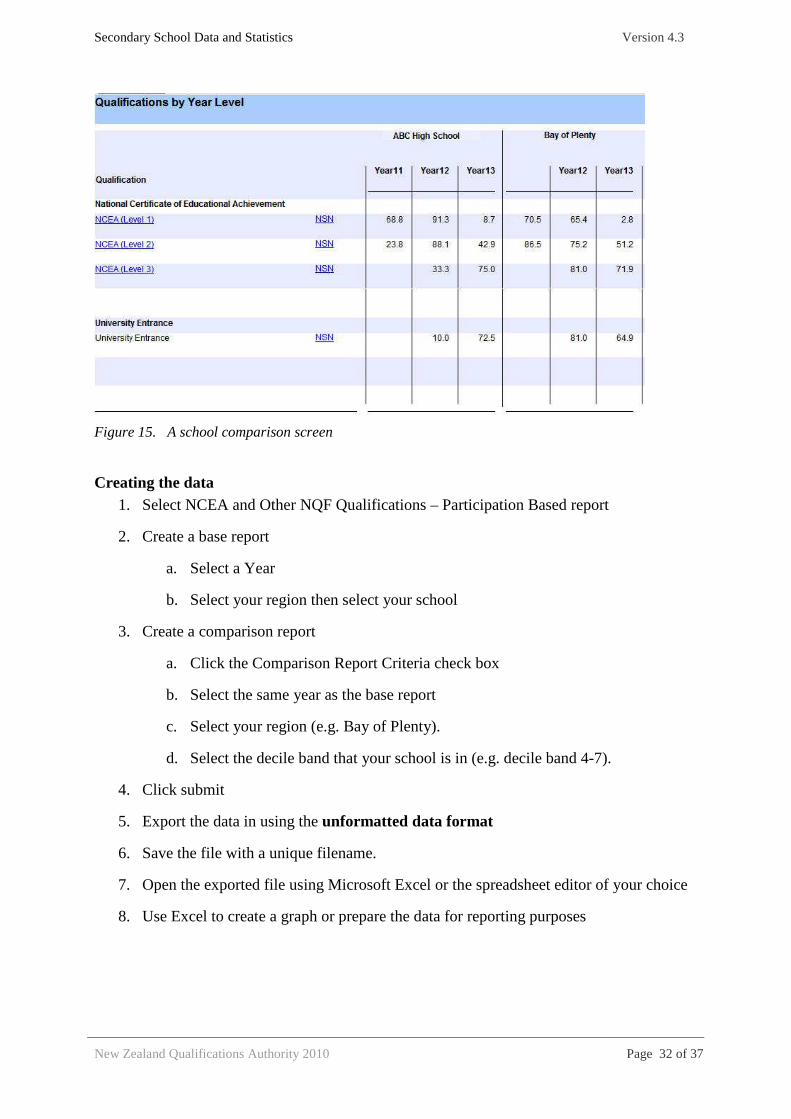
Figure 15. A school comparison screen
Creating the data 1. Select NCEA and Other NQF Qualifications – Participation Based report
2. Create a base report
a. Select a Year
b. Select your region then select your school
3. Create a comparison report
a. Click the Comparison Report Criteria check box
b. Select the same year as the base report
c. Select your region (e.g. Bay of Plenty).
d. Select the decile band that your school is in (e.g. decile band 4-7).
4. Click submit
5. Export the data in using the unformatted data format
6. Save the file with a unique filename.
7. Open the exported file using Microsoft Excel or the spreadsheet editor of your choice
8. Use Excel to create a graph or prepare the data for reporting purposes
Secondary School Data and Statistics Version 4.3
New Zealand Qualifications Authority 2010 Page 33 of 37
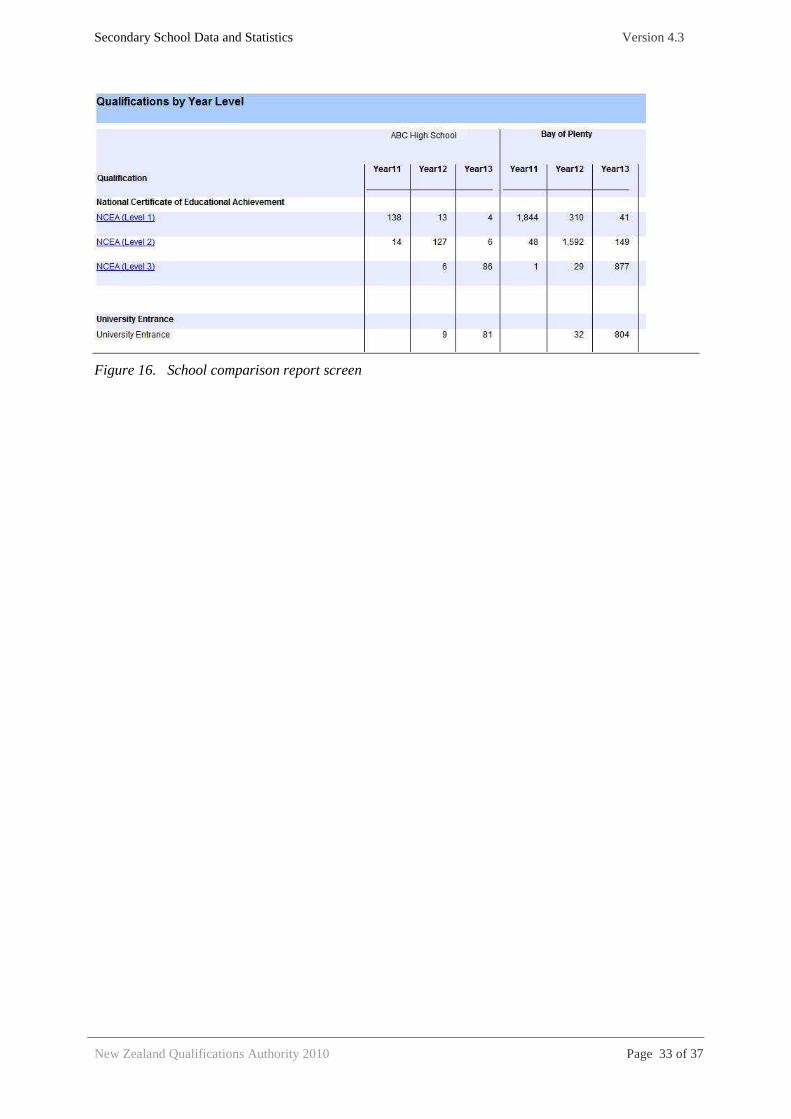
Figure 16. School comparison report screen

Secondary School Data and Statistics Version 4.3
New Zealand Qualifications Authority 2010 Page 34 of 37
6. Reporting on data analyses
This section provides some general guidelines for structuring a report and ways of discussing analyses. Keeping a report brief and to the point is important. The exact form that a report will take depends on its purpose and the types of analyses performed.
6.1 Introducing the report
A report should include a brief introduction that states the high-level question or questions to be addressed, the reason for asking these questions, and a brief description of how the questions are to be addressed analytically. This helps the audience to make sense of the data that are presented.
If the report is being prepared for an authority (such as a school board), a summary of the findings might also be useful. A summary would typically be placed at either the very beginning or very end of a report.
6.2 Visual presentation of data
The main body of a report should contain tables and histograms or other graphs, displaying the data relevant to the analysis. Each graph or table should be as simple as possible. Too many numbers in one illustration can be off-putting, especially for people who are not familiar with reading data analyses.
It is a good idea to write a brief description and interpretation after each table or graph to highlight points of interest and, in particular, how the data reflect upon the questions that the data have been selected to address. Such interpretations should be focused on the data at hand, while the end of a report is usually more appropriate for a wide-ranging discussion, including a presentation of the limitations of an analysis.
Any formal statistical analyses should also be reported in the text in relation to the relevant data.
6.3 Discussion of data & critical thinking
A good report contains a clear interpretation and explanation of the analyses. It is obviously important to describe and discuss the conclusions that can be drawn from the data, and that shed light on the questions. Conclusions should relate first and foremost to the question or questions that prompted the analysis, but any other interesting observations are also worth reporting.
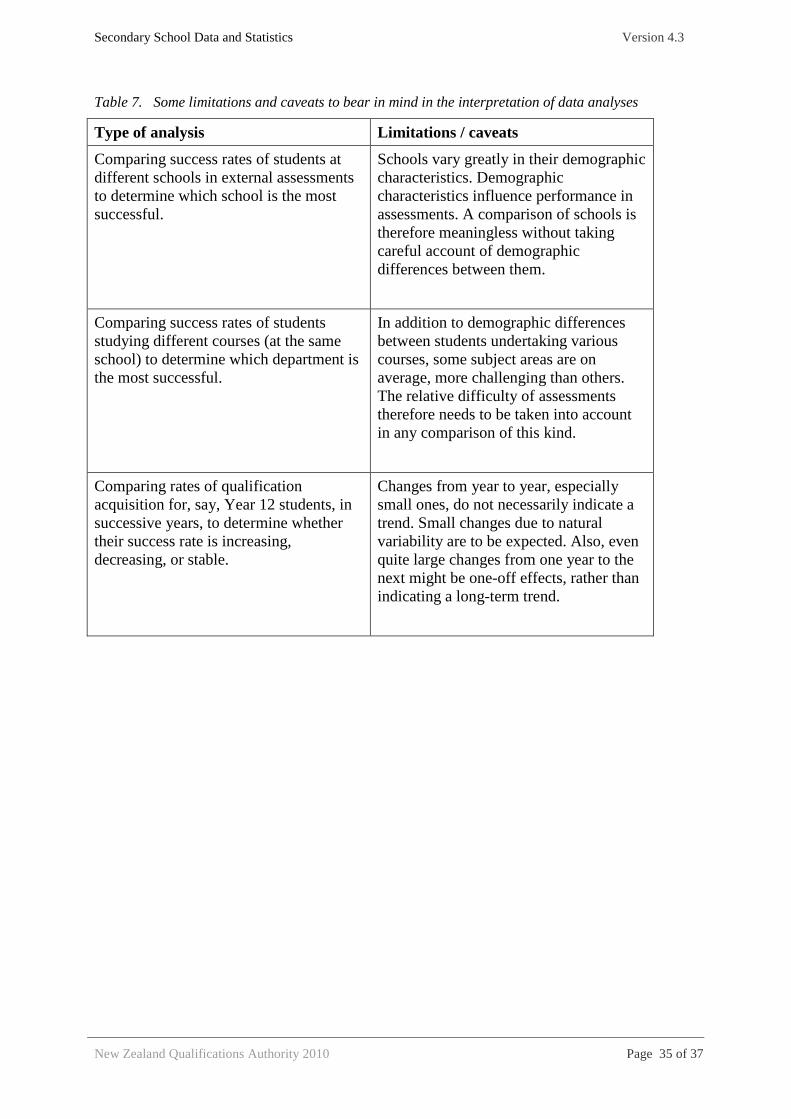
Finally, it is important to include any caveats or limitations on interpretation that apply. Examples of potential limitations to consider, and the circumstances in which each might apply is given in Table 7. This is not an exhaustive list, but is intended to provide some examples of critical thinking about analyses and comparisons of data.
Secondary School Data and Statistics Version 4.3
New Zealand Qualifications Authority 2010 Page 35 of 37
Table 7. Some limitations and caveats to bear in mind in the interpretation of data analyses
Type of analysis Limitations / caveats
Comparing success rates of students at different schools in external assessments to determine which school is the most successful.
Schools vary greatly in their demographic characteristics. Demographic characteristics influence performance in assessments. A comparison of schools is therefore meaningless without taking careful account of demographic differences between them.
Comparing success rates of students studying different courses (at the same school) to determine which department is the most successful.
In addition to demographic differences between students undertaking various courses, some subject areas are on average, more challenging than others. The relative difficulty of assessments therefore needs to be taken into account in any comparison of this kind.
Comparing rates of qualification acquisition for, say, Year 12 students, in successive years, to determine whether their success rate is increasing, decreasing, or stable.
Changes from year to year, especially small ones, do not necessarily indicate a trend. Small changes due to natural variability are to be expected. Also, even quite large changes from one year to the next might be one-off effects, rather than indicating a long-term trend.
Secondary School Data and Statistics Version 4.3
New Zealand Qualifications Authority 2010 Page 36 of 37
7. Appendix 1
7.1 Individual Student Information for Schools
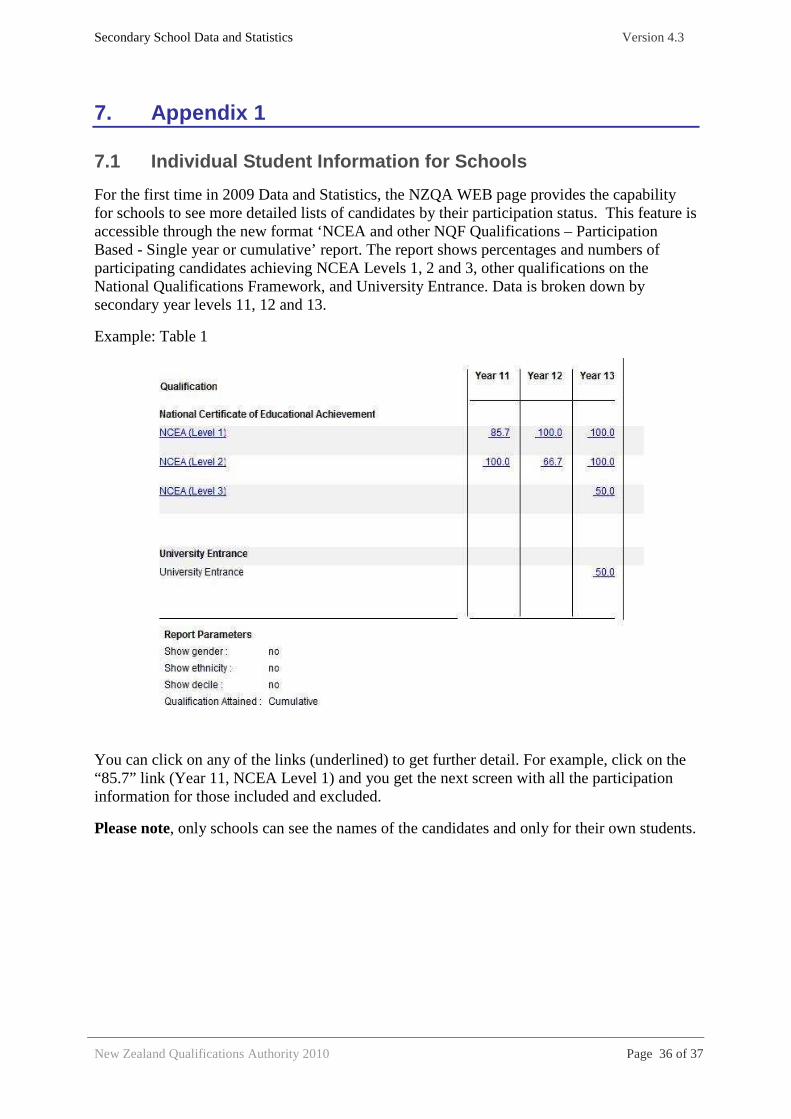
For the first time in 2009 Data and Statistics, the NZQA WEB page provides the capability for schools to see more detailed lists of candidates by their participation status. This feature is accessible through the new format ‘NCEA and other NQF Qualifications – Participation Based - Single year or cumulative’ report. The report shows percentages and numbers of participating candidates achieving NCEA Levels 1, 2 and 3, other qualifications on the National Qualifications Framework, and University Entrance. Data is broken down by secondary year levels 11, 12 and 13.
Example: Table 1
You can click on any of the links (underlined) to get further detail. For example, click on the “85.7” link (Year 11, NCEA Level 1) and you get the next screen with all the participation information for those included and excluded.
Please note, only schools can see the names of the candidates and only for their own students.
Secondary School Data and Statistics Version 4.3
New Zealand Qualifications Authority 2010 Page 37 of 37
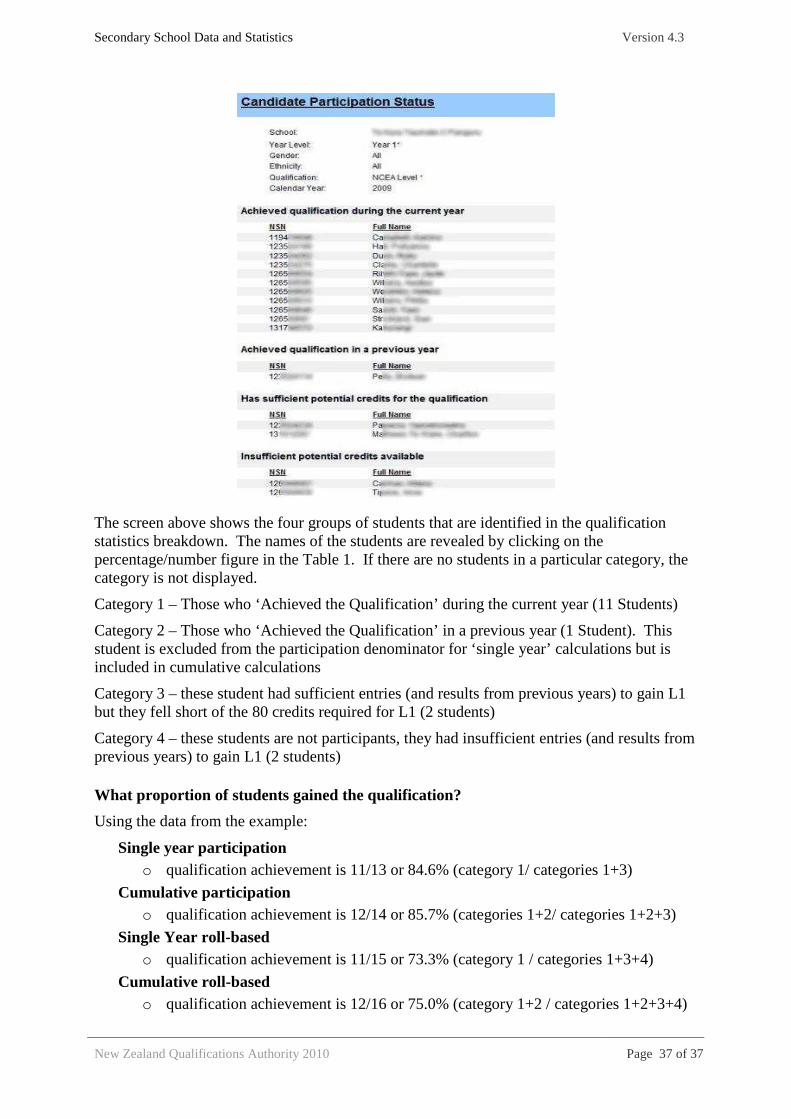
The screen above shows the four groups of students that are identified in the qualification statistics breakdown. The names of the students are revealed by clicking on the percentage/number figure in the Table 1. If there are no students in a particular category, the category is not displayed.
Category 1 – Those who ‘Achieved the Qualification’ during the current year (11 Students)
Category 2 – Those who ‘Achieved the Qualification’ in a previous year (1 Student). This student is excluded from the participation denominator for ‘single year’ calculations but is included in cumulative calculations
Category 3 – these student had sufficient entries (and results from previous years) to gain L1 but they fell short of the 80 credits required for L1 (2 students)
Category 4 – these students are not participants, they had insufficient entries (and results from previous years) to gain L1 (2 students)
What proportion of students gained the qualification?
Using the data from the example:
Single year participation o qualification achievement is 11/13 or 84.6% (category 1/ categories 1+3)
Cumulative participation o qualification achievement is 12/14 or 85.7% (categories 1+2/ categories 1+2+3)
Single Year roll-based o qualification achievement is 11/15 or 73.3% (category 1 / categories 1+3+4)
Cumulative roll-based o qualification achievement is 12/16 or 75.0% (category 1+2 / categories 1+2+3+4)