Embed Size (px)
Citation preview

Secondary Data Research
Urban Poverty related Programmes
Current support for Urban Poverty Alleviation
Existing Urban Development Plans
Status of RAY Reforms
of
Uttar Pradesh (Raebareli)
Support to National Policies on Urban Poverty Reduction
(a DFID and MoHUPA Partnership)
Submitted by:
2012
School of Planning & Architecture, New Delhi
4, Block -B, Indraprastha Estate, New Delhi – 110002
Tele-fax: 011-23725516
email: [email protected]

SNPUPR- Northern Region (A DFID and MoHUPA Partnership)
School of Planning and Architecture, New Delhi
Prepared by:
School of Planning and Architecture,
New Delhi
Prof. ( Dr.) Neelima Risbud
Dean of studies & Professor Housing, SPA
Ms. Dipti Parashar
Senior Urban Planner, NRC
Ms. Rupali Sandhu
Project Associate, NRC
School of Planning & Architecture
4, Block -B, Indraprastha Estate
New Delhi – 110002
Tele-fax: 011-23725516
Web: www.spa.ac.in
SNPUPR- Northern Region (A DFID and MoHUPA Partnership)
School of Planning and Architecture, New Delhi
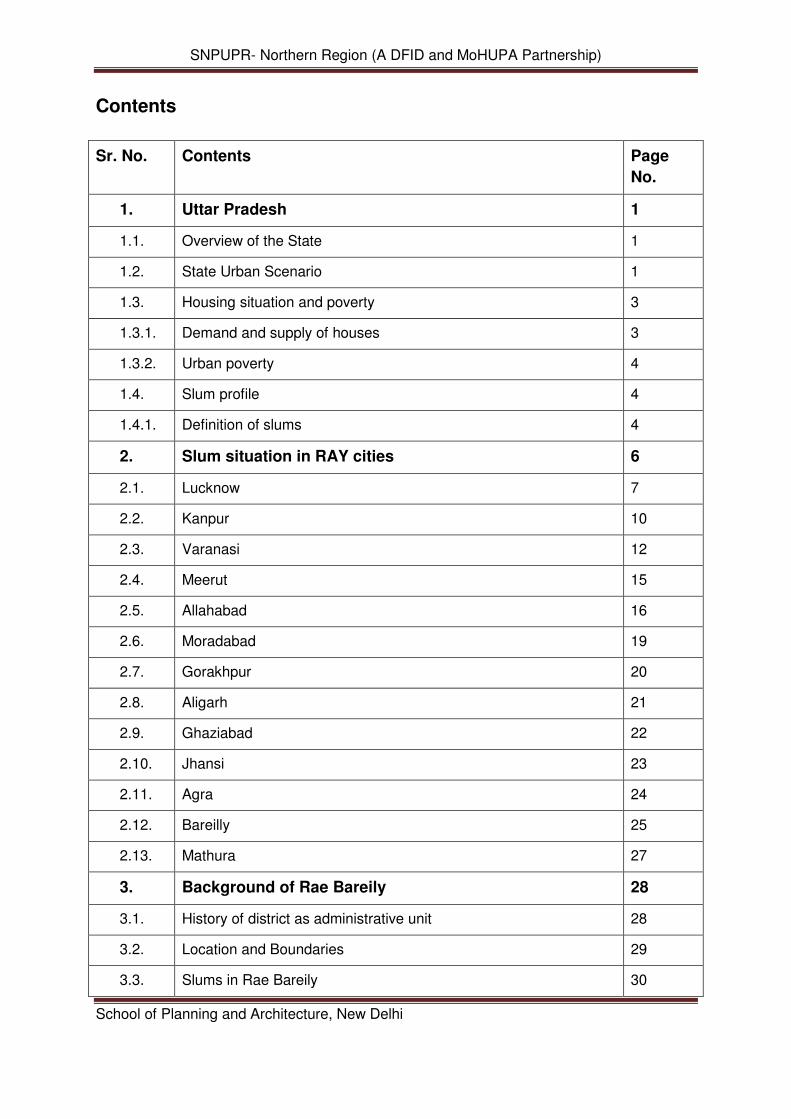
Contents
Sr. No. Contents Page
No.
1. Uttar Pradesh 1
1.1. Overview of the State 1
1.2. State Urban Scenario 1
1.3. Housing situation and poverty 3
1.3.1. Demand and supply of houses 3
1.3.2. Urban poverty 4
1.4. Slum profile 4
1.4.1. Definition of slums 4
2. Slum situation in RAY cities 6
2.1. Lucknow 7
2.2. Kanpur 10
2.3. Varanasi 12
2.4. Meerut 15
2.5. Allahabad 16
2.6. Moradabad 19
2.7. Gorakhpur 20
2.8. Aligarh 21
2.9. Ghaziabad 22
2.10. Jhansi 23
2.11. Agra 24
2.12. Bareilly 25
2.13. Mathura 27
3. Background of Rae Bareily 28
3.1. History of district as administrative unit 28
3.2. Location and Boundaries 29
3.3. Slums in Rae Bareily 30

SNPUPR- Northern Region (A DFID and MoHUPA Partnership)
School of Planning and Architecture, New Delhi
4. Legal and Institutional framework for Town Planning,
Housing and Slum Improvement
34
4.1. Institutional Framework 34
4.1.1. Town and Country Planning Deptt. 35
4.1.2. Housing 36
4.1.3. Slum Improvement 36
4.1.4. Administrative set up 36
4.1.5. Land Acquisition and development 37
4.2. Policies, Programmes and Schemes 37
4.2.1. State policy for Urban Housing 1995 37
4.2.2. Urban housing policy- 2009 40
4.2.3. Houses for all – Under House for all schemes 42
4.2.4. Manyawar Kanshi Ram Sahari Garib Awasiya Yojana of U.P. 42
5. Issues 45

SNPUPR – Northern Region (A DFID and MoHUPA Partnership)
School of Planning and Architecture, New Delhi 1
1. Uttar Pradesh
1.1. Overview of the State
Uttar Pradesh is a state located on the
northern part of India. With a population
of over 190 million people, it is India's
most populous state, as well as the
world's most populous sub-national
entity. Were it a nation in its own right,
Uttar Pradesh would be the world's fifth
most populous country.
Uttar Pradesh covers a large part of the
highly fertile and densely populated
upper Gangetic plain. It shares an international border with Nepal to the north along with the
Indian state of Uttarakhand, Himachal Pradesh to the north-west, Haryana, Delhi and
Rajasthan on the west, Madhya Pradesh on the south, Chhattisgarh and Jharkhand on the
south east and Bihar on the east.
1.2. State Urban Scenario
The total population of Uttar Pradesh is 16.60crore as per census of India 2001. Out of
which 13.15 crore (79.22%) is rural and 3.45 crore (20.78%) is urban population. This
indicates to 16% of the total population of India and 12% of urban population of which lives
in Uttar Pradesh. The decadal increase of the state’s population was 32.88% during the year
1991-2001 which is 31.13% of the National Average. Further, it is to note that State’s Urban
Population is expected to increase to 21.77% i.e. 4.49 crore during the year 2011 and 5.83
crore i.e. 23.19% during the year 2021.
Map of Uttar Pradesh
Source: Uttar Pradesh (District Map)
www.mapsofindia.com

SNPUPR – Northern Region (A DFID and MoHUPA Partnership)
School of Planning and Architecture, New Delhi 2
0
1
2
3
4
1971 1981 1991 2001
Growth of Urban Pop in U.P. – 1971- 2001 (in Million)
Source: Census of India, 2001, Uttar Pradesh
Western Uttar Pradesh is more
urbanized than the rest of the state.
There are 628 local bodies in the
State which is the highest in the
country, but it ranks 18th in the field
of national urbanization. About 62%
i.e. two-third of the State population
lives in 54 class I towns and about
28% of the total urban population of
the State is situated in 6
metropolitan cities i.e. Kanpur,
Lucknow, Varanasi, Agra,
Allahabad and Meerut.
The population increase of especially in small and medium towns i.e. Class V and VI has
been comparatively very low comprising 32% of population increase in metropolitan cities.
The main reason is migration pattern of small and medium towns to larger cities during the
year 1991-2001. This has been misbalanced in the urbanization pattern at regional level.
The population of class I towns is increasing at a higher rate. During the year 1951, the
urban population was 33.71% which increased to 62% in the year 2001. There was acute
development in 14 Class I towns in 1991 to 54 in 2001. The main reason is better
infrastructure facilities, better job opportunities educational and health facilities. Therefore, it
Level of Urbanization in Different Districts of Uttar
Pradesh (2001)

SNPUPR – Northern Region (A DFID and MoHUPA Partnership)
School of Planning and Architecture, New Delhi 3
is necessary to provide better inclusive development in small and medium town for the
balance growth of the region.
Kanpur is the largest city in the state with a population of 25.5 lakhs in 2001 and is expected
to become a 4 million + city by 2030. Lucknow the state capital is 22.45 lakhs.
1.3. Housing situation and poverty
1.3.1. Demand and Supply of Houses
Urban population of the State is increasing rapidly. The provision of developed Plots/houses
is very limited which result the growth of unauthorized colonies i.e. slum development.
During 10th Five year (2002-07), the shortage of Housing units was projected to 7-0 lakh
units, whereas during 10th Five Year Plan, the demand of 9.0 lakhs housing units was
projected. As such, during 10th Five Year Plan, the demand of 16.0 lakh housing units was
envisaged i.e. 3.2 lakh housing unit per year.
During limited scope for construction of housing units, only one lakh units were constructed
by Development Authority and U.P. Housing and Development Board in 2009-10. As such,
the State Government formulated a Policy to construct two third 16.0 lakh housing units
through Public, Private and co-operative sector i.e. 9.10lakh, 5.40 lakh and 1.0 lakh
respectably. In respect of this target the contribution of these three sectors was only 4.50
lakhs, where as 1.25 times of the above targets was contributed by unorganized sector (i.e.
5.60 lakhs housing units).
During 11th Five Year Plan i.e. (2007-12), a shortage of 4.67 lakhs housing units was
projected. Beside this shortage, an additional shortage of 11.17 lakhs housing was predicted
by other agencies. Thus a total demand of 15.84 lakh housing units is predicted. Out of
which (10.45lakhs units) are proposed to be constructed by Public, Private and Co-
operative sectors that is 35%, 55% and 10% respectively. Out of above three sectors, during
11th Five Year Plan, the total housing units will contribute 30% of E.W.S, 34% L.I.G, 24%
M.I.G and 12% for H.I.G Groups. As such this target of 64% of the housing units will be
constructed for weaver and lower income groups.
It is important to note that during the end of 10th Five Year Plan, 99% of the housing units
were constructed for economically weaker section and low income groups against the target
of 2.47 crore. The housing demand for the state of U.P. is 60% for the higher income
groups. Therefore it is necessary to propose three units for the above target groups on the
basis of socio-economic survey to be conducted for state as a whole.

SNPUPR – Northern Region (A DFID and MoHUPA Partnership)
School of Planning and Architecture, New Delhi 4
1.3.2. Urban Poverty
The portable drinking water, cleanliness and services are the basic need of the society.
Keeping in view the above facts, to fulfill the targets under millennium development goals,
every country of the world had agreed for portable drinking water along with pollution free
environment for urban population living in unprotected areas.
There is proposal to reduce such population to a larger extent. But, the lack of basic
facilities in urban areas is still a major problem of the state as a whole. Still 33% of the
facilities of urban areas are living in such conditions where there is no portable water and
facilities. More than 50% of the families are living in such conditions where there is no
sewerage system at all.
1.4. Slum Profile
Uttar Pradesh houses the largest number of urban poor in a single state
1.4.1. Definition of Slums
The slum definition as per the U.P. Slum Areas (Improvement & Clearance Act, 1962) is very
broad. The number of unauthorized colonies and villages in the municipal area are also
included in slums. Once the area is declared as a slum, it continues to be in the list even
after being developed. The boundaries of Slums are also not well demarcated. In every
District town, there is office of DUDA under the District Magistrate, Where slum are identified
and schemes are prepared on the basis of norms and standard given for development. The
development components are drainage, roads/lands/potable water supply, street
electrification, park and open space development, community toilets etc.
About 31% of the total urban population of the state is living in slums. There are poor basic
amenities and facilities of slums, polluted environmental condition and not suitable for
human habitat. As such, there is a need to provide special attention for improving the
environmental condition and health facilities. There is a need to provide better hygienic
conditions in slum areas and to construct new housing stocks in the existing towns as well
as in new developing towns, where higher level of basic facilities are to be provided. Thus
improved environmental condition will upgrade the earning capacity of low and economically
weaker section of society.

SNPUPR – Northern Region (A DFID and MoHUPA Partnership)
School of Planning and Architecture, New Delhi 5
There is great difference in increasing urban population and economic facilities, for urban
poor in the state. The increasing pattern of population in larger towns is more and basic
facilities are better as compared to the small towns. The main reason is availability of better
job opportunities in larger towns along with economic opportunities. Other than this, the
basic facilities like educational, medical and health are also included, which are definitely
better than smaller towns which result in better economic growth in their towns.
The State Govt. has decided to provide better facilities in the towns. Various agencies are
working to maintain their facilities services and infrastructure. The Central Govt. schemes
like JNNURM, Urban Infrastructure Development scheme for small and medium towns
(U.I.D.S.S.M.T) and Integrated Housing and Slum Development Programme (I.H.S.D.P),
there successful implementation will provide good opportunity in the Urban sector of the
state for providing better infrastructure amenities and facilities which will make a better living
conditions to Urban poor.

SNPUPR – Northern Region (A DFID and MoHUPA Partnership)
School of Planning and Architecture, New Delhi 6
2. Slum Situation in RAY cities
There are 18 Pilot cities identified under SNPUPR project.
1. Kanpur
2. Lucknow
3. Agra Municipal Corporation
4. Varanasi
5. Meerut
6. Allahabad
7. Ghaziabad
8. Bareily
9. Aligarh
Percentage slum population in RAY cities
Cities Urban Population (2001) % slum population
(2001)
Agra 1259979 9.67
Meerut 1,074,229 43.87
Ghaziabad 9,68,521 47.93
Saharanpur 452925 31.80
Aligarh 667732 52.42
Moradabad 641240 51.21
Lucknow 2207340 8.2
Kanpur 2532138 14.5
Varanasi 1100748 42.81
Gorakhpur 624570 33.46
Jhansi 383248 42.55
Allahabad 990298 32.32
Source: “State of Urban heath in Uttar Pradesh”, The Urban Health Resource Centre (UHRC)
10. Moradabad
11. Gorakhpur
12. Jhansi MB
13. Saharanpur
14. Firozabad
15. Muzaffarnagar
16. Mathura
17. ShahJáhanour
18. Noida

SNPUPR – Northern Region (A DFID and MoHUPA Partnership)
School of Planning and Architecture, New Delhi 7
2.1. Lucknow
Lucknow city has 37.39% of its population living in the slums (excluding the Urban Villages).
Slum Population w.r.t. LMC population
Oxfam Trust, India in 2005 indicates that there are 787 slum settlements in the city. The
slum settlements in the city have increased from 530 to 787 from 1989 to 2005 i.e. in span of
16 years. The Census 2001 originally did not report any slums and then later revised its
findings. DUDA follows the definition as stated in the UP Slum Act 1962.SUDA/UNCHS do
not follow this definition but define poverty in terms of vulnerability as does Oxfam.
Source: Oxfam Survey 2005
Year LMC population Slum Population % share of slum population
w.r.t. Total pop. of LMC
1981 9.47 1.73 2.85 - 30.10
1991 16.19 6.72 6.97 4.12 43.05
2001 21.85 5.66 10.18 3.21 46.59
Estimated -
2011
31.66 9.81 14.88 4.7 47.00

SNPUPR – Northern Region (A DFID and MoHUPA Partnership)
School of Planning and Architecture, New Delhi 8
Categories of slums
• Authorized settlements are those where there is security of tenure with the cluster
being either an outcome of a government resettlement programme or being located
on private/own land1.
• Unauthorized settlements are those that have emerged on available vacant plots,
mainly railway land or on encroached areas, on the riverbanks or on drains are
classified as unauthorized.
Sub categorization of slums on the basis
of land tenure
• 250 clusters are on halo land (lands which
were given to the dwellers by the erstwhile
nawabs against nominal rents
• 115 clusters are on the railway land
• 195 clusters are on the lands with multiple
ownerships where residents are paying
‘someone’ a monthly rent
• 274 as urban villages
• DUDA identifies 5 categories of land
tenure status for slums. Of the total 530
slums, 79% are located on ‘Niji Lands’ or ‘Own Lands’. These are the lands that had
originally been handed out by the Nawabs and are today part of the Trusts of the
royal families.
1 Nitya Shukla, “Strategy for Slum improvement in Lucknow” (2008), Unpublished Thesis

SNPUPR – Northern Region (A DFID and MoHUPA Partnership)
School of Planning and Architecture, New Delhi 9
Spatial Location of Slums in Lucknow
Name of the
wards
No. of slum
settlements
Zone I 161
Zone II 89
Zone III 56
Zone IV 45
Zone V 78
Zone VI 85
Total 514
Issues:
• There are several sources of information regarding the number of slums in the City
and the population living in the slums – each of the sources differ in their conclusions
but all agree that Lucknow does have a significant slum population that is distributed
in almost even clusters across the wards.
• The slum clusters are located on land that is under various categories of owners –
74% of the slums are located on ‘own land’ where there is security of tenure, about
115 clusters are located on railway lands and the remaining slums are located on
land that belongs to ‘someone’ and requires that dwellers pay a monthly rent.
• All slums are characterized by poor access to basic services and consultations with
slum dwellers has revealed that there is willingness to pay for services either as
capital cost contribution or in terms of labour for housing, water supply, drainage and
solid waste management

SNPUPR – Northern Region (A DFID and MoHUPA Partnership)
School of Planning and Architecture, New Delhi 10
2.2. Kanpur
Kanpur was an industrial town having a dozen textile mills, shoe manufacturing units,
tanneries, a scooter unit, spice packaging units and various other small and medium scale
industries. Many of the industries have closed down in recent past. This along with many
other sick units has led to large unemployment and increase in urban poverty.
In addition to this, more than twenty percent of the population in Kanpur stays in areas
marred with unhygienic living conditions and lack of civic amenities. The urban infrastructure
is not satisfactory enough to bring homogenous development in new areas. The growth of
housing stock is not able to keep pace with the population growth. This has increased the
housing stock deficit which has given rise to slum dwellings.
Slums in Kanpur
As per the survey conducted by DUDA and documents from KNN, total slums in Kanpur are
390. According to census 2001, the slum population was 3.68 lakh i.e. 14.5 percent of total
Population. As per the survey conducted by D.U.D.A in 1997-98, the population was
4,19,859 and total households were 98,208. As per K.N.N estimate, slum population is about
5.0 lakh in 2006 which is twenty percent of total population. A large number of below poverty
line (BPL) population (about 60%) also live-in slums.
Slum population in Kanpur
Housing condition in Slums
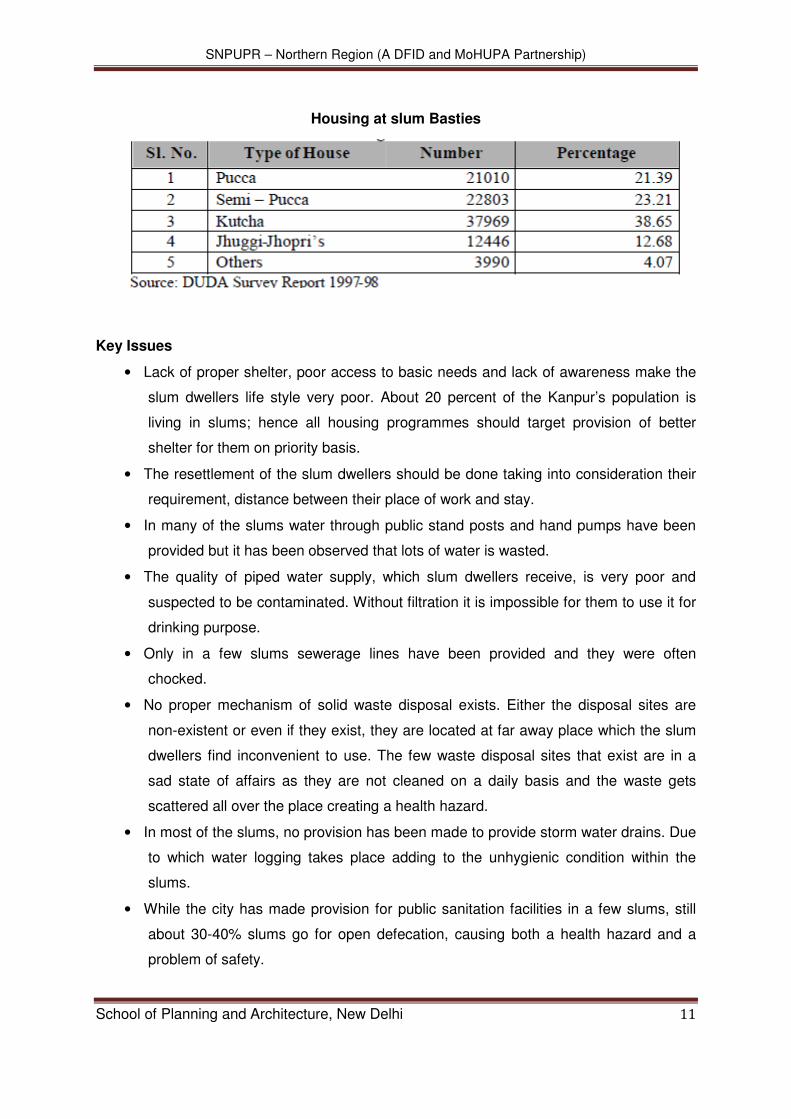
Majority of households i.e. more than 51 percent live in Kutcha Houses made of grass, mud
etc. and jhuggi jhopri’s. Only 21 percent stay in Pucca Houses. In slums, about 47 percent
have their own houses whereas 41% lives in as tenant whereas rest are living as
unauthorised occupants as informed by DUDA, Kanpur.
SNPUPR – Northern Region (A DFID and MoHUPA Partnership)
School of Planning and Architecture, New Delhi 11
Housing at slum Basties
Key Issues
• Lack of proper shelter, poor access to basic needs and lack of awareness make the
slum dwellers life style very poor. About 20 percent of the Kanpur’s population is
living in slums; hence all housing programmes should target provision of better
shelter for them on priority basis.
• The resettlement of the slum dwellers should be done taking into consideration their
requirement, distance between their place of work and stay.
• In many of the slums water through public stand posts and hand pumps have been
provided but it has been observed that lots of water is wasted.
• The quality of piped water supply, which slum dwellers receive, is very poor and
suspected to be contaminated. Without filtration it is impossible for them to use it for
drinking purpose.
• Only in a few slums sewerage lines have been provided and they were often
chocked.
• No proper mechanism of solid waste disposal exists. Either the disposal sites are
non-existent or even if they exist, they are located at far away place which the slum
dwellers find inconvenient to use. The few waste disposal sites that exist are in a
sad state of affairs as they are not cleaned on a daily basis and the waste gets
scattered all over the place creating a health hazard.
• In most of the slums, no provision has been made to provide storm water drains. Due
to which water logging takes place adding to the unhygienic condition within the
slums.
• While the city has made provision for public sanitation facilities in a few slums, still
about 30-40% slums go for open defecation, causing both a health hazard and a
problem of safety.

SNPUPR – Northern Region (A DFID and MoHUPA Partnership)
School of Planning and Architecture, New Delhi 12
• At present the number of notified slum is 390 and strategies for rehabilitation and
implementation of central and state government schemes can only be carried out in
the notified slums. There is a need to carry out a fresh survey to cover all slums and
poor communities so that the actual demand for housing and basic services for
urban poor can be ascertained and overall city environment can be improved.
2.3. Varanasi
Varanasi has 227 slums spread all over the city, either on government or private lands. Total
population in slums is about 453,222, which is about 37.69% of the total population. These
227 slums have formulated 21 Community Development Centres (CDC), which are
responsible for the overall development of the slums along with Slum Urban Development
Authority (SUDA). Population in the slums varies from 200 to almost 9,000 people with
varied densities. Rapid growth of slums in Varanasi has put a lot of pressure on the existing
land resources and infrastructure and has led to deterioration of its physical environment.
Majority of slums have very poor water supply and sanitation facilities; most are either un-
sewered or partially sewered, with disposal of household wastewater and solid wastes taking
place directly into open nallas. This phenomenon has adversely affected drainage system in
these areas and led to water logging in different areas. The poor environmental conditions
within the slum areas have adversely affected the health of the residents. Financial
constraints on the part of civic authorities and un-authorized nature of the slums have also
contributed to non-delivery or partial delivery of basic amenities.
The slum population in the city accounts for about 37.69% of the city population and some of
the factors, which are responsible for this, are:
• Maximum percentage of people living in the slums is employed with the MCV as
Safai Karamcharis. Labour employed with the Handloom industry account for the
second highest concentration followed by rickshaw pullers, which account for nearly
10 to 15% of the slum population.
• The existing tourism base of the city creates opportunities for employment
generation, especially for unskilled labour
• Lack of development opportunities in the hinterland

SNPUPR – Northern Region (A DFID and MoHUPA Partnership)
School of Planning and Architecture, New Delhi 13
Location of slums
Slum locations are spread all over the city but major concentrations can be found in the old
city area near the ghats, areas near small scale industries (as a high percentage of slum
dwellers are weavers working in Handloom industry) as well as in the Rajghat area The main
factor attributing to this concentration is proximity to work place. In case of the old city area,
the employment generation due to religious and tourist traffic and in case of Rajghat area,
the availability of open land has led to indiscriminate squatting.
But the slum
concentration in
these areas has not
only led to poor
living conditions for
the slum dwellers
but is also
responsible for the
general deterioration
of the living
environment of the
city.
This is primarily due
to lack of proper
infrastructural
services in these
areas and
considering the fact
that most of these
slums have 1000+
populations
SNPUPR – Northern Region (A DFID and MoHUPA Partnership)
School of Planning and Architecture, New Delhi 14
Housing scenario in slums
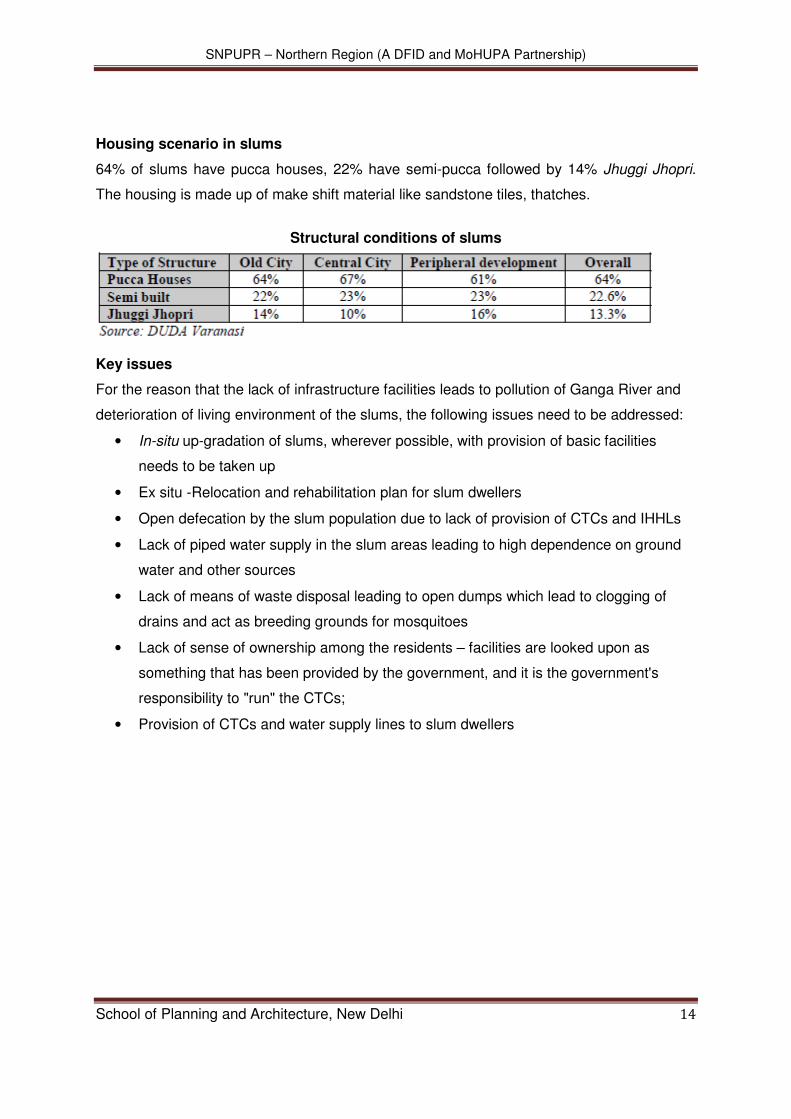
64% of slums have pucca houses, 22% have semi-pucca followed by 14% Jhuggi Jhopri.
The housing is made up of make shift material like sandstone tiles, thatches.
Structural conditions of slums
Key issues
For the reason that the lack of infrastructure facilities leads to pollution of Ganga River and
deterioration of living environment of the slums, the following issues need to be addressed:
• In-situ up-gradation of slums, wherever possible, with provision of basic facilities
needs to be taken up
• Ex situ -Relocation and rehabilitation plan for slum dwellers
• Open defecation by the slum population due to lack of provision of CTCs and IHHLs
• Lack of piped water supply in the slum areas leading to high dependence on ground
water and other sources
• Lack of means of waste disposal leading to open dumps which lead to clogging of
drains and act as breeding grounds for mosquitoes
• Lack of sense of ownership among the residents – facilities are looked upon as
something that has been provided by the government, and it is the government's
responsibility to "run" the CTCs;
• Provision of CTCs and water supply lines to slum dwellers

SNPUPR – Northern Region (A DFID and MoHUPA Partnership)
School of Planning and Architecture, New Delhi 15
2.4. Meerut
Slums in the city cover an area of approximately 240 ha and have an average population
density of around 575 people per hectare. Significant number of these slum dwellers belongs
to backward castes. Scheduled Castes account for nearly 27% of the total slum population in
the city.
Existing slum population in Meerut City
There are 102 slums, which are identified by DUDA in the year 2000. This list is still in the
process of revision. There are several poverty clusters in the city which are not registered in
the official list owing to which they are not getting the benefits of various Governments
policies and facilities. Slums in Meerut have grown from 10 Slum pockets in 1950 to 108
Slum pockets in 2003. Owing to the flaws in current planning process and various ongoing
government policies, practiced so far. Suffering from bias against slums these pockets have
mainly been the recipients of residues and left-over of the main city, which has created
object conditions of poor hygiene and wretchedness in one to all 108 slums as notified by
DUDA. Such treatment of slums also failed to achieve a holistic urban growth.
Condition of slums

SNPUPR – Northern Region (A DFID and MoHUPA Partnership)
School of Planning and Architecture, New Delhi 16
Basic Services and Housing
The existing scenario in Meerut has got two distinct dimensions. Besides fulfilling the
demand of basic amenities and infrastructure, for the mainstream population, the city needs
to address the widespread disparity in access to basic urban services and treatment of city’s
slum dwellers and urban poor that constitute over 40% population of the city.
By and large the condition of huge slum population in the city expressed in terms of access
to basic services present a very grim situation. Only 49.42% of slum dwellers have a piped
water supply, only 48.27% have individual/ private toilets, while mere 24% of these have
sewer lines. 43 % of these slums have drainage network. Overall state of physical and social
infrastructure in the slum areas highlights the acute disparity in service distribution and
provision amongst different areas of the city. The health services to these slums are
provided by 8 health posts and 4 rural PHCs (which also cover few urban areas). There are
2 charitable hospitals which are also functional in the city and serving the urban poor. Many
NGOs are also working in these slums in order to provide the basic education and primary
health services. Poor housing stock in different slums further adds to the degradation of
these areas. As per DUDA records a total of 11203 houses need improvement (until year
2003). Of these 8669 are partially built, while 2534 are Jhuggis/ Kutcha houses that need to
be dismantled and new housing provision need to be made on the lines of VAMBAY/ IHSDP
schemes.
2.5. Allahabad
A large number of slums (Annex 3) are located along the riverbed, in the core of the old city,
in the cantonment area and other environmentally sensitive areas (Figure 31). There are 185
slums with a total population of 3,30,000 covering almost 27.4% of the total population.
Whereas a rapid survey of authorized and unauthorized settlements/slums and urban
villages17 carried out by Oxfam (India) Trust in 2005 suggests that there are 283 poor
settlements or slums in Allahabad with a population of 3,63,550 persons. This constitutes
30% of the total population of the city. However, as per the CoI 2001, only about 15% of
city’s population lives in slums. Table 54 depicts the decadal increase in the slum population.
Slum population

SNPUPR – Northern Region (A DFID and MoHUPA Partnership)
School of Planning and Architecture, New Delhi 17
Of the total 283 slums, there are 59 slum settlements having a total of 20-50 households
while 159 settlements inhabit over 200 households. There are about 131 authorized slums,
112 unauthorized ones and 40 urban villages.
The three-fold growth of slums in the last decade can be attributed to a combination of
factors as under:
• Poor economic conditions – can neither pay rent for proper housing nor can afford to
buy a house;
• Desire to live close to one's own community;
• Involvement of religious or political groups who have vested interests;
• Inability on the part of the local administration to prevent encroachment of government-
owned land;
• Large-scale emergence of nuclear families; and,
• Migration from rural areas in search of livelihood as urban areas provide commercial
and industrial set-up offering greater employment opportunities.
The rapid growth and development of slums in Allahabad city has led to deterioration of its
physical environment. Majority of slums have18 very poor water supply and sanitation
facilities; most are either without sewer or with partially sewer, with disposal of household
waste water and solid wastes taking place directly into open nallas, which adversely affects
drainage in these areas, leading to water logging. The poor environmental conditions within
the slum areas have adversely affected the health of the residents. Financial constraints on
the part of civic authorities and unauthorized nature of the slums have also contributed to
non-delivery or partial delivery of basic amenities.
Some startling comparisons made in the Oxfam Report between the authorised and
unauthorised slum settlements are –
• Poor people living in unauthorized slums do not have access to minimum basic
services while there are better basic services in authorized slums;
• Only 3% houses are pucca, 20% semi-pucca and 77% kutcha) in unauthorized slums
whereas 70% houses in authorized slums are pucca. There are about 40% pucca
houses in urban villages;
• 60% houses have individual connections in authorized slums whereas it is only 10% in
unauthorized slums;
SNPUPR – Northern Region (A DFID and MoHUPA Partnership)
School of Planning and Architecture, New Delhi 18
• 85% inhabitants in authorized slums have individual hygienic toilets where as 85-90%
people in unauthorized slums take to open defecation; and
• 60% people in authorized slums have individual electricity connection while this figure
is only 10% in unauthorized slums.
Housing situation in slums
The average household size in slums in Allahabad is about 6 versus 4.5 for the city as a
whole. Only 3% houses are pucca (20% semi pucca and 77% kutcha) in unauthorized slums
whereas this is 70% in authorized slums. There are about 40% pucca houses in urban
villages. A 500 crore Valmiki Ambedkar Awas Yojna was started in the year 2002 but it still
stands incomplete. DUDA’s annual progress reports indicate that only 70 houses have been
built in the financial year 2003-04 which is a very small number as compared to the need of
city. Also, the rehabilitation colonies already constructed under the scheme are located far
away from the commercial and residential areas where the poor are employed and lack
basic services, thus escalating the opportunity cost and rendering them an economically
unviable proposition as far as liveability is concerned.
An average plot size of 15 m2 has been allotted to all families that are rehabilitated without
taking into account the needs of the people.
Key issues
The three-fold growth of slums in the last decade can be attributed to a combination of
factors summarised as –
• Poor economic conditions – can neither pay rent for proper housing nor can afford to
buy a house;
• They are caused due to desire of living close to one's own community;
• Involvement of religious or political groups who have vested interests in developing
slums;
• Inability of local administration to prevent encroachment of government owned land;
• Large-scale emergence of nuclear families;
• Water and sanitation situation in slums is very grim;
• Open defecation is common and use of public toilets is limited;
• Across the slums, the drains are open and invariably choked with garbage;
• Open disposal of garbage from rive side slums blocks the drains and results in flooding
during the monsoon season;

SNPUPR – Northern Region (A DFID and MoHUPA Partnership)
School of Planning and Architecture, New Delhi 19
• The Indira Awas Yojana is yet to see the light of day to improve the conditions of slum
dwellers, and a comprehensive slum development strategy needs be worked out; and
• Migration from rural areas in search of a livelihood as, urban areas provides the
commercial and industrial set-up that offers greater employment opportunities.
2.6. Moradabad
There are about 100 notified slum settlements in Moradabad city. The approximate slum
population is 1, 80,000 in 2010. The list of slums is given in Annexure 2.1.The percentage of
slum population to total population is 21% in 2010.
Slum population to total population
The total number of slum households is
approximately 30,000 and the
percentage of slum households to total
households is 23% in 2010.
Slum households to total households
Generally, slums located in outskirts of the city and those in interior offer two different
typologies. The core and old city areas are predominantly Muslim population; representing
diversity in terms of demography. And the slums on the outskirts are predominant with
Valmiki, SC or ST population. Based on these typologies we have identified the following
stakeholder groups and their behavioural patterns:

SNPUPR – Northern Region (A DFID and MoHUPA Partnership)
School of Planning and Architecture, New Delhi 20
Slums Outskirts:
• Open defecation is prevalent.
• Most of the households are not having the toilet/latrine facilities and all the habitants
of these areas open defecate in the fields.
• There is no provision of community toilets in these areas.
• There is no provision of door to door collection but residents throw garbage on the
open road/street or in vacant land,/drains/nallas.
• No pipe water supply network and the source of water supply is hand pumps.
• There is no drainage system and water logging take place at low lying areas.
Slums Inner City:
• This area is having community toilets with several operation and maintenance
challenges.
• Children are not allowed to enter the community toilets
• Open defecation by children in drains and open spaces is common.
• Water Scarcity and poor state of community toilets forces elders also to defecate in
open but, it is not very common. Some community toilets do not have water, electricity
connection with broken toilet seats force people to defecate in close vicinity.
• People are in some ways constrained in going out to defecate in the inner city areas.
Open areas such as Public Park land or vacant plots have become open defecation
spots.
• Most of community toilets discharge their waste into open nallas/drains.
2.7. Gorakhpur
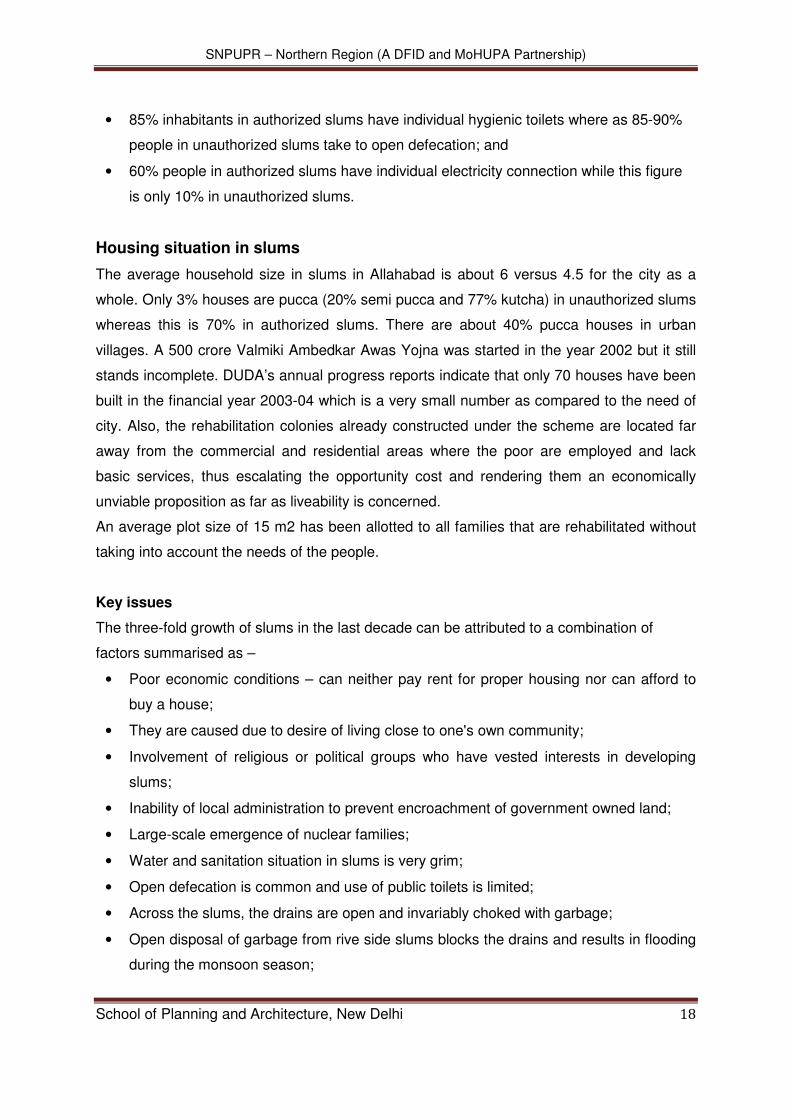
In Gorakhpur Urban Agglomeration the share of slum population compared to the total
population is quite high. As per EHP report, 34% of the total population is living in slums and
slum-like conditions in Gorakhpur. Therefore, more than one-third of the urban population
lives in slums under inhumane conditions and with increased susceptibility to disease and ill
health. Trends in the growth of urban poverty suggest that the number of poor will increase
considerably unless a well-planned, long-term intervention strategy is in place. A significant
proportion of slums are not listed in official records and therefore remains outside the
purview of public services. Different agencies have given different estimations on the
population living in slums of Gorakhpur.
SNPUPR – Northern Region (A DFID and MoHUPA Partnership)
School of Planning and Architecture, New Delhi 21
Identification of various slums by agencies
Most of the slum population living in UA are migrants from nearby rural areas and districts,
which are vulnerable due to their poor economic status, lack of basic health, education and
civic facilities. In terms of the socio-economic growth of the city, poor health conditions
among slum dwellers need to be addressed on a priority basis. Under Jawahar Lal Nehru
Urban Renewal Mission (JNURM) a number of efforts have been planned for to uplift city
slums. Avas Vikas Parishad and Gorakhpur Development Authority are taking care of the
housing needs of the poor people. Poor people are dependent on Government run hospitals,
dispensaries and RMPs for availing health facilities.
2.8. Aligarh
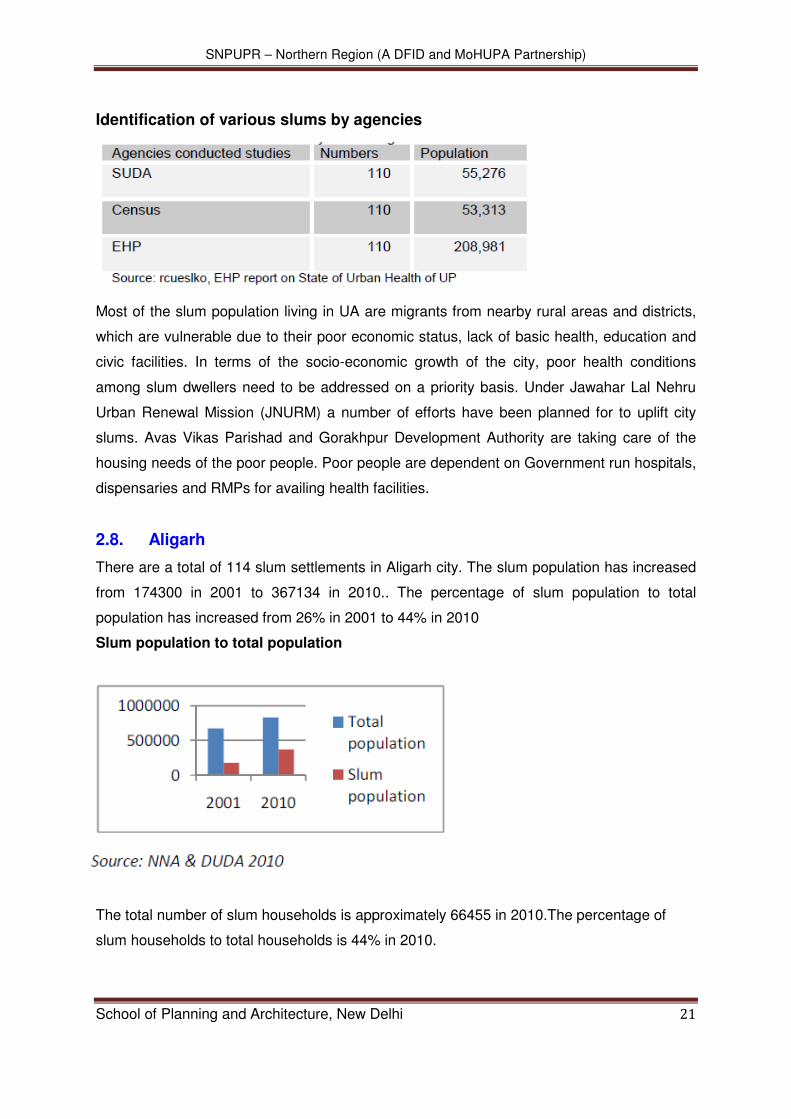
There are a total of 114 slum settlements in Aligarh city. The slum population has increased
from 174300 in 2001 to 367134 in 2010.. The percentage of slum population to total
population has increased from 26% in 2001 to 44% in 2010
Slum population to total population
The total number of slum households is approximately 66455 in 2010.The percentage of
slum households to total households is 44% in 2010.

SNPUPR – Northern Region (A DFID and MoHUPA Partnership)
School of Planning and Architecture, New Delhi 22
Slum households to total households:
2.9. Ghaziabad
Based on the slum mapping exercise conducted by the State Department of Health and
Family Welfare, 82 slums were identified in Ghaziabad city. Of these, 50 slums were already
in the official list while 32 new unlisted slums were identified. The total population residing in
the listed slums is 194,000.
Distribution of slums
Overview of the distribution of slums in Ghaziabad, 2007

SNPUPR – Northern Region (A DFID and MoHUPA Partnership)
School of Planning and Architecture, New Delhi 23
The slums of Ghaziabad may be characterized as either inner city slums or villages
converted into slums. While assessing the typology of slums in Ghaziabad it may be
observed that 32 slums are inner city slums and 43 are villages converted into slums.
Ownership status and Genesis of Slums:
The ownership status of the slums in Ghaziabad reveals that all the slums are situated on
privately owned land. The overview of the genesis of the slums in Ghaziabad reflects that 25
slums are between 25 years to 50 years old, 6 slums are between 50- 100 years old and rest
slums (30) are more than 100 years old.
2.10. Jhansi
There are a total of 56 slum settlements in Jhansi city. The slum population has increased
from 78000 in 2001 to 1,59,127 in 2010. Percentage of slum population to total population
has increased from 16.5% in 2001 to 26.5% in 2010. The total number of slum households is
approximately 30,000 in 2010. The percentage of slum households to total households is
33% in 2010.
Slum population to total population
Slum households to total households

SNPUPR – Northern Region (A DFID and MoHUPA Partnership)
School of Planning and Architecture, New Delhi 24
2.11. Agra
As per the Census 2001, the total slum population in the city is 1, 21,761. The percentage of
slum population in the city is 9.5 per cent of the total population, which is less than the
percentage of slum population to total urban population of the state (12.7 per cent). But the
present slum population is much more than the city population and it is about 9,07,540 -
which is about 60% of the total city population.
As per DUDA (2001) there are 252 slum pockets with a population of the order of 5.5 lacs
i.e. about 44 per cent of the total population. The current statistics show that there are about
378 notified slum pockets with a population of the order 9.07 lacs i.e. about 60% of the total
population and 147 un-notified slum pockets which further more adds slum population to the
existing slum population.
The slum population in the city has been spread over in many wards. The household (HH)
size in slums works out to be 6.05, which is more than the HH size of the total population
(6.00). The sex ratio in the slums (850) is more than that of the total population (846) where
as the literacy rate is 51.32 per cent, which is very less than the total literate population
(60.14 per cent). Out of a total number of 90 wards in the city, more than 50 no. of wards
have slums. The slum population in the wards varies from 1.5 per cent to maximum of 95.85
per cent. Ward nos. 11 and 17 near Taj Nagar and Trans Yamuna have more than 50
percent of the population as slum population.
Infrastructure and Housing condition
As per the Government of India, poverty line for the urban areas is Rs. 296 per month i.e.
people in India who earn less than Rs. 10 per day and as such about more than 25 thousand
families are estimated to be living below poverty line in Agra city. The physical and natural
environment of these slum populations is also below standards. This is due to poor
infrastructure facilities and services provided to them resulting in unhygienic and unhealthy
conditions in these locations.
The secondary analysis for slum area show that most of the houses in slum areas are pucca
with brick walls, PCC roofing where as some people live in jhopris. There are about 20 – 25
slums in Sekhmandu Qazipada area. The slums have come up on both the sides of the
nallah with worst conditions. Further, the basic services are also poor in Naripura. There are
many other potential areas that lack some basic services such as sanitary facilities resulting
in unhygienic disposal of waste and also high rate of open defecation. The secondary
analysis from the District Urban Development Authority (2001), show that there is more than
20% of the slum population does not have any water facility. And the population those have

SNPUPR – Northern Region (A DFID and MoHUPA Partnership)
School of Planning and Architecture, New Delhi 25
water facilities are also polluted and people does not use for drinking purpose. However,
more than 20% of the population has individual connections. In some areas o the city the
water is supplied through stand posts and piped networks supplies with street taps. In
addition to this, there is only 50% of the slum population that is covered with sanitary
facilities. And the rest 10% of the population is involved in usage of community toilets and
others involved in unhygienic practices. This shows that there is high percentage share of
population openly defecating. The other provisions to slum population were low cost
sanitation units and this caters to only less than 5% of the total slum population. This type of
sanitation units are provided in slums and slums cum public places, and these are
maintained by Sulabh, Shikshan Sansthan and Social Welfare Society.
The poor sanitary conditions are prevailing due to lack of drains and collection of wastewater
in pits. The clogged drains have also increased the vulnerability of the slum dwellers. Inside
the settlements there are no paved drains or pathways, the wastewater from homes gets
collected in open soak pits. The stagnant water in the pits results in mosquito breeding. In
addition to this, there is no provision of solid waste collection or disposal in the slum areas.
The plastic waste was disposed in open spaces and the piles of waste were seen at various
locations. Based on the data collected from the DUDA, consultations with the stakeholders,
reconnaissance survey and city assessment it can be seen that the population living in the
slums lacks access to infrastructure services like safe drinking water, sanitation, drainage,
access roads, solid waste disposal and other community facilities. Thus there is need for
slum up gradation programmes through improved basic services.
2.12. Bareilly
Twenty percent of the population in Bareilly stays in areas marred with unhygienic living
conditions and lack of civic amenities. The urban infrastructure is not satisfactory enough to
bring homogenous development in new areas. The growth of housing stock is not able to
keep pace with the population growth. This has increased the housing stock deficit which
has given rise to slum dwellings.
As per the survey conducted by DUDA and documents from NNB, total notified slums in
Bareilly are 85. According to census 2001, the slum population was 77109 i.e. 20.5 percent
of total Population. As per the survey conducted by S.U.D.A in 2000-01, the population was
77109 and total households were 10050. A large number of below poverty line (BPL)
population (about 25%) also live-in slums. The current slum population is about 2.44 lacs
with 31850 of households i.e. about 26.47% of the total population.

SNPUPR – Northern Region (A DFID and MoHUPA Partnership)
School of Planning and Architecture, New Delhi 26
Water Supply Facilities: It may be seen that in slums access to individual water
connections is low and people generally use public stand posts, hand pumps, or wells in a
few cases. Majority of households (55%) get water from public stand posts and only 19%
percent have individual taps. It has been observed that main source of water supply in slum
areas is hand pumps and wherever piped water supply is there, either supply is inadequate
or it’s not regular or it’s very dirty. They are only able to use the water after carrying out the
sedimentation and filtering. Out of total households in slum, about 30 percent have electricity
whereas others use either kerosene, wood etc.
Sanitation Facilities: Presently, access to sanitation services is markedly less than access
to other basic services. While, it may be worthwhile to note that the proportion of people
having access to sanitation in urban areas is considerably greater when compared to their
rural counterparts, the problems are more exacerbated in slums. Urban sanitation is
perceived as being important because of the health factor. In case of slums, it has been
observed that sanitation facilities are worst and in alarming condition.
Majority of households use public toilets followed by households using individual flush. Even
then open defecation is still at a large scale i.e. about 35% of the slum households openly
defecate. During the visit in slums located at different part of the Bareilly city, it has been
observed that sanitation condition is still very poor in most of the slum areas considering only
20 percent people have individual toilets and the others i.e. approx. 5 percent use
community toilets and 35 percent still go for open defecation. The present condition is shown
in the situational analysis of sanitation facilities in slum areas.

SNPUPR – Northern Region (A DFID and MoHUPA Partnership)
School of Planning and Architecture, New Delhi 27
2.13. Mathura
Mathura city has a slum population of 1.44 lakhs as per the 2001 census, constituting 40
percent of the total population of the city. It has been clarified by the consultants that in-situ
tenure rights are envisaged for the slum dwellers who are encroaching on public lands.
Whilst 50 percent of the slums are located on lands owned by the occupants, the remaining
50 percent of the slums in the city of Mathura are unauthorised structures which have been
built by way of encroachment on Govt. lands.
Slums in the Mathura UA are located on private as well as government lands. Around 50%
of the slums in the 18 slum zones, have land/ownership on private lands, the rest is based
on spontaneous structures on government lands. These spontaneous slum areas have no
legal land status and are therefore suffering from lack of physical as well as social amenities.
With the support from DUDA, it is necessary for these spontaneous settlements to be given
in-situ tenure rights by cooperatising the squatter settlements. Initially these encourage them
to be upgraded in-situ. Over a period of time they could emerge in the form of in-situ
reconstructed units.
The city of Mathura being a major religious centre and tourist location, attracts a huge low
income population which is engaged in informal activities which invariably take place on the
road side by way of street vending, etc. Such a population which is an unavoidable and
intrinsic ingredient of the socio-economic mileu of the city needs night shelters, public toilets,
etc. in terms of basic infrastructure.
SNPUPR – Northern Region (A DFID and MoHUPA Partnership)
School of Planning and Architecture, New Delhi 28
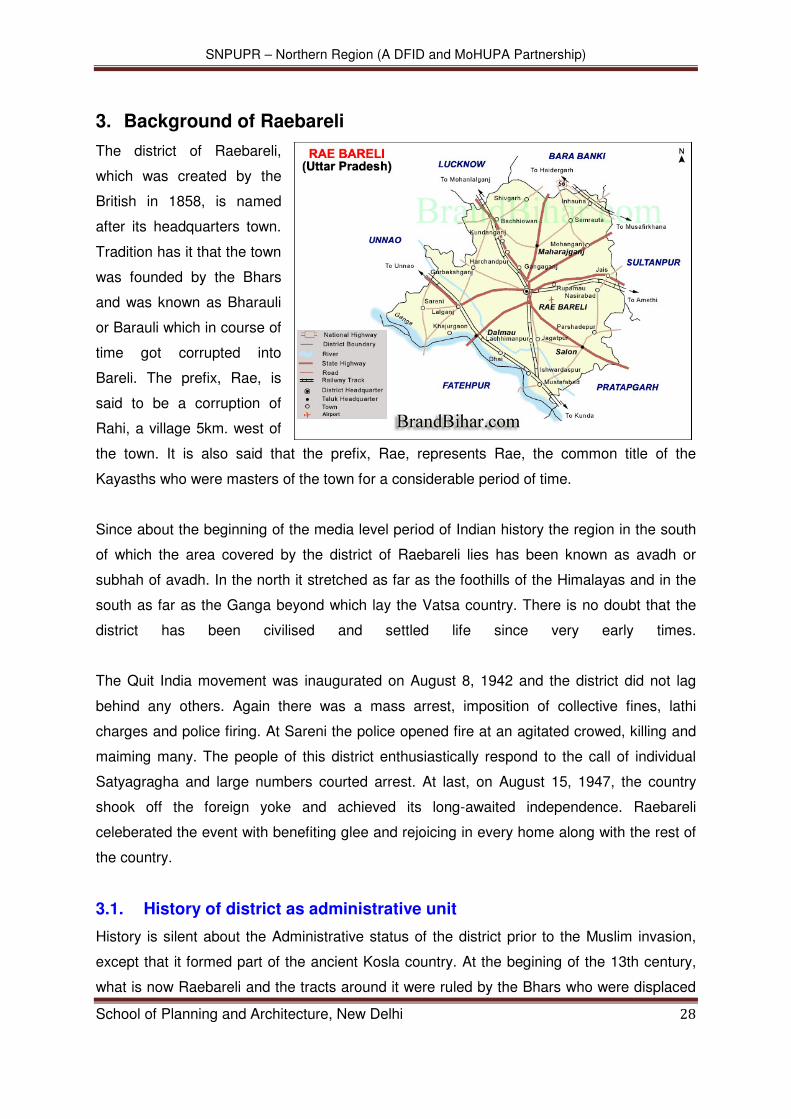
3. Background of Raebareli
The district of Raebareli,
which was created by the
British in 1858, is named
after its headquarters town.
Tradition has it that the town
was founded by the Bhars
and was known as Bharauli
or Barauli which in course of
time got corrupted into
Bareli. The prefix, Rae, is
said to be a corruption of
Rahi, a village 5km. west of
the town. It is also said that the prefix, Rae, represents Rae, the common title of the
Kayasths who were masters of the town for a considerable period of time.
Since about the beginning of the media level period of Indian history the region in the south
of which the area covered by the district of Raebareli lies has been known as avadh or
subhah of avadh. In the north it stretched as far as the foothills of the Himalayas and in the
south as far as the Ganga beyond which lay the Vatsa country. There is no doubt that the
district has been civilised and settled life since very early times.
The Quit India movement was inaugurated on August 8, 1942 and the district did not lag
behind any others. Again there was a mass arrest, imposition of collective fines, lathi
charges and police firing. At Sareni the police opened fire at an agitated crowed, killing and
maiming many. The people of this district enthusiastically respond to the call of individual
Satyagragha and large numbers courted arrest. At last, on August 15, 1947, the country
shook off the foreign yoke and achieved its long-awaited independence. Raebareli
celeberated the event with benefiting glee and rejoicing in every home along with the rest of
the country.
3.1. History of district as administrative unit
History is silent about the Administrative status of the district prior to the Muslim invasion,
except that it formed part of the ancient Kosla country. At the begining of the 13th century,
what is now Raebareli and the tracts around it were ruled by the Bhars who were displaced

SNPUPR – Northern Region (A DFID and MoHUPA Partnership)
School of Planning and Architecture, New Delhi 29
by the Rajputs and, in a few cases, by some Muslim colonist. The south western part of the
district was occupied by the Bais rajputs. The kanpurias and Amethias, other rajput clans,
established themselves respectively in the north east and east. During the rule of the Delhi
sultans nearly the whole tract nominally formed a part of their kingdom. During the reign of
Akbar the area now covered by the district was divided between the sirkars of avadh and
Lucknow in the subah of Allahabad, the sirkar of manikpur which included the larger part of
the district as it extended from the present Mohanlal ganj pargana of district Lucknow on the
north west to the ganga on the south and to pargana Inhauna on the north east. The
pargana of Inhauna corresponded to a mahal of that name in the sirkar of avadh. The
parganas of sareni, Khireoon and the western portion of the pargana of Raebareli formed
part of the sirkar of Lucknow. In 1762, the sirkars of manikpur was included in the territory of
avadh and was placed under a chakladar.
In 1858, it was proposed to form a new district with head quarters at Rae bareli, as a part of
the Lucknow Division. The district, as then constituted, was very different in shape and size
from the existing one and was divided into four tehsils, Raebareli, Haidergargh, Bihar and
Dalmau. This arrangement resulted in a district of very irregular shape, 93 kms.long and 100
kms.broad. In 1966, owing to the change in the course of the Ganga the villages of katia
Ahatima, Rawat pur, Ghiya, Mau, Sultanpur Ahetmali, Kishunpur, Deomai and lauhgi were
transferred fro m district Fatehpur to pargana Sareni of tehsil Dalmau in this district.
3.2. Location & Boundaries
The district is irregular in shape but fairly compact. It forms a part of the lucknow Division
and lies between Latitude 25° 49' North and 26° 36' North and Longitude 100° 41' East and
81° 34' East. On the North it is bounded by tehsil mohanlal ganj of district Lucknow and
tehsil haider gargh of district Barabanki, on the east by tehsil Mussafir Khana of district
Sultanpur and on the south east by pargana Ateha and the Kunda tehsil of district Pratap
Gargh. The southern boundary is formed by the Ganga which separates it from the district of
Fateh pur. On the west lies the purwa tehsil of district Unnao.
Area
According to the 1991 census the area of the district was 4,609 sq. km. The area is liable to
vary every year by reason of the action of the Ganga, for a small variation in the deep
SNPUPR – Northern Region (A DFID and MoHUPA Partnership)
School of Planning and Architecture, New Delhi 30
stream of the river makes a very noticeable change in the area of the district, which occupies
the thirty fourth place in size among the districts of the State.
Topography
The district, as a whole, is fairly compact tract of gently undulating land. The elevation varies
from about 120.4 m. above sea level in the north west to 86.9 m. above sea level in the
extreme south east, on the banks of the Ganga. The highest points are the crowns of the
watersheds of the different drainage channel which serve to divide the district into five main
physical units, The ganga Khadar, the ganag upland, the southern clay tract, the central tract
or the sai upland and the Northern clay tract.
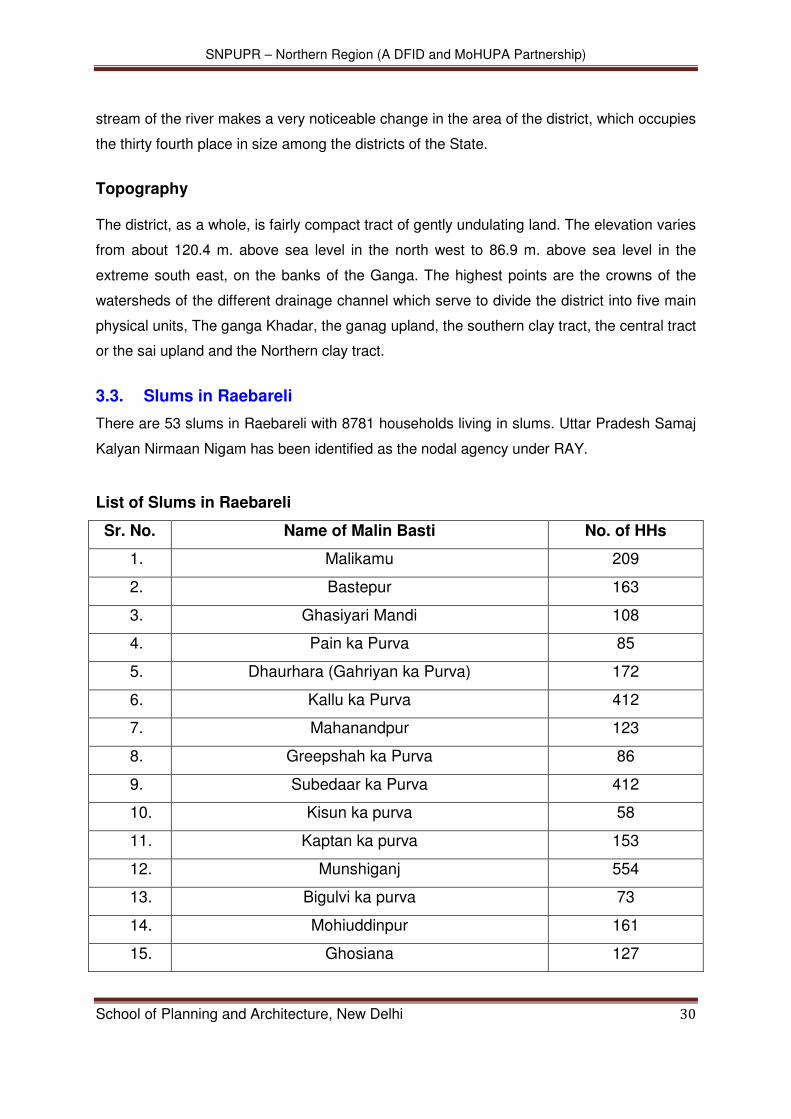
3.3. Slums in Raebareli
There are 53 slums in Raebareli with 8781 households living in slums. Uttar Pradesh Samaj
Kalyan Nirmaan Nigam has been identified as the nodal agency under RAY.
List of Slums in Raebareli
Sr. No. Name of Malin Basti No. of HHs
1. Malikamu 209
2. Bastepur 163
3. Ghasiyari Mandi 108
4. Pain ka Purva 85
5. Dhaurhara (Gahriyan ka Purva) 172
6. Kallu ka Purva 412
7. Mahanandpur 123
8. Greepshah ka Purva 86
9. Subedaar ka Purva 412
10. Kisun ka purva 58
11. Kaptan ka purva 153
12. Munshiganj 554
13. Bigulvi ka purva 73
14. Mohiuddinpur 161
15. Ghosiana 127

SNPUPR – Northern Region (A DFID and MoHUPA Partnership)
School of Planning and Architecture, New Delhi 31
16. Gora bazaar 163
17. Sonia Nagar 156
18. Devanandpur 183
19. Dakshini jahanabad 85
20. Poorvi darwaza 72
21. Tiliyakot 284
22. Khaali sahat 292
23. Bairiya ka purva 68
24. Khatrana 216
25. Basantola 204
26. Shahtola 78
27. Joshiana 110
28. Kajiyana 110
29. Kaharon ka Adda 73
30. Nazarvataal 58
Total 4936
20-22 slum pockets have been improved under IHSDP programme through in situ
redevelopment. Approximately 2000 HH have been proposed under IHSDP with a breakup
of 1031 DUs, 249 DUs & 353DUs.

SNPUPR – Northern Region (A DFID and MoHUPA Partnership)
School of Planning and Architecture, New Delhi 32
1500 HHs have been constructed under Kashi Ram Awas Yojana. Total 8500 HHs as Urban
poor- Approx. need- 1500- 2000 HHs.

SNPUPR – Northern Region (A DFID and MoHUPA Partnership)
School of Planning and Architecture, New Delhi 33

SNPUPR – Northern Region (A DFID and MoHUPA Partnership)
School of Planning and Architecture, New Delhi 34
4. Legal & Institutional framework for Town Planning, Housing and
Slum Improvement.
4.1. Institutional Framework
The responsibilities for town Planning, housing and slum improvement are spread across
the department of Urban Development and Housing, Urban local Bodies, State Urban
Development Authority and District Development authority known as SUDA and DUDA.
These agencies are responsible for Urban Poverty elevation and Slum improvement. The
Town and Country Planning Deptt and U.P. Housing and Development Board development
authorities are under the ministry of Urban Planning and Housing. Urban Development
Policy as well as other sources recommended is directly under Deptt. Of Urban
Development and Housing ministry.
The Development Authority in Uttar Pradesh has been created under U.P. Urban and
Planning Development Act-1973 which also comes under the ministry of Housing and Urban
Planning Deptt. The Master Plan for the towns is generally prepared by State Town and
country Planning Deptt. headed by Chief Town & Country Planner

SNPUPR – Northern Region (A DFID and MoHUPA Partnership)
School of Planning and Architecture, New Delhi 35
4.1.1. Town and Country Planning Deptt.
The main function and activity of Town and Country Planning Deptt is to prepare Master
Plan, Regional Plan for the towns and regions. There is no separate Town and Country
Planning Act in the State. There is provision in U.P. Urban and Planning Development Act-
1973 and U.P. Building operation Act- 1958 to prepare the Master Plan for cities and towns
as directed by controlling authority and development authority. The other functions are
monitoring of various schemes of the state Govt.
The State town and Country Planning Deptt have prepared Master Plans for 37 town under
regulated area and 42 towns under Development authorities. The preparation of Master Plan
is done by town and country Planning Deptt through its Divisional offices which are located
in each commissioner head quarters. The Plan implementation is the responsibility of Urban
Development authorities, which under takes the regulatory functions, primarily building
regulation. The Master Plan/ Development Plan’s apply to the municipal areas as well as
adjoining Urbanisable areas declared under the prevailing act.
There is no provision in Municipal Act to prepare Maser Plan or Zonal Development Plan.
The 74th Constitutional amendment have still not implemented by the Urban Local Bodies.
The U.P. regulation of Building operation Act 1958 and U.P. Urban planning and
Development Act 1973 speak about slum improvement and Development scheme and
provision for the preparation of Zonal Development Plans.
Slums upgrading in spot zone land use is accepted option. Most of the Master Plan of city
identifies the slum areas of a city but does not give any detail list of slums. As such, there is
a need to identify the existing slum pockets of slum in the city while prepared Master Plan
and detail study should be done by Housing and Development Board.
The U.P. Adarsh Bhavan Niyamawali 2008 have been issued by the State Govt. and
adopted by all development authorities. of U.P where there is provision of minimum standard
for E.W.S and low income group.

SNPUPR – Northern Region (A DFID and MoHUPA Partnership)
School of Planning and Architecture, New Delhi 36
Minimum standards for E.W.S and low income group in U.P. Adarsh Bhavan
Niyamawali 2008
S.No. Item Economically weaker Low income group
1- Minimum Plot size 30sq.mt. 70sq.mt.
2- Minimum dwelling size 20sq.mt. 45sq.mt.
4.1.2. Housing
The U.P. Housing and Development Board were established in the year 1965 for the
purpose of undertaking housing and development schemes. It provides a focus on E.W.S
and L.I.G. Since its inceptive U.P. Avas Evam Vikas Parishad has constructed 2.5 lakhs
houses, 40 % for E.W.S are 30% L.I.G. All Projects and Programmes, including it internal
cross subsidies are arranged for by the economics of Projects.
In addition, the Housing for Weaker section is also under taken by Urban Development
authorities, special area development authorities, municipal corporations and municipalities.
Apart from U.P.H.D.B and Development authorities, the other housing activities for the poor
consist of VAMBAY, BSUP and IHSDP schemes.
4.1.3. Slum Improvement
Slum improvement scheme was under taken primarily by Urban Local Bodies. The Slum
improvement Scheme is being implemented through DUDA and SUDA by ministry of Urban
Local Bodies.
4.1.4. Administrative set up
The execution of Housing Projects is mainly done by U.P. Awas and Vikas Parishad and
Development Authorities. At present there are 27 development authorities which are
established in important towns. U.P. Housing and Development Boards are established in
102 small and large towns of the state. The Development authorities are governed by U.P.
Planning and Development Act 1973 and U.P. Housing and Development Board govern by
U.P. Housing and Development Act- 1965.
The Housing Board and Development authorities are entitled to acquire land for
development of planned colonies by providing developed plots, constructed houses for all
SNPUPR – Northern Region (A DFID and MoHUPA Partnership)
School of Planning and Architecture, New Delhi 37
types of income groups like, E.W.S, L.I.G, M.I.G. and H.I.G. These schemes are also
implemented through self financing pattern. Other than this financial help is also provided
through State Govt., Hudco and other financial Institutes.
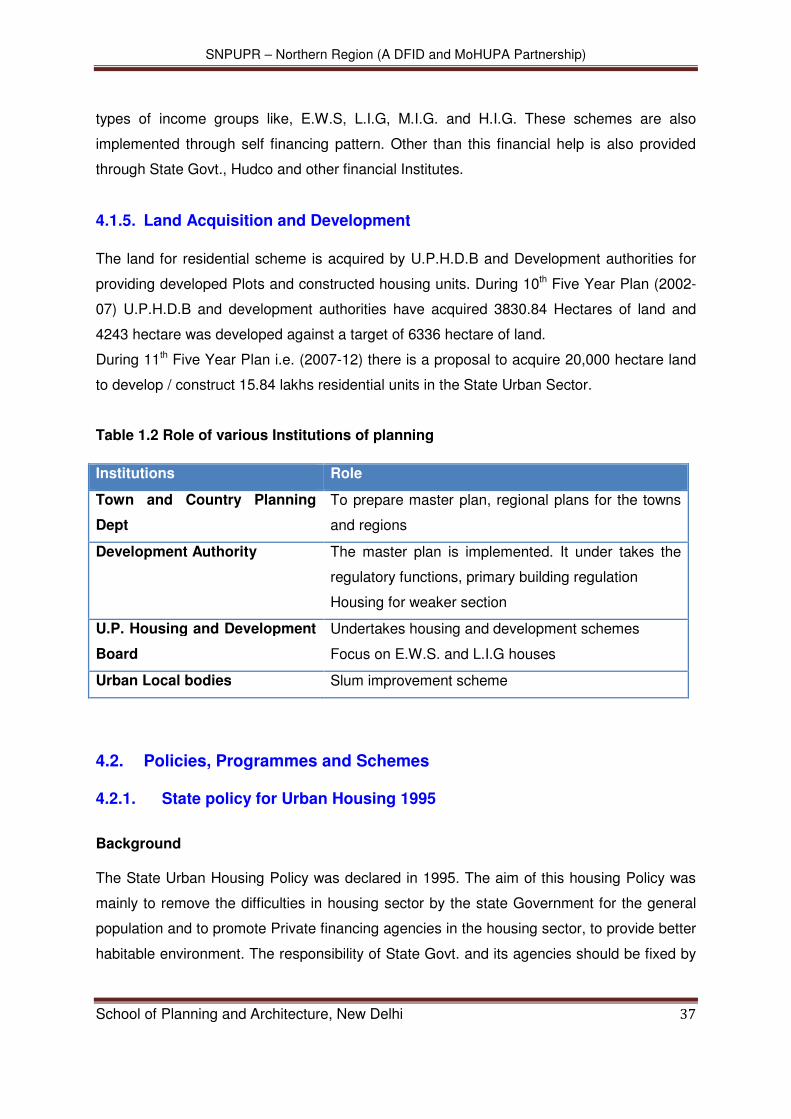
4.1.5. Land Acquisition and Development
The land for residential scheme is acquired by U.P.H.D.B and Development authorities for
providing developed Plots and constructed housing units. During 10th Five Year Plan (2002-
07) U.P.H.D.B and development authorities have acquired 3830.84 Hectares of land and
4243 hectare was developed against a target of 6336 hectare of land.
During 11th Five Year Plan i.e. (2007-12) there is a proposal to acquire 20,000 hectare land
to develop / construct 15.84 lakhs residential units in the State Urban Sector.
Table 1.2 Role of various Institutions of planning
Institutions Role
Town and Country Planning
Dept
To prepare master plan, regional plans for the towns
and regions
Development Authority The master plan is implemented. It under takes the
regulatory functions, primary building regulation
Housing for weaker section
U.P. Housing and Development
Board
Undertakes housing and development schemes
Focus on E.W.S. and L.I.G houses
Urban Local bodies Slum improvement scheme
4.2. Policies, Programmes and Schemes
4.2.1. State policy for Urban Housing 1995
Background
The State Urban Housing Policy was declared in 1995. The aim of this housing Policy was
mainly to remove the difficulties in housing sector by the state Government for the general
population and to promote Private financing agencies in the housing sector, to provide better
habitable environment. The responsibility of State Govt. and its agencies should be fixed by

SNPUPR – Northern Region (A DFID and MoHUPA Partnership)
School of Planning and Architecture, New Delhi 38
the regulatory measures. The aims and objection laid down of State housing Policy 1995 for
urban development are as follows:
Execution of Important Policy
The simplification of Building byelaws to provide appropriate environment to provide housing
for urban poor of different income groups as per their economic condition. Adarsh Building
construction and Development byelaws are issued in 2000 and later, based on the
recommendation National Building code 2005 revised in 2008. All Development Authorities
and U.P. Avas Evam Vikas Parishad started implementation accordingly. The sanction of
Building plans upto 300sq.mt. plotted development was made easier for the general public.
Easy sanction of industrial maps by simplification of procedure
The industrial Plot measuring an area more than 500 sq mt. to be deemed Sanction after
submitting the map with no objection certificate as desired by the authority
Purchasable F.A.R
The purchasable F.A.R in Commercial, Community facilities and group housing may be 20%
of basic permissible F.A.R. in built up area. In developed area this is 33% and in new area
and under developed area this purchasable F.A.R is 50% of basic F.A.R.
Earthquake resistance in Building Construction
In case of building more than 12 meter height and more than 500 sq mt. coverage, it will
come in above provision as per the be I.S and N.B.C code.
Adarsh zoning Regulation
User Friendly Adarsh Zoning Regulation was framed along with the master Plan of towns
and cities which was implemented in all Development Authorities and regulated areas of
Uttar Pradesh during the year 2001-02. Thus Adarsh Zoning regulation was also adopted by
authorities along with Master Plan of the towns/ cities.
Rain Water Harvesting

SNPUPR – Northern Region (A DFID and MoHUPA Partnership)
School of Planning and Architecture, New Delhi 39
To protect the underground source of water, Rain Water Harvesting Policy was
implemented. Residential Schemes along with Rains and open space water. On the plot size
with 300 sq mt and more, the roof top rain harvesting was made compulsory.
Encouraging Solar Energy Source
The provision was made in the Building Bylaws to use compulsory solar energy especially in
Hospital, Nursing Home, Hotel, Guest House, Hostel, High level Educational Institutions,
Public Training Centers, Police/Sanik Bal, community centre, Barat Ghar and residential
Plots having an area of more than 500 sq mt.
Provision for Disables people
The Act was enacted as a “Saman Avsar, Adhikar Sanrakhan and Rural Bagidari Act 1996”
for disabled people and special norms were formulated to accommodate them in all
Buildings to be used as Public utilities.
Regularization of unauthorized colonies
The large part of housing sector of urban area is under unauthorized colony. The Policy of
regularization of these unauthorized colonies was issued to provide basic services like
roads, water supply, Electrification, Drainage and Sewer system.
Sarwajan Hitai Garib Avas (SLUM AREA) ownership scheme
Sarwajan Hitai Garib Avas (SLUM AREA) ownership scheme was executed in Jan 2009 in
the Urban areas were land belongs to State Govt /Agencies, Local bodies, Nazul, in which
poor people are situated. Population below poverty line was given workshops and other
employments means under Malikana Haq Yojna. The maximum Plot of 30 sqmt. and minium
15sqmt. was allotted to them for 90 years lease.
Provision of land-use change fees
The provision for change of land use was made from the lower use to higher use, and
necessary amendments were made in the U.P. Urban and Planning Development Act 1973
in the year 2007. Due to this, the land in residential sector is increasing due to change of use
from agriculture to residential.

SNPUPR – Northern Region (A DFID and MoHUPA Partnership)
School of Planning and Architecture, New Delhi 40
Encouragement of Private Sector Investment
The High Tech Policy was issued by the State Govt. with an area of minimum 1500 acre
land to build world class infrastructure. This was with a view to fill up the gap of supply and
demand in Urban sector of the state for residential Plots/ Houses and limited scope for
providing Developed Plots/ Constructed houses for Govt. Agencies, which has got limited
financial assistance and capacity. This policy is now extended from 1500 acre of land to
5000 acre.
The integrated township/ Housing scheme Policy was also issued in 2005. Development
Authorities and U.P. Avas Evam Vikas Parishad. Under this scheme, registered developers
can develop residential schemes in Development Authorities and U.P. Avas Evam Vikas
Parishad, with an area of 50-500 acres of land.
Review of the Execution of Policies
The Urban Housing Policy of 1995 has not been very effective and its impact was very
limited. However, the Policy for High Tech Township, Integrated Township was issued but its
successful implementation could not take place. As such, it is necessary that Government
agencies should make them effective to facilitate the private sector. An effort has been made
by issuing guide lines by the State Govt. to provide 20% Plots/ House for economically
sector and lower income group.
4.2.2. Urban Housing Policy 2009
The objectives of Urban Housing Policy 2009 for Urban Poor are:
• Provision of Housing units according to economic affordability.
• Centre Govt. has made the provision for subsidy in E.W.S in housing scheme.
• Improvement of slums.
• Providing employment to economically weaker sector.
• Construction of houses for E.W.S and L.I.G by Private sector on cross subsidy basis.
• To provide cross subsidy by State Govt. for E.W.S and L.I.G
Inclusive Development
Special efforts are made for housing and other basic facilities and services for Schedule
caste, Schedule Tribe, other backward classes, minorities. Efforts are made by different

SNPUPR – Northern Region (A DFID and MoHUPA Partnership)
School of Planning and Architecture, New Delhi 41
departments of the State Govt. like education, health, social welfare, NGO’s and UNICEF,
for improvement of child environment and keep them away from child employment etc.
The Strategy for Urban Housing Policy – 2009
a. Land accumulation
The formulation of land bank by Development authorities and U.P. Housing Boards is
through KRAR, with farmars/land owners by mutual agreement. For acquisition of land,
Nazul, Urban ceiling, Rural ceiling, gram samaj etc., policies should be framed to ease out
the processor of land assembling.
b. Houses as per Economic affordability
Various provisions have been made to provide affordable hosuing to EWs and LIG at
subsidized rates. The following strategy is to be adopted-
• The surplus Gram Samaj Land, Nazul land, Urban ceiling land will be provided free of
cost for the residential scheme of E.W.S and L.I.G houses.
• The free land will be provided to the economically weaker sector of the society
through redevelopment scheme, land sharing and under right of ownership in built up
area of the city and come in the preview of law.
• The residential scheme to be developed by Private and co-operative sector, 20% of
Plots/ Houses will be provided to economically weaker sector and low income group.
in each category.
• Keeping in view the limited land availability slums development and improvement
schemes will be implemented.
• The basic facilities/amenities will be provided in slums free of cost.
• The low cost building material like flyash, Bamboo and local materials available in the
area should be used for E.W.S and L.I.G sector to reduce the cost.
• The non-conventional, solar energy, bio-gas will be encouraged for light and fuel.
• The modular cluster design and multi storied building will be encouraged for E.W.S
and L.I.G housing upto G+3.
• The size of Plot/ Plinth area of house and F.A.R will be fixed keeping in view location
and cost of land.
• The house design should be energy efficient, so that the houses may provide natural
light and ventilation.
• The structural design should reduce the cost of construction of houses.

SNPUPR – Northern Region (A DFID and MoHUPA Partnership)
School of Planning and Architecture, New Delhi 42
• The self help housing will be encouraged by Govt. agencies to increase the
community participation.
• The loan from financial institutions for E.W.S housing will be provided at a cheaper
rate through Micro finance.
• The provision will be made to make the E.W.S Plots/ Housing free from Stamp duty.
c. Housing Finance
The efforts will be made to provide loans for HUDCO and other financial institutions at a
cheaper rate with cross subsidy for construction of houses for E.W.S and L.I.G sector.
The maximum grant will be provided by the State Govt. for the execution of JNURM,
UDIDSSMT and IHSDP Scheme.
4.2.3. Houses for all - Under House for all schemes
During the 10th five year plan 2.50 lakhs Plots/ Houses were constructed against the target
of 4.40 lakhs units under House for All Scheme. Out of which 54% of Plots/ houses were
constructed for E.W.S and L.I.G.
The Houses of E.W.S and L.I.G are constructed under 20 point programme. In this
programme 15186 units were constructed for E.W.S against a target of 15500 and 3409
houses were constructed against the target of 2660 houses for L.I.G. During the 10th Five
Year Plan, the progress of housing units under 20 point programme for E.W.S and L.I.G
units is 98% and 128% respectively.
4.2.4. Manyawar Kanshi Ram Sahari Garib Awasiya Yojna of U.P.
The State Govt. of U.P launched Manyawar Kanshi Ram Shari Garib Avasiya Yojna in the
year 2009 for providing houses to urban poor. During the year 2008-09, about 1.01 lakhs
housing units are proposed to be constructed under this scheme. The above house will be
allotted to widows who are without any shelter, Viklang and people below poverty line on the
basis of priority. Under this scheme, during the year 2008-09, the target to construct 1500
housing units in each towns of 60 big districts and 1000 housing units in 11 small towns in
the districts. There is a provision, to provide free land to working institution by development
authorities, Housing Board, district administration and Nagar Nigams/ parishads.
The other provisions are -

SNPUPR – Northern Region (A DFID and MoHUPA Partnership)
School of Planning and Architecture, New Delhi 43
• Minimum plot area prescribed in the scheme is 35sq.mt. It will include 2 rooms, kitchen,
W.C., bathroom and a balcony
• These dwelling units will be made on no profit no loss criteria.
• Minimum number of floors for the swelling units will be 3
• The maximum price of the plot will be Rs 1, 75,000/- per D.U.
a. Integrated Development of small and Medium town
The central integrated Development of small and medium town (IDSMT) Scheme was
launched during 1979-80 in the Uttar Pradesh State. The main objective of scheme was to
provide basic infrastructure and facilities in small and medium town which could able to
generate employment and strengthen the economy of local bodies.
During 10th Five year Plan 150 towns (30 towns every year) was the target of scheme. About
96 towns were benefited during 2002-05. Later on during 2005-06 UDISSMT scheme was
launched. For the above 96 towns Rs. 153.60 crore were sanctioned by the Central Govt. in
10th Five Year Plan. The Central Assistance was Rs. 56.14 crore and state share was Rs.
37.54 crore (i.e. total Rs 93.68 crore) were released for IDSMT towns. During this period
utilization certification for 130 towns was sent to central Govt. for Rs. 52.52 crore.
b. National Capital Region Schemes
The National Capital Regional Scheme is also assisted by Central Govt. for the development
of towns falling in NCR region of U.P. State. For this, N.C.R Planning Board Act was
constituted in 1985 by National Capital Regional Scheme Board.
In the State, Gaziabad, Noida, Greater Noida, Modi Nagar, Haper , Bulland Shahar, Khurja
and Meerut towns were selected for implementation of various development.
c. The backgrounds assistance of State Govt.
It has been observed that out of the total capital investment in residential sector, the major
part of investment in organized and unorganized sector, done by the Private sector. In
organized private sector, the major part of construction of housing units are in M.I.G and
H.I.G groups. Therefore, it is necessary that the state Govt. should take lead for E.W.S and
L.I.G sector. The development authorities and U.P Housing and Development Board should
given an opportunity by state Govt. for E.W.S and L.I.G housing.

SNPUPR – Northern Region (A DFID and MoHUPA Partnership)
School of Planning and Architecture, New Delhi 44
d. Malikana Haq Yojana, 15th Jan 2009
• The garib avas yojana is mainly launched to provide ownership of land to those people
who have not yet been benefitted from any scheme related to urban poor. These people
mainly reside on the unauthorized land of govt./ govt. agency/LDA/ LMC.
• The cutoff date is 15.01.2009
• The maximum plot area will be 30sq.mt and minimum plot will be 15sq.mt.
• The pattas will be provided for a lease of 90 years
e. Government orders2
Government orders - 3900/8-3-2008 – 38 LUC / 08 dated 9th July, 2008 were regarding the
plot size, density and FAR are –
Dwelling units per plot area
Sr. No. Plot area (Sq.mt.) DUs per plot
1 Upto 50 1
2 50-200 2
3 200-300 3
4 300-500 4
Proposed density
Type of development Net residential
Plotted development Maximum 750pph
Group housing Maximum 1000 pph
Ground coverage and FAR
Sr.No. Type of development Maximum ground
coverage (%)
Maximum
F.A.R.
1 Plotted residential 65 2
2 Group housing 35 2.5
2 Government orders - 3900/8-3-2008 – 38 LUC / 08 dated 9
th July, 2008

SNPUPR – Northern Region (A DFID and MoHUPA Partnership)
School of Planning and Architecture, New Delhi 45
5. Issues
• The urbanization rate of UP is expected to increase from 21.1. % (2008) to 26% in
2030.only Kanpur will have population more than 4 million in 2030
• Although the plan implementation is being done from 2 decades, about 31% of the
population is in slums.
• In the entire development scenario EWS housing does not figure out anywhere. There is
no mandatory requirement for developer to contribute towards the EWS Housing as
builtup area or land.
• This leaves the entire onus of providing EWS housing on to the government.
• Government is also working on this front and approx 1500 houses are being built under
Manyavar Kanshiram Yojna.
• Besides this there is no other scheme which is working towards augmentation of EWS
housing stock.
• Although the development control regulations are quite favourable and land prices are in
control but the lack of demand and inability of EWS to access the credit is a big deterrent
in private sector participation in EWS housing
• There is a provision of preparation of zonal plans, but they take a lot of time and do not
get prepared.
• Exemption in ceiling of land holding of the developers has been another way to increase
land supply. For instance, in case of Uttar Pradesh, land holding ceiling of 12.5 acres is a
big hindrance in the assembly of land. Therefore, Government of Uttar Pradesh has
initiated to exempt this holding in case of integrated scheme for city development by
developers.
• State government is doing a proactive role, the central level scheme do not get
implemented.
• Although UBSP (EIUS+NRY) had maximum number of components dealing with basic
services, environment and sanitation and employment generation etc, they were
stopped. Such components can always be included in some other scheme.
• Schemes like Vambay and now BSUP and Kansiram Samagra Vikas Yojana provide
Land tenure.
• There is no system of issuing Patta even to the slums on Government land.
• Except for SJSRY no other scheme has been implemented to its fullest.
• Access to land is very difficult. The cost of land is very high.

SNPUPR – Northern Region (A DFID and MoHUPA Partnership)
School of Planning and Architecture, New Delhi 46
• There is no provision for urban poor in the Master plan. There is only mention of slums
and informal sector in the master plan, but there is no provision for the sector.
• The land reservation for poor is not a part of the Master Plan. According to the U.P Sate
Housing Habitat Policy 2008 (Draft): Emphasis has been laid on the “Inclusive
development of the cities, with affordable housing for all.
• The private developers have to reserve 20% of the plots or houses/flats for this category,
whereas public agencies have to reserve 20% of saleable land for EWS/LIG housing.
• The definition given in U.P. Slum areas (Improvement and Clearance Act), 1962 for
slum areas is very vague as it does not define the terms like over-crowding, compact
area, poorly built, unhygienic environment, inadequate infrastructure etc. It does not
state any guidelines as to how the different types of the slum settlements shall be
improved upon.


![popu A poetize ¥980 (ORENOI Tdrtare [l +¥290] ¥580 …...2019/11/25 · popu A poetize ¥980 (ORENOI Tdrtare [l +¥290] ¥580 Sea Urchin Mousse Wrapped In Marinated Salmon F ¥780](https://img.pdfslide.us/doc/110x75/5fcf31789f319341e37ed91c/popu-a-poetize-980-orenoi-tdrtare-l-290-580-20191125-popu-a-poetize.jpg)