Embed Size (px)
Citation preview
Second Year Policy Analysis (SYPA)
Enhancing responsibility of local government borrowings in China
Client: China’s Ministry of Finance
Zhenqian Huang
Advisor: Jay Rosengard
Seminar leader: Eduardo Levy Yeyati
March 2016
Written in fulfillment of the requirements for
the degree of Master in Public Administration in International Development
John F. Kennedy School of Government
Harvard University

i
CONTENTS
ACKNOWLEDGEMENT ................................................................................................................ iii
EXECUTIVE SUMMARY .............................................................................................................. iv
SECTION I: Introduction and Background ........................................................................................ 1
SECTION II: Diagnostic Framework ................................................................................................. 7
SECTION III: Analysis of China’s Local Government Debt within the Diagnostic Framework .......... 9
SECTION IV: Potential Policy Recommendations ........................................................................... 28
SECTION V: Policy Feasibility and Stakeholder Mobilization: How to Make the Policy
Recommendations Work in China’s Context .................................................................................... 31
SECTION VI: Summary of Policy Recommendations ..................................................................... 39
APPENDIX: Tables ........................................................................................................................ 41
REFERENCE .................................................................................................................................. 60
Figure 1: Local government debt increases quickly, 2010-2014.............................................................1
Figure 2: Breakdown of local government debt, as of June 2013 ...........................................................2
Figure 3: Association between provincial wealth and local government debt, 2013 ..............................2
Figure 4: Local government debt of different government level in 2010 and 2013................................2
Figure 5: Direct liabilities of lower level local governments increase quicker, 2010-2014 ....................3
Figure 6: Government structure in China. ..............................................................................................3
Figure 7: Overdue repayment ratios of China’s local government debt, as of end 2012 ........................4
Figure 8: Sources of local government borrowings, 2010-2014 .............................................................5
Figure 9: Sources of local government borrowings – detailed breakdown, as of June 2013 ..................5
Figure 10: Purpose of local government borrowings (direct and contingent liabilities), 2010 and 2013
........................................................................................................................................................9
Figure 11: Purpose of local government borrowings (direct liabilities), 2010 and 2013 ........................9
Figure 12: Sources of local government borrowings and their maturity, as of June 2013 ....................10
Figure 13: Payback period of selected types of projects .......................................................................10
Figure 14: Association between local government debt and property prices, 2010-2015..................... 11
Figure 15: China’s Property prices in 2001-2015: a downward trajectory ........................................... 11
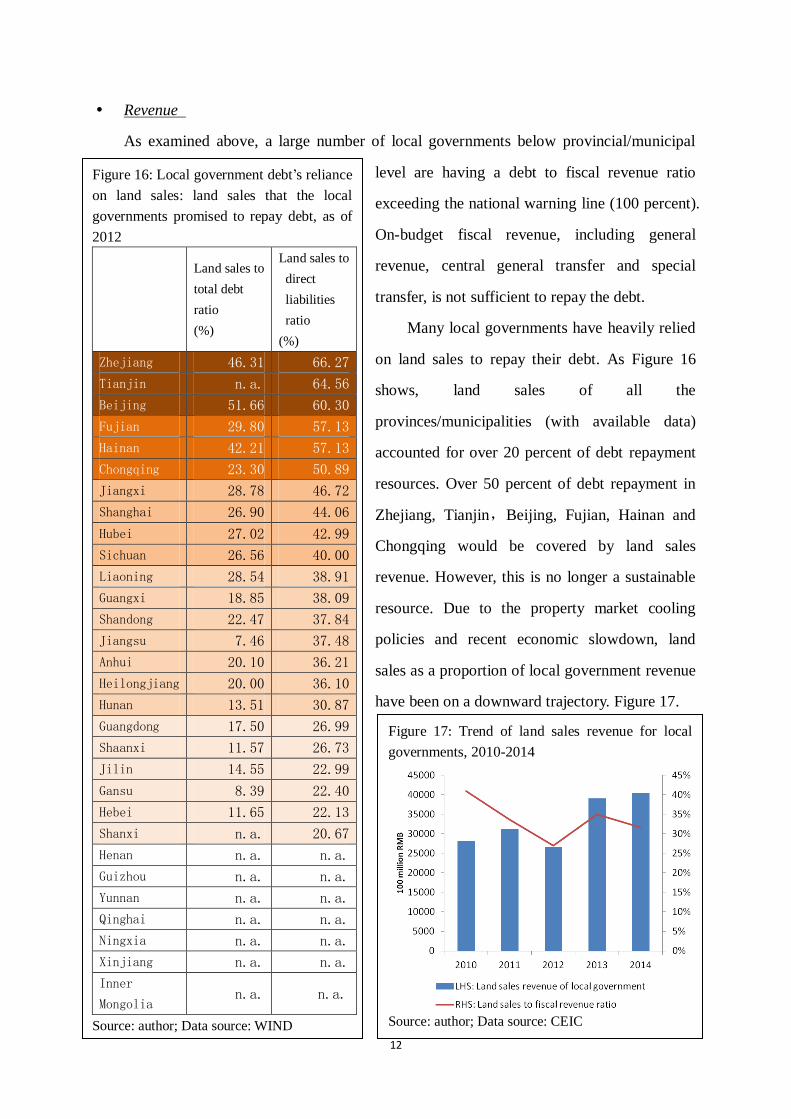
Figure 16: Local government debt’s reliance on land sales: land sales that the local governments
promised to repay debt, as of 2012 ...............................................................................................12
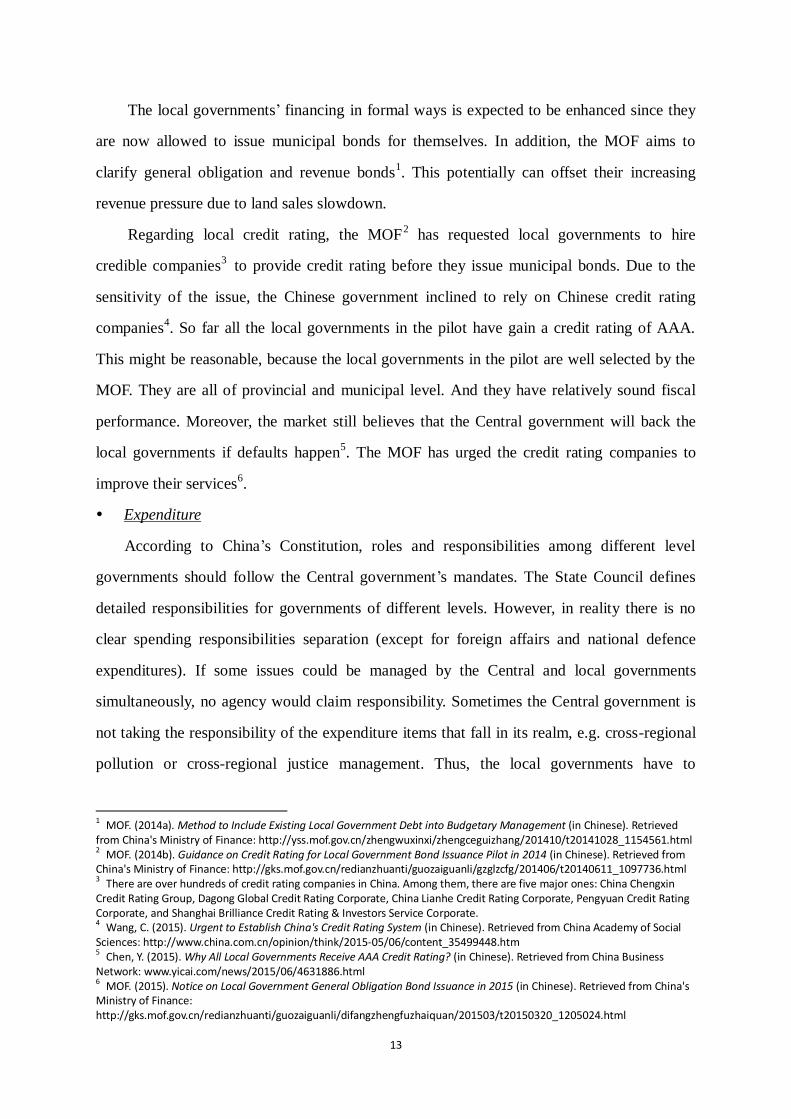
Figure 17: Trend of land sales revenue for local governments, 2010-2014 ..........................................12
Figure 18: Game between the central and the local governments (CG vs. LG) ....................................15
Figure 19: Local fiscal revenue vs. expenditure ...................................................................................17
Figure 20: Fiscal revenue of the Central and local governments (as a proportion of the total revenue),
1953-2014 .....................................................................................................................................18
Figure 21: Local government revenue, expenditure and expenditure with central transfer (in percent of
general government revenue and expenditure), 1953-2014 ..........................................................19
Figure 22: Lists of provinces predicted to have a debt to GDP ratio exceeding 60 percent in 2020 ....20
ii
Figure 23: Lists of provinces predicted to have a debt to fiscal revenue ratio exceeding 100 percent in
2020 ..............................................................................................................................................21
Figure 24: Analysis of policy recommendation 1 .................................................................................32
Figure 25: Analysis of policy recommendation 2 .................................................................................33
Figure 26: Analysis of policy recommendation 3 .................................................................................34
Figure 27: Policy recommendation 3: Spectrum of allies .....................................................................35
Figure 28: Analysis of policy recommendation 4 .................................................................................35
Figure 29: Policy recommendation 4: Spectrum of allies .....................................................................36
Figure 30: Analysis of policy recommendation 5 .................................................................................38
Figure 31: Policy recommendation 5: Spectrum of allies .....................................................................38
APPENDIX: Tables
Table 1: China’s local governemnt debt matrix ....................................................................................41
Table 2: Key indicators to measure local government debt risks in China, as of 2013 .........................42
Table 3: Local government debt: Debt to GDP ratio at provincial/municipal aggregate level, 2012 and
2013 ..............................................................................................................................................45
Table 4: Overdue repayment ratio, as of end 2012 ...............................................................................46
Table 5: Operation model of LGFVs ....................................................................................................48
Table 6: China’s fiscal regimes since 1950 ...........................................................................................48
Table 7: Revenue sharing between China’s Central and local governments .........................................49
Table 8: Expenditure assignment between China’s Central and local governments .............................50
Table 9: Ishikawa diagram: hypotheses of causes of local governments’ excessive borrowings ..........51
Table 10: Predicted debt to GDP ratio in 2020, at provincial aggregate level ......................................52
Table 11: Predicted debt to fiscal revenue ratio in 2020, at provincial aggregate level ........................54
Table 12: Sources of local government debt, as of June 2013 ..............................................................55
Table 13: Summary of policy recommendations ..................................................................................56
Table 14: Summary of key policies on local government debt management, 2010-2015.....................58

iii
ACKNOWLEDGEMENT
I would like to thank Professor Jay Rosengard and Professor Eduardo Levy Yeyati for
their patient guidance and advice to write of this paper.
I appreciate my classmates Duygu Guven’s suggestions of this paper and Li Li’s help in
data visualization.
I also would like to express my gratitude to our Program Director Carol Finney for her
continuous support.
Finally, I would like to thank my family and friends for their continuous encouragement
during my studies at the Harvard Kennedy School.
iv
EXECUTIVE SUMMARY
China’s local government debt has increased quickly in recent years, especially at lower
level governments. Although the total size of the local government debt remains largely
controllable, it brings massive macroeconomic and financial risks.
China’s local governments do not borrow in a responsible manner. They repay debt by
new borrowings. They borrow to fund projects that cannot generate cash flows. Due to the
access to informal borrowing channels and land sales revenue, they care less about
expenditure efficiency and project productivity. This has contributed to China’s overcapacity
issue.
Confidence on the central governments’ bailouts, GDP-focused official promotion
mechanism, discretionary expenditure mandates by the central government, mismatch of the
revenue and the expenditure of the local governments, and incomplete financial market have
incentivized the local governments to expand spending regardless of their fiscal capacity.
Based on the international experience, China’s political regime and the current economic
context, the paper proposes the following policy recommendations to the Ministry of Finance
(MOF):
In short term (one year), the MOF shall focus on reducing the immediate risks. This
includes allowing the local governments to issue bond to replace existing bank loans and
requesting the local governments to clear their illegal contingent liabilities. The MOF shall
collaborate with the National Audit Office to conduct regular local government debt audit.
In medium term (three years), the MOF should set up an early warning system and a risk
classification mechanism. The MOF should increase the general transfer to the local
governments and define expenditure responsibilities. The MOF should work with the
Ministry of Organization to pilot debt management performance related local officials’
appraisal system.
In long term (five years), the MOF should lobby the top government agencies (especially
the National People’s Congress) to confirm hard budget constraints by law.
1
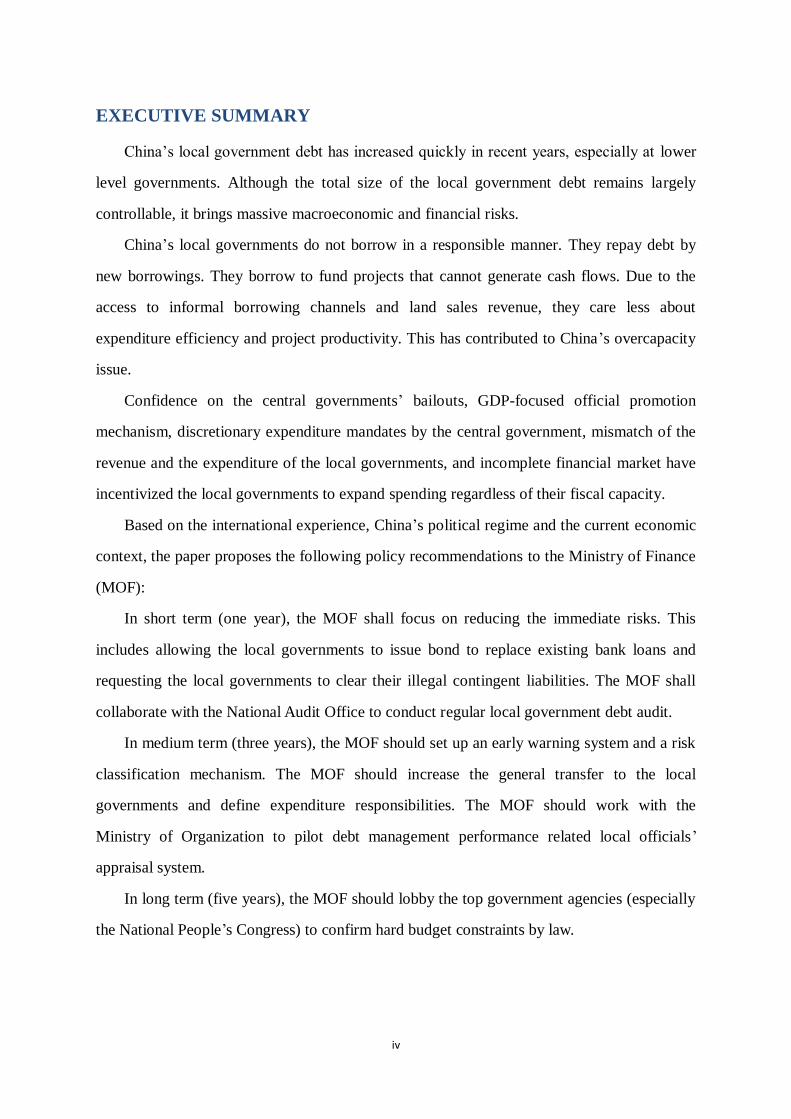
Figure 1: Local government debt increases quickly,
2010-2014
Source: author
Data source: NAO, National People’s Congress (NPC)
* There was no local government auditing in 2011.
SECTION I: Introduction and Background
Local government debt in China increases quickly, especially at lower level governments
China’s local government debt has
increased quickly in recent years. According
to the National Audit Office (NAO), the
total amount of the local government debt
was RMB 10.7 trillion (USD 1.65 trillion1)
by end 20102. It surged to RMB 15.9 trillion
(USD 2.45 trillion) and RMB 17.9 trillion
(USD 2.75 trillion) in 2012 and June 2013,
respectively. This suggested an average
annual growth of over 20 percent3. As of
end 2014, China’s local government debt
rocketed to RMB 24 trillion (USD 3.69
trillion), as the State Council (China’s Cabinet) revealed4. Among them, over 60 percent was
direct liabilities, and the rest was contingent liabilities5. Figure 1.
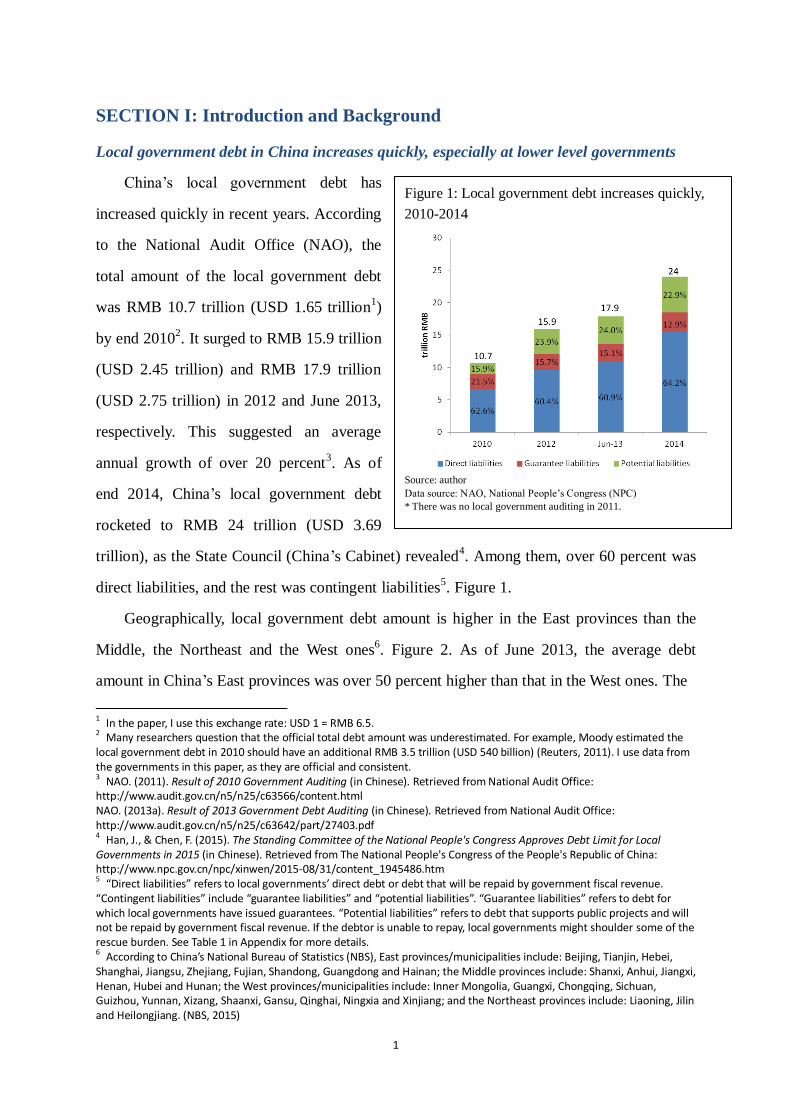
Geographically, local government debt amount is higher in the East provinces than the
Middle, the Northeast and the West ones6. Figure 2. As of June 2013, the average debt
amount in China’s East provinces was over 50 percent higher than that in the West ones. The
1 In the paper, I use this exchange rate: USD 1 = RMB 6.5. 2 Many researchers question that the official total debt amount was underestimated. For example, Moody estimated the local government debt in 2010 should have an additional RMB 3.5 trillion (USD 540 billion) (Reuters, 2011). I use data from the governments in this paper, as they are official and consistent. 3 NAO. (2011). Result of 2010 Government Auditing (in Chinese). Retrieved from National Audit Office:
http://www.audit.gov.cn/n5/n25/c63566/content.html NAO. (2013a). Result of 2013 Government Debt Auditing (in Chinese). Retrieved from National Audit Office: http://www.audit.gov.cn/n5/n25/c63642/part/27403.pdf 4 Han, J., & Chen, F. (2015). The Standing Committee of the National People's Congress Approves Debt Limit for Local Governments in 2015 (in Chinese). Retrieved from The National People's Congress of the People's Republic of China: http://www.npc.gov.cn/npc/xinwen/2015-08/31/content_1945486.htm 5 “Direct liabilities” refers to local governments’ direct debt or debt that will be repaid by government fiscal revenue.
“Contingent liabilities” include “guarantee liabilities” and “potential liabilities”. “Guarantee liabilities” refers to debt for which local governments have issued guarantees. “Potential liabilities” refers to debt that supports public projects and will not be repaid by government fiscal revenue. If the debtor is unable to repay, local governments might shoulder some of the rescue burden. See Table 1 in Appendix for more details. 6 According to China’s National Bureau of Statistics (NBS), East provinces/municipalities include: Beijing, Tianjin, Hebei, Shanghai, Jiangsu, Zhejiang, Fujian, Shandong, Guangdong and Hainan; the Middle provinces include: Shanxi, Anhui, Jiangxi, Henan, Hubei and Hunan; the West provinces/municipalities include: Inner Mongolia, Guangxi, Chongqing, Sichuan, Guizhou, Yunnan, Xizang, Shaanxi, Gansu, Qinghai, Ningxia and Xinjiang; and the Northeast provinces include: Liaoning, Jilin and Heilongjiang. (NBS, 2015)
2
Figure 2: Breakdown of local government debt, as of June 2013
Source: author; Data source: WIND
*The dotted lines show the average local government debt (including contingent liabilities) in the region.
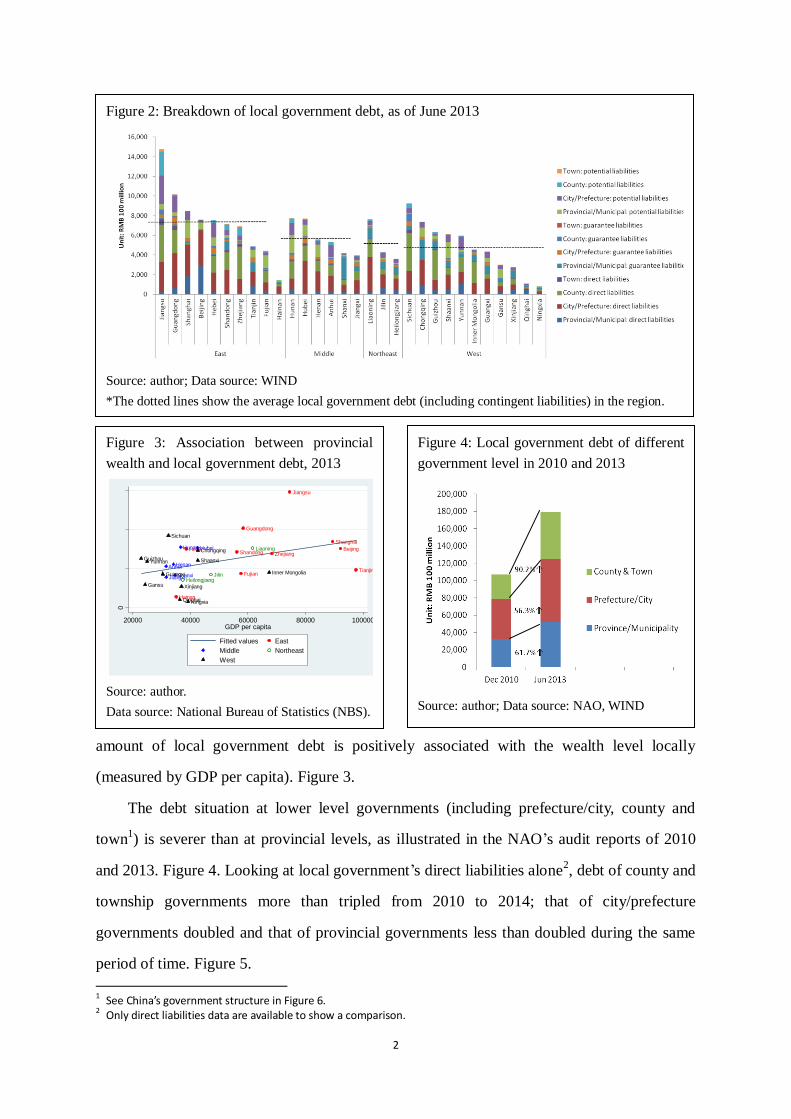
amount of local government debt is positively associated with the wealth level locally
(measured by GDP per capita). Figure 3.
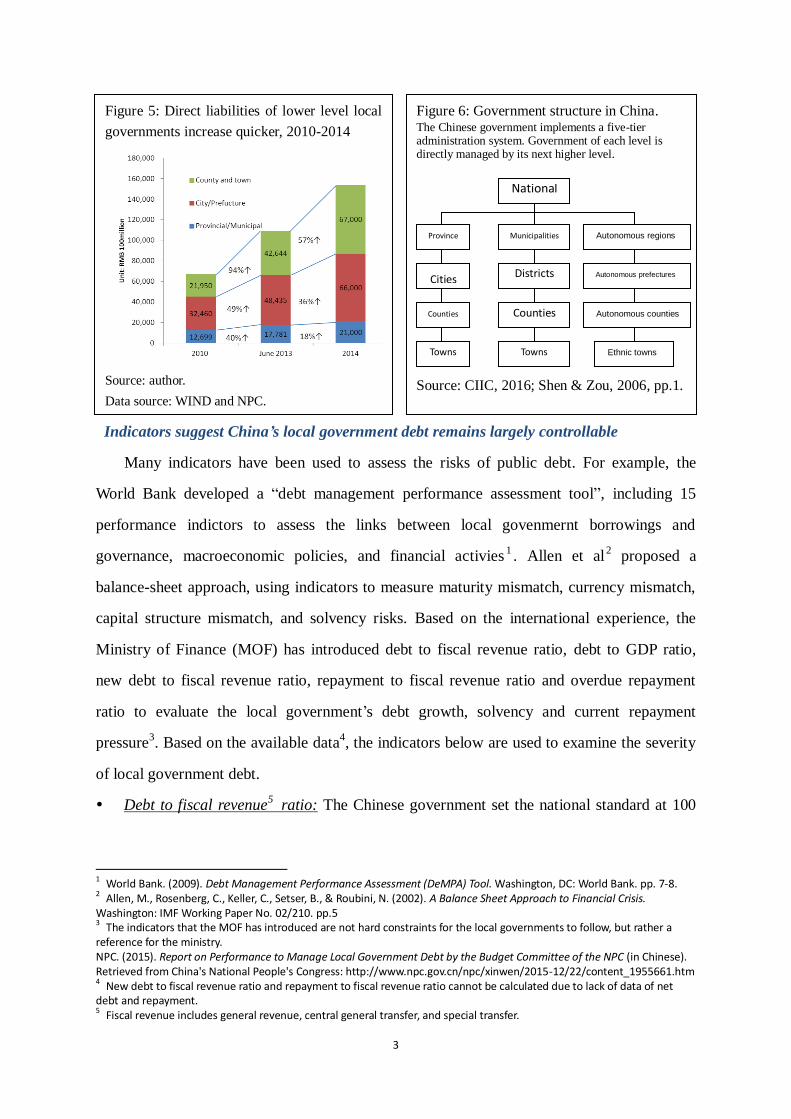
The debt situation at lower level governments (including prefecture/city, county and
town1) is severer than at provincial levels, as illustrated in the NAO’s audit reports of 2010
and 2013. Figure 4. Looking at local government’s direct liabilities alone2, debt of county and
township governments more than tripled from 2010 to 2014; that of city/prefecture
governments doubled and that of provincial governments less than doubled during the same
period of time. Figure 5.
1 See China’s government structure in Figure 6. 2 Only direct liabilities data are available to show a comparison.
Figure 3: Association between provincial
wealth and local government debt, 2013
Source: author.
Data source: National Bureau of Statistics (NBS).
Jiangsu
Guangdong
Shanghai
BeijingHebeiShandong Zhejiang
TianjinFujian
Hainan
Hunan Hubei
HenanAnhui
ShanxiJiangxi
Liaoning
JilinHeilongjiang
Sichuan
Chongqing
Guizhou ShaanxiYunnan
Inner MongoliaGuangxi
Gansu Xinjiang
QinghaiNingxia
0
5000
10000
15000
20000 40000 60000 80000 100000GDP per capita
Fitted values East
Middle Northeast
West
Figure 4: Local government debt of different
government level in 2010 and 2013
Source: author; Data source: NAO, WIND
3
Indicators suggest China’s local government debt remains largely controllable
Many indicators have been used to assess the risks of public debt. For example, the
World Bank developed a “debt management performance assessment tool”, including 15
performance indictors to assess the links between local govenmernt borrowings and
governance, macroeconomic policies, and financial activies1. Allen et al
2 proposed a
balance-sheet approach, using indicators to measure maturity mismatch, currency mismatch,
capital structure mismatch, and solvency risks. Based on the international experience, the
Ministry of Finance (MOF) has introduced debt to fiscal revenue ratio, debt to GDP ratio,
new debt to fiscal revenue ratio, repayment to fiscal revenue ratio and overdue repayment
ratio to evaluate the local government’s debt growth, solvency and current repayment
pressure3. Based on the available data
4, the indicators below are used to examine the severity
of local government debt.
Debt to fiscal revenue5 ratio: The Chinese government set the national standard at 100
1 World Bank. (2009). Debt Management Performance Assessment (DeMPA) Tool. Washington, DC: World Bank. pp. 7-8.
2 Allen, M., Rosenberg, C., Keller, C., Setser, B., & Roubini, N. (2002). A Balance Sheet Approach to Financial Crisis.
Washington: IMF Working Paper No. 02/210. pp.5 3 The indicators that the MOF has introduced are not hard constraints for the local governments to follow, but rather a reference for the ministry. NPC. (2015). Report on Performance to Manage Local Government Debt by the Budget Committee of the NPC (in Chinese). Retrieved from China's National People's Congress: http://www.npc.gov.cn/npc/xinwen/2015-12/22/content_1955661.htm 4 New debt to fiscal revenue ratio and repayment to fiscal revenue ratio cannot be calculated due to lack of data of net
debt and repayment. 5 Fiscal revenue includes general revenue, central general transfer, and special transfer.
Figure 5: Direct liabilities of lower level local
governments increase quicker, 2010-2014
Source: author.
Data source: WIND and NPC.
Figure 6: Government structure in China. The Chinese government implements a five-tier administration system. Government of each level is directly managed by its next higher level.
Source: CIIC, 2016; Shen & Zou, 2006, pp.1.
National
Towns Towns Ethnic towns
Province Municipalities Autonomous regions
Cities Districts Autonomous prefectures
Counties Counties Autonomous counties
4
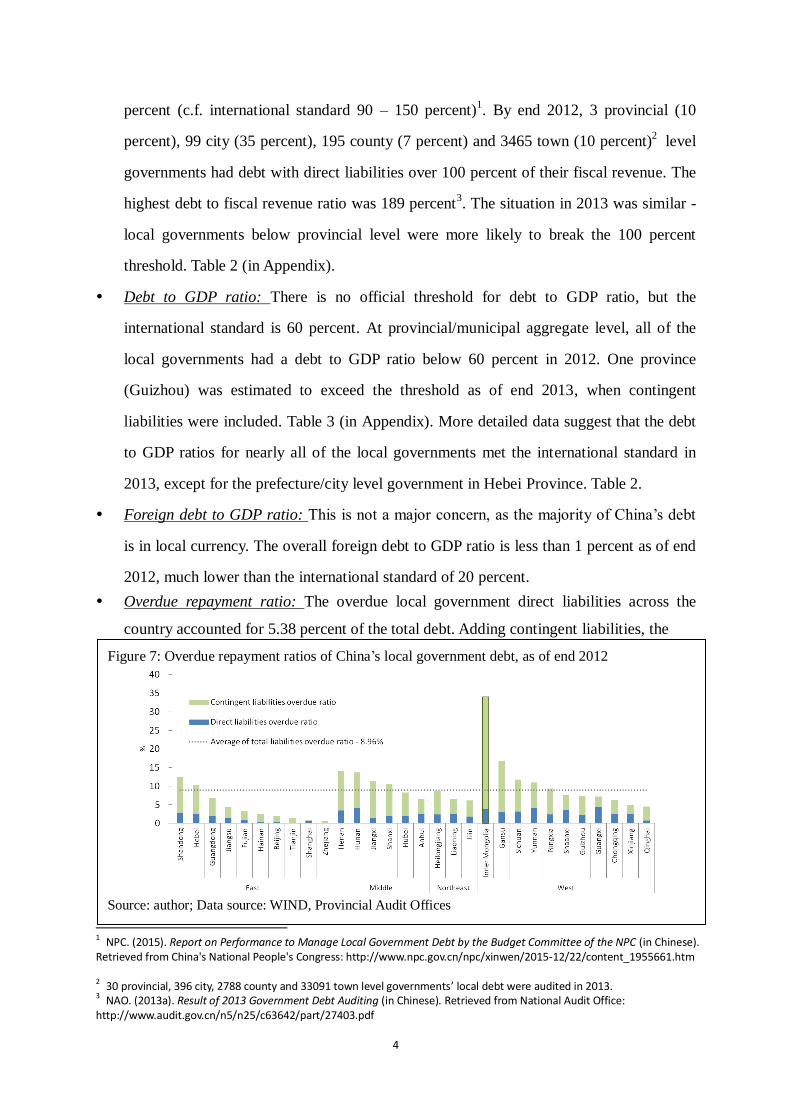
Figure 7: Overdue repayment ratios of China’s local government debt, as of end 2012
Source: author; Data source: WIND, Provincial Audit Offices
percent (c.f. international standard 90 – 150 percent)1. By end 2012, 3 provincial (10
percent), 99 city (35 percent), 195 county (7 percent) and 3465 town (10 percent)2 level
governments had debt with direct liabilities over 100 percent of their fiscal revenue. The
highest debt to fiscal revenue ratio was 189 percent3. The situation in 2013 was similar -
local governments below provincial level were more likely to break the 100 percent
threshold. Table 2 (in Appendix).
Debt to GDP ratio: There is no official threshold for debt to GDP ratio, but the
international standard is 60 percent. At provincial/municipal aggregate level, all of the
local governments had a debt to GDP ratio below 60 percent in 2012. One province
(Guizhou) was estimated to exceed the threshold as of end 2013, when contingent
liabilities were included. Table 3 (in Appendix). More detailed data suggest that the debt
to GDP ratios for nearly all of the local governments met the international standard in
2013, except for the prefecture/city level government in Hebei Province. Table 2.
Foreign debt to GDP ratio: This is not a major concern, as the majority of China’s debt
is in local currency. The overall foreign debt to GDP ratio is less than 1 percent as of end
2012, much lower than the international standard of 20 percent.
Overdue repayment ratio: The overdue local government direct liabilities across the
country accounted for 5.38 percent of the total debt. Adding contingent liabilities, the
1 NPC. (2015). Report on Performance to Manage Local Government Debt by the Budget Committee of the NPC (in Chinese).
Retrieved from China's National People's Congress: http://www.npc.gov.cn/npc/xinwen/2015-12/22/content_1955661.htm
2 30 provincial, 396 city, 2788 county and 33091 town level governments’ local debt were audited in 2013.
3 NAO. (2013a). Result of 2013 Government Debt Auditing (in Chinese). Retrieved from National Audit Office: http://www.audit.gov.cn/n5/n25/c63642/part/27403.pdf
5
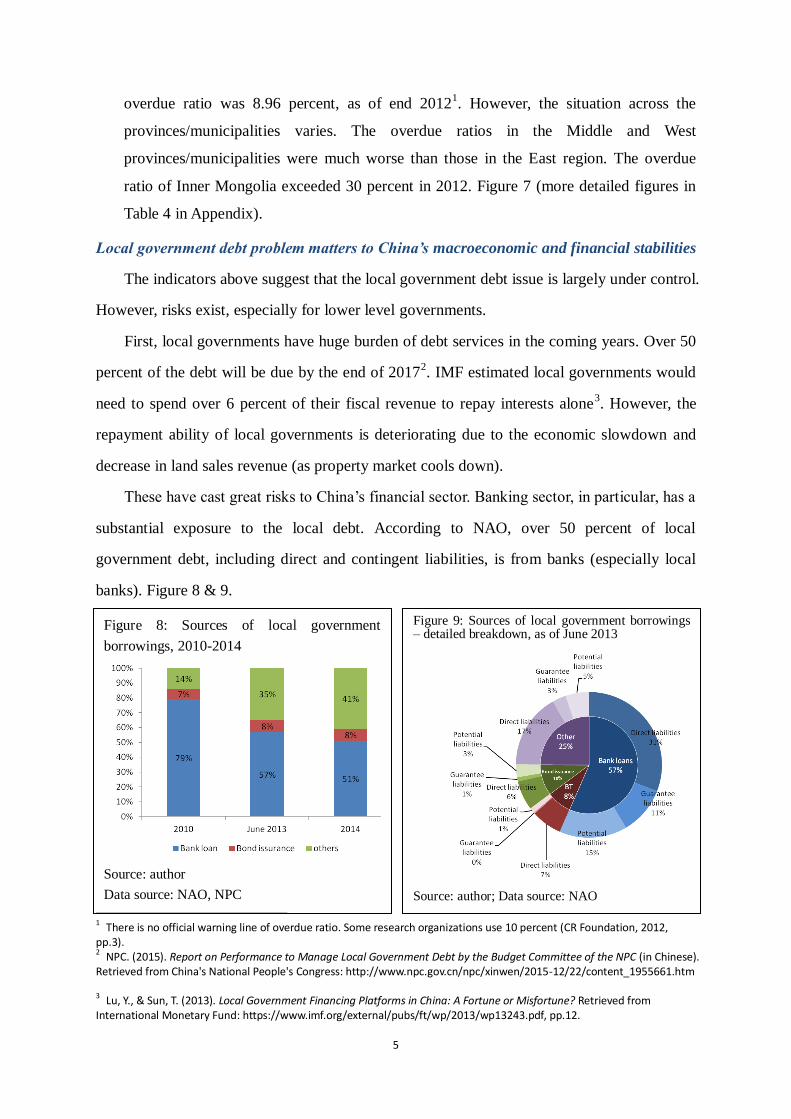
Figure 9: Sources of local government borrowings – detailed breakdown, as of June 2013
Source: author; Data source: NAO
Figure 8: Sources of local government
borrowings, 2010-2014
Source: author
Data source: NAO, NPC
overdue ratio was 8.96 percent, as of end 20121. However, the situation across the
provinces/municipalities varies. The overdue ratios in the Middle and West
provinces/municipalities were much worse than those in the East region. The overdue
ratio of Inner Mongolia exceeded 30 percent in 2012. Figure 7 (more detailed figures in
Table 4 in Appendix).
Local government debt problem matters to China’s macroeconomic and financial stabilities
The indicators above suggest that the local government debt issue is largely under control.
However, risks exist, especially for lower level governments.
First, local governments have huge burden of debt services in the coming years. Over 50
percent of the debt will be due by the end of 20172. IMF estimated local governments would
need to spend over 6 percent of their fiscal revenue to repay interests alone3. However, the
repayment ability of local governments is deteriorating due to the economic slowdown and
decrease in land sales revenue (as property market cools down).
These have cast great risks to China’s financial sector. Banking sector, in particular, has a
substantial exposure to the local debt. According to NAO, over 50 percent of local
government debt, including direct and contingent liabilities, is from banks (especially local
banks). Figure 8 & 9.
1 There is no official warning line of overdue ratio. Some research organizations use 10 percent (CR Foundation, 2012, pp.3). 2 NPC. (2015). Report on Performance to Manage Local Government Debt by the Budget Committee of the NPC (in Chinese). Retrieved from China's National People's Congress: http://www.npc.gov.cn/npc/xinwen/2015-12/22/content_1955661.htm
3 Lu, Y., & Sun, T. (2013). Local Government Financing Platforms in China: A Fortune or Misfortune? Retrieved from International Monetary Fund: https://www.imf.org/external/pubs/ft/wp/2013/wp13243.pdf, pp.12.
6
The close relationship between banks and public sector may create potential contagion
between the financial sector and sovereign. If any local government goes bankrupt, the
central government will eventually have to bail them out to lower the risk. This could incur
moral hazard problem, i.e. the local governments tend to borrow irresponsibly since they
know the Central government will step in. The Central government could have sufficient
resources at the moment, but it will face financial constraints in the future. These could
increase China’s sovereign risk1.
More broadly, huge debt could harm China’s macroeconomic structure. In short run,
increasing government spending can raise aggregate demand and output. But in long run, it
may crowd out private investment, change saving behaviour, and make the economy heavily
rely on public spending2.
Policy Questions: How to enhance local government borrowing responsibility?
Considering the huge debt amount, quick growth rate and significant impacts on China’s
financial and macroeconomic system, I aim to analyze sustainability of local government
debt, from the perspectives of revenue, expenditure, efficiency of public spending, maturity
and etc. Based on that, I will discuss policy options to enhance the responsibility of local
government borrowings.
The paper is organized as follows: Section II discusses a diagnostic framework. Section
III applies it to China’s scenario. Section VI proposes potential policy recommendations.
Section V analyzes how to make them implementable in China’s context. Section VI provides
a conclusion of policy recommendations.
1 Lu, Y., & Sun, T. (2013). Local Government Financing Platforms in China: A Fortune or Misfortune? Retrieved from International Monetary Fund: https://www.imf.org/external/pubs/ft/wp/2013/wp13243.pdf, pp. 14-16. 2 Ibid, pp. 16.
Elmendorf, D. W., & Mankiw, G. N. (1998). Government Debt. Retrieved from Board of Governors of Federal Reserve System: http://www.federalreserve.gov/pubs/feds/1998/199809/199809pap.pdf, pp.10-13.
7
SECTION II: Diagnostic Framework
There is rich literature measuring whether local governments borrow responsively.
Below is a quick summary of the key elements:
Purpose of borrowing: Borrowing is not always an appropriate financing strategy. A
guideline for responsible local borrowing is: increases in longer-term debt should be used to
finance increases in capital investment1.
Debt maturity: The period of debt repayment should approximate the useful life of the
capital project, so as to match the time profile of costs and benefits2.
Amount to borrow projection: An estimation or projection of local government borrowing
needs for investment spending is needed. The amount of debt should be within the locality’s
ability to repay. It should not crowd out private investment3.
Revenue4
A municipality’s capacity to take on new “general obligation” debt – debt secured by
the municipality’s general budget, depends largely on its present and anticipated
future operating saving. Extraordinary sources of capital income for a time may be
used to repay debt, but over the long run operating savings must be sufficient to
cover debt services with a margin of safety.
Fund financing involves dedicating the revenue stream from an investment project to
debt repayment. It is only feasible when it is administratively possible to charge
customers for service usage.
Local government budgets in most developing nations are highly dependent on
shared taxes and intergovernmental transfers. Need to have rules to determine the
total amount of transfer. Local governments should be involved in the design and
management of the intergovernmental transfer system.
1 The World Bank defines capital investment as “investment in the acquisition or building of new assets; or major repair
and replacement of existing assets that have an economic life longer than one year and a value above a specified threshold” (Olga, 2011, pp.3). Peterson, G.E. (2000). Building local credit systems. The World Bank. pp.6. 2 Ibid. pp.7. 3 Ibid. pp. 16. Alisjahbana, A. S., Soemitro, S., & Ramayandi, A. (2002). Local Government Borrowing: Regional University Research on Decentralization in Indonesia. IRIS Center of the URCI, University of Maryland at College Park. pp. 12-13. 4 Local governments’ revenue includes general revenue, project budget (special fund), and central government transfer.
8
A measure of autonomy for sub national governments on the revenue. This requires
sub national governments have the authority to own-finance locally provided
services at the margin.
Local credit systems: an assessment of existing sources and mechanism for local
government borrowings from foreign and domestic sources, from financial and
non-financial sector institutions sources.1
Expenditure
Clarity of roles and responsibilities between different levels of government. Define
the role of local government in service delivery.
A measure of autonomy for sub national governments on the expenditure (within
limits)2.
Efficiency and productivity of local government borrowing
Use of market determined interest rates in lending has been found generally to be
positively correlated with average investment returns
Whether governments provides guarantee influences on the efficiency and
productivity of local government borrowings3.
Institution building: A prerequisite for successful decentralization is that sub national
governments possess the administrative and technical capacity required to effectively carry
out their assigned responsibility. Supporting institutions include democratic representation,
sound budget processes, local government revenue collection capacity, and mechanisms to
ensure coordination and cooperation between different levels of government4.
1 Peterson, G. E. (2000). Building local credit systems. The World Bank. pp. 7, 12-14. Yilmaz, S., Beris, Y., & Serrano-Berthet, R. (2008). Local Government Discretion and Accountability: A Diagnostic Framework for Local Governance. The World Bank. pp. 21-23. Alisjahbana, A. S., Soemitro, S., & Ramayandi, A. (2002). Local Government Borrowing: Regional University Research on Decentralization in Indonesia. IRIS Center of the URCI, University of Maryland at College Park. pp. 12-13. 2 Dabla-Norris, E., & Wade, P. (2002). The Challenge of Fiscal Decentralization in Transition Countries. International Monetary Fund. pp. 14-15. Kee, J. E. (2003). Fiscal Decentralization: Theory as Reform. The George Washington University. pp. 4. Yilmaz, S., Beris, Y., & Serrano-Berthet, R. (2008). Local Government Discretion and Accountability: A Diagnostic Framework for Local Governance. The World Bank. pp. 21. 3 Peterson, G. E. (2000). Building local credit systems. The World Bank. pp. 13.
4 Dabla-Norris, E., & Wade, P. (2002). The Challenge of Fiscal Decentralization in Transition Countries. International Monetary Fund. pp. 15.
9
Figure 10: Purpose of local government
borrowings (direct and contingent liabilities),
2010 and 2013
Source: author. Data source: WIND
SECTION III: Analysis of China’s Local Government Debt within the
Diagnostic Framework
China’s local governments are not borrowing in a responsible way
Applying the diagnostic framework to China’s local government debt situation:
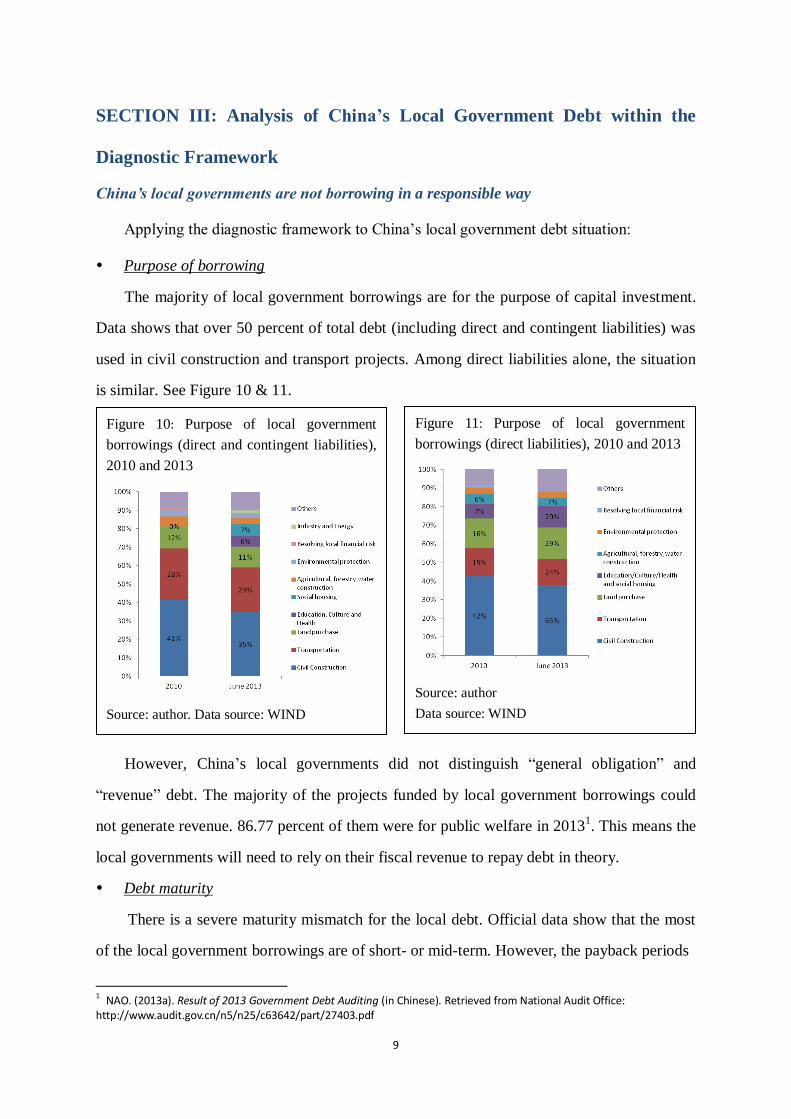
Purpose of borrowing
The majority of local government borrowings are for the purpose of capital investment.
Data shows that over 50 percent of total debt (including direct and contingent liabilities) was
used in civil construction and transport projects. Among direct liabilities alone, the situation
is similar. See Figure 10 & 11.
However, China’s local governments did not distinguish “general obligation” and
“revenue” debt. The majority of the projects funded by local government borrowings could
not generate revenue. 86.77 percent of them were for public welfare in 20131. This means the
local governments will need to rely on their fiscal revenue to repay debt in theory.
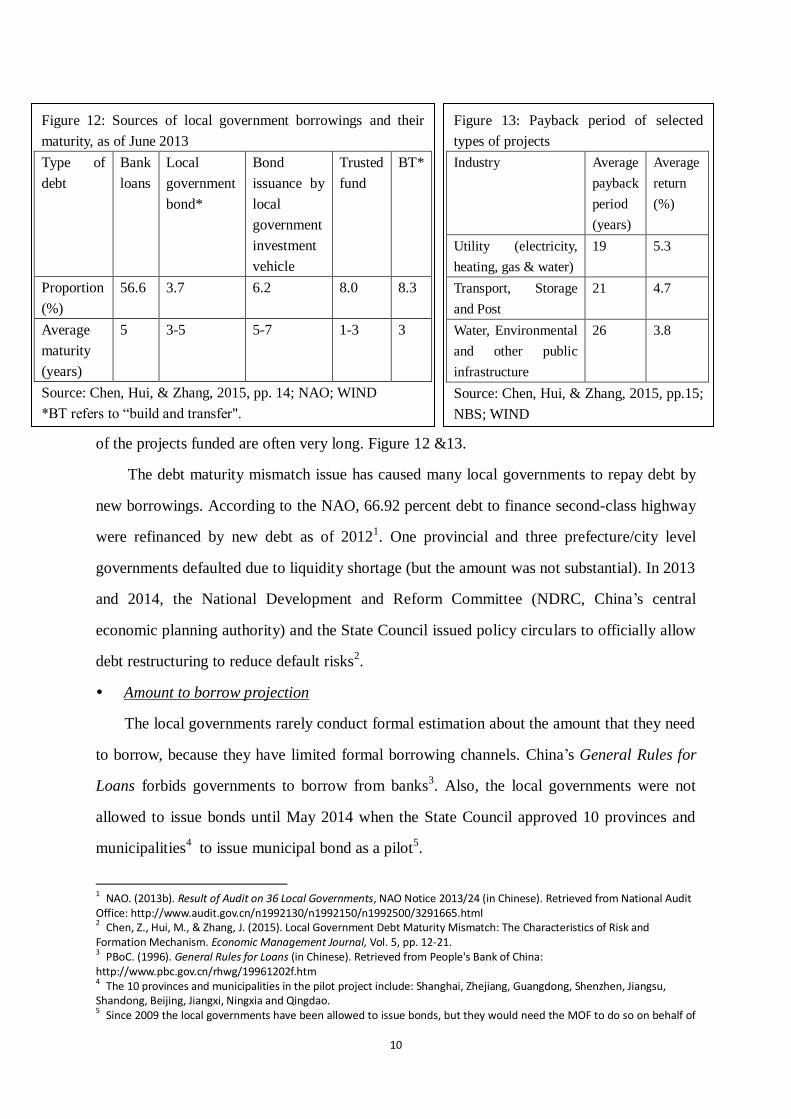
Debt maturity
There is a severe maturity mismatch for the local debt. Official data show that the most
of the local government borrowings are of short- or mid-term. However, the payback periods
1 NAO. (2013a). Result of 2013 Government Debt Auditing (in Chinese). Retrieved from National Audit Office: http://www.audit.gov.cn/n5/n25/c63642/part/27403.pdf
Figure 11: Purpose of local government
borrowings (direct liabilities), 2010 and 2013
Source: author
Data source: WIND
10
of the projects funded are often very long. Figure 12 &13.
The debt maturity mismatch issue has caused many local governments to repay debt by
new borrowings. According to the NAO, 66.92 percent debt to finance second-class highway
were refinanced by new debt as of 20121. One provincial and three prefecture/city level
governments defaulted due to liquidity shortage (but the amount was not substantial). In 2013
and 2014, the National Development and Reform Committee (NDRC, China’s central
economic planning authority) and the State Council issued policy circulars to officially allow
debt restructuring to reduce default risks2.
Amount to borrow projection
The local governments rarely conduct formal estimation about the amount that they need
to borrow, because they have limited formal borrowing channels. China’s General Rules for
Loans forbids governments to borrow from banks3. Also, the local governments were not
allowed to issue bonds until May 2014 when the State Council approved 10 provinces and
municipalities4 to issue municipal bond as a pilot
5.
1 NAO. (2013b). Result of Audit on 36 Local Governments, NAO Notice 2013/24 (in Chinese). Retrieved from National Audit
Office: http://www.audit.gov.cn/n1992130/n1992150/n1992500/3291665.html 2 Chen, Z., Hui, M., & Zhang, J. (2015). Local Government Debt Maturity Mismatch: The Characteristics of Risk and Formation Mechanism. Economic Management Journal, Vol. 5, pp. 12-21. 3 PBoC. (1996). General Rules for Loans (in Chinese). Retrieved from People's Bank of China: http://www.pbc.gov.cn/rhwg/19961202f.htm 4 The 10 provinces and municipalities in the pilot project include: Shanghai, Zhejiang, Guangdong, Shenzhen, Jiangsu,
Shandong, Beijing, Jiangxi, Ningxia and Qingdao. 5 Since 2009 the local governments have been allowed to issue bonds, but they would need the MOF to do so on behalf of
Figure 13: Payback period of selected
types of projects
Industry Average
payback
period
(years)
Average
return
(%)
Utility (electricity,
heating, gas & water)
19 5.3
Transport, Storage
and Post
21 4.7
Water, Environmental
and other public
infrastructure
26 3.8
Source: Chen, Hui, & Zhang, 2015, pp.15;
NBS; WIND
Figure 12: Sources of local government borrowings and their
maturity, as of June 2013
Type of
debt
Bank
loans
Local
government
bond*
Bond
issuance by
local
government
investment
vehicle
Trusted
fund
BT*
Proportion
(%)
56.6 3.7 6.2 8.0 8.3
Average
maturity
(years)
5 3-5 5-7 1-3 3
Source: Chen, Hui, & Zhang, 2015, pp. 14; NAO; WIND
*BT refers to “build and transfer".
11
Therefore, the local governments creatively established arms-length investment vehicles,
or so called “local government financing vehicles (LGFVs)”, to borrow from banks and the
capital market. For example, when a local government needed to finance a public
infrastructure project, they could ask the developer or the constructor to collaborate with an
existing or a new LGFV to finance. The LGFVs could borrow from banks or issue bonds or
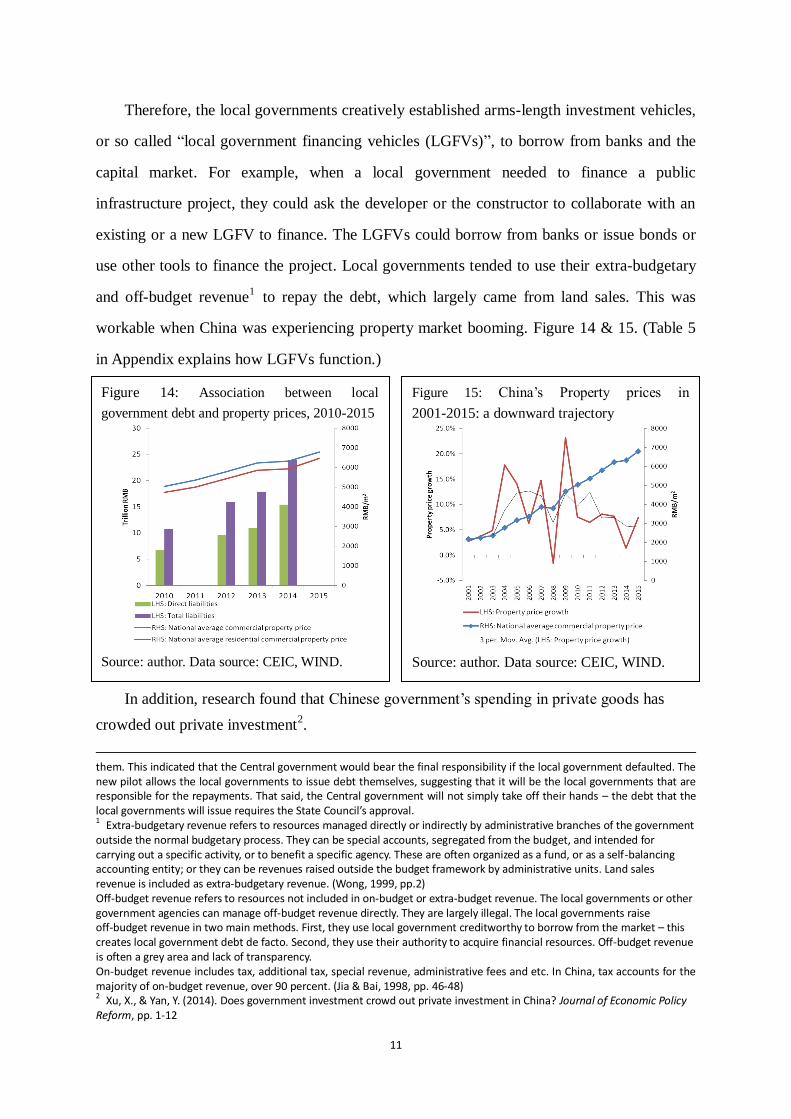
use other tools to finance the project. Local governments tended to use their extra-budgetary
and off-budget revenue1 to repay the debt, which largely came from land sales. This was
workable when China was experiencing property market booming. Figure 14 & 15. (Table 5
in Appendix explains how LGFVs function.)
In addition, research found that Chinese government’s spending in private goods has
crowded out private investment2.
them. This indicated that the Central government would bear the final responsibility if the local government defaulted. The new pilot allows the local governments to issue debt themselves, suggesting that it will be the local governments that are responsible for the repayments. That said, the Central government will not simply take off their hands – the debt that the local governments will issue requires the State Council’s approval. 1 Extra-budgetary revenue refers to resources managed directly or indirectly by administrative branches of the government outside the normal budgetary process. They can be special accounts, segregated from the budget, and intended for carrying out a specific activity, or to benefit a specific agency. These are often organized as a fund, or as a self-balancing accounting entity; or they can be revenues raised outside the budget framework by administrative units. Land sales revenue is included as extra-budgetary revenue. (Wong, 1999, pp.2) Off-budget revenue refers to resources not included in on-budget or extra-budget revenue. The local governments or other government agencies can manage off-budget revenue directly. They are largely illegal. The local governments raise off-budget revenue in two main methods. First, they use local government creditworthy to borrow from the market – this creates local government debt de facto. Second, they use their authority to acquire financial resources. Off-budget revenue is often a grey area and lack of transparency. On-budget revenue includes tax, additional tax, special revenue, administrative fees and etc. In China, tax accounts for the majority of on-budget revenue, over 90 percent. (Jia & Bai, 1998, pp. 46-48) 2 Xu, X., & Yan, Y. (2014). Does government investment crowd out private investment in China? Journal of Economic Policy Reform, pp. 1-12
Figure 14: Association between local
government debt and property prices, 2010-2015
Source: author. Data source: CEIC, WIND.
Figure 15: China’s Property prices in
2001-2015: a downward trajectory
Source: author. Data source: CEIC, WIND.
12
Figure 16: Local government debt’s reliance
on land sales: land sales that the local
governments promised to repay debt, as of
2012
Land sales to
total debt
ratio
(%)
Land sales to
direct
liabilities
ratio
(%)
Zhejiang 46.31 66.27
Tianjin n.a. 64.56
Beijing 51.66 60.30
Fujian 29.80 57.13
Hainan 42.21 57.13
Chongqing 23.30 50.89
Jiangxi 28.78 46.72
Shanghai 26.90 44.06
Hubei 27.02 42.99
Sichuan 26.56 40.00
Liaoning 28.54 38.91
Guangxi 18.85 38.09
Shandong 22.47 37.84
Jiangsu 7.46 37.48
Anhui 20.10 36.21
Heilongjiang 20.00 36.10
Hunan 13.51 30.87
Guangdong 17.50 26.99
Shaanxi 11.57 26.73
Jilin 14.55 22.99
Gansu 8.39 22.40
Hebei 11.65 22.13
Shanxi n.a. 20.67
Henan n.a. n.a.
Guizhou n.a. n.a.
Yunnan n.a. n.a.
Qinghai n.a. n.a.
Ningxia n.a. n.a.
Xinjiang n.a. n.a.
Inner
Mongolia n.a. n.a.
Source: author; Data source: WIND
Figure 17: Trend of land sales revenue for local
governments, 2010-2014
Source: author; Data source: CEIC
Revenue
As examined above, a large number of local governments below provincial/municipal
level are having a debt to fiscal revenue ratio
exceeding the national warning line (100 percent).
On-budget fiscal revenue, including general
revenue, central general transfer and special
transfer, is not sufficient to repay the debt.
Many local governments have heavily relied
on land sales to repay their debt. As Figure 16
shows, land sales of all the
provinces/municipalities (with available data)
accounted for over 20 percent of debt repayment
resources. Over 50 percent of debt repayment in
Zhejiang, Tianjin,Beijing, Fujian, Hainan and
Chongqing would be covered by land sales
revenue. However, this is no longer a sustainable
resource. Due to the property market cooling
policies and recent economic slowdown, land
sales as a proportion of local government revenue
have been on a downward trajectory. Figure 17.
13
The local governments’ financing in formal ways is expected to be enhanced since they
are now allowed to issue municipal bonds for themselves. In addition, the MOF aims to
clarify general obligation and revenue bonds1. This potentially can offset their increasing
revenue pressure due to land sales slowdown.
Regarding local credit rating, the MOF2 has requested local governments to hire
credible companies3 to provide credit rating before they issue municipal bonds. Due to the
sensitivity of the issue, the Chinese government inclined to rely on Chinese credit rating
companies4. So far all the local governments in the pilot have gain a credit rating of AAA.
This might be reasonable, because the local governments in the pilot are well selected by the
MOF. They are all of provincial and municipal level. And they have relatively sound fiscal
performance. Moreover, the market still believes that the Central government will back the
local governments if defaults happen5. The MOF has urged the credit rating companies to
improve their services6.
Expenditure
According to China’s Constitution, roles and responsibilities among different level
governments should follow the Central government’s mandates. The State Council defines
detailed responsibilities for governments of different levels. However, in reality there is no
clear spending responsibilities separation (except for foreign affairs and national defence
expenditures). If some issues could be managed by the Central and local governments
simultaneously, no agency would claim responsibility. Sometimes the Central government is
not taking the responsibility of the expenditure items that fall in its realm, e.g. cross-regional
pollution or cross-regional justice management. Thus, the local governments have to
1 MOF. (2014a). Method to Include Existing Local Government Debt into Budgetary Management (in Chinese). Retrieved from China's Ministry of Finance: http://yss.mof.gov.cn/zhengwuxinxi/zhengceguizhang/201410/t20141028_1154561.html 2 MOF. (2014b). Guidance on Credit Rating for Local Government Bond Issuance Pilot in 2014 (in Chinese). Retrieved from China's Ministry of Finance: http://gks.mof.gov.cn/redianzhuanti/guozaiguanli/gzglzcfg/201406/t20140611_1097736.html 3 There are over hundreds of credit rating companies in China. Among them, there are five major ones: China Chengxin
Credit Rating Group, Dagong Global Credit Rating Corporate, China Lianhe Credit Rating Corporate, Pengyuan Credit Rating Corporate, and Shanghai Brilliance Credit Rating & Investors Service Corporate. 4 Wang, C. (2015). Urgent to Establish China's Credit Rating System (in Chinese). Retrieved from China Academy of Social Sciences: http://www.china.com.cn/opinion/think/2015-05/06/content_35499448.htm 5 Chen, Y. (2015). Why All Local Governments Receive AAA Credit Rating? (in Chinese). Retrieved from China Business Network: www.yicai.com/news/2015/06/4631886.html 6 MOF. (2015). Notice on Local Government General Obligation Bond Issuance in 2015 (in Chinese). Retrieved from China's
Ministry of Finance: http://gks.mof.gov.cn/redianzhuanti/guozaiguanli/difangzhengfuzhaiquan/201503/t20150320_1205024.html
14
financially cover these activities, but with very low incentives. Sometimes the Central
government is in charge of the issues that could be decentralized, e.g. rural toilet projects.
Due to the vague separation of expenditure responsibilities, there is a huge negotiation room
among different levels of governments. This has further enhanced the uncertainty of service
delivery1.
Efficiency and productivity of projects funded by local government borrowings
Low efficiency and productivity of local government investment has been a major
concern. Shen & Zhang2 revealed a decreasing efficiency (measured by marginal capital
production) trend from 1990 to 2011. Zhang & Sun3 had very similar findings based on
regression analysis and attributed the reasons to the neglect of project feasibility studies and
project implementation monitoring. Wang & Zhang4 interestingly revealed a positive
assocition between fiscal decentralization and government investment efficiency, and a
negative relation between extrabudgetary revenues and effiency in China. The NAO also
acknowledged the low efficiency of investment financed by the local government debt, and
the local government officials’ corruption activitied linked with debt financing5.
Overcapacity, as a result of low investment efficiency, has received the Chinese top
leaders’ attention. Since the beginning of 2016, Premier Li Keqiang has reiterated to cut
excessive capacity, especially in steal and coal industries. However, as those industries are
usually big local tax contributors, local officials are reluctant to reduce the production.
Regarding collaterals, RMB 46.5 billion (USD 7.1 billion) of local government debt was
raised with illegal local government guarantees6
in 2010, involving 7
provinces/municipalities (23 percent), 40 prefectures/cities (10 percent), and 107 counties (4
percent). This number increased to RMB 335.9 billion (USD 51.8 billion) in 2012. The
1 Lou, J. (2014). Promoting Institutionalization and Legalization of Administrative Powers between Governments of Different Levels (in Chinese). Retrieved from China's Ministry of Finance: http://www.mof.gov.cn/zhengwuxinxi/caizhengxinwen/201412/t20141202_1162071.html 2 Shen, L., & Zhang, H. (2013). Study on Motives and Necessity of Local Government Investment: Evidence from the 4
Trillion Stimulus Package (in Chinese). Journal of Dongbei University of Finance and Economics, Vol. 2, pp. 70-74. 3 Zhang, R., & Sun, L. (2012). Evidence on Fiscal Decentralization's Impact on the Efficiency of Local Government Investment (in Chinese). Informationization of Management in China. Vol. 15, pp. 25-27. 4 Wang,L., & Zhang,H. (2013). Fiscal Decentralization, Transfer and Local Governments' Investment Efficiency (in Chinese).
Contemporary Finance and Economics, Vol.6, pp.30-31. 5 Zou, X. (2013). Study on Allowing Local Government's Debt Financing in China (in Chinese). Retrieved from China's National Audit Office: http://www.audit.gov.cn/n6/n39/n61/c1381/content.html 6 “Illegal local government guarantees” including improper collaterals (e.g. fiscal revenue or public assets) and no tangible collaterals.
15
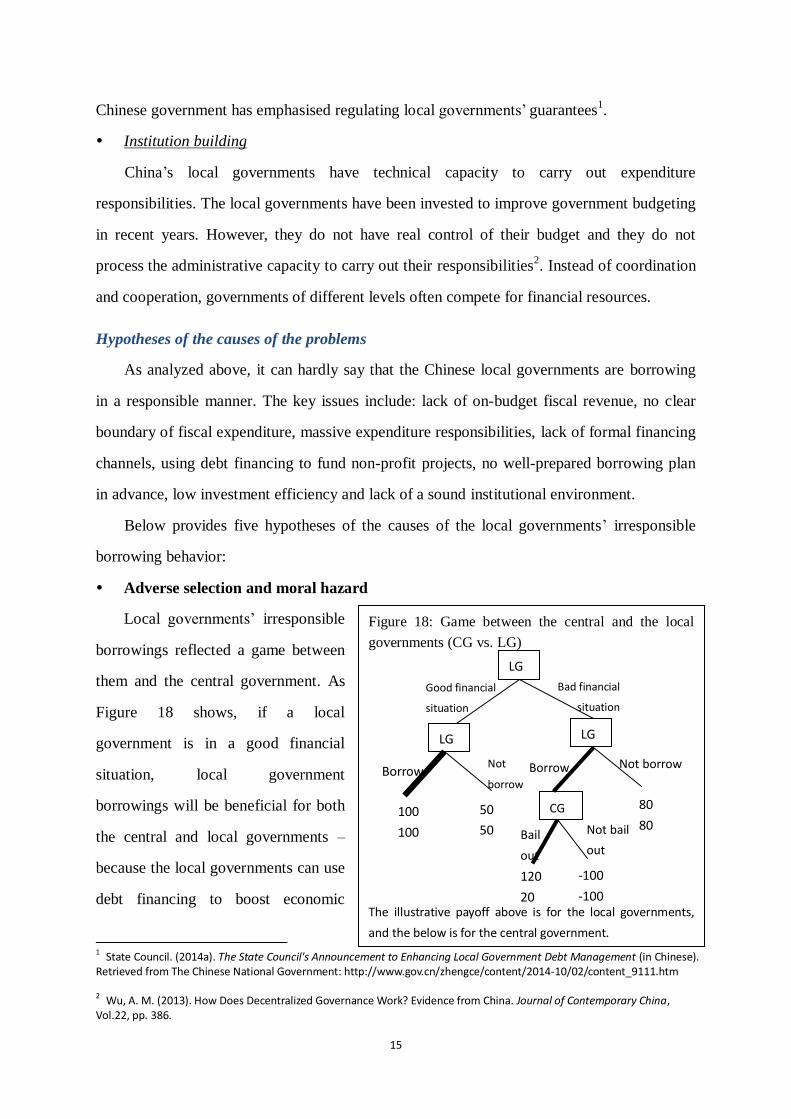
Figure 18: Game between the central and the local
governments (CG vs. LG)
The illustrative payoff above is for the local governments,
and the below is for the central government.
Chinese government has emphasised regulating local governments’ guarantees1.
Institution building
China’s local governments have technical capacity to carry out expenditure
responsibilities. The local governments have been invested to improve government budgeting
in recent years. However, they do not have real control of their budget and they do not
process the administrative capacity to carry out their responsibilities2. Instead of coordination
and cooperation, governments of different levels often compete for financial resources.
Hypotheses of the causes of the problems
As analyzed above, it can hardly say that the Chinese local governments are borrowing
in a responsible manner. The key issues include: lack of on-budget fiscal revenue, no clear
boundary of fiscal expenditure, massive expenditure responsibilities, lack of formal financing
channels, using debt financing to fund non-profit projects, no well-prepared borrowing plan
in advance, low investment efficiency and lack of a sound institutional environment.
Below provides five hypotheses of the causes of the local governments’ irresponsible
borrowing behavior:
Adverse selection and moral hazard
Local governments’ irresponsible
borrowings reflected a game between
them and the central government. As
Figure 18 shows, if a local
government is in a good financial
situation, local government
borrowings will be beneficial for both
the central and local governments –
because the local governments can use
debt financing to boost economic
1 State Council. (2014a). The State Council's Announcement to Enhancing Local Government Debt Management (in Chinese). Retrieved from The Chinese National Government: http://www.gov.cn/zhengce/content/2014-10/02/content_9111.htm
2 Wu, A. M. (2013). How Does Decentralized Governance Work? Evidence from China. Journal of Contemporary China, Vol.22, pp. 386.
100
100
50
50
LG LG
LG
Good financial
situation
Bad financial
situation
Borrow Not
borrow
Borrow Not borrow
80
80 CG
Not bail
out Bail
out
120
20
-100
-100
16
growth and they will be able to repay the debt. If a local government is in a bad financial
situation, it will also choose to borrow, because the local government officials know that the
central government will choose to bail them out to reduce financial and macroeconomic risks.
Compared with not borrowing, the local officials will gain more if they borrow, because they
can support local economic performance via debt financing (if they use the borrowing to
finance economic activities) or they can gain personal benefit (if they corrupt). Thus, no
matter the local governments are in good or bad financial status, they will choose to borrow.
The ones in bad situation will be more inclined to borrow (adverse selection). And the local
governments do not have a strong incentive to repay principal or interests, because the local
debt is essentially backed by the central government (moral hazard).
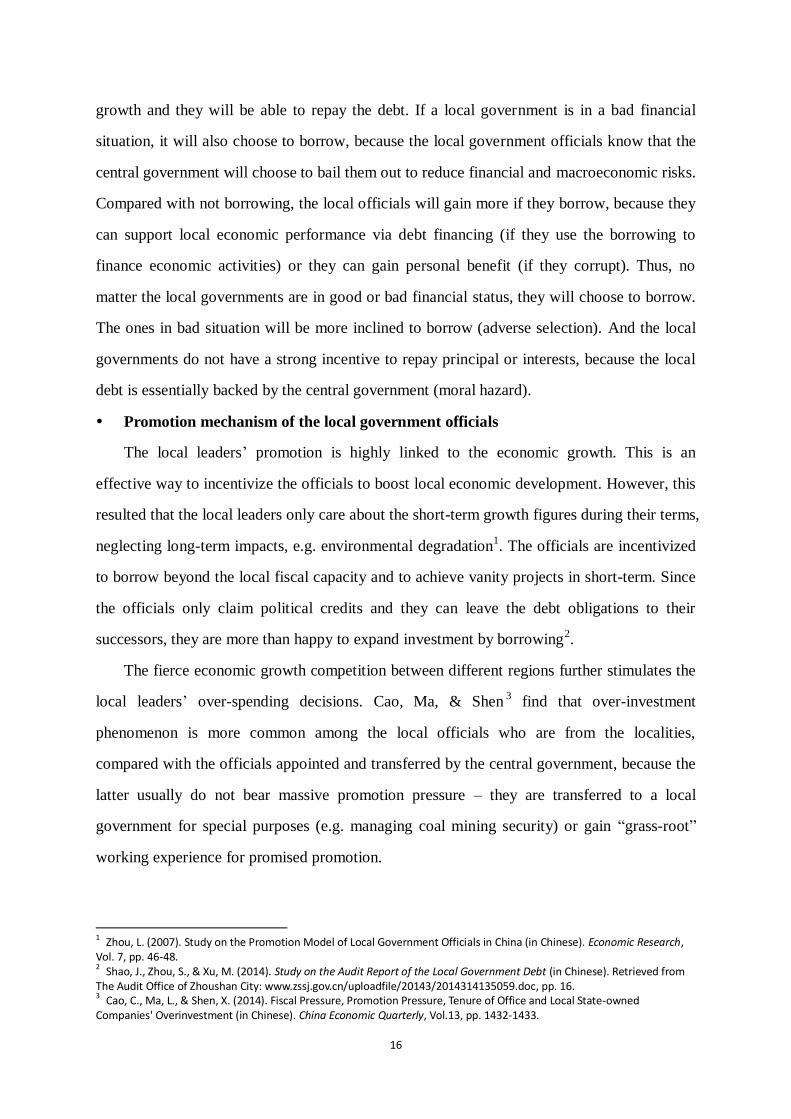
Promotion mechanism of the local government officials
The local leaders’ promotion is highly linked to the economic growth. This is an
effective way to incentivize the officials to boost local economic development. However, this
resulted that the local leaders only care about the short-term growth figures during their terms,
neglecting long-term impacts, e.g. environmental degradation1. The officials are incentivized
to borrow beyond the local fiscal capacity and to achieve vanity projects in short-term. Since
the officials only claim political credits and they can leave the debt obligations to their
successors, they are more than happy to expand investment by borrowing2.
The fierce economic growth competition between different regions further stimulates the
local leaders’ over-spending decisions. Cao, Ma, & Shen3 find that over-investment
phenomenon is more common among the local officials who are from the localities,
compared with the officials appointed and transferred by the central government, because the
latter usually do not bear massive promotion pressure – they are transferred to a local
government for special purposes (e.g. managing coal mining security) or gain “grass-root”
working experience for promised promotion.
1 Zhou, L. (2007). Study on the Promotion Model of Local Government Officials in China (in Chinese). Economic Research,
Vol. 7, pp. 46-48. 2 Shao, J., Zhou, S., & Xu, M. (2014). Study on the Audit Report of the Local Government Debt (in Chinese). Retrieved from The Audit Office of Zhoushan City: www.zssj.gov.cn/uploadfile/20143/2014314135059.doc, pp. 16. 3 Cao, C., Ma, L., & Shen, X. (2014). Fiscal Pressure, Promotion Pressure, Tenure of Office and Local State-owned Companies' Overinvestment (in Chinese). China Economic Quarterly, Vol.13, pp. 1432-1433.
17
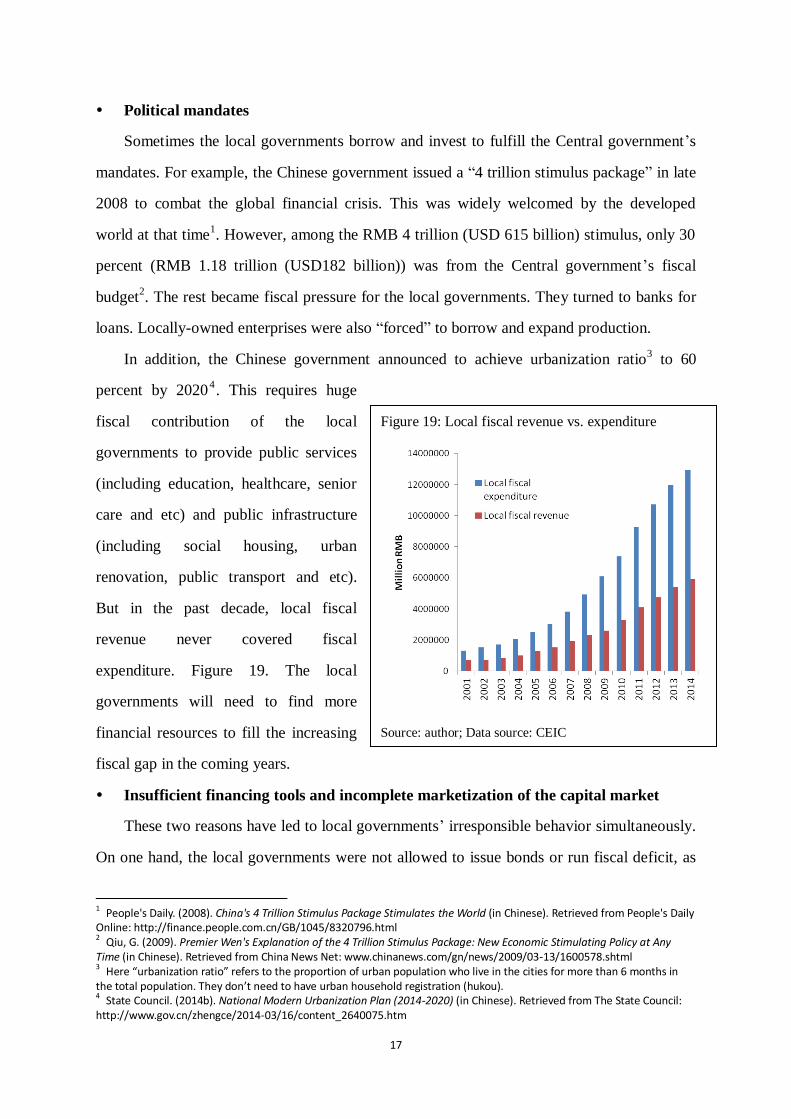
Figure 19: Local fiscal revenue vs. expenditure
Source: author; Data source: CEIC
Political mandates
Sometimes the local governments borrow and invest to fulfill the Central government’s
mandates. For example, the Chinese government issued a “4 trillion stimulus package” in late
2008 to combat the global financial crisis. This was widely welcomed by the developed
world at that time1. However, among the RMB 4 trillion (USD 615 billion) stimulus, only 30
percent (RMB 1.18 trillion (USD182 billion)) was from the Central government’s fiscal
budget2. The rest became fiscal pressure for the local governments. They turned to banks for
loans. Locally-owned enterprises were also “forced” to borrow and expand production.
In addition, the Chinese government announced to achieve urbanization ratio3 to 60
percent by 20204. This requires huge
fiscal contribution of the local
governments to provide public services
(including education, healthcare, senior
care and etc) and public infrastructure
(including social housing, urban
renovation, public transport and etc).
But in the past decade, local fiscal
revenue never covered fiscal
expenditure. Figure 19. The local
governments will need to find more
financial resources to fill the increasing
fiscal gap in the coming years.
Insufficient financing tools and incomplete marketization of the capital market
These two reasons have led to local governments’ irresponsible behavior simultaneously.
On one hand, the local governments were not allowed to issue bonds or run fiscal deficit, as
1 People's Daily. (2008). China's 4 Trillion Stimulus Package Stimulates the World (in Chinese). Retrieved from People's Daily Online: http://finance.people.com.cn/GB/1045/8320796.html 2 Qiu, G. (2009). Premier Wen's Explanation of the 4 Trillion Stimulus Package: New Economic Stimulating Policy at Any
Time (in Chinese). Retrieved from China News Net: www.chinanews.com/gn/news/2009/03-13/1600578.shtml 3 Here “urbanization ratio” refers to the proportion of urban population who live in the cities for more than 6 months in the total population. They don’t need to have urban household registration (hukou). 4 State Council. (2014b). National Modern Urbanization Plan (2014-2020) (in Chinese). Retrieved from The State Council: http://www.gov.cn/zhengce/2014-03/16/content_2640075.htm
18
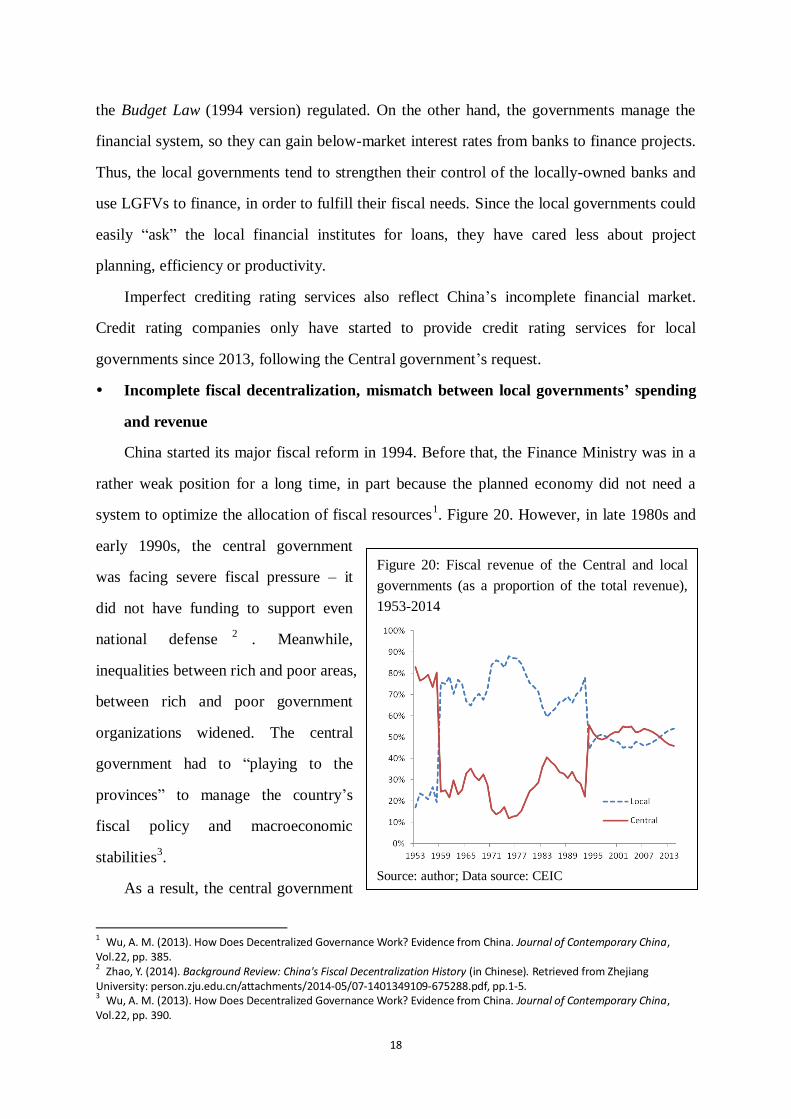
Figure 20: Fiscal revenue of the Central and local
governments (as a proportion of the total revenue),
1953-2014
Source: author; Data source: CEIC
the Budget Law (1994 version) regulated. On the other hand, the governments manage the
financial system, so they can gain below-market interest rates from banks to finance projects.
Thus, the local governments tend to strengthen their control of the locally-owned banks and
use LGFVs to finance, in order to fulfill their fiscal needs. Since the local governments could
easily “ask” the local financial institutes for loans, they have cared less about project
planning, efficiency or productivity.
Imperfect crediting rating services also reflect China’s incomplete financial market.
Credit rating companies only have started to provide credit rating services for local
governments since 2013, following the Central government’s request.
Incomplete fiscal decentralization, mismatch between local governments’ spending
and revenue
China started its major fiscal reform in 1994. Before that, the Finance Ministry was in a
rather weak position for a long time, in part because the planned economy did not need a
system to optimize the allocation of fiscal resources1. Figure 20. However, in late 1980s and
early 1990s, the central government
was facing severe fiscal pressure – it
did not have funding to support even
national defense2
. Meanwhile,
inequalities between rich and poor areas,
between rich and poor government
organizations widened. The central
government had to “playing to the
provinces” to manage the country’s
fiscal policy and macroeconomic
stabilities3.
As a result, the central government
1 Wu, A. M. (2013). How Does Decentralized Governance Work? Evidence from China. Journal of Contemporary China,
Vol.22, pp. 385. 2 Zhao, Y. (2014). Background Review: China's Fiscal Decentralization History (in Chinese). Retrieved from Zhejiang University: person.zju.edu.cn/attachments/2014-05/07-1401349109-675288.pdf, pp.1-5. 3 Wu, A. M. (2013). How Does Decentralized Governance Work? Evidence from China. Journal of Contemporary China, Vol.22, pp. 390.
19
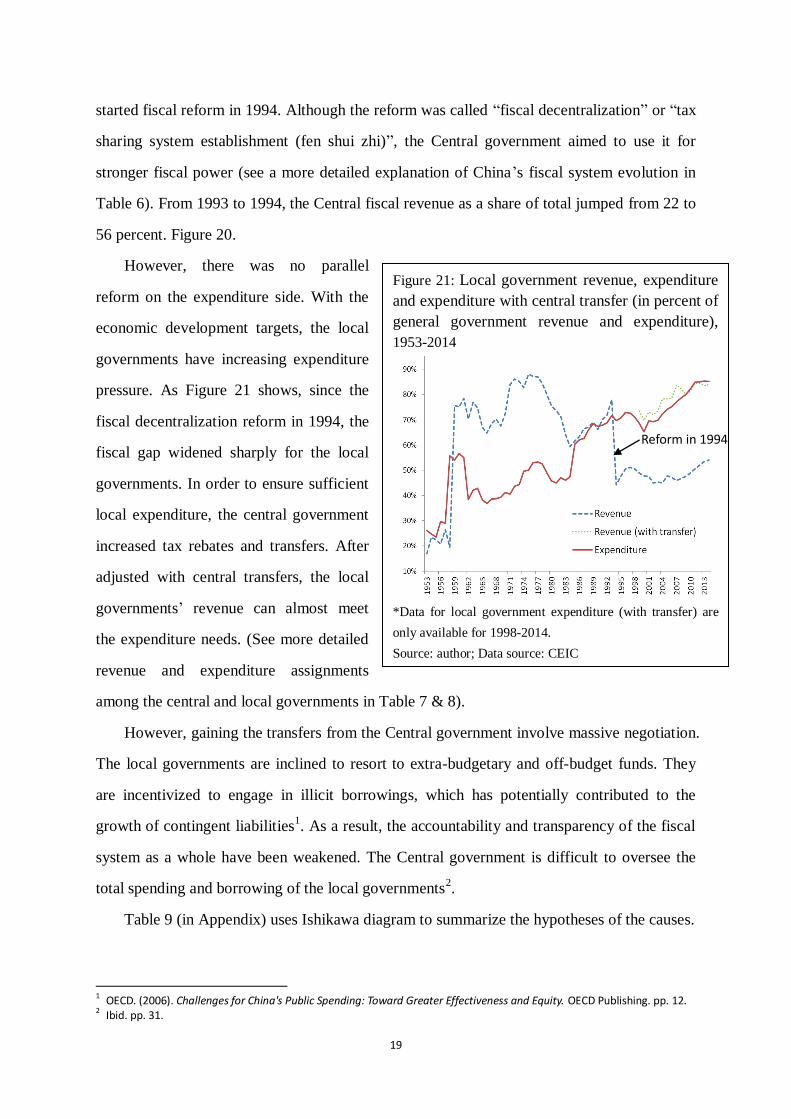
Figure 21: Local government revenue, expenditure
and expenditure with central transfer (in percent of
general government revenue and expenditure),
1953-2014
*Data for local government expenditure (with transfer) are
only available for 1998-2014.
Source: author; Data source: CEIC
started fiscal reform in 1994. Although the reform was called “fiscal decentralization” or “tax
sharing system establishment (fen shui zhi)”, the Central government aimed to use it for
stronger fiscal power (see a more detailed explanation of China’s fiscal system evolution in
Table 6). From 1993 to 1994, the Central fiscal revenue as a share of total jumped from 22 to
56 percent. Figure 20.
However, there was no parallel
reform on the expenditure side. With the
economic development targets, the local
governments have increasing expenditure
pressure. As Figure 21 shows, since the
fiscal decentralization reform in 1994, the
fiscal gap widened sharply for the local
governments. In order to ensure sufficient
local expenditure, the central government
increased tax rebates and transfers. After
adjusted with central transfers, the local
governments’ revenue can almost meet
the expenditure needs. (See more detailed
revenue and expenditure assignments
among the central and local governments in Table 7 & 8).
However, gaining the transfers from the Central government involve massive negotiation.
The local governments are inclined to resort to extra-budgetary and off-budget funds. They
are incentivized to engage in illicit borrowings, which has potentially contributed to the
growth of contingent liabilities1. As a result, the accountability and transparency of the fiscal
system as a whole have been weakened. The Central government is difficult to oversee the
total spending and borrowing of the local governments2.
Table 9 (in Appendix) uses Ishikawa diagram to summarize the hypotheses of the causes.
1 OECD. (2006). Challenges for China's Public Spending: Toward Greater Effectiveness and Equity. OECD Publishing. pp. 12. 2 Ibid. pp. 31.
Reform in 1994
20
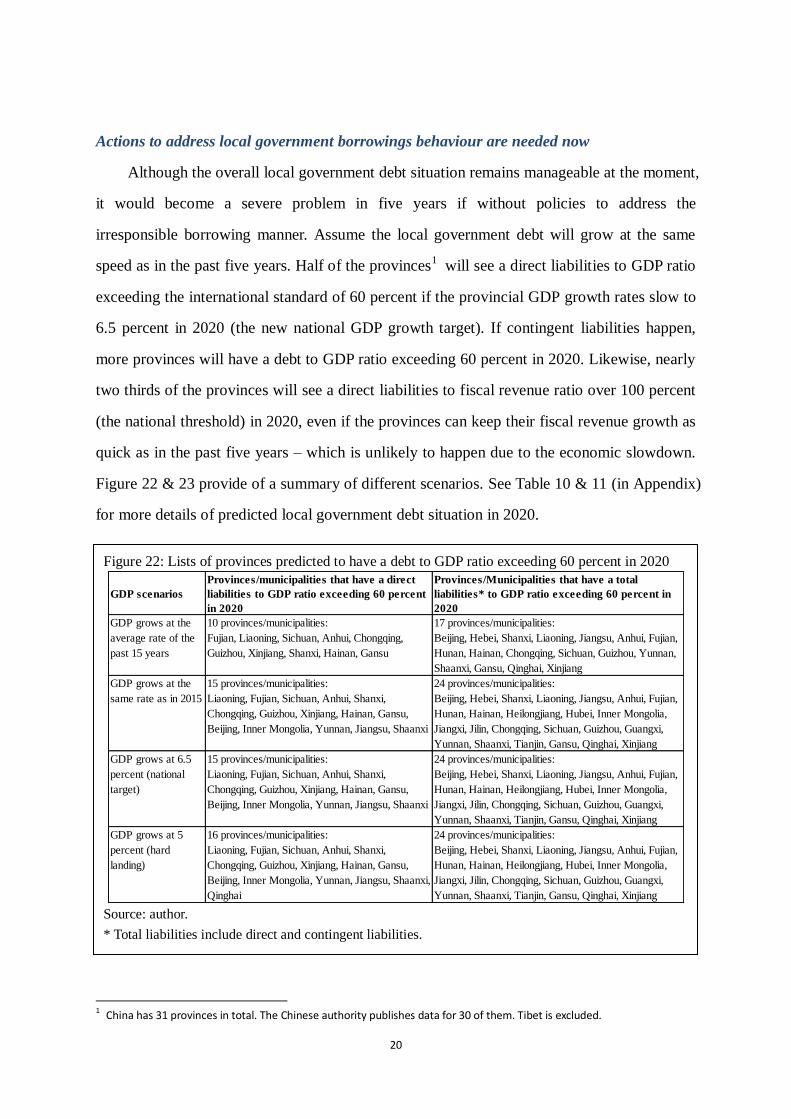
Actions to address local government borrowings behaviour are needed now
Although the overall local government debt situation remains manageable at the moment,
it would become a severe problem in five years if without policies to address the
irresponsible borrowing manner. Assume the local government debt will grow at the same
speed as in the past five years. Half of the provinces1 will see a direct liabilities to GDP ratio
exceeding the international standard of 60 percent if the provincial GDP growth rates slow to
6.5 percent in 2020 (the new national GDP growth target). If contingent liabilities happen,
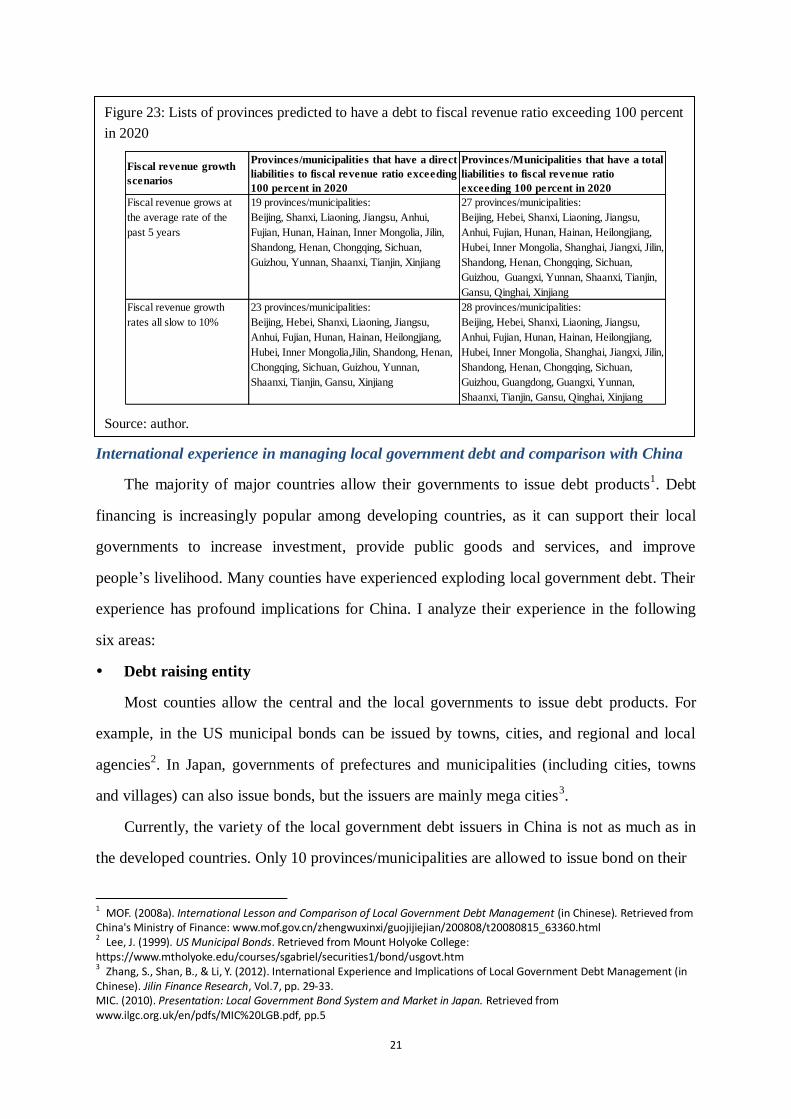
more provinces will have a debt to GDP ratio exceeding 60 percent in 2020. Likewise, nearly
two thirds of the provinces will see a direct liabilities to fiscal revenue ratio over 100 percent
(the national threshold) in 2020, even if the provinces can keep their fiscal revenue growth as
quick as in the past five years – which is unlikely to happen due to the economic slowdown.
Figure 22 & 23 provide of a summary of different scenarios. See Table 10 & 11 (in Appendix)
for more details of predicted local government debt situation in 2020.
1 China has 31 provinces in total. The Chinese authority publishes data for 30 of them. Tibet is excluded.
Figure 22: Lists of provinces predicted to have a debt to GDP ratio exceeding 60 percent in 2020
Source: author.
* Total liabilities include direct and contingent liabilities.
GDP scenarios
Provinces/municipalities that have a direct
liabilities to GDP ratio exceeding 60 percent
in 2020
Provinces/Municipalities that have a total
liabilities* to GDP ratio exceeding 60 percent in
2020
GDP grows at the
average rate of the
past 15 years
10 provinces/municipalities:
Fujian, Liaoning, Sichuan, Anhui, Chongqing,
Guizhou, Xinjiang, Shanxi, Hainan, Gansu
17 provinces/municipalities:
Beijing, Hebei, Shanxi, Liaoning, Jiangsu, Anhui, Fujian,
Hunan, Hainan, Chongqing, Sichuan, Guizhou, Yunnan,
Shaanxi, Gansu, Qinghai, Xinjiang
GDP grows at the
same rate as in 2015
15 provinces/municipalities:
Liaoning, Fujian, Sichuan, Anhui, Shanxi,
Chongqing, Guizhou, Xinjiang, Hainan, Gansu,
Beijing, Inner Mongolia, Yunnan, Jiangsu, Shaanxi
24 provinces/municipalities:
Beijing, Hebei, Shanxi, Liaoning, Jiangsu, Anhui, Fujian,
Hunan, Hainan, Heilongjiang, Hubei, Inner Mongolia,
Jiangxi, Jilin, Chongqing, Sichuan, Guizhou, Guangxi,
Yunnan, Shaanxi, Tianjin, Gansu, Qinghai, Xinjiang
GDP grows at 6.5
percent (national
target)
15 provinces/municipalities:
Liaoning, Fujian, Sichuan, Anhui, Shanxi,
Chongqing, Guizhou, Xinjiang, Hainan, Gansu,
Beijing, Inner Mongolia, Yunnan, Jiangsu, Shaanxi
24 provinces/municipalities:
Beijing, Hebei, Shanxi, Liaoning, Jiangsu, Anhui, Fujian,
Hunan, Hainan, Heilongjiang, Hubei, Inner Mongolia,
Jiangxi, Jilin, Chongqing, Sichuan, Guizhou, Guangxi,
Yunnan, Shaanxi, Tianjin, Gansu, Qinghai, Xinjiang
GDP grows at 5
percent (hard
landing)
16 provinces/municipalities:
Liaoning, Fujian, Sichuan, Anhui, Shanxi,
Chongqing, Guizhou, Xinjiang, Hainan, Gansu,
Beijing, Inner Mongolia, Yunnan, Jiangsu, Shaanxi,
Qinghai
24 provinces/municipalities:
Beijing, Hebei, Shanxi, Liaoning, Jiangsu, Anhui, Fujian,
Hunan, Hainan, Heilongjiang, Hubei, Inner Mongolia,
Jiangxi, Jilin, Chongqing, Sichuan, Guizhou, Guangxi,
Yunnan, Shaanxi, Tianjin, Gansu, Qinghai, Xinjiang
21
International experience in managing local government debt and comparison with China
The majority of major countries allow their governments to issue debt products1. Debt
financing is increasingly popular among developing countries, as it can support their local
governments to increase investment, provide public goods and services, and improve
people’s livelihood. Many counties have experienced exploding local government debt. Their
experience has profound implications for China. I analyze their experience in the following
six areas:
Debt raising entity
Most counties allow the central and the local governments to issue debt products. For
example, in the US municipal bonds can be issued by towns, cities, and regional and local
agencies2. In Japan, governments of prefectures and municipalities (including cities, towns
and villages) can also issue bonds, but the issuers are mainly mega cities3.
Currently, the variety of the local government debt issuers in China is not as much as in
the developed countries. Only 10 provinces/municipalities are allowed to issue bond on their
1 MOF. (2008a). International Lesson and Comparison of Local Government Debt Management (in Chinese). Retrieved from China's Ministry of Finance: www.mof.gov.cn/zhengwuxinxi/guojijiejian/200808/t20080815_63360.html 2 Lee, J. (1999). US Municipal Bonds. Retrieved from Mount Holyoke College:
https://www.mtholyoke.edu/courses/sgabriel/securities1/bond/usgovt.htm 3 Zhang, S., Shan, B., & Li, Y. (2012). International Experience and Implications of Local Government Debt Management (in Chinese). Jilin Finance Research, Vol.7, pp. 29-33. MIC. (2010). Presentation: Local Government Bond System and Market in Japan. Retrieved from www.ilgc.org.uk/en/pdfs/MIC%20LGB.pdf, pp.5
Figure 23: Lists of provinces predicted to have a debt to fiscal revenue ratio exceeding 100 percent
in 2020
Source: author.
Fiscal revenue growth
scenarios
Provinces/municipalities that have a direct
liabilities to fiscal revenue ratio exceeding
100 percent in 2020
Provinces/Municipalities that have a total
liabilities to fiscal revenue ratio
exceeding 100 percent in 2020
Fiscal revenue grows at
the average rate of the
past 5 years
19 provinces/municipalities:
Beijing, Shanxi, Liaoning, Jiangsu, Anhui,
Fujian, Hunan, Hainan, Inner Mongolia, Jilin,
Shandong, Henan, Chongqing, Sichuan,
Guizhou, Yunnan, Shaanxi, Tianjin, Xinjiang
27 provinces/municipalities:
Beijing, Hebei, Shanxi, Liaoning, Jiangsu,
Anhui, Fujian, Hunan, Hainan, Heilongjiang,
Hubei, Inner Mongolia, Shanghai, Jiangxi, Jilin,
Shandong, Henan, Chongqing, Sichuan,
Guizhou, Guangxi, Yunnan, Shaanxi, Tianjin,
Gansu, Qinghai, Xinjiang
Fiscal revenue growth
rates all slow to 10%
23 provinces/municipalities:
Beijing, Hebei, Shanxi, Liaoning, Jiangsu,
Anhui, Fujian, Hunan, Hainan, Heilongjiang,
Hubei, Inner Mongolia,Jilin, Shandong, Henan,
Chongqing, Sichuan, Guizhou, Yunnan,
Shaanxi, Tianjin, Gansu, Xinjiang
28 provinces/municipalities:
Beijing, Hebei, Shanxi, Liaoning, Jiangsu,
Anhui, Fujian, Hunan, Hainan, Heilongjiang,
Hubei, Inner Mongolia, Shanghai, Jiangxi, Jilin,
Shandong, Henan, Chongqing, Sichuan,
Guizhou, Guangdong, Guangxi, Yunnan,
Shaanxi, Tianjin, Gansu, Qinghai, Xinjiang
22
own, as a pilot.
In addition, usually only the central or federal government can borrow internationally.
The local governments can only borrow domestically1. This fits with China’s situation. Data
from the MOF show that none of China’s local governments has foreign debt. All of the local
government debt is RMB-denominated.
Type of debt instruments
There are mainly three types of local government debt instruments – issuing local
government bonds, borrowing from financial institutes (local governments are usually not
allowed to borrow from the financial institutes attached to them), or borrowing from the
central governments.
Japan only allows local government bond issuance2. The US allows municipal bond with
supplement of bank loans and financial lease3. Brazilian local governments can borrow from
banks, but with stringent requirement – local government debt cannot exceed 45 percent of
banks’ net assets4. Western European countries have relied on bank lending to finance
municipal investment throughout most of the 20th century and continue to use it as the
primary source5. In India, local government deficits are largely (over 80 percent) financed by
loans from the Central government and bond issuance through the central bank6.
Apart from bank loans, the debt instruments that the Chinese local governments have
“innovated” include BT (build and transfer), trust funds, securities, insurance and etc (Table
12). The MOF has announced that the local governments can only use bond issuance, which
is under the State Council and the MOF’s approval7.
1 MOF. (2008b). Introduction of Local Government Debt Size Management and Risk Monitoring in Foreign Countries (in Chinese). Retrieved from China's Ministry of Finance: http://yss.mof.gov.cn/zhengwuxinxi/guojijiejian/200809/t20080918_76134.html 2 MOF. (2008a). International Lesson and Comparison of Local Government Debt Management (in Chinese). Retrieved from China's Ministry of Finance: www.mof.gov.cn/zhengwuxinxi/guojijiejian/200808/t20080815_63360.html MIC. (2010). Presentation: Local Government Bond System and Market in Japan. Retrieved from www.ilgc.org.uk/en/pdfs/MIC%20LGB.pdf, pp.7. 3 US Bank. (2013). Newsletter: Today Government Banking. Retrieved from US Bank:
https://www.usbank.com/cgi_w/cfm/inst_govt/products_and_services/pdf/6533_GNP_TODAY_Newsletter_2013.pdf, pp.1. 4 Zhang, S., Shan, B., & Li, Y. (2012). International Experience and Implications of Local Government Debt Management (in Chinese). Jilin Finance Research, Vol.7, pp. 29-33. 5 Peterson, G. E. (2003). Banks or Bonds? Building a Municipal Credit Market. Washington DC: OECD. pp.3. 6 Vera, R. D., & Yun-Hwan, K. (2003). Local Government Finance, Private Resources, and Local Credit Markets in Asia. Manila: Asian Development Bank. pp.3 7 MOF. (2014a). Method to Include Existing Local Government Debt into Budgetary Management (in Chinese). Retrieved from China's Ministry of Finance: http://yss.mof.gov.cn/zhengwuxinxi/zhengceguizhang/201410/t20141028_1154561.html
23
Debt management models
Ter-Minassian and Craig from IMF defines four debt management models1.
i) Market discipline (including France, Canada, Sweden, Finland, and Portugal). The
local governments will borrow based on market mechanism, without intervention by the
central government. This has a high requirement of market development, including free and
open market, adequate information about the borrowers’ outstanding debt and repayment
capacity, no perceived chance of bailout, and institutional framework when a borrower
reaches the point of exclusion from new borrowing. The stringent conditions make this model
unlikely to be realized in the majority of countries.
ii) Direct control of the central government (including the UK, Japan, Australia,
Norway, Ireland, Greece and Spain). The central government executes its administrative
power to control the overall and individual size of debt issued by the local governments. The
central government is responsible for approving debt issuance and monitoring debt
repayment activities. It is more common in unitary countries. However, the fiscal demand of
the local governments may not be well reflected.
iii) A cooperative approach (including Belgium and Denmark). This model allows the
local governments join the central government to set macro economic targets and to agree
fiscal submission or transfer jointly. However, the local governments are usually less
powerful, and thus cannot succeed in negotiating with the central government.
iv) A rule-based approach (including Germany, Italy, US, Holland, and Swiss). Law and
regulations will be made to set detailed rules for local government borrowings, including the
conditions, procedures, information disclosure, risk management, and violation punishment
mechanisms. This model has the virtues of high transparency and high acceptance of the
market. However, usually it is the central government that made the rules, which would make
the model very close to the central-government direct control approach.
There is no best model that a country should follow. Countries may change their models
from time to time, considering their changing policy targets and political, economic and
1 Ter-Minassian, T., & Craig, J. (1997). Chapter 7: Control of Subnational Government Borrowing. In T. Ter-Minassian, Fiscal Federalism in Theory and Practice. Washington DC: International Monetary Fund. pp. 157-167. Doi,T., Hayashi,T., & Suzuki,N. (2005). Local Government Debt and Local Fiscal Discipline (in Japanese). Tokyo: Japan's Cabinet Office. pp. 3-10.
24
social environment. For China, it is quite difficult to adopt the market discipline approach, at
least for now, due to the lack of a well-developed financial market, the lack of transparent
data of local governments’ fiscal situation, and the government’s intervention in the market.
Pure direct control by the Central government might get the Central government
involved in micro management and hard for it to punish the local governments if they default.
A pure rule-based approach may also have drawbacks, as rules will not be exhaustive. Since
China is not famous for rule of law, the local governments will be very “innovative” to
circumvent the rules. Thus, a model involving the Central and the local governments, market,
and well-defined rules1 might be a long-term direction for China.
Local government debt control and monitoring agencies
Control and monitoring mechanism can largely reduce the risk of insolvency. The
Finance Ministries often play a major role in it, including setting up an early risk warning
system, controlling the debt size and ensuring the local governments’ compliance with the
law and regulations. Some countries (e.g. France, Germany and Bulgaria) set up a separate
debt management office and some uses existing departments to take this responsibility (e.g.
Canada)2.
The Audit Office (or an independent agency) is usually responsible for ex post
monitoring. In Japan, the Local Audit Offices audit local governments and report to the
higher level audit offices and the cabinet office directly3. In the US, the Offices of Auditor of
State also adopt in-progress monitoring4.
In China, the Budget Department of the MOF serves the function to manage local
government debt5. It sends special inspectors to provinces, municipalities and selected areas.
The original tasks of the inspectors included monitoring local budgeting process, financial
management of central transfers and implementation of fiscal policies. In 2014, monitoring
local government borrowings was added to their responsibility list, including issuers, size,
1 China has a budget law. It was first passed in 1994. In 2014, the Budget Law was reviewed.
2 MOF. (2008a). International Lesson and Comparison of Local Government Debt Management (in Chinese). Retrieved from China's Ministry of Finance: www.mof.gov.cn/zhengwuxinxi/guojijiejian/200808/t20080815_63360.html 3 Zhang, S., Shan, B., & Li, Y. (2012). International Experience and Implications of Local Government Debt Management (in
Chinese). Jilin Finance Research, Vol.7, pp. 29-33. 4 Liu, L. (2010). Strengthening Subnational Debt Financing and Managing Risks. Washington DC: The World Bank & China's Ministry of Finance. pp. 14. 5 MOF. (2016). Key Roles of the Budget Department of the Ministry of Finance (in Chinese). Retrieved from China's Ministry of Finance: http://yss.mof.gov.cn/zhengwuxinxi/guanyuwomen/zhongyaozhineng/200805/t20080522_33393.html
25
instruments, and purposes1. The local audit offices are responsible for auditing the local
government debt. They find difficulties to discover illicit debt or off-budget activities2.
Risk control mechanisms of local government debt
o Hard budget constraints
The inability of a central government to commit dynamically to a budget constraint (i.e.
soft budget constraints) may induce the local governments to misbehave, distorting ex ante
financial and productive choices, in expectation of a rescue by the central government in the
case of trouble3. Empirical analysis of OECD countries suggests that soft budget constraints
partly contributed to the rapid increase of public local governments’ public spending4. Thus,
many countries believe that government debt, as a source of government revenue, should be
included in budget management (i.e. hard budget constraints). A hard budget constraint could
be imposed either by the market (e.g. the US) or the central government’s administrative
power (e.g. Norway)5.
For example, in Japan, the Central government makes bond issuance plans for local
governments, which will be submitted to the cabinet office. Banks loans are not allowed6.
Brazil’s Fiscal Responsibility Law, introduced in 2000, prohibits local governments to
finance their debt through the Central government. If they have to do so, they will not be able
to issue debt again before the old debt is cleared7.
However, it should be noted that hard budget constraint is not always optimal because it
may discourage investment that is socially efficient8. Also, the institutional structure matters
to the efficiency of hard budget constraints1.
1 MOF. (2014c). Notice to Enhance Budget Inspection of the Offices of Fiscal Inspectors. Retrieved from China's Ministry of
Finance: http://cq.mof.gov.cn/lanmudaohang/tongzhitonggao/201503/W020150303393179105382.pdf, pp. 3-4. Du, T. (2015). Tighter Monitoring on Local Fiscal Funding (in Chinese). Retrieved from Economic Observer: www.eeo.com.cn/2015/0206/272245.shtml 2 NAO. (2013b). Result of Audit on 36 Local Governments, NAO Notice 2013/24 (in Chinese). Retrieved from National Audit Office: http://www.audit.gov.cn/n1992130/n1992150/n1992500/3291665.html 3 Bordignon, M. (2004). Fiscal Decentralization: How to Achieve a Hard Budget Constraint. Retrieved from European Commission: ec.europa.eu/economy_finance/events/2004/bxl1104/papers/bordignon_en.pdf, pp.4. 4 Crivelli, E., Leive, A., & Stratmann, T. (2010). Subnational Health Spending and Soft Budget Constraints in OECD Countries.
Retrieved from The International Monetary Fund: https://www.imf.org/external/pubs/ft/wp/2010/wp10147.pdf. pp.3-5. 5 Huang, R., & Huang, Z. (2015). Hard Budget Constraints-based Local Government Debt Management (in Chinese). Journal of Jiangsu Administration Institute, Vol.1, pp. 39-44. 6 Zhang, S., Shan, B., & Li, Y. (2012). International Experience and Implications of Local Government Debt Management (in Chinese). Jilin Finance Research, Vol. 7, pp. 29-33. 7 MOF. (2008). International Lesson and Comparison of Local Government Debt Management. Retrieved from China's
Ministry of Finance: www.mof.gov.cn/zhengwuxinxi/guojijiejian/200808/t20080815_63360.html 8 Besfamille, M., & Lockwood, B. (2007). Bailouts in Federations: Is a Hard Budget Constraint Always Best? Warwich:
26
China’s subsidy, taxation, credit and administrative pricing systems are all subject to soft
budget constraints. The 1994 Fiscal Reform aiming to have a uniformed and transparent
budgetary system were compromised at the outset when the central government set the
transfer rule based on the assurance of the status quo distribution in 1993. Although a
formula-based intergovernmental transfer scheme2 has been established (general transfer),
negotiations between the central and the local authorities on the allocation of grants (special
transfer) happen from time to time3.
o Transparency
In order to effectively control risks, it is fundamentally important to have a transparent
local government debt information system. Evidence from OECD countries suggests that a
higher degree of fiscal transparency is associated with lower public debt and deficit4. In
South Africa, for example, everyone who is involved in local government borrowing will
need to disclose their influence in the debt products5. In Brazil, every local government needs
to publish their debt reports every four months. All the information is publically available.
Fiscal transparency code of the IMF6 and best practices of the OECD
7 provides detailed
standards and cases of fiscal data disclosure.
In comparison, in China local government debt information is not fully available to the
MOF. The debt audited by the NAO may not fully capture the real situation.
To control the overall size of the local debt is a key measure to reduce the risks. The
policy makers can manage either the demand for debt by controlling e.g. debt to GDP ratio or
Warwick Economics Research Paper 717. pp.1. 1 Webb, S. B. (2001). Argentina: Hardening the Provincial Budget Constraint. Retrieved from The World Bank: www1.worldbank.org/publicsector/decentralization/hardbudget.htm 2 The fiscal transfer in China follows the following formula:
Ti,t = Ti,t-1 *(1+0.3*(0.75*added value of VATi,t+added value of CTi,t))
Current formula (base-year model):
Ti,t, Tax return to province i at year t
CT, consumption tax 3 Jin, J., & Zou, H. (2001). Soft-budget Constraint on Local Governments in China. Retrieved from The World Bank: www1.worldbank.org/publicsector/decentralization/hardbudget.htm 4 Alt, J. E., & Lassen, D. D. (2006). Fiscal Transparency, political parties, and debt in OECD countries. European Economic
Review, Vol. 50, pp. 1403. 5 MOF. (2008). International Lesson and Comparison of Local Government Debt Management (in Chinese). Retrieved from China's Ministry of Finance: www.mof.gov.cn/zhengwuxinxi/guojijiejian/200808/t20080815_63360.html 6 IMF. (2014). Fiscal Transparency Code. Retrieved from International Monetary Fund: blog-pfm.imf.org/files/ft-code.pdf 7 OECD. (2002). OECD Best Practices for Budget Transparency. Paris: OECD Publication Service. pp. 8-14.
27
debt to fiscal revenue ratio, or the supply side by e.g. forbidding banks to provide loans or
restraining local governments from borrowing from local banks.
o Early warning system
Many countries adopt an early warning system that monitors the fiscal health of local
governments and predicts potential fiscal crises. They believe that local fiscal emergencies do
not arise without causes. Thus an early warning system is possible. The Fiscal Watch
Program in US (Ohio), sets out detailed conditions that constitute a fiscal emergency,
including defaults, wage and payments arrears, request for transfers, deficits, and cash
shortage. Brazil uses net borrowing to revenue ratio and debt to revenue ratio. The country
requires all borrowing governments to have a primary surplus. Columbia adopts a “Traffic
Light System”. If local governments’ debt interest to operational savings ratio (liquidity
indicator) and the debt stock to current revenue ratio (solvency indicator) is blow 40 and 80
percent, respectively, then they are in the Green Light Zone, i.e. these local governments can
issue new debt. If these indicators are above 60 and 80 percent, respectively, they are in the
Red Light Zone, i.e. these local governments’ access to new debt is limited1.
The indicators that the Chinese governments have used are limited, mainly debt to
revenue and debt to GDP ratios. They are static and backward looking.
o Fiscal contingency fund
Setting a fiscal contingency reserve requirement can help local governments’ repayment
when they fail to pay back matured debt. This can reduce risks to the local fiscal stability.
Also, since a fiscal contingency fund is generated from fiscal surpluses during economic
booms, it can encourage countercyclical actions. Argentina, Chile, Ecuador, Estonia, and
Peru adopt fiscal reserve fund2. Estonia, for example, established the Stabilization Reserve
Fund in late 1990s, providing resources for emergency situations and unforeseen revenue
shortfalls3.
After the local government debt audit in 2011, the MOF has suggested the local
1 Ma, J. (2002). Chapter 18. Monitoring Fiscal Risks of Subnational Governments: Selected Country Experiences. In H. P.
Brixi, & A. Schick, Government at Risk: Contingent Liabilities and Fiscal Risk. Washington DC: The World Bank. Retrieved from the World Bank: http://info.worldbank.org/etools/docs/library/128810/Jun%20Ma%201999.pdf. pp. 11-14. 2 Kopits, G. (2007). Fiscal Responsibility Framework: International Experience and Implications for Hungary. Magayar
Nemzeti Bank. pp.9. 3 OECD. (2011). OECD Economic Surveys: Estonia 2011. OECD Publishing. pp. 52.
28
governments to establish fiscal contingency funds. 28 provincial/municipal (93 percent), 254
city/prefecture (64 percent), 755 county (27%) level governments followed the advice,
according to the audit result in 20131. However, the State Council has called it to pause, and
has required the local governments to use the fiscal contingent funds to expand investment,
due to the economic slowdown2.
Punishment on misbehavior of debt management
Some countries have established accountability mechanism to punish fiscally
irresponsible officials, aiming to reduce the risk of their future misbehavior. In Brazil, if
public officials violate the provision of the Fiscal Responsibility Law, they will face strict
penalties, including prison terms3.
In December 2015, the National People’s Congress (NPC, China’s legislator) proposed
to link local government officials’ evaluation with their borrowing behavior4. So far, there is
no further detail about the punishment mechanism.
SECTION IV: Potential Policy Recommendations
Based on the comparison with the international experience, China’s local government
borrowings management has a significant gap in controlling and monitoring local
government debt, preventing risks, and addressing misbehavior of local officials.
Reforms or policy recommendations should be within China’s existing political and
institutional framework. China is a unitary country. Policies mainly follow a “top-down”
manner. Thus in the short- to medium-term, the Central government will still be in charge of
approving the local governments’ debt issuance eligibility and the size of the issuance.
Focusing on the weakness of China’s local government debt management and
considering the institutional regime, I propose policy recommendations in the following areas
1 NAO. (2013a). Result of 2013 Government Debt Auditing (in Chinese). Retrieved from National Audit Office:
http://www.audit.gov.cn/n5/n25/c63642/part/27403.pdf 2 State Council. (2015). The State Council's Notice to Activate Stock Fiscal Resources (in Chinese). Retrieved from China's State Council: www.gov.cn/zhengce/content/2015-01/21/content_9408.htm 3 EslavaMarcela. (2007). Chapter 9: The Political Economy of Debt. in BorenszteinEduardo, Levy YeyatiEduardo, &
PanizzaUgo, Living with Debt: How to Limit the Risks of Sovereign Finance. Washington DC: Inter-American Development Bank. pp. 182 4 NPC. (2015). Report on Performance to Manage Local Government Debt by the Budget Committee of the NPC (in Chinese).
Retrieved from China's National People's Congress: http://www.npc.gov.cn/npc/xinwen/2015-12/22/content_1955661.htm
29
(a summary is provided in Table 13 in Appendix).
Reduce the immediate default risks brought by excessive local government debt.
(Policy aim: grasp a clearer picture of local government debt issue, address maturity
mismatch, improve soundness of local governments’ fiscal performance and reduce moral
hazard.)
This firstly includes allowing local governments to issue bonds to replace current bank
loans within the next year, with the MOF's approval. The local governments can take the
advantage to extend their borrowing period and lower costs.The Central government can have
a chance to understand the scale of total debt and consider methods to mitigate hiding risks.
Secondly, the MOF should examine the illegal contingent liabilities and illegal
collaterals that the local governments have provided, in the next year or two. This could help
the local governments to clarify the liabilities they should bear.
Thirdly, the MOF should allow the local fiscal authorities to cover contingent liabilities
if happens, to reduce financial risk contagion. Meanwhile, the MOF should force the local
government agencies to clarify who bear what repayment responsibilities. Once clarified,
these agencies should recover debt payments to the local fiscal bureaus. This work should be
started in the following year.
Enhance risk management and emergency reaction mechanisms of local government debt.
(Policy aim: improve transparency, control and monitor local government debt, and reduce
moral hazard.)
Data insufficiency has been a major challenge for the central government to manage
local debt. The MOF could collaborate and support the NAO to audit local government
borrowings annually. The local fiscal special inspectors sent by the MOF could build the link
for the NAO to get more relevant data and information. The audit results should be open to
the public. This can also help the credit rating agencies to evaluate the risk levels for the local
governments.
With more local government debt data, the MOF could consider establishing an early
warning system and a “traffic light” system to categorize the risk level of local governments,
in the next two to three years. This can help the MOF to control the overall size of the local
30
government debt; and to deal with the local governments with trends towards excessive
borrowings.
In addition, the MOF could help the local fiscal authorities to restore fiscal contingency
funds in the coming years. When the local fiscal revenue or its growth exceeds certain level,
the local fiscal bureaus can allocate a certain proportion of fiscal revenue to the funds. This
could help the local governments to smoothen fiscal revenues across times. Alternatively, the
local governments could transfer a certain proportion of each debt raised or of the total debt
at the end of each year to the contingency fund1. With the local governments’ own resources,
the central government can reduce their reliance on bailouts.
Improve the mechanics of local government budgeting.
(Policy aim: constrain local government borrowings, improve transparency, and reduce moral
hazard.)
In order to reduce the local governments’ moral hazard behavior, it is necessary to apply
hard budget constraints on the local governments and to include all extra-budgetary and
off-budget revenue into the budget, including all the revenue from bond issuance. A more
accurate budget can better reflect the local governments’ fiscal capacity and define their
expenditure activities. However, this is likely out of the MOF’s control. High-level authority,
including the NPC, will need to legislate to create budget requirements. Thus, the process
would take a much longer time.
Address the mismatch between local government revenue and expenditure.
(Policy aim: reduce local governments’ incentives to borrow.)
Considering the current “low revenue, high expenditure” situation for the local
governments, the Central government could increase the local governments’ revenue by
redesigning the revenue-sharing formula, and meanwhile clarify the spending responsibilities
between the Central and local governments. With more revenue, the local governments’
incentives to self-finance could be reduced. However, this is also out of the MOF’s control.
Line Ministries and the local corresponding agencies should be involved in negotiating their
revenue and expenditure. Thus, this will require a long time to implement.
1 NAO. (2013c). Study on Debt Financing of Local Governments (in Chinese). Retrieved from China's National Audit Office: http://www.audit.gov.cn/n1992130/n1992210/n1994456/n3352101.files/n3352100.doc
31
Link local government borrowings with the evaluation of local officials. Establish a
punishment mechanism of irresponsible debt raising behavior.
(Policy aim: reduce moral hazard.)
Local government borrowing can be adopted as a key performance indicator in local
government officials’, especially local leaders’, appraisals. The early warning system or the
“traffic light” system can support their performance evaluation. This policy aims to change
the GDP-focused appraisal system and thus to change the officials’ incentives. Again, this is
not in the MOF’s policy arena. The Ministry of Organization (MOO, in charge of government
human resources) or higher level authority, e.g. the State Council, will need to be aligned for
the policy change.
In addition, each debt issuance should be linked to a local official. If the debt is raised
illegally or irresponsibly, the official will take the responsibility and may be punished,
including imprisonment. Officials’ responsibility roles and punishment (if happens) should be
open to the public. One step ahead, the officials who are responsible for local government
borrowings will bear the responsibility throughout the payback period of the debt product.
Even after the official has left the position, he/she will still be tracked for accountability. Any
official that has misbehavior in raising debt and has not properly resolved the issue cannot
receive promotion. This policy aims to clarify the debt responsibility entities at the local
government level, and to force the local officials to carefully consider the debt activities.
SECTION V: Policy Feasibility and Stakeholder Mobilization: How to
Make the Policy Recommendations Work in China’s Context
Managing local government debt has received support from the Central government and
the top leaders in the recent years (see Table 14 for a summary of local policy announcement).
However, considering the current economic slowdown, the Central government would still
rely on the local governments to expand public spending to boost the economic growth.
Therefore the current aim of the top leaders is to control the potential risks, slow the growth
of debt accumulation but allow the debt amount to increase but to a manageable level.
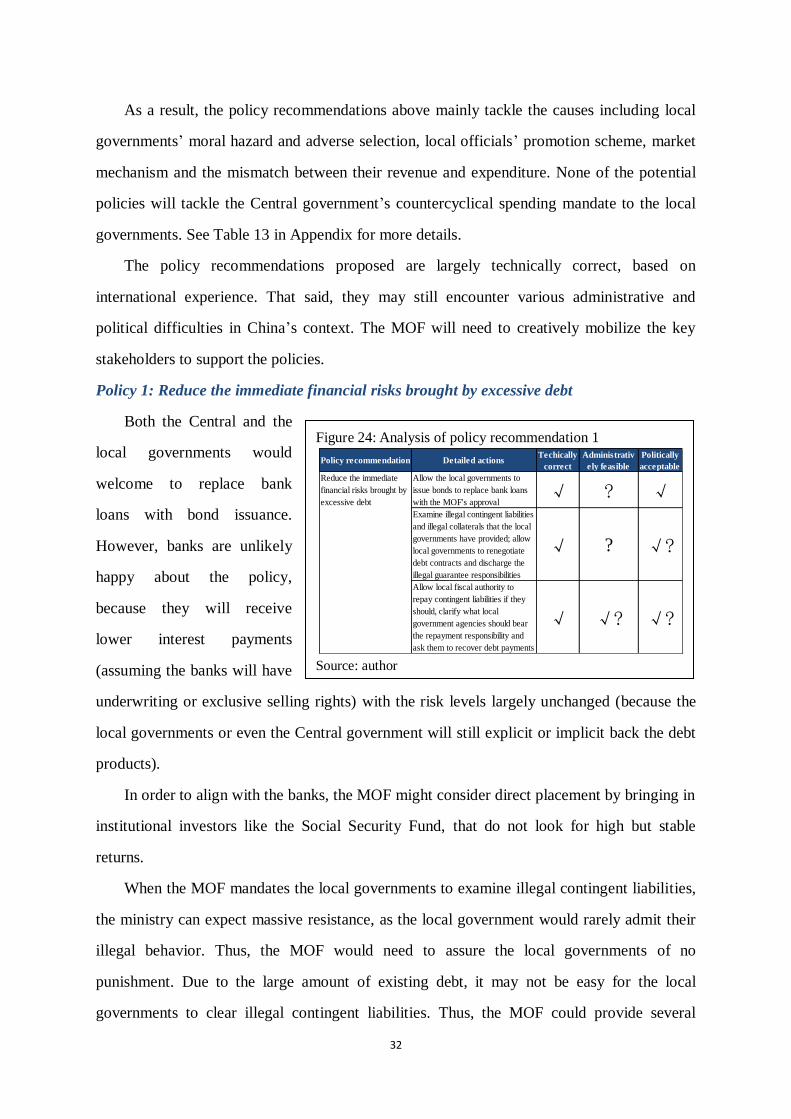
32
As a result, the policy recommendations above mainly tackle the causes including local
governments’ moral hazard and adverse selection, local officials’ promotion scheme, market
mechanism and the mismatch between their revenue and expenditure. None of the potential
policies will tackle the Central government’s countercyclical spending mandate to the local
governments. See Table 13 in Appendix for more details.
The policy recommendations proposed are largely technically correct, based on
international experience. That said, they may still encounter various administrative and
political difficulties in China’s context. The MOF will need to creatively mobilize the key
stakeholders to support the policies.
Policy 1: Reduce the immediate financial risks brought by excessive debt
Both the Central and the
local governments would
welcome to replace bank
loans with bond issuance.
However, banks are unlikely
happy about the policy,
because they will receive
lower interest payments
(assuming the banks will have
underwriting or exclusive selling rights) with the risk levels largely unchanged (because the
local governments or even the Central government will still explicit or implicit back the debt
products).
In order to align with the banks, the MOF might consider direct placement by bringing in
institutional investors like the Social Security Fund, that do not look for high but stable
returns.
When the MOF mandates the local governments to examine illegal contingent liabilities,
the ministry can expect massive resistance, as the local government would rarely admit their
illegal behavior. Thus, the MOF would need to assure the local governments of no
punishment. Due to the large amount of existing debt, it may not be easy for the local
governments to clear illegal contingent liabilities. Thus, the MOF could provide several
Figure 24: Analysis of policy recommendation 1
Source: author
Policy recommendation Detailed actionsTechically
correct
Administrativ
ely feasible
Politically
acceptable
Allow the local governments to
issue bonds to replace bank loans
with the MOF's approval√ ? √
Examine illegal contingent liabilities
and illegal collaterals that the local
governments have provided; allow
local governments to renegotiate
debt contracts and discharge the
illegal guarantee responsibilities
√ ? √?
Allow local fiscal authority to
repay contingent liabilities if they
should, clarify what local
government agencies should bear
the repayment responsibility and
ask them to recover debt payments
√ √? √?
Reduce the immediate
financial risks brought by
excessive debt
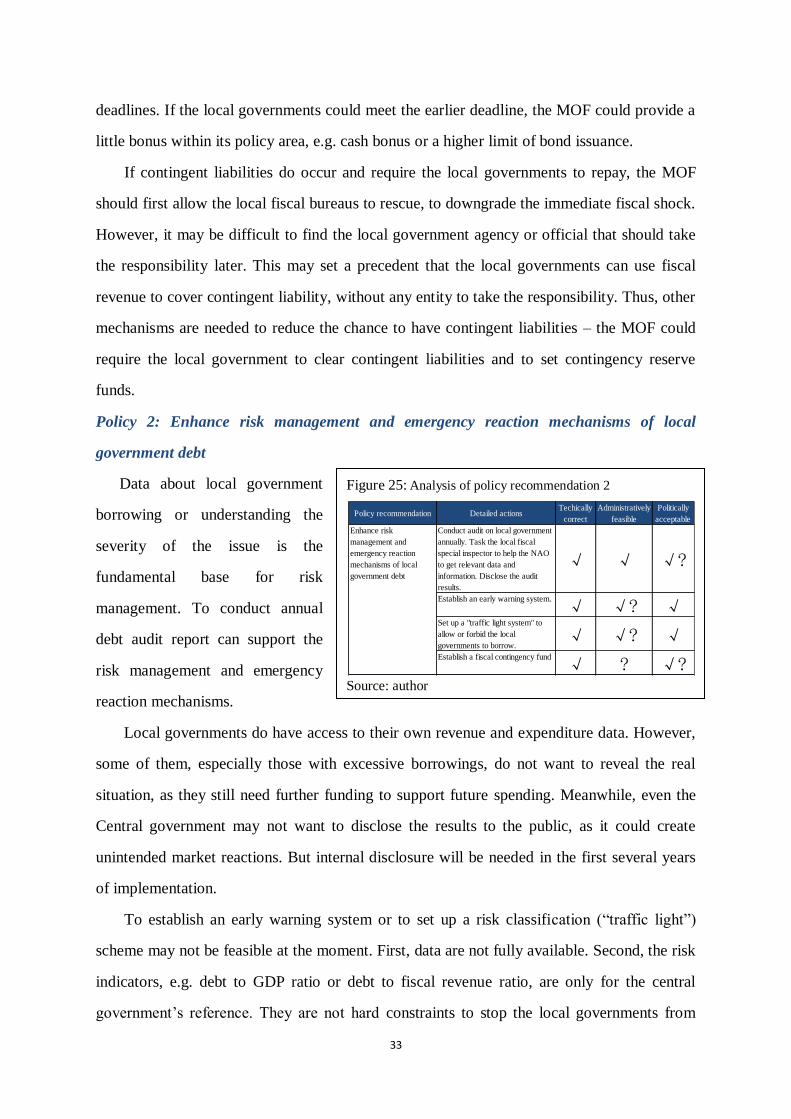
33
deadlines. If the local governments could meet the earlier deadline, the MOF could provide a
little bonus within its policy area, e.g. cash bonus or a higher limit of bond issuance.
If contingent liabilities do occur and require the local governments to repay, the MOF
should first allow the local fiscal bureaus to rescue, to downgrade the immediate fiscal shock.
However, it may be difficult to find the local government agency or official that should take
the responsibility later. This may set a precedent that the local governments can use fiscal
revenue to cover contingent liability, without any entity to take the responsibility. Thus, other
mechanisms are needed to reduce the chance to have contingent liabilities – the MOF could
require the local government to clear contingent liabilities and to set contingency reserve
funds.
Policy 2: Enhance risk management and emergency reaction mechanisms of local
government debt
Data about local government
borrowing or understanding the
severity of the issue is the
fundamental base for risk
management. To conduct annual
debt audit report can support the
risk management and emergency
reaction mechanisms.
Local governments do have access to their own revenue and expenditure data. However,
some of them, especially those with excessive borrowings, do not want to reveal the real
situation, as they still need further funding to support future spending. Meanwhile, even the
Central government may not want to disclose the results to the public, as it could create
unintended market reactions. But internal disclosure will be needed in the first several years
of implementation.
To establish an early warning system or to set up a risk classification (“traffic light”)
scheme may not be feasible at the moment. First, data are not fully available. Second, the risk
indicators, e.g. debt to GDP ratio or debt to fiscal revenue ratio, are only for the central
government’s reference. They are not hard constraints to stop the local governments from
Figure 25: Analysis of policy recommendation 2
Source: author
Policy recommendation Detailed actionsTechically
correct
Administratively
feasible
Politically
acceptable
Conduct audit on local government
annually. Task the local fiscal
special inspector to help the NAO
to get relevant data and
information. Disclose the audit
results.
√ √ √?
Establish an early warning system.
√ √? √Set up a "traffic light system" to
allow or forbid the local
governments to borrow.√ √? √
Establish a fiscal contingency fund
√ ? √?
Enhance risk
management and
emergency reaction
mechanisms of local
government debt
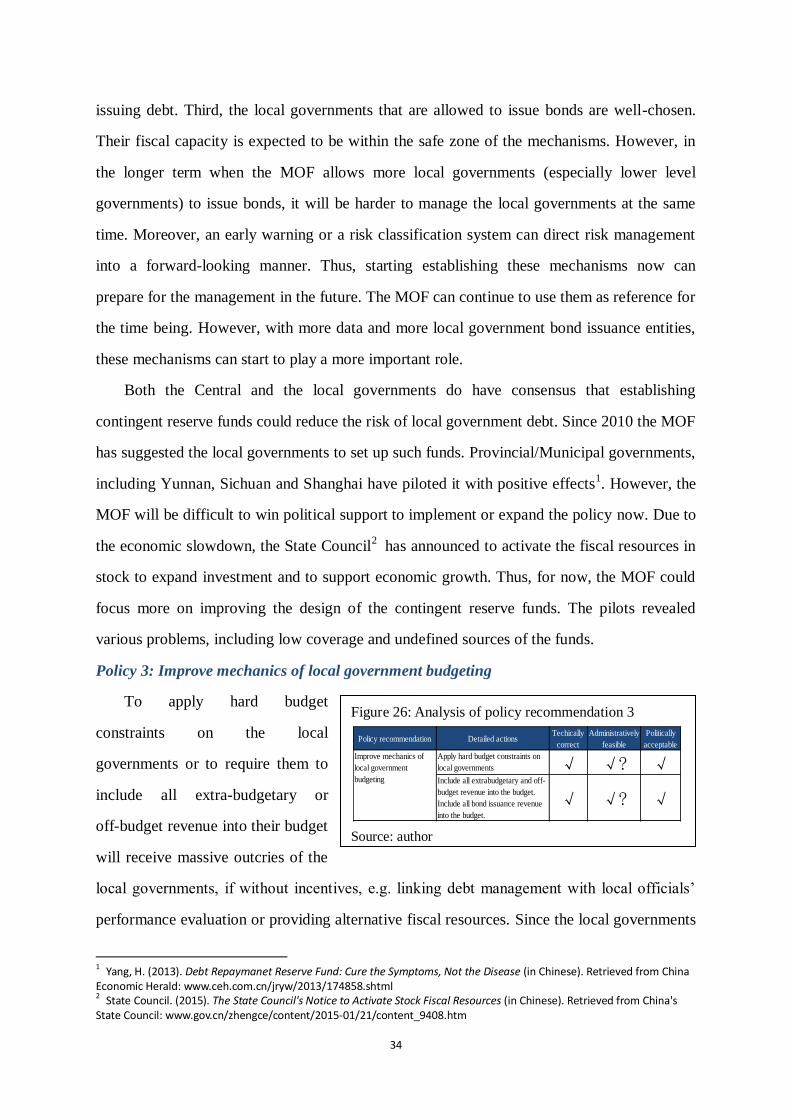
34
issuing debt. Third, the local governments that are allowed to issue bonds are well-chosen.
Their fiscal capacity is expected to be within the safe zone of the mechanisms. However, in
the longer term when the MOF allows more local governments (especially lower level
governments) to issue bonds, it will be harder to manage the local governments at the same
time. Moreover, an early warning or a risk classification system can direct risk management
into a forward-looking manner. Thus, starting establishing these mechanisms now can
prepare for the management in the future. The MOF can continue to use them as reference for
the time being. However, with more data and more local government bond issuance entities,
these mechanisms can start to play a more important role.
Both the Central and the local governments do have consensus that establishing
contingent reserve funds could reduce the risk of local government debt. Since 2010 the MOF
has suggested the local governments to set up such funds. Provincial/Municipal governments,
including Yunnan, Sichuan and Shanghai have piloted it with positive effects1. However, the
MOF will be difficult to win political support to implement or expand the policy now. Due to
the economic slowdown, the State Council2 has announced to activate the fiscal resources in
stock to expand investment and to support economic growth. Thus, for now, the MOF could
focus more on improving the design of the contingent reserve funds. The pilots revealed
various problems, including low coverage and undefined sources of the funds.
Policy 3: Improve mechanics of local government budgeting
To apply hard budget
constraints on the local
governments or to require them to
include all extra-budgetary or
off-budget revenue into their budget
will receive massive outcries of the
local governments, if without incentives, e.g. linking debt management with local officials’
performance evaluation or providing alternative fiscal resources. Since the local governments
1 Yang, H. (2013). Debt Repaymanet Reserve Fund: Cure the Symptoms, Not the Disease (in Chinese). Retrieved from China Economic Herald: www.ceh.com.cn/jryw/2013/174858.shtml 2 State Council. (2015). The State Council's Notice to Activate Stock Fiscal Resources (in Chinese). Retrieved from China's State Council: www.gov.cn/zhengce/content/2015-01/21/content_9408.htm
Figure 26: Analysis of policy recommendation 3
Source: author
Policy recommendation Detailed actionsTechically
correct
Administratively
feasible
Politically
acceptable
Apply hard budget constraints on
local governments √ √? √Include all extrabudgetary and off-
budget revenue into the budget.
Include all bond issuance revenue
into the budget.
√ √? √
Improve mechanics of
local government
budgeting
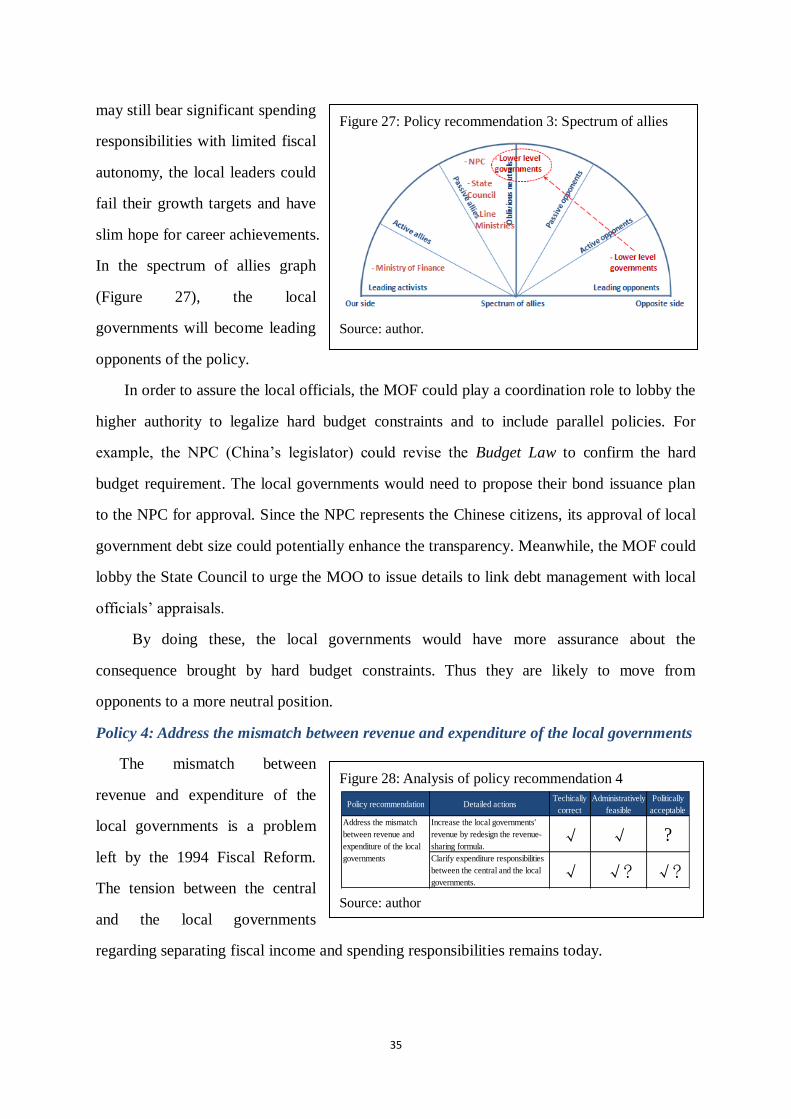
35
Figure 27: Policy recommendation 3: Spectrum of allies
Source: author.
may still bear significant spending
responsibilities with limited fiscal
autonomy, the local leaders could
fail their growth targets and have
slim hope for career achievements.
In the spectrum of allies graph
(Figure 27), the local
governments will become leading
opponents of the policy.
In order to assure the local officials, the MOF could play a coordination role to lobby the
higher authority to legalize hard budget constraints and to include parallel policies. For
example, the NPC (China’s legislator) could revise the Budget Law to confirm the hard
budget requirement. The local governments would need to propose their bond issuance plan
to the NPC for approval. Since the NPC represents the Chinese citizens, its approval of local
government debt size could potentially enhance the transparency. Meanwhile, the MOF could
lobby the State Council to urge the MOO to issue details to link debt management with local
officials’ appraisals.
By doing these, the local governments would have more assurance about the
consequence brought by hard budget constraints. Thus they are likely to move from
opponents to a more neutral position.
Policy 4: Address the mismatch between revenue and expenditure of the local governments
The mismatch between
revenue and expenditure of the
local governments is a problem
left by the 1994 Fiscal Reform.
The tension between the central
and the local governments
regarding separating fiscal income and spending responsibilities remains today.
Figure 28: Analysis of policy recommendation 4
Source: author
Policy recommendation Detailed actionsTechically
correct
Administratively
feasible
Politically
acceptable
Increase the local governments'
revenue by redesign the revenue-
sharing formula.√ √ ?
Clarify expenditure responsibilities
between the central and the local
governments.√ √? √?
Address the mismatch
between revenue and
expenditure of the local
governments
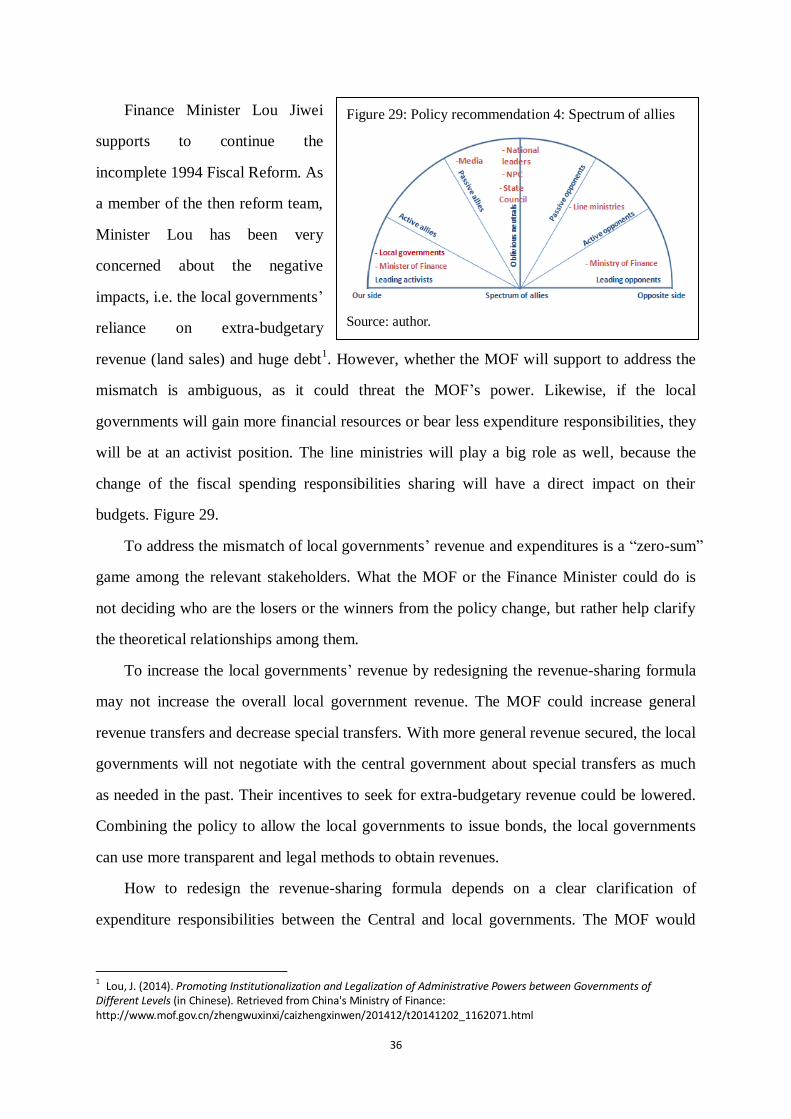
36
Figure 29: Policy recommendation 4: Spectrum of allies
Source: author.
Finance Minister Lou Jiwei
supports to continue the
incomplete 1994 Fiscal Reform. As
a member of the then reform team,
Minister Lou has been very
concerned about the negative
impacts, i.e. the local governments’
reliance on extra-budgetary
revenue (land sales) and huge debt1. However, whether the MOF will support to address the
mismatch is ambiguous, as it could threat the MOF’s power. Likewise, if the local
governments will gain more financial resources or bear less expenditure responsibilities, they
will be at an activist position. The line ministries will play a big role as well, because the
change of the fiscal spending responsibilities sharing will have a direct impact on their
budgets. Figure 29.
To address the mismatch of local governments’ revenue and expenditures is a “zero-sum”
game among the relevant stakeholders. What the MOF or the Finance Minister could do is
not deciding who are the losers or the winners from the policy change, but rather help clarify
the theoretical relationships among them.
To increase the local governments’ revenue by redesigning the revenue-sharing formula
may not increase the overall local government revenue. The MOF could increase general
revenue transfers and decrease special transfers. With more general revenue secured, the local
governments will not negotiate with the central government about special transfers as much
as needed in the past. Their incentives to seek for extra-budgetary revenue could be lowered.
Combining the policy to allow the local governments to issue bonds, the local governments
can use more transparent and legal methods to obtain revenues.
How to redesign the revenue-sharing formula depends on a clear clarification of
expenditure responsibilities between the Central and local governments. The MOF would
1 Lou, J. (2014). Promoting Institutionalization and Legalization of Administrative Powers between Governments of
Different Levels (in Chinese). Retrieved from China's Ministry of Finance: http://www.mof.gov.cn/zhengwuxinxi/caizhengxinwen/201412/t20141202_1162071.html
37
need to make the proposal to the State Council to get the line ministries aligned and to the
NPC to legalize the content.
Since China is a unitary country, in principle, the Central government should be
responsible for the expenditures regarding national sovereignty, balancing economic growth
across regions, securing free mobility of economic inputs, and protect ecological and
environmental security. The local governments should cover the services or projects that have
strong local benefits and no obvious externalities out of the locality. Some expenditure, e.g.
infrastructure construction or maintenance cross several regions, could be shared by the
Central and the local governments. These classifications need to be confirmed by law1.
This is a very long process. The MOF might want to form a special team and send it to
selected local governments to understand their general expenditure needs and the spending
they are covering which should be the Central government’s responsibility. Meanwhile, the
MOF could organize a series of seminars, having representatives of the NPC, the State
Council, the line ministries and the local governments to discuss their contradictions and find
common grounds. Those meetings will be close-door due to the sensitivity. But media could
be used when appropriate, e.g., when discussions reach deadlocks or when common grounds
are reached. A tension on the topic should be maintained to keep the top leaders or top
government agencies interested.
Policy 5: Link local government borrowings with the evaluation of local officials. Establish
a punishment mechanism of irresponsible debt raising behavior.
To include local governments borrowing as a key performance indicator in local officials’
appraisals will need further support from the top leaders and the top government agencies, i.e.
the NPC and the State Council. The Ministry of Finance has advocated for such a policy for a
while. In NPC’s conference in December 2015, Finance Minister Lou reiterated his
suggestion to reform the evaluation system of the local officials2.
1 Lou, J. (2014). Promoting Institutionalization and Legalization of Administrative Powers between Governments of
Different Levels (in Chinese). Retrieved from China's Ministry of Finance: http://www.mof.gov.cn/zhengwuxinxi/caizhengxinwen/201412/t20141202_1162071.html 2 NPC. (2015). Report on Performance to Manage Local Government Debt by the Budget Committee of the NPC (in Chinese).
Retrieved from China's National People's Congress: http://www.npc.gov.cn/npc/xinwen/2015-12/22/content_1955661.htm
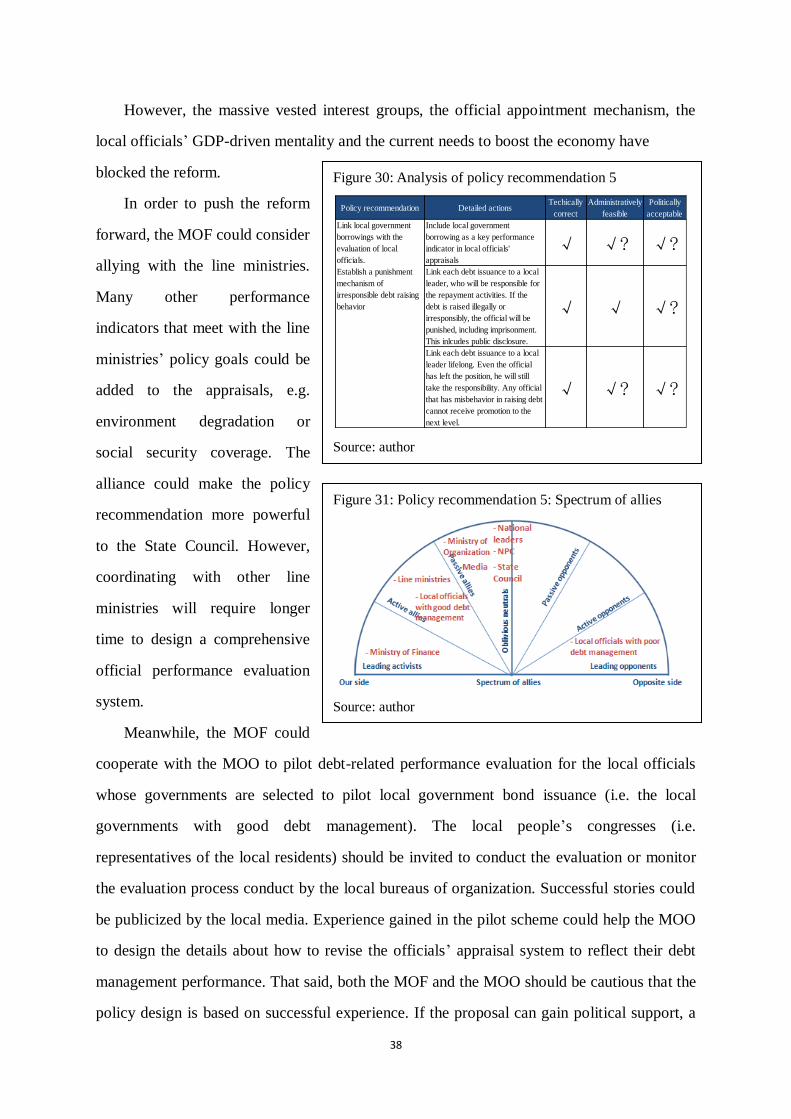
38
However, the massive vested interest groups, the official appointment mechanism, the
local officials’ GDP-driven mentality and the current needs to boost the economy have
blocked the reform.
In order to push the reform
forward, the MOF could consider
allying with the line ministries.
Many other performance
indicators that meet with the line
ministries’ policy goals could be
added to the appraisals, e.g.
environment degradation or
social security coverage. The
alliance could make the policy
recommendation more powerful
to the State Council. However,
coordinating with other line
ministries will require longer
time to design a comprehensive
official performance evaluation
system.
Meanwhile, the MOF could
cooperate with the MOO to pilot debt-related performance evaluation for the local officials
whose governments are selected to pilot local government bond issuance (i.e. the local
governments with good debt management). The local people’s congresses (i.e.
representatives of the local residents) should be invited to conduct the evaluation or monitor
the evaluation process conduct by the local bureaus of organization. Successful stories could
be publicized by the local media. Experience gained in the pilot scheme could help the MOO
to design the details about how to revise the officials’ appraisal system to reflect their debt
management performance. That said, both the MOF and the MOO should be cautious that the
policy design is based on successful experience. If the proposal can gain political support, a
Figure 31: Policy recommendation 5: Spectrum of allies
Source: author
Figure 30: Analysis of policy recommendation 5
Source: author
Policy recommendation Detailed actionsTechically
correct
Administratively
feasible
Politically
acceptable
Include local government
borrowing as a key performance
indicator in local officials'
appraisals
√ √? √?
Link each debt issuance to a local
leader, who will be responsible for
the repayment activities. If the
debt is raised illegally or
irresponsibly, the official will be
punished, including imprisonment.
This inlcudes public disclosure.
√ √ √?
Link each debt issuance to a local
leader lifelong. Even the official
has left the position, he will still
take the responsibility. Any official
that has misbehavior in raising debt
cannot receive promotion to the
next level.
√ √? √?
Link local government
borrowings with the
evaluation of local
officials.
Establish a punishment
mechanism of
irresponsible debt raising
behavior
39
wider pilot will be needed to include the poor debt management localities to further fine-tune
the policy design.
A step further, each local government bond issuance in the future could be linked with a
local official to make them accountable. The linkage with the official could even be extended
to the whole payback period of a bond, which might be longer than 10 years (the tenure of a
local leader is likely to be 3-5 years). This will receive massive resistance of the local leaders,
or even some top leaders due to their nepotistic relation with some local officials.
SECTION VI: Summary of Policy Recommendations
To enhance the responsibility of local government borrowing requires a wide
coordination across the top leaders, the central government agencies, local government
agencies, financial institutes, media and the general public. The various vested interest groups
and the political and economic context in China constrain policy options. The MOF will need
to be creative in putting forward a package of policies. Synergies exist among the policies.
Key policy recommendations to the MOF (see Table 13 in Appendix for more details):
In short term (one year), the MOF shall focus on reducing the immediate financial risks
due to excessive debt. This includes allowing the local governments to issue bond to replace
bank loans. Institutional investors who look for relatively low but stable returns, like the
Social Security Fund, can be introduced to reduce the banks’ obligation to purchase the bonds.
In addition, the MOF will request the local governments to clear their illegal contingent
liabilities. Fiscal bonus could be provided to incentivize the local governments.
The MOF shall collaborate with the NAO to gain updated data about the size of the local
government borrowings and lay a foundation for an early warning system and a risk
classification mechanism. Internal disclosure among government agencies should be made as
a first stage.
In medium term (three years), the MOF should set up an early warning system and a risk
classification mechanism to control local government debt risks.
The MOF should continue addressing the mismatch between the fiscal revenue and the
40
expenditure responsibilities of the local governments. A redesigned revenue-sharing formula
will secure the local governments with more general transfer, to reduce their incentives to
search for extra-budgetary budget. The MOF will continue close communication with the
NPC, the State Council, the line ministries and the local governments to discuss the
contradictions and find common grounds regarding expenditure sharing between the Central
and the local governments.
The MOF should work with the MOO to pilot a debt management performance related
local officials’ appraisal system. The pilot can first be conducted within the
good-debt-management local governments, then expand to the poor ones.
In long term (five years), the MOF should lobby the top government agencies (especially
the NPC) to confirm hard budget constraints by law.
If the macroeconomic context allows (i.e. a better performing economy with increasing
fiscal revenue growth), the MOF should require the local governments to restore fiscal
contingency reserve funds to reduce the local governments’ reliance on the central
governments’ bailouts.
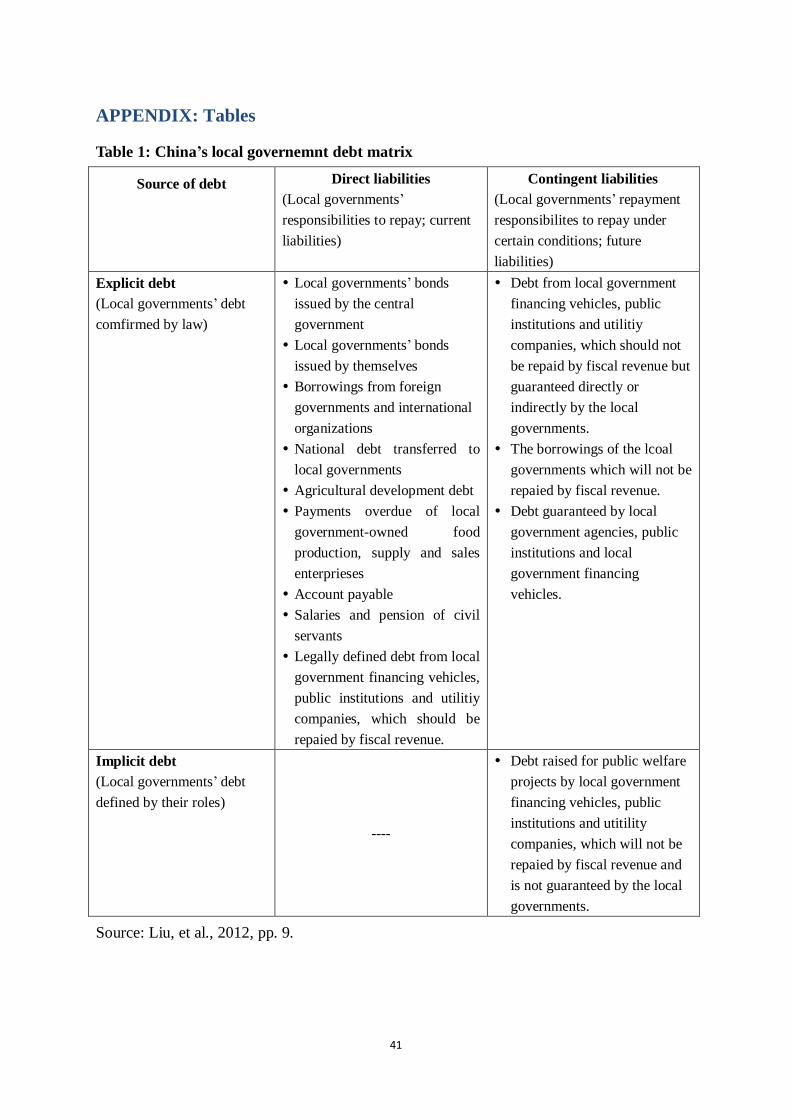
41
APPENDIX: Tables
Table 1: China’s local governemnt debt matrix
Source of debt Direct liabilities
(Local governments’
responsibilities to repay; current
liabilities)
Contingent liabilities
(Local governments’ repayment
responsibilites to repay under
certain conditions; future
liabilities)
Explicit debt
(Local governments’ debt
comfirmed by law)
Local governments’ bonds
issued by the central
government
Local governments’ bonds
issued by themselves
Borrowings from foreign
governments and international
organizations
National debt transferred to
local governments
Agricultural development debt
Payments overdue of local
government-owned food
production, supply and sales
enterprieses
Account payable
Salaries and pension of civil
servants
Legally defined debt from local
government financing vehicles,
public institutions and utilitiy
companies, which should be
repaied by fiscal revenue.
Debt from local government
financing vehicles, public
institutions and utilitiy
companies, which should not
be repaid by fiscal revenue but
guaranteed directly or
indirectly by the local
governments.
The borrowings of the lcoal
governments which will not be
repaied by fiscal revenue.
Debt guaranteed by local
government agencies, public
institutions and local
government financing
vehicles.
Implicit debt
(Local governments’ debt
defined by their roles)
----
Debt raised for public welfare
projects by local government
financing vehicles, public
institutions and utitility
companies, which will not be
repaied by fiscal revenue and
is not guaranteed by the local
governments.
Source: Liu, et al., 2012, pp. 9.
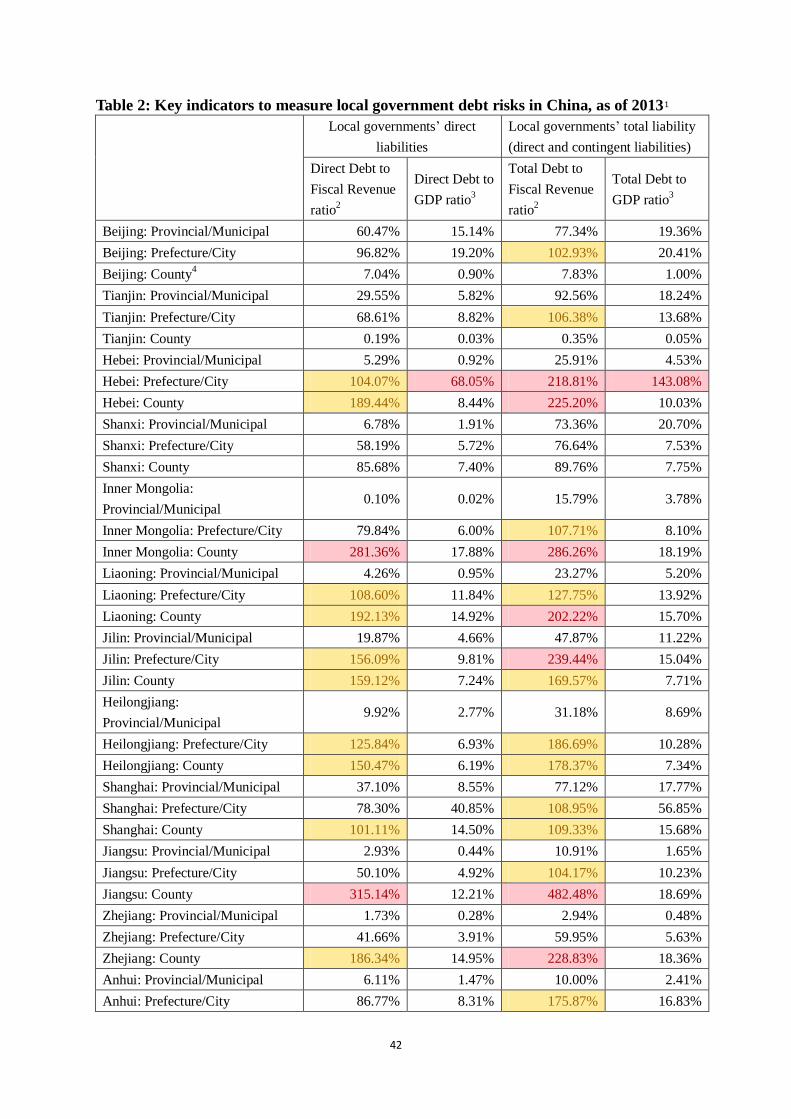
42
Table 2: Key indicators to measure local government debt risks in China, as of 20131
Local governments’ direct
liabilities
Local governments’ total liability
(direct and contingent liabilities)
Direct Debt to
Fiscal Revenue
ratio2
Direct Debt to
GDP ratio3
Total Debt to
Fiscal Revenue
ratio2
Total Debt to
GDP ratio3
Beijing: Provincial/Municipal 60.47% 15.14% 77.34% 19.36%
Beijing: Prefecture/City 96.82% 19.20% 102.93% 20.41%
Beijing: County4 7.04% 0.90% 7.83% 1.00%
Tianjin: Provincial/Municipal 29.55% 5.82% 92.56% 18.24%
Tianjin: Prefecture/City 68.61% 8.82% 106.38% 13.68%
Tianjin: County 0.19% 0.03% 0.35% 0.05%
Hebei: Provincial/Municipal 5.29% 0.92% 25.91% 4.53%
Hebei: Prefecture/City 104.07% 68.05% 218.81% 143.08%
Hebei: County 189.44% 8.44% 225.20% 10.03%
Shanxi: Provincial/Municipal 6.78% 1.91% 73.36% 20.70%
Shanxi: Prefecture/City 58.19% 5.72% 76.64% 7.53%
Shanxi: County 85.68% 7.40% 89.76% 7.75%
Inner Mongolia:
Provincial/Municipal 0.10% 0.02% 15.79% 3.78%
Inner Mongolia: Prefecture/City 79.84% 6.00% 107.71% 8.10%
Inner Mongolia: County 281.36% 17.88% 286.26% 18.19%
Liaoning: Provincial/Municipal 4.26% 0.95% 23.27% 5.20%
Liaoning: Prefecture/City 108.60% 11.84% 127.75% 13.92%
Liaoning: County 192.13% 14.92% 202.22% 15.70%
Jilin: Provincial/Municipal 19.87% 4.66% 47.87% 11.22%
Jilin: Prefecture/City 156.09% 9.81% 239.44% 15.04%
Jilin: County 159.12% 7.24% 169.57% 7.71%
Heilongjiang:
Provincial/Municipal 9.92% 2.77% 31.18% 8.69%
Heilongjiang: Prefecture/City 125.84% 6.93% 186.69% 10.28%
Heilongjiang: County 150.47% 6.19% 178.37% 7.34%
Shanghai: Provincial/Municipal 37.10% 8.55% 77.12% 17.77%
Shanghai: Prefecture/City 78.30% 40.85% 108.95% 56.85%
Shanghai: County 101.11% 14.50% 109.33% 15.68%
Jiangsu: Provincial/Municipal 2.93% 0.44% 10.91% 1.65%
Jiangsu: Prefecture/City 50.10% 4.92% 104.17% 10.23%
Jiangsu: County 315.14% 12.21% 482.48% 18.69%
Zhejiang: Provincial/Municipal 1.73% 0.28% 2.94% 0.48%
Zhejiang: Prefecture/City 41.66% 3.91% 59.95% 5.63%
Zhejiang: County 186.34% 14.95% 228.83% 18.36%
Anhui: Provincial/Municipal 6.11% 1.47% 10.00% 2.41%
Anhui: Prefecture/City 86.77% 8.31% 175.87% 16.83%
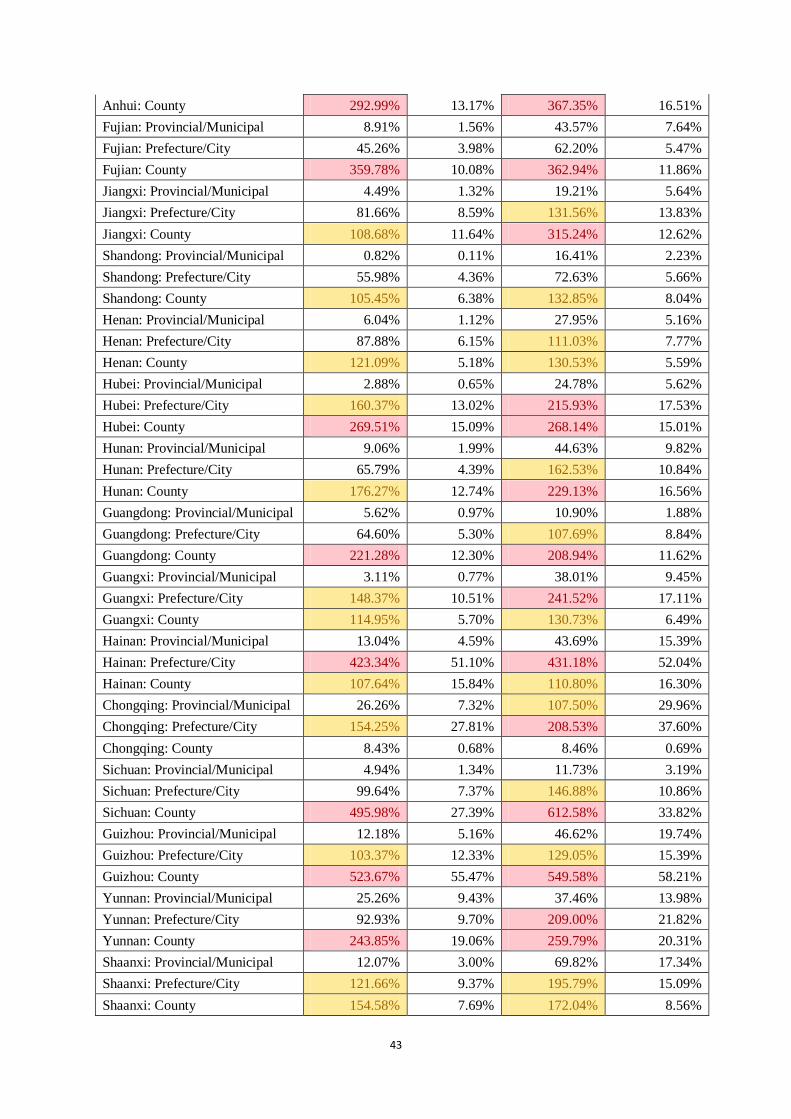
43
Anhui: County 292.99% 13.17% 367.35% 16.51%
Fujian: Provincial/Municipal 8.91% 1.56% 43.57% 7.64%
Fujian: Prefecture/City 45.26% 3.98% 62.20% 5.47%
Fujian: County 359.78% 10.08% 362.94% 11.86%
Jiangxi: Provincial/Municipal 4.49% 1.32% 19.21% 5.64%
Jiangxi: Prefecture/City 81.66% 8.59% 131.56% 13.83%
Jiangxi: County 108.68% 11.64% 315.24% 12.62%
Shandong: Provincial/Municipal 0.82% 0.11% 16.41% 2.23%
Shandong: Prefecture/City 55.98% 4.36% 72.63% 5.66%
Shandong: County 105.45% 6.38% 132.85% 8.04%
Henan: Provincial/Municipal 6.04% 1.12% 27.95% 5.16%
Henan: Prefecture/City 87.88% 6.15% 111.03% 7.77%
Henan: County 121.09% 5.18% 130.53% 5.59%
Hubei: Provincial/Municipal 2.88% 0.65% 24.78% 5.62%
Hubei: Prefecture/City 160.37% 13.02% 215.93% 17.53%
Hubei: County 269.51% 15.09% 268.14% 15.01%
Hunan: Provincial/Municipal 9.06% 1.99% 44.63% 9.82%
Hunan: Prefecture/City 65.79% 4.39% 162.53% 10.84%
Hunan: County 176.27% 12.74% 229.13% 16.56%
Guangdong: Provincial/Municipal 5.62% 0.97% 10.90% 1.88%
Guangdong: Prefecture/City 64.60% 5.30% 107.69% 8.84%
Guangdong: County 221.28% 12.30% 208.94% 11.62%
Guangxi: Provincial/Municipal 3.11% 0.77% 38.01% 9.45%
Guangxi: Prefecture/City 148.37% 10.51% 241.52% 17.11%
Guangxi: County 114.95% 5.70% 130.73% 6.49%
Hainan: Provincial/Municipal 13.04% 4.59% 43.69% 15.39%
Hainan: Prefecture/City 423.34% 51.10% 431.18% 52.04%
Hainan: County 107.64% 15.84% 110.80% 16.30%
Chongqing: Provincial/Municipal 26.26% 7.32% 107.50% 29.96%
Chongqing: Prefecture/City 154.25% 27.81% 208.53% 37.60%
Chongqing: County 8.43% 0.68% 8.46% 0.69%
Sichuan: Provincial/Municipal 4.94% 1.34% 11.73% 3.19%
Sichuan: Prefecture/City 99.64% 7.37% 146.88% 10.86%
Sichuan: County 495.98% 27.39% 612.58% 33.82%
Guizhou: Provincial/Municipal 12.18% 5.16% 46.62% 19.74%
Guizhou: Prefecture/City 103.37% 12.33% 129.05% 15.39%
Guizhou: County 523.67% 55.47% 549.58% 58.21%
Yunnan: Provincial/Municipal 25.26% 9.43% 37.46% 13.98%
Yunnan: Prefecture/City 92.93% 9.70% 209.00% 21.82%
Yunnan: County 243.85% 19.06% 259.79% 20.31%
Shaanxi: Provincial/Municipal 12.07% 3.00% 69.82% 17.34%
Shaanxi: Prefecture/City 121.66% 9.37% 195.79% 15.09%
Shaanxi: County 154.58% 7.69% 172.04% 8.56%
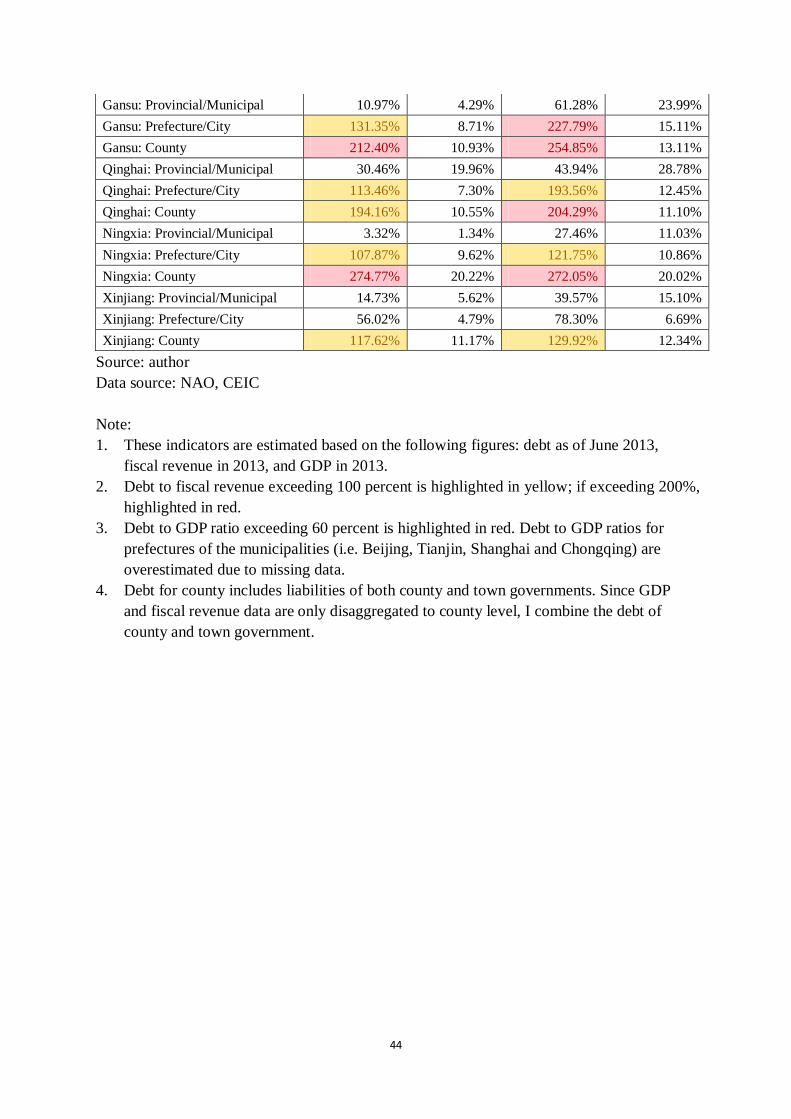
44
Gansu: Provincial/Municipal 10.97% 4.29% 61.28% 23.99%
Gansu: Prefecture/City 131.35% 8.71% 227.79% 15.11%
Gansu: County 212.40% 10.93% 254.85% 13.11%
Qinghai: Provincial/Municipal 30.46% 19.96% 43.94% 28.78%
Qinghai: Prefecture/City 113.46% 7.30% 193.56% 12.45%
Qinghai: County 194.16% 10.55% 204.29% 11.10%
Ningxia: Provincial/Municipal 3.32% 1.34% 27.46% 11.03%
Ningxia: Prefecture/City 107.87% 9.62% 121.75% 10.86%
Ningxia: County 274.77% 20.22% 272.05% 20.02%
Xinjiang: Provincial/Municipal 14.73% 5.62% 39.57% 15.10%
Xinjiang: Prefecture/City 56.02% 4.79% 78.30% 6.69%
Xinjiang: County 117.62% 11.17% 129.92% 12.34%
Source: author
Data source: NAO, CEIC
Note:
1. These indicators are estimated based on the following figures: debt as of June 2013,
fiscal revenue in 2013, and GDP in 2013.
2. Debt to fiscal revenue exceeding 100 percent is highlighted in yellow; if exceeding 200%,
highlighted in red.
3. Debt to GDP ratio exceeding 60 percent is highlighted in red. Debt to GDP ratios for
prefectures of the municipalities (i.e. Beijing, Tianjin, Shanghai and Chongqing) are
overestimated due to missing data.
4. Debt for county includes liabilities of both county and town governments. Since GDP
and fiscal revenue data are only disaggregated to county level, I combine the debt of
county and town government.
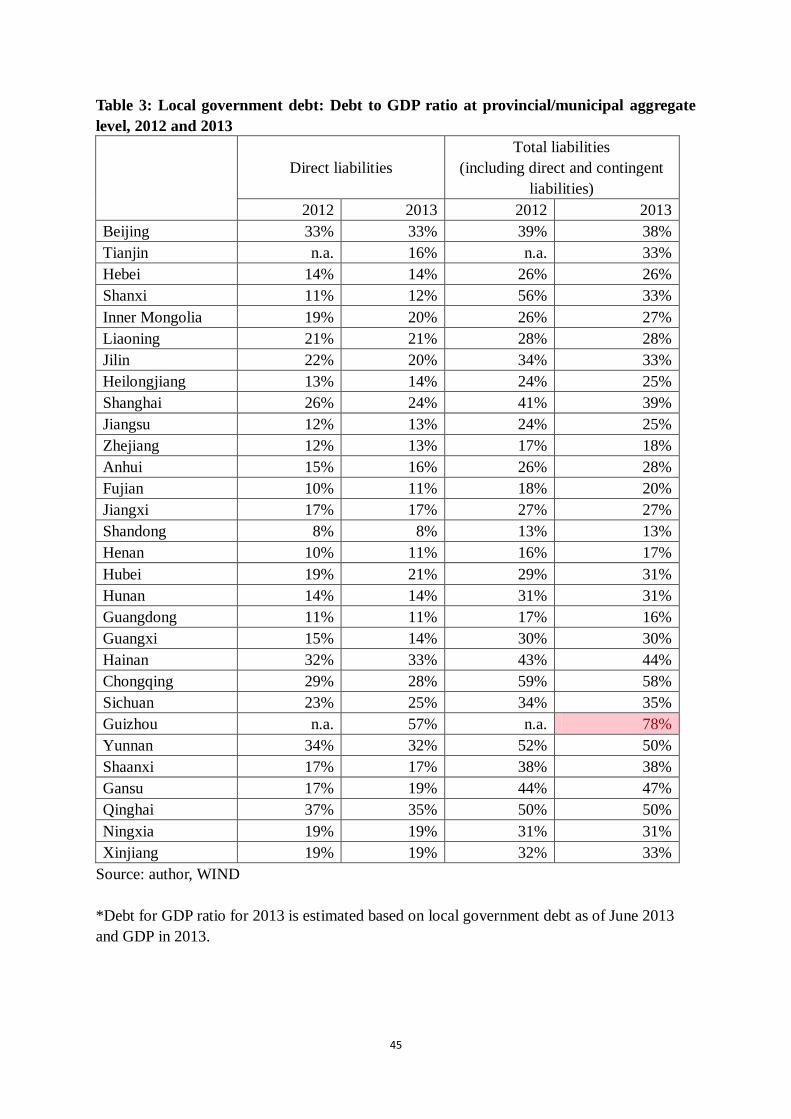
45
Table 3: Local government debt: Debt to GDP ratio at provincial/municipal aggregate
level, 2012 and 2013
Direct liabilities
Total liabilities
(including direct and contingent
liabilities)
2012 2013 2012 2013
Beijing 33% 33% 39% 38%
Tianjin n.a. 16% n.a. 33%
Hebei 14% 14% 26% 26%
Shanxi 11% 12% 56% 33%
Inner Mongolia 19% 20% 26% 27%
Liaoning 21% 21% 28% 28%
Jilin 22% 20% 34% 33%
Heilongjiang 13% 14% 24% 25%
Shanghai 26% 24% 41% 39%
Jiangsu 12% 13% 24% 25%
Zhejiang 12% 13% 17% 18%
Anhui 15% 16% 26% 28%
Fujian 10% 11% 18% 20%
Jiangxi 17% 17% 27% 27%
Shandong 8% 8% 13% 13%
Henan 10% 11% 16% 17%
Hubei 19% 21% 29% 31%
Hunan 14% 14% 31% 31%
Guangdong 11% 11% 17% 16%
Guangxi 15% 14% 30% 30%
Hainan 32% 33% 43% 44%
Chongqing 29% 28% 59% 58%
Sichuan 23% 25% 34% 35%
Guizhou n.a. 57% n.a. 78%
Yunnan 34% 32% 52% 50%
Shaanxi 17% 17% 38% 38%
Gansu 17% 19% 44% 47%
Qinghai 37% 35% 50% 50%
Ningxia 19% 19% 31% 31%
Xinjiang 19% 19% 32% 33%
Source: author, WIND
*Debt for GDP ratio for 2013 is estimated based on local government debt as of June 2013
and GDP in 2013.
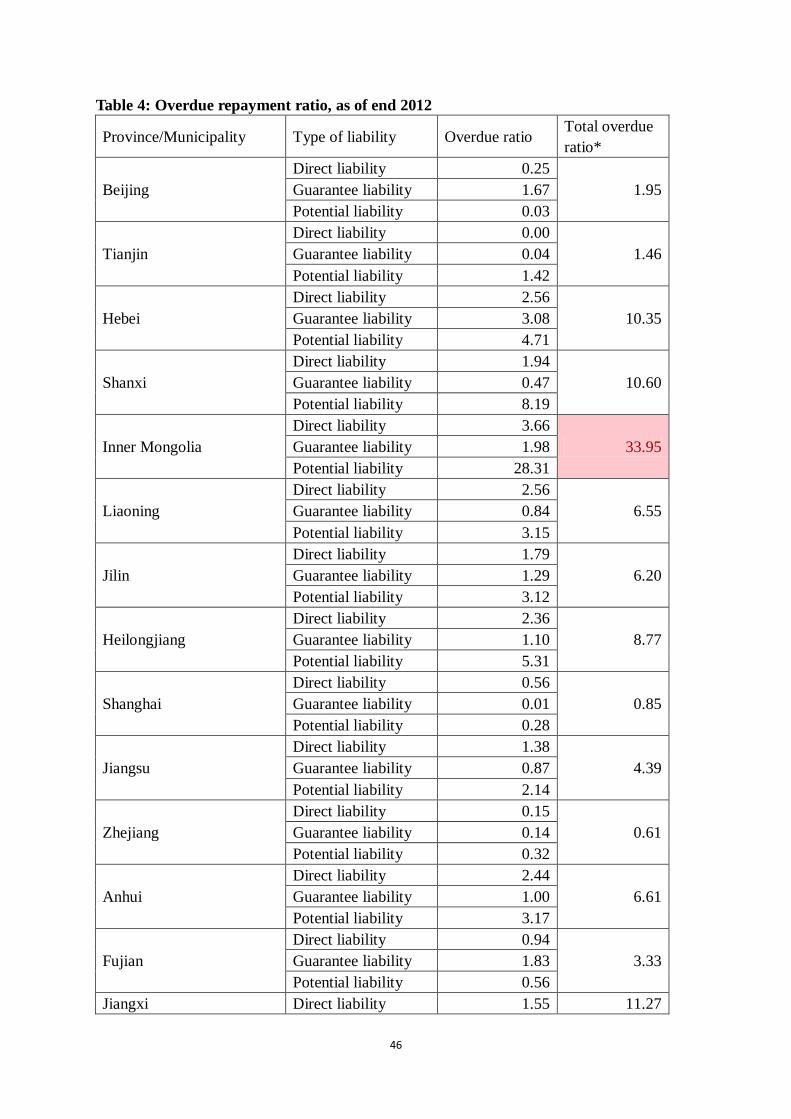
46
Table 4: Overdue repayment ratio, as of end 2012
Province/Municipality Type of liability Overdue ratio Total overdue
ratio*
Beijing
Direct liability 0.25
1.95 Guarantee liability 1.67
Potential liability 0.03
Tianjin
Direct liability 0.00
1.46 Guarantee liability 0.04
Potential liability 1.42
Hebei
Direct liability 2.56
10.35 Guarantee liability 3.08
Potential liability 4.71
Shanxi
Direct liability 1.94
10.60 Guarantee liability 0.47
Potential liability 8.19
Inner Mongolia
Direct liability 3.66
33.95 Guarantee liability 1.98
Potential liability 28.31
Liaoning
Direct liability 2.56
6.55 Guarantee liability 0.84
Potential liability 3.15
Jilin
Direct liability 1.79
6.20 Guarantee liability 1.29
Potential liability 3.12
Heilongjiang
Direct liability 2.36
8.77 Guarantee liability 1.10
Potential liability 5.31
Shanghai
Direct liability 0.56
0.85 Guarantee liability 0.01
Potential liability 0.28
Jiangsu
Direct liability 1.38
4.39 Guarantee liability 0.87
Potential liability 2.14
Zhejiang
Direct liability 0.15
0.61 Guarantee liability 0.14
Potential liability 0.32
Anhui
Direct liability 2.44
6.61 Guarantee liability 1.00
Potential liability 3.17
Fujian
Direct liability 0.94
3.33 Guarantee liability 1.83
Potential liability 0.56
Jiangxi Direct liability 1.55 11.27
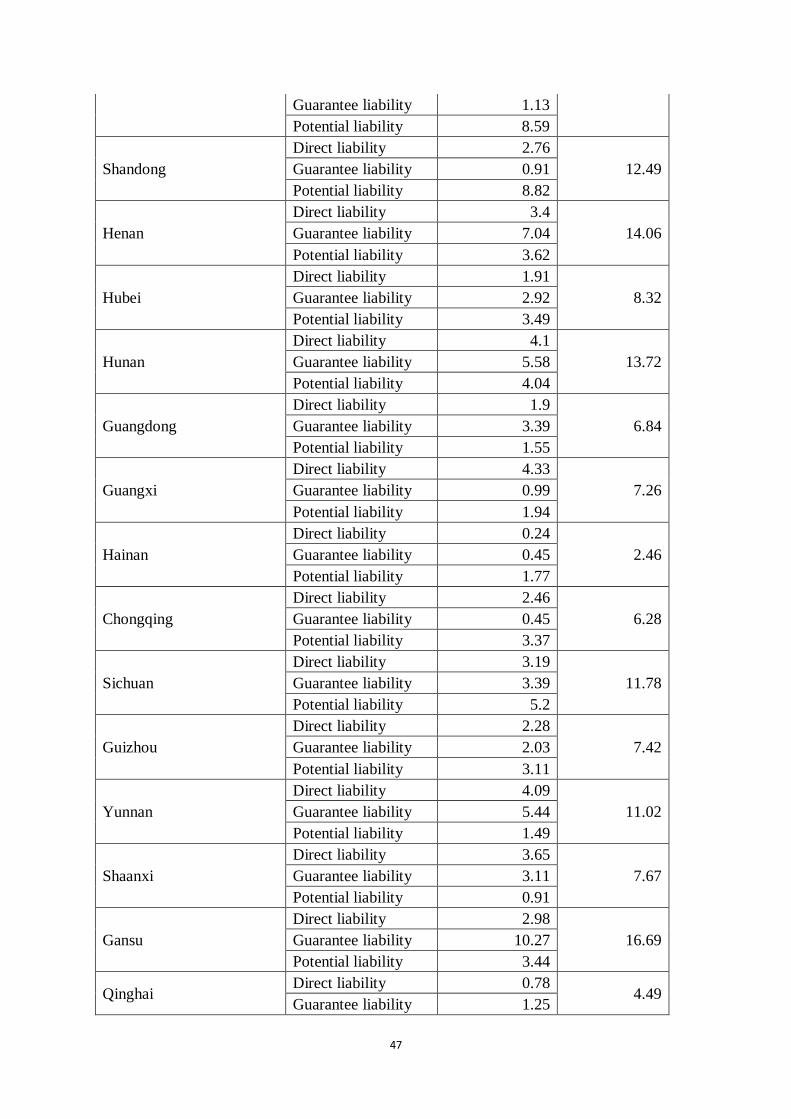
47
Guarantee liability 1.13
Potential liability 8.59
Shandong
Direct liability 2.76
12.49 Guarantee liability 0.91
Potential liability 8.82
Henan
Direct liability 3.4
14.06 Guarantee liability 7.04
Potential liability 3.62
Hubei
Direct liability 1.91
8.32 Guarantee liability 2.92
Potential liability 3.49
Hunan
Direct liability 4.1
13.72 Guarantee liability 5.58
Potential liability 4.04
Guangdong
Direct liability 1.9
6.84 Guarantee liability 3.39
Potential liability 1.55
Guangxi
Direct liability 4.33
7.26 Guarantee liability 0.99
Potential liability 1.94
Hainan
Direct liability 0.24
2.46 Guarantee liability 0.45
Potential liability 1.77
Chongqing
Direct liability 2.46
6.28 Guarantee liability 0.45
Potential liability 3.37
Sichuan
Direct liability 3.19
11.78 Guarantee liability 3.39
Potential liability 5.2
Guizhou
Direct liability 2.28
7.42 Guarantee liability 2.03
Potential liability 3.11
Yunnan
Direct liability 4.09
11.02 Guarantee liability 5.44
Potential liability 1.49
Shaanxi
Direct liability 3.65
7.67 Guarantee liability 3.11
Potential liability 0.91
Gansu
Direct liability 2.98
16.69 Guarantee liability 10.27
Potential liability 3.44
Qinghai Direct liability 0.78
4.49 Guarantee liability 1.25
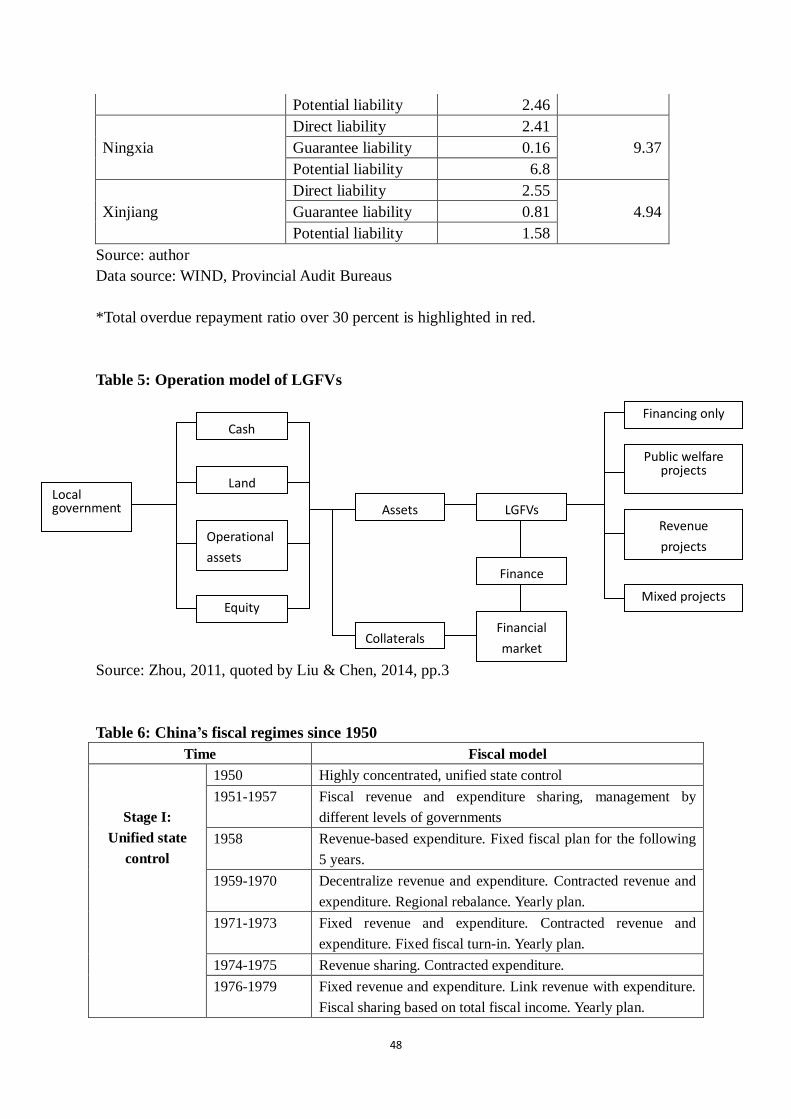
48
Potential liability 2.46
Ningxia
Direct liability 2.41
9.37 Guarantee liability 0.16
Potential liability 6.8
Xinjiang
Direct liability 2.55
4.94 Guarantee liability 0.81
Potential liability 1.58
Source: author
Data source: WIND, Provincial Audit Bureaus
*Total overdue repayment ratio over 30 percent is highlighted in red.
Table 5: Operation model of LGFVs
Source: Zhou, 2011, quoted by Liu & Chen, 2014, pp.3
Table 6: China’s fiscal regimes since 1950
Time Fiscal model
Stage I:
Unified state
control
1950 Highly concentrated, unified state control
1951-1957 Fiscal revenue and expenditure sharing, management by
different levels of governments
1958 Revenue-based expenditure. Fixed fiscal plan for the following
5 years.
1959-1970 Decentralize revenue and expenditure. Contracted revenue and
expenditure. Regional rebalance. Yearly plan.
1971-1973 Fixed revenue and expenditure. Contracted revenue and
expenditure. Fixed fiscal turn-in. Yearly plan.
1974-1975 Revenue sharing. Contracted expenditure.
1976-1979 Fixed revenue and expenditure. Link revenue with expenditure.
Fiscal sharing based on total fiscal income. Yearly plan.
Cash
Land
Operational
assets
Equity
Financing only
Public welfare projects
Revenue
projects
Mixed projects
Local government LGFVs
Collaterals
Assets
Financial
market
Finance
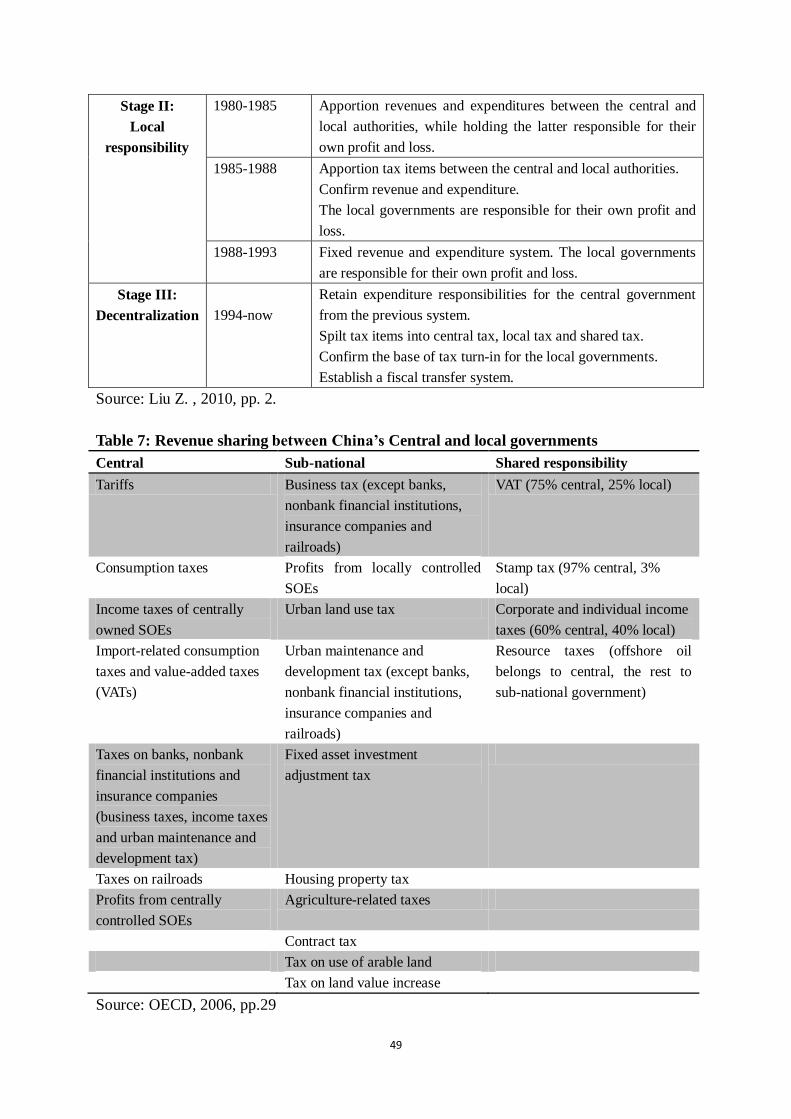
49
Stage II:
Local
responsibility
1980-1985 Apportion revenues and expenditures between the central and
local authorities, while holding the latter responsible for their
own profit and loss.
1985-1988 Apportion tax items between the central and local authorities.
Confirm revenue and expenditure.
The local governments are responsible for their own profit and
loss.
1988-1993 Fixed revenue and expenditure system. The local governments
are responsible for their own profit and loss.
Stage III:
Decentralization
1994-now
Retain expenditure responsibilities for the central government
from the previous system.
Spilt tax items into central tax, local tax and shared tax.
Confirm the base of tax turn-in for the local governments.
Establish a fiscal transfer system.
Source: Liu Z. , 2010, pp. 2.
Table 7: Revenue sharing between China’s Central and local governments
Central Sub-national Shared responsibility
Tariffs Business tax (except banks,
nonbank financial institutions,
insurance companies and
railroads)
VAT (75% central, 25% local)
Consumption taxes Profits from locally controlled
SOEs
Stamp tax (97% central, 3%
local)
Income taxes of centrally
owned SOEs
Urban land use tax Corporate and individual income
taxes (60% central, 40% local)
Import-related consumption
taxes and value-added taxes
(VATs)
Urban maintenance and
development tax (except banks,
nonbank financial institutions,
insurance companies and
railroads)
Resource taxes (offshore oil
belongs to central, the rest to
sub-national government)
Taxes on banks, nonbank
financial institutions and
insurance companies
(business taxes, income taxes
and urban maintenance and
development tax)
Fixed asset investment
adjustment tax
Taxes on railroads Housing property tax
Profits from centrally
controlled SOEs
Agriculture-related taxes
Contract tax
Tax on use of arable land
Tax on land value increase
Source: OECD, 2006, pp.29
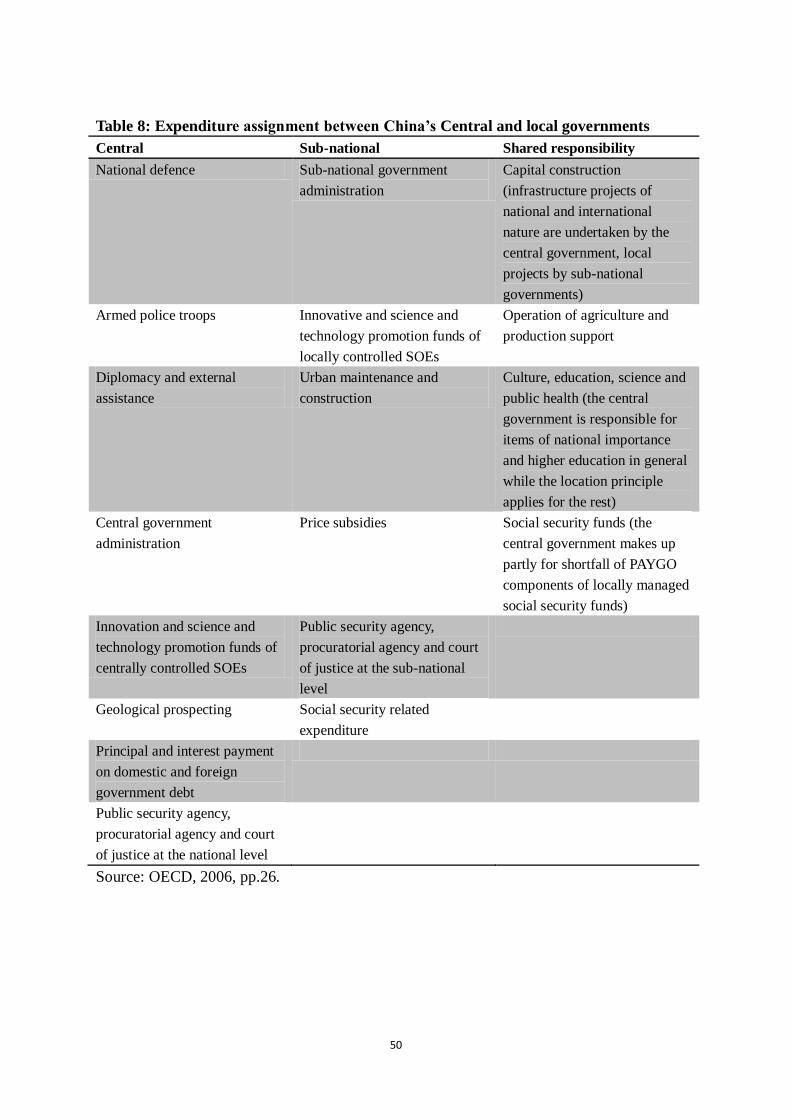
50
Table 8: Expenditure assignment between China’s Central and local governments
Central Sub-national Shared responsibility
National defence Sub-national government
administration
Capital construction
(infrastructure projects of
national and international
nature are undertaken by the
central government, local
projects by sub-national
governments)
Armed police troops Innovative and science and
technology promotion funds of
locally controlled SOEs
Operation of agriculture and
production support
Diplomacy and external
assistance
Urban maintenance and
construction
Culture, education, science and
public health (the central
government is responsible for
items of national importance
and higher education in general
while the location principle
applies for the rest)
Central government
administration
Price subsidies Social security funds (the
central government makes up
partly for shortfall of PAYGO
components of locally managed
social security funds)
Innovation and science and
technology promotion funds of
centrally controlled SOEs
Public security agency,
procuratorial agency and court
of justice at the sub-national
level
Geological prospecting Social security related
expenditure
Principal and interest payment
on domestic and foreign
government debt
Public security agency,
procuratorial agency and court
of justice at the national level
Source: OECD, 2006, pp.26.
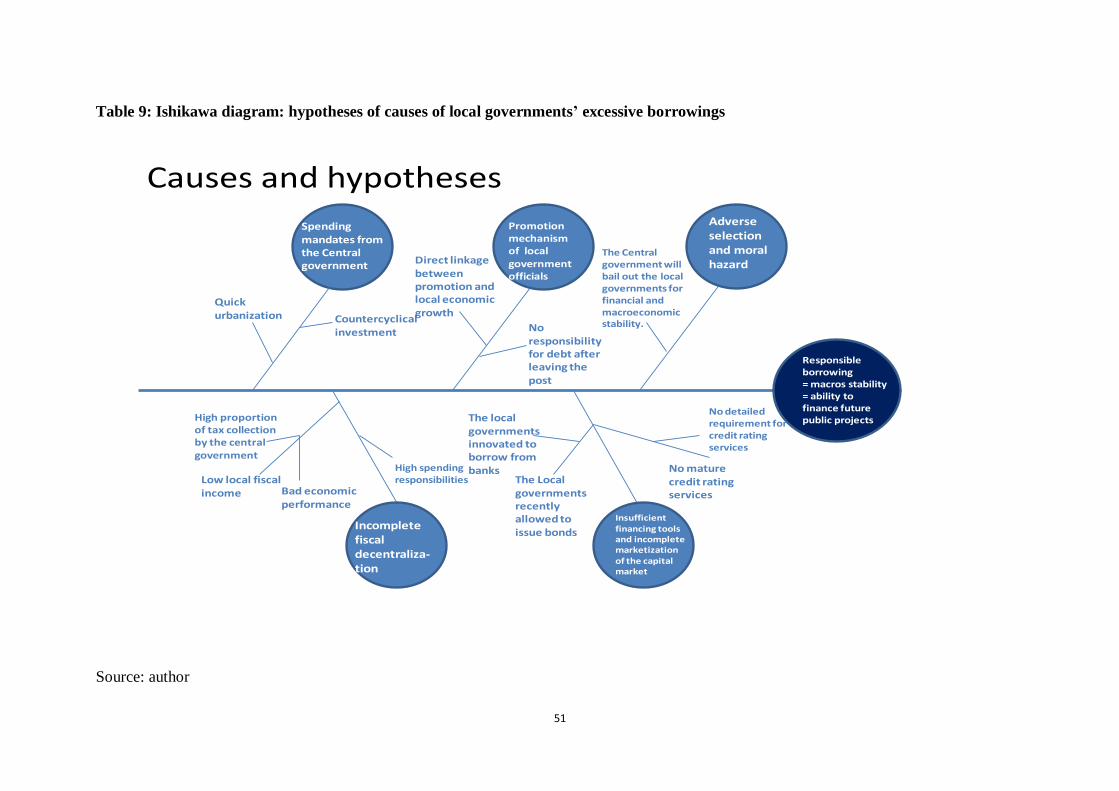
51
Table 9: Ishikawa diagram: hypotheses of causes of local governments’ excessive borrowings
Causes and hypotheses
Responsible borrowing= macros stability= ability to finance future public projects
Adverse selection and moral hazard
The Central government will bail out the local governments for financial and macroeconomic stability.No
responsibility for debt after leaving the post
Countercyclical investment
Spending mandates from the Central government
Low local fiscal income Bad economic
performance
Promotion mechanism of local government officials
Direct linkage between promotion and local economic growth
Incomplete fiscal decentraliza-tion
Quick urbanization
Insufficient financing tools and incomplete marketizationof the capital market
The Local governments recently allowed to issue bonds
No mature credit rating services
No detailed requirement for credit rating services
The local governments innovated to borrow from banksHigh spending
responsibilities
High proportion of tax collection by the central government
Source: author
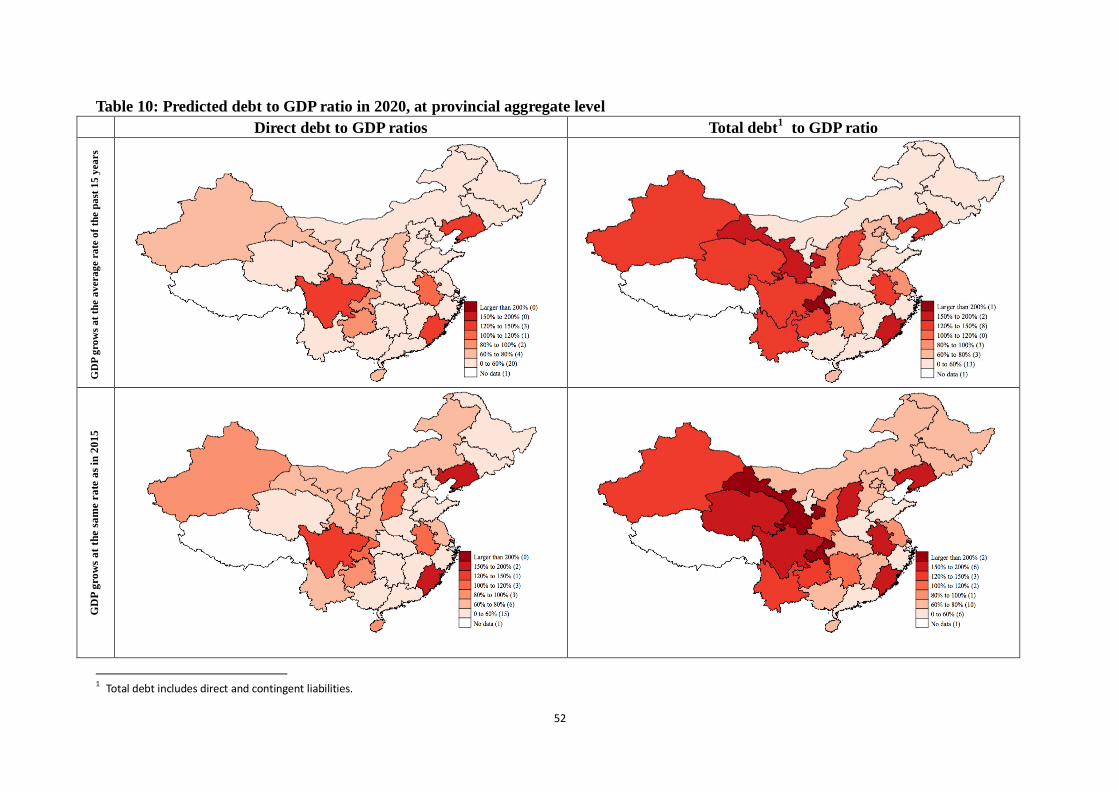
52
Table 10: Predicted debt to GDP ratio in 2020, at provincial aggregate level
Direct debt to GDP ratios Total debt1 to GDP ratio
GD
P g
row
s a
t th
e a
vera
ge r
ate
of
the p
ast
15
yea
rs
GD
P g
row
s a
t th
e s
am
e r
ate
as
in 2
01
5
1 Total debt includes direct and contingent liabilities.
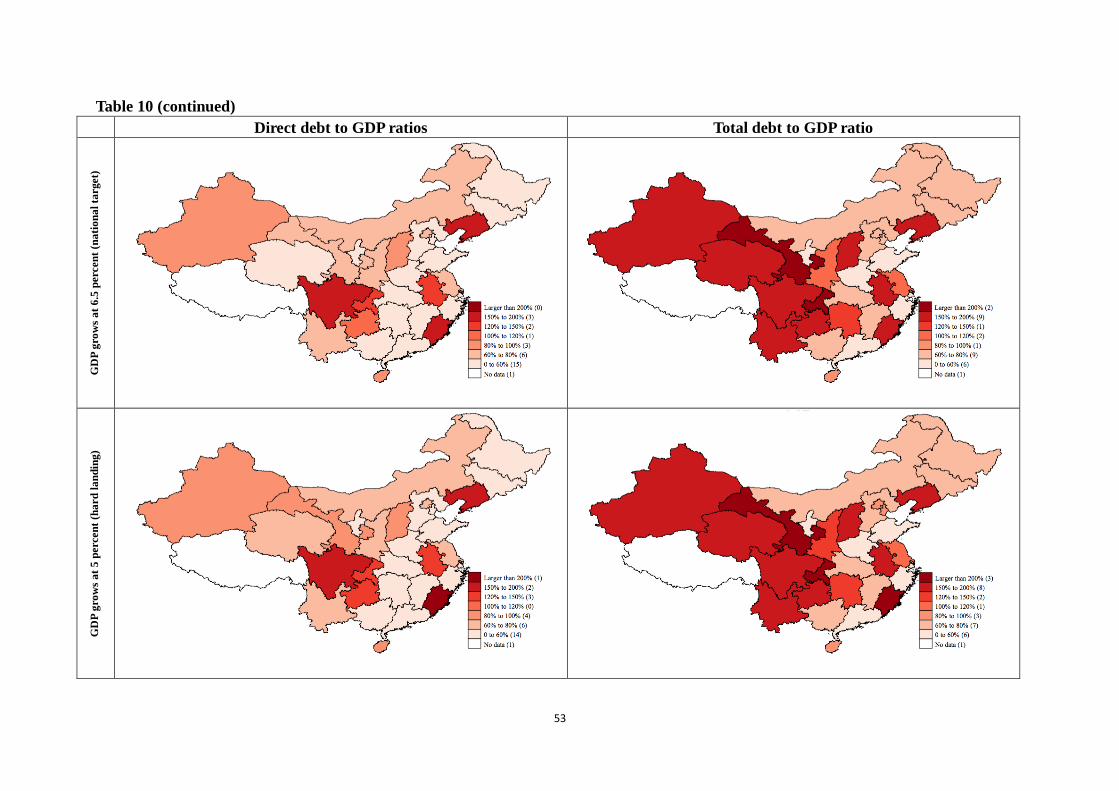
53
Table 10 (continued)
Direct debt to GDP ratios Total debt to GDP ratio
GD
P g
row
s a
t 6
.5 p
erc
en
t (n
ati
on
al
target)
GD
P g
row
s a
t 5
perc
en
t (h
ard
la
nd
ing
)
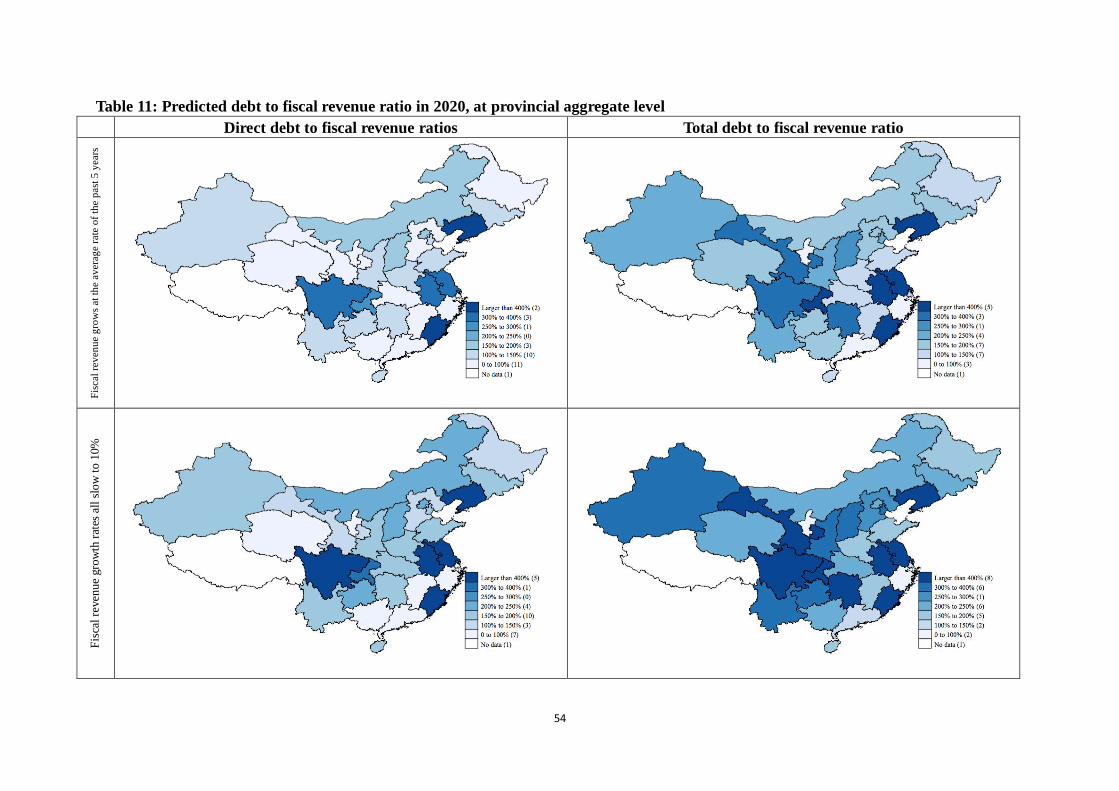
54
Table 11: Predicted debt to fiscal revenue ratio in 2020, at provincial aggregate level
Direct debt to fiscal revenue ratios Total debt to fiscal revenue ratio
Fis
cal
rev
enu
e g
row
s at
th
e av
erag
e ra
te o
f th
e p
ast
5 y
ears
Fis
cal re
ven
ue
gro
wth
rat
es a
ll s
low
to 1
0%
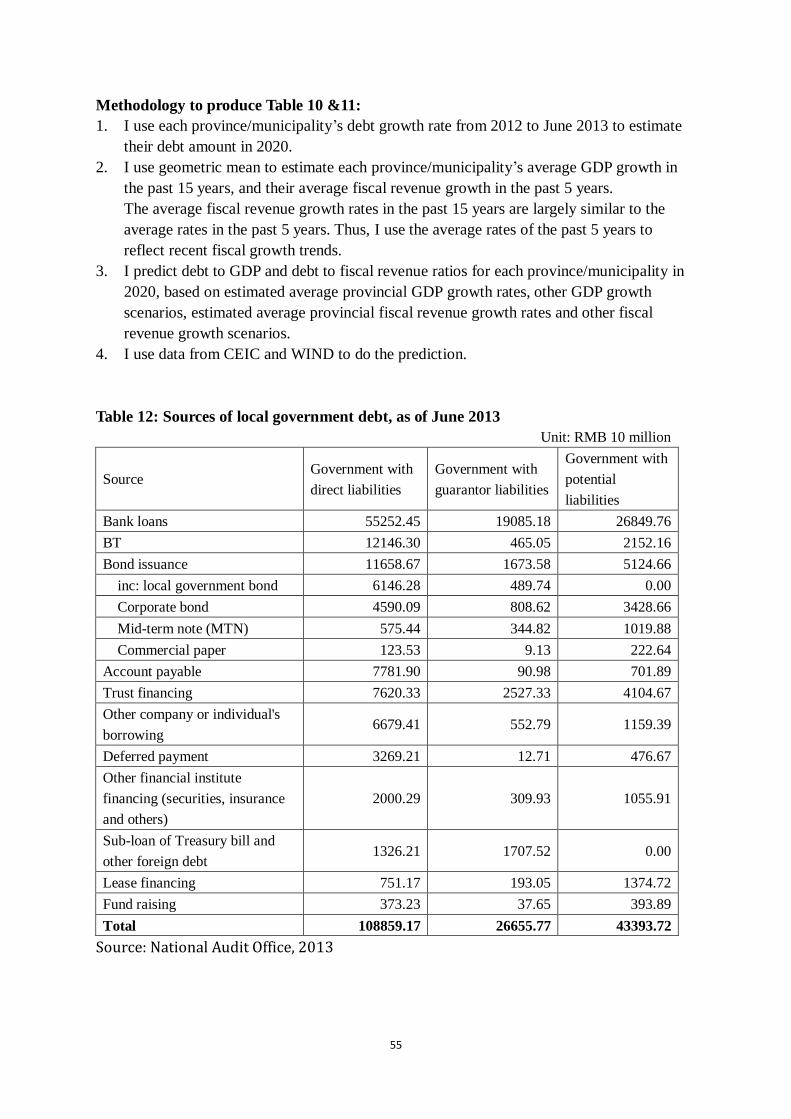
55
Methodology to produce Table 10 &11:
1. I use each province/municipality’s debt growth rate from 2012 to June 2013 to estimate
their debt amount in 2020.
2. I use geometric mean to estimate each province/municipality’s average GDP growth in
the past 15 years, and their average fiscal revenue growth in the past 5 years.
The average fiscal revenue growth rates in the past 15 years are largely similar to the
average rates in the past 5 years. Thus, I use the average rates of the past 5 years to
reflect recent fiscal growth trends.
3. I predict debt to GDP and debt to fiscal revenue ratios for each province/municipality in
2020, based on estimated average provincial GDP growth rates, other GDP growth
scenarios, estimated average provincial fiscal revenue growth rates and other fiscal
revenue growth scenarios.
4. I use data from CEIC and WIND to do the prediction.
Table 12: Sources of local government debt, as of June 2013
Unit: RMB 10 million
Source Government with
direct liabilities
Government with
guarantor liabilities
Government with
potential
liabilities
Bank loans 55252.45 19085.18 26849.76
BT 12146.30 465.05 2152.16
Bond issuance 11658.67 1673.58 5124.66
inc: local government bond 6146.28 489.74 0.00
Corporate bond 4590.09 808.62 3428.66
Mid-term note (MTN) 575.44 344.82 1019.88
Commercial paper 123.53 9.13 222.64
Account payable 7781.90 90.98 701.89
Trust financing 7620.33 2527.33 4104.67
Other company or individual's
borrowing 6679.41 552.79 1159.39
Deferred payment 3269.21 12.71 476.67
Other financial institute
financing (securities, insurance
and others)
2000.29 309.93 1055.91
Sub-loan of Treasury bill and
other foreign debt 1326.21 1707.52 0.00
Lease financing 751.17 193.05 1374.72
Fund raising 373.23 37.65 393.89
Total 108859.17 26655.77 43393.72
Source: National Audit Office, 2013
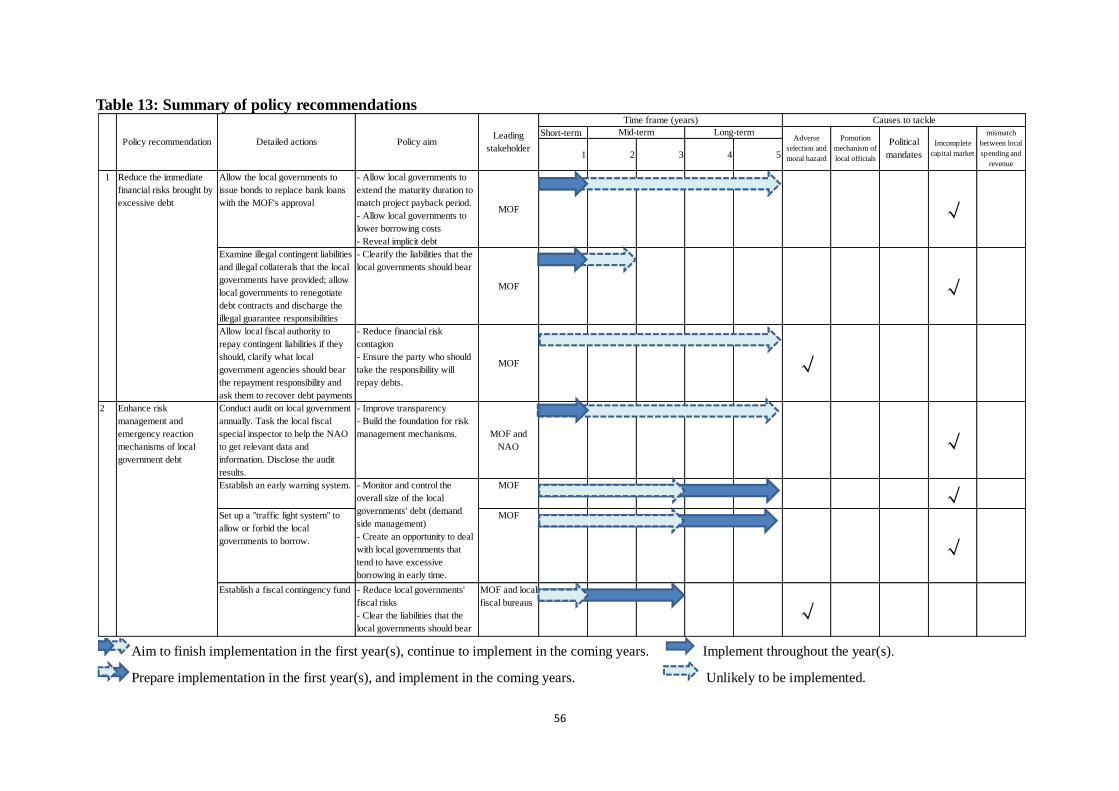
56
Table 13: Summary of policy recommendations
Aim to finish implementation in the first year(s), continue to implement in the coming years. Implement throughout the year(s).
Prepare implementation in the first year(s), and implement in the coming years. Unlikely to be implemented.
Short-term
1 2 3 4 5
Allow the local governments to
issue bonds to replace bank loans
with the MOF's approval
- Allow local governments to
extend the maturity duration to
match project payback period.
- Allow local governments to
lower borrowing costs
- Reveal implicit debt
MOF √
Examine illegal contingent liabilities
and illegal collaterals that the local
governments have provided; allow
local governments to renegotiate
debt contracts and discharge the
illegal guarantee responsibilities
- Clearify the liabilities that the
local governments should bear
MOF √
Allow local fiscal authority to
repay contingent liabilities if they
should, clarify what local
government agencies should bear
the repayment responsibility and
ask them to recover debt payments
- Reduce financial risk
contagion
- Ensure the party who should
take the responsibility will
repay debts.
MOF √
Conduct audit on local government
annually. Task the local fiscal
special inspector to help the NAO
to get relevant data and
information. Disclose the audit
results.
- Improve transparency
- Build the foundation for risk
management mechanisms. MOF and
NAO √
Establish an early warning system. MOF
√Set up a "traffic light system" to
allow or forbid the local
governments to borrow.
MOF
√
Establish a fiscal contingency fund - Reduce local governments'
fiscal risks
- Clear the liabilities that the
local governments should bear
MOF and local
fiscal bureaus
√
Long-termMid-term
Time frame (years) Causes to tackle
Adverse
selection and
moral hazard
Pomotion
mechanism of
local officials
Political
mandates
Imcomplete
capital market
mismatch
between local
spending and
revenue
Enhance risk
management and
emergency reaction
mechanisms of local
government debt
2
- Monitor and control the
overall size of the local
governments' debt (demand
side management)
- Create an opportunity to deal
with local governments that
tend to have excessive
borrowing in early time.
Leading
stakeholderPolicy recommendation Detailed actions Policy aim
Reduce the immediate
financial risks brought by
excessive debt
1
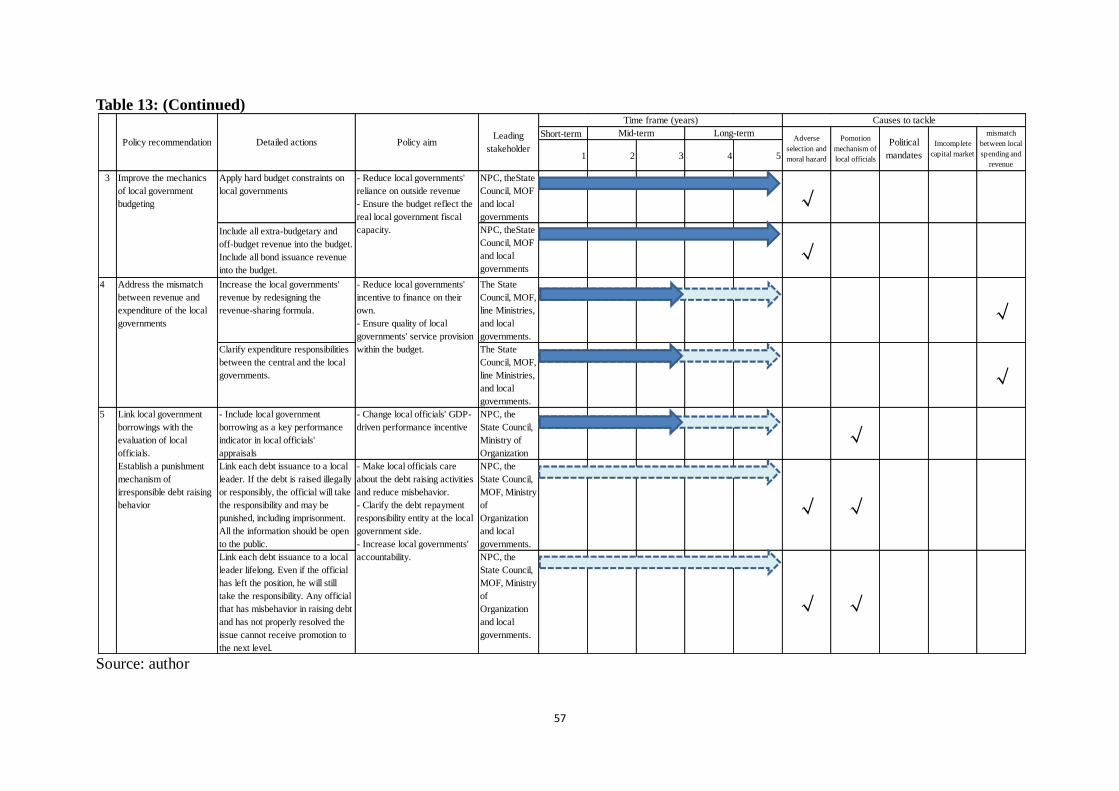
57
Table 13: (Continued)
Source: author
Short-term
1 2 3 4 5
Apply hard budget constraints on
local governments
NPC, theState
Council, MOF
and local
governments
√Include all extra-budgetary and
off-budget revenue into the budget.
Include all bond issuance revenue
into the budget.
NPC, theState
Council, MOF
and local
governments
√Increase the local governments'
revenue by redesigning the
revenue-sharing formula.
The State
Council, MOF,
line Ministries,
and local
governments.
√
Clarify expenditure responsibilities
between the central and the local
governments.
The State
Council, MOF,
line Ministries,
and local
governments.
√
- Include local government
borrowing as a key performance
indicator in local officials'
appraisals
- Change local officials' GDP-
driven performance incentive
NPC, the
State Council,
Ministry of
Organization
√Link each debt issuance to a local
leader. If the debt is raised illegally
or responsibly, the official will take
the responsibility and may be
punished, including imprisonment.
All the information should be open
to the public.
NPC, the
State Council,
MOF, Ministry
of
Organization
and local
governments.
√ √
Link each debt issuance to a local
leader lifelong. Even if the official
has left the position, he will still
take the responsibility. Any official
that has misbehavior in raising debt
and has not properly resolved the
issue cannot receive promotion to
the next level.
NPC, the
State Council,
MOF, Ministry
of
Organization
and local
governments.
√ √
Improve the mechanics
of local government
budgeting
- Reduce local governments'
reliance on outside revenue
- Ensure the budget reflect the
real local government fiscal
capacity.
3
Policy recommendation Detailed actions
Address the mismatch
between revenue and
expenditure of the local
governments
- Reduce local governments'
incentive to finance on their
own.
- Ensure quality of local
governments' service provision
within the budget.
4
Link local government
borrowings with the
evaluation of local
officials.
Establish a punishment
mechanism of
irresponsible debt raising
behavior
5
- Make local officials care
about the debt raising activities
and reduce misbehavior.
- Clarify the debt repayment
responsibility entity at the local
government side.
- Increase local governments'
accountability.
Policy aimLeading
stakeholder
Time frame (years) Causes to tackle
Mid-term Long-termAdverse
selection and
moral hazard
Pomotion
mechanism of
local officials
Political
mandates
Imcomplete
capital market
mismatch
between local
spending and
revenue
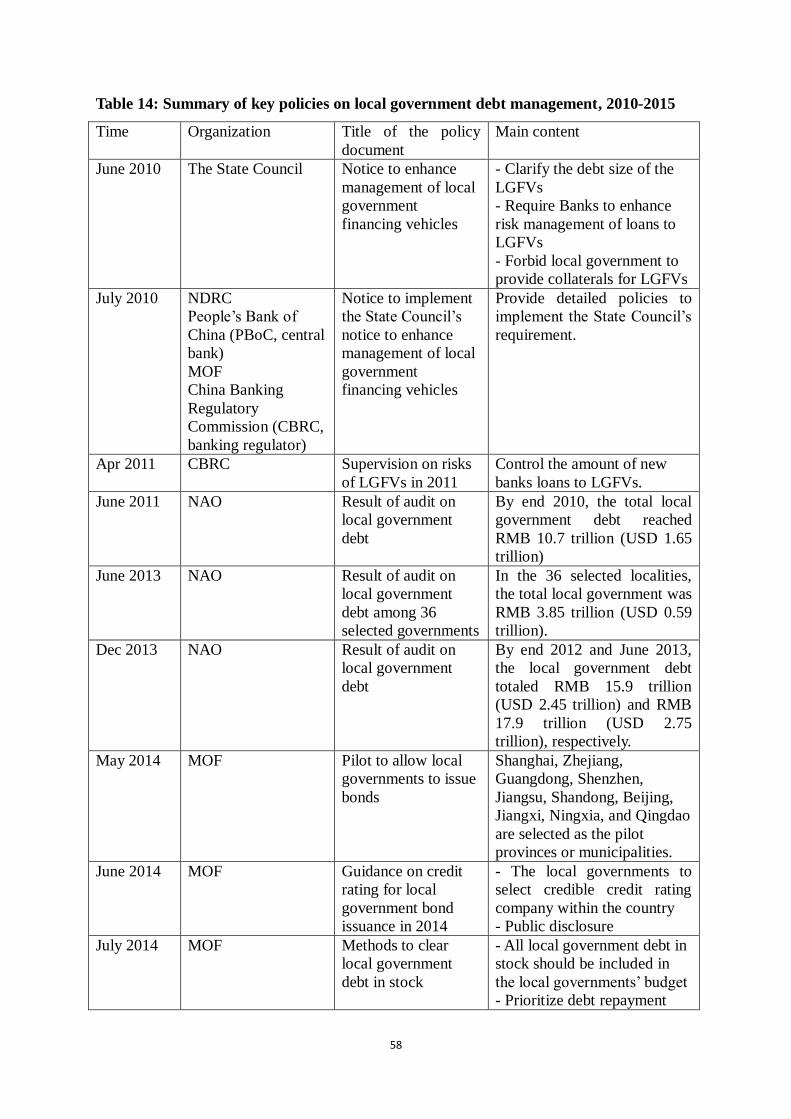
58
Table 14: Summary of key policies on local government debt management, 2010-2015
Time Organization Title of the policy
document
Main content
June 2010 The State Council Notice to enhance
management of local
government
financing vehicles
- Clarify the debt size of the
LGFVs
- Require Banks to enhance
risk management of loans to
LGFVs
- Forbid local government to
provide collaterals for LGFVs
July 2010 NDRC
People’s Bank of
China (PBoC, central
bank)
MOF
China Banking
Regulatory
Commission (CBRC,
banking regulator)
Notice to implement
the State Council’s
notice to enhance
management of local
government
financing vehicles
Provide detailed policies to
implement the State Council’s
requirement.
Apr 2011 CBRC Supervision on risks
of LGFVs in 2011
Control the amount of new
banks loans to LGFVs.
June 2011 NAO Result of audit on
local government
debt
By end 2010, the total local
government debt reached
RMB 10.7 trillion (USD 1.65
trillion)
June 2013 NAO Result of audit on
local government
debt among 36
selected governments
In the 36 selected localities,
the total local government was
RMB 3.85 trillion (USD 0.59
trillion).
Dec 2013 NAO Result of audit on
local government
debt
By end 2012 and June 2013,
the local government debt
totaled RMB 15.9 trillion
(USD 2.45 trillion) and RMB
17.9 trillion (USD 2.75
trillion), respectively.
May 2014 MOF Pilot to allow local
governments to issue
bonds
Shanghai, Zhejiang,
Guangdong, Shenzhen,
Jiangsu, Shandong, Beijing,
Jiangxi, Ningxia, and Qingdao
are selected as the pilot
provinces or municipalities.
June 2014 MOF Guidance on credit
rating for local
government bond
issuance in 2014
- The local governments to
select credible credit rating
company within the country
- Public disclosure
July 2014 MOF Methods to clear
local government
debt in stock
- All local government debt in
stock should be included in
the local governments’ budget
- Prioritize debt repayment
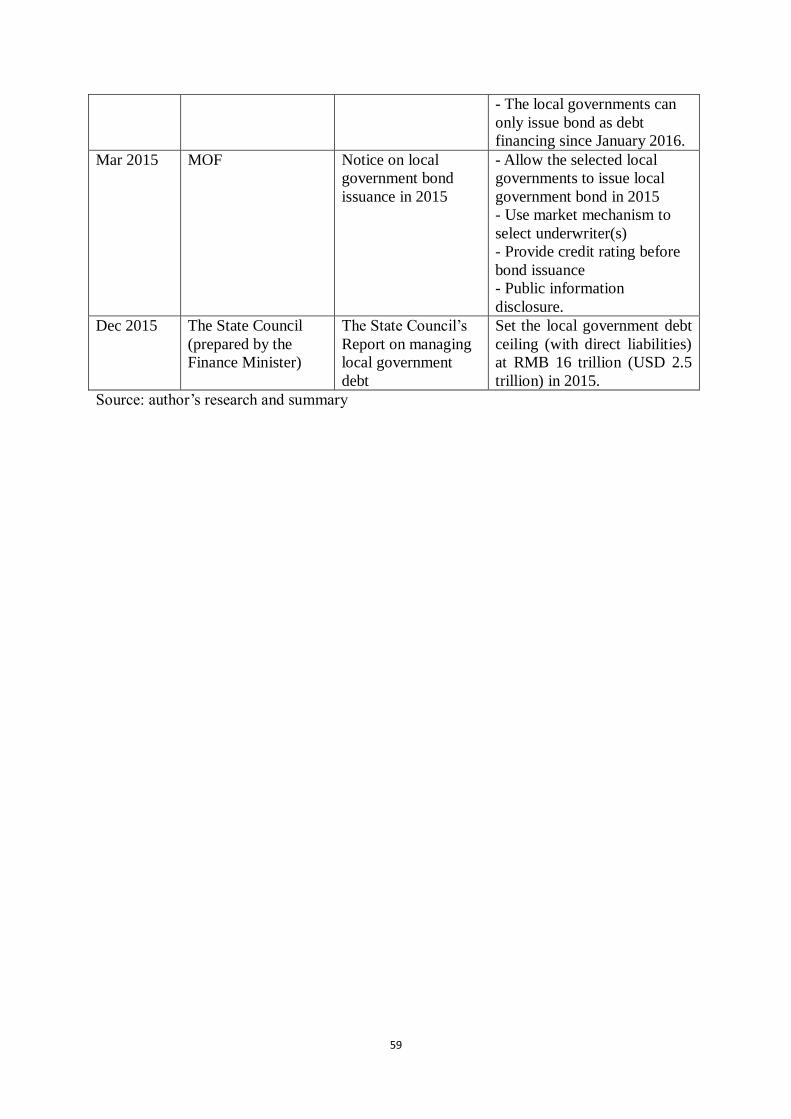
59
- The local governments can
only issue bond as debt
financing since January 2016.
Mar 2015 MOF Notice on local
government bond
issuance in 2015
- Allow the selected local
governments to issue local
government bond in 2015
- Use market mechanism to
select underwriter(s)
- Provide credit rating before
bond issuance
- Public information
disclosure.
Dec 2015 The State Council
(prepared by the
Finance Minister)
The State Council’s
Report on managing
local government
debt
Set the local government debt
ceiling (with direct liabilities)
at RMB 16 trillion (USD 2.5
trillion) in 2015.
Source: author’s research and summary
60
REFERENCE
Alisjahbana, A. S., Soemitro, S., & Ramayandi, A. (2002). Local Government Borrowing: Regional University Research on Decentralization in Indonesia. IRIS Center of the URCI, University of Maryland at College Park.
Allen, M., Rosenberg, C., Keller, C., Setser, B., & Roubini, N. (2002). A Balance Sheet Approach to Financial Crisis. Washington: IMF Working Paper No. 02/210.
Alt, J. E., & Lassen, D. D. (2006). Fiscal Transparency, political parties, and debt in OECD countries. European Economic Review, Vol.50, pp. 1403-1439.
Besfamille, M., & Lockwood, B. (2007). Bailouts in Federations: Is a Hard Budget Constraint Always Best? Warwich: Warwick Economics Research Paper 717.
Bordignon, M. (2004). Fiscal Decentralization: How to Achieve a Hard Budget Constraint. Retrieved from European Commission: ec.europa.eu/economy_finance/events/2004/bxl1104/papers/bordignon_en.pdf
Cao, C., Ma, L., & Shen, X. (2014). Fiscal Pressure, Promotion Pressure, Tenure of Office and Local State-owned Companies' Overinvestment (in Chinese). China Economic Quarterly, Vol.13, pp. 1415-1436.
Chen, Y. (2015). Why All Local Governments Receive AAA Credit Rating? (in Chinese). Retrieved from China Business Network: www.yicai.com/news/2015/06/4631886.html
Chen, Z., Hui, M., & Zhang, J. (2015). Local Government Debt Maturity Mismatch:The Characteristics of Risk and Formation Mechanism. Economic Management Journal, Vol.5, pp. 12-21.
CIIC. (2016). China's Political System: The Local Administrative System. Retrieved 1 14, 2016, from China Internet Information Center: http://www.china.org.cn/english/Political/28842.htm
CR Foundation. (2012). Local Government Debt Budget Management (in Chinese). Retrieved from China Reform Foundation: www.crfoundation.org/filesCser/201203-2.pdf
Crivelli, E., Leive, A., & Stratmann, T. (2010). Subnational Health Spending and Soft Budget Constraints in OECD Countries. Retrieved from The International Monetary Fund: https://www.imf.org/external/pubs/ft/wp/2010/wp10147.pdf
Dabla-Norris, E., & Wade, P. (2002). The Challenge of Fiscal Decentralization in Transition Countries. International Monetary Fund.
Doi, T., Hayashi, T., & Suzuki, N. (2005). Local Government Debt and Local Fiscal Discipline (in Japanese). Tokyo: Japan's Cabinet Office.
Du, T. (2015). Tighter Monitoring on Local Fiscal Funding (in Chinese). Retrieved from Economic Observer: www.eeo.com.cn/2015/0206/272245.shtml
Elmendorf, D. W., & Mankiw, G. N. (1998). Government Debt. Retrieved from Board of Governors of Federal Reserve System: http://www.federalreserve.gov/pubs/feds/1998/199809/199809pap.pdf
Eslava, M. (2007). Chapter 9: The Political Economy of Debt. In E. Borensztein, E. Levy Yeyati, & U. Panizza, Living with Debt: How to Limit the Risks of Sovereign Finance (pp. 171-184). Washington DC: Inter-American Development Bank.
Han, J., & Chen, F. (2015). The Standing Committee of the National People's Congress Approves Debt Limit for Local Governments in 2015 (in Chinese). Retrieved from The National People's Congress of the People's Republic of China: http://www.npc.gov.cn/npc/xinwen/2015-08/31/content_1945486.htm
Han, J., Xi, M., & Shen, C. (2015). Question China's Local Government Debt: Size and Risk (in Chinese). Retrieved from Xinhua News Agency: http://finance.people.com.cn/n/2015/0829/c1004-27531316.html
Hu, Y. (2015). New budget law and local government debt (in Chinese). Retrieved from Caixin Net: http://opinion.caixin.com/2015-03-27/100795332_all.html#page2
Huang, R., & Huang, Z. (2015). Hard Budget Constraints-based Local Government Debt Management (in Chinese). Journal of Jiangsu Administration Institute, Vol.1, pp. 39-44.
IMF. (2014). Fiscal Transparency Code. Retrieved from International Monetary Fund: blog-pfm.imf.org/files/ft-code.pdf
Jia, K., & Bai, J. (1998). Revenue sources of the Chinese Government and Ways to Improve (in Chinese). Economic Research, Vol.6, pp. 46-54.
61
Jin, J., & Zou, H. (2001). Soft-budget Constraint on Local Governments in China. Retrieved from The World Bank: www1.worldbank.org/publicsector/decentralization/hardbudget.htm
Kee, J. E. (2003). Fiscal Decentralization: Theory as Reform. The George Washington University. Kopits, G. (2007). Fiscal Responsibility Framework: International Experience and Implications for Hungary.
Magayar Nemzeti Bank. Lee, J. (1999). US Municipal Bonds. Retrieved from Mount Holyoke College:
https://www.mtholyoke.edu/courses/sgabriel/securities1/bond/usgovt.htm Li, Y. (2015). 2015 local government debt ceiling: implication, influence and recommendations (in Chinese).
Retrieved from Research Institute of International Finance, Bank of China: http://pic.bankofchina.com/bocappd/rareport/201509/P020150907328750804367.pdf
Liu, D., & Chen, J. (2014). Evidence on Credit Rating for Local Government Financing Vehicles (in Chinese). Retrieved from Shanghai Brilliance Credit Rating & Investors Service Co.,Ltd.: http://www.shxsj.com/uploadfile/yanjiu/20141229.pdf
Liu, L. (2010). Strengthening Subnational Debt Financing and Managing Risks. Washington DC: The World Bank & China's Ministry of Finance.
Liu, S., Zhao, Q., Meng, Y., Beilin, F., Li, C., & Licheng, Z. (2012). China's Local Government Debt Stress Test in the 12th Five Year Plan Period (in Chinese). Review of Economic Research, Vol.8, pp. 3-58.
Liu, Z. (2010). Sources and Sizes of China's Local Government Fiscal Revenue (in Chinese). Sub National Fiscal Research, Vol.4, pp. 14-19.
Lou, J. (2014). Promoting Instituionalization and Legalization of Administrative Powers between Governments of Different Levels (in Chinese). Retrieved from China's Ministry of Finance: http://www.mof.gov.cn/zhengwuxinxi/caizhengxinwen/201412/t20141202_1162071.html
Lu, Y., & Sun, T. (2013). Local Government Financing Platforms in China: A Fortune or Misfortune? Retrieved from International Monetary Fund: https://www.imf.org/external/pubs/ft/wp/2013/wp13243.pdf
Ma, J. (2002). Chapter 18. Monitoring Fiscal Risks of Subnational Governments: Selected Country Experiences. In H. P. Brixi, & A. Schick, Government at Risk: Contingent Liabilities and Fiscal Risk. Washington DC: The World Bank.
MIC. (2010). Presentation: Local Government Bond System and Market in Japan. Retrieved from www.ilgc.org.uk/en/pdfs/MIC%20LGB.pdf
MOF. (2008a). International Lesson and Comparison of Local Government Debt Management (in Chinese). Retrieved from China's Ministry of Finance: www.mof.gov.cn/zhengwuxinxi/guojijiejian/200808/t20080815_63360.html
MOF. (2008b). Introduction of Local Government Debt Size Management and Risk Monitoring in Foreign Countries (in Chinese). Retrieved from China's Ministry of Finance: http://yss.mof.gov.cn/zhengwuxinxi/guojijiejian/200809/t20080918_76134.html
MOF. (2014a). Method to Include Existing Local Government Debt into Budgetary Management (in Chinese). Retrieved from China's Ministry of Finance: http://yss.mof.gov.cn/zhengwuxinxi/zhengceguizhang/201410/t20141028_1154561.html
MOF. (2014b). Guidance on Credit Rating for Local Government Bond Issuance Pilot in 2014 (in Chinese). Retrieved from China's Ministry of Finance: http://gks.mof.gov.cn/redianzhuanti/guozaiguanli/gzglzcfg/201406/t20140611_1097736.html
MOF. (2014c). Notice to Enhance Budget Inspection of the Offices of Fiscal Inspectors (in Chinese). Retrieved from China's Ministry of Finance: http://cq.mof.gov.cn/lanmudaohang/tongzhitonggao/201503/W020150303393179105382.pdf
MOF. (2015). Notice on Local Government General Obligation Bond Issuance in 2015 (in Chinese). Retrieved from China's Ministry of Finance: http://gks.mof.gov.cn/redianzhuanti/guozaiguanli/difangzhengfuzhaiquan/201503/t20150320_1205024.html
MOF. (2016). Key Roles of the Budget Department of the Ministry of Finance (in Chinese). Retrieved from China's Ministry of Finance: http://yss.mof.gov.cn/zhengwuxinxi/guanyuwomen/zhongyaozhineng/200805/t20080522_33393.html
NAO. (2011). Result of 2010 Government Auditing (in Chinese). Retrieved from National Audit Office:
62
http://www.audit.gov.cn/n5/n25/c63566/content.html NAO. (2013a). Result of 2013 Government Debt Auditing (in Chinese). Retrieved from National Audit
Office: http://www.audit.gov.cn/n5/n25/c63642/part/27403.pdf NAO. (2013b). Result of Audit on 36 Local Governments, NAO Notice 2013/24 (in Chinese). Retrieved from
National Audit Office: http://www.audit.gov.cn/n1992130/n1992150/n1992500/3291665.html NAO. (2013c). Study on Debt Financing of Local Governments (in Chinese). Retrieved from China's National
Audit Office: http://www.audit.gov.cn/n1992130/n1992210/n1994456/n3352101.files/n3352100.doc
NBS. (2015). Indicator explanantion of 2014 Statistic Year Book (in Chinese). Retrieved 10 31, 2015, from China's National Bureau of Statistics: http://www.stats.gov.cn/tjsj/ndsj/2014/html/note.htm
NPC. (2015). Report on Performance to Manage Local Government Debt by the Budget Committee of the NPC (in Chinese). Retrieved from China's National People's Congress: http://www.npc.gov.cn/npc/xinwen/2015-12/22/content_1955661.htm
OECD. (2002). OECD Best Practices for Budget Transparency. Paris: OECD Publication Service. OECD. (2006). Challenges for China's Public Spending: Toward Greater Effectiveness and Equity. OECD
Pulbishing. OECD. (2011). OECD Economic Surveys: Estonia 2011. OECD Publishing. Olga, K. (2011). Guidebook on Capital Investment Planning for Local Governments. The World Bank:
Washington,DC. PBoC. (1996). General Rules for Loans (in Chinese). Retrieved from People's Bank of China:
http://www.pbc.gov.cn/rhwg/19961202f.htm People's Daily. (2008). China's 4 Trillion Stimulus Package Stimulates the World (in Chinese). Retrieved
from People's Daily Online: http://finance.people.com.cn/GB/1045/8320796.html Peterson, G. E. (2000). Building local credit systems. The World Bank. Peterson, G. E. (2003). Banks or Bonds? Building a Municipal Credit Market. Washington DC: OECD. Qiu, G. (2009). Premier Wen's Explanation of the 4 Trillion Stimulus Package: New Economic Stimulating
Policy at Any Time (in Chinese). Retrieved from China News Net: www.chinanews.com/gn/news/2009/03-13/1600578.shtml
Reuters. (2011). China's local government debt underestimated by 540 billion US dollars, might threaten the banking sector's credit (in Chinese). Retrieved from Reuters: http://cn.reuters.com/article/2011/07/05/idCNnCN181923320110705?pageNumber=1&sp=true
Reuters. (2011). China's local government debt underestimated by 540 billion US dollars, might threaten the banking sector's credit (in Chinese). Retrieved from Reuters: http://cn.reuters.com/article/2011/07/05/idCNnCN181923320110705?pageNumber=1&sp=true
Shao, J., Zhou, S., & Xu, M. (2014). Study on the Audit Report of the Local Government Debt (in Chinese). Retrieved from The Audit Office of Zhoushan City: www.zssj.gov.cn/uploadfile/20143/2014314135059.doc
Shen, C., & Zou, H. (2006). Fiscal Decentralization in China: Main Challenges and Reform Steps (in Chinese). Retrieved from World Bank: http://siteresources.worldbank.org/INTPUBSERV/Resources/477250-1165612792742/Zou.fiscal_decentralization.chinese.12-21-2006.pdf
Shen, L., & Zhang, H. (2013). Study on Motives and Necessicity of Local Government Investment: Evidence from the 4 Trillion Stimulus Package (in Chinese). Journal of Dongbei University of Finance and Economics,Vol. 2, pp. 70-74.
State Council. (2014a). The State Council's Announcement to Enhancing Local Government Debt Management (in Chinese). Retrieved from The Chinese National Government: http://www.gov.cn/zhengce/content/2014-10/02/content_9111.htm
State Council. (2014b). National Modern Urbanization Plan (2014-2020) (in Chinese). Retrieved from The State Council: http://www.gov.cn/zhengce/2014-03/16/content_2640075.htm
State Council. (2015). The State Council's Notice to Activate Stock Fiscal Resources (in Chinese). Retrieved from China's State Council: www.gov.cn/zhengce/content/2015-01/21/content_9408.htm
Ter-Minassian, T., & Craig, J. (1997). Chapter 7: Control of Subnational Government Borrowing. In T. Ter-Minassian, Fiscal Federalism in Theory and Practice (pp. 156-172). Washington DC: International Monetary Fund.
63
US Bank. (2013). Newsletter: Today Government Banking. Retrieved from US Bank: https://www.usbank.com/cgi_w/cfm/inst_govt/products_and_services/pdf/6533_GNP_TODAY_Newsletter_2013.pdf
Vera, R. D., & Yun-Hwan, K. (2003). Local Government Finance, Private Resources, and Local Credit Markets in Asia. Manila: Asian Development Bank.
Wang, C. (2015). Urgent to Establish China's Credit Rating System (in Chinese). Retrieved from China Academy of Social Sciences: http://www.china.com.cn/opinion/think/2015-05/06/content_35499448.htm
Wang, L., & Zhang, H. (2013). Fiscal Decentralization, Transfer and Local Governments' Investment Efficiency (in Chinese). Contemporary Finance and Economics,Vol. 6, pp. 27-33.
Webb, S. B. (2001). Argentina: Hardening the Provincial Budget Constraint. Retrieved from The World Bank: www1.worldbank.org/publicsector/decentralization/hardbudget.htm
Wong, C. (1999). Extrabudgetary funds. China: The World Bank. World Bank. (2009). Debt Management Performance Assessment (DeMPA) Tool. Washington, DC: The
World Bank. Wu, A. M. (2013). How Does Decentralized Governance Work? Evidence from China. Journal of
Contemporary China, Vol.22, pp. 379-393. Xu, X., & Yan, Y. (2014). Does government investment crowd out private investment in China? (in Chinese)
Journal of Economic Policy Reform, pp. 1-12. Yang, H. (2013). Debt Repaymanet Reserve Fund: Cure the Symptoms, Not the Disease (in Chinese).
Retrieved from China Economic Herald: www.ceh.com.cn/jryw/2013/174858.shtml Yilmaz, S., Beris, Y., & Serrano-Berthet, R. (2008). Local Government Discretion and Accountability: A
Diagnostic Framework for Local Governance. The World Bank. Zhang, R., & Sun, J. (2012). Evidence on Fiscal Decentralization's Impact on the Efficiency of Local
Government Investment (in Chinese). Informationization of Management in China, 15, pp. 25-27. Zhang, S., Shan, B., & Li, Y. (2012). International Experience and Implications of Local Government Debt
Management (in Chinese). Jilin Finance Research, Vol.7, pp. 29-33. Zhao, Y. (2014). Background Review: China's Fiscal Decentralization History (in Chinese). Retrieved from
Zhejiang University: person.zju.edu.cn/attachments/2014-05/07-1401349109-675288.pdf Zhou, L. (2007). Study on the Promotion Model of Local Government Offiicals in China (in Chinese).
Economic Research, Vol.7, pp. 36-50. Zou, X. (2013). Study on Allowing Local Government's Debt Financing in China (in Chinese). Retrieved from
China's National Audit Office: http://www.audit.gov.cn/n6/n39/n61/c1381/content.html