Embed Size (px)
Citation preview

Robert A. Barton Inspector General Office of the Inspector General
Second Report on CDCR’s Progress Implementing its Future of California Corrections Blueprint
October 2013

Office of the Inspector General Second Report on CDCR’s Progress Implementing its Future of California Corrections Blueprint
Robert A. Barton Inspector General Roy W. Wesley Chief Deputy Inspector General James C. Spurling Chief Counsel Renee L. Hansen Executive Director, California Rehabilitation Oversight Board Public Information Officer 10111 Old Placerville Road, Suite 110 Sacramento, CA 95827 Telephone: 916-255-1102 Facsimile: 916-255-1403 October 2013
TABLE OF CONTENTS FOREWORD
REHABILITATIVE PROGRAMS…………………………………………..………… 1
In-PrisonTarget Population ................................................................................................... 1
In-Prison Rehabilitation Goal – Current Status ............................................................. 2
In-Prison Program Placement: Case Management and Reentry Hubs ........................... 5
In-Prison Programs – Miscellaneous Benchmarks ......................................................... 6
Community Rehabilitative Programs .......................................................................... 10
STANDARDIZED STAFFING ..................................................................................... 12
Standardized Staffing – Background ........................................................................... 12
Goals and Benchmarks ................................................................................................ 12
Review of Staffing Patterns and Payroll....................................................................... 13
INMATE CLASSIFICATION SCORE SYSTEM ...................................................... 15
Modification of the Inmate Classification Score System ............................................... 15
ICSS – Miscellaneous Data Benchmarks..................................................................... 17
GANG MANAGEMENT ............................................................................................... 22
Security Threat Group – Gang Management Program ................................................ 22
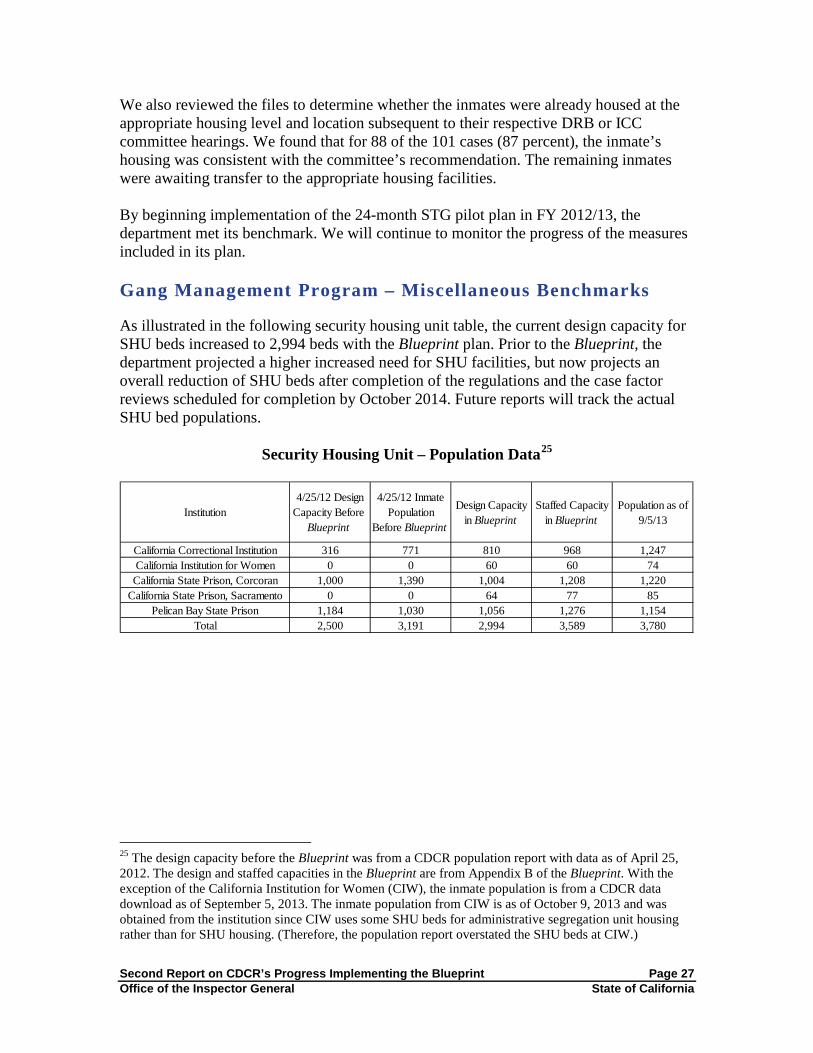
Gang Management Program – Miscellaneous Benchmarks ......................................... 27
COMPREHENSIVE HOUSING PLAN ....................................................................... 28
Institution Housing Plans ............................................................................................. 28
Housing Plan – Miscellaneous Benchmarks ................................................................. 29
Housing Plan – Global Benchmarks ............................................................................ 33
CONCLUSION ............................................................................................................... 34
APPENDICES ................................................................................................................. 36
APPENDIX A – STANDARDIZED STAFFING ......................................................... 37
APPENDIX B – HOUSING PLANS ............................................................................. 73
APPENDIX C – PROGRAMMING PLANS ............................................................. 112
APPENDIX D – CORE COMPAS ASSESSMENTS ................................................ 149

Second Report on CDCR’s Progress Implementing the Blueprint Foreword Office of the Inspector General State of California
FOREWORD In July 2012, the Office of the Inspector General’s (OIG) oversight role was expanded when the Legislature tasked the OIG with monitoring the California Department of Corrections and Rehabilitation’s (CDCR or department) adherence to The Future of California Corrections: A Blueprint to Save Billions of Dollars, End Federal Court Oversight, and Improve the Prison System (the Blueprint). To monitor implementation of the Blueprint, the Legislature passed and the Governor signed legislation adding language to California Penal Code section 6126 mandating the OIG to periodically review delivery of the reforms identified in the Blueprint, including, but not limited to, the following specific goals and reforms described in the Blueprint: Whether the department has increased the percentage of inmates served in
rehabilitative programs to 70 percent of the department’s target population prior to their release;
The establishment of and adherence to the standardized staffing model at each institution;
The establishment of and adherence to the new inmate classification score system;
The establishment of and adherence to the new prison gang management system, including changes to the department’s current policies for identifying prison-based gang members and associates and the use and conditions associated with the department’s secured housing units; and
The implementation of and adherence to the comprehensive housing plan described in the Blueprint.
To assess and monitor the reforms published in the Blueprint, the OIG identified measurable benchmarks in the Blueprint, researched the various aspects of the benchmarks, collected and assessed documents and electronic databases, interviewed numerous staff from CDCR and the Department of Finance (DOF), developed a monitoring tool, and compared the assessment results with goals identified in the Blueprint. The OIG also performed on-site reviews at each of the 34 adult institutions that included the review and reconciliation of documents, interviews of staff, and observations. One major obstacle that we encountered during our review is that the published version of the Blueprint was not final. As stated in the Blueprint, the staffing standards at some of the prisons had yet to be assessed, so conceptual staffing standards were published. The department considers Standardized Staffing Version 5 (SSV5) to be the final version. That version was not published, but its updated information was provided to us for assessment. According to CDCR management, the department was authorized to amend the detail of the staffing numbers after completing an overall assessment, but could not exceed the total

Second Report on CDCR’s Progress Implementing the Blueprint Foreword Office of the Inspector General State of California
departmental staffing numbers identified in the published version of the Blueprint, as those are the staffing numbers that were ultimately approved by the Legislature during the budget process. This report represents the results of our second review of CDCR’s implementation of the Blueprint. It is important to note that many of the reforms contained in the Blueprint have implementation dates well into 2015 (and beyond); therefore, some of the contents of this second report are preliminary. In summary, the department has demonstrated progress in implementing its Blueprint goals in most categories we reviewed. Specifically:
• Various rehabilitation measures have been established or are in development; however, the department is not close to meeting its overarching goal of providing rehabilitative services to 70 percent of its target inmate population prior to the inmates’ release from prison.
• The department has established and is adhering to the standardized staffing model at each institution.
• The department has established and is adhering to the new inmate classification score system.
• The department has established the new prison gang management system and is undergoing a 24-month pilot program to implement and assess the new procedures.
• The department has implemented and is adhering to the comprehensive housing plan described in the Blueprint.
The department has demonstrated good initial progress implementing its Blueprint goals. The first report published served as a baseline for the department’s initial efforts to implement its plan. This report is based on some information as recent as October 9, 2013, and subsequent reports will assess its progress meeting specified future benchmarks and goals of the Blueprint.

Second Report on CDCR’s Progress Implementing the Blueprint Page 1 Office of the Inspector General State of California
REHABILITATIVE PROGRAMS The department provides in-prison programming to adult offenders, including academic education, career technical education (CTE) (formerly vocational), substance abuse treatment, cognitive-based behavioral programs, transitional services, and employment programs. In the Blueprint, the department indicated its goal is to increase the percentage of inmates served in rehabilitative programs to 70 percent of the department’s target population prior to their release. The Blueprint does not identify a milestone for when the goal is to be met; however, CDCR identifies June 30, 2015, as the projected completion date.1 The department also avails community programming to inmates released from prison. The department indicated its goal as stated in the Blueprint is to build program capacity by fiscal year (FY) 2013/14 to accommodate 70 percent of parolees who have a need for substance abuse treatment, employment services, or education within their first year of being released from prison.
In-Prison Target Population The department uses concepts identified in the California Logic Model to determine its target population for rehabilitative programs. That model requires the calculation of the inmate’s risk to re-offend coupled with an assessment of the inmate’s criminogenic needs to determine whether the inmate is included in the target population. The department uses the results of the California Static Risk Assessment (CSRA) tool to identify the inmate’s risk to re-offend. The level of an inmate’s criminogenic need is assessed based on the results of the Correctional Offender Management Profiling for Alternative Sanctions (COMPAS) tool. If the CSRA results show a high or moderate risk to re-offend and the results of COMPAS show a high or medium need in any of the criminogenic categories,2 the inmate becomes part of CDCR’s target population for rehabilitation.3 Data4 summarized in the following table indicates that of the 132,439 inmate population, 96 percent had received a CSRA risk assessment and 45 percent had received a core
1 CDCR’s revised Strategic Plan (draft) identifies June 30, 2015, as the date to reach the 70 percent rehabilitation goal.
2 The criminogenic need categories can include any of the following: academic education, career technical education (CTE), substance abuse treatment (SAT), and criminal thinking, anger, family, and employment needs.
3 Being included in the target population does not necessarily trigger the placement of inmates into specific programs. The results of COMPAS are used for placement into cognitive behavioral treatment and employment programs, but CDCR uses individual case factors for placement into other programs, such as, the Test of Adult Basic Education (TABE) results for placement into academic programs.
4 The data set was provided by CDCR and contains data as of July 30, 2013.

Second Report on CDCR’s Progress Implementing the Blueprint Page 2 Office of the Inspector General State of California
COMPAS assessment. Of those inmates with a CSRA assessment, 69,743 (55 percent) had a high or moderate risk to re-offend. Of those, 47,535 inmates (68 percent) were identified as having a high or medium criminogenic need, thus representing the target population on that day. The target population would likely be much larger if the COMPAS assessment was provided to a larger percentage of inmates, since 79 percent of inmates who receive a core COMPAS assessment eventually become part of the target population based on the data provided.
Risk and Needs Assessment by Target Population
Total Inmate Population 132,439 Data as of 7/30/13
Inmates with CSRA Assessment 127,651 96% Percent in relation to inmate population
Inmates with High/Moderate CSRA Score 69,743 55% Percent in relation to inmates with CSRA
Inmates with Core COMPAS Assessment 60,250 45% Percent in relation to inmate population
Target Population 47,535 68% Target divided by number with high/mod CSRA
% of Inmates who Receive COMPAS Assessment Who Become Target 79% Target population divided by COMPAS count In-Prison Rehabilitation Goal – Current Status
While the department has made strides in implementing some measures to reach some benchmarks identified in the Blueprint, the goal to reach 70 percent of the target population is far from being attained as it has demonstrated only a 13 percent rate of accomplishment during the fourth quarter of FY 2012/13. That represents a 1 percent decrease from that identified in our last report. The Blueprint calls for an increase in academic and CTE instructors over a two-year period to increase the number of program slots available for inmates. While the academic education and CTE programs are available at the adult institutions statewide, the other programs are primarily available at 13 institutions designated as reentry hubs, geared toward inmates within 48 months of their release. As illustrated in the chart below, approximately 69 percent of the department’s target population is within 48 months of release, and require more immediate rehabilitative efforts based on the projected release dates.
Projected Release Timeframe Inmates Percent0-6 Months 7,676 16.1%
7-12 Months 7,254 15.3%13-24 Months 9,358 19.6%25-36 Months 5,318 11.2%37-48 Months 3,370 7.1%49-60 Months 2,455 5.2%
60-120 Months 6,589 13.9%Over 120 Months 5,133 10.8%
Unusable Data Regarding Release Date 382 0.8%Total Target Population 47,535 100.0%
Target Population by Projected Release Date

Second Report on CDCR’s Progress Implementing the Blueprint Page 3 Office of the Inspector General State of California
The planned programs at each institution are summarized in Appendix B of the Blueprint. It is important to note that the reentry hub programs, additional services, and some rehabilitative slots identified in the Blueprint are not scheduled to be implemented until FY 2013/14, and other reforms, such as, case management, are still in the pilot stage. Subsequent to July 2014, we will better assess the department’s completion of this goal. The following tables identify inmates who were released during the last two fiscal years and whether their rehabilitation needs were met while in custody.5 The numbers in the category of “some needs met” indicate that offenders had criminogenic needs in multiple categories and participated in rehabilitative services that addressed at least one, but not all, of the categories. The department considers “all needs met” for inmates who have participated in rehabilitative services in each of their criminogenic needs. It should also be noted that whether the inmate attended one day of class or completed the entire program, the department counts that as participation. We recommend a more meaningful measure of participation, such as, a reasonable program completion percentage or an average number of days in a program to count as “participation.” The data reported by the department illustrates progress providing in-prison rehabilitative services in the last year. In FY 2011/12, an average of 11 percent of inmates with criminogenic needs had their needs completely met. In FY 2012/13 the percentage increased to an average of 13 percent, and additional progress is demonstrated by a 7 percent increase in the “some needs met” category from 22 percent in FY 2011/12 to 29 percent in FY 2012/13. Although there was overall progress in the last year from the prior year, the last two quarters during FY 2012/13 showed regression from the prior two quarters by 1 percent. Percent of In-Prison Rehabilitative Needs Met for Offenders Released - FY 2011/12
1st Qtr 2nd Qtr 3rd Qtr 4th Qtr Totals
Count Percent Count Percent Count Percent Count Percent Count PercentAll Needs Met 732 14% 647 9% 643 11% 569 11% 2,591 11%Some Needs Met 1,054 19% 1,433 21% 1,375 23% 1,383 27% 5,245 22%No Needs Met 3,634 67% 4,873 70% 4,078 66% 3,238 62% 15,823 67%Total 5,420 100% 6,953 100% 6,096 100% 5,190 100% 23,659 100%
Percent of In-Prison Rehabilitative Needs Met for Offenders Released - FY 2012/13
1st Qtr 2nd Qtr 3rd Qtr 4th Qtr Totals
Count Percent Count Percent Count Percent Count Percent Count PercentAll Needs Met 654 14% 619 14% 525 13% 518 13% 2,316 13%Some Needs Met 1,360 29% 1,284 29% 1,207 30% 1,104 27% 4,955 29%No Needs Met 2,659 57% 2,487 57% 2,280 57% 2,472 60% 9,898 58%Total 4,673 100% 4,390 100% 4,012 100% 4,094 100% 17,169 100% 5 The data was provided by CDCR.
Second Report on CDCR’s Progress Implementing the Blueprint Page 4 Office of the Inspector General State of California
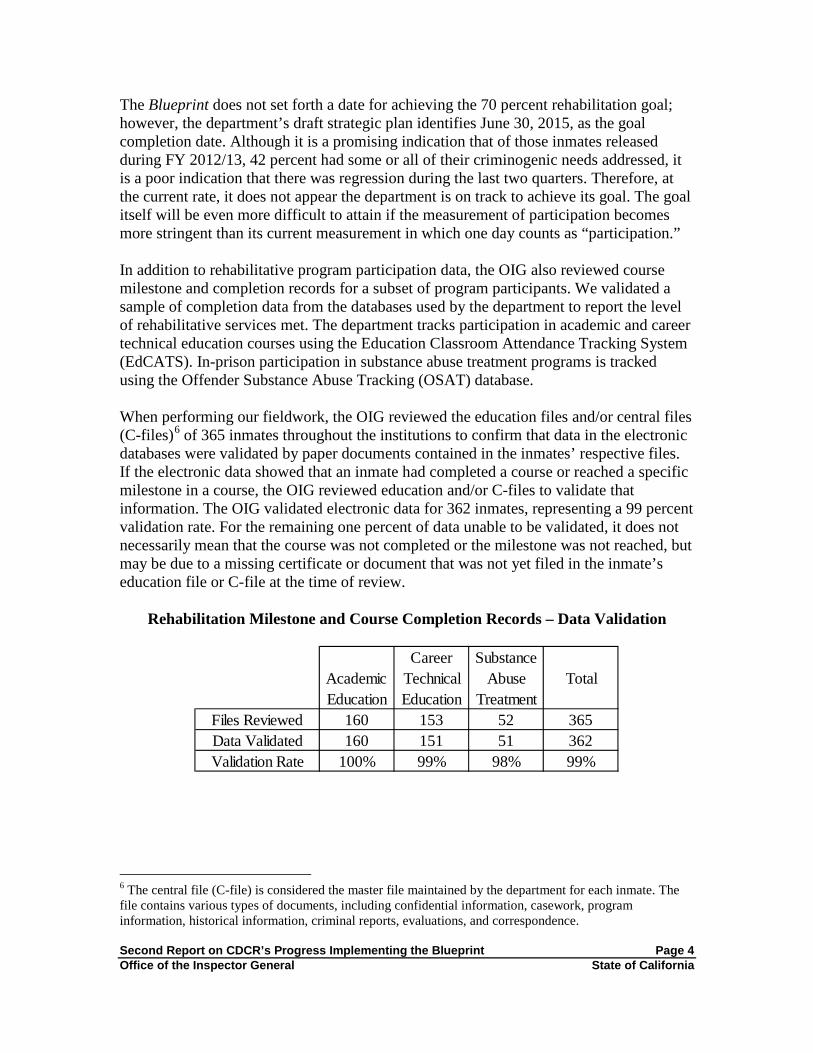
The Blueprint does not set forth a date for achieving the 70 percent rehabilitation goal; however, the department’s draft strategic plan identifies June 30, 2015, as the goal completion date. Although it is a promising indication that of those inmates released during FY 2012/13, 42 percent had some or all of their criminogenic needs addressed, it is a poor indication that there was regression during the last two quarters. Therefore, at the current rate, it does not appear the department is on track to achieve its goal. The goal itself will be even more difficult to attain if the measurement of participation becomes more stringent than its current measurement in which one day counts as “participation.” In addition to rehabilitative program participation data, the OIG also reviewed course milestone and completion records for a subset of program participants. We validated a sample of completion data from the databases used by the department to report the level of rehabilitative services met. The department tracks participation in academic and career technical education courses using the Education Classroom Attendance Tracking System (EdCATS). In-prison participation in substance abuse treatment programs is tracked using the Offender Substance Abuse Tracking (OSAT) database. When performing our fieldwork, the OIG reviewed the education files and/or central files (C-files)6 of 365 inmates throughout the institutions to confirm that data in the electronic databases were validated by paper documents contained in the inmates’ respective files. If the electronic data showed that an inmate had completed a course or reached a specific milestone in a course, the OIG reviewed education and/or C-files to validate that information. The OIG validated electronic data for 362 inmates, representing a 99 percent validation rate. For the remaining one percent of data unable to be validated, it does not necessarily mean that the course was not completed or the milestone was not reached, but may be due to a missing certificate or document that was not yet filed in the inmate’s education file or C-file at the time of review.
Rehabilitation Milestone and Course Completion Records – Data Validation
AcademicEducation
Career Technical Education
SubstanceAbuse
TreatmentTotal
Files Reviewed 160 153 52 365Data Validated 160 151 51 362Validation Rate 100% 99% 98% 99%
6 The central file (C-file) is considered the master file maintained by the department for each inmate. The file contains various types of documents, including confidential information, casework, program information, historical information, criminal reports, evaluations, and correspondence.

Second Report on CDCR’s Progress Implementing the Blueprint Page 5 Office of the Inspector General State of California
In-Prison Program Placement: Case Management and Reentry Hubs According to the Blueprint, a component critical to successful implementation of the rehabilitation plan is an effective case management system. The goal of the new automated case management system is to help place the inmate in the appropriate program at the appropriate time. According to the department, a COMPAS pilot program to evaluate the automated case plan management system commenced at the Central California Women’s Facility (CCWF) on July 2, 2012. This is a 24-month program to monitor each participant for a period of 18 months. The participants are inmates who are identified for placement consistent with their criminogenic need. Initially, the department targeted 250 inmates for participation. However, inmate participation in the pilot program declined after the conversion of neighboring Valley State Prison for Women to a male facility. At that point, inmates at CCWF were presented with transfer opportunities to the California Institution for Women (CIW), which were unavailable before the conversion. Transfers decreased pilot program participation to only 54 of the initial 250 participants. The program now has 58 participants with an additional three who have paroled. There is also a population of inmates at CIW serving as a control group for comparison purposes only. Preliminary comparisons of the effectiveness of the automated case plan process versus the use of the current classification process have not yet been measured. The department expects to complete the evaluation by the end of December 2013, with the pilot ending June 30, 2014. If the program is proven successful in assisting the placement of offenders in appropriate programs, an action plan will be developed to implement it statewide. Future OIG Blueprint reports will make public this information. The department reports that it is also reviewing the case management module of the Strategic Offender Management System (SOMS) for possible consideration, in the event the pilot is unsuccessful. Another component not specifically categorized in the Blueprint that directly impacts appropriate inmate program placement is expanded use of the COMPAS assessment tool. While COMPAS helps identify the target population, it does not currently determine the placement of inmates into most programs.7 As described earlier, only 45 percent of the current inmates had received a core COMPAS assessment to determine their criminogenic needs. However, in an effort to increase the amount of rehabilitation needs data, the department submitted emergency regulations to the Office of Administrative Law (OAL) that require an automated needs assessment tool (currently COMPAS) to be administered to all inmates during the reception center process, as this was previously voluntary. The regulations require the tool to be administered to inmates during their
7 While COMPAS is currently used for placement into substance abuse treatment programs, it is not a main consideration for other programs. Also, results of COMPAS assessments are broad and do not specifically identify a particular course needed. For example, the result can identify a high need for a career technical education course, but does not identify the specific course. The inmate, in conjunction with the correctional counselor, must request a course of interest and then go through the placement process for enrollment.

Second Report on CDCR’s Progress Implementing the Blueprint Page 6 Office of the Inspector General State of California
initial or annual review process if it had not been previously administered. The regulations were approved and became permanent on February 25, 2013. These adopted regulations could substantially increase the percentage of inmates who are administered a COMPAS assessment, thereby providing CDCR with more data to be used for appropriate placement into programs.8 Given the recent regulations, we expect to see a much higher percentage of inmates who have received a COMPAS assessment in future reports. In the last report, we identified the combined number of core and reentry COMPAS assessments provided to inmates. In this report we identify only the core COMPAS assessments since that pertains to the in-prison rehabilitation programs. Despite identifying a combined number of COMPAS assessments in the last report, we have still seen an increase from 44 percent identified in our last report to 45 percent reported now. Appendix D provides a breakdown on the percentages of inmates with core COMPAS assessments identified at each institution. One other component of program placement is the establishment of reentry hubs. Reentry hubs were established to provide relevant rehabilitation services to inmates who are within 48 months of being released and who have demonstrated a willingness to take advantage of such services. The Blueprint identified 13 institutions that would be designated as reentry hubs. However, the department since changed the designation of two reentry hubs to standard sites and two standard sites to reentry hubs. So while the location of reentry hubs has been established, the implementation of enhanced programming is set to begin in FY 2013/14. At the conclusion of our fieldwork, no reentry hubs were fully operational. However, by providing education, employment, cognitive-behavior, and substance abuse programs, the department reports that four reentry hubs became operational in September 2013 at the following institutions: California Institution for Women, California Men’s Colony, Central California Women’s Facility, and Ironwood State Prison. We will verify that during the course of future fieldwork and our next report will identify the number of reentry hubs that have since been fully established.
In-Prison Programs – Miscellaneous Benchmarks The Blueprint identified miscellaneous benchmarks in its narrative and Appendix B. We have attempted to monitor the status of the benchmarks wherever there were measurable figures. As mentioned earlier, when the Blueprint was published, not all the staffing numbers were final. The department considers SSV5 to contain the final staffing numbers. Also, the department changed the designation of two reentry hubs and two standard sites. 8 For clarification purposes, CDCR does not currently transfer inmates to specific institutions solely based on the inmates’ program needs. Other factors, such as, security, safety, health issues, and individual case factors, take precedence in determining institution placement. Once the automated case management system is refined and implemented, it is anticipated that rehabilitation needs will contribute more toward program and/or institution placement.

Second Report on CDCR’s Progress Implementing the Blueprint Page 7 Office of the Inspector General State of California
The OIG performed fieldwork to determine the operational status of the various programs at each institution. In order to determine the operational status of programs, we acquired the SSV5 final rehabilitation authorized position counts and the detail of the authorized positions per institution from CDCR. The OIG then reviewed payroll reports of rehabilitation employees, reconciled the budgeted positions and discussed any discrepancies with the education managers at the institutions, reviewed monthly attendance reports, and conducted spot checks of classrooms. In order to be deemed fully operational, a course needed to have a corresponding instructor, an assigned classroom, and data showing monthly inmate attendance. Appendix C provides a detailed comparison of the rehabilitation programs provided at each institution, identifying the programs as planned for both in the initial Blueprint and SSV5, and their current operational status. In addition to Appendix C, the following summary discusses miscellaneous programs identified in the Blueprint and describes their current status. In short, our fieldwork9 at all prisons found that 93 percent of the academic education programs are operational, 83 percent of the career technical education programs are operational, and 80 percent of the substance abuse treatment slots are filled. This represents a 3 percent increase in academic education programs, a 9 percent increase in career technical education programs, and a 16 percent decrease in substance abuse treatment participation10 from that identified in our last report. Academic Education: The Blueprint identified an additional 151 academic teachers to be added over a two-year period to the department’s staffing of 418 positions. Of the 151 new positions, 81 were scheduled to become operational in FY 2012/13. However, in the final version (SSV5), that number was reduced by eight positions to establish a substitute teacher pool. From July through August, our staff reviewed the institutions’ documents and performed site visits to determine whether 491 academic positions were fully operational. At the conclusion of our fieldwork, we found 455 of the 491 positions were fully operational, which represents a 93 percent rate of compliance. It is reasonable to expect a 5 percent vacancy rate due to attrition and that is the reason the positions were funded with a 5 percent salary savings requirement. Given those facts, the 93 percent compliance rate is commendable. Additionally, it represents a 3 percent increase from that identified in our last report. Career Technical Education: The Blueprint identified an additional 98 CTE instructors to be added over a two-year period to the department’s staffing of 182 positions. Of the 98 positions, 42 were scheduled to become operational in FY 2012/13. From July through August, our staff reviewed the institutions’ documents and performed site visits to determine whether 224 vocational positions were fully operational. At the conclusion of 9 For purposes of determining whether rehabilitation programs were operational, the fieldwork was performed throughout July and August 2013. Therefore, the statistics do not account for programs that became operational after the site visits took place at the individual prisons. 10 The department reports that the drop in substance abuse treatment participation is attributed to the ramping down of existing contracts in preparation of the September 2013 reentry hub activations.

Second Report on CDCR’s Progress Implementing the Blueprint Page 8 Office of the Inspector General State of California
our fieldwork, we found 185 of the 224 positions were fully operational, which represents an 83 percent rate of compliance with the Blueprint. This represents a 9 percent increase from that identified in our last report. Substance Abuse Treatment: Other than articulating that the substance abuse treatment programs would be located at reentry hubs, the Blueprint did not provide new substance abuse treatment information in its narrative. In Appendix B, the Blueprint did identify an additional 148 substance abuse treatment slots to be added to its FY 2011/12 capacity of 1,528 slots. However, the contract for the substance abuse treatment at the Valley State Prison (VSP) was to provide a gender-responsive program for women, and when VSP was converted to a male prison, 120 slots were transferred to the neighboring CIW institution. Since VSP was allocated 140 slots in the Blueprint, this temporarily reduced the number of substance abuse treatment slots by 20, for a FY 2012/13 departmental total of 1,656 available slots. When we performed our fieldwork during July and August 2013, the programs we reviewed had an operational level of 1,416 slots (240 less than the FY 2012/13 total). This was due to 120 slots at the California State Prison, Solano, no longer existing because, as described earlier, this was one of the programs that was originally designated as a reentry hub but later changed to a standard site. The other 120 slots that were reduced in terms of the capacity count were the slots from VSP that were transferred to CCWF. Since the VSP program was slated to commence in early FY 2013/14, the extra 120 slots at CCWF were not continued. At the conclusion of our fieldwork, 1,137 inmates occupied the 1,416 operational slots, which represents an 80 percent filled capacity rate. This represents a 16 percent decrease from that identified in our last report. It should be noted that the substance abuse programs are five-month programs and if inmates either fall out or elect to exit the program prior to its completion, other inmates cannot enter the program in midstream so that impacts the participation rate. For FY 2013/14, the department plans on expanding its substance abuse treatment slots from the projected 1,720 slots identified in the Blueprint to 1,902 slots. This includes providing substance abuse treatment programs at some non-reentry hubs. Cognitive Behavioral Therapy: The Blueprint identified these programs to be implemented during FY 2013/14; therefore, they were not available for review during this monitoring period. However, the department reports that four were to become operational in September 2013. Others are in the contracting phase and anticipated to be operational in January 2014. Pre-Employment Transition: The Blueprint identified the transition programs and the identification project to be implemented during FY 2012/13. However, our fieldwork confirmed that these programs were not yet operational as of August 2013 at any of the designated reentry hubs. The department indicates that it is close to reaching an agreement with the Department of Motor Vehicles on the identification card project so it can begin to implement that project. Subsequent to completion of our fieldwork, the department reports and we tentatively confirmed that pre-employment transition programs were introduced in September 2013 at the following three institutions: Central

Second Report on CDCR’s Progress Implementing the Blueprint Page 9 Office of the Inspector General State of California
California Women’s Facility, Folsom Women’s Facility, and Valley State Prison. The OIG will review implementation status during its next review period and identify the number of pre-employment transition programs that have since been fully established. Designated Enhanced Programming Yards: As stated in the initial report, there is no detail in the Blueprint regarding any specifics or benchmarks for designated enhanced programming for any specific yards or institutions. The department reported that these are program opportunities already offered at each institution, and there were never any separately designated slots for these programs contemplated in the Blueprint. The department stated this was an overall goal to support those inmates and institutions where programming is desired. As such, going forward, the OIG will continue to request whatever information the department can provide regarding its efforts in meeting this goal. None was provided in this report. Long-Term Offender Model: The Blueprint identified the development of a reentry model designed for long-term offenders to be piloted during FY 2013/14 at four institutions. While this program is in the development phase, an invitation for bid was released September 5, 2013, for three locations. The department is on schedule to begin implementation of the program in January 2014. A fourth location will no longer be piloted, as the department is instead developing a state-operated parole transitional housing model, which will provide community-based programming opportunities specifically designed for former life-term inmates as well as provide temporary housing. Additionally, other than stating that the pilots for these programs will be implemented during FY 2013/14, the Blueprint did not provide any specifics or benchmarks in terms of program slots or milestones. Therefore, the OIG will only be able to report on the status of the program as it moves forward. Sex Offender Treatment: The Blueprint identified the development of services for sex offenders and piloting of the model at one institution during FY 2013/14. While this program is in the development phase, an invitation for bid was released September 5, 2013. The department is on schedule to begin implementation of the program in January 2014. There will be 80 slots available for participants, and the program length is 18 months. The Blueprint did not provide any specifics or benchmarks in terms of program slots or milestones; therefore, the OIG will report on the occupancy status of the 80 slots and the completion rates of attendees in future reports. Gang Prevention: The Blueprint mentioned that the gang prevention program contains a programming component. The programs consist of self-directed journaling, facilitated journaling, a voluntary education program model, and an alternative programming model. The self-directed journaling takes place in steps one through four of the step-down program (SDP). The department is currently working on a contract to facilitate small group journaling and also to have the facilitator review the self-directed journaling and provide feedback to the participant. Programming videos are also shown on the institution television network. The Blueprint did not provide any specifics or benchmarks in terms of program slots or milestones; therefore, the OIG will only be able to report on the status of the program. The programs have been implemented at institutions with an

Second Report on CDCR’s Progress Implementing the Blueprint Page 10 Office of the Inspector General State of California
SDP in conjunction with the implementation of phase II of that program. Refer to the gang management section of this report for more information about the programming.
Community Rehabilitative Programs Similar to the in-prison rehabilitation program goals, the department’s goal as stated in the Blueprint is to build program capacity by FY 2013/14 to accommodate 70 percent of parolees who have a need for substance abuse treatment, employment services, or education within their first year of being released from prison. The Blueprint identified capacity benchmarks by type that the department intended to meet in order to accommodate the parolee needs. The following table identifies the number of slots identified for each program type as identified in the Blueprint and the number of slots available as reported by the department. Keep in mind that many of the programs available offer multiple types of services at a single site.
Community Programs for Parolees Available During FY 2013/14
Blueprint FY 2013/14Program Types Slots Capacity Program TypesEducation Programs 6,219 3,150 Education ProgramsEmployment Programs 5,915 5,501 Employment/Education ProgramsSubstance Abuse Treatment 5,172 5,764 Substance Abuse Program Beds
3,480 Substance Abuse Education The capacity numbers identified above include 21 statewide sites in a new model designed as a “one-stop shop” providing substance abuse treatment, employment, and education programs. The department is continuing to develop or enhance other programs, including the substance abuse treatment programs, to address the needs of the higher risk parolee population. While it is too early to determine how successful the programs will be in relation to rehabilitation and recidivism, the department is in the process of developing a tracking mechanism to identify the percentages of first-year parolees who have participated in community-based programming based on their assessed needs. In the interim, the department has provided data identifying the number of parolees released during the fourth quarter of FY 2012/13 who were in the target population and participated in a rehabilitative program consistent with their employment or substance abuse treatment needs. The following table represents a snapshot of that data.

Second Report on CDCR’s Progress Implementing the Blueprint Page 11 Office of the Inspector General State of California
Percent of Parolees Receiving Services Consistent with Their Needs - FY 2012/13
Count Percent Count Percent Count PercentTarget Population 1,492Parolees-Employment Need 1,154 77% 230 20% 924 80%Parolees-Substance Abuse Treatment Need 815 55% 214 26% 601 74%
Programming Consistent with Needs
No Programming Consistent with Needs
4th Qtr FY 2012/13
As explained previously, the target population above represents parolees with a moderate or high risk to reoffend, who were assessed to have a medium to high need for a rehabilitative service. However, the data does not encompass all parolees in the target population as not all have received an assessment to determine their rehabilitative needs. We will continue to report the data on participation and attempt to expand on it. However, the Blueprint goal for community programming is to have the capacity available for parolees to participate, so that will be our focus in future reviews.
Second Report on CDCR’s Progress Implementing the Blueprint Page 12 Office of the Inspector General State of California
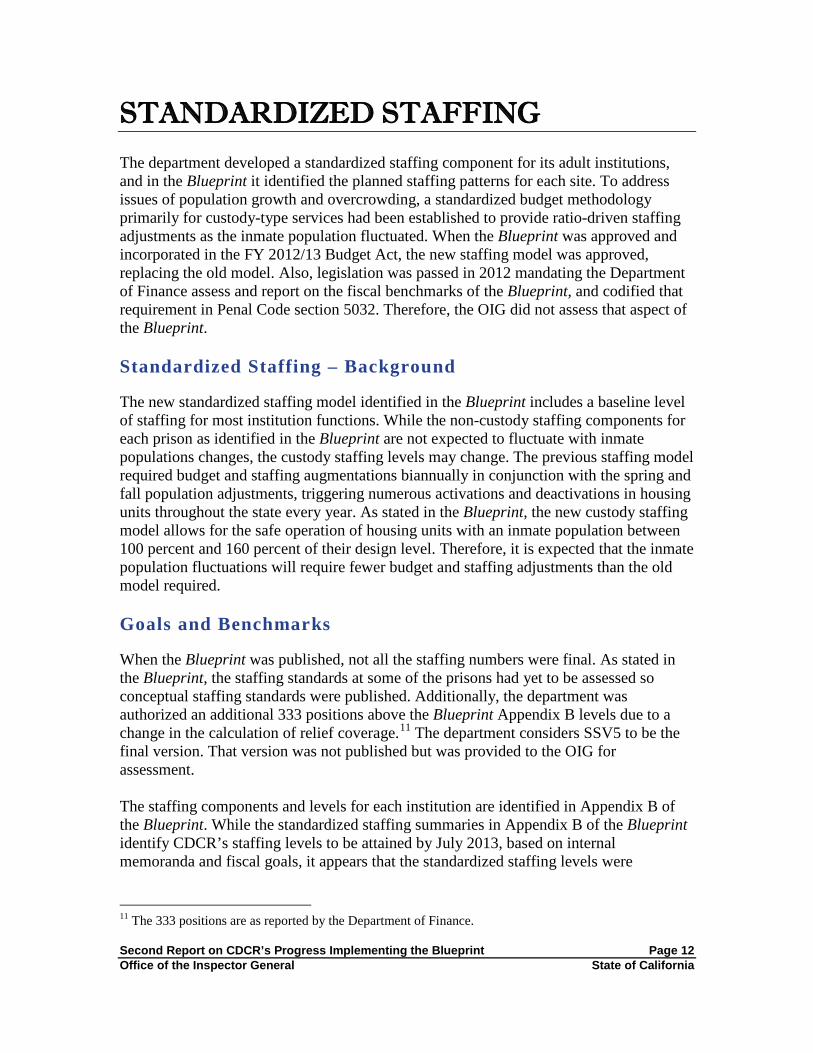
STANDARDIZED STAFFING The department developed a standardized staffing component for its adult institutions, and in the Blueprint it identified the planned staffing patterns for each site. To address issues of population growth and overcrowding, a standardized budget methodology primarily for custody-type services had been established to provide ratio-driven staffing adjustments as the inmate population fluctuated. When the Blueprint was approved and incorporated in the FY 2012/13 Budget Act, the new staffing model was approved, replacing the old model. Also, legislation was passed in 2012 mandating the Department of Finance assess and report on the fiscal benchmarks of the Blueprint, and codified that requirement in Penal Code section 5032. Therefore, the OIG did not assess that aspect of the Blueprint. Standardized Staffing – Background
The new standardized staffing model identified in the Blueprint includes a baseline level of staffing for most institution functions. While the non-custody staffing components for each prison as identified in the Blueprint are not expected to fluctuate with inmate populations changes, the custody staffing levels may change. The previous staffing model required budget and staffing augmentations biannually in conjunction with the spring and fall population adjustments, triggering numerous activations and deactivations in housing units throughout the state every year. As stated in the Blueprint, the new custody staffing model allows for the safe operation of housing units with an inmate population between 100 percent and 160 percent of their design level. Therefore, it is expected that the inmate population fluctuations will require fewer budget and staffing adjustments than the old model required. Goals and Benchmarks
When the Blueprint was published, not all the staffing numbers were final. As stated in the Blueprint, the staffing standards at some of the prisons had yet to be assessed so conceptual staffing standards were published. Additionally, the department was authorized an additional 333 positions above the Blueprint Appendix B levels due to a change in the calculation of relief coverage.11 The department considers SSV5 to be the final version. That version was not published but was provided to the OIG for assessment. The staffing components and levels for each institution are identified in Appendix B of the Blueprint. While the standardized staffing summaries in Appendix B of the Blueprint identify CDCR’s staffing levels to be attained by July 2013, based on internal memoranda and fiscal goals, it appears that the standardized staffing levels were
11 The 333 positions are as reported by the Department of Finance.

Second Report on CDCR’s Progress Implementing the Blueprint Page 13 Office of the Inspector General State of California
implemented in early FY 2012/13. Nevertheless, we performed our review based on the July 2013 benchmarks since that was our point of reference. Review of Staffing Patterns and Payroll
In order for the major reforms laid out in the Blueprint to be met, it is critical that the standardized staffing levels be implemented, specifically in accordance with the staffing plan as it relates to housing and security levels. If staffed appropriately, it is assumed the inmates can be housed as planned and gain access to the rehabilitative services as planned in a safe and secure manner. For each prison we performed fieldwork to assess whether the custody staffing patterns matched the budgeted levels of staffing. For two major yards or facilities within each prison, the OIG reviewed the actual staff sign-in/out sheets12 to compare with the standardized staffing reports13 and determine whether the prisons were consistently staffing the units in accordance with their budgeted levels. The results of the fieldwork indicated a high level of adherence to the standardized staffing plan. For 64 of the 66 facilities that were reviewed, the daily staffing patterns matched the standardized staffing reports, representing a 97 percent adherence rate. For the two facilities where the patterns did not match, there was a discrepancy of six positions (posts). Two of the posts were left vacant to provide relief coverage for vacancies caused by a holiday. The other four posts were left vacant to conform with salary savings requirements. Additionally, in our initial Blueprint report, we had reported that during our review, the daily staffing pattern was short one position at another facility because, according to staff, the position was abolished and the standardized staffing report was overstated. We followed up on that discrepancy and found the explanation to be true. In addition to reviewing the detail of custody positions, we looked at the detail of rehabilitative positions. Again, this is critical since it directly impacts the ability to carry out the major rehabilitative reforms laid out in the Blueprint. A minimal requirement to be deemed fully operational is that the instructors are employed. We used payroll reports to make that determination. As reported earlier, 455 (93 percent) of the budgeted 491 academic instructors were employed throughout the prisons representing an increase from 442 (90 percent) identified in our last report. Also, 185 (83 percent) of the budgeted 224 CTE instructors were employed throughout the prisons representing an increase from 166 (74 percent) identified in our last report.
12 The sign-in/out sheets are daily reports that are used at the prisons to track employee time. The reports contain pre-printed information including the position description, shift, and name of the scheduled employee. These reports were acquired at each institution. 13 The standardized staffing reports are detailed reports of each prison’s major facilities, and the information supports the summaries in the Blueprint. They also tie to the post assignment schedules that identify authorized position detail. The reports were obtained from CDCR.
Second Report on CDCR’s Progress Implementing the Blueprint Page 14 Office of the Inspector General State of California
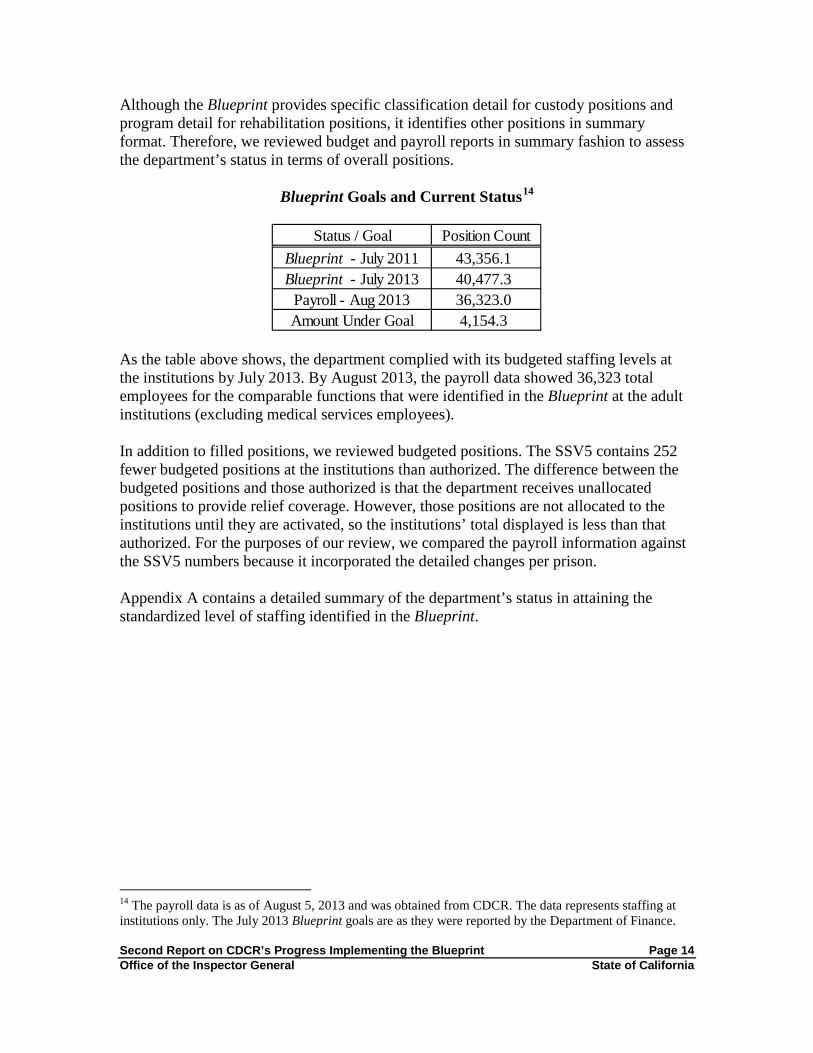
Although the Blueprint provides specific classification detail for custody positions and program detail for rehabilitation positions, it identifies other positions in summary format. Therefore, we reviewed budget and payroll reports in summary fashion to assess the department’s status in terms of overall positions.
Blueprint Goals and Current Status14
Status / Goal Position CountBlueprint - July 2011 43,356.1Blueprint - July 2013 40,477.3
Payroll - Aug 2013 36,323.0Amount Under Goal 4,154.3
As the table above shows, the department complied with its budgeted staffing levels at the institutions by July 2013. By August 2013, the payroll data showed 36,323 total employees for the comparable functions that were identified in the Blueprint at the adult institutions (excluding medical services employees). In addition to filled positions, we reviewed budgeted positions. The SSV5 contains 252 fewer budgeted positions at the institutions than authorized. The difference between the budgeted positions and those authorized is that the department receives unallocated positions to provide relief coverage. However, those positions are not allocated to the institutions until they are activated, so the institutions’ total displayed is less than that authorized. For the purposes of our review, we compared the payroll information against the SSV5 numbers because it incorporated the detailed changes per prison. Appendix A contains a detailed summary of the department’s status in attaining the standardized level of staffing identified in the Blueprint.
14 The payroll data is as of August 5, 2013 and was obtained from CDCR. The data represents staffing at institutions only. The July 2013 Blueprint goals are as they were reported by the Department of Finance.

Second Report on CDCR’s Progress Implementing the Blueprint Page 15 Office of the Inspector General State of California
INMATE CLASSIFICATION SCORE SYSTEM The department uses an inmate classification score system (ICSS) to ensure its inmates are properly housed and supervised. After review of the inmate classification score system, an expert panel15 concluded in 2011 that the point thresholds used by CDCR to assign housing could be changed without increasing the risk of serious misconduct. As a result, the Blueprint stated the department would adjust the point thresholds and file emergency regulations to adopt the recommendations set forth in the ICSS study with the Office of Administrative Law (OAL) by June 2012. Modification of the Inmate Classification Score System
According to the department, the ICSS is the primary objective factor used to determine the most appropriate housing and supervision for each inmate. The department’s goal is to modify the ICSS by changing the point thresholds between the four levels used for housing purposes. The department anticipates the changes affecting male inmates will bring about better access to rehabilitative programs, avoid unnecessary over-classification, and thereby increase success upon release.16 It also anticipates reduced costs since the higher level of housing corresponds with higher costs to house inmates. The department’s emergency regulations to implement the expert panel’s recommendations became effective July 1, 2012. As stated in the Blueprint, the department expects that by 2015 the new regulations will be fully implemented, and over 9,500 male inmates will have moved from level IV to level III, and over 7,000 male inmates will have moved from level III to level II. Based on a recent snapshot of data as of September 5, 2013, it appears the projection of movement is substantiated. The data show the ICSS score range changes currently affect over 16,000 inmates. This does not necessarily mean that those inmates moved to a lower security level, but only that barring overriding factors, their placement score now indicates a lower security housing level than before.
Placement Score Range Inmate Count28 - 35 (Formerly Level III - Now Level II) 10,69352 - 59 (Formerly Level IV - Now Level III) 5,635
Total 16,328 15 CDCR commissioned researchers from the University of California system to evaluate the department’s ICSS and, in collaboration with key CDCR staff, completed a statistical analysis of the current classification process. The report was issued in December 2011. 16 Female offenders are generally housed together without regard to level (level I to IV) as their propensity for violence is much lower than that of male offenders.

Second Report on CDCR’s Progress Implementing the Blueprint Page 16 Office of the Inspector General State of California
The institutions and their housing facilities have four designated security levels, level I through level IV with level I for minimum security inmates and level IV for maximum security inmates. The following table displays the changes to the inmate classification score system, which increased the maximum point threshold for levels II and III and the minimum point threshold for level IV. An inmate’s classification score (placement score) determines which level the inmate will be housed in, unless other overriding case factors exist.
To determine if the department is adhering to its new inmate classification system and thereby making progress towards its expectation of 16,500 inmates moving to lower security levels by 2015, the OIG reviewed a statewide sample of completed classification score sheets. We identified the score sheets that had a classification review completed after June 30, 2012, and those with final placement scores in the 28-35 range or the 52-59 range. (Those ranges are the ones most impacted by the threshold changes in security levels.) As summarized in the table below, we found the department did, in fact, begin using all of the new classification forms consistently upon the effective date of the new regulations, July 1, 2012. According to the department, all eligible inmates were to have received annual classification reviews utilizing the new score sheet by July 2013.
New Inmate Classification Score Sheets - Data Validation
Number of Files Reviewed 310Yes No
Data Validated 309 1Validation Rate 99.7% 0.3%
Inmate Classification Score System Changes
Pre-July 1, 2012 Post-July 1, 2012
Security Level Final Classification Score
Final Classification Score
I 0-18 0-18 II 19-27 19-35 III 28-51 36-59 IV 52+ 60+

Second Report on CDCR’s Progress Implementing the Blueprint Page 17 Office of the Inspector General State of California
ICSS – Miscellaneous Data Benchmarks
Neither CDCR nor the OIG has a method (other than a manual assessment) to efficiently identify the number of inmates who moved from one security level to another solely because of the change in classification score thresholds. This is because an inmate’s placement score can change for a variety of reasons other than ICSS changes. There are also administrative determinants, such as, closed custody, mandatory minimums, medical status, and mental health status, which can override scores and show an inmate with, for example, a level III security score being housed in a different level. Therefore, it is difficult to determine whether inmates are moving from one security level to another solely because of the ICSS score threshold changes. However, we can report that as of June 30, 2013, in traditionally higher-cost security housing levels, there were 10,918 fewer inmates placed in level III housing units and 1,185 fewer inmates placed in level IV housing units statewide than what the Blueprint identified.
Security Level Impact Based on ICSS Score Changes
Our fieldwork showed that of the 310 files we reviewed, 184 inmates (59 percent) had their security level decrease from the previous classification review. Of those 184 inmates who had their security level decrease, we were able to confirm that 183 inmates (99 percent) had their security level decrease solely because of the change in the ICSS score ranges. That group of 183 inmates represents 59 percent of the entire sample reviewed (310). This is just a snapshot of the impact the ICSS score change can have. The sample size of 310 is not statistically representative to be able to project to the entire inmate population. However, a 59 percent overall decrease in security level is a promising trend for the overall cost-savings goals.

Second Report on CDCR’s Progress Implementing the Blueprint Page 18 Office of the Inspector General State of California
Housing Impact Based on ICSS Score Changes
Our fieldwork showed that of the 310 inmates’ files we reviewed, 290 inmates were housed in traditional housing (security levels I-IV). The other 20 inmates were housed in units not designated a security level, such as, an administrative segregation unit, a reception center, or a correctional treatment center. Of those 290 inmates housed in traditional housing, 226 inmates (78 percent) were housed in a security level consistent with their placement score, 56 inmates (19 percent) were waiting to be endorsed to a lower security level, and 5 inmates (2 percent) were waiting to be transferred to a lower security housing level. The remaining 3 inmates (1 percent) had a score that increased. Again, this is a snapshot of the impact the ICSS score change can have as the sample size is not statistically representative to be able to project to the entire inmate population. However, to be able to house 78 percent of inmates consistently with their placement score in this targeted group most susceptible to movement (scores in the 28-35 or the 52-59 range) is promising. To emphasize this, simply because an inmate’s placement score changes after a classification review and causes the change in security level designation, it does not mean that the inmate is immediately moved to a housing unit or institution consistent with the inmate’s placement score. The classification staff representative (CSR) can endorse the inmate to be moved to a different institution or facility; however, that is basically the “bus ticket” to be moved. If a bus is not available, the inmate is not moved. Bed space at the appropriate facility must also be available for the movement to occur. If an inmate is not moved after a certain amount of time, the endorsement expires and requires CSR17 reauthorization. 17 The endorsements by the CSR have expiration dates because the information becomes outdated. For example, an inmate can be endorsed to be transferred to another prison after an evaluation of enemy concerns at the prospective prison. If four months elapse before the transfer, the endorsement needs to be reauthorized because another inmate with an enemy concern may have arrived at that prospective prison.

Second Report on CDCR’s Progress Implementing the Blueprint Page 19 Office of the Inspector General State of California
The following tables provide a snapshot of inmates housed in levels inconsistent with their placement score. Inmates can be housed in levels inconsistent with their placement scores for a variety of reasons, including bed availability as previously described. The data below average a 12-month period and provides the breakdown per housing level of where inmates with placement scores in three different levels have been housed.18 For example, the 12-month data show that 65 percent of inmates with placement scores in the level II range were housed at a level consistent with their score, while 31 percent were housed in a level III setting. The data below also show the count for the most recent month that the data were generated. The June 2013 data show that 70 percent of inmates with placement scores in the level II range were housed at a level consistent with their score, while 26 percent were housed in a level III setting. So the more recent data show an increase in inmates with a level II placement score are housed in a level II setting. As stated previously, the placement score is one of many factors that determine what security level the inmates are housed in.
Inmate Placement Score Level IIActual Housing Level Inmate Count (12 Mos) Average/Month Percent (12 Mos) 6/30/13 Count Percent 6/30/13
II 309,062 25,755 65% 30,918 70%III 146,635 12,220 31% 11,592 26%IV 19,009 1,584 4% 1,544 4%
Total 474,706 39,559 100% 44,054 100%
Inmate Placement Score Level IIIActual Housing Level Inmate Count (12 Mos) Average/Month Percent (12 Mos) 6/30/13 Count Percent 6/30/13
II 13,578 1,132 4% 1,125 5%III 258,192 21,516 85% 19,728 84%IV 34,013 2,834 11% 2,726 11%
Total 305,783 25,482 100% 23,579 100%
Inmate Placement Score Level IVActual Housing Level Inmate Count (12 Mos) Average/Month Percent (12 Mos) 6/30/13 Count Percent 6/30/13
II 606 51 <1% 58 <1%III 15,713 1,309 6% 1,509 7%IV 265,260 22,105 94% 19,425 93%
Total 281,579 23,465 100% 20,992 100% The following projected placement needs table provides actual inmate population counts and projections identified by the different housing levels and types, including the special housing consisting of protective housing units (PHU) and security housing units (SHU). This table contains data identified in the Blueprint. If attributed solely to the changes in the ICSS, the projections do not support the predicted inmate movement from one level to another. For example, the level II numbers were predicted to increase by over 7,000 by 2015, but instead the projections predict a drop of almost 8,000 level II inmates from December 31, 2011, to June 30, 2015. 18 The data provided by CDCR are for a 12-month period through June 30, 2013.

Second Report on CDCR’s Progress Implementing the Blueprint Page 20 Office of the Inspector General State of California
Projected Placement Needs for Male Inmate Population in Blueprint
Recept Level Level Level Level Total Date Cntr I II III IV PHU SHU Total Pop
9/30/11* 23,116 21,558 37,395 34,888 28,767 12 5,617 5,629 151,35312/31/11* 15,911 19,864 35,426 33,930 28,752 12 5,649 5,661 139,544
6/30/12 9,583 15,158 32,688 35,571 29,098 13 5,243 5,256 127,3546/30/13 9,228 12,681 29,863 36,028 29,537 12 4,702 4,714 122,0516/30/14 8,645 12,266 28,225 36,341 29,631 12 4,515 4,527 119,6356/30/15 8,457 12,040 27,628 36,195 29,516 12 4,404 4,416 118,2526/30/16 8,372 12,383 27,461 35,975 29,403 13 4,328 4,341 117,9356/30/17 8,329 12,719 27,761 35,933 29,419 13 4,237 4,250 118,411
* Actual
Special Housing
The following table provides updated actual inmate population counts through June 30, 2013, as well as updated inmate population projections.19 Because the data now predicts an increase in level II beds from the December 2011 number, this updated table is more in line with the Blueprint, which stated the changes in the ICSS would cause an increase of over 7,000 level II beds. The updated data also predicts a lower need for level III and level IV beds than was previously projected, which is more consistent with what was stated in the Blueprint narrative.
Updated Projected Placement Needs for Male Inmate Population
Recept Level Level Level Level Total Date Cntr I II III IV PHU SHU Total Pop
9/30/11* 23,116 21,558 37,395 34,888 28,767 12 5,617 5,629 151,35312/31/11* 15,911 19,864 35,426 33,930 28,752 12 5,649 5,661 139,5446/30/12* 11,523 16,041 31,545 34,570 29,361 13 5,776 5,789 128,829
12/31/12* 10,135 15,411 37,008 32,541 26,151 14 5,749 5,763 127,0096/30/13* 11,332 13,676 55,031 25,110 28,352 15 3,858 3,873 137,3746/30/14 10,077 13,700 42,733 30,306 21,942 14 4,797 4,811 123,5696/30/15 10,072 13,815 42,618 30,470 21,735 14 4,505 4,519 123,2296/30/16 10,002 14,398 42,822 30,787 21,587 13 4,342 4,355 123,9516/30/17 10,025 14,812 43,385 30,956 21,655 12 4,222 4,234 125,0676/30/18 10,027 15,275 43,528 31,090 21,802 12 4,171 4,183 125,905
* Actual
Special Housing
19 The updated inmate population data was provided by CDCR.

Second Report on CDCR’s Progress Implementing the Blueprint Page 21 Office of the Inspector General State of California
The following table displays the differences between the projections identified when the Blueprint was published and the updated projections that show the inmate population increasing slightly over the previous projections. The difference in projections shows a higher need for level II housing and a lower need for level III and level IV housing than previously projected. These projections provide better support for the changes in movement caused by the changes in the ICSS than the projections identified in the Blueprint. The department is continually monitoring its inmate population and demographics to address and adjust its housing needs as needed. An update on its housing needs is explained later in the comprehensive housing plan section of this report.
Differences Between Updated Placement Needs and Those in Blueprint
Recept Level Level Level Level Total Date Cntr I II III IV PHU SHU Total Pop
9/30/11* 0 0 0 0 0 0 0 0 012/31/11* 0 0 0 0 0 0 0 0 06/30/12* 1,940 883 -1,143 -1,001 263 0 533 533 1,4756/30/13 2,104 995 25,168 -10,918 -1,185 3 -844 -841 15,3236/30/14 1,432 1,434 14,508 -6,035 -7,689 2 282 284 3,9346/30/15 1,615 1,775 14,990 -5,725 -7,781 2 101 103 4,9776/30/16 1,630 2,015 15,361 -5,188 -7,816 0 14 14 6,0166/30/17 1,696 2,093 15,624 -4,977 -7,764 -1 -15 -16 6,656
* Actual
Special Housing

Second Report on CDCR’s Progress Implementing the Blueprint Page 22 Office of the Inspector General State of California
GANG MANAGEMENT The Blueprint stated that the department commissioned a study in 2007 entitled “Security Threat Group Identification and Management” performed by the California State University, Sacramento. The Blueprint identified several measures recommended as a result of that study and stated the department could now begin a careful implementation of the recommendations, due to the reductions in crowding and offender movement coupled with changes in the ICSS. The study recommended the department employ several measures, including offering graduated housing, a step-down program for inmates, support and education for disengaging from gangs, a weighted point system for gang validation, specific use of segregated housing, and social value programs in preparation for the inmate’s return to the community. The Blueprint states the department is commencing new targeted and programmatic strategies to minimize the negative impacts of gangs in its prisons. Since the Blueprint was launched prior to the department establishing its pilot program for gang management, it did not include any target dates or certain benchmarks to be achieved. However, we plan to monitor the department’s progress of its pilot program and key areas included in its plan. Security Threat Group – Gang Management Program
To combat gangs, the department has historically identified gangs with the greatest propensity for violence and has separated the offenders from the general inmate population by placement into security housing units.20 The department’s policy for identifying prison-based gang members and associates and isolating them from the general population is to be replaced with a new model that identifies, targets, and manages security threat groups (STG)21 and utilizes a behavior-based step-down program (SDP) for validated affiliates.22 This new 24-month pilot program entitled “Security Threat Group Identification, Prevention, and Management Instructional Memorandum” (STG Plan) allows gang affiliates an opportunity to work their way from a restricted program back to the general population by demonstrating a willingness and commitment
20 California Code of Regulations (CCR), Title 15, section 3341.5 (c), provides for “an inmate whose conduct endangers the safety of others or the security of the institution” to be housed in a security housing unit (SHU). Inmates may be placed in a SHU for either a determinate or an indeterminate term. Inmates sentenced to a determinate term in SHUs are those who have been found guilty through a formal disciplinary process of having committed one or more specified serious offenses ranging from murder to threatening institution security. CCR, Title 15, section 3341.5(c)(2)(A)(2), in contrast, specifies an indeterminate SHU term for validated prison gang members and associates, who are deemed “a severe threat to the safety of others or the security of the institution.” 21 The term “Security Threat Group” will generally replace the terms “prison gang”, “disruptive group”, or “street gang” within CDCR. 22 Affiliates are individual offenders (inmates) identified as “members,” “associates,” or “monitored,” who are connected or interact with a certified security threat group.

Second Report on CDCR’s Progress Implementing the Blueprint Page 23 Office of the Inspector General State of California
to discontinue gang activity during their incarceration. This new policy addresses validated affiliates with indeterminate SHU terms. It does not address inmates with determinate SHU terms (inmates in SHU for non-gang-related behavior). The STG Plan was approved by the OAL and became effective on October 18, 2012. In October 2012, the department issued an instructional memorandum for the implementation of the STG Plan, defining staff responsibilities and establishing a comprehensive process for the prevention, identification, and management of security threat groups and individual affiliates within CDCR. The department identified several revisions in the new STG Plan, including the following key areas:
• Prevention – Incorporation of an STG prevention program for offenders during the intake process and an orientation process for validated affiliates classified to participate in the SDP;
• Step-down program – Implementation of an incremental four-year STG step-down program, replacing the six-year inactive review process for validated affiliates. The SDP is to provide graduated housing, enhanced programs, and interpersonal interactions, and include privilege and personal property enhancements for participating STG affiliates;
• STG Disciplinary Matrix – A new behavior-based system that includes an STG behavior-based disciplinary matrix to provide for additional procedural due process safeguards and a system of individual accountability for validated affiliates; and,
• Validation – Evaluation of offenders for validation using a weighted point system, requiring three independent source items (totaling at least 10 points) and a direct link (of at least one source item), where required.
The department initiated phase I of the STG Plan by conducting case-by-case reviews for currently validated affiliates housed in SHU facilities.23 As part of the review, the Departmental Review Board (DRB) determines an inmate’s appropriate placement or retention within the SHU or an SDP, or potential release to general population. As described in the department’s October 2012 STG Plan, inmates serving an indeterminate SHU term due to their gang validation (prior to the STG Plan) shall be provided a DRB hearing. The DRB will conduct an assessment of the preceding four years to determine the existence of on-going STG behavior by the inmate. These inmates will be classified as “inactive-monitored status affiliates” (i.e. validated affiliates released
23 As of August 8, 2013, the department operated five security housing units with a population of 2,283 validated prison gang members and associates. These units are located at the California Correctional Institution; California Institution for Women; California State Prison, Corcoran; California State Prison, Sacramento; and Pelican Bay State Prison. The total statewide population of validated affiliates is 2,956, including those housed in administrative segregation units, California out-of-state correctional facilities, condemned housing units, general population units, and reception centers.

Second Report on CDCR’s Progress Implementing the Blueprint Page 24 Office of the Inspector General State of California
from SHU concurrent to the implementation of the SDP through a case-by-case review) upon their release from SHU facilities. The table below identifies the validated affiliate inmate populations at each institution within CDCR.
Validated Affiliate Inmate Populations As of August 8, 2013
PrisonCalifornia Correctional Institution 32 488 520
California Institution for Women 0 3 3
California State Prison, Corcoran 90 437 527
California State Prison, Sacramento 13 108 121
Pelican Bay State Prison 335 777 1,112
Others (Statew ide) in Administrative, Segregation Units (ASU), California Out-of-State Correctional Facilities (COCF), Condemned Housing, General Population (GP), and Reception Centers (RC).
110 563 673
Statew ide Totals 580 2,376 2,956
Source: CDCR - Data as of 8/8/13
STG Members STG AssociatesTotal STG Inmates
Documents from the department show that through September 26, 2013, the DRB had reviewed a total of 320 cases at the five SHU facilities. Of the 320 cases reviewed, the department approved 164 inmates (51 percent) for release to general population (step 5) and placed 105 inmates (33 percent) in steps 1, 2, 3, or 4 of the SDP. Most of the remaining inmates were retained in the SHU due to safety concerns or debriefing.
Outcome of DRB Hearing Number of Inmates
SDP – Step 1 31
SDP – Step 2 39
SDP – Step 3 19
SDP – Step 4 16
Release to GP - Step 5 164
Retain in SHU (Debriefing or Safety) 46
Debriefed - Release to THU/GP 5
Totals 320
SHU – Summary of Outcomes from Case-by-Case Reviews
Source: CDCR – Data as of September 26, 2013

Second Report on CDCR’s Progress Implementing the Blueprint Page 25 Office of the Inspector General State of California
The department has also conducted institution case-by-case reviews for currently validated affiliates housed in non-SHU facilities. These inmates are primarily housed in the administrative segregation (AdSeg) units at various institutions throughout the state. The reviews are conducted by the institution classification committee (ICC). Documents from the department show that through September 26, 2013, the ICC had reviewed a total of 208 cases at various non-SHU facilities. Of the 208 cases reviewed, the department approved 133 inmates (64 percent) for release to general population and placed 45 inmates (22 percent) in steps 1, 2, 3, or 4 of the SDP. The remaining inmates were retained in AdSeg due to safety concerns, disciplinary reasons, or debriefing.
Outcome of ICC Hearing Number of Inmates
SDP – Step 1 40
SDP – Step 2 3
SDP – Step 3 2
SDP – Step 4 0
Release to GP 133
Retain in AdSeg (Debriefing, Safety, or Disciplinary) 30
Totals 208
AdSeg-Summary of Outcomes from Case-by-Case Reviews
Source: CDCR – Data as of September 26, 2013
In total, during the last 11 months, the department has conducted 528 case-by-case reviews as of September 26, 2013, which represents 18 percent of its STG population (2,956 inmates). This also represents an increase of 384 case-by-case reviews (267 percent) identified in our prior report. Although the pilot STG plan does not identify any benchmarks regarding the number or percentage of case-by-case reviews the department needs to complete during its 24-month pilot program, we will continue to monitor and report on the case-by-case reviews completed by the department. Based on the more rapid rate of completion during the last 7 months, we estimate the department will complete 1,241 case-by-case reviews (42 percent) of its current STG inmate population by the conclusion of the pilot program. The department reports that it will attempt to increase its rate of reviews by dedicating more resources and our next report will indicate whether that rate has increased. The DRB and ICC hearings resulted in the release of 138 of the 528 inmates (26 percent) into a general population setting commensurate with their individual case factors. The hearings also resulted in the initial placement of 314 of the 528 inmates (59 percent) in

Second Report on CDCR’s Progress Implementing the Blueprint Page 26 Office of the Inspector General State of California
the step-down program (SDP). Of the 314 inmates placed in the SDP, 164 inmates (52 percent) were placed in step 5 of the SDP, which corresponds with the placement into a level IV general population setting to serve a year of observation. If the inmate refrains from STG activity for that year, the inmate’s case factors would be reviewed and the inmate would have the opportunity to return to a general population setting commensurate with their individual case factors. Overall, a total of 302 inmates (57 percent) were released from a SHU setting into a general population setting as a result of the case-by-case reviews. The SDP policy requires an offender to sign a personal contract to acknowledge the program expectations and consequences for failing to participate. In its policy memorandum establishing March 1, 2013, as the commencement date for the implementation of phase II of the pilot program, the department reinforced that requirement for inmates placed in steps 2, 3, and 4 of the SDP. It requires them to sign a contract, and continual failure to do so will eventually cause them to regress to step 1. We validated the department’s data by reviewing a sampling of the cases that went through either the DRB or ICC review process. The difficulty with the review is that some of these inmates (and their respective C-files) were in transit, so we could not access the files. For the 101 cases we did review, we confirmed that the DRB or ICC reviews had, in fact, taken place. Of the 101 cases reviewed, 73 inmates were in the SDP, thus requiring a contract; however, we found only 45 of those cases (62 percent) contained a contract in the inmate’s C-file. Although it represents a small sample, a smaller subset of our review revealed a concern. We reviewed 11 cases (14 percent) of STG inmates who had received a committee review24 and were placed in step 2, 3, or 4 at SHU institutions. We found that in 10 of the 11 cases (91 percent), the inmate was unwilling to sign the required personal contract and/or refused to participate in the programming aspects (self-directed journals). In those cases, the inmate regressed to step 1, and will not earn credit towards completion of the 12 months required in step 1 (before proceeding to step 2). To earn credits, the inmate must notify the correctional counselor or case manager of renewed intention to participate in the SDP and sign the personal contract. Otherwise, the inmate will “plateau” in step 1 at a SHU facility, and not progress to the next step or eventual release to general population. The department reports that it has reviewed the criteria for regression in the SDP and prior to final adoption of its pilot program, the criteria will be changed to allow inmates to move into step 2 without signing a contract. We will verify whether changes to the criteria have taken place in future reporting periods. We also anticipate having a larger sample size in the future to continue monitoring regression in the SDP since the regression rate is a bit alarming, despite the small sample size.
24 The department utilizes a Departmental Review Board to conduct case-by-case reviews for current validated affiliates housed in the security housing units (SHU). Also, a Special Project Team conducts case by case reviews for validated inmates housed within administrative segregation units and endorsed to transfer to SHU.
Second Report on CDCR’s Progress Implementing the Blueprint Page 27 Office of the Inspector General State of California
We also reviewed the files to determine whether the inmates were already housed at the appropriate housing level and location subsequent to their respective DRB or ICC committee hearings. We found that for 88 of the 101 cases (87 percent), the inmate’s housing was consistent with the committee’s recommendation. The remaining inmates were awaiting transfer to the appropriate housing facilities. By beginning implementation of the 24-month STG pilot plan in FY 2012/13, the department met its benchmark. We will continue to monitor the progress of the measures included in its plan. Gang Management Program – Miscellaneous Benchmarks
As illustrated in the following security housing unit table, the current design capacity for SHU beds increased to 2,994 beds with the Blueprint plan. Prior to the Blueprint, the department projected a higher increased need for SHU facilities, but now projects an overall reduction of SHU beds after completion of the regulations and the case factor reviews scheduled for completion by October 2014. Future reports will track the actual SHU bed populations.
Security Housing Unit – Population Data25
Institution4/25/12 Design
Capacity Before Blueprint
4/25/12 Inmate Population
Before Blueprint
Design Capacity in Blueprint
Staffed Capacity in Blueprint
Population as of 9/5/13
California Correctional Institution 316 771 810 968 1,247California Institution for Women 0 0 60 60 74California State Prison, Corcoran 1,000 1,390 1,004 1,208 1,220
California State Prison, Sacramento 0 0 64 77 85Pelican Bay State Prison 1,184 1,030 1,056 1,276 1,154
Total 2,500 3,191 2,994 3,589 3,780
25 The design capacity before the Blueprint was from a CDCR population report with data as of April 25, 2012. The design and staffed capacities in the Blueprint are from Appendix B of the Blueprint. With the exception of the California Institution for Women (CIW), the inmate population is from a CDCR data download as of September 5, 2013. The inmate population from CIW is as of October 9, 2013 and was obtained from the institution since CIW uses some SHU beds for administrative segregation unit housing rather than for SHU housing. (Therefore, the population report overstated the SHU beds at CIW.)
Second Report on CDCR’s Progress Implementing the Blueprint Page 28 Office of the Inspector General State of California
COMPREHENSIVE HOUSING PLAN The department updated its comprehensive housing plan and incorporated the components identified in the Blueprint. Those components include changes to the inmate classification score system, creating anticipated changes in housing and population density levels, construction, renovations, conversions, activations, and closures, and changes to contract beds and fire camp population. The results of the comprehensive housing plan are primarily summarized in Appendix B of the Blueprint at the institution level.
Institution Housing Plans The institution housing plans identify design and staff capacity as well as the custody level and program assignment for each housing unit at each institution. Since neither the housing plans nor the narrative identify an implementation date, for the purposes of our review, we assumed that the institution housing plans became effective when the Blueprint was approved which was when the FY 2012/13 Budget Act was signed. The Blueprint does not provide the detail regarding the housing plans prior to the Blueprint changes. Therefore, we do not have a starting point to the level of detail that the new housing plans provide. This is critical because although we are attempting to monitor monthly activation and deactivation plans, some of the plans we have reviewed call for an activation of a housing unit to the custody level and program assignment consistent with what is already in the housing plan in the Blueprint. For example, a February 11, 2013, memorandum called for Facility A at Ironwood State Prison (ISP) to be converted from a level IV sensitive needs yard to a level III sensitive needs yard. The Blueprint housing plan already identified Facility A at ISP as a level III sensitive needs yard. Because of a lack of “before Blueprint” data, we relied primarily on the institutions’ shift count reports and departmental population data to determine whether housing units are being used in accordance with the Blueprint housing plans. We did not attempt to reconcile the housing plans to the program assignment level but rather to the custody levels. The OIG collected “positive shift count” reports at each institution.26 Although those reports do not identify custody level and program assignment, they do provide inmate population counts for each housing unit. We were then able to determine whether inmates are being housed at each housing unit within a level reasonably consistent with the level identified in the housing plan. We found that the inmate housing is consistent with the
26 “Positive shift count” reports are reports generated at each prison at standard intervals throughout each day. The reports contain data of the number of inmate counts in each housing unit within each facility or major yard and at each prison. The reports also identify the number of inmates either off grounds or at special areas of the prison, such as being out to court, out to a medical appointment, at education, or in the administration building.
Second Report on CDCR’s Progress Implementing the Blueprint Page 29 Office of the Inspector General State of California
housing plan in most instances. In fact, of the 901 housing units identified in the Blueprint, we found 886 housing units (98 percent) to be operating.27 There were was one institution (California Rehabilitation Center) where a few of the housing units have remained closed at least temporarily since our initial report. Since our initial report, we found other institutions had closed some of their housing units at least temporarily. We used a download of electronic population data to compare the current population by security level at each institution with the security level capacities identified in the Blueprint housing plans. The data also contained detailed information regarding program types. This approach provided validation that the housing of inmates is consistent with the housing plans identified in the Blueprint as the plan relates to the inmate population levels by both housing levels and program types. Appendix B of this report provides a detailed comparison of the capacities identified in the Blueprint for each institution at the housing unit level and the comparisons we performed during our review. The few discrepancies found are noted on each institution’s respective summary sheet wherever applicable.
Housing Plan – Miscellaneous Benchmarks There were several specific components identified in the Blueprint that were related to the comprehensive housing plan. The following describes those components and includes their status resulting from our review. Current Design Capacity: The Blueprint housing plan revisions and changes in inmate population prompted the conversion of beds at two sites and the scheduled closure of another. They also prompted the conversion of the housing of reception center beds to general population beds. (The detail of reception center and general population beds is captured in Appendix B of this report.) The department had also predicted the decline in eligible inmates for the fire camp inmate population. The Blueprint identified the conversion of Valley State Prison for Women to a male facility by the summer of 2013. The phased-in conversion began in October 2012 and was completed sooner than the Blueprint benchmark. This is noted by the inmate population reports showing that by February 2013, no female inmates were being housed at the renamed Valley State Prison (VSP) and 2,149 male inmates were housed there. The full conversion has been realized as the current male inmate population at VSP has surpassed its capacity level and stood at 3,223 inmates on September 18, 2013.28 The Blueprint identified the conversion of the former Folsom Transitional Treatment Facility into dorms used for housing female inmates (to be named Folsom Women’s Facility). The conversion was scheduled to take place in 2013. Departmental memoranda
27 There is a total of 925 housing units identified in the Blueprint; however, 24 were excluded since they represent the housing units of the California Health Care Facility, which is in the process of activation. 28 CDCR population report with data as of September 18, 2013.

Second Report on CDCR’s Progress Implementing the Blueprint Page 30 Office of the Inspector General State of California
indicated the activation of Folsom Women’s Facility was to begin December 3, 2012, as inmates were scheduled to arrive that day. Inmate population reports29 indicate the activation began in January 2013, well within the Blueprint benchmark. As of September 18, 2013, the population reports identified 274 female inmates housed in dorms designed to house 403 inmates, which is consistent with what the Blueprint calls for.30 Construction of the dorms was completed on July 2, 2013, and, pending construction activities on adjacent support buildings, was scheduled to be completed in September 2013. The Blueprint also identified the planned closure of the California Rehabilitation Center (CRC). The plan identified its closure to be completed by June 2016. While it is very early to monitor this item, the CRC inmate population was at 3,820 inmates when the Blueprint was published, and the inmate population stood at 3,407 inmates as of September 18, 2013. Additionally, the recent passage of Senate Bill 105 suspends the requirement to close CRC pending a review that determines if it can be closed. This project will continue to be monitored. The Blueprint stated there would be a decline in inmates eligible for the department’s fire camp population. The detail in its Appendix G identified a projected inmate population decline from 4,480 to its projected baseline of 2,500 by June 27, 2013.
Inmate Population – CDCR Fire Camps
Timeline Projected Actuals6/27/12 4,480 4,043
12/27/12 3,800 3,7606/27/13 2,500 3,9199/5/13 3,800 3,949
This benchmark was changed with legislative support. The department has been funded to restore its previous level of fire camps and associated inmates. The FY 2013/14 Budget Act restored its funding to the original level, which eliminated the need to close fire camps and reduce its fire camp inmate population. The department currently operates 40 fire camps off prison grounds, totaling a 4,200 inmate bed capacity level.31 Therefore, its current population of 3,949 inmates is well within its limit of 4,200 inmates for off grounds fire camps. Additionally, the Blueprint provided no schedule of fire camp closures, so the only reduction activity being monitored is population levels.
29 CDCR population report with data as of January 23, 2013, contains the first population count of female inmates at Folsom Women’s Facility. 30 CDCR population report with data as of September 18, 2013. 31 The CDCR population reports identified on the table are respectively from data as of June 27, 2012, December 26, 2012, and June 27, 2013. The September 5, 2013, data are from a data download from CDCR. The current counts and bed capacity for fire camps was provided by CDCR.

Second Report on CDCR’s Progress Implementing the Blueprint Page 31 Office of the Inspector General State of California
New Construction: Two specific construction projects were underway at the department when the Blueprint was released: the California Health Care Facility (CHCF) in Stockton was to be activated by summer 2013, and an annex to the CHCF was being constructed. The annex would be built over the former DeWitt Nelson Youth Correctional Facility and completed by June 2014. Our review found the construction of the CHCF was completed on schedule in August 2013. The phased-in activation of the facility commenced in mid-July. The facility is slated to be fully operational by December 2013. The construction of the DeWitt Nelson Correctional Annex is on schedule to be completed in spring 2014 with the activation immediately following. Infill Construction: The Blueprint identified some infill construction projects due to a higher need for level II housing. The projects identified include the DeWitt Nelson Correctional Annex and the construction of three new facilities to house approximately 800 inmates, each to be built at existing facilities. The status of the DeWitt Nelson Correctional Annex is discussed above. The following provides the status of the three other infill projects. Senate Bill 1022 (Chapter 42, Statutes of 2012) authorized the design and construction of three level II facilities adjacent to one or more of the following facilities:
California Institution for Men California Medical Facility California State Prison, Sacramento California State Prison, Solano Folsom State Prison Mule Creek State Prison Richard J. Donovan Correctional Facility
The Public Works Board took action on September 11, 2012, to authorize the 800-bed infill projects with two slated to be built at Mule Creek State Prison (1,600 beds), and one at the Richard J. Donovan Correctional Facility (800 beds). However, in December 2012, the Notice of Preparation of an Environmental Impact Report (EIR) regarding the proposed projects included proposals for evaluations at all seven institutions. Scoping hearings took place in mid to late January 2013 and formal written comments were due in early February 2013. The department submitted the EIR document for public comment and is preparing the response to those comments as part of the final EIR, which is estimated to be available in early Fall 2013 with approval of the final three sites following the report. The Public Works Board approved the performance criteria for the level II bed facilities on August 9, 2013. The department was preparing to release the request for proposal to pre-qualified design-build entities in September 2013. Construction is estimated to begin in spring 2014 and the preliminary construction completion date is estimated at March 2016.
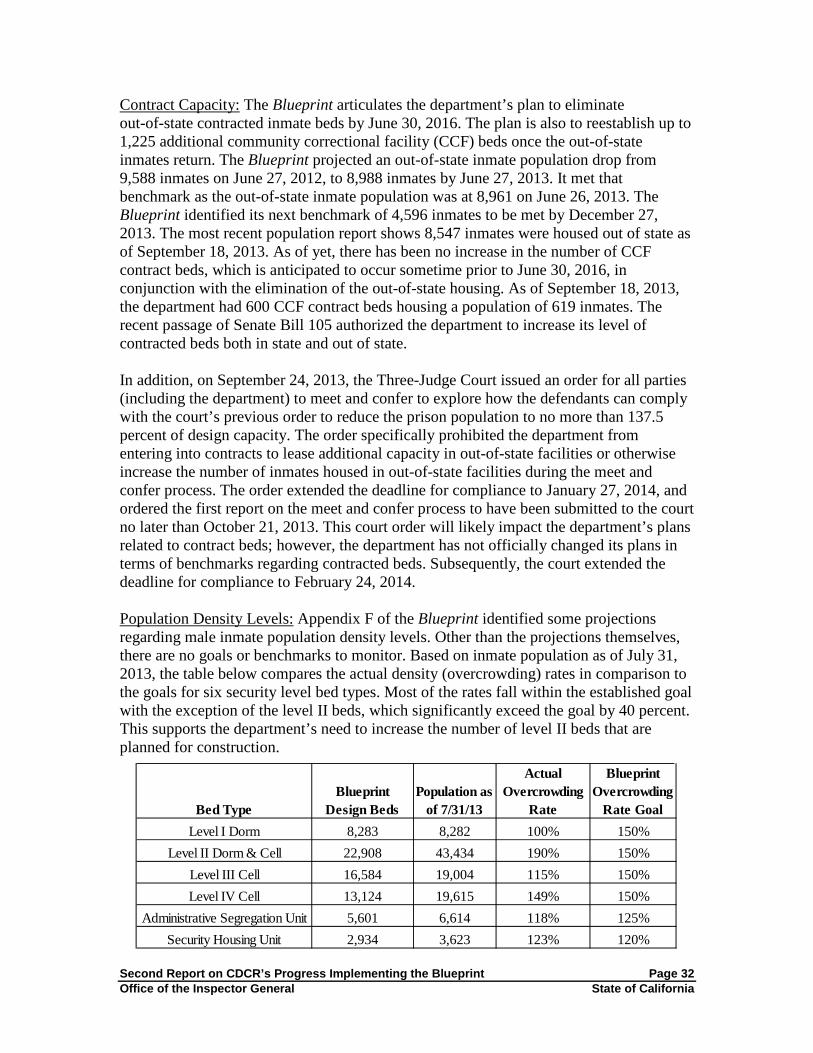
Second Report on CDCR’s Progress Implementing the Blueprint Page 32 Office of the Inspector General State of California
Contract Capacity: The Blueprint articulates the department’s plan to eliminate out-of-state contracted inmate beds by June 30, 2016. The plan is also to reestablish up to 1,225 additional community correctional facility (CCF) beds once the out-of-state inmates return. The Blueprint projected an out-of-state inmate population drop from 9,588 inmates on June 27, 2012, to 8,988 inmates by June 27, 2013. It met that benchmark as the out-of-state inmate population was at 8,961 on June 26, 2013. The Blueprint identified its next benchmark of 4,596 inmates to be met by December 27, 2013. The most recent population report shows 8,547 inmates were housed out of state as of September 18, 2013. As of yet, there has been no increase in the number of CCF contract beds, which is anticipated to occur sometime prior to June 30, 2016, in conjunction with the elimination of the out-of-state housing. As of September 18, 2013, the department had 600 CCF contract beds housing a population of 619 inmates. The recent passage of Senate Bill 105 authorized the department to increase its level of contracted beds both in state and out of state. In addition, on September 24, 2013, the Three-Judge Court issued an order for all parties (including the department) to meet and confer to explore how the defendants can comply with the court’s previous order to reduce the prison population to no more than 137.5 percent of design capacity. The order specifically prohibited the department from entering into contracts to lease additional capacity in out-of-state facilities or otherwise increase the number of inmates housed in out-of-state facilities during the meet and confer process. The order extended the deadline for compliance to January 27, 2014, and ordered the first report on the meet and confer process to have been submitted to the court no later than October 21, 2013. This court order will likely impact the department’s plans related to contract beds; however, the department has not officially changed its plans in terms of benchmarks regarding contracted beds. Subsequently, the court extended the deadline for compliance to February 24, 2014. Population Density Levels: Appendix F of the Blueprint identified some projections regarding male inmate population density levels. Other than the projections themselves, there are no goals or benchmarks to monitor. Based on inmate population as of July 31, 2013, the table below compares the actual density (overcrowding) rates in comparison to the goals for six security level bed types. Most of the rates fall within the established goal with the exception of the level II beds, which significantly exceed the goal by 40 percent. This supports the department’s need to increase the number of level II beds that are planned for construction.
Bed TypeBlueprint
Design BedsPopulation as
of 7/31/13
Actual Overcrowding
Rate
Blueprint Overcrowding
Rate GoalLevel I Dorm 8,283 8,282 100% 150%
Level II Dorm & Cell 22,908 43,434 190% 150%Level III Cell 16,584 19,004 115% 150%Level IV Cell 13,124 19,615 149% 150%
Administrative Segregation Unit 5,601 6,614 118% 125%Security Housing Unit 2,934 3,623 123% 120%

Second Report on CDCR’s Progress Implementing the Blueprint Page 33 Office of the Inspector General State of California
Health Care: Although the Blueprint narrative did not identify the following projects in the “Housing” section, they were identified in Appendix B where the housing plans for each institution are summarized. They were also identified in the “Health Care” section of the Blueprint where it identified a completion date of January 1, 2013, for the following three licensed facilities containing a total of 159 beds for inmates in need of crisis, intermediate, and acute mental health care services.
As reported on our last report, the licensed 45-bed facility at the California Institution for Women was completed and became fully operational in June 2012. The licensed facility provides health care to inmates in need of intermediate or acute mental health services. As reported in our last report, the licensed 64-bed facility at the California Medical Facility was completed and became fully operational in March 2012. The licensed facility provides health care to inmates in need of intermediate mental health care.32
The licensed 50-bed facility at the California Men’s Colony was recently completed in August 2013. Thus, its completion surpassed the January 1, 2013, original completion benchmark. The new licensed facility will provide health care to those in need of crisis mental health care. As of this report, all three licensed facilities are completed and operational.
Housing Plan – Global Benchmarks The department is under federal court order to reduce overcrowding to 137.5 percent of overall design-bed capacity. The deadline for reaching that goal has now been extended to February 24, 2014.
32 Although the facility was operational almost a full month before the Blueprint was published, the OIG was assured that this was one of the three projects referred to in the Blueprint; however, it was not removed from the narrative because the Blueprint document was in its final review stage.

Second Report on CDCR’s Progress Implementing the Blueprint Page 34 Office of the Inspector General State of California
CONCLUSION With the exception of overall population and rehabilitative programming, the department has met or is on track to meet Blueprint goals.
• Various rehabilitation measures have been established or are in development. The major goal of increasing the percentage of inmates served in in-prison rehabilitative programs to 70 percent of the department’s target population prior to their release still has yet to be met. The Blueprint identified no benchmark, but the department’s internal goal to achieve that mark is June 2015. Currently the department reports 13 percent of its target population is having all its rehabilitative needs met and 29 percent of its target population have had some rehabilitative needs met. Also, the department has many variables working against the progress, including the lack of a system-wide case management tool. A case management system is key to getting the right offender into the right program (reentry hubs) at the right time.
In terms of program slots, we found that 93 percent of the academic education programs are operational which represents a three percent increase from our last report. We found that 83 percent of the career technical education programs are operational which represents a nine percent increase from our last report. We also found that 80 percent of the substance abuse treatment slots are filled which represents a 16 percent decrease from our last report. The pre-employment transition programs were introduced in September 2013 at three institutions, Central California Women’s Facility, Folsom Women’s Facility, and Valley State Prison, and the department has other miscellaneous programs slated to be established in FY 2013/14. The department still has not provided a plan for “enhanced program” yards for non-reentry hub prisons.
There are many programs that need to be implemented or established at the same time, which can cause difficulty in successful or timely implementation. New regulations implemented to assess inmates’ needs should provide more data to help the department meet its rehabilitation goals. The department is making progress, but this may be the area with the most challenges.
• The department has established and is adhering to the standardized staffing model at each institution. The staffing model appears to have been well planned out and implemented appropriately. It appears the staffing is in accordance with the Blueprint levels.
• The department has established and is adhering to the new inmate classification score system. The emergency regulations were approved in a timely manner, which changed the inmate classification scoring threshold for male inmates. The new classification score sheets are being used by departmental staff. The changes appear to have been implemented in accordance with the Blueprint goals, and to be trending toward overall reduction in higher-level inmate placements.

Second Report on CDCR’s Progress Implementing the Blueprint Page 35 Office of the Inspector General State of California
• Although there were no benchmarks identified in the Blueprint, the department established the new prison gang management system in October 2012 and is undergoing a 24-month pilot to implement and assess the new procedures. The pilot program is underway, and inmates are being assessed for the SDP. Thus far, 528 inmates have been assessed and 314 inmates (59 percent) have been placed in the SDP and 138 inmates (26 percent) have been released to a general population setting. The department has expressed that the deliberate pace is directly related to the most violent and sophisticated STG members and associates as the department implements this pilot program with caution to enhance safety and security. Based on the more rapid pace in the last seven months, we estimate it will complete assessments of 42 percent of the current STG inmate population by the end of the pilot program in October 2014. We will continue to monitor the progress.
• The department has implemented and is adhering to the comprehensive housing plan described in the Blueprint. The department is housing inmates, for the most part, at levels established in the Blueprint. Additionally, thus far, the construction projects identified in the Blueprint have been completed within the time frames identified. There are still a few large-scale construction projects that need to be completed, but those appear to be on schedule and we will continue to monitor the progress. The two most notable potential variations will be non-closure of the California Rehabilitation Center by 2016, and continued use of out-of-state prisons.
As noted above, the department has demonstrated progress in implementing its Blueprint goals, but considerable progress is still needed to realize the rehabilitation goals. It will also take more time to achieve the projected fiscal benefits of the changes in the ICSS score thresholds and the changes to the new gang management system, which ultimately will reduce the inmate population levels to lower security, less expensive housing.

Second Report on CDCR’s Progress Implementing the Blueprint Page 36 Office of the Inspector General State of California
APPENDICES Appendix A – Standardized Staffing
Appendix B – Housing Plans
Appendix C – Programming Plans
Appendix D – COMPAS Assessments

Second Report on CDCR’s Progress Implementing the Blueprint Page 37 Office of the Inspector General State of California
APPENDIX A – STANDARDIZED STAFFING
The following pages display the information we summarized using the standardized staffing plans identified in the Blueprint and comparing them with payroll data. The staffing plans identified a few specific position classifications, but mainly displayed the positions in major categories for each institution. When performing our comparison against payroll data, we attempted to display the information similar to the staffing plans in the Blueprint. Primarily in the administrative reporting units for each institution, we placed the payroll information in the category or categories where it best appeared to apply. Therefore, the data are not guaranteed to be in the precise category for some of the administrative positions. One other item of note relates to the Enterprise Information Systems (EIS) positions. While the institutions average between four and five EIS positions per site, the positions are captured in the headquarters’ payroll and the department does not have a method to track them separately. Therefore, for the purposes of this exercise, we added them in as “filled” positions at the capacity in which they are displayed in the Blueprint. Since, in total, they only account for 145 positions, we considered this amount negligible for this review. Also, the department was allowed to move positions among the institutions, but they were mandated to conform to the departmental total. The totals are those identified in the Blueprint plus an additional 333 positions that were later identified by the Department of Finance due to a revision in the calculation of unallocated relief coverage. The most current budget information CDCR provided, SSV5, contains 252 positions less in total (40,225.4 positions) than was authorized. Departmental staff explained that they receive unallocated positions to provide relief coverage. However, those positions are not allocated to the institutions until they are activated so the institution total is displayed less than that authorized. For the purposes of our review, we compared the payroll information against the lower budgeted number because that incorporated the detailed changes per institution. The first page of Appendix A displays a statewide summary of the numbers the Blueprint contained for each institution and compares it with the budget positions since they should match in total. The summary also contains the number of filled positions on the payroll33 for each institution and displays the difference between the filled positions and those budgeted.34 The subsequent pages in Appendix A provide the individual detail for each institution.
33 The payroll data were obtained directly from the department, which uses a system maintained by the State Controller’s Office named the Management Information Retrieval System (MIRS). 34 The filled position data at each prison do not contain medical position data (with the exception of custody health care access positions). The medical positions were not included in the Blueprint as part of the standardized staffing plan.

Second Report on CDCR’s Progress Implementing the Blueprint Page 38 Office of the Inspector General State of California
APPENDIX A: STANDARDIZED STAFFING
Standardized Staffing - Statewide Summary
DOF Budget
AuthorityCDCR
BudgetsInstitution Jul 2011 July 2013 July 2013 July 2013
Avenal State Prison 1,437.4 1,306.8 1,318.3 1,310.5 -7.8 1,111.0 -199.5
California Correctional Center 1,088.6 987.8 996.6 969.3 -27.3 870.0 -99.3
California Correctional Institution 1,893.7 1,578.7 1,599.4 1,612.2 12.8 1,482.0 -130.2
California Institution for Men 1,791.9 1,330.2 1,354.6 1,427.2 72.6 1,344.0 -83.2
California Institution for Women 826.9 798.8 799.9 735.5 -64.4 761.0 25.5
California Medical Facility 1,291.6 1,283.0 1,298.7 1,260.4 -38.3 1,167.0 -93.4
California Men's Colony 1,716.4 1,486.8 1,511.0 1,486.9 -24.1 1,411.0 -75.9
California Rehabilitation Center 1,143.3 1,150.7 1,168.0 1,107.1 -60.9 996.0 -111.1
California State Prison, Corcoran 1,846.8 1,737.7 1,754.5 1,798.5 44.0 1,660.0 -138.5California State Prison, Los Angeles County 1,385.6 1,247.8 1,247.8 1,261.0 13.2 1,163.0 -98.0
California State Prison, Sacramento 1,423.8 1,394.8 1,410.7 1,491.6 80.9 1,343.0 -148.6
California State Prison, San Quentin 1,675.2 1,594.1 1,622.6 1,524.9 -97.7 1,382.0 -142.9
California State Prison, Solano 1,133.3 1,095.8 1,103.4 1,114.2 10.8 956.0 -158.2California Substance Abuse Treatment Facility and State Prison, Corcoran 1,744.1 1,625.5 1,635.6 1,661.2 25.6 1,522.0 -139.2
Calipatria State Prison 1,123.3 1,090.9 1,095.6 1,089.1 -6.5 984.0 -105.1
Centinela State Prison 1,118.3 1,116.2 1,112.7 1,098.3 -14.4 1,028.0 -70.3
Central California Women's Facility 954.3 855.9 861.0 900.0 39.0 814.0 -86.0
Chuckawalla Valley State Prison 809.9 784.7 790.1 788.6 -1.5 683.0 -105.6
Correctional Training Facility 1,544.8 1,339.8 1,362.7 1,250.9 -111.8 1,091.0 -159.9
Deuel Vocational Institution 1,184.5 908.2 916.6 885.3 -31.3 749.0 -136.3
Folsom State Prison 921.1 843.0 854.4 848.6 -5.8 763.0 -85.6
Folsom Women's Facility 0.0 70.4 70.4 79.7 9.3 38.0 -41.7
High Desert State Prison 1,270.5 1,250.0 1,259.5 1,261.9 2.4 1,045.0 -216.9
Ironwood State Prison 1,084.3 1,052.8 1,046.5 1,019.4 -27.1 950.0 -69.4
Kern Valley State Prison 1,548.0 1,390.2 1,402.4 1,435.1 32.7 1,319.0 -116.1
Mule Creek State Prison 1,032.9 1,061.6 1,056.7 1,080.6 23.9 1,005.0 -75.6
North Kern State Prison 1,407.1 1,219.7 1,230.3 1,232.2 1.9 1,119.0 -113.2
Pelican Bay State Prison 1,370.2 1,361.0 1,375.3 1,424.4 49.1 1,212.0 -212.4
Pleasant Valley State Prison 1,302.1 1,246.0 1,244.7 1,241.5 -3.2 1,068.0 -173.5
Richard J. Donovan Correctional Facility 1,425.6 1,295.1 1,295.6 1,312.8 17.2 1,214.0 -98.8
Salinas Valley State Prison 1,410.7 1,370.5 1,381.9 1,377.0 -4.9 1,269.0 -108.0
Sierra Conservation Center 1,041.6 1,030.6 1,040.4 969.1 -71.3 893.0 -76.1
Valley State Prison 882.9 889.1 894.3 836.1 -58.2 730.0 -106.1
Wasco State Prison 1,525.4 1,350.0 1,365.1 1,334.3 -30.8 1,181.0 -153.3
TOTALS 43,356.1 40,144.2 40,477.3 40,225.4 -251.9 36,323.0 -3,902.4
* Filled positions derived from payroll data provided 8/5/13. The data displayed includes 145.0 positions physically located at the prisons but not contained in institution payroll information as they appear in headquarters payroll data. For the purposes of this comparison they were added in as budgeted in the Blueprint since the amount was negligible in comparison to the total positions.
Blueprint
Diff Between Budget
Authority
*Filled Positions
as of 8/5/13
Diff of Filled & CDCR Budget

Second Report on CDCR’s Progress Implementing the Blueprint Page 39 Office of the Inspector General State of California
APPENDIX A: STANDARDIZED STAFFING
AVENAL STATE PRISON
Staffing Category Classification Staffing July 2011Standardized
Staffing Totals July 2013
* DOF Budget Authority Totals July
2013
Budgets V. 5.0 -Standardized Staffing
Totals July 2013
Staffing From MIRS Data as of 8/5/13
Difference Between Actual and DOF
Budget as of 8/5/13
Management Warden 1.0 1.0 1.0 1.0 0.0 -1.0Chief Deputy 1.0 1.0 1.0 1.0 1.0 0.0Assoc. Warden 6.0 6.0 6.0 5.0 4.0 -2.0Captain 8.0 5.0 5.0 5.0 4.0 -1.0
Custody Lieutenant 33.9 32.4 32.3 33.4 28.0 -4.3Sergeant 98.5 87.8 88.8 88.4 74.0 -14.8Officer 765.1 690.3 703.9 697.2 631.0 -72.9
Correctional Counselor CCIII 2.0 2.0 2.0 1.0CCII 14.0 9.0 9.0 10.0CCI 39.3 30.0 31.0 29.0
Support Services Total PY 175.7 142.0 142.0 140.0 114.0 -28.0
Canteen Total PY 10.0 10.0 10.0 10.0 10.0 0.0
Food Services Total PY 46.1 38.8 38.8 40.0 33.0 -5.8
Personnel Total PY 21.6 22.0 21.0 21.0 21.0 0.0
Plant Operations Total PY 57.7 64.0 62.0 65.0 39.0 -23.0
Enterprise Information Systems (EIS) Total PY 6.0 6.0 5.0 5.0 5.0 0.0
Education Total PY 47.0 50.0 50.0 50.0 37.0 -13.0
Vocation Total PY 16.0 19.0 19.0 20.0 14.0 -5.0
Dental Total PY 49.5 39.0 39.0 39.0 37.0 -2.0
Mental Health Total PY 39.0 51.5 51.5 49.5 30.0 -21.5
Custody Subtotal 968.8 864.5 880.0 871.0 771.0 -109.0Non Custody Subtotal 317.1 282.8 278.8 281.0 222.0 -56.8Inmate Programs Subtotal 63.0 69.0 69.0 70.0 51.0 -18.0Health Care Subtotal 88.5 90.5 90.5 88.5 67.0 -23.5
Institution Total 1,437.4 1,306.8 1,318.3 1,310.5 1,111.0 -207.3* DOF Budgeted Authority – Refers to the positions for the Blueprint authorized by the Department of Finance (DOF). The numbers were obtained from DOF and differ slightly from the original numbers in the Blueprint due to minor adjustments of unallocated positions related to relief coverage and ratio positions.
29.0 -13.0

Second Report on CDCR’s Progress Implementing the Blueprint Page 40 Office of the Inspector General State of California
APPENDIX A: STANDARDIZED STAFFING
CALIFORNIA CORRECTIONAL CENTER
Staffing Category Classification Staffing July 2011Standardized
Staffing Totals July 2013
* DOF Budget Authority Totals
July 2013
Budgets V. 5.0 -Standardized
Staffing Totals July 2013
Staffing From MIRS Data as of
8/5/13
Difference Between Actual and Budgeted as
of 8/5/13Management Warden 1.0 1.0 1.0 1.0 1.0 0.0
Chief Deputy 1.0 1.0 1.0 1.0 1.0 0.0Assoc. Warden 5.0 5.0 5.0 4.0 4.0 -1.0Captain 7.0 6.0 6.0 5.0 5.0 -1.0
Custody Lieutenant 45.1 20.4 20.3 37.0 39.0 18.7Sergeant 82.3 81.0 81.9 74.4 76.0 -5.9Officer 566.5 500.6 508.6 459.2 425.0 -83.6
Correctional Counselor CCIII 1.0 1.0 1.0 1.0CCII 7.0 7.5 7.5 9.0CCI 35.1 23.0 24.0 29.0
Support Services Total PY 127.5 128.5 126.5 94.0 -34.5Support Services (Camps) Total PY 8.0 8.0 12.0 13.0 5.0
Canteen Total PY 9.0 9.0 9.0 9.0 12.0 3.0Canteen (Camps) 1.0 1.0 1.0 1.0 0.0 -1.0
Food Services Total PY 25.6 24.8 24.8 29.2 27.0 2.2Food Services (Camps) 3.0 3.0 3.0 3.0 0.0 -3.0
Personnel Total PY 18.4 19.0 18.0 18.0 17.0 -1.0
Plant Operations Total PY 55.0 53.0 53.0 53.0 47.0 -6.0Plant Operations (Camps) 2.0 3.0 3.0 3.0 0.0 -3.0
Enterprise Information Systems (EIS) Total PY 6.0 6.0 5.0 5.0 5.0 0.0
Education Total PY 29.0 31.0 31.0 33.0 21.0 -10.0
Vocation Total PY 8.0 11.0 11.0 11.0 8.0 -3.0
Dental Total PY 35.5 34.0 34.0 34.0 31.0 -3.0
Mental Health Total PY 3.0 11.0 11.0 11.0 7.0 -4.0
Custody Subtotal 751.0 646.5 656.3 620.6 588.0 -68.3Non Custody Subtotal 262.1 254.3 253.3 259.7 215.0 -38.3Inmate Programs Subtotal 37.0 42.0 42.0 44.0 29.0 -13.0Health Care Subtotal 38.5 45.0 45.0 45.0 38.0 -7.0
Institution Total 1,088.6 987.8 996.6 969.3 870.0 -126.6
37.0 4.5
* DOF Budgeted Authority – Refers to the positions for the Blueprint authorized by the Department of Finance (DOF). The numbers were obtained from DOF and differ slightly from the original numbers in the Blueprint due to minor adjustments of unallocated positions related to relief coverage and ratio positions.

Second Report on CDCR’s Progress Implementing the Blueprint Page 41 Office of the Inspector General State of California
APPENDIX A: STANDARDIZED STAFFING
CALIFORNIA CORRECTIONAL INSTITUTION
Staffing Category Classification Staffing July 2011Standardized
Staffing Totals July 2013
* DOF Budget Authority Totals
July 2013
Budgets V. 5.0 -Standardized
Staffing Totals July 2013
Staffing From MIRS Data as of
8/5/13
Difference Between Actual and Budgeted as
of 8/5/13Management Warden 1.0 1.0 1.0 1.0 1.0 0.0
Chief Deputy 2.0 1.0 1.0 1.0 1.0 0.0Assoc. Warden 5.0 6.0 6.0 6.0 4.0 -2.0Captain 8.0 8.0 8.0 8.0 8.0 0.0
Custody Lieutenant 42.7 30.5 30.4 36.0 35.0 4.6Sergeant 131.9 96.0 97.1 96.8 84.0 -13.1Officer 1,123.3 952.6 971.3 991.4 940.0 -31.3
Correctional Counselor CCIII 2.0 1.0 1.0 1.0CCII 17.0 11.0 11.0 12.0CCI 47.9 30.0 31.0 31.0
Support Services Total PY 202.6 147.0 148.0 147.0 128.0 -20.0
Canteen Total PY 9.0 9.0 9.0 9.0 8.0 -1.0
Food Services Total PY 31.0 35.6 35.6 33.0 29.0 -6.6
Personnel Total PY 27.5 25.0 24.0 24.0 24.0 0.0
Plant Operations Total PY 79.0 65.0 65.0 67.0 52.0 -13.0
Enterprise Information Systems (EIS) Total PY 6.0 6.0 6.0 5.0 5.0 -1.0
Education Total PY 38.0 40.0 40.0 35.0 35.0 -5.0
Vocation Total PY 10.0 12.0 12.0 13.0 11.0 -1.0
Dental Total PY 40.0 38.0 38.0 38.0 34.0 -4.0
Mental Health Total PY 69.8 64.0 64.0 57.0 45.0 -19.0
Custody Subtotal 1,380.8 1,137.1 1,157.8 1,184.2 1,111.0 -46.8Non Custody Subtotal 355.1 287.6 287.6 285.0 246.0 -41.6Inmate Programs Subtotal 48.0 52.0 52.0 48.0 46.0 -6.0Health Care Subtotal 109.8 102.0 102.0 95.0 79.0 -23.0
Institution Total 1,893.7 1,578.7 1,599.4 1,612.2 1,482.0 -117.4
38.0 -5.0
* DOF Budgeted Authority – Refers to the positions for the Blueprint authorized by the Department of Finance (DOF). The numbers were obtained from DOF and differ slightly from the original numbers in the Blueprint due to minor adjustments of unallocated positions related to relief coverage and ratio positions.

Second Report on CDCR’s Progress Implementing the Blueprint Page 42 Office of the Inspector General State of California
APPENDIX A: STANDARDIZED STAFFING
CALIFORNIA INSTITUTION FOR MEN
Staffing Category Classification Staffing July 2011Standardized
Staffing Totals July 2013
* DOF Budget Authority Totals July
2013
Budgets V. 5.0 -Standardized Staffing
Totals July 2013
Staffing From MIRS Data as of 8/5/13
Difference Between Actual and Budgeted
as of 8/5/13
Management Warden 1.0 1.0 1.0 1.0 0.0 -1.0Chief Deputy 2.0 1.0 1.0 1.0 1.0 0.0Assoc. Warden 7.0 6.0 6.0 6.0 6.0 0.0Captain 7.0 6.0 6.0 6.0 6.0 0.0
Custody Lieutenant 35.1 23.9 23.8 28.2 26.0 2.2Sergeant 130.1 108.8 110.0 97.4 91.0 -19.0Officer 979.5 674.1 696.4 762.0 728.0 31.6
Correctional Counselor CCIII 4.0 2.0 2.0 1.0CCII 15.4 10.0 10.0 11.0CCI 56.9 26.0 27.0 31.0
Support Services Total PY 244.2 146.0 147.0 155.0 140.0 -7.0
Canteen Total PY 7.0 7.0 7.0 7.0 7.0 0.0
Food Services Total PY 41.5 36.4 36.4 40.6 33.0 -3.4
Personnel Total PY 25.8 24.0 23.0 24.0 24.0 1.0
Plant Operations Total PY 70.0 65.0 65.0 63.0 55.0 -10.0
Enterprise Information Systems (EIS) Total PY 5.0 6.0 6.0 5.0 5.0 -1.0
Education Total PY 25.0 38.0 38.0 40.0 30.0 -8.0
Vocation Total PY 3.0 15.0 15.0 15.0 7.0 -8.0
Dental Total PY 37.0 35.0 35.0 38.0 35.0 0.0
Mental Health Total PY 93.4 99.0 99.0 95.0 113.0 14.0
Custody Subtotal 1,238.0 858.8 883.2 944.6 895.0 11.8Non Custody Subtotal 395.5 284.4 284.4 294.6 264.0 -20.4Inmate Programs Subtotal 28.0 53.0 53.0 55.0 37.0 -16.0Health Care Subtotal 130.4 134.0 134.0 133.0 148.0 14.0
Institution Total 1,791.9 1,330.2 1,354.6 1,427.2 1,344.0 -10.6
37.0 -2.0
* DOF Budgeted Authority – Refers to the positions for the Blueprint authorized by the Department of Finance (DOF). The numbers were obtained from DOF and differ slightly from the original numbers in the Blueprint due to minor adjustments of unallocated positions related to relief coverage and ratio positions.

Second Report on CDCR’s Progress Implementing the Blueprint Page 43 Office of the Inspector General State of California
APPENDIX A: STANDARDIZED STAFFING
CALIFORNIA INSTITUTION FOR WOMEN
Staffing Category Classification Staffing July 2011Standardized
Staffing Totals July 2013
* DOF Budget Authority Totals July
2013
Budgets V. 5.0 -Standardized Staffing
Totals July 2013
Staffing From MIRS Data as of 8/5/13
Difference Between Actual and Budgeted
as of 8/5/13
Management Warden 1.0 1.0 1.0 1.0 0.0 -1.0Chief Deputy 1.0 1.0 1.0 1.0 1.0 0.0Assoc. Warden 5.0 4.0 4.0 4.0 3.0 -1.0Captain 5.0 3.0 3.0 4.0 4.0 1.0
Custody Lieutenant 25.5 19.8 19.7 23.2 20.0 0.3Sergeant 63.3 60.4 61.1 55.8 46.0 -15.1Officer 372.2 385.7 392.4 341.4 324.0 -68.4
Correctional Counselor CCIII 3.0 1.0 1.0 1.0CCII 7.5 6.0 6.0 7.0CCI 16.0 12.0 10.8 10.0
Support Services Total PY 93.8 94.0 92.0 89.0 76.0 -16.0
Camp Support Total PY 1.0 1.0 1.0 1.0 0.0 -1.0
Canteen Total PY 4.0 4.0 4.0 4.0 3.0 -1.0
Food Services Total PY 16.1 14.2 14.2 20.6 17.0 2.8
Personnel Total PY 13.2 18.0 17.0 17.0 17.0 0.0
Plant Operations Total PY 44.0 42.0 41.0 42.0 34.0 -7.0
Enterprise Information Systems (EIS) Total PY 5.0 5.0 4.0 4.0 4.0 0.0
Education Total PY 22.0 21.0 21.0 20.0 19.0 -2.0
Vocation Total PY 3.0 5.0 5.0 5.0 5.0 0.0
Dental Total PY 25.0 19.0 19.0 19.0 19.0 0.0
Mental Health Total PY 100.3 81.7 81.7 65.5 151.0 69.3
Custody Subtotal 499.5 493.9 500.0 448.4 416.0 -84.0Non Custody Subtotal 177.1 178.2 173.2 177.6 151.0 -22.2Inmate Programs Subtotal 25.0 26.0 26.0 25.0 24.0 -2.0Health Care Subtotal 125.3 100.7 100.7 84.5 170.0 69.3
Institution Total 826.9 798.8 799.9 735.5 761.0 -38.9
18.0 0.2
* DOF Budgeted Authority – Refers to the positions for the Blueprint authorized by the Department of Finance (DOF). The numbers were obtained from DOF and differ slightly from the original numbers in the Blueprint due to minor adjustments of unallocated positions related to relief coverage and ratio positions.

Second Report on CDCR’s Progress Implementing the Blueprint Page 44 Office of the Inspector General State of California
APPENDIX A: STANDARDIZED STAFFING
CALIFORNIA MEDICAL FACILITY
Staffing Category Classification Staffing July 2011Standardized
Staffing Totals July 2013
* DOF Budget Authority Totals July
2013
Budgets V. 5.0 -Standardized Staffing
Totals July 2013
Staffing From MIRS Data as of 8/5/13
Difference Between Actual and Budgeted
as of 8/5/13
Management Warden 1.0 1.0 1.0 1.0 0.0 -1.0Chief Deputy 1.0 1.0 1.0 1.0 1.0 0.0Assoc. Warden 6.0 5.0 5.0 5.0 4.0 -1.0Captain 7.0 6.0 6.0 6.0 6.0 0.0
Custody Lieutenant 31.5 38.8 38.7 32.0 29.0 -9.7Sergeant 92.7 92.6 93.6 83.8 80.0 -13.6Officer 690.0 675.8 694.6 686.2 630.0 -64.6
Correctional Counselor CCIII 1.0 1.0 1.0 1.0CCII 12.0 8.0 8.0 12.0CCI 25.1 24.0 23.0 24.0
Support Services Total PY 97.5 117.5 117.5 114.0 87.0 -30.5
Canteen Total PY 4.0 4.0 4.0 4.0 0.0 -4.0
Food Services Total PY 29.0 37.4 37.4 28.4 21.0 -16.4
Personnel Total PY 23.9 24.0 23.0 23.0 12.0 -11.0
Plant Operations Total PY 47.0 52.0 51.0 52.0 30.0 -21.0
Enterprise Information Systems (EIS) Total PY 4.0 4.0 3.0 4.0 4.0 1.0
Education Total PY 25.0 22.0 22.0 25.0 20.0 -2.0
Vocation Total PY 2.0 6.0 6.0 3.0 2.0 -4.0
Dental Total PY 26.0 24.0 24.0 24.0 21.0 -3.0
Mental Health Total PY 165.9 138.9 138.9 131.0 189.0 50.1
Custody Subtotal 867.3 853.2 871.9 852.0 781.0 -90.9Non Custody Subtotal 205.4 238.9 235.9 225.4 154.0 -81.9Inmate Programs Subtotal 27.0 28.0 28.0 28.0 22.0 -6.0Health Care Subtotal 191.9 162.9 162.9 155.0 210.0 47.1
Institution Total 1,291.6 1,283.0 1,298.7 1,260.4 1,167.0 -131.7
31.0 -1.0
* DOF Budgeted Authority – Refers to the positions for the Blueprint authorized by the Department of Finance (DOF). The numbers were obtained from DOF and differ slightly from the original numbers in the Blueprint due to minor adjustments of unallocated positions related to relief coverage and ratio positions.

Second Report on CDCR’s Progress Implementing the Blueprint Page 45 Office of the Inspector General State of California
APPENDIX A: STANDARDIZED STAFFING
CALIFORNIA MEN’S COLONY
Staffing Category Classification Staffing July 2011Standardized
Staffing Totals July 2013
* DOF Budget Authority Totals July
2013
Budgets V. 5.0 -Standardized Staffing
Totals July 2013
Staffing From MIRS Data as of 8/5/13
Difference Between Actual and Budgeted
as of 8/5/13
Management Warden 1.0 1.0 1.0 1.0 1.0 0.0Chief Deputy 2.0 1.0 1.0 1.0 0.0 -1.0Assoc. Warden 6.0 5.0 5.0 5.0 5.0 0.0Captain 9.0 7.0 7.0 7.0 7.0 0.0
Custody Lieutenant 44.1 33.0 32.9 36.4 32.0 -0.9Sergeant 129.5 97.2 98.3 90.4 86.0 -12.3Officer 849.1 730.2 752.4 720.2 667.0 -85.4
Correctional Counselor CCIII 2.0 1.0 1.0 1.0CCII 15.7 9.0 9.0 10.0CCI 48.3 30.0 31.0 40.0
Support Services Total PY 183.0 153.0 154.0 156.0 131.0 -23.0
Canteen Total PY 8.0 8.0 8.0 8.0 7.0 -1.0
Food Services Total PY 35.0 42.8 42.8 43.2 35.0 -7.8
Personnel Total PY 25.0 24.0 23.0 23.0 23.0 0.0
Plant Operations Total PY 75.0 71.0 71.0 74.0 60.0 -11.0
Enterprise Information Systems (EIS) Total PY 6.0 6.0 6.0 5.0 5.0 -1.0
Education Total PY 48.0 48.0 48.0 49.0 38.0 -10.0
Vocation Total PY 9.0 13.0 13.0 13.0 6.0 -7.0
Dental Total PY 43.0 36.0 36.0 34.0 32.0 -4.0
Mental Health Total PY 177.7 170.6 170.6 169.7 231.0 60.4
Custody Subtotal 1,106.7 914.4 938.6 912.0 843.0 -95.6Non Custody Subtotal 332.0 304.8 304.8 309.2 261.0 -43.8Inmate Programs Subtotal 57.0 61.0 61.0 62.0 44.0 -17.0Health Care Subtotal 220.7 206.6 206.6 203.7 263.0 56.4
Institution Total 1,716.4 1,486.8 1,511.0 1,486.9 1,411.0 -100.0
45.0 4.0
* DOF Budgeted Authority – Refers to the positions for the Blueprint authorized by the Department of Finance (DOF). The numbers were obtained from DOF and differ slightly from the original numbers in the Blueprint due to minor adjustments of unallocated positions related to relief coverage and ratio positions.

Second Report on CDCR’s Progress Implementing the Blueprint Page 46 Office of the Inspector General State of California
APPENDIX A: STANDARDIZED STAFFING
CALIFORNIA REHABILITATION CENTER
Staffing Category Classification Staffing July 2011Standardized
Staffing Totals July 2013
* DOF Budget Authority Totals July
2013
Budgets V. 5.0 -Standardized Staffing
Totals July 2013
Staffing From MIRS Data as of 8/5/13
Difference Between Actual and Budgeted
as of 8/5/13
Management Warden 1.0 1.0 1.0 1.0 1.0 0.0Chief Deputy 1.0 1.0 1.0 1.0 1.0 0.0Assoc. Warden 5.0 5.0 5.0 4.0 4.0 -1.0Captain 7.0 5.0 5.0 5.0 3.0 -2.0
Custody Lieutenant 30.3 27.4 27.3 22.8 26.0 -1.3Sergeant 64.6 62.6 63.3 51.6 59.0 -4.3Officer 630.9 638.6 656.3 509.0 596.0 -60.3
Correctional Counselor CCIII 1.0 1.0 1.0 1.0CCII 10.0 8.0 8.0 8.0CCI 28.4 24.0 25.0 22.0
Support Services Total PY 148.4 126.0 126.0 124.0 100.0 -26.0
Canteen Total PY 7.0 7.0 7.0 7.0 0.0 -7.0
Food Services Total PY 28.0 31.6 31.6 29.2 24.0 -7.6
Personnel Total PY 16.9 20.0 19.0 19.0 15.0 -4.0
Plant Operations Total PY 50.0 57.0 57.0 57.0 40.0 -17.0
Enterprise Information Systems (EIS) Total PY 5.0 5.0 4.0 4.0 4.0 0.0
Education Total PY 36.0 45.0 45.0 37.0 31.0 -14.0
Vocation Total PY 10.0 19.0 19.0 9.0 10.0 -9.0
Dental Total PY 32.0 30.0 30.0 30.0 28.0 -2.0
Mental Health Total PY 30.8 36.5 36.5 38.5 25.0 -11.5
Custody Subtotal 779.2 773.6 792.9 752.4 719.0 -73.9Non Custody Subtotal 255.3 246.6 244.6 240.2 183.0 -61.6Inmate Programs Subtotal 46.0 64.0 64.0 46.0 41.0 -23.0Health Care Subtotal 62.8 66.5 66.5 68.5 53.0 -13.5
Institution Total 1,143.3 1,150.7 1,168.0 1,107.1 996.0 -172.0
29.0 -5.0
* DOF Budgeted Authority – Refers to the positions for the Blueprint authorized by the Department of Finance (DOF). The numbers were obtained from DOF and differ slightly from the original numbers in the Blueprint due to minor adjustments of unallocated positions related to relief coverage and ratio positions.

Second Report on CDCR’s Progress Implementing the Blueprint Page 47 Office of the Inspector General State of California
APPENDIX A: STANDARDIZED STAFFING
CALIFORNIA STATE PRISON, CORCORAN
Staffing Category Classification Staffing July 2011Standardized
Staffing Totals July 2013
* DOF Budget Authority Totals July
2013
Budgets V. 5.0 -Standardized Staffing
Totals July 2013
Staffing From MIRS Data as of 8/5/13
Difference Between Actual and Budgeted
as of 8/5/13
Management Warden 1.0 1.0 1.0 1.0 0.0 -1.0Chief Deputy 2.0 1.0 1.0 1.0 1.0 0.0Assoc. Warden 6.0 7.0 7.0 7.0 6.0 -1.0Captain 9.0 8.0 8.0 8.0 6.0 -2.0
Custody Lieutenant 43.1 39.0 38.8 37.0 34.0 -4.8Sergeant 115.1 97.8 98.9 109.0 100.0 1.1Officer 1,088.1 1,047.8 1,064.7 1,089.2 1,008.0 -56.7
Correctional Counselor CCIII 2.0 1.0 1.0 1.0CCII 17.0 14.0 14.0 14.0CCI 39.5 33.0 34.0 38.0
Support Services Total PY 146.0 147.0 146.0 119.0 -28.0
Canteen Total PY 9.5 9.5 9.5 9.5 9.0 -0.5
Food Services Total PY 38.4 37.6 37.6 40.8 30.0 -7.6
Personnel Total PY 28.5 27.0 26.0 27.0 27.0 1.0
Plant Operations Total PY 85.0 77.0 75.0 80.0 54.0 -21.0
Enterprise Information Systems (EIS) Total PY 4.0 5.0 5.0 4.0 4.0 -1.0
Education Total PY 39.0 38.0 38.0 40.0 34.0 -4.0
Vocation Total PY 7.0 5.0 5.0 6.0 5.0 0.0
Dental Total PY 42.0 39.0 39.0 39.0 32.0 -7.0
Mental Health Total PY 114.1 104.0 104.0 101.0 145.0 41.0
Custody Subtotal 1,322.8 1,249.6 1,268.4 1,305.2 1,201.0 -67.4Non Custody Subtotal 321.9 302.1 300.1 307.3 243.0 -57.1Inmate Programs Subtotal 46.0 43.0 43.0 46.0 39.0 -4.0Health Care Subtotal 156.1 143.0 143.0 140.0 177.0 34.0
Institution Total 1,846.8 1,737.7 1,754.5 1,798.5 1,660.0 -94.5
46.0 -3.0
* DOF Budgeted Authority – Refers to the positions for the Blueprint authorized by the Department of Finance (DOF). The numbers were obtained from DOF and differ slightly from the original numbers in the Blueprint due to minor adjustments of unallocated positions related to relief coverage and ratio positions.

Second Report on CDCR’s Progress Implementing the Blueprint Page 48 Office of the Inspector General State of California
APPENDIX A: STANDARDIZED STAFFING
CALIFORNIA STATE PRISON, LOS ANGELES COUNTY
Staffing Category Classification Staffing July 2011Standardized
Staffing Totals July 2013
* DOF Budget Authority Totals July
2013
Budgets V. 5.0 -Standardized Staffing
Totals July 2013
Staffing From MIRS Data as of 8/5/13
Difference Between Actual and Budgeted
as of 8/5/13
Management Warden 1.0 1.0 1.0 1.0 1.0 0.0Chief Deputy 1.0 1.0 1.0 1.0 1.0 0.0Assoc. Warden 5.0 4.0 4.0 4.0 4.0 0.0Captain 6.0 6.0 6.0 6.0 6.0 0.0
Custody Lieutenant 32.3 27.8 27.7 28.2 27.0 -0.7Sergeant 68.9 77.8 78.6 71.2 58.0 -20.6Officer 750.7 664.7 666.0 683.0 641.0 -25.0
Correctional Counselor CCIII 2.0 1.0 1.0 1.0CCII 12.0 10.5 10.5 11.0CCI 44.5 27.0 28.0 28.0
Support Services Total PY 165.9 119.0 120.0 122.0 99.0 -21.0
Canteen Total PY 8.0 8.0 8.0 8.0 8.0 0.0
Food Services Total PY 38.0 35.4 35.4 34.0 28.0 -7.4
Personnel Total PY 20.2 22.0 21.0 21.0 21.0 0.0
Plant Operations Total PY 59.0 56.0 54.0 54.0 48.0 -6.0
Enterprise Information Systems (EIS) Total PY 6.0 6.0 5.0 5.0 5.0 0.0
Education Total PY 33.0 31.0 31.0 32.0 26.0 -5.0
Vocation Total PY 2.0 7.0 7.0 8.0 4.0 -3.0
Dental Total PY 41.0 35.0 35.0 35.0 32.0 -3.0
Mental Health Total PY 89.1 107.6 107.6 107.6 119.0 11.4
Custody Subtotal 923.4 820.8 823.8 834.4 773.0 -50.8Non Custody Subtotal 297.1 246.4 243.4 244.0 209.0 -34.4Inmate Programs Subtotal 35.0 38.0 38.0 40.0 30.0 -8.0Health Care Subtotal 130.1 142.6 142.6 142.6 151.0 8.4
Institution Total 1,385.6 1,247.8 1,247.8 1,261.0 1,163.0 -84.8
35.0 -4.5
* DOF Budgeted Authority – Refers to the positions for the Blueprint authorized by the Department of Finance (DOF). The numbers were obtained from DOF and differ slightly from the original numbers in the Blueprint due to minor adjustments of unallocated positions related to relief coverage and ratio positions.

Second Report on CDCR’s Progress Implementing the Blueprint Page 49 Office of the Inspector General State of California
APPENDIX A: STANDARDIZED STAFFING
CALIFORNIA STATE PRISON, SACRAMENTO
Staffing Category Classification Staffing July 2011Standardized
Staffing Totals July 2013
* DOF Budget Authority Totals July
2013
Budgets V. 5.0 -Standardized Staffing
Totals July 2013
Staffing From MIRS Data as of 8/5/13
Difference Between Actual and Budgeted
as of 8/5/13
Management Warden 1.0 1.0 1.0 1.0 1.0 0.0Chief Deputy 1.0 1.0 1.0 1.0 1.0 0.0Assoc. Warden 5.0 5.0 5.0 5.0 5.0 0.0Captain 6.0 6.0 6.0 6.0 5.0 -1.0
Custody Lieutenant 33.3 32.8 32.7 35.0 29.0 -3.7Sergeant 100.9 95.0 96.0 95.6 86.0 -10.0Officer 828.6 772.1 792.1 842.8 708.0 -84.1
Correctional Counselor CCIII 1.0 1.0 1.0 1.0CCII 16.0 14.0 14.0 16.5CCI 19.5 18.0 17.0 21.0
Support Services Total PY 94.1 105.0 105.0 109.0 85.0 -20.0
Canteen Total PY 5.0 5.0 5.0 5.0 5.0 0.0
Food Services Total PY 35.1 32.4 32.4 36.2 34.0 1.6
Personnel Total PY 21.6 23.0 22.0 23.0 23.0 1.0
Plant Operations Total PY 54.0 52.0 50.0 56.0 45.0 -5.0
Enterprise Information Systems (EIS) Total PY 4.0 5.0 4.0 4.0 4.0 0.0
Education Total PY 22.0 25.0 25.0 25.0 21.0 -4.0
Vocation Total PY 3.0 3.0 3.0 3.0 3.0 0.0
Dental Total PY 29.0 26.0 26.0 26.0 24.0 -2.0
Mental Health Total PY 143.7 172.5 172.5 179.5 230.0 57.5
Custody Subtotal 1,012.3 945.9 965.8 1,024.9 869.0 -96.8Non Custody Subtotal 213.8 222.4 218.4 233.2 196.0 -22.4Inmate Programs Subtotal 25.0 28.0 28.0 28.0 24.0 -4.0Health Care Subtotal 172.7 198.5 198.5 205.5 254.0 55.5
Institution Total 1,423.8 1,394.8 1,410.7 1,491.6 1,343.0 -67.7
34.0 2.0
* DOF Budgeted Authority – Refers to the positions for the Blueprint authorized by the Department of Finance (DOF). The numbers were obtained from DOF and differ slightly from the original numbers in the Blueprint due to minor adjustments of unallocated positions related to relief coverage and ratio positions.

Second Report on CDCR’s Progress Implementing the Blueprint Page 50 Office of the Inspector General State of California
APPENDIX A: STANDARDIZED STAFFING
CALIFORNIA STATE PRISON, SAN QUENTIN
Staffing Category Classification Staffing July 2011Standardized
Staffing Totals July 2013
* DOF Budget Authority Totals July
2013
Budgets V. 5.0 -Standardized Staffing
Totals July 2013
Staffing From MIRS Data as of 8/5/13
Difference Between Actual and Budgeted
as of 8/5/13
Management Warden 1.0 1.0 1.0 1.0 1.0 0.0Chief Deputy 1.0 1.0 1.0 1.0 1.0 0.0Assoc. Warden 7.0 6.0 6.0 6.0 6.0 0.0Captain 7.0 7.0 7.0 7.0 6.0 -1.0
Custody Lieutenant 42.8 34.2 34.0 37.2 36.0 2.0Sergeant 107.3 105.4 106.6 98.4 92.0 -14.6Officer 946.3 919.0 946.5 872.6 808.0 -138.5
Correctional Counselor CCIII 2.0 1.0 1.0 1.0CCII 14.1 12.0 12.0 13.0CCI 48.0 35.0 36.0 29.0
Support Services Total PY 198.5 154.0 154.0 151.0 119.0 -35.0
Canteen Total PY 9.0 9.0 9.0 9.0 8.0 -1.0
Food Services Total PY 39.9 35.6 35.6 34.8 28.0 -7.6
Personnel Total PY 22.0 25.0 24.0 24.0 24.0 0.0
Plant Operations Total PY 57.7 66.0 66.0 67.0 35.0 -31.0
Enterprise Information Systems (EIS) Total PY 4.0 4.0 4.0 4.0 4.0 0.0
Education Total PY 23.0 33.0 33.0 36.0 25.0 -8.0
Vocation Total PY 2.0 11.0 11.0 11.0 3.0 -8.0
Dental Total PY 35.0 30.0 30.0 30.0 26.0 -4.0
Mental Health Total PY 107.6 104.9 104.9 91.9 117.0 12.1
Custody Subtotal 1,176.5 1,121.6 1,151.1 1,066.2 993.0 -158.1Non Custody Subtotal 331.1 293.6 292.6 289.8 218.0 -74.6Inmate Programs Subtotal 25.0 44.0 44.0 47.0 28.0 -16.0Health Care Subtotal 142.6 134.9 134.9 121.9 143.0 8.1
Institution Total 1,675.2 1,594.1 1,622.6 1,524.9 1,382.0 -240.6
43.0 -6.0
* DOF Budgeted Authority – Refers to the positions for the Blueprint authorized by the Department of Finance (DOF). The numbers were obtained from DOF and differ slightly from the original numbers in the Blueprint due to minor adjustments of unallocated positions related to relief coverage and ratio positions.
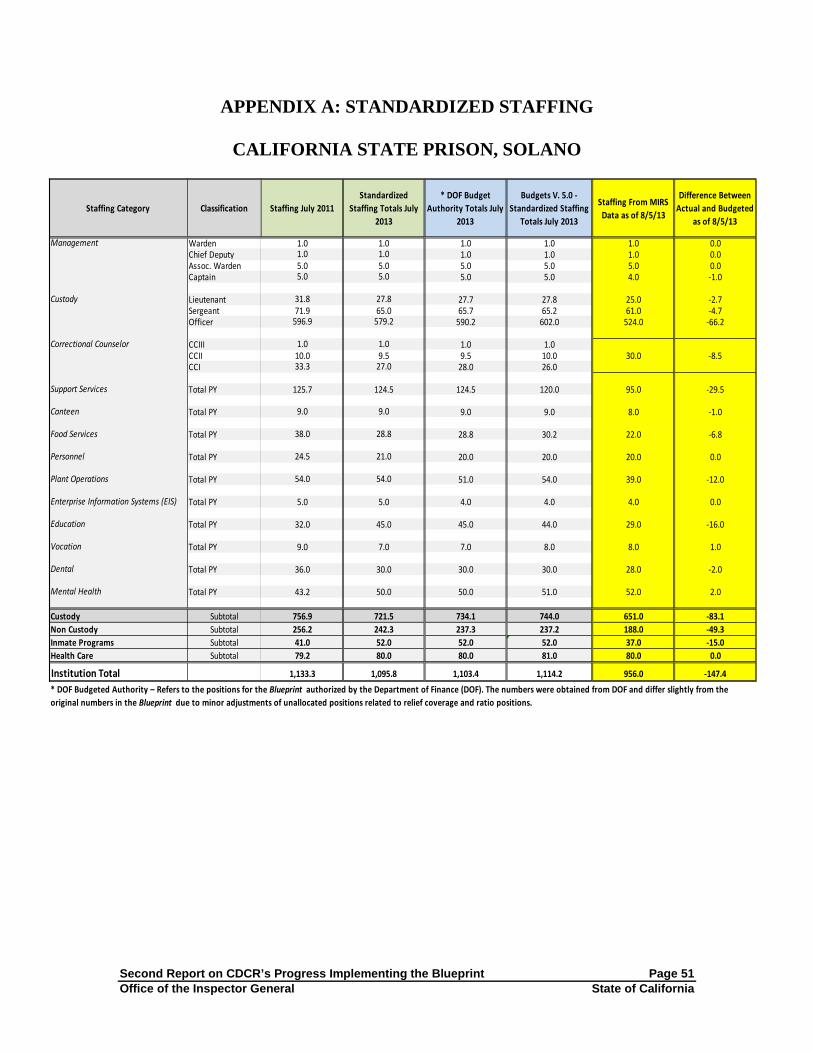
Second Report on CDCR’s Progress Implementing the Blueprint Page 51 Office of the Inspector General State of California
APPENDIX A: STANDARDIZED STAFFING
CALIFORNIA STATE PRISON, SOLANO
Staffing Category Classification Staffing July 2011Standardized
Staffing Totals July 2013
* DOF Budget Authority Totals July
2013
Budgets V. 5.0 -Standardized Staffing
Totals July 2013
Staffing From MIRS Data as of 8/5/13
Difference Between Actual and Budgeted
as of 8/5/13
Management Warden 1.0 1.0 1.0 1.0 1.0 0.0Chief Deputy 1.0 1.0 1.0 1.0 1.0 0.0Assoc. Warden 5.0 5.0 5.0 5.0 5.0 0.0Captain 5.0 5.0 5.0 5.0 4.0 -1.0
Custody Lieutenant 31.8 27.8 27.7 27.8 25.0 -2.7Sergeant 71.9 65.0 65.7 65.2 61.0 -4.7Officer 596.9 579.2 590.2 602.0 524.0 -66.2
Correctional Counselor CCIII 1.0 1.0 1.0 1.0CCII 10.0 9.5 9.5 10.0CCI 33.3 27.0 28.0 26.0
Support Services Total PY 125.7 124.5 124.5 120.0 95.0 -29.5
Canteen Total PY 9.0 9.0 9.0 9.0 8.0 -1.0
Food Services Total PY 38.0 28.8 28.8 30.2 22.0 -6.8
Personnel Total PY 24.5 21.0 20.0 20.0 20.0 0.0
Plant Operations Total PY 54.0 54.0 51.0 54.0 39.0 -12.0
Enterprise Information Systems (EIS) Total PY 5.0 5.0 4.0 4.0 4.0 0.0
Education Total PY 32.0 45.0 45.0 44.0 29.0 -16.0
Vocation Total PY 9.0 7.0 7.0 8.0 8.0 1.0
Dental Total PY 36.0 30.0 30.0 30.0 28.0 -2.0
Mental Health Total PY 43.2 50.0 50.0 51.0 52.0 2.0
Custody Subtotal 756.9 721.5 734.1 744.0 651.0 -83.1Non Custody Subtotal 256.2 242.3 237.3 237.2 188.0 -49.3Inmate Programs Subtotal 41.0 52.0 52.0 52.0 37.0 -15.0Health Care Subtotal 79.2 80.0 80.0 81.0 80.0 0.0
Institution Total 1,133.3 1,095.8 1,103.4 1,114.2 956.0 -147.4* DOF Budgeted Authority – Refers to the positions for the Blueprint authorized by the Department of Finance (DOF). The numbers were obtained from DOF and differ slightly from the original numbers in the Blueprint due to minor adjustments of unallocated positions related to relief coverage and ratio positions.
30.0 -8.5

Second Report on CDCR’s Progress Implementing the Blueprint Page 52 Office of the Inspector General State of California
APPENDIX A: STANDARDIZED STAFFING
CALIFORNIA SUBSTANCE ABUSE TREATMENT FACILITY AND STATE PRISON, CORCORAN
Staffing Category Classification Staffing July 2011Standardized
Staffing Totals July 2013
* DOF Budget Authority Totals July
2013
Budgets V. 5.0 -Standardized Staffing
Totals July 2013
Staffing From MIRS Data as of 8/5/13
Difference Between Actual and Budgeted
as of 8/5/13
Management Warden 1.0 1.0 1.0 1.0 1.0 0.0Chief Deputy 2.0 1.0 1.0 1.0 1.0 0.0Assoc. Warden 7.0 7.0 7.0 7.0 7.0 0.0Captain 9.0 7.0 7.0 7.0 7.0 0.0
Custody Lieutenant 41.3 38.2 38.1 39.6 38.0 -0.1Sergeant 95.2 93.0 94.0 98.4 93.0 -1.0Officer 953.0 905.7 914.9 894.8 806.0 -108.9
Correctional Counselor CCIII 2.0 1.0 1.0 1.0CCII 16.0 13.0 13.0 13.0CCI 45.9 37.0 38.0 39.0
Support Services Total PY 195.0 156.0 159.0 165.0 148.0 -11.0
Canteen Total PY 12.0 12.0 12.0 12.0 11.0 -1.0
Food Services Total PY 56.0 45.6 45.6 49.4 43.0 -2.6
Personnel Total PY 29.6 25.0 24.0 25.0 21.0 -3.0
Plant Operations Total PY 97.0 69.0 66.0 72.0 61.0 -5.0
Enterprise Information Systems (EIS) Total PY 6.0 6.0 6.0 5.0 5.0 -1.0
Education Total PY 61.0 56.0 56.0 61.0 54.0 -2.0
Vocation Total PY 14.0 16.0 16.0 17.0 15.0 -1.0
Dental Total PY 48.0 43.5 43.5 43.5 38.0 -5.5
Mental Health Total PY 53.1 92.5 92.5 109.5 120.0 27.5
Custody Subtotal 1,172.4 1,103.9 1,115.0 1,101.8 1,006.0 -109.0Non Custody Subtotal 395.6 313.6 312.6 328.4 289.0 -23.6Inmate Programs Subtotal 75.0 72.0 72.0 78.0 69.0 -3.0Health Care Subtotal 101.1 136.0 136.0 153.0 158.0 22.0
Institution Total 1,744.1 1,625.5 1,635.6 1,661.2 1,522.0 -113.6
53.0 1.0
* DOF Budgeted Authority – Refers to the positions for the Blueprint authorized by the Department of Finance (DOF). The numbers were obtained from DOF and differ slightly from the original numbers in the Blueprint due to minor adjustments of unallocated positions related to relief coverage and ratio positions.

Second Report on CDCR’s Progress Implementing the Blueprint Page 53 Office of the Inspector General State of California
APPENDIX A: STANDARDIZED STAFFING
CALIPATRIA STATE PRISON
Staffing Category Classification Staffing July 2011Standardized
Staffing Totals July 2013
* DOF Budget Authority Totals July
2013
Budgets V. 5.0 -Standardized Staffing
Totals July 2013
Staffing From MIRS Data as of 8/5/13
Difference Between Actual and Budgeted
as of 8/5/13
Management Warden 1.0 1.0 1.0 1.0 0.0 -1.0Chief Deputy 1.0 1.0 1.0 1.0 1.0 0.0Assoc. Warden 5.0 4.0 4.0 3.0 3.0 -1.0Captain 6.0 6.0 6.0 6.0 5.0 -1.0
Custody Lieutenant 30.1 27.8 27.7 28.2 27.0 -0.7Sergeant 66.0 71.6 72.4 71.2 68.0 -4.4Officer 628.3 619.9 625.9 610.2 552.0 -73.9
Correctional Counselor CCIII 1.0 1.0 1.0 1.0CCII 9.0 8.5 8.5 9.0CCI 26.0 20.0 21.0 24.0
Support Services Total PY 136.5 123.0 124.0 126.0 110.0 -14.0
Canteen Total PY 7.0 7.0 7.0 7.0 6.0 -1.0
Food Services Total PY 39.0 32.6 32.6 33.0 31.0 -1.6
Personnel Total PY 18.0 21.0 20.0 21.0 14.0 -6.0
Plant Operations Total PY 63.0 56.0 54.0 56.0 50.0 -4.0
Enterprise Information Systems (EIS) Total PY 5.0 5.0 4.0 4.0 4.0 0.0
Education Total PY 28.0 33.0 33.0 34.0 27.0 -6.0
Vocation Total PY 4.0 5.0 5.0 6.0 4.0 -1.0
Dental Total PY 37.0 34.0 34.0 34.0 32.0 -2.0
Mental Health Total PY 12.4 13.5 13.5 13.5 19.0 5.5
Custody Subtotal 773.4 760.8 768.5 754.6 687.0 -81.5Non Custody Subtotal 268.5 244.6 241.6 247.0 215.0 -26.6Inmate Programs Subtotal 32.0 38.0 38.0 40.0 31.0 -7.0Health Care Subtotal 49.4 47.5 47.5 47.5 51.0 3.5
Institution Total 1,123.3 1,090.9 1,095.6 1,089.1 984.0 -111.6
31.0 0.5
* DOF Budgeted Authority – Refers to the positions for the Blueprint authorized by the Department of Finance (DOF). The numbers were obtained from DOF and differ slightly from the original numbers in the Blueprint due to minor adjustments of unallocated positions related to relief coverage and ratio positions.

Second Report on CDCR’s Progress Implementing the Blueprint Page 54 Office of the Inspector General State of California
APPENDIX A: STANDARDIZED STAFFING
CENTINELA STATE PRISON
Staffing Category Classification Staffing July 2011Standardized
Staffing Totals July 2013
* DOF Budget Authority Totals July
2013
Budgets V. 5.0 -Standardized Staffing
Totals July 2013
Staffing From MIRS Data as of 8/5/13
Difference Between Actual and Budgeted
as of 8/5/13
Management Warden 1.0 1.0 1.0 1.0 0.0 -1.0Chief Deputy 1.0 1.0 1.0 1.0 1.0 0.0Assoc. Warden 5.0 4.0 4.0 3.0 3.0 -1.0Captain 6.0 6.0 6.0 6.0 5.0 -1.0
Custody Lieutenant 30.6 27.8 27.7 28.2 25.0 -2.7Sergeant 68.7 70.6 71.4 71.2 67.0 -4.4Officer 599.8 635.4 633.2 624.4 604.0 -29.2
Correctional Counselor CCIII 1.0 1.0 1.0 1.0CCII 9.0 8.5 8.5 9.0CCI 27.0 20.0 21.0 21.0
Support Services Total PY 136.5 122.0 123.0 120.0 109.0 -14.0
Canteen Total PY 7.0 7.0 7.0 7.0 7.0 0.0
Food Services Total PY 39.1 36.4 36.4 34.0 30.0 -6.4
Personnel Total PY 20.5 21.0 20.0 20.0 17.0 -3.0
Plant Operations Total PY 60.5 57.0 55.0 58.0 50.0 -5.0
Enterprise Information Systems (EIS) Total PY 6.0 6.0 5.0 5.0 5.0 0.0
Education Total PY 33.0 39.0 39.0 34.0 27.0 -12.0
Vocation Total PY 11.0 6.0 6.0 8.0 8.0 2.0
Dental Total PY 38.0 34.0 34.0 34.0 30.0 -4.0
Mental Health Total PY 13.1 12.5 12.5 12.5 15.0 2.5
Custody Subtotal 749.1 775.3 774.8 765.8 730.0 -44.8Non Custody Subtotal 274.1 249.4 246.4 244.0 218.0 -28.4Inmate Programs Subtotal 44.0 45.0 45.0 42.0 35.0 -10.0Health Care Subtotal 51.1 46.5 46.5 46.5 45.0 -1.5
Institution Total 1,118.3 1,116.2 1,112.7 1,098.3 1,028.0 -84.7
25.0 -5.5
* DOF Budgeted Authority – Refers to the positions for the Blueprint authorized by the Department of Finance (DOF). The numbers were obtained from DOF and differ slightly from the original numbers in the Blueprint due to minor adjustments of unallocated positions related to relief coverage and ratio positions.
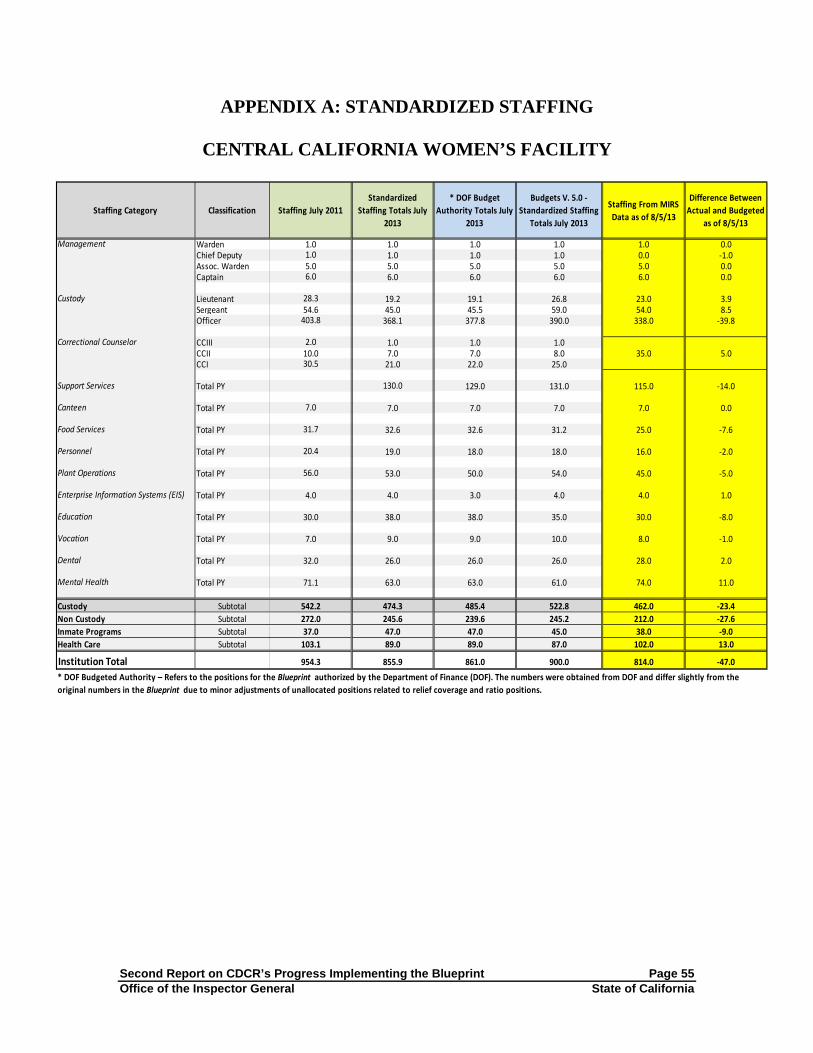
Second Report on CDCR’s Progress Implementing the Blueprint Page 55 Office of the Inspector General State of California
APPENDIX A: STANDARDIZED STAFFING
CENTRAL CALIFORNIA WOMEN’S FACILITY
Staffing Category Classification Staffing July 2011Standardized
Staffing Totals July 2013
* DOF Budget Authority Totals July
2013
Budgets V. 5.0 -Standardized Staffing
Totals July 2013
Staffing From MIRS Data as of 8/5/13
Difference Between Actual and Budgeted
as of 8/5/13
Management Warden 1.0 1.0 1.0 1.0 1.0 0.0Chief Deputy 1.0 1.0 1.0 1.0 0.0 -1.0Assoc. Warden 5.0 5.0 5.0 5.0 5.0 0.0Captain 6.0 6.0 6.0 6.0 6.0 0.0
Custody Lieutenant 28.3 19.2 19.1 26.8 23.0 3.9Sergeant 54.6 45.0 45.5 59.0 54.0 8.5Officer 403.8 368.1 377.8 390.0 338.0 -39.8
Correctional Counselor CCIII 2.0 1.0 1.0 1.0CCII 10.0 7.0 7.0 8.0CCI 30.5 21.0 22.0 25.0
Support Services Total PY 130.0 129.0 131.0 115.0 -14.0
Canteen Total PY 7.0 7.0 7.0 7.0 7.0 0.0
Food Services Total PY 31.7 32.6 32.6 31.2 25.0 -7.6
Personnel Total PY 20.4 19.0 18.0 18.0 16.0 -2.0
Plant Operations Total PY 56.0 53.0 50.0 54.0 45.0 -5.0
Enterprise Information Systems (EIS) Total PY 4.0 4.0 3.0 4.0 4.0 1.0
Education Total PY 30.0 38.0 38.0 35.0 30.0 -8.0
Vocation Total PY 7.0 9.0 9.0 10.0 8.0 -1.0
Dental Total PY 32.0 26.0 26.0 26.0 28.0 2.0
Mental Health Total PY 71.1 63.0 63.0 61.0 74.0 11.0
Custody Subtotal 542.2 474.3 485.4 522.8 462.0 -23.4Non Custody Subtotal 272.0 245.6 239.6 245.2 212.0 -27.6Inmate Programs Subtotal 37.0 47.0 47.0 45.0 38.0 -9.0Health Care Subtotal 103.1 89.0 89.0 87.0 102.0 13.0
Institution Total 954.3 855.9 861.0 900.0 814.0 -47.0
35.0 5.0
* DOF Budgeted Authority – Refers to the positions for the Blueprint authorized by the Department of Finance (DOF). The numbers were obtained from DOF and differ slightly from the original numbers in the Blueprint due to minor adjustments of unallocated positions related to relief coverage and ratio positions.
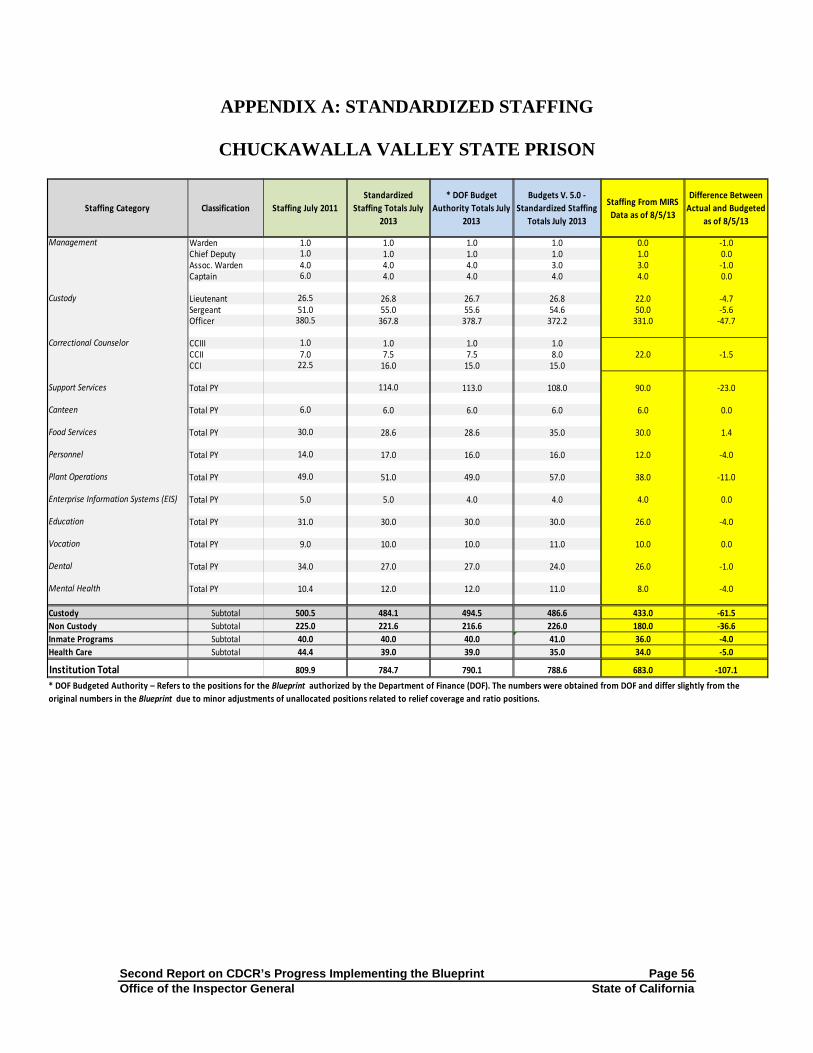
Second Report on CDCR’s Progress Implementing the Blueprint Page 56 Office of the Inspector General State of California
APPENDIX A: STANDARDIZED STAFFING
CHUCKAWALLA VALLEY STATE PRISON
Staffing Category Classification Staffing July 2011Standardized
Staffing Totals July 2013
* DOF Budget Authority Totals July
2013
Budgets V. 5.0 -Standardized Staffing
Totals July 2013
Staffing From MIRS Data as of 8/5/13
Difference Between Actual and Budgeted
as of 8/5/13
Management Warden 1.0 1.0 1.0 1.0 0.0 -1.0Chief Deputy 1.0 1.0 1.0 1.0 1.0 0.0Assoc. Warden 4.0 4.0 4.0 3.0 3.0 -1.0Captain 6.0 4.0 4.0 4.0 4.0 0.0
Custody Lieutenant 26.5 26.8 26.7 26.8 22.0 -4.7Sergeant 51.0 55.0 55.6 54.6 50.0 -5.6Officer 380.5 367.8 378.7 372.2 331.0 -47.7
Correctional Counselor CCIII 1.0 1.0 1.0 1.0CCII 7.0 7.5 7.5 8.0CCI 22.5 16.0 15.0 15.0
Support Services Total PY 114.0 113.0 108.0 90.0 -23.0
Canteen Total PY 6.0 6.0 6.0 6.0 6.0 0.0
Food Services Total PY 30.0 28.6 28.6 35.0 30.0 1.4
Personnel Total PY 14.0 17.0 16.0 16.0 12.0 -4.0
Plant Operations Total PY 49.0 51.0 49.0 57.0 38.0 -11.0
Enterprise Information Systems (EIS) Total PY 5.0 5.0 4.0 4.0 4.0 0.0
Education Total PY 31.0 30.0 30.0 30.0 26.0 -4.0
Vocation Total PY 9.0 10.0 10.0 11.0 10.0 0.0
Dental Total PY 34.0 27.0 27.0 24.0 26.0 -1.0
Mental Health Total PY 10.4 12.0 12.0 11.0 8.0 -4.0
Custody Subtotal 500.5 484.1 494.5 486.6 433.0 -61.5Non Custody Subtotal 225.0 221.6 216.6 226.0 180.0 -36.6Inmate Programs Subtotal 40.0 40.0 40.0 41.0 36.0 -4.0Health Care Subtotal 44.4 39.0 39.0 35.0 34.0 -5.0
Institution Total 809.9 784.7 790.1 788.6 683.0 -107.1
22.0 -1.5
* DOF Budgeted Authority – Refers to the positions for the Blueprint authorized by the Department of Finance (DOF). The numbers were obtained from DOF and differ slightly from the original numbers in the Blueprint due to minor adjustments of unallocated positions related to relief coverage and ratio positions.
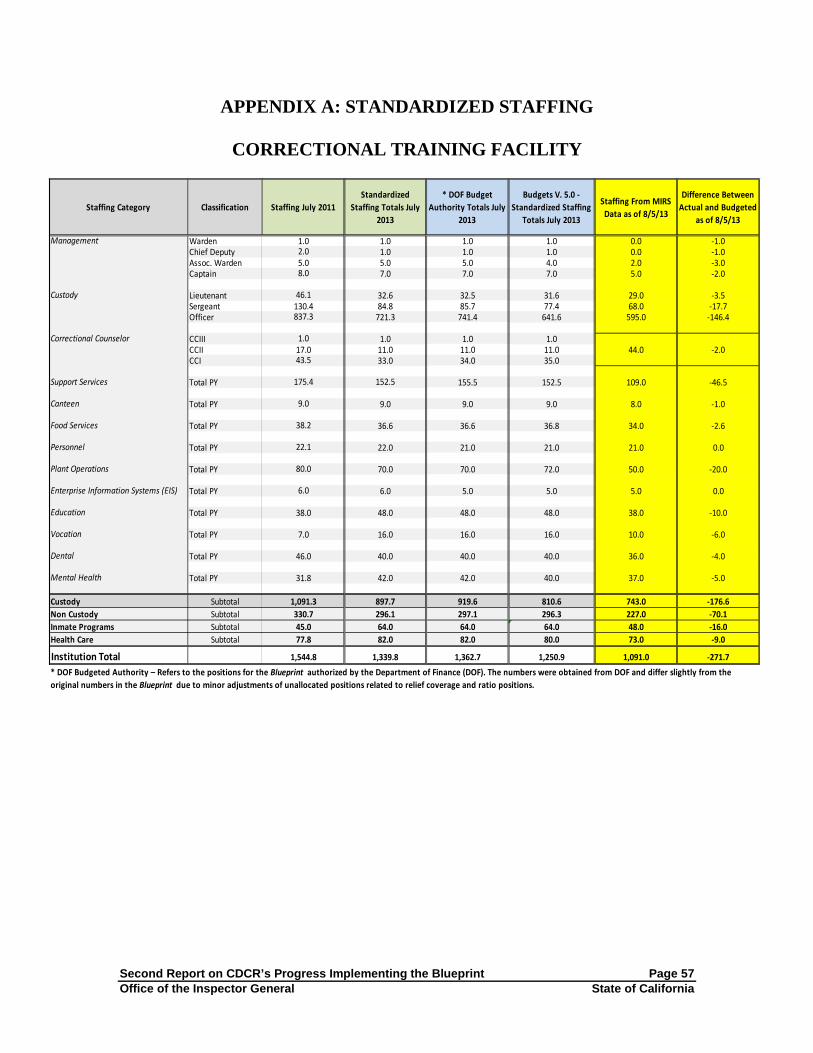
Second Report on CDCR’s Progress Implementing the Blueprint Page 57 Office of the Inspector General State of California
APPENDIX A: STANDARDIZED STAFFING
CORRECTIONAL TRAINING FACILITY
Staffing Category Classification Staffing July 2011Standardized
Staffing Totals July 2013
* DOF Budget Authority Totals July
2013
Budgets V. 5.0 -Standardized Staffing
Totals July 2013
Staffing From MIRS Data as of 8/5/13
Difference Between Actual and Budgeted
as of 8/5/13
Management Warden 1.0 1.0 1.0 1.0 0.0 -1.0Chief Deputy 2.0 1.0 1.0 1.0 0.0 -1.0Assoc. Warden 5.0 5.0 5.0 4.0 2.0 -3.0Captain 8.0 7.0 7.0 7.0 5.0 -2.0
Custody Lieutenant 46.1 32.6 32.5 31.6 29.0 -3.5Sergeant 130.4 84.8 85.7 77.4 68.0 -17.7Officer 837.3 721.3 741.4 641.6 595.0 -146.4
Correctional Counselor CCIII 1.0 1.0 1.0 1.0CCII 17.0 11.0 11.0 11.0CCI 43.5 33.0 34.0 35.0
Support Services Total PY 175.4 152.5 155.5 152.5 109.0 -46.5
Canteen Total PY 9.0 9.0 9.0 9.0 8.0 -1.0
Food Services Total PY 38.2 36.6 36.6 36.8 34.0 -2.6
Personnel Total PY 22.1 22.0 21.0 21.0 21.0 0.0
Plant Operations Total PY 80.0 70.0 70.0 72.0 50.0 -20.0
Enterprise Information Systems (EIS) Total PY 6.0 6.0 5.0 5.0 5.0 0.0
Education Total PY 38.0 48.0 48.0 48.0 38.0 -10.0
Vocation Total PY 7.0 16.0 16.0 16.0 10.0 -6.0
Dental Total PY 46.0 40.0 40.0 40.0 36.0 -4.0
Mental Health Total PY 31.8 42.0 42.0 40.0 37.0 -5.0
Custody Subtotal 1,091.3 897.7 919.6 810.6 743.0 -176.6Non Custody Subtotal 330.7 296.1 297.1 296.3 227.0 -70.1Inmate Programs Subtotal 45.0 64.0 64.0 64.0 48.0 -16.0Health Care Subtotal 77.8 82.0 82.0 80.0 73.0 -9.0
Institution Total 1,544.8 1,339.8 1,362.7 1,250.9 1,091.0 -271.7
44.0 -2.0
* DOF Budgeted Authority – Refers to the positions for the Blueprint authorized by the Department of Finance (DOF). The numbers were obtained from DOF and differ slightly from the original numbers in the Blueprint due to minor adjustments of unallocated positions related to relief coverage and ratio positions.

Second Report on CDCR’s Progress Implementing the Blueprint Page 58 Office of the Inspector General State of California
APPENDIX A: STANDARDIZED STAFFING
DEUEL VOCATIONAL INSTITUTION
Staffing Category Classification Staffing July 2011Standardized
Staffing Totals July 2013
* DOF Budget Authority Totals July
2013
Budgets V. 5.0 -Standardized Staffing
Totals July 2013
Staffing From MIRS Data as of 8/5/13
Difference Between Actual and Budgeted
as of 8/5/13
Management Warden 1.0 1.0 1.0 1.0 1.0 0.0Chief Deputy 1.0 1.0 1.0 1.0 1.0 0.0Assoc. Warden 5.0 5.0 5.0 5.0 5.0 0.0Captain 5.0 5.0 5.0 5.0 5.0 0.0
Custody Lieutenant 33.3 25.4 25.3 25.4 17.0 -8.3Sergeant 73.6 64.0 64.7 64.6 52.0 -12.7Officer 609.1 421.2 432.5 409.6 374.0 -58.5
Correctional Counselor CCIII 2.0 1.0 1.0 1.0CCII 12.0 8.0 8.0 7.0CCI 44.0 22.0 21.0 22.0
Support Services Total PY 170.5 130.5 130.0 129.5 106.0 -24.0
Canteen Total PY 5.0 5.0 5.0 5.0 0.0 -5.0
Food Services Total PY 26.0 31.4 31.4 29.2 24.0 -7.4
Personnel Total PY 20.9 18.0 17.0 18.0 13.0 -4.0
Plant Operations Total PY 63.0 63.0 63.0 61.0 42.0 -21.0
Enterprise Information Systems (EIS) Total PY 5.0 5.0 4.0 4.0 4.0 0.0
Education Total PY 18.0 24.0 24.0 24.0 16.0 -8.0
Vocation Total PY 0.0 5.0 5.0 5.0 4.0 -1.0
Dental Total PY 29.0 26.0 26.0 26.0 18.0 -8.0
Mental Health Total PY 61.1 46.7 46.7 42.0 39.0 -7.7
Custody Subtotal 786.0 553.6 564.5 541.6 483.0 -81.5Non Custody Subtotal 290.4 252.9 250.4 246.7 189.0 -61.4Inmate Programs Subtotal 18.0 29.0 29.0 29.0 20.0 -9.0Health Care Subtotal 90.1 72.7 72.7 68.0 57.0 -15.7
Institution Total 1,184.5 908.2 916.6 885.3 749.0 -167.6
28.0 -2.0
* DOF Budgeted Authority – Refers to the positions for the Blueprint authorized by the Department of Finance (DOF). The numbers were obtained from DOF and differ slightly from the original numbers in the Blueprint due to minor adjustments of unallocated positions related to relief coverage and ratio positions.
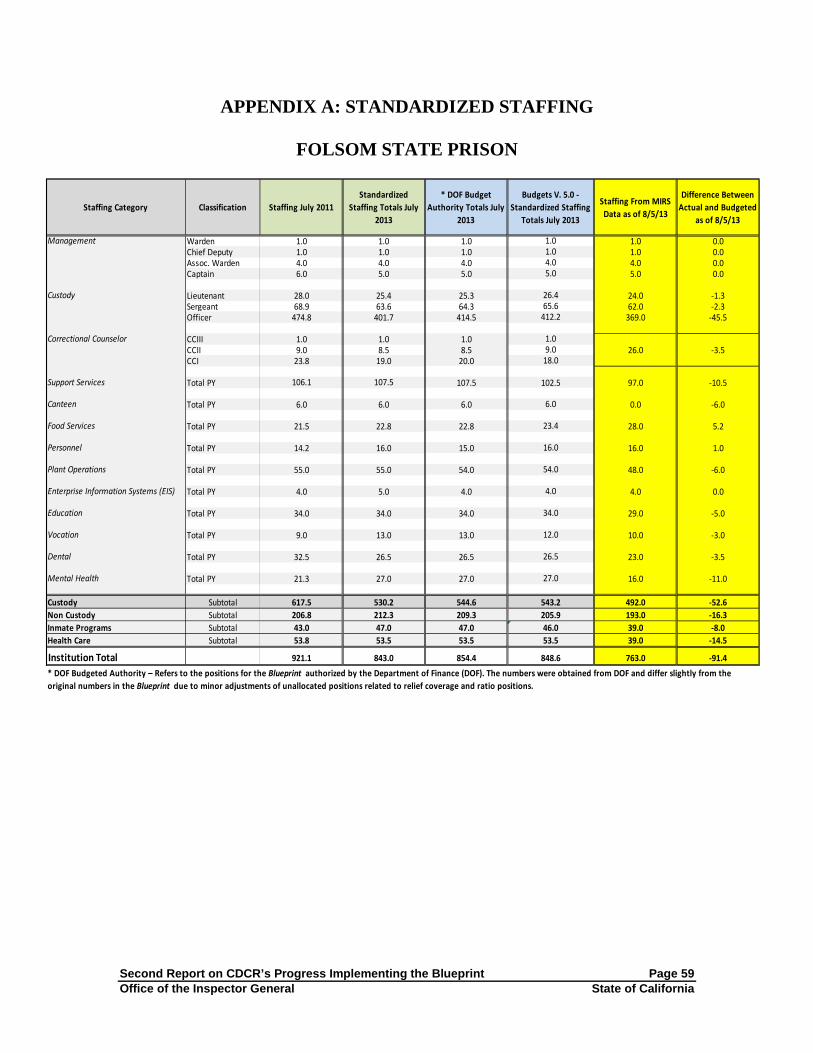
Second Report on CDCR’s Progress Implementing the Blueprint Page 59 Office of the Inspector General State of California
APPENDIX A: STANDARDIZED STAFFING
FOLSOM STATE PRISON
Staffing Category Classification Staffing July 2011Standardized
Staffing Totals July 2013
* DOF Budget Authority Totals July
2013
Budgets V. 5.0 -Standardized Staffing
Totals July 2013
Staffing From MIRS Data as of 8/5/13
Difference Between Actual and Budgeted
as of 8/5/13
Management Warden 1.0 1.0 1.0 1.0 1.0 0.0Chief Deputy 1.0 1.0 1.0 1.0 1.0 0.0Assoc. Warden 4.0 4.0 4.0 4.0 4.0 0.0Captain 6.0 5.0 5.0 5.0 5.0 0.0
Custody Lieutenant 28.0 25.4 25.3 26.4 24.0 -1.3Sergeant 68.9 63.6 64.3 65.6 62.0 -2.3Officer 474.8 401.7 414.5 412.2 369.0 -45.5
Correctional Counselor CCIII 1.0 1.0 1.0 1.0CCII 9.0 8.5 8.5 9.0CCI 23.8 19.0 20.0 18.0
Support Services Total PY 106.1 107.5 107.5 102.5 97.0 -10.5
Canteen Total PY 6.0 6.0 6.0 6.0 0.0 -6.0
Food Services Total PY 21.5 22.8 22.8 23.4 28.0 5.2
Personnel Total PY 14.2 16.0 15.0 16.0 16.0 1.0
Plant Operations Total PY 55.0 55.0 54.0 54.0 48.0 -6.0
Enterprise Information Systems (EIS) Total PY 4.0 5.0 4.0 4.0 4.0 0.0
Education Total PY 34.0 34.0 34.0 34.0 29.0 -5.0
Vocation Total PY 9.0 13.0 13.0 12.0 10.0 -3.0
Dental Total PY 32.5 26.5 26.5 26.5 23.0 -3.5
Mental Health Total PY 21.3 27.0 27.0 27.0 16.0 -11.0
Custody Subtotal 617.5 530.2 544.6 543.2 492.0 -52.6Non Custody Subtotal 206.8 212.3 209.3 205.9 193.0 -16.3Inmate Programs Subtotal 43.0 47.0 47.0 46.0 39.0 -8.0Health Care Subtotal 53.8 53.5 53.5 53.5 39.0 -14.5
Institution Total 921.1 843.0 854.4 848.6 763.0 -91.4
26.0 -3.5
* DOF Budgeted Authority – Refers to the positions for the Blueprint authorized by the Department of Finance (DOF). The numbers were obtained from DOF and differ slightly from the original numbers in the Blueprint due to minor adjustments of unallocated positions related to relief coverage and ratio positions.

Second Report on CDCR’s Progress Implementing the Blueprint Page 60 Office of the Inspector General State of California
APPENDIX A: STANDARDIZED STAFFING
FOLSOM WOMEN’S FACILITY
Staffing Category Classification Staffing July 2011Standardized
Staffing Totals July 2013
* DOF Budget Authority Totals July
2013
Budgets V. 5.0 -Standardized Staffing
Totals July 2013
Staffing From MIRS Data as of 8/5/13
Difference Between Actual and Budgeted
as of 8/5/13
Management Warden 0.0 0.0 0.0 0.0 0.0Chief Deputy 0.0 0.0 0.0 0.0 0.0Assoc. Warden 0.0 0.0 1.0 0.0 0.0Captain 1.0 1.0 0.0 0.0 -1.0
Custody Lieutenant 2.0 2.0 1.4 1.0 -1.0Sergeant 5.2 5.2 4.2 4.0 -1.2Officer 41.2 41.2 31.2 33.0 -8.2
Correctional Counselor CCIII 0.0 0.0 0.0CCII 0.0 1.0 1.0CCI 0.0 0.0 2.5
Support Services Total PY 9.0 9.0 0.0 0.0 -9.0
Canteen Total PY 1.0 1.0 1.0 0.0 -1.0
Food Services Total PY 3.0 3.0 4.8 0.0 -3.0
Personnel Total PY 1.0 1.0 1.0 0.0 -1.0
Plant Operations Total PY 3.0 3.0 5.0 0.0 -3.0
Enterprise Information Systems (EIS) Total PY 0.0 0.0 0.0 0.0 0.0
Education Total PY 1.0 1.0 2.0 0.0 -1.0
Vocation Total PY 1.0 1.0 1.0 0.0 -1.0
Dental Total PY 0.0 0.0 0.0 0.0 0.0
Mental Health Total PY 1.0 1.0 0.0 0.0 -1.0
Custody Subtotal 0.0 50.4 50.4 53.9 38.0 -12.4Non Custody Subtotal 0.0 17.0 17.0 22.8 0.0 -17.0Inmate Programs Subtotal 0.0 2.0 2.0 3.0 0.0 -2.0Health Care Subtotal 0.0 1.0 1.0 0.0 0.0 -1.0
Institution Total 0.0 70.4 70.4 79.7 38.0 -32.4
0.0 -1.0
* DOF Budgeted Authority – Refers to the positions for the Blueprint authorized by the Department of Finance (DOF). The numbers were obtained from DOF and differ slightly from the original numbers in the Blueprint due to minor adjustments of unallocated positions related to relief coverage and ratio positions.
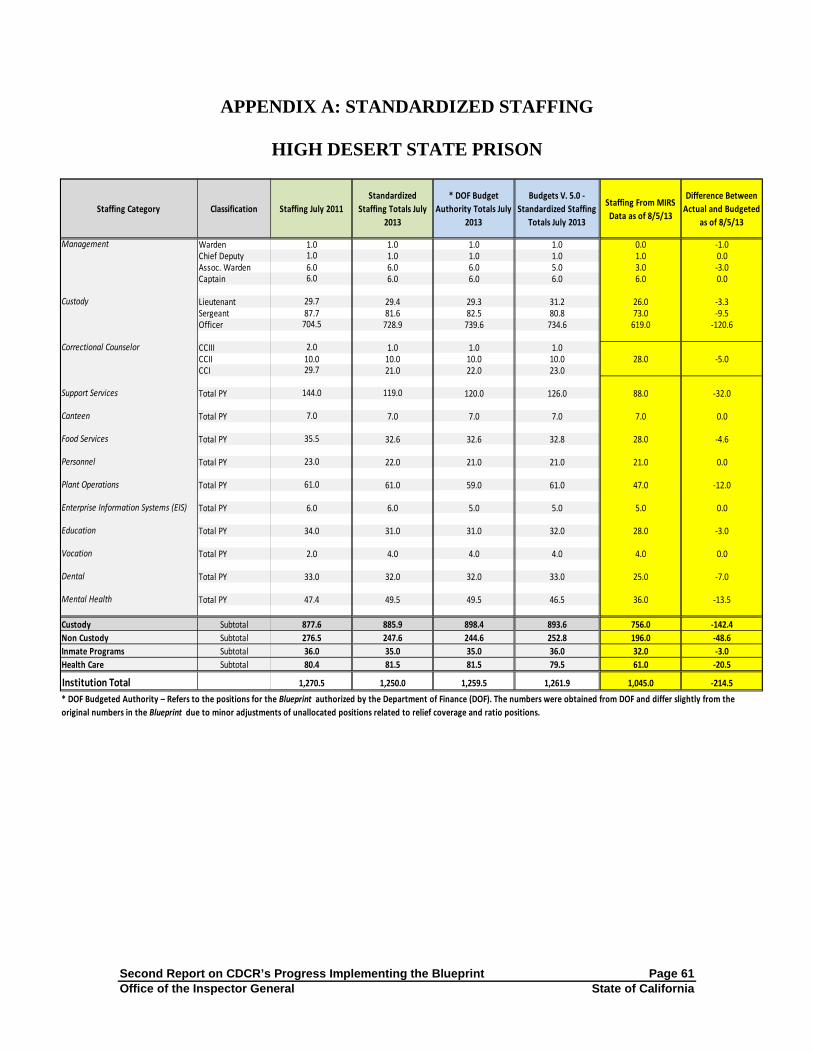
Second Report on CDCR’s Progress Implementing the Blueprint Page 61 Office of the Inspector General State of California
APPENDIX A: STANDARDIZED STAFFING
HIGH DESERT STATE PRISON
Staffing Category Classification Staffing July 2011Standardized
Staffing Totals July 2013
* DOF Budget Authority Totals July
2013
Budgets V. 5.0 -Standardized Staffing
Totals July 2013
Staffing From MIRS Data as of 8/5/13
Difference Between Actual and Budgeted
as of 8/5/13
Management Warden 1.0 1.0 1.0 1.0 0.0 -1.0Chief Deputy 1.0 1.0 1.0 1.0 1.0 0.0Assoc. Warden 6.0 6.0 6.0 5.0 3.0 -3.0Captain 6.0 6.0 6.0 6.0 6.0 0.0
Custody Lieutenant 29.7 29.4 29.3 31.2 26.0 -3.3Sergeant 87.7 81.6 82.5 80.8 73.0 -9.5Officer 704.5 728.9 739.6 734.6 619.0 -120.6
Correctional Counselor CCIII 2.0 1.0 1.0 1.0CCII 10.0 10.0 10.0 10.0CCI 29.7 21.0 22.0 23.0
Support Services Total PY 144.0 119.0 120.0 126.0 88.0 -32.0
Canteen Total PY 7.0 7.0 7.0 7.0 7.0 0.0
Food Services Total PY 35.5 32.6 32.6 32.8 28.0 -4.6
Personnel Total PY 23.0 22.0 21.0 21.0 21.0 0.0
Plant Operations Total PY 61.0 61.0 59.0 61.0 47.0 -12.0
Enterprise Information Systems (EIS) Total PY 6.0 6.0 5.0 5.0 5.0 0.0
Education Total PY 34.0 31.0 31.0 32.0 28.0 -3.0
Vocation Total PY 2.0 4.0 4.0 4.0 4.0 0.0
Dental Total PY 33.0 32.0 32.0 33.0 25.0 -7.0
Mental Health Total PY 47.4 49.5 49.5 46.5 36.0 -13.5
Custody Subtotal 877.6 885.9 898.4 893.6 756.0 -142.4Non Custody Subtotal 276.5 247.6 244.6 252.8 196.0 -48.6Inmate Programs Subtotal 36.0 35.0 35.0 36.0 32.0 -3.0Health Care Subtotal 80.4 81.5 81.5 79.5 61.0 -20.5
Institution Total 1,270.5 1,250.0 1,259.5 1,261.9 1,045.0 -214.5
28.0 -5.0
* DOF Budgeted Authority – Refers to the positions for the Blueprint authorized by the Department of Finance (DOF). The numbers were obtained from DOF and differ slightly from the original numbers in the Blueprint due to minor adjustments of unallocated positions related to relief coverage and ratio positions.

Second Report on CDCR’s Progress Implementing the Blueprint Page 62 Office of the Inspector General State of California
APPENDIX A: STANDARDIZED STAFFING
IRONWOOD STATE PRISON
Staffing Category Classification Staffing July 2011Standardized
Staffing Totals July 2013
* DOF Budget Authority Totals July
2013
Budgets V. 5.0 -Standardized Staffing
Totals July 2013
Staffing From MIRS Data as of 8/5/13
Difference Between Actual and Budgeted
as of 8/5/13
Management Warden 1.0 1.0 1.0 1.0 1.0 0.0Chief Deputy 1.0 1.0 1.0 1.0 1.0 0.0Assoc. Warden 5.0 4.0 4.0 3.0 3.0 -1.0Captain 6.0 6.0 6.0 6.0 6.0 0.0
Custody Lieutenant 29.0 27.8 27.7 27.8 24.0 -3.7Sergeant 68.9 68.8 69.6 67.4 65.0 -4.6Officer 613.5 609.1 606.1 583.2 550.0 -56.1
Correctional Counselor CCIII 1.0 1.0 1.0 1.0CCII 8.0 8.5 8.5 9.0CCI 23.8 20.0 21.0 20.0
Support Services Total PY 120.1 111.0 111.0 106.0 94.0 -17.0
Canteen Total PY 7.0 7.0 7.0 7.0 6.0 -1.0
Food Services Total PY 32.9 31.6 31.6 32.0 31.0 -0.6
Personnel Total PY 16.6 20.0 19.0 19.0 19.0 0.0
Plant Operations Total PY 52.0 48.0 45.0 49.0 40.0 -5.0
Enterprise Information Systems (EIS) Total PY 6.0 6.0 5.0 5.0 5.0 0.0
Education Total PY 33.0 34.0 34.0 33.0 26.0 -8.0
Vocation Total PY 11.0 5.0 5.0 6.0 10.0 5.0
Dental Total PY 38.0 32.0 32.0 32.0 28.0 -4.0
Mental Health Total PY 10.5 11.0 11.0 11.0 15.0 4.0
Custody Subtotal 757.2 747.2 745.9 719.4 676.0 -69.9Non Custody Subtotal 234.6 223.6 218.6 218.0 195.0 -23.6Inmate Programs Subtotal 44.0 39.0 39.0 39.0 36.0 -3.0Health Care Subtotal 48.5 43.0 43.0 43.0 43.0 0.0
Institution Total 1,084.3 1,052.8 1,046.5 1,019.4 950.0 -96.5
26.0 -4.5
* DOF Budgeted Authority – Refers to the positions for the Blueprint authorized by the Department of Finance (DOF). The numbers were obtained from DOF and differ slightly from the original numbers in the Blueprint due to minor adjustments of unallocated positions related to relief coverage and ratio positions.

Second Report on CDCR’s Progress Implementing the Blueprint Page 63 Office of the Inspector General State of California
APPENDIX A: STANDARDIZED STAFFING
KERN VALLEY STATE PRISON
Staffing Category Classification Staffing July 2011Standardized
Staffing Totals July 2013
* DOF Budget Authority Totals July
2013
Budgets V. 5.0 -Standardized Staffing
Totals July 2013
Staffing From MIRS Data as of 8/5/13
Difference Between Actual and Budgeted
as of 8/5/13
Management Warden 1.0 1.0 1.0 1.0 1.0 0.0Chief Deputy 1.0 1.0 1.0 1.0 1.0 0.0Assoc. Warden 6.0 7.0 7.0 7.0 5.0 -2.0Captain 6.0 6.0 6.0 6.0 6.0 0.0
Custody Lieutenant 31.3 31.8 31.7 32.2 29.0 -2.7Sergeant 84.7 89.0 90.0 93.6 87.0 -3.0Officer 914.0 822.5 835.8 843.0 798.0 -37.8
Correctional Counselor CCIII 1.0 1.0 1.0 1.0CCII 12.0 11.0 11.0 11.0CCI 30.5 22.0 23.0 29.0
Support Services Total PY 168.5 128.0 128.0 129.0 104.0 -24.0
Canteen Total PY 8.0 8.0 8.0 8.0 8.0 0.0
Food Services Total PY 56.2 36.4 36.4 43.8 36.0 -0.4
Personnel Total PY 29.0 23.0 22.0 22.0 21.0 -1.0
Plant Operations Total PY 72.7 62.0 60.0 60.0 54.0 -6.0
Enterprise Information Systems (EIS) Total PY 5.0 5.0 5.0 4.0 4.0 -1.0
Education Total PY 35.0 36.0 36.0 37.0 31.0 -5.0
Vocation Total PY 7.0 6.0 6.0 6.0 6.0 0.0
Dental Total PY 38.0 35.0 35.0 35.0 31.0 -4.0
Mental Health Total PY 41.1 58.5 58.5 65.5 62.0 3.5
Custody Subtotal 1,087.5 992.3 1,007.5 1,024.8 962.0 -45.5Non Custody Subtotal 339.4 262.4 259.4 266.8 227.0 -32.4Inmate Programs Subtotal 42.0 42.0 42.0 43.0 37.0 -5.0Health Care Subtotal 79.1 93.5 93.5 100.5 93.0 -0.5
Institution Total 1,548.0 1,390.2 1,402.4 1,435.1 1,319.0 -83.4
35.0 0.0
* DOF Budgeted Authority – Refers to the positions for the Blueprint authorized by the Department of Finance (DOF). The numbers were obtained from DOF and differ slightly from the original numbers in the Blueprint due to minor adjustments of unallocated positions related to relief coverage and ratio positions.

Second Report on CDCR’s Progress Implementing the Blueprint Page 64 Office of the Inspector General State of California
APPENDIX A: STANDARDIZED STAFFING
MULE CREEK STATE PRISON
Staffing Category Classification Staffing July 2011Standardized
Staffing Totals July 2013
* DOF Budget Authority Totals July
2013
Budgets V. 5.0 -Standardized Staffing
Totals July 2013
Staffing From MIRS Data as of 8/5/13
Difference Between Actual and Budgeted
as of 8/5/13
Management Warden 1.0 1.0 1.0 1.0 1.0 0.0Chief Deputy 1.0 1.0 1.0 1.0 1.0 0.0Assoc. Warden 4.0 4.0 4.0 4.0 4.0 0.0Captain 5.0 5.0 5.0 5.0 5.0 0.0
Custody Lieutenant 22.7 23.6 23.5 25.0 23.0 -0.5Sergeant 67.2 69.8 70.6 65.2 60.0 -10.6Officer 542.5 536.1 536.5 542.2 509.0 -27.5
Correctional Counselor CCIII 1.0 1.0 1.0 1.0CCII 12.0 7.5 7.5 8.0CCI 22.5 18.0 17.0 21.0
Support Services Total PY 109.2 109.0 108.0 113.0 97.0 -11.0
Canteen Total PY 7.0 7.0 7.0 7.0 7.0 0.0
Food Services Total PY 26.3 28.6 28.6 29.2 22.0 -6.6
Personnel Total PY 12.8 21.0 20.0 20.0 16.0 -4.0
Plant Operations Total PY 49.5 54.0 52.0 54.0 51.0 -1.0
Enterprise Information Systems (EIS) Total PY 6.0 6.0 5.0 5.0 5.0 0.0
Education Total PY 28.0 32.0 32.0 31.0 30.0 -2.0
Vocation Total PY 7.0 3.0 3.0 6.0 4.0 1.0
Dental Total PY 32.0 27.5 27.5 27.5 26.0 -1.5
Mental Health Total PY 76.2 106.5 106.5 114.5 114.0 7.5
Custody Subtotal 678.9 667.0 667.1 673.4 633.0 -34.1Non Custody Subtotal 210.8 225.6 220.6 228.2 198.0 -22.6Inmate Programs Subtotal 35.0 35.0 35.0 37.0 34.0 -1.0Health Care Subtotal 108.2 134.0 134.0 142.0 140.0 6.0
Institution Total 1,032.9 1,061.6 1,056.7 1,080.6 1,005.0 -51.7
30.0 4.5
* DOF Budgeted Authority – Refers to the positions for the Blueprint authorized by the Department of Finance (DOF). The numbers were obtained from DOF and differ slightly from the original numbers in the Blueprint due to minor adjustments of unallocated positions related to relief coverage and ratio positions.

Second Report on CDCR’s Progress Implementing the Blueprint Page 65 Office of the Inspector General State of California
APPENDIX A: STANDARDIZED STAFFING
NORTH KERN STATE PRISON
Staffing Category Classification Staffing July 2011Standardized
Staffing Totals July 2013
* DOF Budget Authority Totals July
2013
Budgets V. 5.0 -Standardized Staffing
Totals July 2013
Staffing From MIRS Data as of 8/5/13
Difference Between Actual and Budgeted
as of 8/5/13
Management Warden 1.0 1.0 1.0 1.0 1.0 0.0Chief Deputy 1.0 1.0 1.0 1.0 0.0 -1.0Assoc. Warden 6.0 6.0 6.0 6.0 6.0 0.0Captain 6.0 6.0 6.0 6.0 6.0 0.0
Custody Lieutenant 28.7 29.8 29.7 29.8 26.0 -3.7Sergeant 78.6 60.8 61.5 71.4 63.0 1.5Officer 722.7 626.2 639.2 631.8 592.0 -47.2
Correctional Counselor CCIII 2.0 1.0 1.0 1.0CCII 12.2 12.0 12.0 10.0CCI 61.4 44.0 45.0 45.0
Support Services Total PY 214.0 165.0 165.0 169.0 151.0 -14.0
Canteen Total PY 7.0 7.0 7.0 7.0 6.0 -1.0
Food Services Total PY 41.0 37.6 37.6 38.0 34.0 -3.6
Personnel Total PY 21.5 22.0 21.0 21.0 18.0 -3.0
Plant Operations Total PY 65.0 54.0 52.0 54.0 45.0 -7.0
Enterprise Information Systems (EIS) Total PY 5.0 5.0 4.0 4.0 4.0 0.0
Education Total PY 23.0 23.0 23.0 20.0 18.0 -5.0
Vocation Total PY 0.0 3.0 3.0 2.0 2.0 -1.0
Dental Total PY 40.0 35.5 35.5 36.5 31.0 -4.5
Mental Health Total PY 71.0 79.8 79.8 77.7 66.0 -13.8
Custody Subtotal 919.6 787.8 802.4 803.0 744.0 -58.4Non Custody Subtotal 353.5 290.6 286.6 293.0 258.0 -28.6Inmate Programs Subtotal 23.0 26.0 26.0 22.0 20.0 -6.0Health Care Subtotal 111.0 115.3 115.3 114.2 97.0 -18.3
Institution Total 1,407.1 1,219.7 1,230.3 1,232.2 1,119.0 -111.3
50.0 -8.0
* DOF Budgeted Authority – Refers to the positions for the Blueprint authorized by the Department of Finance (DOF). The numbers were obtained from DOF and differ slightly from the original numbers in the Blueprint due to minor adjustments of unallocated positions related to relief coverage and ratio positions.

Second Report on CDCR’s Progress Implementing the Blueprint Page 66 Office of the Inspector General State of California
APPENDIX A: STANDARDIZED STAFFING
PELICAN BAY STATE PRISON
Staffing Category Classification Staffing July 2011Standardized
Staffing Totals July 2013
* DOF Budget Authority Totals July
2013
Budgets V. 5.0 -Standardized Staffing
Totals July 2013
Staffing From MIRS Data as of 8/5/13
Difference Between Actual and Budgeted
as of 8/5/13
Management Warden 1.0 1.0 1.0 1.0 1.0 0.0Chief Deputy 1.0 1.0 1.0 1.0 0.0 -1.0Assoc. Warden 5.0 5.0 5.0 5.0 3.0 -2.0Captain 8.0 6.0 6.0 7.0 7.0 1.0
Custody Lieutenant 34.6 30.8 30.7 32.6 23.0 -7.7Sergeant 96.1 96.2 97.3 98.0 89.0 -8.3Officer 822.3 807.4 823.3 864.8 720.0 -103.3
Correctional Counselor CCIII 1.0 1.0 1.0 1.0CCII 17.0 13.5 13.5 14.5CCI 25.5 24.0 25.0 25.0
Support Services Total PY 106.0 116.0 116.4 116.0 103.0 -13.4
Canteen Total PY 6.0 6.0 6.0 6.0 5.0 -1.0
Food Services Total PY 36.0 36.4 36.4 35.8 29.0 -7.4
Personnel Total PY 23.4 23.0 22.0 22.0 18.0 -4.0
Plant Operations Total PY 56.0 66.0 64.0 64.0 55.0 -9.0
Enterprise Information Systems (EIS) Total PY 5.0 4.0 3.0 4.0 4.0 1.0
Education Total PY 21.0 20.0 20.0 22.0 20.0 0.0
Vocation Total PY 1.0 1.0 1.0 1.0 1.0 0.0
Dental Total PY 31.7 30.7 30.7 30.7 28.0 -2.7
Mental Health Total PY 72.6 72.0 72.0 73.0 76.0 4.0
Custody Subtotal 1,011.5 985.9 1,003.8 1,049.9 873.0 -130.8Non Custody Subtotal 232.4 251.4 247.8 247.8 214.0 -33.8Inmate Programs Subtotal 22.0 21.0 21.0 23.0 21.0 0.0Health Care Subtotal 104.3 102.7 102.7 103.7 104.0 1.3
Institution Total 1,370.2 1,361.0 1,375.3 1,424.4 1,212.0 -163.3
30.0 -9.5
* DOF Budgeted Authority – Refers to the positions for the Blueprint authorized by the Department of Finance (DOF). The numbers were obtained from DOF and differ slightly from the original numbers in the Blueprint due to minor adjustments of unallocated positions related to relief coverage and ratio positions.

Second Report on CDCR’s Progress Implementing the Blueprint Page 67 Office of the Inspector General State of California
APPENDIX A: STANDARDIZED STAFFING
PLEASANT VALLEY STATE PRISON
Staffing Category Classification Staffing July 2011Standardized
Staffing Totals July 2013
* DOF Budget Authority Totals July
2013
Budgets V. 5.0 -Standardized Staffing
Totals July 2013
Staffing From MIRS Data as of 8/5/13
Difference Between Actual and Budgeted
as of 8/5/13
Management Warden 1.0 1.0 1.0 1.0 1.0 0.0Chief Deputy 1.0 1.0 1.0 1.0 1.0 0.0Assoc. Warden 6.0 5.0 5.0 4.0 4.0 -1.0Captain 6.0 6.0 6.0 6.0 6.0 0.0
Custody Lieutenant 33.1 28.8 28.7 30.2 24.0 -4.7Sergeant 80.8 78.8 79.7 78.4 69.0 -10.7Officer 712.9 706.3 706.2 696.4 612.0 -94.2
Correctional Counselor CCIII 1.0 1.0 1.0 1.0CCII 10.0 9.0 9.0 9.0CCI 31.5 21.0 22.0 23.0
Support Services Total PY 144.0 122.0 123.0 122.0 107.0 -16.0
Canteen Total PY 6.0 6.0 6.0 6.0 5.0 -1.0
Food Services Total PY 38.2 32.6 32.6 33.0 27.0 -5.6
Personnel Total PY 20.7 22.0 21.0 21.0 15.0 -6.0
Plant Operations Total PY 74.9 61.0 59.0 63.0 53.0 -6.0
Enterprise Information Systems (EIS) Total PY 4.0 5.0 4.0 4.0 4.0 0.0
Education Total PY 33.0 37.0 37.0 38.0 29.0 -8.0
Vocation Total PY 11.0 5.0 5.0 8.0 7.0 2.0
Dental Total PY 41.0 33.0 33.0 33.0 26.0 -7.0
Mental Health Total PY 46.0 64.5 64.5 63.5 50.0 -14.5
Custody Subtotal 883.3 857.9 859.6 850.0 745.0 -114.6Non Custody Subtotal 287.8 248.6 245.6 249.0 211.0 -34.6Inmate Programs Subtotal 44.0 42.0 42.0 46.0 36.0 -6.0Health Care Subtotal 87.0 97.5 97.5 96.5 76.0 -21.5
Institution Total 1,302.1 1,246.0 1,244.7 1,241.5 1,068.0 -176.7
28.0 -4.0
* DOF Budgeted Authority – Refers to the positions for the Blueprint authorized by the Department of Finance (DOF). The numbers were obtained from DOF and differ slightly from the original numbers in the Blueprint due to minor adjustments of unallocated positions related to relief coverage and ratio positions.

Second Report on CDCR’s Progress Implementing the Blueprint Page 68 Office of the Inspector General State of California
APPENDIX A: STANDARDIZED STAFFING
RICHARD J. DONOVAN CORRECTIONAL FACILITY
Staffing Category Classification Staffing July 2011Standardized
Staffing Totals July 2013
* DOF Budget Authority Totals July
2013
Budgets V. 5.0 -Standardized Staffing
Totals July 2013
Staffing From MIRS Data as of 8/5/13
Difference Between Actual and Budgeted
as of 8/5/13
Management Warden 1.0 1.0 1.0 1.0 1.0 0.0Chief Deputy 1.0 1.0 1.0 1.0 0.0 -1.0Assoc. Warden 6.0 5.0 5.0 5.0 5.0 0.0Captain 6.0 6.0 6.0 6.0 5.0 -1.0
Custody Lieutenant 32.1 27.8 27.7 28.2 26.0 -1.7Sergeant 84.3 78.8 79.7 80.8 73.0 -6.7Officer 749.4 682.5 684.2 703.2 655.0 -29.2
Correctional Counselor CCIII 2.0 1.0 1.0 1.0CCII 12.1 10.0 10.0 10.0CCI 44.5 25.0 26.0 24.0
Support Services Total PY 179.4 119.5 120.5 120.5 89.0 -31.5
Canteen Total PY 7.0 7.0 7.0 7.0 5.0 -2.0
Food Services Total PY 34.8 35.4 35.4 33.0 26.0 -9.4
Personnel Total PY 20.0 22.0 21.0 22.0 17.0 -4.0
Plant Operations Total PY 54.0 57.0 55.0 57.0 38.0 -17.0
Enterprise Information Systems (EIS) Total PY 6.0 6.0 5.0 5.0 5.0 0.0
Education Total PY 32.5 31.0 31.0 29.0 25.0 -6.0
Vocation Total PY 3.0 7.0 7.0 8.0 4.0 -3.0
Dental Total PY 36.0 34.0 34.0 34.0 35.0 1.0
Mental Health Total PY 114.5 138.1 138.1 137.1 172.0 33.9
Custody Subtotal 938.4 838.1 841.6 860.2 798.0 -43.6Non Custody Subtotal 301.2 246.9 243.9 244.5 180.0 -63.9Inmate Programs Subtotal 35.5 38.0 38.0 37.0 29.0 -9.0Health Care Subtotal 150.5 172.1 172.1 171.1 207.0 34.9
Institution Total 1,425.6 1,295.1 1,295.6 1,312.8 1,214.0 -81.6
33.0 -4.0
* DOF Budgeted Authority – Refers to the positions for the Blueprint authorized by the Department of Finance (DOF). The numbers were obtained from DOF and differ slightly from the original numbers in the Blueprint due to minor adjustments of unallocated positions related to relief coverage and ratio positions.

Second Report on CDCR’s Progress Implementing the Blueprint Page 69 Office of the Inspector General State of California
APPENDIX A: STANDARDIZED STAFFING
SALINAS VALLEY STATE PRISON
Staffing Category Classification * Staffing July 2011Standardized
Staffing Totals July 2013
** DOF Budget Authority Totals July
2013
Budgets V. 5.0 -Standardized Staffing
Totals July 2013
Staffing From MIRS Data as of 8/5/13
Difference Between Actual and Budgeted
as of 8/5/13
Management Warden 1.0 1.0 1.0 1.0 1.0 0.0Chief Deputy 1.0 1.0 1.0 1.0 1.0 0.0Assoc. Warden 6.0 6.0 6.0 6.0 5.0 -1.0Captain 6.0 6.0 6.0 6.0 3.0 -3.0
Custody Lieutenant 28.7 29.8 29.7 31.2 28.0 -1.7Sergeant 99.2 93.0 94.0 94.2 84.0 -10.0Officer 813.6 798.1 810.6 808.6 751.0 -59.6
Correctional Counselor CCIII 1.0 1.0 1.0 1.0CCII 11.0 11.0 11.0 12.0CCI 30.5 27.0 28.0 27.0
Support Services Total PY 120.1 120.5 121.5 116.5 103.0 -18.5
Canteen Total PY 7.0 7.0 7.0 7.0 7.0 0.0
Food Services Total PY 44.4 38.6 38.6 39.0 33.0 -5.6
Personnel Total PY 21.5 23.0 22.0 22.0 18.0 -4.0
Plant Operations Total PY 68.0 58.0 56.0 61.0 49.0 -7.0
Enterprise Information Systems (EIS) Total PY 5.0 5.0 4.0 4.0 4.0 0.0
Education Total PY 32.0 25.0 25.0 25.0 25.0 0.0
Vocation Total PY 0.0 1.0 1.0 1.0 1.0 0.0
Dental Total PY 36.0 33.0 33.0 33.0 32.0 -1.0
Mental Health Total PY 78.7 85.5 85.5 80.5 92.0 6.5
Custody Subtotal 998.0 973.9 988.3 988.0 905.0 -83.3Non Custody Subtotal 266.0 252.1 249.1 249.5 214.0 -35.1Inmate Programs Subtotal 32.0 26.0 26.0 26.0 26.0 0.0Health Care Subtotal 114.7 118.5 118.5 113.5 124.0 5.5
Institution Total 1,410.7 1,370.5 1,381.9 1,377.0 1,269.0 -112.9
32.0 -8.0
* The total for the July 2011 staffing does not match the number displayed in the Blueprint (1,410.8) due to a rounding error in the Blueprint calculations.
** DOF Budgeted Authority – Refers to the positions for the Blueprint authorized by the Department of Finance (DOF). The numbers were obtained from DOF and differ slightly from the original numbers in the Blueprint due to minor adjustments of unallocated positions related to relief coverage and ratio positions.

Second Report on CDCR’s Progress Implementing the Blueprint Page 70 Office of the Inspector General State of California
APPENDIX A: STANDARDIZED STAFFING
SIERRA CONSERVATION CENTER
Staffing Category Classification Staffing July 2011Standardized
Staffing Totals July 2013
* DOF Budget Authority Totals July
2013
Budgets V. 5.0 -Standardized Staffing
Totals July 2013
Staffing From MIRS Data as of 8/5/13
Difference Between Actual and Budgeted
as of 8/5/13
Management Warden 1.0 1.0 1.0 1.0 1.0 0.0Chief Deputy 1.0 1.0 1.0 1.0 1.0 0.0Assoc. Warden 5.0 5.0 5.0 4.0 2.0 -3.0Captain 7.0 6.0 6.0 5.0 5.0 -1.0
Custody Lieutenant 46.0 44.0 43.9 37.0 40.0 -3.9Sergeant 72.7 82.0 82.9 68.6 75.0 -7.9Officer 519.5 500.3 508.3 461.6 447.0 -61.3
Correctional Counselor CCIII 1.0 1.0 1.0 1.0CCII 8.0 7.5 7.5 9.0CCI 32.5 22.0 23.0 27.0
Support Services Total PY 130.4 129.0 131.0 123.5 103.0 -28.0Support Services (Camps) Total PY 7.0 8.0 8.0 12.0 13.0 5.0
Canteen Total PY 6.0 6.0 6.0 6.0 6.0 0.0Canteen (Camps) Total PY 1.0 1.0 1.0 1.0 0.0 -1.0
Food Services Total PY 25.0 24.8 24.8 25.4 22.0 -2.8Food Services (Camps) Total PY 2.0 3.0 3.0 3.0 0.0 -3.0
Personnel Total PY 18.7 19.0 18.0 18.0 13.0 -5.0
Plant Operations Total PY 48.0 56.0 56.0 56.0 42.0 -14.0Plant Operations (Camps) Total PY 5.0 3.0 3.0 3.0 0.0 -3.0
Enterprise Information Systems (EIS) Total PY 5.0 5.0 4.0 4.0 4.0 0.0
Education Total PY 30.0 36.0 36.0 35.0 26.0 -10.0
Vocation Total PY 7.0 11.0 11.0 11.0 8.0 -3.0
Dental Total PY 39.0 33.0 33.0 32.0 30.0 -3.0
Mental Health Total PY 23.8 26.0 26.0 24.0 19.0 -7.0
Custody Subtotal 693.7 669.8 679.6 615.2 607.0 -72.6Non Custody Subtotal 248.1 254.8 254.8 251.9 203.0 -51.8Inmate Programs Subtotal 37.0 47.0 47.0 46.0 34.0 -13.0Health Care Subtotal 62.8 59.0 59.0 56.0 49.0 -10.0
Institution Total 1,041.6 1,030.6 1,040.4 969.1 893.0 -147.4
36.0 4.5
* DOF Budgeted Authority – Refers to the positions for the Blueprint authorized by the Department of Finance (DOF). The numbers were obtained from DOF and differ slightly from the original numbers in the Blueprint due to minor adjustments of unallocated positions related to relief coverage and ratio positions.

Second Report on CDCR’s Progress Implementing the Blueprint Page 71 Office of the Inspector General State of California
APPENDIX A: STANDARDIZED STAFFING
VALLEY STATE PRISON
Staffing Category Classification Staffing July 2011Standardized
Staffing Totals July 2013
* DOF Budget Authority Totals July
2013
Budgets V. 5.0 -Standardized Staffing
Totals July 2013
Staffing From MIRS Data as of 8/5/13
Difference Between Actual and Budgeted
as of 8/5/13
Management Warden 1.0 1.0 1.0 1.0 1.0 0.0Chief Deputy 1.0 1.0 1.0 1.0 1.0 0.0Assoc. Warden 5.0 5.0 5.0 4.0 2.0 -3.0Captain 6.0 4.0 4.0 4.0 4.0 0.0
Custody Lieutenant 26.4 19.2 19.1 26.8 25.0 5.9Sergeant 59.8 49.8 50.4 59.4 51.0 0.6Officer 409.6 437.0 448.7 395.2 368.0 -80.7
Correctional Counselor CCIII 2.0 1.0 1.0 1.0CCII 9.0 7.0 7.0 8.0CCI 24.5 18.0 18.0 12.0
Support Services Total PY 116.6 108.0 107.0 99.0 80.0 -27.0
Canteen Total PY 6.0 6.0 6.0 6.0 6.0 0.0
Food Services Total PY 25.9 32.6 32.6 29.2 21.0 -11.6
Personnel Total PY 15.9 18.0 17.0 17.0 13.0 -4.0
Plant Operations Total PY 45.0 56.0 52.0 50.0 38.0 -14.0
Enterprise Information Systems (EIS) Total PY 5.0 5.0 4.0 4.0 4.0 0.0
Education Total PY 26.0 35.0 35.0 34.0 26.0 -9.0
Vocation Total PY 7.0 16.0 16.0 17.0 7.0 -9.0
Dental Total PY 31.5 27.0 27.0 27.0 25.0 -2.0
Mental Health Total PY 59.7 42.5 42.5 40.5 38.0 -4.5
Custody Subtotal 544.3 543.0 555.2 512.4 472.0 -83.2Non Custody Subtotal 214.4 225.6 218.6 205.2 162.0 -56.6Inmate Programs Subtotal 33.0 51.0 51.0 51.0 33.0 -18.0Health Care Subtotal 91.2 69.5 69.5 67.5 63.0 -6.5
Institution Total 882.9 889.1 894.3 836.1 730.0 -164.3
20.0 -6.0
* DOF Budgeted Authority – Refers to the positions for the Blueprint authorized by the Department of Finance (DOF). The numbers were obtained from DOF and differ slightly from the original numbers in the Blueprint due to minor adjustments of unallocated positions related to relief coverage and ratio positions.

Second Report on CDCR’s Progress Implementing the Blueprint Page 72 Office of the Inspector General State of California
APPENDIX A: STANDARDIZED STAFFING
WASCO STATE PRISON
Staffing Category Classification Staffing July 2011Standardized
Staffing Totals July 2013
* DOF Budget Authority Totals July
2013
Budgets V. 5.0 -Standardized Staffing
Totals July 2013
Staffing From MIRS Data as of 8/5/13
Difference Between Actual and Budgeted
as of 8/5/13
Management Warden 1.0 1.0 1.0 1.0 1.0 0.0Chief Deputy 1.0 1.0 1.0 1.0 1.0 0.0Assoc. Warden 6.0 6.0 6.0 6.0 6.0 0.0Captain 6.0 6.0 6.0 6.0 5.0 -1.0
Custody Lieutenant 35.5 33.6 33.5 32.2 30.0 -3.5Sergeant 77.5 81.4 82.3 78.6 68.0 -14.3Officer 780.7 702.7 718.0 694.0 638.0 -80.0
Correctional Counselor CCIII 2.0 1.0 1.0 1.0CCII 13.2 14.0 14.0 11.0CCI 66.5 49.0 50.0 51.0
Support Services Total PY 229.4 172.0 174.0 182.0 151.0 -23.0
Canteen Total PY 8.0 8.0 8.0 8.0 5.0 -3.0
Food Services Total PY 50.8 50.8 50.8 43.0 31.0 -19.8
Personnel Total PY 30.1 23.0 22.0 22.0 18.0 -4.0
Plant Operations Total PY 74.0 60.0 58.0 61.0 50.0 -8.0
Enterprise Information Systems (EIS) Total PY 5.0 5.0 4.0 4.0 4.0 0.0
Education Total PY 20.0 21.0 21.0 22.0 17.0 -4.0
Vocation Total PY 0.0 3.0 3.0 3.0 2.0 -1.0
Dental Total PY 41.0 37.5 37.5 38.5 34.0 -3.5
Mental Health Total PY 77.7 74.0 74.0 69.0 58.0 -16.0
Custody Subtotal 989.4 895.7 912.8 881.8 811.0 -101.8Non Custody Subtotal 397.3 318.8 316.8 320.0 259.0 -57.8Inmate Programs Subtotal 20.0 24.0 24.0 25.0 19.0 -5.0Health Care Subtotal 118.7 111.5 111.5 107.5 92.0 -19.5
Institution Total 1,525.4 1,350.0 1,365.1 1,334.3 1,181.0 -184.1
62.0 -3.0
* DOF Budgeted Authority – Refers to the positions for the Blueprint authorized by the Department of Finance (DOF). The numbers were obtained from DOF and differ slightly from the original numbers in the Blueprint due to minor adjustments of unallocated positions related to relief coverage and ratio positions.

Second Report on CDCR’s Progress Implementing the Blueprint Page 73 Office of the Inspector General State of California
APPENDIX B – HOUSING PLANS
The following pages display the information we summarized after reviewing data and documents to assess whether the department is housing inmates consistent with the housing plans identified in the Blueprint. The first page of Appendix B displays a summary of a comparison of actual population data against the design capacity beds identified for each prison in the Blueprint.35 The data is summarized by different housing types. This comparison was performed to assess whether the actual housing of inmates is consistent with the level and types of housing identified in the Blueprint. The data show that in each of the major categories, the department is consistently surpassing the inmate housing levels for each individual housing type identified in the Blueprint, as the overcrowding rate is over 100 percent in each major category. There are only a few housing categories that show a housing rate less than 100 percent, and those categories are for special types of housing, such as, beds for condemned inmates, hospice beds, or mental health crisis beds.36 The subsequent pages of Appendix B display data in summary format by institution totals and then unit total for each institution and then in detail format for each institution. We compared the individual Blueprint housing plans for each institution at the unit level against “positive shift count” reports obtained at each institution. These reports allowed a snapshot view of the inmate population for each housing unit in operation. The initial summary pages and the individual pages for each institution compare the design capacity against the actual inmate population on the day of the site visit. The fieldwork time frame for the data collected commenced in July 2013 and concluded in August 2013. The capacity data that were identified in the Blueprint are color-coded in green while the data from the “positive shift count” reports and the calculations we derived from the data are color-coded in yellow. While most of the units identified in the Blueprint were matched against data in the population count reports, in some cases, there were no data that matched the unit name. In other cases, there were additional units we added to the housing plans that were not identified in the Blueprint. In summary, our assessment found that the actual housing of inmates is substantially consistent with the housing plans identified in the Blueprint. Our assessment did find a few housing units that are at least temporarily closed. Within each institution’s respective housing plan identified in Appendix B, the housing count is identified as zero for those units that are closed.
35 The electronic population data is effective July 31, 2013, and was provided by CDCR. 36 Some of the beds identified in Appendix B are for very temporary housing. However, we identified them since they are identified in the Blueprint.

Second Report on CDCR’s Progress Implementing the Blueprint Page 74 Office of the Inspector General State of California
CDCR Inmate Population Summary Per Housing Type
Male Prisons
General Population (GP) /A
GP LevelBlueprint
Design Beds Population /B DifferenceOvercrowding
RateLevel I 7,664 6,821 -843 89%Level II 15,254 27,269 12,015 179%Level III 10,934 10,691 -243 98%Level IV 8,228 11,959 3,731 145%GP, Level Unknown 861 861Subtotal, General Population 42,080 57,601 15,521 137%
Special Needs Yards (SNY) /A
SNY LevelBlueprint
Design Beds Population /B DifferenceOvercrowding
RateLevel I 619 1,461 842 236%Level II 7,654 16,165 8,511 211%Level III 5,650 8,313 2,663 147%Level IV 4,896 7,656 2,760 156%SNY, Level Unknown 203 203Subtotal, Special Needs Yards 18,819 33,798 14,979 180%
Miscellaneous Housing Types - Various Prison or Off-Site Locations
Housing TypeBlueprint
Design Beds Population /B DifferenceOvercrowding
RateAdministrative Segregation Unit 5,601 6,614 1,013 118%Fire Camps /C 3,924 3,715 -209 95%Reception Center 4,972 10,821 5,849 218%Segregated Housing Unit 2,934 3,623 689 123%Subtotal, Various Housing Types 17,431 24,773 7,342 142%
Miscellaneous Housing Types-Limited Prison Locations
Housing TypeBlueprint
Design Beds Population /B DifferenceOvercrowding
RateAcute Care 150 221 71 147%CHCF CTC Medical High Acuity 420 0 -420 0%CHCF OHU Medical Low Acuity 590 0 -590 0%Condemned 684 684 0 100%General Acute Care Hospital 29 122 93 421%Hospice 17 12 -5 71%Integrated Housing Unit 200 377 177 189%Intermediate Care Facility 879 576 -303 66%Mental Health Crisis Beds 282 76 -206 27%Protective Housing Unit 20 14 -6 70%Psychiatric Services Unit 512 360 -152 70%Subtotal, Limited Housing Types 3,783 2,442 -1,341 65%
Subtotal, Male Prisons and Camps 82,113 118,614 36,501 144%
Female Prisons
Housing TypesBlueprint
Design Beds Population /B DifferenceOvercrowding
RateAcute Care 45 41 -4 91%Administrative Segregation Unit 83 104 21 125%Condemned 17 15 -2 88%Fire Camps /C 320 258 -62 81%General Population 2,904 4,696 1,792 162%Psychiatric Services Unit 23 18 -5 78%Reception Center 356 683 327 192%Segregated Housing Unit 60 102 42 170%Subtotal, Female Prisons and Camps 3,808 5,917 2,109 155%
Blueprint Design Beds Population /B Difference
Overcrowding Rate
Totals, CDCR Prisons-Inmate Population 85,921 124,531 38,610 145%
/A - The data for the GP and SNY tables include Enhanced Outpatient Program (EOP) inmate design beds and population./B - The inmate population is based on July 31, 2013 data from the CDCR Office of Research./C - The fire camp capacities are higher than Blueprint levels due to approved budget proposal.
APPENDIX B: HOUSING PLANS

Second Report on CDCR’s Progress Implementing the Blueprint Page 75 Office of the Inspector General State of California
APPENDIX B: HOUSING PLANS
INSTITUTION * DESIGN CAPACITY
* STAFFED CAPACITY
TOTAL INMATE COUNTS REVIEWED BY OIG (JUL 2013 -
JUN 2013)
OVERCROWDING RATE ON REVIEW DATE
(BASED ON DESIGN CAPACITY)
Avenal State Prison 2,920 4,350 4,435 152%California Correctional Center 3,875 4,708 4,916 127%
California Correctional Institution 2,783 3,870 4,607 166%California Health Care Facility 1,722 1,722 158 9%California Institution for Men 2,944 4,130 4,796 163%
California Institution for Women 1,401 1,848 2,160 154%California Medical Facility 2,412 2,871 2,338 97%California Men's Colony 3,888 4,490 4,919 127%
California Rehabilitation Center 2,431 3,643 3,509 144%California State Prison, Corcoran 3,116 4,136 4,278 137%
California State Prison, Los Angeles County 2,300 3,250 3,649 159%California State Prison, Sacramento 1,828 2,362 2,249 123%California State Prison, San Quentin 3,081 4,062 4,254 138%
California State Prison, Solano 2,610 3,890 3,900 149%California Substance Abuse Treatment Facility 3,424 4,910 5,648 165%
Calipatria State Prison 2,308 3,308 3,637 158%Centinela State Prison 2,308 3,308 2,904 126%
Central California Women's Facility 2,004 2,972 3,497 175%Chuchawalla Valley State Prison 1,738 2,478 2,602 150%
Correctional Training Facility 3,312 4,899 5,264 159%Deuel Vocational Institution 1,673 2,333 2,772 166%
Folsom State Prison 2,064 2,898 2,752 133%Folsom Women's Facility 403 403 239 59%High Desert State Prison 2,324 3,329 3,270 141%
Ironwood State Prison 2,200 3,175 3,181 145%Kern Valley State Prison 2,448 3,506 3,717 152%Mule Creek State Prison 1,700 2,400 2,899 171%North Kern State Prison 2,694 3,911 4,712 175%Pelican Bay State Prison 2,380 3,041 2,824 119%
Pleasant Valley State Prison 2,308 3,308 3,451 150%Richard J. Donavon Correctional Facility 2,200 3,138 3,325 151%
Salinas Valley State Prison 2,452 3,361 3,511 143%Sierra Conservation Center 3,706 4,544 4,866 131%
Valley State Prison 1,980 2,948 3,136 158%Wasco State Prison 2,984 4,351 5,063 170%
85,921 117,853 123,438 144%
* Capacity totals per site may not match Blueprint numbers due to incorrect formulas or a lack of rounding in the Blueprint numbers.
GRAND TOTAL
HOUSING PLAN - STATEWIDE SUMMARY

Second Report on CDCR’s Progress Implementing the Blueprint Page 76 Office of the Inspector General State of California
APPENDIX B: HOUSING PLANS
INSTITUTION Housing Unit Count Per Blueprint
Housing Units - VACANT
Housing Units - IN USE
Percent Of Housing Units In Use
Avenal State Prison 24 24 100.0%California Correctional Center 32 32 100.0%
California Correctional Institution 37 37 100.0%California Health Care Facility 24 20 4 16.7%California Institution for Men 30 30 100.0%
California Institution for Women 21 21 100.0%California Medical Facility 37 3 34 91.9%California Men's Colony 19 19 100.0%
California Rehabilitation Center 51 5 46 90.2%California State Prison, Corcoran 41 2 39 95.1%
California State Prison, Los Angeles County 23 23 100.0%California State Prison, Sacramento 27 27 100.0%California State Prison, San Quentin 29 29 100.0%
California State Prison, Solano 24 24 100.0%California Substance Abuse Treatment Facility 31 31 100.0%
Calipatria State Prison 24 24 100.0%Centinela State Prison 24 1 23 95.8%
Central California Women's Facility 20 20 100.0%Chuchawalla Valley State Prison 15 15 100.0%
Correctional Training Facility 23 23 100.0%Deuel Vocational Institution 17 17 100.0%
Folsom State Prison 21 21 100.0%Folsom Women's Facility 2 2 100.0%High Desert State Prison 29 29 100.0%
Ironwood State Prison 22 22 100.0%Kern Valley State Prison 36 36 100.0%Mule Creek State Prison 19 19 100.0%North Kern State Prison 26 26 100.0%Pelican Bay State Prison 42 2 40 95.2%
Pleasant Valley State Prison 24 1 23 95.8%Richard J. Donavon Correctional Facility 24 24 100.0%
Salinas Valley State Prison 31 31 100.0%Sierra Conservation Center 31 31 100.0%
Valley State Prison 16 1 15 93.8%Wasco State Prison 29 29 100.0%
925 35 890 96%(24) (20) (4) 17%
901 15 886 98%
* The data for the California Health Care Facility (CHCF) was backed out since it only began receiving inmates in July 2013.
HOUSING UNITS - STATEWIDE SUMMARY
Subtotal
GRAND TOTAL
* Back out CHCF
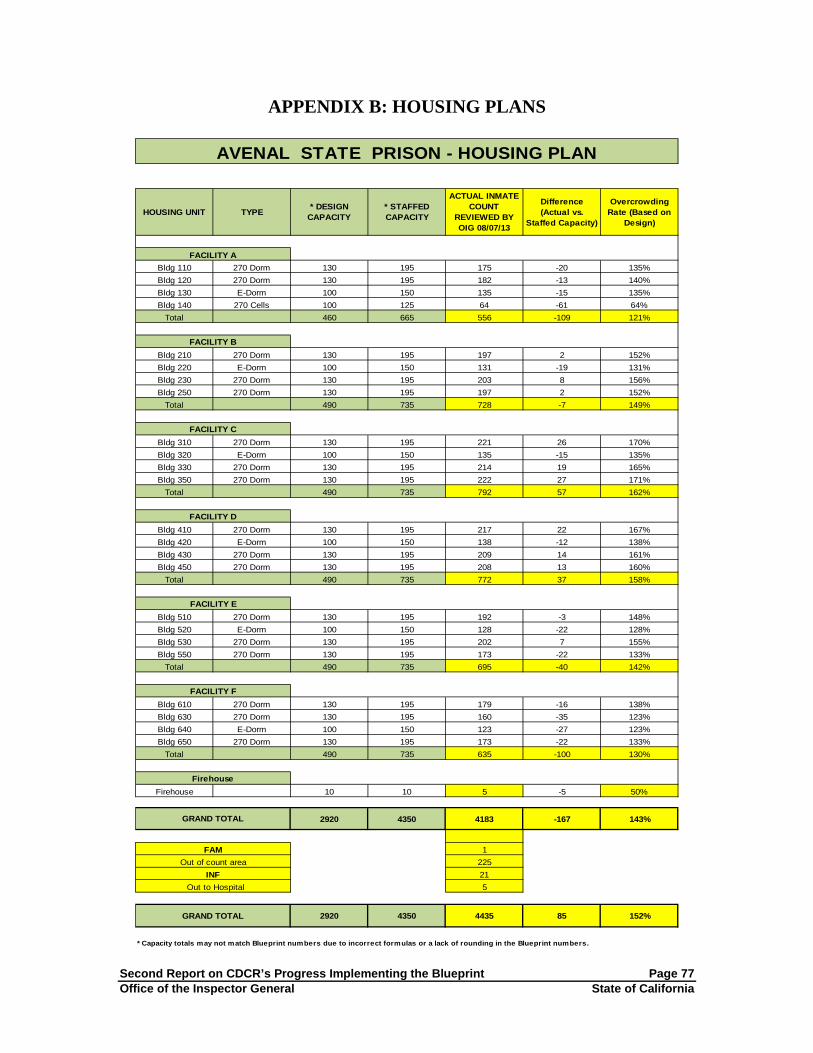
Second Report on CDCR’s Progress Implementing the Blueprint Page 77 Office of the Inspector General State of California
APPENDIX B: HOUSING PLANS
HOUSING UNIT TYPE * DESIGN CAPACITY
* STAFFED CAPACITY
ACTUAL INMATE COUNT
REVIEWED BY OIG 08/07/13
Difference (Actual vs.
Staffed Capacity)
Overcrowding Rate (Based on
Design)
Bldg 110 270 Dorm 130 195 175 -20 135%Bldg 120 270 Dorm 130 195 182 -13 140%Bldg 130 E-Dorm 100 150 135 -15 135%Bldg 140 270 Cells 100 125 64 -61 64%
Total 460 665 556 -109 121%
Bldg 210 270 Dorm 130 195 197 2 152%Bldg 220 E-Dorm 100 150 131 -19 131%Bldg 230 270 Dorm 130 195 203 8 156%Bldg 250 270 Dorm 130 195 197 2 152%
Total 490 735 728 -7 149%
Bldg 310 270 Dorm 130 195 221 26 170%Bldg 320 E-Dorm 100 150 135 -15 135%Bldg 330 270 Dorm 130 195 214 19 165%Bldg 350 270 Dorm 130 195 222 27 171%
Total 490 735 792 57 162%
Bldg 410 270 Dorm 130 195 217 22 167%Bldg 420 E-Dorm 100 150 138 -12 138%Bldg 430 270 Dorm 130 195 209 14 161%Bldg 450 270 Dorm 130 195 208 13 160%
Total 490 735 772 37 158%
Bldg 510 270 Dorm 130 195 192 -3 148%Bldg 520 E-Dorm 100 150 128 -22 128%Bldg 530 270 Dorm 130 195 202 7 155%Bldg 550 270 Dorm 130 195 173 -22 133%
Total 490 735 695 -40 142%
Bldg 610 270 Dorm 130 195 179 -16 138%Bldg 630 270 Dorm 130 195 160 -35 123%Bldg 640 E-Dorm 100 150 123 -27 123%Bldg 650 270 Dorm 130 195 173 -22 133%
Total 490 735 635 -100 130%
Firehouse 10 10 5 -5 50%
2920 4350 4183 -167 143%
1Out of count area 225
21 Out to Hospital 5
2920 4350 4435 85 152%
* Capacity totals may not match Blueprint numbers due to incorrect formulas or a lack of rounding in the Blueprint numbers.
FAM
INF
GRAND TOTAL
AVENAL STATE PRISON - HOUSING PLAN
FACILITY D
FACILITY E
FACILITY F
GRAND TOTAL
Firehouse
FACILITY A
FACILITY B
FACILITY C

Second Report on CDCR’s Progress Implementing the Blueprint Page 78 Office of the Inspector General State of California
APPENDIX B: HOUSING PLANS
HOUSING UNIT TYPE * DESIGN CAPACITY
* STAFFED CAPACITY
ACTUAL INMATE COUNT
REVIEWED BY OIG 07/14/13
Difference (Actual vs.
Staffed Capacity)
Overcrowding Rate (Based on
Design)
Abel Unit Dorm 224 336 390 54 174%Baker Unit Dorm 224 336 376 40 168%Charlie Unit Dorm 160 240 245 5 153%Arnold Unit Dorm 242 242 242 0 100%
Total 850 1154 1253 99 147%
Delta Unit Dorm 224 336 420 84 188%Echo Unit Dorm 224 336 403 67 180%Fox Unit Dorm 160 240 177 -63 111%
Total 608 912 1000 88 164%
Bldg 1 270 Cells 100 150 151 1 151%Bldg 2 270 Cells 100 150 153 3 153%Bldg 3 270 Cells 100 150 145 -5 145%Bldg 4 270 Cells 100 125 151 26 151%Bldg 5 270 Cells 100 150 152 2 152%
Total 500 725 752 27 150%
03-Trinity River Dorm 120 120 117 -3 98%06-Parlin Fork Dorm 100 100 98 -2 98%07-Salt Creek Dorm 120 120 116 -4 97%08-Delta Dorm 120 120 111 -9 93%09-Sugar Pine Dorm 120 120 114 -6 95%17-Chamberlain Creek Dorm 100 100 100 0 100%18-Ishi Dorm 100 100 107 7 107%20-Alder Dorm 100 100 99 -1 99%22-Intermountain Dorm 80 80 83 3 104%23-Deadwood Dorm 80 80 76 -4 95%25-Antelope Dorm 100 100 137 37 137%27-Konocti Dorm 100 100 104 4 104%31-Eel River Dorm 120 120 117 -3 0.9832-High Rock Dorm 100 100 101 1 1.0134-Valley View Dorm 120 120 107 -13 0.8940-Devil's Garden Dorm 120 120 113 -7 0.9444-Washington Ridge Dorm 100 100 96 -4 0.9645-Ben Lomond Dorm 100 100 104 4 1.04Total 1900 1900 1900 0 100%
Firehouse 1 8 8 0 -8 0%Firehouse 2 9 9 0 -9 0%
Total 17 17 0 -17 0%
3875 4708 4905 197 127%
Bldg 1 1 Bldg 2 4
Main Infirmary, Patio, Snack Bar 6
3875 4708 4916 208 127%
* Capacity totals may not match Blueprint numbers due to incorrect formulas or a lack of rounding in the Blueprint numbers.** Fire camp capacity totals do not match Blueprint numbers since a FY 2013/14 BCP approved the fire camps to be restored to prior levels.
CENTRAL SERVICE
OUT-COUNT AREA
GRAND TOTAL
CALIFORNIA CORRECTIONAL CENTER - HOUSING PLAN
** Fire Camps
Firehouse
FACILITY A
FACILITY B
FACILITY C
GRAND TOTAL

Second Report on CDCR’s Progress Implementing the Blueprint Page 79 Office of the Inspector General State of California
APPENDIX B: HOUSING PLANS
HOUSING UNIT TYPE * DESIGN CAPACITY
* STAFFED CAPACITY
ACTUAL INMATE COUNT
REVIEWED BY OIG 08/04/13
Difference (Actual vs.
Staffed Capacity)
Overcrowding Rate (Based on
Design)
Unit 1 180 Cells 62 74 98 24 158%Unit 2 180 Cells 62 74 96 22 155%Unit 3 180 Cells 62 74 95 21 153%Unit 4 180 Cells 62 74 96 22 155%Unit 5 180 Cells 62 74 96 22 155%Unit 6 180 Cells 62 78 88 10 142%Unit 7 180 Cells 64 80 81 1 127%Unit 8 180 Cells 64 80 71 -9 111%
Family Visiting 2 2Total 500 608 723 145%
Unit 1 180 Cells 62 74 87 13 140%Unit 2 180 Cells 62 74 97 23 156%Unit 3 180 Cells 62 74 92 18 148%Unit 4 180 Cells 62 74 93 19 150%Unit 5 180 Cells 62 74 93 19 150%Unit 6 180 Cells 62 74 101 27 163%Unit 7 180 Cells 64 77 98 21 153%Unit 8 180 Cells 64 77 91 14 142%
Family Visit + Infirm 14 14Total 500 598 766 168 153%
Bldg 1 270 Cells 100 150 173 23 173%Bldg 2 270 Cells 100 150 168 18 168%Bldg 3 270 Cells 100 150 171 21 171%Bldg 4 270 Cells 100 150 177 27 177%Bldg 5 270 Cells 100 150 177 27 177%Total 500 750 866 116 173%
Dorm 1 Dorm 80 120 156 36 195%Dorm 2 Dorm 80 120 151 31 189%Dorm 3 Dorm 80 120 154 34 193%Dorm 4 Dorm 80 120 146 26 183%Dorm 5 Dorm 80 120 159 39 199%Dorm 6 Dorm 80 120 142 22 178%Dorm 7 Dorm 80 120 145 25 181%Dorm 8 Dorm 80 120 143 23 179%
Rest House Cells 24 30 0 -30 0%Total 664 990 1196 206 180%
Briggs Dorm 104 156 189 33 182%Clark Dorm 160 240 308 68 193%Davis Dorm 74 111 93 -18 126%
Family Visiting Dorm 10 10 2 -8 20%Rex Deal Dorm 80 120 97 -23 121%
Van Wess Dorm 117 176 212 36.5 181%Willard Dorm 74 111 102 -9 138%Total 619 924 1003 79.5 162%
2783 3870 4554 684.5 164%
8423
2783 3870 4607 737.5 166%
* Capacity totals may not match Blueprint numbers due to incorrect formulas or a lack of rounding in the Blueprint numbers.
CENTRAL SERVICE - FIR 1
GRAND TOTAL
GRAND TOTAL
CALIFORNIA CORRECTIONAL INSTITUTION - HOUSING PLAN
FACILITY A
FACILITY B
FACILITY C
FACILITY D
FACILITY E
Out to HospitalOut Count Area

Second Report on CDCR’s Progress Implementing the Blueprint Page 80 Office of the Inspector General State of California
APPENDIX B: HOUSING PLANS
HOUSING UNIT TYPE * DESIGN CAPACITY
* STAFFED CAPACITY
ACTUAL INMATE COUNT
REVIEWED BY OIG 07/28/13
Difference (Actual vs.
Staffed Capacity)
Overcrowding Rate (Based on
Design)
A301 Cells (MHCB) 60 60 0 -60 0%A302 Cells (MHCB) 77 77 0 -77 0%A304 Cells (PWC) 100 100 128 28 128%Total 237 237 128 -109 54%
B301 Cells (ICF) 55 55 10 -45 18%B302 Cells (ICF) 60 60 0 -60 0%B303 Cells (ICF) 60 60 0 -60 0%B304 Cells (ICF) 60 60 10 -50 17%B305 Cells (ICF) 60 60 10 -50 17%B306 Cells (ICF) 60 60 0 -60 0%B307 Cells (ICF) 60 60 0 -60 0%B308 Cells (ICF) 60 60 0 -60 0%Total 475 475 30 -445 6%
C301 Dorms (Low Accu) 100 100 0 -100 0%C302 Cells (Low Accu) 96 96 0 -96 0%C303 Cells (Low Accu) 96 96 0 -96 0%C304 Dorms (Low Accu) 98 98 0 -98 0%C305 Dorms (Low Accu) 100 100 0 -100 0%C306 Dorms (Low Accu) 100 100 0 -100 0%Total 590 590 0 -590 0%
D301 Cells (High Accu) 60 60 0 -60 0%D302 Cells (High Accu) 60 60 0 -60 0%D303 Cells (High Accu) 60 60 0 -60 0%D304 Cells (High Accu) 60 60 0 -60 0%D305 Cells (High Accu) 60 60 0 -60 0%D306 Cells (High Accu) 60 60 0 -60 0%D307 Cells (High Accu) 60 60 0 -60 0%Total 420 420 0 -420 0%
1722 1722 158 -1564 9%
0
0
1722 1722 158 -1564 9%
* Capacity totals may not match Blueprint numbers due to incorrect formulas or a lack of rounding in the Blueprint numbers.
GRAND TOTAL
OUT-COUNT AREA
Off-Prison Grounds
CALIFORNIA HEALTH CARE FACILITY - HOUSING PLAN
FACILITY A
FACILITY B
FACILITY C - OHU
FACILITY D - CTC
GRAND TOTAL

Second Report on CDCR’s Progress Implementing the Blueprint Page 81 Office of the Inspector General State of California
APPENDIX B: HOUSING PLANS
HOUSING UNIT TYPE * DESIGN CAPACITY
* STAFFED CAPACITY
ACTUAL INMATE COUNT
REVIEWED BY OIG 08/05/13
Difference (Actual vs.
Staffed Capacity)
Overcrowding Rate (Based on
Design)
Angeles Dorm 80 120 139 19 174%Borrego Dorm 80 120 151 31 189%
Cleveland Dorm 80 120 150 30 188%Joshua Dorm 80 120 134 14 168%Laguna Dorm 80 120 142 22 178%
Mariposa Dorm 80 120 111 -9 139%Otay Dorm 80 120 143 23 179%
Sequioia Dorm 80 120 135 15 169%Total 640 960 1105 145 173%
Birch Cells (O/U) 154 154 249 95 162%Cypress Cells (O/U) 102 102 170 68 167%Madrone Cells (O/U) 102 102 177 75 174%
Palm Cells (O/U) 102 102 172 70 169%Sycamore Cells (O/U) 102 102 195 93 191%
Fam 1 1Total 562 562 964 402 172%
Alpine Cells 100 150 175 25 175%Butte Cells 100 150 185 35 185%
Colusa Cells 100 150 182 32 182%Del Norte Cells 100 150 173 23 173%
Total 400 600 715 115 179%
Alder Hall Dorm 100 150 152 2 152%Spruce Hall Dorm 100 150 155 5 155%Willow Hall Dorm 100 150 152 2 152%
Magnolia Hall Dorm 100 150 151 1 151%Juniper Hall Dorm 100 150 152 2 152%West Dorm Cells 224 336 331 -5 148%South Dorm Cells 52 78 68 -10 131%
Redwood Dorm 100 150 153 3 153%Elm Hall Dorm 156 234 153 -81 98%
Cedar Hall Dorm 100 150 153 3 153%Pine Hall Dorm 100 150 152 2 152%Oak Hall Dorm 100 150 150 0 150%
Firehouse + Fam Dorm 10 10 6 -4 60%OHU 78 78Total 1342 2008 2006 -2 149%
2944 4130 4790 660 163%
Hospital 1
Out to Hospital 5
2944 4130 4796 666 163%
* Capacity totals may not match Blueprint numbers due to incorrect formulas or a lack of rounding in the Blueprint numbers.
OUT-COUNT AREA
Off-Prison Grounds
GRAND TOTAL
CALIFORNIA INSTITUTION FOR MEN - HOUSING PLAN
GRAND TOTAL
FACILITY A
FACILITY B
FACILITY C
FACILITY D

Second Report on CDCR’s Progress Implementing the Blueprint Page 82 Office of the Inspector General State of California
APPENDIX B: HOUSING PLANS
HOUSING UNIT TYPE * DESIGN CAPACITY
* STAFFED CAPACITY
ACTUAL INMATE COUNT
REVIEWED BY OIG 07/29/13
Difference (Actual vs.
Staffed Capacity)
Overcrowding Rate (Based on
Design)
Hall 1-4 Rooms 116 174 207 33 178%Total 116 174 207 33 178%
Barneberg Dorm 120 180 231 51 193%Emmons Dorm 120 180 234 54 195%Harrison Dorm 120 180 234 54 195%Latham Dorm 120 180 234 54 195%Miller Dorm 120 180 239 59 199%
Wilson Dorm 120 180 237 57 198%Total 720 1080 1409 329 196%
SP HU TIER 1 270 10 10 51 610%SP HU TIER 1 270 30 38 -38 0%SP HU TIER 1 270 10 10 -10 0%SP HU TIER 2 270 50 50 71 21 142%
Total 100 108 132 24 132%
North Dorms 24 36West Dorms 23 35East Cells 23 20Total 70 91 93 2 133%
Rainbow Camp 100 100 83 -17 83%Malibu Camp 100 100 84 -16 84%
Puerta La Cruz Camp 120 120 93 -27 78%Total 320 320 260 -60 81%
OHU OHU 10 10 6 -4 60%Total 10 10 6 -4 60%
PIP ICF 45 45 40 -5 89%Total 45 45 40 -5 89%
North Rooms 10 10 0 -10 0%South Rooms 10 10 0 -10 0%Total 20 20 0 -20 0%
1401 1848 2147 299 153%
Fam 1 1 Infirmary 1 12
1401 1848 2160 312 154%
* Capacity totals may not match Blueprint numbers due to incorrect formulas or a lack of rounding in the Blueprint numbers.** Fire camp capacity totals do not match Blueprint numbers since a FY 2013/14 BCP approved the fire camps to be restored to prior levels.
61
GRAND TOTAL
CENTRAL SERVICE
CALIFORNIA INSTITUTION FOR WOMEN - HOUSING PLAN
SCU
** Fire Camps
Medical
GRAND TOTAL
WALKER
RC HALL
DORMS
GP
ICF
93 2 133%
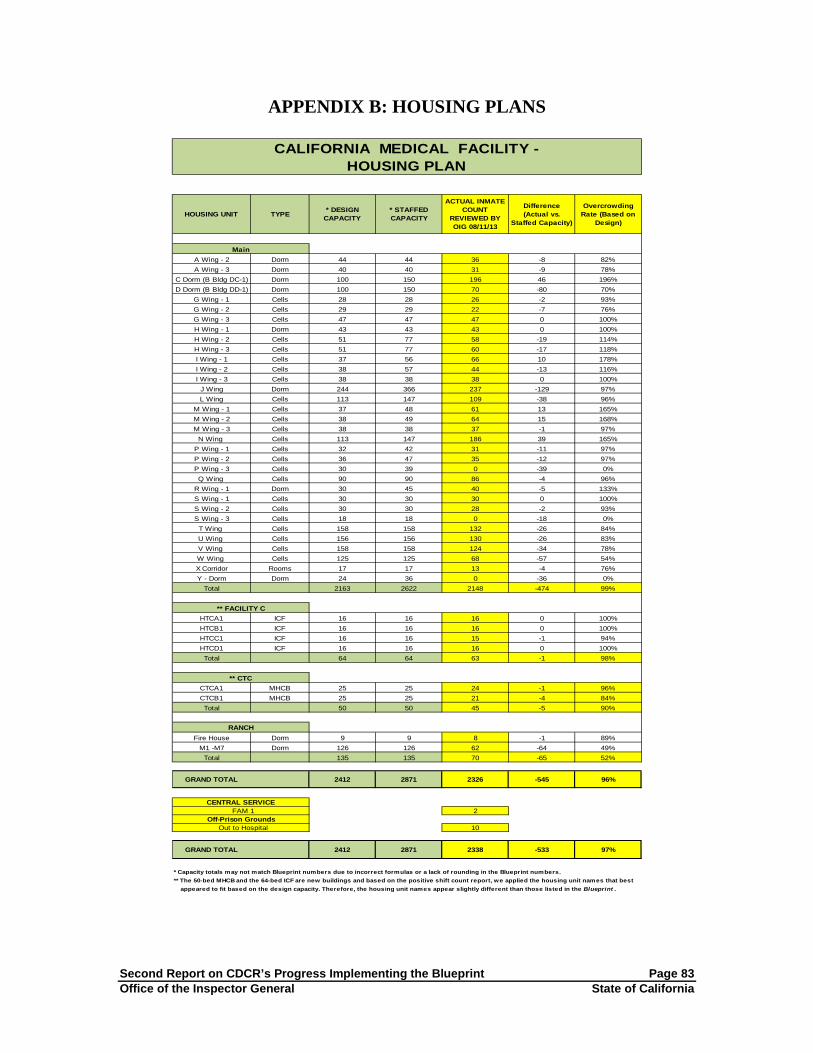
Second Report on CDCR’s Progress Implementing the Blueprint Page 83 Office of the Inspector General State of California
APPENDIX B: HOUSING PLANS
HOUSING UNIT TYPE * DESIGN CAPACITY
* STAFFED CAPACITY
ACTUAL INMATE COUNT
REVIEWED BY OIG 08/11/13
Difference (Actual vs.
Staffed Capacity)
Overcrowding Rate (Based on
Design)
A Wing - 2 Dorm 44 44 36 -8 82%A Wing - 3 Dorm 40 40 31 -9 78%
C Dorm (B Bldg DC-1) Dorm 100 150 196 46 196%D Dorm (B Bldg DD-1) Dorm 100 150 70 -80 70%
G Wing - 1 Cells 28 28 26 -2 93%G Wing - 2 Cells 29 29 22 -7 76%G Wing - 3 Cells 47 47 47 0 100%H Wing - 1 Dorm 43 43 43 0 100%H Wing - 2 Cells 51 77 58 -19 114%H Wing - 3 Cells 51 77 60 -17 118%I Wing - 1 Cells 37 56 66 10 178%I Wing - 2 Cells 38 57 44 -13 116%I Wing - 3 Cells 38 38 38 0 100%
J Wing Dorm 244 366 237 -129 97%L Wing Cells 113 147 109 -38 96%
M Wing - 1 Cells 37 48 61 13 165%M Wing - 2 Cells 38 49 64 15 168%M Wing - 3 Cells 38 38 37 -1 97%
N Wing Cells 113 147 186 39 165%P Wing - 1 Cells 32 42 31 -11 97%P Wing - 2 Cells 36 47 35 -12 97%P Wing - 3 Cells 30 39 0 -39 0%Q Wing Cells 90 90 86 -4 96%
R Wing - 1 Dorm 30 45 40 -5 133%S Wing - 1 Cells 30 30 30 0 100%S Wing - 2 Cells 30 30 28 -2 93%S Wing - 3 Cells 18 18 0 -18 0%
T Wing Cells 158 158 132 -26 84%U Wing Cells 156 156 130 -26 83%V Wing Cells 158 158 124 -34 78%W Wing Cells 125 125 68 -57 54%X Corridor Rooms 17 17 13 -4 76%Y - Dorm Dorm 24 36 0 -36 0%
Total 2163 2622 2148 -474 99%
HTCA1 ICF 16 16 16 0 100%HTCB1 ICF 16 16 16 0 100%HTCC1 ICF 16 16 15 -1 94%HTCD1 ICF 16 16 16 0 100%Total 64 64 63 -1 98%
CTCA1 MHCB 25 25 24 -1 96%CTCB1 MHCB 25 25 21 -4 84%Total 50 50 45 -5 90%
Fire House Dorm 9 9 8 -1 89%M1 -M7 Dorm 126 126 62 -64 49%
Total 135 135 70 -65 52%
GRAND TOTAL 2412 2871 2326 -545 96%
FAM 1 2
Out to Hospital 10
GRAND TOTAL 2412 2871 2338 -533 97%
* Capacity totals may not match Blueprint numbers due to incorrect formulas or a lack of rounding in the Blueprint numbers.** The 50-bed MHCB and the 64-bed ICF are new buildings and based on the positive shift count report, we applied the housing unit names that best appeared to fit based on the design capacity. Therefore, the housing unit names appear slightly different than those listed in the Blueprint .
Off-Prison Grounds
Main
RANCH
CALIFORNIA MEDICAL FACILITY - HOUSING PLAN
** CTC
** FACILITY C
CENTRAL SERVICE

Second Report on CDCR’s Progress Implementing the Blueprint Page 84 Office of the Inspector General State of California
APPENDIX B: HOUSING PLANS
HOUSING UNIT TYPE * DESIGN CAPACITY
* STAFFED CAPACITY
ACTUAL INMATE COUNT
REVIEWED BY OIG 07/28/13
Difference (Actual vs.
Staffed Capacity)
Overcrowding Rate (Based on
Design)
Bldg 1 Cells (O/U) 300 300 365 65 122%Bldg 2 Cells (O/U) 300 300 332 32 111%Total 600 600 697 97 116%
Bldg 3 Cells (O/U) 300 300 428 128 143%Bldg 4 Cells (O/U) 300 300 300 0 100%Total 600 600 728 128 121%
Bldg 5 Cells (O/U) 300 300 321 21 107%Bldg 6 Cells (O/U) 300 300 359 59 120%Total 600 600 680 80 113%
Bldg 7 Cells (O/U) 300 300 339 39 113%Bldg 8 Cells (O/U) 300 300 396 96 132%Total 600 600 735 135 123%
ASU 25 25 0 -25 0%Total 25 25 0 -25 0%
MHCB 50 50 0 -50 0%Total 50 50 0 -50 0%
Dorms 1-10 Dorm 450 675 689 14 153%Total 450 675 689 14 153%
Dorms 11-20 Dorm 450 675 711 36 158%Total 450 675 711 36 158%
Dorms 22-28 Dorm 303 455 447 -8 148%Total 303 455 447 -8 148%
Dorm 30 Dorm 44 44 44 0 100%Dorm 31 Dorm 44 44 51 7 116%Dorm 32 Dorm 44 44 38 -6 86%Dorm 33 Dorm 33 33 31 -2 94%Dorm 34 Dorm 33 33 33 0 100%
Firehouse 12 12 9 -3 75%Total 210 210 206 -4 98%
3888 4490 4893 403 126%
21
Family Visiting 2
Out to Hospital 3
3888 4490 4919 429 127%
* Capacity totals may not match Blueprint numbers due to incorrect formulas or a lack of rounding in the Blueprint numbers.
CALIFORNIA MEN'S COLONY - HOUSING PLAN
MH CRISIS BED
WEST FACILITYFACILITY E
FACILITY F
Separate ASU
EAST FACILITYFACILITY A
FACILITY B
FACILITY C
FACILITY D
GRAND TOTAL
CENTRAL SERVICE
FACILITY G
GRAND TOTAL
MSF
OUT-COUNT AREA
Off-Prison Grounds
Hos 1

Second Report on CDCR’s Progress Implementing the Blueprint Page 85 Office of the Inspector General State of California
APPENDIX B: HOUSING PLANS
HOUSING UNIT TYPE * DESIGN CAPACITY
* STAFFED CAPACITY
ACTUAL INMATE COUNT
REVIEWED BY OIG 07/22/13
Difference (Actual vs.
Staffed Capacity)
Overcrowding Rate (Based on
Design)
Firehouse Dorm 10 10 0 -10 0%Total 10 10 0 -10 0%
Dorm 101 Dorm 44 66 75 9 170%Dorm 102 Dorm 44 66 72 6 164%Dorm 103 Dorm 44 66 76 10 173%Dorm 104 Dorm 44 66 75 9 170%Dorm 105 Dorm 44 66 0 -66 0%Dorm 106 Dorm 50 75 76 1 152%Dorm 107 Dorm 44 66 76 10 173%Dorm 108 Dorm 44 66 75 9 170%Dorm 109 Dorm 50 75 76 1 152%Dorm 110 Dorm 50 75 75 0 150%Dorm 111 Dorm 50 75 74 -1 148%Dorm 112 Dorm 50 75 74 -1 148%
Total 558 837 824 -13 148%
Dorm 201 Dorm 50 75 78 3 156%Dorm 202 Dorm 50 75 78 3 156%Dorm 203 Dorm 50 75 78 3 156%Dorm 204 Dorm 50 75 78 3 156%Dorm 205 Dorm 50 75 77 2 154%Dorm 206 Dorm 50 75 77 2 154%Dorm 207 Dorm 50 75 78 3 156%Dorm 208 Dorm 50 75 76 1 152%Dorm 209 Dorm 50 75 78 3 156%Dorm 210 Dorm 50 75 78 3 156%Dorm 211 Dorm 50 75 0 -75 0%Dorm 212 Dorm 50 75 0 -75 0%Dorm 213 Dorm 50 75 0 -75 0%Dorm 214 Dorm 100 150 148 -2 148%
Total 750 1125 924 -201 123%
Dorm 301 Dorm 50 75 0 -75 0%Dorm 302 Dorm 50 75 78 3 156%Dorm 303 Dorm 50 75 80 5 160%Dorm 304 Dorm 50 75 79 4 158%Dorm 305 Dorm 50 75 79 4 158%Dorm 306 Dorm 50 75 78 3 156%Dorm 307 Dorm 50 75 0 -75 0%Dorm 308 Dorm 50 75 74 -1 148%Dorm 309 Dorm 50 75 79 4 158%Dorm 310 Dorm 50 75 77 2 154%Dorm 311 Dorm 50 75 79 4 158%Dorm 312 Dorm 50 75 78 3 156%Dorm 313 Dorm 50 75 75 0 150%Dorm 314 Dorm 32 48 38 -10 119%Dorm 315 Dorm 31 47 32 -15 103%
Fir 7 7Total 713 1070 933 -137 131%
Dorm 401 Dorm 43 65 86 21 200%Dorm 402 Dorm 50 75 100 25 200%Dorm 403 Dorm 47 71 94 23 200%Dorm 404 Dorm 50 75 99 24 198%Dorm 405 Dorm 48 72 96 24 200%Dorm 406 Dorm 42 63 80 17 190%Dorm 407 Dorm 40 60 75 15 188%Dorm 408 Dorm 40 60 80 20 200%Dorm 409 Dorm 40 60 79 19 198%
Total 400 601 789 188 197%
2431 3643 3470 -173 143%
INF 1 6
Camp Norco/CDF 25Other 4
Infirmary 3
Out to Hospital 1
2431 3643 3509 -134 144%
* Capacity totals may not match Blueprint numbers due to incorrect formulas or a lack of rounding in the Blueprint numbers.** It appears that a total of six housing units have been closed among the A, B, and C facilities.
OUT-COUNT AREA
GRAND TOTAL
GRAND TOTAL
CALIFORNIA REHABILITATION CENTER - HOUSING PLAN
Level I
** FACILITY A
** FACILITY B
** FACILITY C
FACILITY D
Off-Prison Grounds
CENTRAL SERVICE

Second Report on CDCR’s Progress Implementing the Blueprint Page 86 Office of the Inspector General State of California
APPENDIX B: HOUSING PLANS
HOUSING UNIT TYPE * DESIGN CAPACITY
* STAFFED CAPACITY
ACTUAL INMATE COUNT
REVIEWED BY OIG 07/21/13
Difference (Actual vs.
Staffed Capacity)
Overcrowding Rate (Based on
Design)
A Dorm Dorm 96 96 0 -96 0%B Dorm Dorm 96 96 95 -1 99%C Dorm Dorm 96 96 0 -96 0%D Dorm Dorm 96 96 102 6 106%E Dorm E-Dorm 100 100 97 -3 97%
Firehouse Dorm 8 8 6 -2 75%Total 492 492 300 -192 61%
Bldg 1 270 Cells 100 150 187 37 187%Bldg 2 270 Cells 100 150 193 43 193%
Bldg 3-1 270 Cells 50 50 58 8 116%Bldg 3-2 270 Cells 50 63 58 -5 116%Bldg 4 270 Cells 100 125 127 2 127%Bldg 5 270 Cells 100 150 171 21 171%Total 500 688 794 106 159%
Bldg 1 270 Cells 100 150 153 3 153%Bldg 2 270 Cells 100 150 74 -76 74%Bldg 3 270 Cells 100 150 190 40 190%Bldg 4 270 Cells 100 150 196 46 196%Bldg 5 270 Cells 100 150 186 36 186%Total 500 750 799 49 160%
Bldg 1 270 Cells 100 150 195 45 195%Bldg 2 270 Cells 100 150 196 46 196%Bldg 3 270 Cells 100 150 199 49 199%Bldg 4 270 Cells 100 150 198 48 198%Bldg 5 270 Cells 100 150 197 47 197%Total 500 750 985 235 197%
Bldg 4A-1L 180 Cells 64 77 69 -8 108%Bldg 4A-1R 180 Cells 64 77 84 7 131%Bldg 4A-2L 180 Cells 64 77 85 8 133%Bldg 4A-2R 180 Cells 64 77 78 1 122%Bldg 4A-3L 180 Cells 64 77 92 15 144%Bldg 4A-3R 180 Cells 64 77 78 1 122%Bldg 4A-4L 180 Cells 64 77 73 -4 114%Bldg 4A-4R 180 Cells 44 53 36 -17 82%Bldg 4A-4R 180 Cells 20 24 30 6 150%
Total 512 616 625 9 122%
Bldg 4B-1L 180 Cells 64 77 69 -8 108%Bldg 4B-1R 180 Cells 64 77 65 -12 102%Bldg 4B-2L 180 Cells 64 77 66 -11 103%Bldg 4B-2R 180 Cells 64 77 64 -13 100%Bldg 4B-3L 180 Cells 64 77 71 -6 111%Bldg 4B-3R 180 Cells 64 77 65 -12 102%Bldg 4B-4L 180 Cells 64 77 68 -9 106%Bldg 4B-4R 180 Cells 64 77 66 -11 103%
Total 512 616 534 -82 104%
Stand Alone ASU 100 125 125 0 125%Total 100 125 125 0 125%
Hospital 0 99 91 -8Total 0 99 91 -8
3116 4136 4253 117 136%
17 Out to Hospital 8
3116 4136 4278 142 137%
* Capacity totals may not match Blueprint numbers due to incorrect formulas or a lack of rounding in the Blueprint numbers.
CALIFORNIA STATE PRISON, CORCORAN - HOUSING PLAN
Off-Prison Grounds
GRAND TOTAL
GRAND TOTAL
ASU
Hospital
MSF
FACILITY 3A
FACILITY 3B
FACILITY 3C
FACILITY 4A
FACILITY 4B
PIA Dairy, ACH-ER
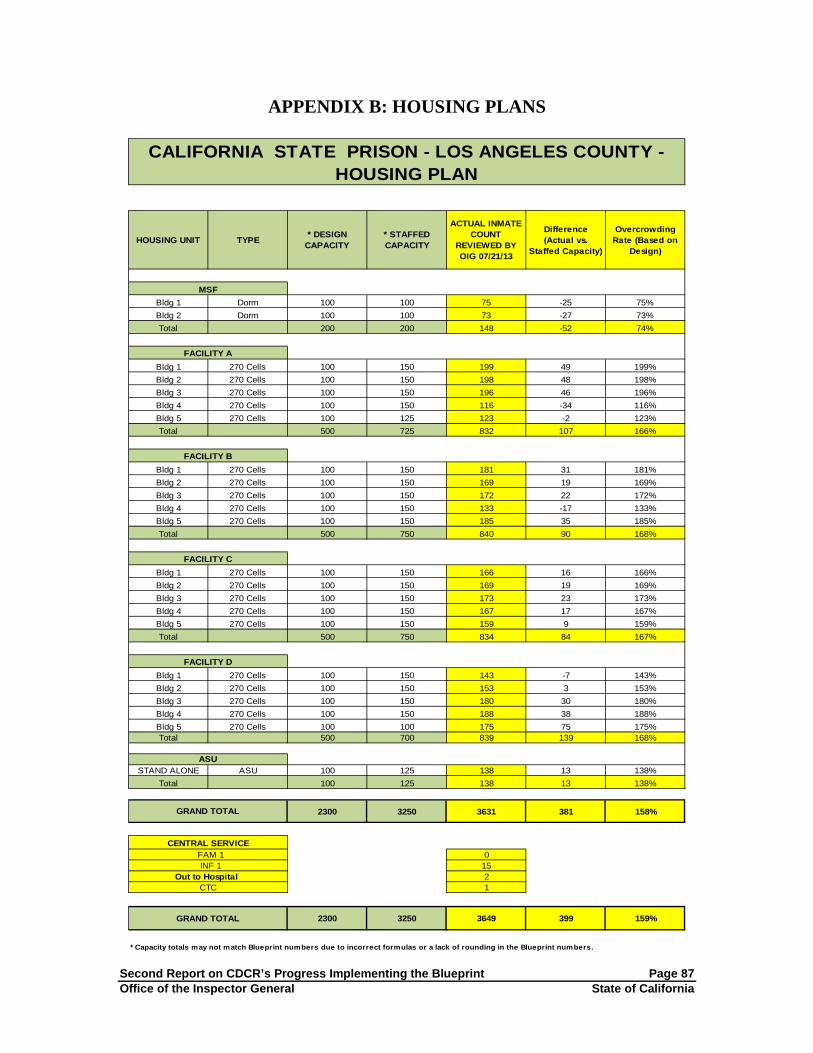
Second Report on CDCR’s Progress Implementing the Blueprint Page 87 Office of the Inspector General State of California
APPENDIX B: HOUSING PLANS
HOUSING UNIT TYPE * DESIGN CAPACITY
* STAFFED CAPACITY
ACTUAL INMATE COUNT
REVIEWED BY OIG 07/21/13
Difference (Actual vs.
Staffed Capacity)
Overcrowding Rate (Based on
Design)
Bldg 1 Dorm 100 100 75 -25 75%Bldg 2 Dorm 100 100 73 -27 73%Total 200 200 148 -52 74%
Bldg 1 270 Cells 100 150 199 49 199%Bldg 2 270 Cells 100 150 198 48 198%Bldg 3 270 Cells 100 150 196 46 196%Bldg 4 270 Cells 100 150 116 -34 116%Bldg 5 270 Cells 100 125 123 -2 123%Total 500 725 832 107 166%
Bldg 1 270 Cells 100 150 181 31 181%Bldg 2 270 Cells 100 150 169 19 169%Bldg 3 270 Cells 100 150 172 22 172%Bldg 4 270 Cells 100 150 133 -17 133%Bldg 5 270 Cells 100 150 185 35 185%Total 500 750 840 90 168%
Bldg 1 270 Cells 100 150 166 16 166%Bldg 2 270 Cells 100 150 169 19 169%Bldg 3 270 Cells 100 150 173 23 173%Bldg 4 270 Cells 100 150 167 17 167%Bldg 5 270 Cells 100 150 159 9 159%Total 500 750 834 84 167%
Bldg 1 270 Cells 100 150 143 -7 143%Bldg 2 270 Cells 100 150 153 3 153%Bldg 3 270 Cells 100 150 180 30 180%Bldg 4 270 Cells 100 150 188 38 188%Bldg 5 270 Cells 100 100 175 75 175%Total 500 700 839 139 168%
STAND ALONE ASU 100 125 138 13 138%Total 100 125 138 13 138%
2300 3250 3631 381 158%
FAM 1 0 INF 1 15
2CTC 1
2300 3250 3649 399 159%
* Capacity totals may not match Blueprint numbers due to incorrect formulas or a lack of rounding in the Blueprint numbers.
CENTRAL SERVICE
Out to Hospital
GRAND TOTAL
CALIFORNIA STATE PRISON - LOS ANGELES COUNTY - HOUSING PLAN
FACILITY D
GRAND TOTAL
ASU
MSF
FACILITY A
FACILITY B
FACILITY C

Second Report on CDCR’s Progress Implementing the Blueprint Page 88 Office of the Inspector General State of California
APPENDIX B: HOUSING PLANS
HOUSING UNIT TYPE * DESIGN CAPACITY
* STAFFED CAPACITY
ACTUAL INMATE COUNT
REVIEWED BY OIG 08/05/13
Difference (Actual vs.
Staffed Capacity)
Overcrowding Rate (Based on
Design)
D Dorm Dorm 96 96 71 -25 74%E Dorm Dorm 96 96 68 -28 71%
Total 192 192 139 -53 72%
Bldg A1 180 Cells 64 64 62 -2 97%Bldg A2 180 Cells 64 64 61 -3 95%Bldg A3 180 Cells 64 64 58 -6 91%Bldg A4 180 Cells 64 64 64 0 100%Bldg A5 180 Cells 64 64 63 -1 98%Bldg A6 180 Cells 64 96 84 -12 131%Bldg A7 180 Cells 64 96 83 -13 130%Bldg A8 180 Cells 64 96 96 0 150%Wat 1 2 2Total 512 608 573 -35 112%
Bldg B1 180 Cells 64 96 82 -14 128%Bldg B2 180 Cells 64 96 108 12 169%Bldg B3 180 Cells 64 77 89 12 139%Bldg B4 180 Cells 64 80 77 -3 120%Bldg B5 180 Cells 64 96 106 10 166%Bldg B6 180 Cells 64 96 77 -19 120%Bldg B7 180 Cells 64 64 79 15 123%Bldg B8 180 Cells 64 64 52 -12 81%Wat 1 2Total 512 669 672 3 131%
Bldg C1 180 Cells 64 96 95 -1 148%Bldg C2 180 Cells 64 96 89 -7 139%Bldg C3 180 Cells 64 96 98 2 153%Bldg C4 180 Cells 64 96 100 4 156%Bldg C5 180 Cells 64 96 93 -3 145%Bldg C6 180 Cells 64 96 95 -1 148%Bldg C7 180 Cells 64 96 90 -6 141%Bldg C8 180 Cells 64 96 77 -19 120%Wat 1 1Total 512 768 738 -30 144%
Stand Alone ASU 100 125 100 -25 100%Total 100 125 100 -25 100%
1828 2362 2222 -140 122%
INF 1 15 CTC 1 10
Out to Hospital/Medical 2
1828 2362 2249 -113 123%
* Capacity totals may not match Blueprint numbers due to incorrect formulas or a lack of rounding in the Blueprint numbers.
CENTRAL SERVICE
Off-Prison Grounds
GRAND TOTAL
GRAND TOTAL
CALIFORNIA STATE PRISON, SACRAMENTO - HOUSING PLAN
MSF
FACILITY A
FACILITY B
FACILITY C
ASU

Second Report on CDCR’s Progress Implementing the Blueprint Page 89 Office of the Inspector General State of California
APPENDIX B: HOUSING PLANS
HOUSING UNIT TYPE * DESIGN CAPACITY
* STAFFED CAPACITY
ACTUAL INMATE COUNT
REVIEWED BY OIG 08/20/13
Difference (Actual vs.
Staffed Capacity)
Overcrowding Rate (Based on
Design)
Tier 1-3 Cells 102 102 92 -10 90%Total 102 102 92 -10 90%
Tier 1-5 Cells 247 371 378 7 153%Total 247 371 378 7 153%
Tier 1-5 Cells 247 371 415 44 168%Total 247 371 415 44 168%
Tier 1 Cells 41 41 41 0 100%Tier 2 Cells 48 48 48 0 100%Tier 3 Cells 48 48 48 0 100%Tier 4 Cells 48 48 48 0 100%Tier 5 Cells 48 48 47 -1 98%Total 233 233 232 -1 100%
Tier 1 Cells 49 74 72 -2 147%Tier 2 Cells 48 72 97 25 202%Tier 3 Cells 48 48 84 36 175%Tier 4 Cells 48 48 72 24 150%Tier 5 Cells 48 48 7 -41 15%Total 241 290 332 42 138%
Tier 1-5 Cells 520 520 519 -1 100%Total 520 520 519 -1 100%
Tier 1-5 Dorm 500 750 585 -165 117%Total 500 750 585 -165 117%
Tier 1 Cells 82 123 143 20 174%Tier 2 Cells 83 125 157 32 189%Tier 3 Cells 83 125 159 34 192%Tier 4 Cells 83 125 156 31 188%Tier 5 Cells 83 125 154 29 186%Total 414 623 769 146 186%
North Side Cells 34 34 34 0 100%South Side Cells 34 34 34 0 100%
Total 68 68 68 0 100%
Tier 1 Cells 89 134 137 3 154%Tier 2 Cells 90 135 155 20 172%Tier 3 Cells 90 135 167 32 186%Tier 4 Cells 90 135 175 40 194%Tier 5 Cells 90 135 166 31 184%Total 449 674 800 126 178%
Fire House 15 15 12 -3 80%INF 47
Total 15 15 59 44 393%
CHSB 45 45 0 -45 0%Total 45 45 0 -45 0%
3081 4062 4249 187 138%
Sewer Treatment + Contraband Watch 2
Out to Hospital 3
3081 4062 4254 192 138%
* Capacity totals may not match Blueprint numbers due to incorrect formulas or a lack of rounding in the Blueprint numbers.** Three housing units have been closed. This was confirmed by SQ management.
OUT-COUNT AREA
Off-Prison Grounds
GRAND TOTAL
GRAND TOTAL
EAST BAY/YARD
CALIFORNIA STATE PRISON, SAN QUENTIN - HOUSING PLAN
ADJUSTMENT CENTER
ALPINE
BADGER
CARSON
** DONNER
Central Health Services Building
WEST BLOCK
H UNIT - Fac B
NORTH BLOCK
NORTH SEG
WEST BLOCK

Second Report on CDCR’s Progress Implementing the Blueprint Page 90 Office of the Inspector General State of California
APPENDIX B: HOUSING PLANS
HOUSING UNIT TYPE * DESIGN CAPACITY
* STAFFED CAPACITY
ACTUAL INMATE COUNT
REVIEWED BY OIG 07/22/13
Difference (Actual vs.
Staffed Capacity)
Overcrowding Rate (Based on
Design)
Unit 1 270 Cells 100 150 139 -11 139%Unit 2 270 Cells 100 150 141 -9 141%Unit 3 270 Cells 100 150 140 -10 140%Unit 4 270 Cells 100 150 145 -5 145%Unit 5 270 Cells 100 150 151 1 151%Unit 6 270 Cells 100 150 139 -11 139%FAM 1 2 2Total 600 900 857 -43 143%
Unit 7 270 Cells 100 150 136 -14 136%Unit 8 270 Cells 100 150 156 6 156%Unit 9 270 Cells 100 150 117 -33 117%Unit 10 270 Cells 100 125 107 -18 107%Unit 11 270 Cells 100 150 149 -1 149%Unit 12 270 Cells 100 150 152 2 152%Total 600 875 817 -58 136%
Unit 13 270 Dorm 130 195 186 -9 143%Unit 14 270 Dorm 130 195 195 0 150%Unit 15 270 Dorm 130 195 198 3 152%Unit 16 E-Dorm 100 150 140 -10 140%Unit 17 E-Dorm 100 150 136 -14 136%Unit 18 E-Dorm 100 150 129 -21 129%FAM 1 0 0Total 690 1035 984 -51 143%
Unit 19 E-Dorm 100 150 144 -6 144%Unit 20 270 Dorm 130 195 203 8 156%Unit 21 270 Dorm 130 195 200 5 154%Unit 22 270 Dorm 130 195 209 14 161%Unit 23 270 Dorm 130 195 207 12 159%Unit 24 E-Dorm 100 150 146 -4 146%Total 720 1080 1109 29 154%
2610 3890 3767 -123 144%
INF 1 15
Laundry, Level III Kitchen, B Dining, etc. 105
Out to Hospital/Medical 11
R & R In 2
2610 3890 3900 10 149%
* Capacity totals may not match Blueprint numbers due to incorrect formulas or a lack of rounding in the Blueprint numbers.
CENTRAL SERVICE
OUT-COUNT AREA
Off-Prison Grounds
GRAND TOTAL
CALIFORNIA STATE PRISON, SOLANO - HOUSING PLAN
GRAND TOTAL
FACILITY A
FACILITY B
FACILITY C
FACILITY D
INCOMING AREA
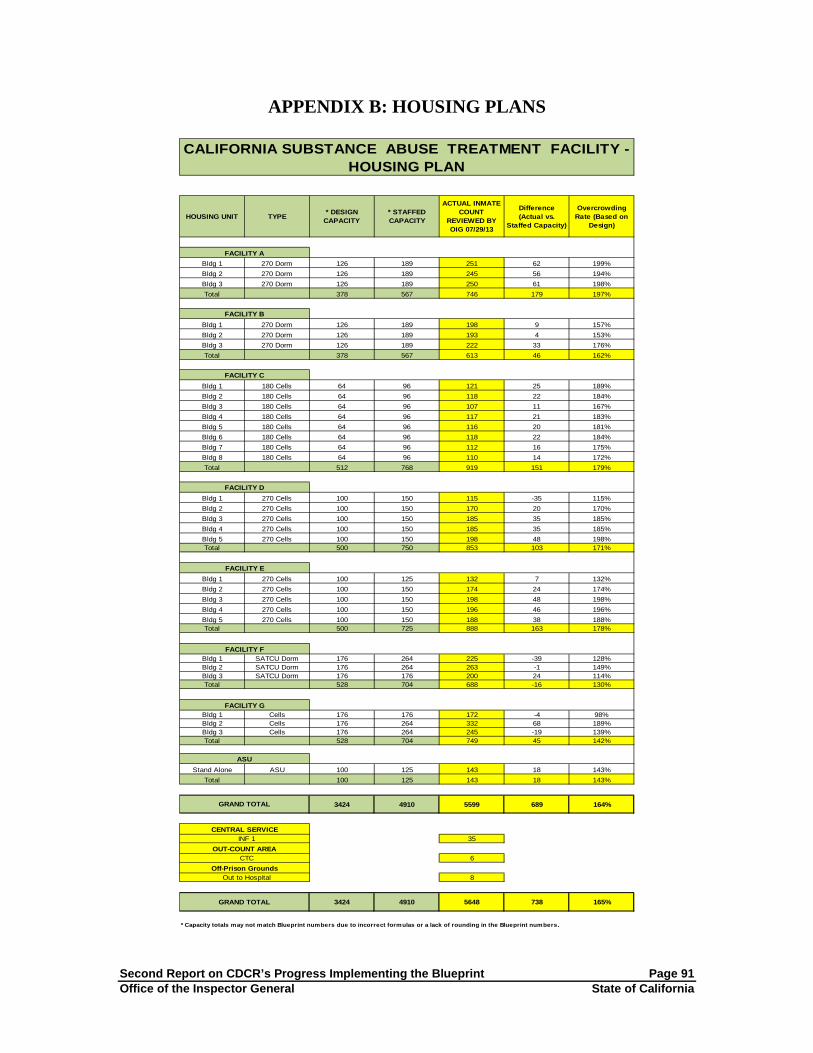
Second Report on CDCR’s Progress Implementing the Blueprint Page 91 Office of the Inspector General State of California
APPENDIX B: HOUSING PLANS
HOUSING UNIT TYPE * DESIGN CAPACITY
* STAFFED CAPACITY
ACTUAL INMATE COUNT
REVIEWED BY OIG 07/29/13
Difference (Actual vs.
Staffed Capacity)
Overcrowding Rate (Based on
Design)
Bldg 1 270 Dorm 126 189 251 62 199%Bldg 2 270 Dorm 126 189 245 56 194%Bldg 3 270 Dorm 126 189 250 61 198%Total 378 567 746 179 197%
Bldg 1 270 Dorm 126 189 198 9 157%Bldg 2 270 Dorm 126 189 193 4 153%Bldg 3 270 Dorm 126 189 222 33 176%Total 378 567 613 46 162%
Bldg 1 180 Cells 64 96 121 25 189%Bldg 2 180 Cells 64 96 118 22 184%Bldg 3 180 Cells 64 96 107 11 167%Bldg 4 180 Cells 64 96 117 21 183%Bldg 5 180 Cells 64 96 116 20 181%Bldg 6 180 Cells 64 96 118 22 184%Bldg 7 180 Cells 64 96 112 16 175%Bldg 8 180 Cells 64 96 110 14 172%Total 512 768 919 151 179%
Bldg 1 270 Cells 100 150 115 -35 115%Bldg 2 270 Cells 100 150 170 20 170%Bldg 3 270 Cells 100 150 185 35 185%Bldg 4 270 Cells 100 150 185 35 185%Bldg 5 270 Cells 100 150 198 48 198%Total 500 750 853 103 171%
Bldg 1 270 Cells 100 125 132 7 132%Bldg 2 270 Cells 100 150 174 24 174%Bldg 3 270 Cells 100 150 198 48 198%Bldg 4 270 Cells 100 150 196 46 196%Bldg 5 270 Cells 100 150 188 38 188%Total 500 725 888 163 178%
Bldg 1 SATCU Dorm 176 264 225 -39 128%Bldg 2 SATCU Dorm 176 264 263 -1 149%Bldg 3 SATCU Dorm 176 176 200 24 114%Total 528 704 688 -16 130%
Bldg 1 Cells 176 176 172 -4 98%Bldg 2 Cells 176 264 332 68 189%Bldg 3 Cells 176 264 245 -19 139%Total 528 704 749 45 142%
Stand Alone ASU 100 125 143 18 143%Total 100 125 143 18 143%
3424 4910 5599 689 164%
INF 1 35
CTC 6
Out to Hospital 8
3424 4910 5648 738 165%
* Capacity totals may not match Blueprint numbers due to incorrect formulas or a lack of rounding in the Blueprint numbers.
CENTRAL SERVICE
OUT-COUNT AREA
Off-Prison Grounds
GRAND TOTAL
CALIFORNIA SUBSTANCE ABUSE TREATMENT FACILITY - HOUSING PLAN
GRAND TOTAL
FACILITY G
ASU
FACILITY A
FACILITY B
FACILITY C
FACILITY D
FACILITY E
FACILITY F

Second Report on CDCR’s Progress Implementing the Blueprint Page 92 Office of the Inspector General State of California
APPENDIX B: HOUSING PLANS
HOUSING UNIT TYPE * DESIGN CAPACITY
* STAFFED CAPACITY
ACTUAL INMATE COUNT
REVIEWED BY OIG 07/30/13
Difference (Actual vs.
Staffed Capacity)
Overcrowding Rate (Based on
Design)
Dorm 1 Dorm 100 100 58 -42 58%Dorm 2 Dorm 100 100 49 -51 49%
Firehouse 8 8 6 -2 75%Total 208 208 113 -95 54%
Bldg 1 270 Cells 100 150 169 19 169%Bldg 2 270 Cells 100 150 176 26 176%Bldg 3 270 Cells 100 150 185 35 185%Bldg 4 270 Cells 100 150 173 23 173%Bldg 5 270 Cells 100 125 146 21 146%Total 500 725 849 124 170%
Bldg 1 270 Cells 100 150 180 30 180%Bldg 2 270 Cells 100 150 177 27 177%Bldg 3 270 Cells 100 150 180 30 180%Bldg 4 270 Cells 100 150 176 26 176%Bldg 5 270 Cells 100 150 168 18 168%Total 500 750 881 131 176%
Bldg 1 270 Cells 100 150 130 -20 130%Bldg 2 270 Cells 100 150 175 25 175%Bldg 3 270 Cells 100 150 174 24 174%Bldg 4 270 Cells 100 150 175 25 175%Bldg 5 270 Cells 100 150 179 29 179%Total 500 750 833 83 167%
Bldg 1 270 Cells 100 150 159 9 159%Bldg 2 270 Cells 100 150 155 5 155%Bldg 3 270 Cells 100 150 154 4 154%Bldg 4 270 Cells 100 150 157 7 157%Bldg 5 270 Cells 100 150 155 5 155%Total 500 750 780 30 156%
Ad Seg ASU 100 125 161 36 161%
2308 3308 3617 309 157%
INF Bldg 1 17
Out to Hospital 3
2308 3308 3637 329 158%
* Capacity totals may not match Blueprint numbers due to incorrect formulas or a lack of rounding in the Blueprint numbers.
Off-Prison Grounds
GRAND TOTAL
CENTRAL SERVICE
CALIPATRIA STATE PRISON - HOUSING PLAN
MSF
FACILITY A
FACILITY B
FACILITY C
FACILITY D
Stand Alone
GRAND TOTAL

Second Report on CDCR’s Progress Implementing the Blueprint Page 93 Office of the Inspector General State of California
APPENDIX B: HOUSING PLANS
HOUSING UNIT TYPE * DESIGN CAPACITY
* STAFFED CAPACITY
ACTUAL INMATE COUNT
REVIEWED BY OIG 08/06/13
Difference (Actual vs.
Staffed Capacity)
Overcrowding Rate (Based on
Design)
Dorm 1 E-Dorm 100 100 0 -100 0%Dorm 2 E-Dorm 100 100 72 -28 72%
Firehouse 8 8 7 -1 88%Total 208 208 79 -129 38%
Bldg 1 270 Cells 100 150 141 -9 141%Bldg 2 270 Cells 100 150 126 -24 126%Bldg 3 270 Cells 100 150 117 -33 117%Bldg 4 270 Cells 100 150 124 -26 124%Bldg 5 270 Cells 100 125 108 -17 108%Total 500 725 616 -109 123%
Bldg 1 270 Cells 100 150 154 4 154%Bldg 2 270 Cells 100 150 147 -3 147%Bldg 3 270 Cells 100 150 151 1 151%Bldg 4 270 Cells 100 150 170 20 170%Bldg 5 270 Cells 100 150 141 -9 141%Total 500 750 763 13 153%
Bldg 1 270 Cells 100 150 89 -61 89%Bldg 2 270 Cells 100 150 125 -25 125%Bldg 3 270 Cells 100 150 113 -37 113%Bldg 4 270 Cells 100 150 127 -23 127%Bldg 5 270 Cells 100 150 134 -16 134%Total 500 750 588 -162 118%
Bldg 1 270 Cells 100 150 142 -8 142%Bldg 2 270 Cells 100 150 148 -2 148%Bldg 3 270 Cells 100 150 151 1 151%Bldg 4 270 Cells 100 150 154 4 154%Bldg 5 270 Cells 100 150 150 0 150%Total 500 750 745 -5 149%
Ad Seg ASU 100 125 101 -24 101%
2308 3308 2892 -416 125%
Infirmary 1 10
Out to Hospital/Medical 2
2308 3308 2904 -404 126%
* Capacity totals may not match Blueprint numbers due to incorrect formulas or a lack of rounding in the Blueprint numbers.
CENTRAL SERVICE
GRAND TOTAL
Off-Prison Grounds
CENTINELA STATE PRISON - HOUSING PLAN
FACILITY D
GRAND TOTAL
STAND ALONE
MSF
FACILITY A
FACILITY B
FACILITY C

Second Report on CDCR’s Progress Implementing the Blueprint Page 94 Office of the Inspector General State of California
APPENDIX B: HOUSING PLANS
HOUSING UNIT TYPE * DESIGN CAPACITY
* STAFFED CAPACITY
ACTUAL INMATE COUNT
REVIEWED BY OIG 07/30/13
Difference (Actual vs.
Staffed Capacity)
Overcrowding Rate (Based on
Design)
Bldg 501 W Dorm 128 192 253 61 198%Bldg 502 W Dorm 128 192 256 64 200%Bldg 503 270 Cells 100 150 164 14 164%Bldg 504 270 Cells 33 41 54 13 164%Bldg 504 270 Cells 40 54 75 21 188%Bldg 504 270 Cells 17 17 0 -17 0%Bldg 504 270 Cells 10 10 0 -10 0%
Total 456 656 802 146 176%
Bldg 505 W Dorm 128 192 189 -3 148%Bldg 506 W Dorm 128 192 226 34 177%Bldg 507 W Dorm 128 192 237 45 185%Bldg 508 W Dorm 128 192 222 30 173%
Total 512 768 874 106 171%
Bldg 509 W Dorm 128 192 216 24 169%Bldg 510 W Dorm 128 192 231 39 180%Bldg 511 W Dorm 128 192 212 20 166%Bldg 512 W Dorm 128 192 228 36 178%
Total 512 768 887 119 173%
Bldg 513 W Dorm 128 192 200 8 156%Bldg 514 W Dorm 128 192 227 35 177%Bldg 515 W Dorm 128 192 237 45 185%Bldg 516 W Dorm 128 192 222 30 173%
Total 512 768 886 118 173%
Firehouse 12 12 10 -2 83%
2004 2972 3459 487 173%
Infirmary 1 25
Watch Office 11
Out to Hospital/Medical 2
2004 2972 3497 525 175%
* Capacity totals may not match Blueprint numbers due to incorrect formulas or a lack of rounding in the Blueprint numbers.
FACILITY D
CENTRAL CALIFORNIA WOMEN'S FACILITY - HOUSING PLAN
FACILITY A
FACILITY B
FACILITY C
FACILITY D
CENTRAL SERVICE
GRAND TOTAL
OUT-COUNT AREA
Off-Prison Grounds
GRAND TOTAL

Second Report on CDCR’s Progress Implementing the Blueprint Page 95 Office of the Inspector General State of California
APPENDIX B: HOUSING PLANS
HOUSING UNIT TYPE * DESIGN CAPACITY
* STAFFED CAPACITY
ACTUAL INMATE COUNT
REVIEWED BY OIG 07/28/13
Difference (Actual vs.
Staffed Capacity)
Overcrowding Rate (Based on
Design)
Bldg 1 E-Dorm 100 100 48 -52 48%Bldg 2 E-Dorm 100 100 49 -51 49%
Firehouse 8 8 8 0 100%Family Visiting 0 0
Total 208 208 105 -103 50%
Bldg 1 270 Dorm 130 195 226 31 174%Bldg 2 270 Dorm 130 195 221 26 170%ASU 270 Cells 100 125 72 -53 72%Total 360 515 519 4 144%
Bldg 3 270 Dorm 130 195 226 31 174%Bldg 4 270 Dorm 130 195 228 33 175%Bldg 5 270 Dorm 130 195 224 29 172%Total 390 585 678 93 174%
Bldg 6 270 Dorm 130 195 203 8 156%Bldg 7 270 Dorm 130 195 193 -2 148%Bldg 8 270 Dorm 130 195 199 4 153%Total 390 585 595 10 153%
Bldg 9 270 Dorm 130 195 186 -9 143%Bldg 10 270 Dorm 130 195 191 -4 147%Bldg 11 270 Dorm 130 195 179 -16 138%
Total 390 585 556 -29 143%
1738 2478 2453 -25 141%
Infirmary 1 7
Central Health 4Kitchen 132
Watch Office 4
Out to Hospital 2
1738 2478 2602 124 150%
* Capacity totals may not match Blueprint numbers due to incorrect formulas or a lack of rounding in the Blueprint numbers.
FACILITY D
CHUCKAWALLA VALLEY STATE PRISON - HOUSING PLAN
MSF
FACILITY A
FACILITY B
FACILITY C
CENTRAL SERVICE
OUT-COUNT AREA
GRAND TOTAL
Off-Prison Grounds
GRAND TOTAL

Second Report on CDCR’s Progress Implementing the Blueprint Page 96 Office of the Inspector General State of California
APPENDIX B: HOUSING PLANS
HOUSING UNIT TYPE * DESIGN CAPACITY
* STAFFED CAPACITY
ACTUAL INMATE COUNT
REVIEWED BY OIG 07/06/13
Difference (Actual vs.
Staffed Capacity)
Overcrowding Rate (Based on
Design)
Fremont E-Dorm 100 150 195 45 195%Lassen Cells 303 455 563 108 186%Rainier Cells 303 455 493 38 163%Total 706 1060 1251 191 177%
Shasta Cells 303 455 512 57 169%Toro E-Dorm 100 150 197 47 197%
Whitney Cells 303 455 474 19 156%Total 706 1060 1183 123 168%
B Wing Cells 127 191 210 19 165%C Wing Cells 127 191 195 4 154%D Wing Cells 127 191 193 2 152%E Wing Cells 127 191 185 -6 146%F Wing Cells 175 263 257 -6 147%G Wing Cells 175 263 314 51 179%
Inf 2 14 14O Wing Cells 144 144 62 -82 43%X Wing Cells 131 197 156 -41 119%Y Wing Cells 129 194 213 19 165%Z Wing Cells 132 198 214 16 162%Total 1394 2023 2013 -10 144%
Dorm 1Dorm 2 Dorm 100 150 197 47 197%Dorm 3 Dorm 80 120 123 3 154%Dorm 4 Dorm 80 120 123 3 154%Dorm 5 Dorm 80 120 123 3 154%Dorm 6 Dorm 80 120 122 2 153%Dorm 7 Dorm 80 120 122 2 153%
Firehouse 6 6 4 -2 67%Total 506 756 814 58 161%
3312 4899 5261 362 159%
1 Out to Hospital 2
3312 4899 5264 365 159%
* Capacity totals may not match Blueprint numbers due to incorrect formulas or a lack of rounding in the Blueprint numbers.
Out Count Area
GRAND TOTAL
CORRECTIONAL TRAINING FACILITY - HOUSING PLAN
GRAND TOTAL
FACILITY C - CTF - C
FACILITY A - CTF - N
FACILITY D - CTF - S
FACILITY B - CTF - N

Second Report on CDCR’s Progress Implementing the Blueprint Page 97 Office of the Inspector General State of California
APPENDIX B: HOUSING PLANS
HOUSING UNIT TYPE * DESIGN CAPACITY
* STAFFED CAPACITY
ACTUAL INMATE COUNT
REVIEWED BY OIG 07/22/13
Difference (Actual vs.
Staffed Capacity)
Overcrowding Rate (Based on
Design)
B Dorm Dorm 18 18D Dorm Dorm 18 18E Dorm Dorm 18 18G Dorm E-Dorm 100 100
Firehouse 10 10 5 -5 50%Total 164 164 97 -67 59%
East Hall Cells 150 225 297 72 198%West Hall Cells 149 224 291 67 195%
Total 299 449 588 139 197%
C Cells 132 198 228 30 173%D Cells 132 198 248 50 188%E Cells 132 198 253 55 192%F Cells 132 198 255 57 193%G Cells 132 198 256 58 194%H Cells 132 198 247 49 187%J Cells 130 195 237 42 182%K Cells 143 143 138 -5 97%
L 1/2 Cells 96 120 119 -1 124%L 3 Cells 49 74 74 0 151%
Total 1210 1720 2055 335 170%
1673 2333 2740 407 164%
FAM 1 2 INF 2 22
Dairy 6
Out to Hospital 2
1673 2333 2772 439 166%
* Capacity totals may not match Blueprint numbers due to incorrect formulas or a lack of rounding in the Blueprint numbers.
CENTRAL SERVICE
Off-Prison Grounds
GRAND TOTAL
OUT-COUNT AREA
DEUEL VOCATIONAL INSTITUTION - HOUSING PLAN
GRAND TOTAL
Dorms
HALL
WINGS
92 -62 60%

Second Report on CDCR’s Progress Implementing the Blueprint Page 98 Office of the Inspector General State of California
APPENDIX B: HOUSING PLANS
HOUSING UNIT TYPE * DESIGN CAPACITY
* STAFFED CAPACITY
ACTUAL INMATE COUNT
REVIEWED BY OIG 08/13/13
Difference (Actual vs.
Staffed Capacity)
Overcrowding Rate (Based on
Design)
Ranch Dorm 265 265 176 -89 66%Total 265 265 176 -89 66%
Tier 1 Cells 124 186 182 -4 147%Tier 2 Cells 127 191 182 -9 143%Tier 3 Cells 127 191 200 9 157%Tier 4 Cells 127 191 149 -42 117%Tier 5 Cells 127 191 123 -68 97%Total 632 950 836 -114 132%
Tier 1 Cells 62 93 91 -2 147%Tier 2 Cells 61 92 95 3 156%Tier 3 Cells 62 93 99 6 160%Tier 4 Cells 62 93 96 3 155%Tier 5 Cells 62 93 95 2 153%Total 309 464 476 12 154%
Tier 1 Cells 79 119 122 3 154%Tier 2 Cells 80 120 121 1 151%Tier 3 Cells 80 120 141 21 176%Tier 4 Cells 80 120 140 20 175%Tier 5 Cells 80 120 124 4 155%Total 399 599 648 49 162%
Tier 1 Cells 46 46 37 -9 80%Tier 2 Cells 46 46 80 34 174%Tier 3 Cells 46 46 48 2 104%Total 138 138 165 27 120%
Tier 1 Cells 157 236 284 48 181%Tier 2 Cells 164 246 161 -85 98%Total 321 482 445 -37 139%
2064 2898 2746 -152 133%
FAM 1 2
Custody 2Out to Hospital 2
2064 2898 2752 -146 133%
* Capacity totals may not match Blueprint numbers due to incorrect formulas or a lack of rounding in the Blueprint numbers.
CENTRAL SERVICE
Off-Prison Grounds
GRAND TOTAL
FOLSOM STATE PRISON - HOUSING PLAN
BUILDING 2
BUILDING 3
BUILDING 4
GRAND TOTAL
BUILDING 5
MSF
FACILITY ABUILDING 1

Second Report on CDCR’s Progress Implementing the Blueprint Page 99 Office of the Inspector General State of California
APPENDIX B: HOUSING PLANS
HOUSING UNIT TYPE * DESIGN CAPACITY
* STAFFED CAPACITY
ACTUAL INMATE COUNT
REVIEWED BY OIG 08/13/13
Difference (Actual vs.
Staffed Capacity)
Overcrowding Rate (Based on
Design)
Dorm 1 (A) Dorm 201 201 82 -119 41%Dorm 2 (B) Dorm 202 202 157 -45 78%
Total 403 403 239 -164 59%
403 403 239 -164 59%
* Capacity totals may not match Blueprint numbers due to incorrect formulas or a lack of rounding in the Blueprint numbers.
GRAND TOTAL
FACILITY B
FOLSOM WOMEN'S FACILITY - HOUSING PLAN
** = Folsom Women's Facility was scheduled to activate on January 13, 2013, per the Emergency Institution Activation Schedule (IAS) dated January 2, 2013. ( Was listed as Facility A in Blueprint but is listed as Facility B on counts.)

Second Report on CDCR’s Progress Implementing the Blueprint Page 100 Office of the Inspector General State of California
APPENDIX B: HOUSING PLANS
HOUSING UNIT TYPE * DESIGN CAPACITY
* STAFFED CAPACITY
ACTUAL INMATE COUNT
REVIEWED BY OIG 07/14/13
Difference (Actual vs.
Staffed Capacity)
Overcrowding Rate (Based on
Design)
Dorm 1 E-Dorm 100 100Dorm 2 E-Dorm 100 100Total 200 200 135 -65 68%
Bldg A1 270 Cells 100 150 152 2 152%Bldg A2 270 Cells 100 150 155 5 155%Bldg A3 270 Cells 100 150 140 -10 140%Bldg A4 270 Cells 100 150 149 -1 149%Bldg A5 270 Cells 100 150 143 -7 143%
Total 500 750 739 -11 148%
Bldg B1 270 Cells 100 150 168 18 168%Bldg B2 270 Cells 100 150 167 17 167%Bldg B3 270 Cells 100 150 159 9 159%Bldg B4 270 Cells 100 150 173 23 173%Bldg B5 270 Cells 100 150 175 25 175%
Total 500 750 842 92 168%
Bldg C1 180 Cells 64 96 96 0 150%Bldg C2 180 Cells 64 96 89 -7 139%Bldg C3 180 Cells 64 96 84 -12 131%Bldg C4 180 Cells 64 96 85 -11 133%Bldg C5 180 Cells 64 96 68 -28 106%Bldg C6 180 Cells 64 96 83 -13 130%Bldg C7 180 Cells 64 96 72 -24 113%Bldg C8 180 Cells 64 96 81 -15 127%
Total 512 768 658 -110 129%
Bldg D1 180 Cells 64 96 104 8 163%Bldg D2 180 Cells 64 96 106 10 166%Bldg D3 180 Cells 64 96 95 -1 148%Bldg D4 180 Cells 64 96 98 2 153%Bldg D5 180 Cells 64 96 109 13 170%Bldg D6 180 Cells 64 96 43 -53 67%Bldg D7 180 Cells 64 80 82 2 128%Bldg D8 180 Cells 64 80 79 -1 123%
Total 512 736 716 -20 140%
Facility ZStand Alone
ASU 100 125 146 21 146%
Total 100 125 146 21 146%
2324 3329 3236 -93 139%
INF 1 30
Coyote Cafe 4
2324 3329 3270 -59 141%
* Capacity totals may not match Blueprint numbers due to incorrect formulas or a lack of rounding in the Blueprint numbers.
OUT-COUNT AREA
GRAND TOTAL
CENTRAL SERVICE
HIGH DESERT STATE PRISON - HOUSING PLAN
FACILITY D
GRAND TOTAL
ASU
MSF
FACILITY A
FACILITY B
FACILITY C
135 -65 68%

Second Report on CDCR’s Progress Implementing the Blueprint Page 101 Office of the Inspector General State of California
APPENDIX B: HOUSING PLANS
HOUSING UNIT TYPE * DESIGN CAPACITY
* STAFFED CAPACITY
ACTUAL INMATE COUNT
REVIEWED BY OIG 07/23/13
Difference (Actual vs.
Staffed Capacity)
Overcrowding Rate (Based on
Design)
Bldg 1 E-Dorm 100 100 47 -53 47%Bldg 2 E-Dorm 100 100 59 -41 59%Total 200 200 106 -94 53%
Bldg 1 270 Cells 100 150 163 13 163%Bldg 2 270 Cells 100 150 162 12 162%Bldg 3 270 Cells 100 150 160 10 160%Bldg 4 270 Cells 100 150 162 12 162%Bldg 5 270 Cells 100 125 80 -45 80%Total 500 725 727 2 145%
Bldg 1 270 Cells 100 150 163 13 163%Bldg 2 270 Cells 100 150 156 6 156%Bldg 3 270 Cells 100 150 160 10 160%Bldg 4 270 Cells 100 150 155 5 155%Bldg 5 270 Cells 100 150 151 1 151%Total 500 750 785 35 157%
Bldg 1 270 Cells 100 150 95 -55 95%Bldg 2 270 Cells 100 150 169 19 169%Bldg 3 270 Cells 100 150 170 20 170%Bldg 4 270 Cells 100 150 169 19 169%Bldg 5 270 Cells 100 150 170 20 170%Total 500 750 773 23 155%
Bldg 1 270 Cells 100 150 151 1 151%Bldg 2 270 Cells 100 150 155 5 155%Bldg 3 270 Cells 100 150 154 4 154%Bldg 4 270 Cells 100 150 156 6 156%Bldg 5 270 Cells 100 150 163 13 163%Total 500 750 779 29 156%
2200 3175 3170 -5 144%
INF 1 11
2200 3175 3181 6 145%
* Capacity totals may not match Blueprint numbers due to incorrect formulas or a lack of rounding in the Blueprint numbers.
CENTRAL SERVICE
GRAND TOTAL
GRAND TOTAL
FACILITY D
IRONWOOD STATE PRISON - HOUSING PLAN
MSF
FACILITY A
FACILITY B
FACILITY C

Second Report on CDCR’s Progress Implementing the Blueprint Page 102 Office of the Inspector General State of California
APPENDIX B: HOUSING PLANS
HOUSING UNIT TYPE * DESIGN CAPACITY
* STAFFED CAPACITY
ACTUAL INMATE COUNT
REVIEWED BY OIG 07/23/13
Difference (Actual vs.
Staffed Capacity)
Overcrowding Rate (Based on
Design)
Dorm 1 E-Dorm 100 100Dorm 2 E-Dorm 100 100Total 200 200 110 -90 55%
Bldg 1 180 Cells 64 96 89 -7 139%Bldg 2 180 Cells 64 96 102 6 159%Bldg 3 180 Cells 64 96 102 6 159%Bldg 4 180 Cells 64 96 95 -1 148%Bldg 5 180 Cells 64 96 97 1 152%Bldg 6 180 Cells 64 96 100 4 156%Bldg 7 180 Cells 64 96 97 1 152%Bldg 8 180 Cells 64 96 95 -1 148%Total 512 768 777 9 152%
Bldg 1 180 Cells 64 80 82 2 128%Bldg 2 180 Cells 64 96 89 -7 139%Bldg 3 180 Cells 64 96 100 4 156%Bldg 4 180 Cells 64 96 101 5 158%Bldg 5 180 Cells 64 96 105 9 164%Bldg 6 180 Cells 64 96 104 8 163%Bldg 7 180 Cells 64 96 109 13 170%Bldg 8 180 Cells 64 96 109 13 170%Total 512 752 799 47 156%
Bldg 1 180 Cells 64 96 113 17 177%Bldg 2 180 Cells 64 96 119 23 186%Bldg 3 180 Cells 64 96 118 22 184%Bldg 4 180 Cells 64 96 120 24 188%Bldg 5 180 Cells 64 96 120 24 188%Bldg 6 180 Cells 64 96 118 22 184%Bldg 7 180 Cells 64 96 117 21 183%Bldg 8 180 Cells 64 96 94 -2 147%Total 512 768 919 151 179%
Bldg 1 180 Cells 64 96 109 13 170%Bldg 2 180 Cells 64 96 119 23 186%Bldg 3 180 Cells 64 96 126 30 197%Bldg 4 180 Cells 64 96 123 27 192%Bldg 5 180 Cells 64 96 123 27 192%Bldg 6 180 Cells 64 96 115 19 180%Bldg 7 180 Cells 64 96 93 -3 145%Bldg 8 180 Cells 64 96 56 -40 88%Total 512 768 864 96 169%
Z01 ASU 100 125 129 4 129%Z02 ASU 100 125 94 -31 94%
Total 200 250 223 -27 112%
2448 3506 3692 186 151%
INF 1 20
Out to Hospital 5
2448 3506 3717 211 152%
* Capacity totals may not match Blueprint numbers due to incorrect formulas or a lack of rounding in the Blueprint numbers.
CENTRAL SERVICE
Off-Prison Grounds
GRAND TOTAL
110
KERN VALLEY STATE PRISON - HOUSING PLAN
FACILITY D
GRAND TOTAL
ASU - STAND ALONE
MSF
FACILITY A
FACILITY B
FACILITY C
-90 55%

Second Report on CDCR’s Progress Implementing the Blueprint Page 103 Office of the Inspector General State of California
APPENDIX B: HOUSING PLANS
HOUSING UNIT TYPE * DESIGN CAPACITY
* STAFFED CAPACITY
ACTUAL INMATE COUNT
REVIEWED BY OIG 07/14/13
Difference (Actual vs.
Staffed Capacity)
Overcrowding Rate (Based on
Design)
Dorm #1 Dorm 96 96 87 -9 91%Dorm #2 Dorm 96 96 99 3 103%
Firehouse 8 8 3 -5 38%Total 200 200 189 -11 95%
Bldg 1 270 Cells 100 150 158 8 158%Bldg 2 270 Cells 100 150 181 31 181%Bldg 3 270 Cells 100 150 189 39 189%Bldg 4 270 Cells 100 150 174 24 174%Bldg 5 270 Cells 100 150 150 0 150%Total 500 750 852 102 170%
Bldg 6 270 Cells 100 150 180 30 180%Bldg 7 270 Cells 100 150 198 48 198%Bldg 8 270 Cells 100 150 200 50 200%Bldg 9 270 Cells 100 150 195 45 195%
Bldg 10 270 Cells 100 150 194 44 194%Total 500 750 967 217 193%
Bldg 11 270 Cells 100 150 199 49 199%Bldg 12 270 Cells 100 125 110 -15 110%
Bldg 13-1 270 Cells 50 50 78 28 156%Bldg 13-2 270 Cells 50 75 89 14 178%Bldg 14 270 Cells 100 150 200 50 200%Bldg 15 270 Cells 100 150 200 50 200%
Total 500 700 876 176 175%
1700 2400 2884 484 170%
INF 1 10
Dining, PIA Meat Cutting, etc. 4
Out to Hospital/Medical 1
1700 2400 2899 499 171%
* Capacity totals may not match Blueprint numbers due to incorrect formulas or a lack of rounding in the Blueprint numbers.
CENTRAL SERVICE
OUT-COUNT AREA
Off-Prison Grounds
GRAND TOTAL
GRAND TOTAL
MULE CREEK STATE PRISON - HOUSING PLAN
MSF 1
FACILITY A
FACILITY B
FACILITY C

Second Report on CDCR’s Progress Implementing the Blueprint Page 104 Office of the Inspector General State of California
APPENDIX B: HOUSING PLANS
HOUSING UNIT TYPE * DESIGN CAPACITY
* STAFFED CAPACITY
ACTUAL INMATE COUNT
REVIEWED BY OIG 08/03/13
Difference (Actual vs.
Staffed Capacity)
Overcrowding Rate (Based on
Design)
Bldg 1 E-Dorm 100 100 158
Bldg 2 E-Dorm 100 100 0Firehouse 10 10 5 -5 50%
Total 210 210 163 -47 78%
Bldg 1 270 Cells 100 150 151 1 151%Bldg 2 270 Cells 100 150 161 11 161%Bldg 3 270 Cells 100 150 167 17 167%Bldg 4 270 Cells 100 150 118 -32 118%Bldg 5 270 Cells 100 150 167 17 167%Total 500 750 764 14 153%
Bldg 1 Wingnut Cells 100 150 196 46 196%Bldg 2 Wingnut Cells 100 150 193 43 193%Bldg 3 Wingnut Cells 100 150 193 43 193%Bldg 4 Wingnut Cells 100 150 179 29 179%Bldg 5 Wingnut Cells 100 150 194 44 194%Bldg 6 Wingnut Cells 100 150 194 44 194%Total 600 900 1149 249 192%
Dorm 1 Wingnut Dorm 146 219 288 69 197%Dorm 2 Wingnut Dorm 146 219 276 57 189%Dorm 3 Wingnut Dorm 146 219 291 72 199%Dorm 4 Wingnut Dorm 146 219 293 74 201%Dorm E E-Dorm 100 150 199 49 199%Dorm W E-Dorm 100 150 200 50 200%
Total 784 1176 1547 371 197%
Bldg 1 Wingnut Cells 100 150 190 40 190%Bldg 2 Wingnut Cells 100 150 191 41 191%Bldg 3 Wingnut Cells 100 150 178 28 178%Bldg 4 Wingnut Cells 100 150 187 37 187%Bldg 5 Wingnut Cells 100 150 157 7 157%Bldg 6 Wingnut Cells 100 125 151 26 151%Total 600 875 1054 179 176%
2694 3911 4677 766 174%
INF 1 14
Dining, Central Kitchen, etc. 17
Out to Hospital 4
2694 3911 4712 801 175%
* Capacity totals may not match Blueprint numbers due to incorrect formulas or a lack of rounding in the Blueprint numbers.
CENTRAL SERVICE
OUT-COUNT AREA
Off-Prison Grounds
GRAND TOTAL
GRAND TOTAL
FACILITY D
-42 79%
NORTH KERN STATE PRISON - HOUSING PLAN
MSF
FACILITY A
FACILITY B
FACILITY C

Second Report on CDCR’s Progress Implementing the Blueprint Page 105 Office of the Inspector General State of California
APPENDIX B: HOUSING PLANS
HOUSING UNIT TYPE * DESIGN CAPACITY
* STAFFED CAPACITY
ACTUAL INMATE COUNT
REVIEWED BY OIG 07/23/13
Difference (Actual vs.
Staffed Capacity)
Overcrowding Rate (Based on
Design)
Bldg 1 Dorm 96 96 98 2 102%Bldg 2 Dorm 96 96 81 -15 84%
Firehouse 8 8 8 0 100%Total 200 200 187 -13 94%
Bldg 1 180 Cells 64 80 61 -19 95%Bldg 2 180 Cells 64 96 70 -26 109%Bldg 3 180 Cells 64 80 0 -80 0%Bldg 4 180 Cells 64 96 116 20 181%Bldg 5 180 Cells 64 96 118 22 184%Bldg 6 180 Cells 64 96 114 18 178%Bldg 7 180 Cells 64 96 114 18 178%Bldg 8 180 Cells 64 96 119 23 186%Total 512 736 712 -24 139%
Bldg 1 180 Cells 64 64 55 -9 86%Bldg 2 180 Cells 64 64 54 -10 84%Bldg 3 180 Cells 64 96 69 -27 108%Bldg 4 180 Cells 64 96 0 -96 0%Bldg 5 180 Cells 64 96 114 18 178%Bldg 6 180 Cells 64 96 121 25 189%Bldg 7 180 Cells 64 96 89 -7 139%Bldg 8 180 Cells 64 96 116 20 181%Total 512 704 618 -86 121%
Bldg 1 SHU 48 58 55 -3 115%Bldg 2 SHU 48 58 54 -4 113%Bldg 3 SHU 48 58 55 -3 115%Bldg 4 SHU 48 58 53 -5 110%Bldg 5 SHU 48 58 53 -5 110%Bldg 6 SHU 48 58 53 -5 110%Bldg 7 SHU 48 58 52 -6 108%Bldg 8 SHU 48 58 52 -6 108%Bldg 9 SHU 48 58 58 0 121%
Bldg 10 SHU 48 58 53 -5 110%Bldg 11 SHU 48 58 55 -3 115%Bldg 12 SHU 48 58 50 -8 104%
Total 576 696 643 -53 112%
Bldg 1 SHU 48 58 48 -10 100%Bldg 2 SHU 48 58 47 -11 98%Bldg 3 SHU 48 58 51 -7 106%Bldg 4 SHU 48 58 46 -12 96%Bldg 5 SHU 48 58 57 -1 119%Bldg 6 SHU 48 58 54 -4 113%Bldg 7 SHU 48 58 56 -2 117%Bldg 8 SHU 48 58 56 -2 117%Bldg 9 SHU 48 58 56 -2 117%
Bldg 10 SHU 48 58 58 0 121%Total 480 580 529 -51 110%
Stand Alone ASU 100 125 117 -8 117%Total 100 125 117 -8 117%
2380 3041 2806 -235 118%
INF 1 18
2380 3041 2824 -217 119%
* Capacity totals may not match Blueprint numbers due to incorrect formulas or a lack of rounding in the Blueprint numbers.
CENTRAL SERVICE
GRAND TOTAL
PELICAN BAY STATE PRISON - HOUSING PLAN
FACILITY D
GRAND TOTAL
ASU
MSF
FACILITY A
FACILITY B
FACILITY C

Second Report on CDCR’s Progress Implementing the Blueprint Page 106 Office of the Inspector General State of California
APPENDIX B: HOUSING PLANS
HOUSING UNIT TYPE * DESIGN CAPACITY
* STAFFED CAPACITY
ACTUAL INMATE COUNT
REVIEWED BY OIG 07/22/13
Difference (Actual vs.
Staffed Capacity)
Overcrowding Rate (Based on
Design)
Bldg 1 E-Dorm 100 100 68 -32 68%Bldg 2 E-Dorm 100 100 0 -100 0%
Firehouse 8 8 6 -2 75%Total 208 208 74 -134 36%
Bldg 1 270 Cells 100 150 125 -25 125%Bldg 2 270 Cells 100 150 155 5 155%Bldg 3 270 Cells 100 150 149 -1 149%Bldg 4 270 Cells 100 150 160 10 160%Bldg 5 270 Cells 100 150 163 13 163%Total 500 750 752 2 150%
Bldg 1 270 Cells 100 150 153 3 153%Bldg 2 270 Cells 100 150 157 7 157%Bldg 3 270 Cells 100 150 153 3 153%Bldg 4 270 Cells 100 150 162 12 162%Bldg 5 270 Cells 100 150 166 16 166%Total 500 750 791 41 158%
Bldg 1 270 Cells 100 150 165 15 165%Bldg 2 270 Cells 100 150 157 7 157%Bldg 3 270 Cells 100 150 153 3 153%Bldg 4 270 Cells 100 150 141 -9 141%Bldg 5 270 Cells 100 150 118 -32 118%Total 500 750 734 -16 147%
Bldg 1 270 Cells 100 150 198 48 198%Bldg 2 270 Cells 100 150 196 46 196%Bldg 3 270 Cells 100 150 194 44 194%Bldg 4 270 Cells 100 125 148 23 148%Bldg 5 270 Cells 100 150 187 37 187%Total 500 725 923 198 185%
Stand Alone ASU 100 125 152 27 152%Total 100 125 152 27 152%
2308 3308 3426 118 148%
INF 1 14 FAM 1 2
TTA, visiting, watch office 6
Out to Hospital 3
2308 3308 3451 143 150%
* Capacity totals may not match Blueprint numbers due to incorrect formulas or a lack of rounding in the Blueprint numbers.
CENTRAL SERVICE
OUT-COUNT AREA
Off-Prison Grounds
GRAND TOTAL
PLEASANT VALLEY STATE PRISON - HOUSING PLAN
FACILITY D
GRAND TOTAL
ASU
MSF
FACILITY A
FACILITY B
FACILITY C

Second Report on CDCR’s Progress Implementing the Blueprint Page 107 Office of the Inspector General State of California
APPENDIX B: HOUSING PLANS
HOUSING UNIT TYPE * DESIGN CAPACITY
* STAFFED CAPACITY
ACTUAL INMATE COUNT
REVIEWED BY OIG 08/04/13
Difference (Actual vs.
Staffed Capacity)
Overcrowding Rate (Based on
Design)
Bldg 21 Dorm 96 96 59 -37 61%Bldg 22 Dorm 96 96 59 -37 61%
Fire House 8 8 6 -2 75%Total 200 200 124 -76 62%
Bldg 1 270 Cells 100 150 161 11 161%Bldg 2 270 Cells 100 150 156 6 156%Bldg 3 270 Cells 100 150 165 15 165%Bldg 4 270 Cells 100 150 154 4 154%Bldg 5 270 Cells 100 150 163 13 163%Total 500 750 799 49 160%
Unit 06-1 270 Cells 50 63 53 -10 106%Unit 06-2 270 Cells 50 50 58 8 116%Unit 07 270 Cells 100 125 135 10 135%Unit 08 270 Cells 100 150 169 19 169%Unit 09 270 Cells 100 150 82 -68 82%Unit 10 270 Cells 100 150 179 29 179%Total 500 688 676 -12 135%
Unit 11 270 Cells 100 150 170 20 170%Unit 12 270 Cells 100 150 172 22 172%Unit 13 270 Cells 100 150 163 13 163%Unit 14 270 Cells 100 150 178 28 178%Unit 15 270 Cells 100 150 150 0 150%Total 500 750 833 83 167%
Bldg 16 270 Cells 100 150 160 10 160%Bldg 17 270 Cells 100 150 169 19 169%Bldg 18 270 Cells 100 150 181 31 181%Bldg 19 270 Cells 100 150 169 19 169%Bldg 20 270 Cells 100 150 174 24 174%
Total 500 750 853 103 171%
2200 3138 3285 147 149%
INF 1 + FAM 1 28
Watch Office 2 Infirmary (TTA) 2
Out to Hospital 8
2200 3138 3325 187 151%
* Capacity totals may not match Blueprint numbers due to incorrect formulas or a lack of rounding in the Blueprint numbers.
CENTRAL SERVICE
OUT-COUNT AREA
Off-Prison Grounds
GRAND TOTAL
GRAND TOTAL
FACILITY D
RICHARD J. DONOVAN CORRECTIONAL FACILITY - HOUSING PLAN
MSF
FACILITY A
FACILITY B
FACILITY C

Second Report on CDCR’s Progress Implementing the Blueprint Page 108 Office of the Inspector General State of California
APPENDIX B: HOUSING PLANS
HOUSING UNIT TYPE * DESIGN CAPACITY
* STAFFED CAPACITY
ACTUAL INMATE COUNT
REVIEWED BY OIG 07/14/13
Difference (Actual vs.
Staffed Capacity)
Overcrowding Rate (Based on
Design)
Bldg 1 Dorm 100 100 74 -26 74%Bldg 2 Dorm 100 100 76 -24 76%Total 200 200 150 -50 75%
Bldg A1 270 Cells 100 150 189 39 189%Bldg A2 270 Cells 100 150 185 35 185%Bldg A3 270 Cells 100 150 190 40 190%Bldg A4 270 Cells 100 150 181 31 181%Bldg A5 270 Cells 100 150 160 10 160%
Total 500 750 905 155 181%
Bldg B1 270 Cells 100 150 167 17 167%Bldg B2 270 Cells 100 150 170 20 170%Bldg B3 270 Cells 100 150 160 10 160%Bldg B4 270 Cells 100 150 169 19 169%Bldg B5 270 Cells 100 150 175 25 175%
Total 500 750 841 91 168%
Bldg C1 180 Cells 64 96 92 -4 144%Bldg C2 180 Cells 64 96 77 -19 120%Bldg C3 180 Cells 64 96 96 0 150%Bldg C4 180 Cells 64 96 79 -17 123%Bldg C5 180 Cells 64 64 57 -7 89%Bldg C6 180 Cells 64 64 56 -8 88%Bldg C7 180 Cells 64 96 100 4 156%Bldg C8 180 Cells 64 96 95 -1 148%
Total 512 704 652 -52 127%
Bldg D1 180 Cells 64 64 69 5 108%Bldg D2 180 Cells 64 80 75 -5 117%Bldg D3 180 Cells 64 96 84 -12 131%Bldg D4 180 Cells 64 96 93 -3 145%Bldg D5 180 Cells 64 96 58 -38 91%Bldg D6 180 Cells 64 96 53 -43 83%Bldg D7 180 Cells 64 96 107 11 167%Bldg D8 180 Cells 64 80 84 4 131%
Total 512 704 623 -81 122%
I-1 64 64 45 -19 70%I-2 64 64 71 7 111%
Total 128 128 116 -12 91%
Stand Alone ASU 100 125 145 20 145%Total 100 125 145 20 145%
2452 3361 3432 71 140%
2Central Service - CTC -1 20
CTC, BPH, Other 49
Out to Hospital 8
2452 3361 3511 150 143%
* Capacity totals may not match Blueprint numbers due to incorrect formulas or a lack of rounding in the Blueprint numbers.
Incoming Area
OUT-COUNT AREA
Off-Prison Grounds
GRAND TOTAL
SALINAS VALLEY STATE PRISON - HOUSING PLAN
FACILITY C
FACILITY D
ICF
GRAND TOTAL
ASU
MSF
FACILITY A
FACILITY B

Second Report on CDCR’s Progress Implementing the Blueprint Page 109 Office of the Inspector General State of California
APPENDIX B: HOUSING PLANS
HOUSING UNIT TYPE * DESIGN CAPACITY
* STAFFED CAPACITY
ACTUAL INMATE COUNT
REVIEWED BY OIG 07/30/13
Difference (Actual vs.
Staffed Capacity)
Overcrowding Rate (Based on
Design)
Section A Dorm 192 288 358 70 186%Section B Dorm 224 336 433 97 193%Section C Dorm 192 288 373 85 194%Firehouse 10 15 7 -8 70%
Total 618 927 1171 244 189%
Section D Dorm 192 288 366 78 191%Section E Dorm 224 336 390 54 174%Section F Dorm 192 288 307 19 160%
Total 608 912 1063 151 175%
Bldg 1 270 Cells 100 150 183 33 183%Bldg 2 270 Cells 100 125 136 11 136%Bldg 3 270 Cells 100 150 150 0 150%Bldg 4 270 Cells 100 150 178 28 178%Bldg 5 270 Cells 100 150 192 42 192%Total 500 725 839 114 168%
01-Vallecito Camps 100 100 91 -9 91%04-Francisquito Camps 80 80 75 -5 94%05-Miramonte Camps 80 80 74 -6 93%10-Mountain Home Camps 100 100 90 -10 90%11-Acton Camps 80 80 76 -4 95%15-Pilot Rock Camps 80 80 78 -2 98%16-Holton Camps 100 100 82 -18 82%19-Julius Klein Camps 120 120 99 -21 83%21-McCain Valley Camps 100 100 97 -3 97%26-Owens Valley Camps 120 120 103 -17 86%28-Prado Camps 80 80 82 2 103%30-Baseline Camps 120 120 107 -13 89%33-Growlersburg Camps 120 120 108 -12 90%35-Oak Glen Camps 160 160 133 -27 83%36-Bautista Camps 120 120 101 -19 84%38-Gabilan Camps 120 120 115 -5 96%39-Mt. Bullion Camps 100 100 94 -6 94%41-Fenner Canyon Camps 120 120 114 -6 95%42-La Cima Camps 80 80 71 -9 89%
Total 1980 1980 1790 -190 90%
3706 4544 4863 319 131%
HOS 3
3706 4544 4866 322 131%
* Capacity totals may not match Blueprint numbers due to incorrect formulas or a lack of rounding in the Blueprint numbers.** Fire camp capacity totals do not match Blueprint numbers since a FY 2013/14 BCP approved the fire camps to be restored to prior levels.
GRAND TOTAL
SIERRA CONSERVATION CENTER - HOUSING PLAN
GRAND TOTAL
FACILITY A
FACILITY B
FACILITY C
** Fire Camps
OUT-COUNT AREA

Second Report on CDCR’s Progress Implementing the Blueprint Page 110 Office of the Inspector General State of California
APPENDIX B: HOUSING PLANS
HOUSING UNIT TYPE * DESIGN CAPACITY
* STAFFED CAPACITY
ACTUAL INMATE COUNT
REVIEWED BY OIG 07/28/13
Difference (Actual vs.
Staffed Capacity)
Overcrowding Rate (Based on
Design)
Bldg 1 Cross Top 128 192 0 -192 0%Bldg 2 Cross Top 128 192 222 30 173%Bldg 3 270 Cells 100 150 162 12 162%Bldg 4 270 Cells 88 110 58 -52 66%Total 444 644 442 -202 100%
Bldg 1 Cross Top 128 192 212 20 166%Bldg 2 Cross Top 128 192 225 33 176%Bldg 3 Cross Top 128 192 226 34 177%Bldg 4 Cross Top 128 192 218 26 170%Total 512 768 881 113 172%
Bldg 1 Cross Top 128 192 231 39 180%Bldg 2 Cross Top 128 192 226 34 177%Bldg 3 Cross Top 128 192 224 32 175%Bldg 4 Cross Top 128 192 218 26 170%Total 512 768 899 131 176%
Bldg 1 Cross Top 128 192 234 42 183%Bldg 2 Cross Top 128 192 208 16 163%Bldg 3 Cross Top 128 192 219 27 171%Bldg 4 Cross Top 128 192 222 30 173%Total 512 768 883 115 172%
1980 2948 3105 157 157%
INF 1 20FAM 1 3
Watch Office 1
Out to Hospital 7
1980 2948 3136 188 158%
* Capacity totals may not match Blueprint numbers due to incorrect formulas or a lack of rounding in the Blueprint numbers.
CENTRAL SERVICE
OUT-COUNT AREA
Off-Prison Grounds
GRAND TOTAL
VALLEY STATE PRISON - HOUSING PLAN
GRAND TOTAL
FACILITY A
FACILITY B
FACILITY C
FACILITY D
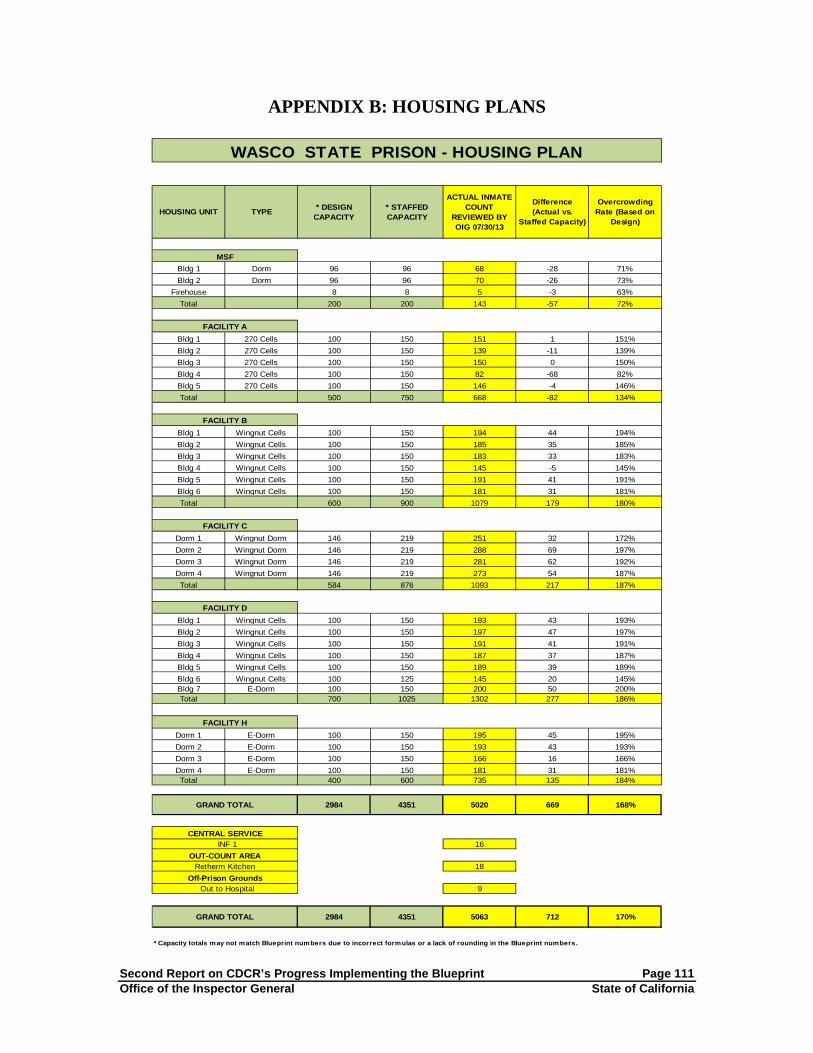
Second Report on CDCR’s Progress Implementing the Blueprint Page 111 Office of the Inspector General State of California
APPENDIX B: HOUSING PLANS
HOUSING UNIT TYPE * DESIGN CAPACITY
* STAFFED CAPACITY
ACTUAL INMATE COUNT
REVIEWED BY OIG 07/30/13
Difference (Actual vs.
Staffed Capacity)
Overcrowding Rate (Based on
Design)
Bldg 1 Dorm 96 96 68 -28 71%Bldg 2 Dorm 96 96 70 -26 73%
Firehouse 8 8 5 -3 63%Total 200 200 143 -57 72%
Bldg 1 270 Cells 100 150 151 1 151%Bldg 2 270 Cells 100 150 139 -11 139%Bldg 3 270 Cells 100 150 150 0 150%Bldg 4 270 Cells 100 150 82 -68 82%Bldg 5 270 Cells 100 150 146 -4 146%Total 500 750 668 -82 134%
Bldg 1 Wingnut Cells 100 150 194 44 194%Bldg 2 Wingnut Cells 100 150 185 35 185%Bldg 3 Wingnut Cells 100 150 183 33 183%Bldg 4 Wingnut Cells 100 150 145 -5 145%Bldg 5 Wingnut Cells 100 150 191 41 191%Bldg 6 Wingnut Cells 100 150 181 31 181%Total 600 900 1079 179 180%
Dorm 1 Wingnut Dorm 146 219 251 32 172%Dorm 2 Wingnut Dorm 146 219 288 69 197%Dorm 3 Wingnut Dorm 146 219 281 62 192%Dorm 4 Wingnut Dorm 146 219 273 54 187%Total 584 876 1093 217 187%
Bldg 1 Wingnut Cells 100 150 193 43 193%Bldg 2 Wingnut Cells 100 150 197 47 197%Bldg 3 Wingnut Cells 100 150 191 41 191%Bldg 4 Wingnut Cells 100 150 187 37 187%Bldg 5 Wingnut Cells 100 150 189 39 189%Bldg 6 Wingnut Cells 100 125 145 20 145%Bldg 7 E-Dorm 100 150 200 50 200%Total 700 1025 1302 277 186%
Dorm 1 E-Dorm 100 150 195 45 195%Dorm 2 E-Dorm 100 150 193 43 193%Dorm 3 E-Dorm 100 150 166 16 166%Dorm 4 E-Dorm 100 150 181 31 181%Total 400 600 735 135 184%
2984 4351 5020 669 168%
INF 1 16
Retherm Kitchen 18
Out to Hospital 9
2984 4351 5063 712 170%
* Capacity totals may not match Blueprint numbers due to incorrect formulas or a lack of rounding in the Blueprint numbers.
CENTRAL SERVICE
OUT-COUNT AREA
Off-Prison Grounds
GRAND TOTAL
WASCO STATE PRISON - HOUSING PLAN
FACILITY D
GRAND TOTAL
FACILITY H
MSF
FACILITY A
FACILITY B
FACILITY C
Second Report on CDCR’s Progress Implementing the Blueprint Page 112 Office of the Inspector General State of California
APPENDIX C – PROGRAMMING PLANS
The following pages display the information we summarized after assessing whether the department has implemented the rehabilitation programs scheduled to be underway in FY 2012/13 as identified in Appendix B of the Blueprint. The OIG performed the fieldwork to assess the operational status of each program at each institution. The information displayed in the following page identifies the statewide operational status of the rehabilitation programs in summary format for each type of program. An individual page for each prison is provided after the summary page. The first columns identify the numbers in terms of teacher positions and the numbers in terms of student slots as they were identified in the initial Blueprint. As described earlier, the numbers were allowed to be changed as long as they met the total departmental numbers. The next set of columns displays the numbers as identified in the final version of the Blueprint. Then we show the results of our fieldwork identifying the number of programs that were actually fully operational when we performed the fieldwork. The last set of columns identifies the differences between the number of courses that were supposed to be operational (and related available slots) and the number of courses that we actually found to be operational during our site visit. The fieldwork performed in this exercise was conducted from July 2013 through August 2013. Therefore, the numbers may have changed since that time. Additionally, some of the detail of the specific courses may have changed from institution to institution, but the departmental totals in terms of scheduled courses still match the original Blueprint numbers.

Second Report on CDCR’s Progress Implementing the Blueprint Page 113 Office of the Inspector General State of California
APPENDIX C: PROGRAMMING PLANS
STATEWIDE SUMMARY TOTALS - REHABILITATION PROGRAMS
Initial Blueprint Final Blueprint Actuals Differences
Academic EducationProposed
Staff (Version 1)
Budgeted Capacity
(Version 1)
Proposed Staff
(Version 5)
Budgeted Capacity
(Version 5)
Actual Staff (Programs)
Actual Student Capacity
Differences Differences
General Population 315 17,010 308 15,469 280 14,633 -28 -836Alternative Programming 15 1,620 13 834 14 799 1 -35Voluntary Educ. Program 169 20,280 170 20,400 161 18,696 -9 -1,704
TOTALS 499 38,910 491 36,703 455 34,128 -36 -2,575
Career Technical Education
Proposed Staff
(Version 1)
Budgeted Capacity
(Version 1)
Proposed Staff
(Version 5)
Budgeted Capacity
(Version 5)
Actual Staff (Programs)
Actual Student Capacity
Differences Differences
Auto Mechanics 17 459 17 459 10 270 -7 -189Auto Repair 13 351 13 351 13 351 0 0Building Maintenance 19 513 19 513 16 432 -3 -81Carpentry 15 405 16 432 10 270 -6 -162Computer Literacy * 17 864 15 810 14 756 -1 -54Cosmetology 3 81 4 108 3 81 -1 -27Electric Work 10 270 12 324 9 243 -3 -81Electronics 29 783 30 810 22 594 -8 -216HVAC 10 270 10 270 9 216 -1 -54Machine Shop 4 108 4 108 3 81 -1 -27Masonry 11 297 8 216 8 216 0 0Office Technologies 41 1,107 41 1,107 38 1,026 -3 -81Plumbing 9 243 9 243 7 189 -2 -54Sheet Metal 2 54 2 54 0 0 -2 -54Small Engine Repair 7 189 7 189 6 162 -1 -27Welding 17 459 17 459 17 459 0 0TBD 0 0 0 0 0 0 0 0
TOTALS 224 6,453 224 6,453 185 5,346 -39 -1,107
Contract Treatment Programs
Student Capacity
(/Program) (Version 1)
Student Capacity (Annual)
(Version 1)
Student Capacity
(/Program) (Version 5)
Student Capacity (Annual)
(Version 5)
Actual Students in
Program
Annual Student Capacity
(Projected)
Differences Differences
Substance Abuse 1,676 3,898 1,656 3,850 1,137 2,728 -519 -1,122Cognitive-BehavioralLifer Program
TOTALS 1,676 3,898 1,656 3,850 1,137 2,728 -519 -1,122
Employment ProgramsProgram
Slots (Version 1)
Annual Served
(Version 1)
Program Slots
(Version 5)
Annual Served
(Version 5)
Inmates Served (Actual)
Annual Served
(Projected)Differences Differences
Transitions Program 240 2,916 240 2,916 0 0 -240 -2,916Identification (ID) Project 0 8,459 0 8,459 0 0 0 -8,459
TOTALS 240 11,375 240 11,375 0 0 -240 -11,375
* The computer literacy slots were adjusted to account for a morning and afternoon session. The slots were reported in the Blueprint as
only available once per day so the adjustment doubled the slot amount for that class.
FY 12-13 (Version 1) FY 12-13 (Version 5) July - August 2013 (Actuals - Final)
(None - commences 2013/14)(None - commences 2013/14)

Second Report on CDCR’s Progress Implementing the Blueprint Page 114 Office of the Inspector General State of California
APPENDIX C: PROGRAMMING PLANS
Initial Blueprint Final Blueprint Actuals Differences
Academic EducationProposed
Staff (Version 1)
Budgeted Capacity
(Version 1)
Proposed Staff
(Version 5)
Budgeted Capacity
(Version 5)
Actual Staff (Programs)
Actual Student Capacity
Differences Differences
General Population 19 1026 19 1026 15 778 -4 -248Alternative Programming 0 0 0 0 0 0 0 0Voluntary Educ. Program 6 720 6 720 5 600 -1 -120
TOTALS 25 1746 25 1746 20 1378 -5 -368
Career Technical Education
Proposed Staff
(Version 1)
Budgeted Capacity
(Version 1)
Proposed Staff
(Version 5)
Budgeted Capacity
(Version 5)
Actual Staff (Programs)
Actual Student Capacity
Differences Differences
Auto Mechanics 1 27 1 27 1 27 0 0Auto Repair 1 27 1 27 1 27 0 0Building Maintenance 1 27 1 27 1 27 0 0Carpentry 0 0 0 0 0 0 0 0Computer Literacy 0 0 0 0 0 0 0 0Cosmetology 0 0 0 0 0 0 0 0Electric Work 1 27 1 27 1 27 0 0Electronics 2 54 2 54 2 54 0 0HVAC 1 27 1 27 1 27 0 0Machine Shop 0 0 0 0 0 0 0 0Masonry 0 0 1 27 1 27 0 0Office Technologies 4 108 4 108 3 81 -1 -27Plumbing 1 27 1 27 1 27 0 0Sheet Metal 0 0 0 0 0 0 0 0Small Engine Repair 1 27 1 27 0 0 -1 -27Welding 1 27 1 27 1 27 0 0TBD 0 0 0 0 0 0 0 0
TOTALS 14 378 15 405 13 351 -2 -54
Contract Treatment Programs
Student Capacity
(/Program) (Version 1)
Student Capacity (Annual)
(Version 1)
Student Capacity
(/Program) (Version 5)
Student Capacity (Annual)
(Version 5)
Actual Students in
Program
Annual Student Capacity
(Projected)
Differences Differences
Substance Abuse 156 374 156 374 156 374 0 0Cognitive-Behavioral (None - commences 2013/14)Lifer Program (None - commences 2013/14)
TOTALS 156 374 156 374 156 374 0 0
Employment ProgramsProgram
Slots (Version 1)
Annual Served
(Version 1)
Program Slots
(Version 5)
Annual Served
(Version 5)
Inmates Served (Actual)
Annual Served
(Projected)Differences Differences
Transitions Program 20 228 20 228 0 0 -20 -228Identification (ID) Project 1007 1007 0 0 0 -1007
TOTALS 20 1235 20 1235 0 0 -20 -1235
AVENAL STATE PRISON (ASP)
ASP is designated as a Re-Entry Hub.
FY 12-13 (Version 5)
Programs at this institution are to include Academic Education, Career Technical Education, Substance Abuse Treatment, Cognitive-Behavioral Programs (including criminal thinking, anger management, and family programming), Employment Training, and a cognitive behavioral based program for life-term inmates. The tables below illustrate the planned and actual staffing and student capacities by program area:
FY 12-13 (Version 1) July - August 2013 (Actuals - Final)

Second Report on CDCR’s Progress Implementing the Blueprint Page 115 Office of the Inspector General State of California
APPENDIX C: PROGRAMMING PLANS
Initial Blueprint Final Blueprint Actuals Differences
Academic EducationProposed
Staff (Version 1)
Budgeted Capacity
(Version 1)
Proposed Staff
(Version 5)
Budgeted Capacity
(Version 5)
Actual Staff (Programs)
Actual Student Capacity
Differences Differences
General Population 8 432 8 195 8 424 0 229Alternative Programming 1 108 1 108 0 0 -1 -108Voluntary Educ. Program 5 600 5 600 3 360 -2 -240
TOTALS 14 1140 14 903 11 784 -3 -119
Career Technical Education
Proposed Staff
(Version 1)
Budgeted Capacity
(Version 1)
Proposed Staff
(Version 5)
Budgeted Capacity
(Version 5)
Actual Staff (Programs)
Actual Student Capacity
Differences Differences
Auto Mechanics 1 27 1 27 1 27 0 0Auto Repair 1 27 1 27 1 27 0 0Building Maintenance 1 27 1 27 1 27 0 0Carpentry 0 0 0 0 0 0 0 0Computer Literacy 1 27 0 0 0 0 0 0Cosmetology 0 0 0 0 0 0 0 0Electric Work 1 27 1 27 0 0 -1 -27Electronics 1 27 1 27 1 27 0 0HVAC 1 27 1 27 1 27 0 0Machine Shop 0 0 0 0 0 0 0 0Masonry 0 0 0 0 0 0 0 0Office Technologies 1 27 1 27 1 27 0 0Plumbing 0 0 0 0 0 0 0 0Sheet Metal 0 0 0 0 0 0 0 0Small Engine Repair 0 0 0 0 0 0 0 0Welding 1 27 1 27 1 27 0 0TBD 0 0 0 0 0 0 0
TOTALS 9 243 8 216 7 189 -1 -27
CCC is designated as a Standard Program Site.
CALIFORNIA CORRECTIONAL CENTER (CCC)
Programs at this institution are to include Academic Education and Career Technical Education. The tables below illustrate the planned and actual staffing and student capacities by program area:
(Actuals - Final)FY 12-13 (Version 1) FY 12-13 (Version 5) July - August 2013

Second Report on CDCR’s Progress Implementing the Blueprint Page 116 Office of the Inspector General State of California
APPENDIX C: PROGRAMMING PLANS
Initial Blueprint Final Blueprint Actuals Differences
Academic EducationProposed
Staff (Version 1)
Budgeted Capacity
(Version 1)
Proposed Staff
(Version 5)
Budgeted Capacity
(Version 5)
Actual Staff (Programs)
Actual Student Capacity
Differences Differences
General Population 13 702 10 512 10 512 0 0Alternative Programming 0 0 0 0 0 0 0 0Voluntary Educ. Program 7 840 8 960 8 960 0 0
TOTALS 20 1542 18 1472 18 1472 0 0
Career Technical Education
Proposed Staff
(Version 1)
Budgeted Capacity
(Version 1)
Proposed Staff
(Version 5)
Budgeted Capacity
(Version 5)
Actual Staff (Programs)
Actual Student Capacity
Differences Differences
Auto Mechanics 2 54 2 54 1 27 -1 -27Auto Repair 1 27 1 27 1 27 0 0Building Maintenance 1 27 1 27 1 27 0 0Carpentry 1 27 1 27 0 0 -1 -27Computer Literacy 1 27 0 0 0 0 0 0Cosmetology 0 0 0 0 0 0 0 0Electric Work 0 0 0 0 0 0 0 0Electronics 1 27 2 54 2 54 0 0HVAC 1 27 1 27 1 27 0 0Machine Shop 0 0 0 0 0 0 0 0Masonry 0 0 0 0 0 0 0 0Office Technologies 2 54 2 54 2 54 0 0Plumbing 0 0 0 0 0 0 0 0Sheet Metal 0 0 0 0 0 0 0 0Small Engine Repair 0 0 0 0 0 0 0 0Welding 1 27 1 27 1 27 0 0TBD 0 0 0 0 0 0 0 0
TOTALS 11 297 11 297 9 243 -2 -54
Contract Treatment Programs
Student Capacity
(/Program) (Version 1)
Student Capacity (Annual)
(Version 1)
Student Capacity
(/Program) (Version 5)
Student Capacity (Annual)
(Version 5)
Actual Students in
Program
Annual Student Capacity
(Projected)
Differences Differences
Substance Abuse 138 331 138 331 126 302 -12 -29Cognitive-Behavioral (None - commences 2013/14)Lifer Program (None - commences 2013/14)
TOTALS 138 331 138 331 126 302 -12 -29
Employment ProgramsProgram
Slots (Version 1)
Annual Served
(Version 1)
Program Slots
(Version 5)
Annual Served
(Version 5)
Inmates Served (Actual)
Annual Served
(Projected)Differences Differences
Transitions Program 20 228 20 228 0 0 -20 -228Identification (ID) Project 0 831 831 0 0 0 -831
TOTALS 20 1059 20 1059 0 0 -20 -1059
CALIFORNIA CORRECTIONAL INSTITUTION (CCI)
Programs at this institution are to include Academic Education and Career Technical Education. The tables below illustrate the planned and actual staffing and student capacities by program area (programs have been minimally updated since the change in designation):
CCI was designated as a Standard Program Site on 12/4/12 although it was originally designated as a Re-Entry Hub.
FY 12-13 (Version 1) FY 12-13 (Version 5) July - August 2013 (Actuals - Final)

Second Report on CDCR’s Progress Implementing the Blueprint Page 117 Office of the Inspector General State of California
APPENDIX C: PROGRAMMING PLANS
Initial Blueprint Final Blueprint Actuals Differences
Academic EducationProposed
Staff (Version 1)
Budgeted Capacity
(Version 1)
Proposed Staff
(Version 5)
Budgeted Capacity
(Version 5)
Actual Staff (Programs)
Actual Student Capacity
Differences Differences
General Population 2 108 2 108 0 0 -2 -108Alternative Programming 0 0 0 0 0 0 0 0Voluntary Educ. Program 1 120 1 120 1 120 0 0
TOTALS 3 228 3 228 1 120 -2 -108
Career Technical Education
Proposed Staff
(Version 1)
Budgeted Capacity
(Version 1)
Proposed Staff
(Version 5)
Budgeted Capacity
(Version 5)
Actual Staff (Programs)
Actual Student Capacity
Differences Differences
Auto Mechanics 0 0 0 0 0 0 0 0Auto Repair 0 0 0 0 0 0 0 0Building Maintenance 0 0 0 0 0 0 0 0Carpentry 0 0 0 0 0 0 0 0Computer Literacy 0 0 0 0 0 0 0 0Cosmetology 0 0 0 0 0 0 0 0Electric Work 0 0 0 0 0 0 0 0Electronics 0 0 0 0 0 0 0 0HVAC 0 0 0 0 0 0 0 0Machine Shop 0 0 0 0 0 0 0 0Masonry 0 0 0 0 0 0 0 0Office Technologies 0 0 0 0 0 0 0 0Plumbing 0 0 0 0 0 0 0 0Sheet Metal 0 0 0 0 0 0 0 0Small Engine Repair 0 0 0 0 0 0 0 0Welding 0 0 0 0 0 0 0 0TBD 0 0 0 0 0 0 0 0
TOTALS 0 0 0 0 0 0 0 0
CALIFORNIA HEALTH CARE FACILITY (CHCF)
Programs at this institution are to include Academic Education and Career Technical Education. The tables below illustrate the planned and actual staffing and student capacities by program area:
(Actuals - Final)
CHCF is designated as a Standard Program Site. It was recently activated in July 2013.
FY 12-13 (Version 1) FY 12-13 (Version 5) July - August 2013

Second Report on CDCR’s Progress Implementing the Blueprint Page 118 Office of the Inspector General State of California
APPENDIX C: PROGRAMMING PLANS
Initial Blueprint Final Blueprint Actuals Differences
Academic EducationProposed
Staff (Version 1)
Budgeted Capacity
(Version 1)
Proposed Staff
(Version 5)
Budgeted Capacity
(Version 5)
Actual Staff (Programs)
Actual Student Capacity
Differences Differences
General Population 9 486 9 408 8 420 -1 12Alternative Programming 0 0 0 0 0 0 0 0Voluntary Educ. Program 7 840 7 840 6 720 -1 -120
TOTALS 16 1326 16 1248 14 1140 -2 -108
Career Technical Education
Proposed Staff
(Version 1)
Budgeted Capacity
(Version 1)
Proposed Staff
(Version 5)
Budgeted Capacity
(Version 5)
Actual Staff (Programs)
Actual Student Capacity
Differences Differences
Auto Mechanics 0 0 0 0 0 0 0 0Auto Repair 0 0 0 0 0 0 0 0Building Maintenance 2 54 2 54 2 54 0 0Carpentry 2 54 2 54 2 54 0 0Computer Literacy 1 54 1 54 1 54 0 0Cosmetology 0 0 0 0 0 0 0 0Electric Work 0 0 1 27 0 0 -1 -27Electronics 1 27 1 27 0 0 -1 -27HVAC 0 0 0 0 0 0 0 0Machine Shop 0 0 0 0 0 0 0 0Masonry 1 27 1 27 1 27 0 0Office Technologies 0 0 0 0 0 0 0 0Plumbing 1 27 1 27 1 27 0 0Sheet Metal 0 0 0 0 0 0 0 0Small Engine Repair 0 0 0 0 0 0 0 0Welding 1 27 1 27 1 27 0 0TBD 0 0 0 0 0 0 0 0
TOTALS 9 270 10 297 8 243 -2 -54
Contract Treatment Programs
Student Capacity
(/Program) (Version 1)
Student Capacity (Annual)
(Version 1)
Student Capacity
(/Program) (Version 5)
Student Capacity (Annual)
(Version 5)
Actual Students in
Program
Annual Student Capacity
(Projected)
Differences Differences
Substance Abuse 156 374 156 374 134 322 -22 -52Cognitive-Behavioral Lifer Program (None - commences 2013/14)
TOTALS 156 374 156 374 134 322 -22 -52
Employment ProgramsProgram
Slots (Version 1)
Annual Served
(Version 1)
Program Slots
(Version 5)
Annual Served
(Version 5)
Inmates Served (Actual)
Annual Served
(Projected)Differences Differences
Transitions Program 20 288 20 288 0 0 -20 -288Identification (ID) Project 0 1101 0 1101 0 0 0 -1101
TOTALS 20 1389 20 1389 0 0 -20 -1389
CIM is designated as a Re-Entry Hub.
CALIFORNIA INSTITUTION FOR MEN (CIM)
Programs at this institution are to include Academic Education, Career Technical Education, Substance Abuse Treatment, Cognitive-Behavioral Programs (including criminal thinking, anger management, and family programming), Employment Training, and a cognitive behavioral based program for life-term inmates. The tables below illustrate the planned and actual staffing and student capacities by program area:
(Actuals - Final)FY 12-13 (Version 1) FY 12-13 (Version 5) July - August 2013
(None - commences 2013/14)

Second Report on CDCR’s Progress Implementing the Blueprint Page 119 Office of the Inspector General State of California
APPENDIX C: PROGRAMMING PLANS
Initial Blueprint Final Blueprint Actuals Differences
Academic EducationProposed
Staff (Version 1)
Budgeted Capacity
(Version 1)
Proposed Staff
(Version 5)
Budgeted Capacity
(Version 5)
Actual Staff (Programs)
Actual Student Capacity
Differences Differences
General Population 6 324 6 324 6 324 0 0Alternative Programming 0 0 0 0 0 0 0 0Voluntary Educ. Program 3 360 3 360 3 360 0 0
TOTALS 9 684 9 684 9 684 0 0
Career Technical Education
Proposed Staff
(Version 1)
Budgeted Capacity
(Version 1)
Proposed Staff
(Version 5)
Budgeted Capacity
(Version 5)
Actual Staff (Programs)
Actual Student Capacity
Differences Differences
Auto Mechanics 0 0 0 0 0 0 0 0Auto Repair 0 0 0 0 0 0 0 0Building Maintenance 1 27 1 27 1 27 0 0Carpentry 0 0 0 0 0 0 0 0Computer Literacy 0 0 0 0 0 0 0 0Cosmetology 1 27 1 27 1 27 0 0Electric Work 0 0 0 0 0 0 0 0Electronics 0 0 1 27 1 27 0 0HVAC 0 0 0 0 0 0 0 0Machine Shop 0 0 0 0 0 0 0 0Masonry 0 0 0 0 0 0 0 0Office Technologies 2 54 2 54 2 54 0 0Plumbing 0 0 0 0 0 0 0 0Sheet Metal 0 0 0 0 0 0 0 0Small Engine Repair 0 0 0 0 0 0 0 0Welding 0 0 0 0 0 0 0 0TBD 0 0 0 0 0 0 0 0
TOTALS 4 108 5 135 5 135 0 0
Contract Treatment Programs
Student Capacity
(/Program) (Version 1)
Student Capacity (Annual)
(Version 1)
Student Capacity
(/Program) (Version 5)
Student Capacity (Annual)
(Version 5)
Actual Students in
Program
Annual Student Capacity
(Projected)
Differences Differences
Substance Abuse 138 331 138 331 76 182 -62 -149Cognitive-Behavioral (None - commences 2013/14)Lifer Program (None - commences 2013/14)
TOTALS 138 331 138 331 76 182 -62 -149
Employment ProgramsProgram
Slots (Version 1)
Annual Served
(Version 1)
Program Slots
(Version 5)
Annual Served
(Version 5)
Inmates Served (Actual)
Annual Served
(Projected)Differences Differences
Transitions Program 20 288 20 288 0 0 -20 -288Identification (ID) Project 0 249 0 249 0 0 0 -249
TOTALS 20 537 20 537 0 0 -20 -537
CALIFORNIA INSTITUTION FOR WOMEN (CIW)
Programs at this institution are to include Academic Education, Career Technical Education, Substance Abuse Treatment, Cognitive-Behavioral Programs (including criminal thinking, anger management, and family programming), Employment Training, and a cognitive behavioral based program for life-term inmates. The tables below illustrate the planned and actual staffing and student capacities by program area:
FY 12-13 (Version 1) FY 12-13 (Version 5) July - August 2013
CIW is designated as a Re-Entry Hub.
(Actuals - Final)

Second Report on CDCR’s Progress Implementing the Blueprint Page 120 Office of the Inspector General State of California
APPENDIX C: PROGRAMMING PLANS
Initial Blueprint Final Blueprint Actuals Differences
Academic EducationProposed
Staff (Version 1)
Budgeted Capacity
(Version 1)
Proposed Staff
(Version 5)
Budgeted Capacity
(Version 5)
Actual Staff (Programs)
Actual Student Capacity
Differences Differences
General Population 5 270 5 270 5 270 0 0Alternative Programming 0 0 0 0 0 0 0 0Voluntary Educ. Program 3 360 4 480 4 480 0 0
TOTALS 8 630 9 750 9 750 0 0
Career Technical Education
Proposed Staff
(Version 1)
Budgeted Capacity
(Version 1)
Proposed Staff
(Version 5)
Budgeted Capacity
(Version 5)
Actual Staff (Programs)
Actual Student Capacity
Differences Differences
Auto Mechanics 0 0 0 0 0 0 0 0Auto Repair 0 0 0 0 0 0 0 0Building Maintenance 0 0 0 0 0 0 0 0Carpentry 0 0 0 0 0 0 0 0Computer Literacy 1 54 0 0 0 0 0 0Cosmetology 0 0 0 0 0 0 0 0Electric Work 0 0 0 0 0 0 0 0Electronics 2 54 1 27 1 27 0 0HVAC 0 0 0 0 0 0 0 0Machine Shop 0 0 0 0 0 0 0 0Masonry 0 0 0 0 0 0 0 0Office Technologies 1 27 1 27 1 27 0 0Plumbing 0 0 0 0 0 0 0 0Sheet Metal 0 0 0 0 0 0 0 0Small Engine Repair 0 0 0 0 0 0 0 0Welding 0 0 0 0 0 0 0 0TBD 0 0 0 0 0 0 0 0
TOTALS 4 135 2 54 2 54 0 0
CMF is designated as a Standard Program Site.
CALIFORNIA MEDICAL FACILITY (CMF)
Programs at this institution are to include Academic Education and Career Technical Education. The tables below illustrate the planned and actual staffing and student capacities by program area:
(Actuals - Final)FY 12-13 (Version 1) FY 12-13 (Version 5) July - August 2013

Second Report on CDCR’s Progress Implementing the Blueprint Page 121 Office of the Inspector General State of California
APPENDIX C: PROGRAMMING PLANS
Initial Blueprint Final Blueprint Actuals Differences
Academic EducationProposed
Staff (Version 1)
Budgeted Capacity
(Version 1)
Proposed Staff
(Version 5)
Budgeted Capacity
(Version 5)
Actual Staff (Programs)
Actual Student Capacity
Differences Differences
General Population 16 864 14 756 14 685 0 -71Alternative Programming 0 0 1 48 1 31 0 -17Voluntary Educ. Program 8 960 8 960 8 960 0 0
TOTALS 24 1824 23 1764 23 1676 0 -88
Career Technical Education
Proposed Staff
(Version 1)
Budgeted Capacity
(Version 1)
Proposed Staff
(Version 5)
Budgeted Capacity
(Version 5)
Actual Staff (Programs)
Actual Student Capacity
Differences Differences
Auto Mechanics 1 27 1 27 0 0 -1 -27Auto Repair 1 27 1 27 1 27 0 0Building Maintenance 1 27 1 27 1 27 0 0Carpentry 0 0 1 27 0 0 -1 -27Computer Literacy 0 0 0 0 0 0 0 0Cosmetology 0 0 0 0 0 0 0 0Electric Work 0 0 0 0 0 0 0 0Electronics 1 27 1 27 0 0 -1 -27HVAC 0 0 0 0 0 0 0 0Machine Shop 1 27 1 27 0 0 -1 -27Masonry 0 0 0 0 0 0 0 0Office Technologies 2 54 2 54 1 27 -1 -27Plumbing 0 0 0 0 0 0 0 0Sheet Metal 0 0 0 0 0 0 0 0Small Engine Repair 0 0 0 0 0 0 0 0Welding 1 27 1 27 1 27 0 0TBD 0 0 0 0 0 0 0 0
TOTALS 8 216 9 243 4 108 -5 -135
Contract Treatment Programs
Student Capacity
(/Program) (Version 1)
Student Capacity (Annual)
(Version 1)
Student Capacity
(/Program) (Version 5)
Student Capacity (Annual)
(Version 5)
Actual Students in
Program
Annual Student Capacity
(Projected)
Differences Differences
Substance Abuse 120 288 120 288 117 281 -3 -7Cognitive-Behavioral (None - commences 2013/14)Lifer Program (None - commences 2013/14)
TOTALS 120 288 120 288 117 281 -3 -7
Employment ProgramsProgram
Slots (Version 1)
Annual Served
(Version 1)
Program Slots
(Version 5)
Annual Served
(Version 5)
Inmates Served (Actual)
Annual Served
(Projected)Differences Differences
Transitions Program 20 228 20 228 0 0 -20 -228Identification (ID) Project 0 871 0 871 0 0 0 -871
TOTALS 20 1099 20 1099 0 0 -20 -1099
CMC is designated as a Re-Entry Hub.
CALIFORNIA MEN'S COLONY (CMC)
Programs at this institution are to include Academic Education, Career Technical Education, Substance Abuse Treatment, Cognitive-Behavioral Programs (including criminal thinking, anger management, and family programming), Employment Training, and a cognitive behavioral based program for life-term inmates. The tables below illustrate the planned and actual staffing and student capacities by program area:
(Actuals - Final)FY 12-13 (Version 1) FY 12-13 (Version 5) July - August 2013

Second Report on CDCR’s Progress Implementing the Blueprint Page 122 Office of the Inspector General State of California
APPENDIX C: PROGRAMMING PLANS
Initial Blueprint Final Blueprint Actuals Differences
Academic EducationProposed
Staff (Version 1)
Budgeted Capacity
(Version 1)
Proposed Staff
(Version 5)
Budgeted Capacity
(Version 5)
Actual Staff (Programs)
Actual Student Capacity
Differences Differences
General Population 14 756 10 540 11 594 1 54Alternative Programming 0 0 0 0 0 0 0 0Voluntary Educ. Program 6 720 4 480 4 480 0 0
TOTALS 20 1476 14 1020 15 1074 1 54
Career Technical Education
Proposed Staff
(Version 1)
Budgeted Capacity
(Version 1)
Proposed Staff
(Version 5)
Budgeted Capacity
(Version 5)
Actual Staff (Programs)
Actual Student Capacity
Differences Differences
Auto Mechanics 2 54 2 54 1 27 -1 -27Auto Repair 0 0 0 0 0 0 0 0Building Maintenance 1 27 0 0 0 0 0 0Carpentry 1 27 1 27 1 27 0 0Computer Literacy 0 0 0 0 1 54 1 54Cosmetology 0 0 0 0 0 0 0 0Electric Work 1 27 1 27 1 27 0 0Electronics 2 54 1 27 1 27 0 0HVAC 1 27 1 27 1 27 0 0Machine Shop 0 0 0 0 0 0 0 0Masonry 1 27 0 0 0 0 0 0Office Technologies 2 54 2 54 2 54 0 0Plumbing 0 0 1 27 1 27 0 0Sheet Metal 0 0 0 0 0 0 0 0Small Engine Repair 1 27 0 0 0 0 0 0Welding 0 0 0 0 0 0 0 0TBD 0 0 0 0 0 0 0 0
TOTALS 12 324 9 243 9 270 0 27
Contract Treatment Programs
Student Capacity
(/Program) (Version 1)
Student Capacity (Annual)
(Version 1)
Student Capacity
(/Program) (Version 5)
Student Capacity (Annual)
(Version 5)
Actual Students in
Program
Annual Student Capacity
(Projected)
Differences Differences
Substance Abuse 140 336 140 336 96 230 -44 -106Cognitive-Behavioral (None - commences 2013/14)Lifer Program (None - commences 2013/14)
TOTALS 140 336 140 336 96 230 -44 -106
Employment ProgramsProgram
Slots (Version 1)
Annual Served
(Version 1)
Program Slots
(Version 5)
Annual Served
(Version 5)
Inmates Served (Actual)
Annual Served
(Projected)Differences Differences
Transitions Program * 20 228 20 228 0 0 -20 -228Identification (ID) Project 0 1104 0 1104 0 0 0 -1104
TOTALS 20 1332 20 1332 0 0 -20 -1332* The slot numbers for the transitions programs as reported in the Blueprint were transposed between the capacity slots and the annual slots so we switched them to be recorded appropriately between the two columns.
CRC is designated as a Re-Entry Hub.
CALIFORNIA REHABILITATION CENTER (CRC)
Programs at this institution are to include Academic Education, Career Technical Education, Substance Abuse Treatment, Cognitive-Behavioral Programs (including criminal thinking, anger management, and family programming), Employment Training, and a cognitive behavioral based program for life-term inmates. The tables below illustrate the planned and actual staffing and student capacities by program area:
(Actuals - Final)FY 12-13 (Version 1) FY 12-13 (Version 5) July - August 2013

Second Report on CDCR’s Progress Implementing the Blueprint Page 123 Office of the Inspector General State of California
APPENDIX C: PROGRAMMING PLANS
Initial Blueprint Final Blueprint Actuals Differences
Academic EducationProposed
Staff (Version 1)
Budgeted Capacity
(Version 1)
Proposed Staff
(Version 5)
Budgeted Capacity
(Version 5)
Actual Staff (Programs)
Actual Student Capacity
Differences Differences
General Population 10 540 11 555 9 486 -2 -69Alternative Programming 3 324 3 162 3 162 0 0Voluntary Educ. Program 4 480 4 480 4 480 0 0
TOTALS 17 1344 18 1197 16 1128 -2 -69
Career Technical Education
Proposed Staff
(Version 1)
Budgeted Capacity
(Version 1)
Proposed Staff
(Version 5)
Budgeted Capacity
(Version 5)
Actual Staff (Programs)
Actual Student Capacity
Differences Differences
Auto Mechanics 0 0 0 0 0 0 0 0Auto Repair 0 0 0 0 0 0 0 0Building Maintenance 0 0 0 0 0 0 0 0Carpentry 0 0 0 0 0 0 0 0Computer Literacy 0 0 0 0 0 0 0 0Cosmetology 0 0 0 0 0 0 0 0Electric Work 0 0 0 0 0 0 0 0Electronics 1 27 1 27 1 27 0 0HVAC 0 0 0 0 0 0 0 0Machine Shop 1 27 1 27 1 27 0 0Masonry 0 0 0 0 0 0 0 0Office Technologies 2 54 2 54 2 54 0 0Plumbing 0 0 0 0 0 0 0 0Sheet Metal 1 27 1 27 0 0 -1 -27Small Engine Repair 0 0 0 0 0 0 0 0Welding 0 0 0 0 1 27 1 27TBD 0 0 0 0 0 0 0 0
TOTALS 5 135 5 135 5 135 0 0
(Actuals - Final)FY 12-13 (Version 1) FY 12-13 (Version 5) July - August 2013
COR is designated as a Standard Program Site.
CALIFORNIA STATE PRISON, CORCORAN (COR)
Programs at this institution are to include Academic Education and Career Technical Education. The tables below illustrate the planned and actual staffing and student capacities by program area:

Second Report on CDCR’s Progress Implementing the Blueprint Page 124 Office of the Inspector General State of California
APPENDIX C: PROGRAMMING PLANS
Initial Blueprint Final Blueprint Actuals Differences
Academic EducationProposed
Staff (Version 1)
Budgeted Capacity
(Version 1)
Proposed Staff
(Version 5)
Budgeted Capacity
(Version 5)
Actual Staff (Programs)
Actual Student Capacity
Differences Differences
General Population 8 432 8 378 7 378 -1 0Alternative Programming 0 0 0 0 0 0 0 0Voluntary Educ. Program 5 600 5 600 5 600 0 0
TOTALS 13 1032 13 978 12 978 -1 0
Career Technical Education
Proposed Staff
(Version 1)
Budgeted Capacity
(Version 1)
Proposed Staff
(Version 5)
Budgeted Capacity
(Version 5)
Actual Staff (Programs)
Actual Student Capacity
Differences Differences
Auto Mechanics 0 0 0 0 0 0 0 0Auto Repair 0 0 0 0 0 0 0 0Building Maintenance 0 0 0 0 0 0 0 0Carpentry 1 27 1 27 0 0 -1 -27Computer Literacy 0 0 1 54 1 54 0 0Cosmetology 0 0 0 0 0 0 0 0Electric Work 0 0 1 27 0 0 -1 -27Electronics 1 27 1 27 1 27 0 0HVAC 0 0 0 0 0 0 0 0Machine Shop 0 0 0 0 0 0 0 0Masonry 0 0 0 0 0 0 0 0Office Technologies 1 27 1 27 0 0 -1 -27Plumbing 1 27 1 27 1 27 0 0Sheet Metal 0 0 0 0 0 0 0 0Small Engine Repair 0 0 0 0 0 0 0 0Welding 0 0 0 0 0 0 0 0TBD 0 0 0 0 0 0 0
TOTALS 4 108 6 189 3 108 -3 -81
Contract Treatment Programs
Student Capacity
(/Program) (Version 1)
Student Capacity (Annual)
(Version 1)
Student Capacity
(/Program) (Version 5)
Student Capacity (Annual)
(Version 5)
Actual Students in
Program
Annual Student Capacity
(Projected)
Differences Differences
Substance Abuse 0 0 0 0 0 0 0 0TOTALS 0 0 0 0 0 0 0 0
(Actuals - Final)FY 12-13 (Version 1) FY 12-13 (Version 5) July - August 2013
CALIFORNIA STATE PRISON, LOS ANGELES COUNTY (LAC)
Programs at this institution are to include Academic Education, Career Technical Education, Substance Abuse Treatment, Cognitive-Behavioral Programs (including criminal thinking, anger management, and family programming), Employment Training, and a cognitive behavioral based program for life-term inmates. The tables below illustrate the planned and actual staffing and student capacities by program area (programs have been minimally updated since the change in designation):
LAC was designated as a Re-Entry Hub on 12/4/12 although it was originally designated as a Standard Program Site.

Second Report on CDCR’s Progress Implementing the Blueprint Page 125 Office of the Inspector General State of California
APPENDIX C: PROGRAMMING PLANS
Initial Blueprint Final Blueprint Actuals Differences
Academic EducationProposed
Staff (Version 1)
Budgeted Capacity
(Version 1)
Proposed Staff
(Version 5)
Budgeted Capacity
(Version 5)
Actual Staff (Programs)
Actual Student Capacity
Differences Differences
General Population 6 324 6 324 5 270 -1 -54Alternative Programming 0 0 0 0 0 0 0 0Voluntary Educ. Program 4 480 4 480 4 414 0 -66
TOTALS 10 804 10 804 9 684 -1 -120
Career Technical Education
Proposed Staff
(Version 1)
Budgeted Capacity
(Version 1)
Proposed Staff
(Version 5)
Budgeted Capacity
(Version 5)
Actual Staff (Programs)
Actual Student Capacity
Differences Differences
Auto Mechanics 0 0 0 0 0 0 0 0Auto Repair 0 0 0 0 0 0 0 0Building Maintenance 0 0 0 0 0 0 0 0Carpentry 0 0 0 0 0 0 0 0Computer Literacy 0 0 0 0 0 0 0 0Cosmetology 0 0 0 0 0 0 0 0Electric Work 0 0 0 0 0 0 0 0Electronics 0 0 0 0 0 0 0 0HVAC 0 0 0 0 0 0 0 0Machine Shop 0 0 0 0 0 0 0 0Masonry 0 0 0 0 0 0 0 0Office Technologies 3 81 3 81 3 81 0 0Plumbing 0 0 0 0 0 0 0 0Sheet Metal 0 0 0 0 0 0 0 0Small Engine Repair 0 0 0 0 0 0 0 0Welding 0 0 0 0 0 0 0 0TBD 0 0 0 0 0 0 0 0
TOTALS 3 81 3 81 3 81 0 0
SAC is designated as a Standard Program Site.
CALIFORNIA STATE PRISON, SACRAMENTO (SAC)
Programs at this institution are to include Academic Education and Career Technical Education. The tables below illustrate the planned and actual staffing and student capacities by program area:
(Actuals - Final)FY 12-13 (Version 1) FY 12-13 (Version 5) July - August 2013

Second Report on CDCR’s Progress Implementing the Blueprint Page 126 Office of the Inspector General State of California
APPENDIX C: PROGRAMMING PLANS
Academic EducationProposed
Staff (Version 1)
Budgeted Capacity
(Version 1)
Proposed Staff
(Version 5)
Budgeted Capacity
(Version 5)
Actual Staff (Programs)
Actual Student Capacity
Differences Differences
General Population 7 378 7 378 6 324 -1 -54Alternative Programming 0 0 0 0 0 0 0 0Voluntary Educ. Program 6 720 7 840 6 720 -1 -120
TOTALS 13 1098 14 1218 12 1044 -2 -174
Career Technical Education
Proposed Staff
(Version 1)
Budgeted Capacity
(Version 1)
Proposed Staff
(Version 5)
Budgeted Capacity
(Version 5)
Actual Staff (Programs)
Actual Student Capacity
Differences Differences
Auto Mechanics 0 0 0 0 0 0 0 0Auto Repair 0 0 0 0 0 0 0 0Building Maintenance 1 27 1 27 0 0 -1 -27Carpentry 0 0 0 0 0 0 0 0Computer Literacy 1 54 1 54 0 0 -1 -54Cosmetology 0 0 0 0 0 0 0 0Electric Work 0 0 0 0 0 0 0 0Electronics 1 27 1 27 0 0 -1 -27HVAC 0 0 0 0 0 0 0 0Machine Shop 1 27 1 27 1 27 0 0Masonry 0 0 0 0 0 0 0 0Office Technologies 0 0 0 0 0 0 0 0Plumbing 0 0 0 0 0 0 0 0Sheet Metal 1 27 1 27 0 0 -1 -27Small Engine Repair 0 0 0 0 0 0 0 0Welding 0 0 0 0 0 0 0 0TBD 0 0 0 0 0 0 0 0
TOTALS 5 162 5 162 1 27 -4 -135
CALIFORNIA STATE PRISON, SAN QUENTIN (SQ)
Programs at this institution are to include Academic Education and Career Technical Education. The tables below illustrate the planned and actual staffing and student capacities by program area:
(Actuals - Final)FY 12-13 (Version 1) FY 12-13 (Version 5) July - August 2013
SQ is designated as a Standard Program Site.
Initial Blueprint Final Blueprint Actuals Differences

Second Report on CDCR’s Progress Implementing the Blueprint Page 127 Office of the Inspector General State of California
APPENDIX C: PROGRAMMING PLANS
Initial Blueprint Final Blueprint Actuals Differences
Academic EducationProposed
Staff (Version 1)
Budgeted Capacity
(Version 1)
Proposed Staff
(Version 5)
Budgeted Capacity
(Version 5)
Actual Staff (Programs)
Actual Student Capacity
Differences Differences
General Population 15 810 15 674 12 534 -3 -140Alternative Programming 0 0 0 0 0 0 0 0Voluntary Educ. Program 6 720 6 720 4 480 -2 -240
TOTALS 21 1530 21 1394 16 1014 -5 -380
Career Technical Education
Proposed Staff
(Version 1)
Budgeted Capacity
(Version 1)
Proposed Staff
(Version 5)
Budgeted Capacity
(Version 5)
Actual Staff (Programs)
Actual Student Capacity
Differences Differences
Auto Mechanics 0 0 0 0 0 0 0 0Auto Repair 0 0 0 0 0 0 0 0Building Maintenance 1 27 1 27 1 27 0 0Carpentry 1 27 1 27 1 27 0 0Computer Literacy 1 54 1 54 0 0 -1 -54Cosmetology 0 0 0 0 0 0 0 0Electric Work 1 27 1 27 1 27 0 0Electronics 1 27 1 27 1 27 0 0HVAC 0 0 0 0 0 0 0 0Machine Shop 0 0 0 0 0 0 0 0Masonry 1 27 1 27 1 27 0 0Office Technologies 1 27 1 27 1 27 0 0Plumbing 0 0 0 0 0 0 0 0Sheet Metal 0 0 0 0 0 0 0 0Small Engine Repair 0 0 0 0 0 0 0 0Welding 1 27 1 27 1 27 0 0TBD 0 0 0 0 0 0 0 0
TOTALS 8 243 8 243 7 189 -1 -54
Contract Treatment Programs
Student Capacity
(/Program) (Version 1)
Student Capacity (Annual)
(Version 1)
Student Capacity
(/Program) (Version 5)
Student Capacity (Annual)
(Version 5)
Actual Students in
Program
Annual Student Capacity
(Projected)
Differences Differences
Substance Abuse 120 288 120 288 0 0 -120 -288Cognitive-Behavioral (None - commences 2013/14)Lifer Program (None - commences 2013/14)
Employment ProgramsProgram
Slots (Version 1)
Annual Served
(Version 1)
Program Slots
(Version 5)
Annual Served
(Version 5)
Inmates Served (Actual)
Annual Served
(Projected)Differences Differences
Transitions Program 20 288 20 288 0 0 -20 -288Identification (ID) Project 0 424 0 424 0 0 0 -424
TOTALS 20 712 20 712 0 0 -20 -712
CALIFORNIA STATE PRISON, SOLANO (SOL)
Programs at this institution are to include Academic Education and Career Technical Education. The tables below illustrate the planned and actual staffing and student capacities by program area (programs have been minimally updated since the change in designation):
SOL was designated as a Standard Program Site on 12/4/12 although it was originally designated as a Re-Entry Hub.
(Actuals - Final)FY 12-13 (Version 1) FY 12-13 (Version 5) July - August 2013

Second Report on CDCR’s Progress Implementing the Blueprint Page 128 Office of the Inspector General State of California
APPENDIX C: PROGRAMMING PLANS
Initial Blueprint Final Blueprint Actuals Differences
Academic EducationProposed
Staff (Version 1)
Budgeted Capacity
(Version 1)
Proposed Staff
(Version 5)
Budgeted Capacity
(Version 5)
Actual Staff (Programs)
Actual Student Capacity
Differences Differences
General Population 14 756 20 1080 18 972 -2 -108Alternative Programming 3 324 0 0 0 0 0 0Voluntary Educ. Program 9 1080 6 720 9 1080 3 360
TOTALS 26 2160 26 1800 27 2052 1 252
Career Technical Education
Proposed Staff
(Version 1)
Budgeted Capacity
(Version 1)
Proposed Staff
(Version 5)
Budgeted Capacity
(Version 5)
Actual Staff (Programs)
Actual Student Capacity
Differences Differences
Auto Mechanics 1 27 1 27 1 27 0 0Auto Repair 1 27 1 27 1 27 0 0Building Maintenance 1 27 1 27 0 0 -1 -27Carpentry 1 27 1 27 1 27 0 0Computer Literacy 0 0 1 54 1 54 0 0Cosmetology 0 0 0 0 0 0 0 0Electric Work 2 54 2 54 2 54 0 0Electronics 1 27 1 27 1 27 0 0HVAC 1 27 1 27 1 27 0 0Machine Shop 0 0 0 0 0 0 0 0Masonry 1 27 1 27 1 27 0 0Office Technologies 2 54 2 54 2 54 0 0Plumbing 1 27 1 27 1 27 0 0Sheet Metal 0 0 0 0 0 0 0 0Small Engine Repair 1 27 1 27 1 27 0 0Welding 1 27 1 27 1 27 0 0TBD 0 0 0 0 0 0 0 0
TOTALS 14 378 15 432 14 405 -1 -27
Contract Treatment Programs
Student Capacity
(/Program) (Version 1)
Student Capacity (Annual)
(Version 1)
Student Capacity
(/Program) (Version 5)
Student Capacity (Annual)
(Version 5)
Actual Students in
Program
Annual Student Capacity
(Projected)
Differences Differences
Substance Abuse 208 376 208 376 171 410 -37 34Cognitive-Behavioral (None - commences 2013/14)Lifer Program (None - commences 2013/14)
TOTALS 208 376 208 376 171 410 -37 34
Employment ProgramsProgram
Slots (Version 1)
Annual Served
(Version 1)
Program Slots
(Version 5)
Annual Served
(Version 5)
Inmates Served (Actual)
Annual Served
(Projected)Differences Differences
Transitions Program * 20 228 20 228 0 0 -20 -228Identification (ID) Project 0 668 0 668 0 0 0 -668
TOTALS 20 896 20 896 0 0 -20 -896* The slot numbers for the transitions programs as reported in the Blueprint were transposed between the capacity slots and the annual slots so we switched them to be recorded appropriately between the two columns.
SATF is designated as a Re-Entry Hub.
(Actuals - Final)
CALIFORNIA SUBSTANCE ABUSE TREATMENT FACILITY (SATF)
Programs at this institution are to include Academic Education, Career Technical Education, Substance Abuse Treatment, Cognitive-Behavioral Programs (including criminal thinking, anger management, and family programming), Employment Training, and a cognitive behavioral based program for life-term inmates. The tables below illustrate the planned and actual staffing and student capacities by program area:
FY 12-13 (Version 1) FY 12-13 (Version 5) July - August 2013

Second Report on CDCR’s Progress Implementing the Blueprint Page 129 Office of the Inspector General State of California
APPENDIX C: PROGRAMMING PLANS
Initial Blueprint Final Blueprint Actuals Differences
Academic EducationProposed
Staff (Version 1)
Budgeted Capacity
(Version 1)
Proposed Staff
(Version 5)
Budgeted Capacity
(Version 5)
Actual Staff (Programs)
Actual Student Capacity
Differences Differences
General Population 12 648 13 540 11 594 -2 54Alternative Programming 0 0 1 108 1 54 0 -54Voluntary Educ. Program 4 480 4 480 5 600 1 120
TOTALS 16 1128 18 1128 17 1248 -1 120
Career Technical Education
Proposed Staff
(Version 1)
Budgeted Capacity
(Version 1)
Proposed Staff
(Version 5)
Budgeted Capacity
(Version 5)
Actual Staff (Programs)
Actual Student Capacity
Differences Differences
Auto Mechanics 0 0 0 0 0 0 0 0Auto Repair 0 0 0 0 0 0 0 0Building Maintenance 0 0 0 0 0 0 0 0Carpentry 1 27 1 27 1 27 0 0Computer Literacy 1 54 2 108 1 54 -1 -54Cosmetology 0 0 0 0 0 0 0 0Electric Work 1 27 1 27 0 0 -1 -27Electronics 1 27 1 27 1 27 0 0HVAC 1 27 1 27 1 27 0 0Machine Shop 0 0 0 0 0 0 0 0Masonry 0 0 0 0 0 0 0 0Office Technologies 0 0 0 0 0 0 0 0Plumbing 0 0 0 0 0 0 0 0Sheet Metal 0 0 0 0 0 0 0 0Small Engine Repair 0 0 0 0 0 0 0 0Welding 0 0 0 0 0 0 0 0TBD 0 0 0 0 0 0 0 0
TOTALS 5 162 6 216 4 135 -2 -81
CALIPATRIA STATE PRISON (CAL)
Programs at this institution are to include Academic Education and Career Technical Education. The tables below illustrate the planned and actual staffing and student capacities by program area:
CAL is designated as a Standard Program Site.
FY 12-13 (Version 1) FY 12-13 (Version 5) July - August 2013 (Actuals - Final)

Second Report on CDCR’s Progress Implementing the Blueprint Page 130 Office of the Inspector General State of California
APPENDIX C: PROGRAMMING PLANS
Initial Blueprint Final Blueprint Actuals Differences
Academic EducationProposed
Staff (Version 1)
Budgeted Capacity
(Version 1)
Proposed Staff
(Version 5)
Budgeted Capacity
(Version 5)
Actual Staff (Programs)
Actual Student Capacity
Differences Differences
General Population 11 594 14 486 13 594 -1 108Alternative Programming 0 0 0 0 0 0 0 0Voluntary Educ. Program 7 840 6 720 5 240 -1 -480
TOTALS 18 1434 20 1206 18 834 -2 -372
Career Technical Education
Proposed Staff
(Version 1)
Budgeted Capacity
(Version 1)
Proposed Staff
(Version 5)
Budgeted Capacity
(Version 5)
Actual Staff (Programs)
Actual Student Capacity
Differences Differences
Auto Mechanics 1 27 1 27 1 27 0 0Auto Repair 1 27 1 27 1 27 0 0Building Maintenance 1 27 1 27 1 27 0 0Carpentry 0 0 0 0 0 0 0 0Computer Literacy 0 0 0 0 0 0 0 0Cosmetology 0 0 0 0 0 0 0 0Electric Work 0 0 0 0 0 0 0 0Electronics 1 27 1 27 0 0 -1 -27HVAC 0 0 0 0 0 0 0 0Machine Shop 0 0 0 0 0 0 0 0Masonry 1 27 0 0 0 0 0 0Office Technologies 2 54 2 54 2 54 0 0Plumbing 0 0 0 0 0 0 0 0Sheet Metal 0 0 0 0 0 0 0 0Small Engine Repair 1 27 1 27 1 27 0 0Welding 1 27 1 27 0 0 -1 -27TBD 0 0 0 0 0 0 0 0
TOTALS 9 243 8 216 6 162 -2 -54
CEN is designated as a Standard Program Site.
CENTINELA STATE PRISON (CEN)
Programs at this institution are to include Academic Education and Career Technical Education. The tables below illustrate the planned and actual staffing and student capacities by program area:
(Actuals - Final)FY 12-13 (Version 1) FY 12-13 (Version 5) July - August 2013

Second Report on CDCR’s Progress Implementing the Blueprint Page 131 Office of the Inspector General State of California
APPENDIX C: PROGRAMMING PLANS
Initial Blueprint * Final Blueprint Actuals Differences
Academic EducationProposed
Staff (Version 1)
Budgeted Capacity
(Version 1)
Proposed Staff
(Version 5)
Budgeted Capacity
(Version 5)
Actual Staff (Programs)
Actual Student Capacity
Differences Differences
General Population 9 486 8 432 7 432 -1 0Alternative Programming 0 0 0 0 0 0 0 0Voluntary Educ. Program 4 480 4 480 4 480 0 0
TOTALS 13 966 12 912 11 912 -1 0
Career Technical Education
Proposed Staff
(Version 1)
Budgeted Capacity
(Version 1)
Proposed Staff
(Version 5)
Budgeted Capacity
(Version 5)
Actual Staff (Programs)
Actual Student Capacity
Differences Differences
Auto Mechanics 0 0 0 0 0 0 0 0Auto Repair 1 27 1 27 1 27 0 0Building Maintenance 0 0 1 27 1 27 0 0Carpentry 1 27 1 27 1 27 0 0Computer Literacy 1 54 1 54 1 54 0 0Cosmetology 2 54 2 54 1 27 -1 -27Electric Work 0 0 0 0 0 0 0 0Electronics 1 27 1 27 1 27 0 0HVAC 0 0 0 0 0 0 0 0Machine Shop 0 0 0 0 0 0 0 0Masonry 0 0 0 0 0 0 0 0Office Technologies 2 54 2 54 2 54 0 0Plumbing 0 0 0 0 0 0 0 0Sheet Metal 0 0 0 0 0 0 0 0Small Engine Repair 0 0 0 0 0 0 0 0Welding 0 0 0 0 0 0 0 0TBD 0 0 0 0 0 0 0 0
TOTALS 8 243 9 270 8 243 -1 -27
Contract Treatment Programs
Student Capacity
(/Program) (Version 1)
Student Capacity (Annual)
(Version 1)
* Student Capacity
(/Program) (Version 5)
Student Capacity (Annual)
(Version 5)
Actual Students in
Program
Annual Student Capacity
(Projected)
Differences Differences
Substance Abuse 120 288 240 576 87 209 -153 -367Cognitive-Behavioral (None - commences 2013/14)Lifer Program (None - commences 2013/14)
TOTALS 120 288 240 576 87 209 -153 -367
Employment ProgramsProgram
Slots (Version 1)
Annual Served
(Version 1)
Program Slots
(Version 5)
Annual Served
(Version 5)
Inmates Served (Actual)
Annual Served
(Projected)Differences Differences
Transitions Program 20 228 20 228 0 0 -20 -228Identification (ID) Project 0 358 0 358 0 0 0 -358
TOTALS 20 586 20 586 0 0 -20 -586* 120 substance abuse slots temporarily added to CCWF from the neighboring VSP. Since the slots were gender specific, they could not be used at VSP.
CCWF is designated as a Re-Entry Hub.
CENTRAL CALIFORNIA WOMEN'S FACILITY (CCWF)
Programs at this institution are to include Academic Education, Career Technical Education, Substance Abuse Treatment, Cognitive-Behavioral Programs (including criminal thinking, anger management, and family programming), Employment Training, and a cognitive behavioral based program for life-term inmates. The tables below illustrate the planned and actual staffing and student capacities by program area:
(Actuals - Final)FY 12-13 (Version 1) FY 12-13 (Version 5) July - August 2013

Second Report on CDCR’s Progress Implementing the Blueprint Page 132 Office of the Inspector General State of California
APPENDIX C: PROGRAMMING PLANS
Initial Blueprint Final Blueprint Actuals Differences
Academic EducationProposed
Staff (Version 1)
Budgeted Capacity
(Version 1)
Proposed Staff
(Version 5)
Budgeted Capacity
(Version 5)
Actual Staff (Programs)
Actual Student Capacity
Differences Differences
General Population 10 540 9 486 9 486 0 0Alternative Programming 0 0 0 0 0 0 0 0Voluntary Educ. Program 4 480 4 480 4 480 0 0
TOTALS 14 1020 13 966 13 966 0 0
Career Technical Education
Proposed Staff
(Version 1)
Budgeted Capacity
(Version 1)
Proposed Staff
(Version 5)
Budgeted Capacity
(Version 5)
Actual Staff (Programs)
Actual Student Capacity
Differences Differences
Auto Mechanics 1 27 1 27 1 27 0 0Auto Repair 1 27 1 27 1 27 0 0Building Maintenance 0 0 0 0 0 0 0 0Carpentry 0 0 0 0 0 0 0 0Computer Literacy 0 0 0 0 0 0 0 0Cosmetology 0 0 0 0 0 0 0 0Electric Work 0 0 0 0 0 0 0 0Electronics 1 27 1 27 1 27 0 0HVAC 1 27 1 27 1 27 0 0Machine Shop 0 0 0 0 0 0 0 0Masonry 1 27 1 27 1 27 0 0Office Technologies 2 54 2 54 2 54 0 0Plumbing 1 27 1 27 1 27 0 0Sheet Metal 0 0 0 0 0 0 0 0Small Engine Repair 0 0 0 0 0 0 0 0Welding 1 27 1 27 1 27 0 0TBD 0 0 0 0 0 0 0 0
TOTALS 9 243 9 243 9 243 0 0
Contract Treatment Programs
Student Capacity
(/Program) (Version 1)
Student Capacity (Annual)
(Version 1)
Student Capacity
(/Program) (Version 5)
Student Capacity (Annual)
(Version 5)
Actual Students in
Program
Annual Student Capacity
(Projected)
Differences Differences
Substance Abuse 120 288 120 288 90 216 -30 -72Cognitive-Behavioral (None - commences 2013/14)Lifer Program (None - commences 2013/14)
TOTALS 120 288 120 288 90 216 -30 -72
Employment ProgramsProgram
Slots (Version 1)
Annual Served
(Version 1)
Program Slots
(Version 5)
Annual Served
(Version 5)
Inmates Served (Actual)
Annual Served
(Projected)Differences Differences
Transitions Program * 20 228 20 228 0 0 -20 -228Identification (ID) Project 0 545 0 545 0 0 0 -545
TOTALS 20 773 20 773 0 0 -20 -773* The slot numbers for the transitions programs as reported in the Blueprint were transposed between the capacity slots and the annual slots so we switched them to be recorded appropriately between the two columns.
CVSP is designated as a Re-Entry Hub.
(Actuals - Final)
CHUCKAWALLA VALLEY STATE PRISION (CVSP)
Programs at this institution are to include Academic Education, Career Technical Education, Substance Abuse Treatment, Cognitive-Behavioral Programs (including criminal thinking, anger management, and family programming), Employment Training, and a cognitive behavioral based program for life-term inmates. The tables below illustrate the planned and actual staffing and student capacities by program area:
FY 12-13 (Version 1) FY 12-13 (Version 5) July - August 2013
Second Report on CDCR’s Progress Implementing the Blueprint Page 133 Office of the Inspector General State of California
APPENDIX C: PROGRAMMING PLANS
Initial Blueprint Final Blueprint Actuals Differences
Academic EducationProposed
Staff (Version 1)
Budgeted Capacity
(Version 1)
Proposed Staff
(Version 5)
Budgeted Capacity
(Version 5)
Actual Staff (Programs)
Actual Student Capacity
Differences Differences
General Population 18 972 16 864 16 844 0 -20Alternative Programming 0 0 0 0 0 0 0 0Voluntary Educ. Program 9 1080 7 840 7 840 0 0
TOTALS 27 2052 23 1704 23 1684 0 -20
Career Technical Education
Proposed Staff
(Version 1)
Budgeted Capacity
(Version 1)
Proposed Staff
(Version 5)
Budgeted Capacity
(Version 5)
Actual Staff (Programs)
Actual Student Capacity
Differences Differences
Auto Mechanics 0 0 0 0 0 0 0 0Auto Repair 0 0 0 0 0 0 0 0Building Maintenance 1 27 1 27 1 27 0 0Carpentry 1 27 1 27 0 0 -1 -27Computer Literacy 1 54 1 54 1 54 0 0Cosmetology 0 0 0 0 0 0 0 0Electric Work 1 27 1 27 1 27 0 0Electronics 1 27 1 27 1 27 0 0HVAC 0 0 0 0 0 0 0 0Machine Shop 0 0 0 0 0 0 0 0Masonry 1 27 1 27 0 0 -1 -27Office Technologies 1 27 1 27 1 27 0 0Plumbing 1 27 1 27 0 0 -1 -27Sheet Metal 0 0 0 0 0 0 0 0Small Engine Repair 0 0 0 0 0 0 0 0Welding 0 0 0 0 0 0 0 0TBD 0 0 0 0 0 0 0 0
TOTALS 8 243 8 243 5 162 -3 -81
Contract Treatment Programs
Student Capacity
(/Program) (Version 1)
Student Capacity (Annual)
(Version 1)
Student Capacity
(/Program) (Version 5)
Student Capacity (Annual)
(Version 5)
Actual Students in
Program
Annual Student Capacity
(Projected)
Differences Differences
Substance Abuse 120 288 120 288 84 202 -36 -86Cognitive-Behavioral (None - commences 2013/14)Lifer Program (None - commences 2013/14)
TOTALS 120 288 120 288 84 202 -36 -86
Employment ProgramsProgram
Slots (Version 1)
Annual Served
(Version 1)
Program Slots
(Version 5)
Annual Served
(Version 5)
Inmates Served (Actual)
Annual Served
(Projected)Differences Differences
Transitions Program 20 228 20 228 0 0 -20 -228Identification (ID) Project 0 896 0 896 0 0 0 -896
TOTALS 20 1124 20 1124 0 0 -20 -1124
FY 12-13 (Version 1) FY 12-13 (Version 5) July - August 2013 (Actuals - Final)
CORRECTIONAL TRAINING FACILITY (CTF)
Programs at this institution are to include Academic Education, Career Technical Education, Substance Abuse Treatment, Cognitive-Behavioral Programs (including criminal thinking, anger management, and family programming), Employment Training, and a cognitive behavioral based program for life-term inmates. The tables below illustrate the planned and actual staffing and student capacities by program area:
CTF is designated as a Re-Entry Hub.

Second Report on CDCR’s Progress Implementing the Blueprint Page 134 Office of the Inspector General State of California
APPENDIX C: PROGRAMMING PLANS
Initial Blueprint Final Blueprint Actuals Differences
Academic EducationProposed
Staff (Version 1)
Budgeted Capacity
(Version 1)
Proposed Staff
(Version 5)
Budgeted Capacity
(Version 5)
Actual Staff (Programs)
Actual Student Capacity
Differences Differences
General Population 4 216 4 216 2 108 -2 -108Alternative Programming 0 0 0 0 0 0 0 0Voluntary Educ. Program 4 480 4 480 3 360 -1 -120
TOTALS 8 696 8 696 5 468 -3 -228
Career Technical Education
Proposed Staff
(Version 1)
Budgeted Capacity
(Version 1)
Proposed Staff
(Version 5)
Budgeted Capacity
(Version 5)
Actual Staff (Programs)
Actual Student Capacity
Differences Differences
Auto Mechanics 0 0 0 0 0 0 0 0Auto Repair 1 27 1 27 1 27 0 0Building Maintenance 1 27 1 27 1 27 0 0Carpentry 0 0 0 0 0 0 0 0Computer Literacy 1 54 1 54 1 54 0 0Cosmetology 0 0 0 0 0 0 0 0Electric Work 0 0 0 0 0 0 0 0Electronics 0 0 0 0 0 0 0 0HVAC 1 27 1 27 1 0 0 -27Machine Shop 0 0 0 0 0 0 0 0Masonry 0 0 0 0 0 0 0 0Office Technologies 0 0 0 0 0 0 0 0Plumbing 0 0 0 0 0 0 0 0Sheet Metal 0 0 0 0 0 0 0 0Small Engine Repair 0 0 0 0 0 0 0 0Welding 0 0 0 0 0 0 0 0TBD 0 0 0 0 0 0 0 0
TOTALS 4 135 4 135 4 108 0 -27
DVI is designated as a Standard Program Site.
DEUEL VOCATIONAL INSTITUTION (DVI)
Programs at this institution are to include Academic Education and Career Technical Education. The tables below illustrate the planned and actual staffing and student capacities by program area:
(Actuals - Final)FY 12-13 (Version 1) FY 12-13 (Version 5) July - August 2013

Second Report on CDCR’s Progress Implementing the Blueprint Page 135 Office of the Inspector General State of California
APPENDIX C: PROGRAMMING PLANS
Initial Blueprint Final Blueprint Actuals Differences
Academic EducationProposed
Staff (Version 1)
Budgeted Capacity
(Version 1)
Proposed Staff
(Version 5)
Budgeted Capacity
(Version 5)
Actual Staff (Programs)
Actual Student Capacity
Differences Differences
General Population 13 702 10 504 9 450 -1 -54Alternative Programming 0 0 0 0 0 0 0 0Voluntary Educ. Program 1 120 6 720 6 720 0 0
TOTALS 14 822 16 1224 15 1170 -1 -54
Career Technical Education
Proposed Staff
(Version 1)
Budgeted Capacity
(Version 1)
Proposed Staff
(Version 5)
Budgeted Capacity
(Version 5)
Actual Staff (Programs)
Actual Student Capacity
Differences Differences
Auto Mechanics 1 27 1 27 0 0 -1 -27Auto Repair 0 0 0 0 0 0 0 0Building Maintenance 1 27 1 27 1 27 0 0Carpentry 0 0 1 27 0 0 -1 -27Computer Literacy 0 0 0 0 0 0 0 0Cosmetology 0 0 0 0 0 0 0 0Electric Work 1 27 1 27 1 27 0 0Electronics 1 27 1 27 0 0 -1 -27HVAC 0 0 0 0 0 0 0 0Machine Shop 0 0 0 0 0 0 0 0Masonry 1 27 1 27 1 27 0 0Office Technologies 2 54 2 54 2 54 0 0Plumbing 1 27 1 27 0 0 -1 -27Sheet Metal 0 0 0 0 0 0 0 0Small Engine Repair 0 0 0 0 0 0 0 0Welding 2 54 2 54 2 54 0 0TBD 0 0 0 0 0 0 0 0
TOTALS 10 270 11 297 7 189 -4 -108
FSP is designated as a Standard Program Site.
FOLSOM STATE PRISON (FSP)
Programs at this institution are to include Academic Education and Career Technical Education. The tables below illustrate the planned and actual staffing and student capacities by program area:
(Actuals - Final)FY 12-13 (Version 1) FY 12-13 (Version 5) July - August 2013

Second Report on CDCR’s Progress Implementing the Blueprint Page 136 Office of the Inspector General State of California
APPENDIX C: PROGRAMMING PLANS
Initial Blueprint Final Blueprint Actuals Differences
Academic EducationProposed
Staff (Version 1)
Budgeted Capacity
(Version 1)
Proposed Staff
(Version 5)
Budgeted Capacity
(Version 5)
Actual Staff (Programs)
Actual Student Capacity
Differences Differences
General Population 0 0 0 0 1 54 1 54Alternative Programming 0 0 0 0 0 0 0 0Voluntary Educ. Program 1 120 1 120 0 0 -1 -120
TOTALS 1 120 1 120 1 54 0 -66
Career Technical Education
Proposed Staff
(Version 1)
Budgeted Capacity
(Version 1)
Proposed Staff
(Version 5)
Budgeted Capacity
(Version 5)
Actual Staff (Programs)
Actual Student Capacity
Differences Differences
Auto Mechanics 0 0 0 0 0 0 0 0Auto Repair 0 0 0 0 0 0 0 0Building Maintenance 0 0 0 0 0 0 0 0Carpentry 0 0 0 0 0 0 0 0Computer Literacy 0 0 0 0 1 54 1 54Cosmetology 0 0 0 0 0 0 0 0Electric Work 0 0 0 0 0 0 0 0Electronics 0 0 0 0 0 0 0 0HVAC 0 0 0 0 0 0 0 0Machine Shop 0 0 0 0 0 0 0 0Masonry 0 0 0 0 0 0 0 0Office Technologies 0 0 0 0 0 0 0 0Plumbing 0 0 0 0 0 0 0 0Sheet Metal 0 0 0 0 0 0 0 0Small Engine Repair 0 0 0 0 0 0 0 0Welding 0 0 0 0 0 0 0 0TBD 0 0 0 0 0 0 0 0
TOTALS 0 0 0 0 1 54 1 54
Contract Treatment Programs
Student Capacity
(/Program) (Version 1)
Student Capacity (Annual)
(Version 1)
Student Capacity
(/Program) (Version 5)
Student Capacity (Annual)
(Version 5)
Actual Students in
Program
Annual Student Capacity
(Projected)
Differences Differences
Substance Abuse 0 0 0 0 0 0 0 0Cognitive-Behavioral Lifer Program
TOTALS 0 0 0 0 0 0 0 0
Employment ProgramsProgram
Slots (Version 1)
Annual Served
(Version 1)
Program Slots
(Version 5)
Annual Served
(Version 5)
Inmates Served (Actual)
Annual Served
(Projected)Differences Differences
Transitions Program 0 0 0 0 0 0 0 0Identification (ID) Project 0 0 0 0 0 0 0 0
TOTALS 0 0 0 0 0 0 0 0
FOLSOM WOMEN'S FACILITY (FWF)
Programs at this institution are to include Academic Education, Career Technical Education, Substance Abuse Treatment, Cognitive-Behavioral Programs (including criminal thinking, anger management, and family programming), Employment Training, and a cognitive behavioral based program for life-term inmates. The tables below illustrate the planned and actual staffing and student capacities by program area:
(None - commences 2013/14)(None - commences 2013/14)
(Actuals - Final)
FWF is designated as a Re-Entry Hub.
FY 12-13 (Version 5) July - August 2013FY 12-13 (Version 1)

Second Report on CDCR’s Progress Implementing the Blueprint Page 137 Office of the Inspector General State of California
APPENDIX C: PROGRAMMING PLANS
Initial Blueprint Final Blueprint Actuals Differences
Academic EducationProposed
Staff (Version 1)
Budgeted Capacity
(Version 1)
Proposed Staff
(Version 5)
Budgeted Capacity
(Version 5)
Actual Staff (Programs)
Actual Student Capacity
Differences Differences
General Population 7 378 8 432 7 378 -1 -54Alternative Programming 1 108 1 84 1 54 0 -30Voluntary Educ. Program 2 240 3 360 3 360 0 0
TOTALS 10 726 12 876 11 792 -1 -84
Career Technical Education
Proposed Staff
(Version 1)
Budgeted Capacity
(Version 1)
Proposed Staff
(Version 5)
Budgeted Capacity
(Version 5)
Actual Staff (Programs)
Actual Student Capacity
Differences Differences
Auto Mechanics 0 0 0 0 0 0 0 0Auto Repair 1 27 1 27 1 27 0 0Building Maintenance 1 27 1 27 1 27 0 0Carpentry 0 0 0 0 0 0 0 0Computer Literacy 1 54 1 54 1 54 0 0Cosmetology 0 0 0 0 0 0 0 0Electric Work 0 0 0 0 0 0 0 0Electronics 0 0 0 0 0 0 0 0HVAC 0 0 0 0 0 0 0 0Machine Shop 0 0 0 0 0 0 0 0Masonry 0 0 0 0 0 0 0 0Office Technologies 0 0 0 0 0 0 0 0Plumbing 1 27 0 0 0 0 0 0Sheet Metal 0 0 0 0 0 0 0 0Small Engine Repair 0 0 0 0 0 0 0 0Welding 0 0 0 0 0 0 0 0TBD 0 0 0 0 0 0 0
TOTALS 4 135 3 108 3 108 0 0
HDSP is designated as a Standard Program Site.
FY 12-13 (Version 1) FY 12-13 (Version 5) July - August 2013
HIGH DESERT STATE PRISON (HDSP)
Programs at this institution are to include Academic Education and Career Technical Education. The tables below illustrate the planned and actual staffing and student capacities by program area:
(Actuals - Final)

Second Report on CDCR’s Progress Implementing the Blueprint Page 138 Office of the Inspector General State of California
APPENDIX C: PROGRAMMING PLANS
Initial Blueprint Final Blueprint Actuals Differences
Academic EducationProposed
Staff (Version 1)
Budgeted Capacity
(Version 1)
Proposed Staff
(Version 5)
Budgeted Capacity
(Version 5)
Actual Staff (Programs)
Actual Student Capacity
Differences Differences
General Population 10 540 8 432 8 432 0 0Alternative Programming 0 0 0 0 0 0 0 0Voluntary Educ. Program 8 960 9 1080 6 720 -3 -360
TOTALS 18 1500 17 1512 14 1152 -3 -360
Career Technical Education
Proposed Staff
(Version 1)
Budgeted Capacity
(Version 1)
Proposed Staff
(Version 5)
Budgeted Capacity
(Version 5)
Actual Staff (Programs)
Actual Student Capacity
Differences Differences
Auto Mechanics 1 27 1 27 0 0 -1 -27Auto Repair 1 27 1 27 1 27 0 0Building Maintenance 1 27 1 27 1 27 0 0Carpentry 1 27 1 27 1 27 0 0Computer Literacy 0 0 0 0 0 0 0 0Cosmetology 0 0 0 0 0 0 0 0Electric Work 0 0 0 0 0 0 0 0Electronics 1 27 1 27 1 27 0 0HVAC 0 0 0 0 0 0 0 0Machine Shop 0 0 0 0 0 0 0 0Masonry 1 27 0 0 1 27 1 27Office Technologies 2 54 2 54 2 54 0 0Plumbing 1 27 1 27 1 27 0 0Sheet Metal 0 0 0 0 0 0 0 0Small Engine Repair 0 0 0 0 0 0 0 0Welding 0 0 0 0 0 0 0 0TBD 0 0 0 0 0 0 0 0
TOTALS 9 243 8 216 8 216 0 0
Contract Treatment Programs
Student Capacity
(/Program) (Version 1)
Student Capacity (Annual)
(Version 1)
Student Capacity
(/Program) (Version 5)
Student Capacity (Annual)
(Version 5)
Actual Students in
Program
Annual Student Capacity
(Projected)
Differences Differences
Substance Abuse 0 0 0 0 0 0 0 0TOTALS 0 0 0 0 0 0 0 0
IRONWOOD STATE PRISON (ISP)
Programs at this institution are to include Academic Education, Career Technical Education, Substance Abuse Treatment, Cognitive-Behavioral Programs (including criminal thinking, anger management, and family programming), Employment Training, and a cognitive behavioral based program for life-term inmates. The tables below illustrate the planned and actual staffing and student capacities by program area (programs have been minimally updated since the change in designation):
ISP was designated as a Re-Entry Hub on 12/4/12 although it was originally designated as a Standard Program Site.
(Actuals - Final)FY 12-13 (Version 1) FY 12-13 (Version 5) July - August 2013
Second Report on CDCR’s Progress Implementing the Blueprint Page 139 Office of the Inspector General State of California
APPENDIX C: PROGRAMMING PLANS
Initial Blueprint Final Blueprint Actuals Differences
Academic EducationProposed
Staff (Version 1)
Budgeted Capacity
(Version 1)
Proposed Staff
(Version 5)
Budgeted Capacity
(Version 5)
Actual Staff (Programs)
Actual Student Capacity
Differences Differences
General Population 14 756 14 756 14 756 0 0Alternative Programming 0 0 0 0 0 0 0 0Voluntary Educ. Program 4 480 4 480 4 480 0 0
TOTALS 18 1236 18 1236 18 1236 0 0
Career Technical Education
Proposed Staff
(Version 1)
Budgeted Capacity
(Version 1)
Proposed Staff
(Version 5)
Budgeted Capacity
(Version 5)
Actual Staff (Programs)
Actual Student Capacity
Differences Differences
Auto Mechanics 1 27 1 27 1 27 0 0Auto Repair 0 0 0 0 0 0 0 0Building Maintenance 0 0 0 0 0 0 0 0Carpentry 0 0 0 0 0 0 0 0Computer Literacy 0 0 0 0 0 0 0 0Cosmetology 0 0 0 0 0 0 0 0Electric Work 0 0 0 0 0 0 0 0Electronics 0 0 0 0 0 0 0 0HVAC 0 0 0 0 0 0 0 0Machine Shop 0 0 0 0 0 0 0 0Masonry 0 0 0 0 0 0 0 0Office Technologies 2 54 2 54 2 54 0 0Plumbing 0 0 0 0 0 0 0 0Sheet Metal 0 0 0 0 0 0 0 0Small Engine Repair 1 27 1 27 1 27 0 0Welding 1 27 1 27 1 27 0 0TBD 0 0 0 0 0 0 0 0
TOTALS 5 135 5 135 5 135 0 0
KVSP is designated as a Standard Program Site.
KERN VALLEY STATE PRISON (KVSP)
Programs at this institution are to include Academic Education and Career Technical Education. The tables below illustrate the planned and actual staffing and student capacities by program area:
(Actuals - Final)FY 12-13 (Version 1) FY 12-13 (Version 5) July - August 2013

Second Report on CDCR’s Progress Implementing the Blueprint Page 140 Office of the Inspector General State of California
APPENDIX C: PROGRAMMING PLANS
Initial Blueprint Final Blueprint Actuals Differences
Academic EducationProposed
Staff (Version 1)
Budgeted Capacity
(Version 1)
Proposed Staff
(Version 5)
Budgeted Capacity
(Version 5)
Actual Staff (Programs)
Actual Student Capacity
Differences Differences
General Population 8 432 8 432 8 432 0 0Alternative Programming 0 0 0 0 0 0 0 0Voluntary Educ. Program 4 480 3 360 3 360 0 0
TOTALS 12 912 11 792 11 792 0 0
Career Technical Education
Proposed Staff
(Version 1)
Budgeted Capacity
(Version 1)
Proposed Staff
(Version 5)
Budgeted Capacity
(Version 5)
Actual Staff (Programs)
Actual Student Capacity
Differences Differences
Auto Mechanics 1 27 1 27 0 0 -1 -27Auto Repair 0 0 0 0 0 0 0 0Building Maintenance 0 0 0 0 0 0 0 0Carpentry 0 0 0 0 0 0 0 0Computer Literacy 0 0 0 0 0 0 0 0Cosmetology 0 0 0 0 0 0 0 0Electric Work 0 0 0 0 0 0 0 0Electronics 2 54 2 54 1 27 -1 -27HVAC 1 27 1 27 1 27 0 0Machine Shop 0 0 0 0 0 0 0 0Masonry 0 0 0 0 0 0 0 0Office Technologies 1 27 1 27 1 27 0 0Plumbing 0 0 0 0 0 0 0 0Sheet Metal 0 0 0 0 0 0 0 0Small Engine Repair 0 0 0 0 0 0 0 0Welding 1 27 1 27 1 27 0 0TBD 0 0 0 0 0 0 0 0
TOTALS 6 162 6 162 4 108 -2 -54
MCSP is designated as a Standard Program Site.
MULE CREEK STATE PRISON (MCSP)
Programs at this institution are to include Academic Education and Career Technical Education. The tables below illustrate the planned and actual staffing and student capacities by program area:
(Actuals - Final)FY 12-13 (Version 1) FY 12-13 (Version 5) July - August 2013

Second Report on CDCR’s Progress Implementing the Blueprint Page 141 Office of the Inspector General State of California
APPENDIX C: PROGRAMMING PLANS
Initial Blueprint Final Blueprint Actuals Differences
Academic EducationProposed
Staff (Version 1)
Budgeted Capacity
(Version 1)
Proposed Staff
(Version 5)
Budgeted Capacity
(Version 5)
Actual Staff (Programs)
Actual Student Capacity
Differences Differences
General Population 2 108 3 162 2 108 -1 -54Alternative Programming 0 0 0 0 1 54 1 54Voluntary Educ. Program 5 600 3 360 2 240 -1 -120
TOTALS 7 708 6 522 5 402 -1 -120
Career Technical Education
Proposed Staff
(Version 1)
Budgeted Capacity
(Version 1)
Proposed Staff
(Version 5)
Budgeted Capacity
(Version 5)
Actual Staff (Programs)
Actual Student Capacity
Differences Differences
Auto Mechanics 0 0 0 0 0 0 0 0Auto Repair 0 0 0 0 0 0 0 0Building Maintenance 0 0 0 0 0 0 0 0Carpentry 0 0 0 0 0 0 0 0Computer Literacy 1 54 0 0 0 0 0 0Cosmetology 0 0 0 0 0 0 0 0Electric Work 0 0 0 0 1 27 1 27Electronics 1 27 1 27 0 0 -1 -27HVAC 0 0 0 0 0 0 0 0Machine Shop 0 0 0 0 0 0 0 0Masonry 0 0 0 0 0 0 0 0Office Technologies 0 0 0 0 0 0 0 0Plumbing 0 0 0 0 0 0 0 0Sheet Metal 0 0 0 0 0 0 0 0Small Engine Repair 1 27 1 27 1 27 0 0Welding 0 0 0 0 0 0 0 0TBD 0 0 0 0 0 0 0 0
TOTALS 3 108 2 54 2 54 0 0
NKSP is designated as a Standard Program Site.
NORTH KERN STATE PRISON (NKSP)
Programs at this institution are to include Academic Education and Career Technical Education. The tables below illustrate the planned and actual staffing and student capacities by program area:
(Actuals - Final)FY 12-13 (Version 1) FY 12-13 (Version 5) July - August 2013

Second Report on CDCR’s Progress Implementing the Blueprint Page 142 Office of the Inspector General State of California
APPENDIX C: PROGRAMMING PLANS
Initial Blueprint Final Blueprint Actuals Differences
Academic EducationProposed
Staff (Version 1)
Budgeted Capacity
(Version 1)
Proposed Staff
(Version 5)
Budgeted Capacity
(Version 5)
Actual Staff (Programs)
Actual Student Capacity
Differences Differences
General Population 0 0 0 0 0 0 0 0Alternative Programming 5 540 4 216 4 216 0 0Voluntary Educ. Program 3 360 4 480 3 360 -1 -120
TOTALS 8 900 8 696 7 576 -1 -120
Career Technical Education
Proposed Staff
(Version 1)
Budgeted Capacity
(Version 1)
Proposed Staff
(Version 5)
Budgeted Capacity
(Version 5)
Actual Staff (Programs)
Actual Student Capacity
Differences Differences
Auto Mechanics 0 0 0 0 0 0 0 0Auto Repair 0 0 0 0 0 0 0 0Building Maintenance 0 0 0 0 0 0 0 0Carpentry 0 0 0 0 0 0 0 0Computer Literacy 1 54 1 54 1 54 0 0Cosmetology 0 0 0 0 0 0 0 0Electric Work 0 0 0 0 0 0 0 0Electronics 0 0 0 0 0 0 0 0HVAC 0 0 0 0 0 0 0 0Machine Shop 0 0 0 0 0 0 0 0Masonry 0 0 0 0 0 0 0 0Office Technologies 0 0 0 0 0 0 0 0Plumbing 0 0 0 0 0 0 0 0Sheet Metal 0 0 0 0 0 0 0 0Small Engine Repair 0 0 0 0 0 0 0 0Welding 0 0 0 0 0 0 0 0TBD 0 0 0 0 0 0 0 0
TOTALS 1 54 1 54 1 54 0 0
PBSP is designated as a Standard Program Site.
PELICAN BAY STATE PRISON (PBSP)
Programs at this institution are to include Academic Education and Career Technical Education. The tables below illustrate the planned and actual staffing and student capacities by program area:
(Actuals - Final)FY 12-13 (Version 1) FY 12-13 (Version 5) July - August 2013

Second Report on CDCR’s Progress Implementing the Blueprint Page 143 Office of the Inspector General State of California
APPENDIX C: PROGRAMMING PLANS
Initial Blueprint Final Blueprint Actuals Differences
Academic EducationProposed
Staff (Version 1)
Budgeted Capacity
(Version 1)
Proposed Staff
(Version 5)
Budgeted Capacity
(Version 5)
Actual Staff (Programs)
Actual Student Capacity
Differences Differences
General Population 14 756 14 756 13 702 -1 -54Alternative Programming 0 0 0 0 0 0 0 0Voluntary Educ. Program 4 480 4 480 4 480 0 0
TOTALS 18 1236 18 1236 17 1182 -1 -54
Career Technical Education
Proposed Staff
(Version 1)
Budgeted Capacity
(Version 1)
Proposed Staff
(Version 5)
Budgeted Capacity
(Version 5)
Actual Staff (Programs)
Actual Student Capacity
Differences Differences
Auto Mechanics 1 27 1 27 1 27 0 0Auto Repair 1 27 1 27 1 27 0 0Building Maintenance 1 27 1 27 1 27 0 0Carpentry 1 27 1 27 1 27 0 0Computer Literacy 0 0 0 0 0 0 0 0Cosmetology 0 0 0 0 0 0 0 0Electric Work 1 27 1 27 1 27 0 0Electronics 1 27 1 27 1 27 0 0HVAC 0 0 0 0 0 0 0 0Machine Shop 0 0 0 0 0 0 0 0Masonry 1 27 0 0 0 0 0 0Office Technologies 1 27 1 27 1 27 0 0Plumbing 0 0 0 0 0 0 0 0Sheet Metal 0 0 0 0 0 0 0 0Small Engine Repair 1 27 1 27 1 27 0 0Welding 1 27 1 27 1 27 0 0TBD 0 0 0 0 0 0 0 0
TOTALS 10 270 9 243 9 243 0 0
PLEASANT VALLEY STATE PRISON (PVSP)
Programs at this institution are to include Academic Education and Career Technical Education. The tables below illustrate the planned and actual staffing and student capacities by program area:
(Actuals - Final)
PVSP is designated as a Standard Program Site.
FY 12-13 (Version 1) FY 12-13 (Version 5) July - August 2013

Second Report on CDCR’s Progress Implementing the Blueprint Page 144 Office of the Inspector General State of California
APPENDIX C: PROGRAMMING PLANS
Initial Blueprint Final Blueprint Actuals Differences
Academic EducationProposed
Staff (Version 1)
Budgeted Capacity
(Version 1)
Proposed Staff
(Version 5)
Budgeted Capacity
(Version 5)
Actual Staff (Programs)
Actual Student Capacity
Differences Differences
General Population 4 216 3 162 3 156 0 -6Alternative Programming 2 216 2 108 3 228 1 120Voluntary Educ. Program 9 1080 9 1080 8 960 -1 -120
TOTALS 15 1512 14 1350 14 1344 0 -6
Career Technical Education
Proposed Staff
(Version 1)
Budgeted Capacity
(Version 1)
Proposed Staff
(Version 5)
Budgeted Capacity
(Version 5)
Actual Staff (Programs)
Actual Student Capacity
Differences Differences
Auto Mechanics 0 0 0 0 0 0 0 0Auto Repair 0 0 0 0 0 0 0 0Building Maintenance 0 0 0 0 0 0 0 0Carpentry 1 27 1 27 0 0 -1 -27Computer Literacy 1 54 1 54 1 54 0 0Cosmetology 0 0 0 0 0 0 0 0Electric Work 0 0 0 0 0 0 0 0Electronics 1 27 1 27 0 0 -1 -27HVAC 1 27 1 27 0 0 -1 -27Machine Shop 1 27 1 27 1 27 0 0Masonry 0 0 0 0 0 0 0 0Office Technologies 0 0 0 0 0 0 0 0Plumbing 0 0 0 0 0 0 0 0Sheet Metal 0 0 0 0 0 0 0 0Small Engine Repair 0 0 0 0 0 0 0 0Welding 1 27 1 27 1 27 0 0TBD 0 0 0 0 0 0 0 0
TOTALS 6 189 6 189 3 108 -3 -81
RJD is designated as a Standard Program Site.
RICHARD J. DONOVAN CORRECTIONAL FACILITY (RJD)
Programs at this institution are to include Academic Education and Career Technical Education. The tables below illustrate the planned and actual staffing and student capacities by program area:
(Actuals - Final)FY 12-13 (Version 1) FY 12-13 (Version 5) July - August 2013

Second Report on CDCR’s Progress Implementing the Blueprint Page 145 Office of the Inspector General State of California
APPENDIX C: PROGRAMMING PLANS
Differences
Academic EducationProposed
Staff (Version 1)
Budgeted Capacity
(Version 1)
Proposed Staff
(Version 5)
Budgeted Capacity
(Version 5)
Actual Staff (Programs)
Actual Student Capacity
Differences Differences
General Population 6 324 6 324 6 324 0 0Alternative Programming 0 0 0 0 0 0 0 0Voluntary Educ. Program 5 600 5 600 5 600 0 0
TOTALS 11 924 11 924 11 924 0 0
Career Technical Education
Proposed Staff
(Version 1)
Budgeted Capacity
(Version 1)
Proposed Staff
(Version 5)
Budgeted Capacity
(Version 5)
Actual Staff (Programs)
Actual Student Capacity
Differences Differences
Auto Mechanics 0 0 0 0 0 0 0 0Auto Repair 0 0 0 0 0 0 0 0Building Maintenance 0 0 0 0 0 0 0 0Carpentry 0 0 0 0 0 0 0 0Computer Literacy 1 54 1 54 1 54 0 0Cosmetology 0 0 0 0 0 0 0 0Electric Work 0 0 0 0 0 0 0 0Electronics 0 0 0 0 0 0 0 0HVAC 0 0 0 0 0 0 0 0Machine Shop 0 0 0 0 0 0 0 0Masonry 0 0 0 0 0 0 0 0Office Technologies 0 0 0 0 0 0 0 0Plumbing 0 0 0 0 0 0 0 0Sheet Metal 0 0 0 0 0 0 0 0Small Engine Repair 0 0 0 0 0 0 0 0Welding 0 0 0 0 0 0 0 0TBD 0 0 0 0 0 0 0 0
TOTALS 1 54 1 54 1 54 0 0
SALINAS VALLEY STATE PRISON (SVSP)
Programs at this institution are to include Academic Education and Career Technical Education. The tables below illustrate the planned and actual staffing and student capacities by program area:
(Actuals - Final)FY 12-13 (Version 1) FY 12-13 (Version 5) July - August 2013
SVSP is designated as a Standard Program Site.
Initial Blueprint Final Blueprint Actuals

Second Report on CDCR’s Progress Implementing the Blueprint Page 146 Office of the Inspector General State of California
APPENDIX C: PROGRAMMING PLANS
Initial Blueprint Final Blueprint Actuals Differences
Academic EducationProposed
Staff (Version 1)
Budgeted Capacity
(Version 1)
Proposed Staff
(Version 5)
Budgeted Capacity
(Version 5)
Actual Staff (Programs)
Actual Student Capacity
Differences Differences
General Population 11 594 11 471 10 434 -1 -37Alternative Programming 0 0 0 0 0 0 0 0Voluntary Educ. Program 3 360 3 360 3 360 0 0
TOTALS 14 954 14 831 13 794 -1 -37
Career Technical Education
Proposed Staff
(Version 1)
Budgeted Capacity
(Version 1)
Proposed Staff
(Version 5)
Budgeted Capacity
(Version 5)
Actual Staff (Programs)
Actual Student Capacity
Differences Differences
Auto Mechanics 1 27 1 27 1 27 0 0Auto Repair 1 27 1 27 1 27 0 0Building Maintenance 1 27 1 27 0 0 -1 -27Carpentry 1 27 1 27 1 27 0 0Computer Literacy 0 0 0 0 0 0 0 0Cosmetology 0 0 0 0 0 0 0 0Electric Work 0 0 0 0 0 0 0 0Electronics 1 27 1 27 1 27 0 0HVAC 0 0 0 0 0 0 0 0Machine Shop 0 0 0 0 0 0 0 0Masonry 1 27 1 27 1 27 0 0Office Technologies 1 27 1 27 1 27 0 0Plumbing 0 0 0 0 0 0 0 0Sheet Metal 0 0 0 0 0 0 0 0Small Engine Repair 0 0 0 0 0 0 0 0Welding 1 27 1 27 1 27 0 0TBD 0 0 0 0 0 0 0 0
TOTALS 8 216 8 216 7 189 -1 -27
SCC is designated as a Standard Program Site.
SIERRA CONSERVATION CENTER (SCC)
Programs at this institution are to include Academic Education and Career Technical Education. The tables below illustrate the planned and actual staffing and student capacities by program area:
(Actuals - Final)FY 12-13 (Version 1) FY 12-13 (Version 5) July - August 2013

Second Report on CDCR’s Progress Implementing the Blueprint Page 147 Office of the Inspector General State of California
APPENDIX C: PROGRAMMING PLANS
Initial Blueprint * Final Blueprint Actuals Differences
Academic EducationProposed
Staff (Version 1)
Budgeted Capacity
(Version 1)
Proposed Staff
(Version 5)
Budgeted Capacity
(Version 5)
Actual Staff (Programs)
Actual Student Capacity
Differences Differences
General Population 10 540 9 486 7 378 -2 -108Alternative Programming 0 0 0 0 0 0 0 0Voluntary Educ. Program 4 480 5 600 7 642 2 42
TOTALS 14 1020 14 1086 14 1020 0 -66
Career Technical Education
Proposed Staff
(Version 1)
Budgeted Capacity
(Version 1)
Proposed Staff
(Version 5)
Budgeted Capacity
(Version 5)
Actual Staff (Programs)
Actual Student Capacity
Differences Differences
Auto Mechanics 1 27 1 27 0 0 -1 -27Auto Repair 0 0 0 0 0 0 0 0Building Maintenance 0 0 0 0 0 0 0 0Carpentry 1 27 0 0 0 0 0 0Computer Literacy 1 54 1 54 1 54 0 0Cosmetology 0 0 1 27 1 27 0 0Electric Work 0 0 0 0 0 0 0 0Electronics 1 27 1 27 1 27 0 0HVAC 0 0 0 0 0 0 0 0Machine Shop 0 0 0 0 0 0 0 0Masonry 0 0 0 0 0 0 0 0Office Technologies 1 27 1 27 1 27 0 0Plumbing 0 0 0 0 0 0 0 0Sheet Metal 0 0 0 0 0 0 0 0Small Engine Repair 0 0 1 27 1 27 0 0Welding 1 27 1 27 1 27 0 0TBD 0 0 0 0 0 0 0 0
TOTALS 6 189 7 216 6 189 -1 -27
Contract Treatment Programs
Student Capacity
(/Program) (Version 1)
Student Capacity (Annual)
(Version 1)
* Student Capacity
(/Program) (Version 5)
Student Capacity (Annual)
(Version 5)
Actual Students in
Program
Annual Student Capacity
(Projected)
Differences Differences
Substance Abuse 140 336 0 0 0 0 0 0Cognitive-Behavioral (None - commences 2013/14)Lifer Program (None - commences 2013/14)
TOTALS 140 336 0 0 0 0 0 0
Employment ProgramsProgram
Slots (Version 1)
Annual Served
(Version 1)
Program Slots
(Version 5)
Annual Served
(Version 5)
Inmates Served (Actual)
Annual Served
(Projected)Differences Differences
Transitions Program 20 228 20 228 0 0 -20 -228Identification (ID) Project 0 405 0 405 0 0 0 -405
TOTALS 20 633 20 633 0 0 -20 -633* The contract for the substance abuse treatment was to provide a gender responsive program for women; therefore, the slots couldnot be used when VSP converted to a male prison. The program was transferred to neighboring CCWF and a new contract for male inmates is in the works for FY 2013/14.
VSP is designated as a Re-Entry Hub.
VALLEY STATE PRISON (VSP)
Programs at this institution are to include Academic Education, Career Technical Education, Substance Abuse Treatment, Cognitive-Behavioral Programs (including criminal thinking, anger management, and family programming), Employment Training, and a cognitive behavioral based program for life-term inmates. The tables below illustrate the planned and actual staffing and student capacities by program area:
(Actuals - Final)FY 12-13 (Version 1) FY 12-13 (Version 5) July - August 2013

Second Report on CDCR’s Progress Implementing the Blueprint Page 148 Office of the Inspector General State of California
Initial Blueprint Final Blueprint Actuals Differences
Academic EducationProposed
Staff (Version 1)
Budgeted Capacity
(Version 1)
Proposed Staff
(Version 5)
Budgeted Capacity
(Version 5)
Actual Staff (Programs)
Actual Student Capacity
Differences Differences
General Population 0 0 0 0 0 0 0 0Alternative Programming 0 0 0 0 0 0 0 0Voluntary Educ. Program 4 480 4 480 4 480 0 0
TOTALS 4 480 4 480 4 480 0 0
Career Technical Education
Proposed Staff
(Version 1)
Budgeted Capacity
(Version 1)
Proposed Staff
(Version 5)
Budgeted Capacity
(Version 5)
Actual Staff (Programs)
Actual Student Capacity
Differences Differences
Auto Mechanics 0 0 0 0 0 0 0 0Auto Repair 0 0 0 0 0 0 0 0Building Maintenance 0 0 0 0 0 0 0 0Carpentry 0 0 0 0 0 0 0 0Computer Literacy 1 54 0 0 0 0 0 0Cosmetology 0 0 0 0 0 0 0 0Electric Work 0 0 0 0 0 0 0 0Electronics 0 0 1 27 1 27 0 0HVAC 0 0 0 0 0 0 0 0Machine Shop 0 0 0 0 0 0 0 0Masonry 0 0 0 0 0 0 0 0Office Technologies 1 27 1 27 1 27 0 0Plumbing 0 0 0 0 0 0 0 0Sheet Metal 0 0 0 0 0 0 0 0Small Engine Repair 0 0 0 0 0 0 0 0Welding 0 0 0 0 0 0 0 0TBD 0 0 0 0 0 0 0 0
TOTALS 2 81 2 54 2 54 0 0
WSP is designated as a Standard Program Site.
WASCO STATE PRISON (WSP)
Programs at this institution are to include Academic Education and Career Technical Education. The tables below illustrate the planned and actual staffing and student capacities by program area:
(Actuals - Final)FY 12-13 (Version 1) FY 12-13 (Version 5) July - August 2013
APPENDIX C: PROGRAMMING PLANS

Second Report on CDCR’s Progress Implementing the Blueprint Page 149 Office of the Inspector General State of California
APPENDIX D – CORE COMPAS ASSESSMENTS
The following displays the department’s status in completing core COMPAS assessments for each inmate to assess his or her rehabilitative needs. The data is as of July 30, 2013.
InstitutionInmate
Population
Inmates with
COMPAS
Inmates Without
COMPAS
Percent with
COMPAS
Avenal State Prison 4,439 2,303 2,136 51.9%
California Correctional Center 4,976 4,209 767 84.6%
California Correctional Institution 4,604 2,576 2,028 56.0%
California Health Care Facility 221 111 110 50.2%
California Institution for Men 4,796 2,554 2,242 53.3%
California Institution for Women 2,136 905 1,231 42.4%
California Medical Facility 2,343 680 1,663 29.0%
California Men's Colony 4,941 2,160 2,781 43.7%
California Rehabilitation Center 3,533 2,537 996 71.8%
California State Prison, Corcoran 4,265 1,739 2,526 40.8%
California State Prison, Los Angeles County 3,630 1,252 2,378 34.5%
California State Prison, Sacramento 2,247 680 1,567 30.3%
California State Prison, San Quentin 4,304 1,294 3,010 30.1%
California State Prison, Solano 3,984 1,616 2,368 40.6%California Substance Abuse Treatment Facility and State Prison, Corcoran 5,645 2,262 3,383 40.1%
Calipatria State Prison 3,649 1,593 2,056 43.7%
Centinela State Prison 2,907 1,285 1,622 44.2%
Central California Women's Facility 3,498 1,063 2,435 30.4%
Chuckawalla Valley State Prison 2,649 1,279 1,370 48.3%
Correctional Training Facility 5,263 2,506 2,757 47.6%
Deuel Vocational Institution 2,771 1,021 1,750 36.8%
Female Rehabilitative Community Correctional Center 26 18 8 69.2%
Folsom State Prison 2,706 1,137 1,569 42.0%
Folsom Women's Facility 238 105 133 44.1%
High Desert State Prison 3,291 1,779 1,512 54.1%
Ironwood State Prison 3,195 1,537 1,658 48.1%
Kern Valley State Prison 3,709 1,485 2,224 40.0%
Mule Creek State Prison 2,807 953 1,854 34.0%
North Kern State Prison 4,700 1,945 2,755 41.4%
Out of State Correctional Facilities-Various 8,957 4,073 4,884 45.5%
Pelican Bay State Prison 2,797 1,056 1,741 37.8%
Pleasant Valley State Prison 3,375 1,715 1,660 50.8%
Richard J. Donovan Correctional Facility 3,311 1,216 2,095 36.7%
Salinas Valley State Prison 3,524 1,153 2,371 32.7%
Sierra Conservation Center 4,902 3,356 1,546 68.5%
Valley State Prison 3,126 1,379 1,747 44.1%
Wasco State Prison 4,974 1,718 3,256 34.5%
TOTALS 132,439 60,250 72,189 45.5%

2013 Blueprint Monitoring Report
OFFICE OF THE INSPECTOR GENERAL
Robert A. Barton
INSPECTOR GENERAL
Roy W. Wesley CHIEF DEPUTY INSPECTOR GENERAL
STATE OF CALIFORNIA October 2013