Embed Size (px)
Citation preview
A Disclosure fact sheet is available on Pages 24-25 of this report.
SECOND QUARTER TOP PICKS 2011
Pricing as of March 31, 2011
Changes to Q2 2011 Top Picks
Added:
Air Canada (T-AC.A; AC.B)Cervus Equipment Corp (T-CVL)Equal Energy Ltd. (T-EQU)Hemisphere GPS (T-HEM)Premium Brands Holdings Corp. (T-PBH)Trican Well Service Ltd. (T-TCW)
Removed:
Bombardier Inc. (T-BBD.B)Arsenal Energy Inc. (T-AEI)Sunopta Inc. (T-SOY; Q-STKL)Tio Networks Corp. (V-TNC)
Air Canada.(T-AC.A; AC.B)
Cervus Equipment Corp.(T-CVL))
Equal Energy Ltd.(T-EQU)
Rocky Mountain Dealerships Inc.(T-RME)
Premium Brands Holdings Corp.(T-PBH)
Hemisphere GPS(T-HEM)
Trican Well Service Ltd. (T-TCW)
Q111 Top Picks
PI Top Picks 5.0%
TSX Index 5.0%
TSX Small Cap Index 3.7%
2 | Q211
TABLE OF CONTENTS
Q1 Top Picks In Line with Markets 3
Consumer Products and Special Situations
Sector Review 5
Premium Brands Holdings Corp (T-PBH) 7
Oil and Gas
Sector Review 8
Equal Energy Ltd. (T-EQU) 10
Special Situations
Sector Review 11
Rocky Mountain Dealerships Inc. (T-RME) 13
Cervus Equipment Corp. (T-CVL) 14
Technology
Sector Review 15
Hemisphere GPS. (T-HEM) 17
Transportation and Industrial
Sector Review 18
Air Canada (T-AC.A; AC.B) 20
Energy Services
Sector Review 21
Trican Well Service Ltd. (T-TCW) 23
Disclosure Fact Sheet 24
3 | Q211
Q1 TOP PICKS IN LINE WITH MARKETS
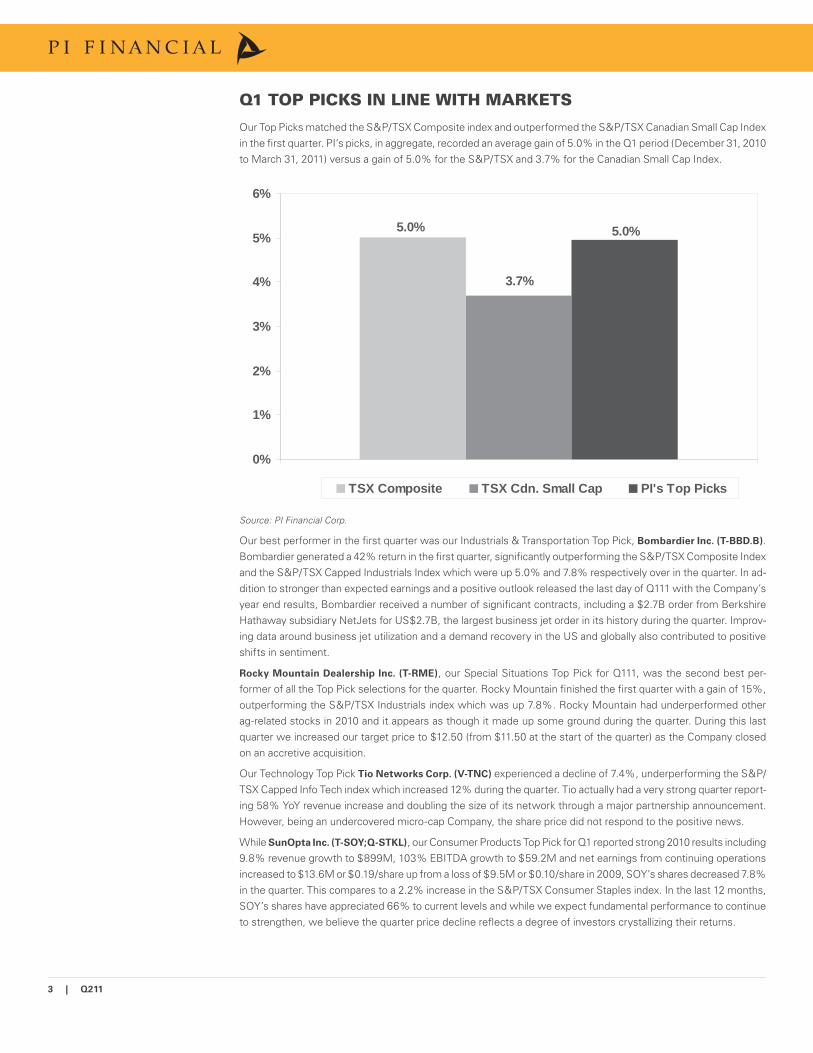
Our Top Picks matched the S&P/TSX Composite index and outperformed the S&P/TSX Canadian Small Cap Index in the fi rst quarter. PI’s picks, in aggregate, recorded an average gain of 5.0% in the Q1 period (December 31, 2010 to March 31, 2011) versus a gain of 5.0% for the S&P/TSX and 3.7% for the Canadian Small Cap Index.
5.0%
3.7%
5.0%
0%
1%
2%
3%
4%
5%
6%
TSX Composite TSX Cdn. Small Cap PI's Top Picks
Source: PI Financial Corp.
Our best performer in the fi rst quarter was our Industrials & Transportation Top Pick, Bombardier Inc. (T-BBD.B). Bombardier generated a 42% return in the fi rst quarter, signifi cantly outperforming the S&P/TSX Composite Index and the S&P/TSX Capped Industrials Index which were up 5.0% and 7.8% respectively over in the quarter. In ad-dition to stronger than expected earnings and a positive outlook released the last day of Q111 with the Company’s year end results, Bombardier received a number of signifi cant contracts, including a $2.7B order from Berkshire Hathaway subsidiary NetJets for US$2.7B, the largest business jet order in its history during the quarter. Improv-ing data around business jet utilization and a demand recovery in the US and globally also contributed to positive shifts in sentiment.
Rocky Mountain Dealership Inc. (T-RME), our Special Situations Top Pick for Q111, was the second best per-former of all the Top Pick selections for the quarter. Rocky Mountain fi nished the fi rst quarter with a gain of 15%, outperforming the S&P/TSX Industrials index which was up 7.8%. Rocky Mountain had underperformed other ag-related stocks in 2010 and it appears as though it made up some ground during the quarter. During this last quarter we increased our target price to $12.50 (from $11.50 at the start of the quarter) as the Company closed on an accretive acquisition.
Our Technology Top Pick Tio Networks Corp. (V-TNC) experienced a decline of 7.4%, underperforming the S&P/TSX Capped Info Tech index which increased 12% during the quarter. Tio actually had a very strong quarter report-ing 58% YoY revenue increase and doubling the size of its network through a major partnership announcement. However, being an undercovered micro-cap Company, the share price did not respond to the positive news.
While SunOpta Inc. (T-SOY;Q-STKL), our Consumer Products Top Pick for Q1 reported strong 2010 results including 9.8% revenue growth to $899M, 103% EBITDA growth to $59.2M and net earnings from continuing operations increased to $13.6M or $0.19/share up from a loss of $9.5M or $0.10/share in 2009, SOY’s shares decreased 7.8% in the quarter. This compares to a 2.2% increase in the S&P/TSX Consumer Staples index. In the last 12 months, SOY’s shares have appreciated 66% to current levels and while we expect fundamental performance to continue to strengthen, we believe the quarter price decline refl ects a degree of investors crystallizing their returns.
4 | Q211
Arsenal Energy. (T-AEI), our Oil & Gas Top Pick, was down 18% during the fi rst quarter, underperforming the S&P/TSX Capped Energy Index which was up 11%. Arsenal’s share price underperformance in Q1 pertains principally to certain stated operational and production hurdles not being achieved during the quarter. These operational de-lays are attributed to the frenzied level of industry activity underway in North Dakota –where the service industry cannot grow fast enough to keep up with demand. It seems unreasonable to us that Arsenal’s assets should be interpreted as decreasing under these circumstances. We would argue that this level of activity and excitement speaks to an increasing value for Arsenal’s North Dakota assets. We reiterate our BUY rating with a 12-month tar-
get price of $1.45, SPECULATIVE risk rating.
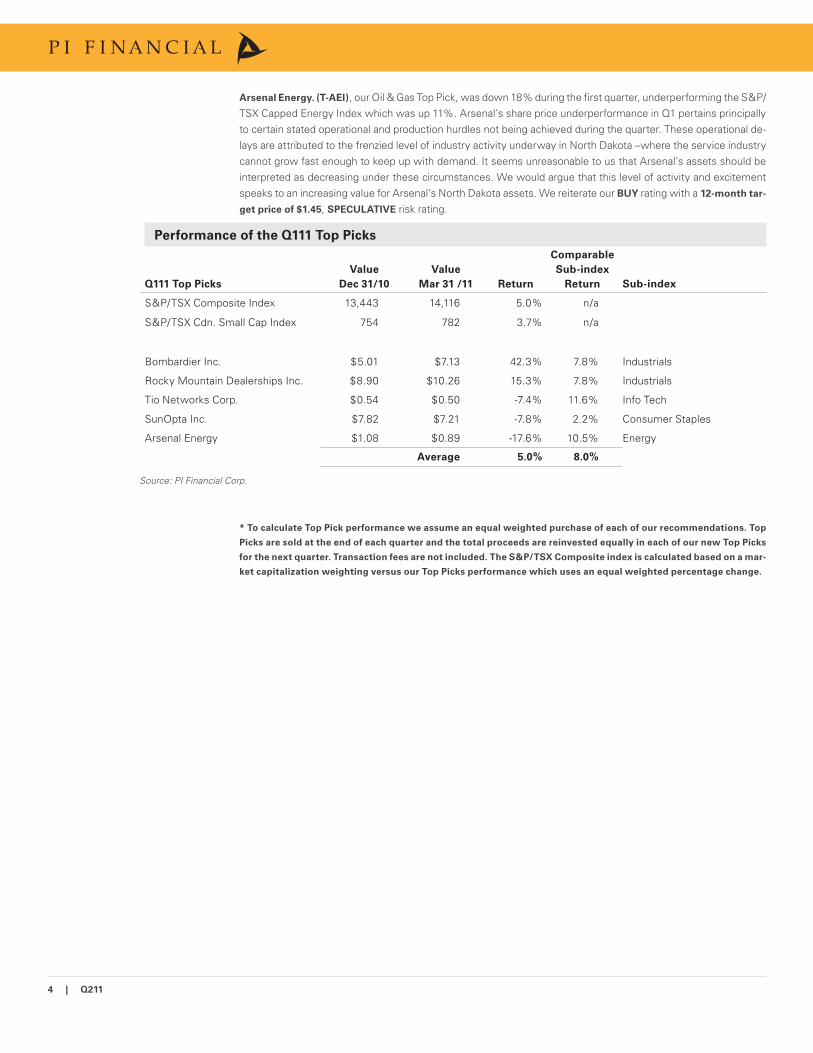
Performance of the Q111 Top Picks
Q111 Top Picks
Value
Dec 31/10
Value
Mar 31 /11 Return
Comparable
Sub-index
Return Sub-index
S&P/TSX Composite Index 13,443 14,116 5.0% n/a
S&P/TSX Cdn. Small Cap Index 754 782 3.7% n/a
Bombardier Inc. $5.01 $7.13 42.3% 7.8% Industrials
Rocky Mountain Dealerships Inc. $8.90 $10.26 15.3% 7.8% Industrials
Tio Networks Corp. $0.54 $0.50 -7.4% 11.6% Info Tech
SunOpta Inc. $7.82 $7.21 -7.8% 2.2% Consumer Staples
Arsenal Energy $1.08 $0.89 -17.6% 10.5% Energy
Average 5.0% 8.0%
Source: PI Financial Corp.
* To calculate Top Pick performance we assume an equal weighted purchase of each of our recommendations. Top
Picks are sold at the end of each quarter and the total proceeds are reinvested equally in each of our new Top Picks
for the next quarter. Transaction fees are not included. The S&P/TSX Composite index is calculated based on a mar-
ket capitalization weighting versus our Top Picks performance which uses an equal weighted percentage change.

5 | Q211 Sheila Broughton, MBA, CFA
SECTOR OVERVIEW
The market recovery continued in the fi rst quarter of 2011 in the North American markets. The S&P/TSX index increased 5.0% in Q111, building on the 14% return generated in 2010. In the US, the DJIA increased 8.3% in Q111, building on the 9.0% in 2010.
The Consumer Discretionary Index underperformed the general market in Q111 declining 2.5% breaking its outperformance trend which included a 22% increase in 2010.
The Consumer Staples Index continued to underperformed the general market but performed better than the Discretionary Index, increasing 2.2% in Q111 following an 8.9% return in 2010.
As a group, our Consumer Products covered companies continued to outperform the market generating an 8.5% return in Q111 following a 45% return in 2010 and a 77% return in 2009.
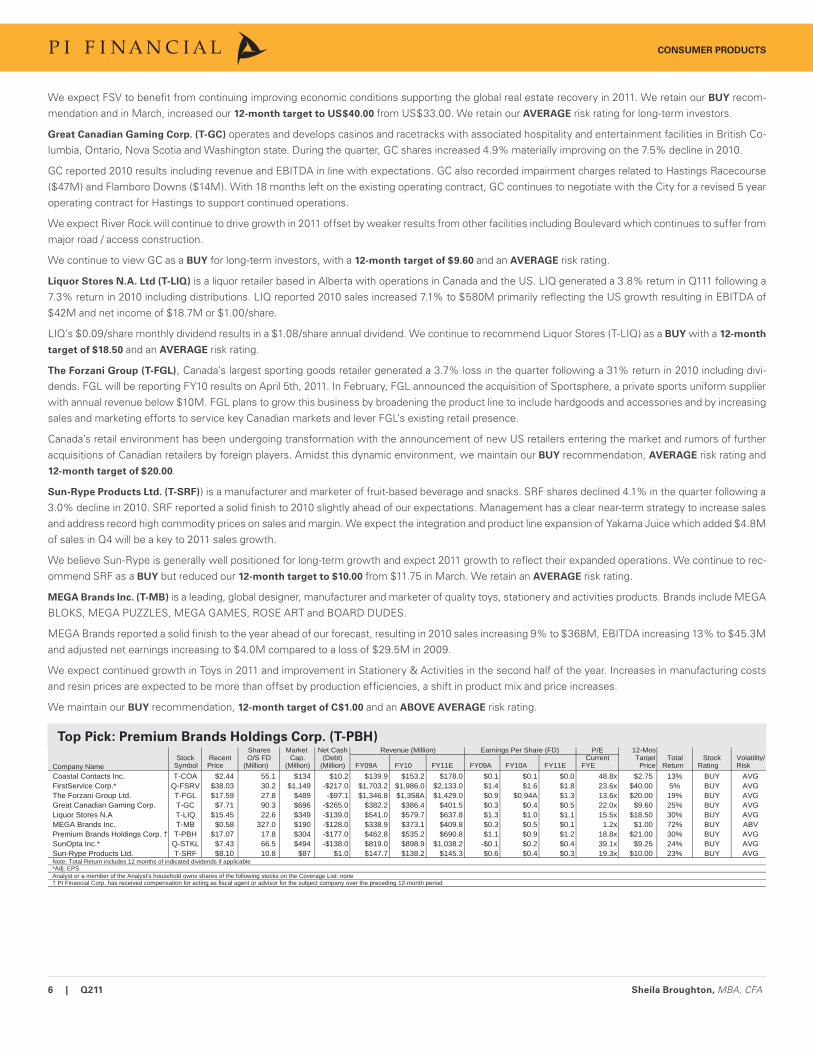
Strong Q111 returns were generated by Coastal Contacts Inc. (T-COA) up 47%, Premium Brands Holdings Corp. (T-PBH) up 24% and FirstService Corp. (T-FSV; Q-FSRV) up 22%.
SECTOR OUTLOOK
We expect the general North American economic recovery to continue in 2011 and expect economic growth will support generally positive returns for the consumer products sectors in 2011. Benefi tting from stronger prices for commodities, Canada is expected to lead growth among the G7 economies in the fi rst half of 2011.
We expect Canadian consumer products companies will alter pricing strategies, packaging formats and sizes where appropriate and focus on improved operating effi ciency to protect gross margin levels with higher priced commodity inputs. We anticipate further consolidation in certain consumer products sectors, especially in the areas of food production and retail.
COVERAGE LIST OVERVIEW
SunOpta Inc. (T-SOY; Q-STKL) our Q111 Consumer Products Top Pick did not continue to generate positive returns in the quarter. Following a 120% re-turn in 2010, SOY shares declined 7.8% in Q111 despite reporting strong 2010 results including 9.8% revenue growth to $899M, 103% EBITDA growth to $59.2M and net earnings from continuing operations increasing to $13.6M or $0.19/share up from a loss of $9.5M or $0.10/share in 2009. SOY under-performed the S&P/TSX Consumer Staples index which increased 2.2% in the quarter.
SunOpta has developed a solid operating base with a vertically integrated business model focused within growing niche markets. Management remains focused on improving their EBITDA margins, operating margins and return on assets employed toward their target levels of 10%, 8% and 15% respectively.
We expect future growth in SOY’s price to be driven by fundamental performance and we maintain our BUY recommendation, 12-month target of US$9.25 and AVERAGE risk rating.
Coastal Contacts Inc. (T-COA)is a rapidly growing direct-to-consumer retailer of vision care products in North America, Europe and Asia Pacifi c. COA was our best consumer products stock in the quarter, up 47% building on their 18% increase in 2010. Coastal Contacts recently reported Q111 results including 13% revenue growth to $40.6M, including a 64% increase in eyeglasses sales to $6.3M.
We expect FY11 growth to be driven by eyeglasses growth of 100% supported by contact lenses growth of 3-4%. We maintain our BUY recommendation and AVERAGE risk rating and in March we increased our 12-month target to $2.75 per share.
Premium Brands Holdings Corp. (T-PBH)is a manufacturer, marketer and distributor of high quality, branded food products primarily in western Canada. PBH shares generated a 24% return in the quarter following an 11% return in 2010 including dividends.
PBH reported strong 2010 results including record revenue and EBITDA in challenging conditions and rapid commodity price increases. PBH completed 5 acquisitions in 2010 and in February, 2011 acquired Les Aliments Deli Chef, the sandwich operations and direct-to-store delivery network of Canada Bread Company (T-CBY) for $8M. We expect further acquisitions to be key components of 2011 growth.
We maintain our BUY recommendation, and AVERAGE risk rating and in March increased our 12-month target to $21.00 from $16.25.
FirstService Corporation (T-FSV; Q-FSRV) ) is a diversifi ed property services company providing commercial real estate services, residential property manage-ment services and property improvement services. FirstService shares continued to perform very strongly, up 22% in Q111 following a 48% return in 2010.
FirstService reported 2010 results including a 17% increase in revenue to $1,986M, an 11% increase in adjusted EBITDA to $147M and a 13% increase in adjusted EPS to $1.61/share.
CONSUMER PRODUCTS
Sheila Broughton
MBA, CFA
604.664.2695sheilab@pifi nancialcorp.com
REL
ATIV
E PE
RFO
RM
AN
CE
vs. T
SX C
OM
POSI
TE
95
100
105
110
Jan 11 Feb 11 Mar 11
S&P/TSX Composite IndexS&P/TSX Consumer StaplesS&P/TSX Consumer Discretionary
6 | Q211 Sheila Broughton, MBA, CFA
We expect FSV to benefi t from continuing improving economic conditions supporting the global real estate recovery in 2011. We retain our BUY recom-mendation and in March, increased our 12-month target to US$40.00 from US$33.00. We retain our AVERAGE risk rating for long-term investors.
Great Canadian Gaming Corp. (T-GC) operates and develops casinos and racetracks with associated hospitality and entertainment facilities in British Co-lumbia, Ontario, Nova Scotia and Washington state. During the quarter, GC shares increased 4.9% materially improving on the 7.5% decline in 2010.
GC reported 2010 results including revenue and EBITDA in line with expectations. GC also recorded impairment charges related to Hastings Racecourse ($47M) and Flamboro Downs ($14M). With 18 months left on the existing operating contract, GC continues to negotiate with the City for a revised 5 year operating contract for Hastings to support continued operations.
We expect River Rock will continue to drive growth in 2011 offset by weaker results from other facilities including Boulevard which continues to suffer from major road / access construction.
We continue to view GC as a BUY for long-term investors, with a 12-month target of $9.60 and an AVERAGE risk rating.
Liquor Stores N.A. Ltd (T-LIQ) is a liquor retailer based in Alberta with operations in Canada and the US. LIQ generated a 3.8% return in Q111 following a 7.3% return in 2010 including distributions. LIQ reported 2010 sales increased 7.1% to $580M primarily refl ecting the US growth resulting in EBITDA of $42M and net income of $18.7M or $1.00/share.
LIQ’s $0.09/share monthly dividend results in a $1.08/share annual dividend. We continue to recommend Liquor Stores (T-LIQ) as a BUY with a 12-month
target of $18.50 and an AVERAGE risk rating.
The Forzani Group (T-FGL), Canada’s largest sporting goods retailer generated a 3.7% loss in the quarter following a 31% return in 2010 including divi-dends. FGL will be reporting FY10 results on April 5th, 2011. In February, FGL announced the acquisition of Sportsphere, a private sports uniform supplier with annual revenue below $10M. FGL plans to grow this business by broadening the product line to include hardgoods and accessories and by increasing sales and marketing efforts to service key Canadian markets and lever FGL’s existing retail presence.
Canada’s retail environment has been undergoing transformation with the announcement of new US retailers entering the market and rumors of further acquisitions of Canadian retailers by foreign players. Amidst this dynamic environment, we maintain our BUY recommendation, AVERAGE risk rating and 12-month target of $20.00.
Sun-Rype Products Ltd. (T-SRF)) is a manufacturer and marketer of fruit-based beverage and snacks. SRF shares declined 4.1% in the quarter following a 3.0% decline in 2010. SRF reported a solid fi nish to 2010 slightly ahead of our expectations. Management has a clear near-term strategy to increase sales and address record high commodity prices on sales and margin. We expect the integration and product line expansion of Yakama Juice which added $4.8M of sales in Q4 will be a key to 2011 sales growth.
We believe Sun-Rype is generally well positioned for long-term growth and expect 2011 growth to refl ect their expanded operations. We continue to rec-ommend SRF as a BUY but reduced our 12-month target to $10.00 from $11.75 in March. We retain an AVERAGE risk rating.
MEGA Brands Inc. (T-MB) is a leading, global designer, manufacturer and marketer of quality toys, stationery and activities products. Brands include MEGA BLOKS, MEGA PUZZLES, MEGA GAMES, ROSE ART and BOARD DUDES.
MEGA Brands reported a solid fi nish to the year ahead of our forecast, resulting in 2010 sales increasing 9% to $368M, EBITDA increasing 13% to $45.3M and adjusted net earnings increasing to $4.0M compared to a loss of $29.5M in 2009.
We expect continued growth in Toys in 2011 and improvement in Stationery & Activities in the second half of the year. Increases in manufacturing costs and resin prices are expected to be more than offset by production effi ciencies, a shift in product mix and price increases.
We maintain our BUY recommendation, 12-month target of C$1.00 and an ABOVE AVERAGE risk rating.
Top Pick: Premium Brands Holdings Corp. (T-PBH)Shares Market Net Cash Revenue (Million) Earnings Per Share (FD) P/E 12-Mos
Stock Recent O/S FD Cap. (Debt) Current Target Total Stock Volatility/Symbol Price (Million) (Million) (Million) FY09A FY10 FY11E FY09A FY10A FY11E FYE Price Return Rating Risk
Coastal Contacts Inc. T-COA $2.44 55.1 $134 $10.2 $139.9 $153.2 $178.0 $0.1 $0.1 $0.0 48.8x $2.75 13% BUY AVGFirstService Corp.* Q-FSRV $38.03 30.2 $1,149 -$217.0 $1,703.2 $1,986.0 $2,133.0 $1.4 $1.6 $1.8 23.6x $40.00 5% BUY AVGThe Forzani Group Ltd. T-FGL $17.59 27.8 $489 -$97.1 $1,346.8 $1,358A $1,429.0 $0.9 $0.94A $1.3 13.6x $20.00 19% BUY AVGGreat Canadian Gaming Corp. T-GC $7.71 90.3 $696 -$265.0 $382.2 $386.4 $401.5 $0.3 $0.4 $0.5 22.0x $9.60 25% BUY AVGLiquor Stores N.A T-LIQ $15.45 22.6 $349 -$139.0 $541.0 $579.7 $637.8 $1.3 $1.0 $1.1 15.5x $18.50 30% BUY AVGMEGA Brands Inc. T-MB $0.58 327.0 $190 -$128.0 $338.9 $373.1 $409.8 $0.3 $0.5 $0.1 1.2x $1.00 72% BUY ABVPremium Brands Holdings Corp. † T-PBH $17.07 17.8 $304 -$177.0 $462.8 $535.2 $690.8 $1.1 $0.9 $1.2 18.8x $21.00 30% BUY AVGSunOpta Inc.* Q-STKL $7.43 66.5 $494 -$138.0 $819.0 $898.9 $1,038.2 -$0.1 $0.2 $0.4 39.1x $9.25 24% BUY AVGSun-Rype Products Ltd. T-SRF $8.10 10.8 $87 $1.0 $147.7 $138.2 $145.3 $0.6 $0.4 $0.3 19.3x $10.00 23% BUY AVG
† PI Financial Corp. has received compensation for acting as fiscal agent or advisor for the subject company over the preceding 12-month periodAnalyst or a member of the Analyst's household owns shares of the following stocks on the Coverage List: none
Company Name
Note: Total Return includes 12 months of indicated dividends if applicable*Adj. EPS
CONSUMER PRODUCTS
7 | Q211 Sheila Broughton, MBA, CFA
-
50
100
150
200
250
300
350
Mar-10 May-10 Jul-10 Sep-10 Nov-10 Jan-11 Mar-11$4.00
$6.00
$8.00
$10.00
$12.00
$14.00
$16.00
$18.00
Opinion and Share Information
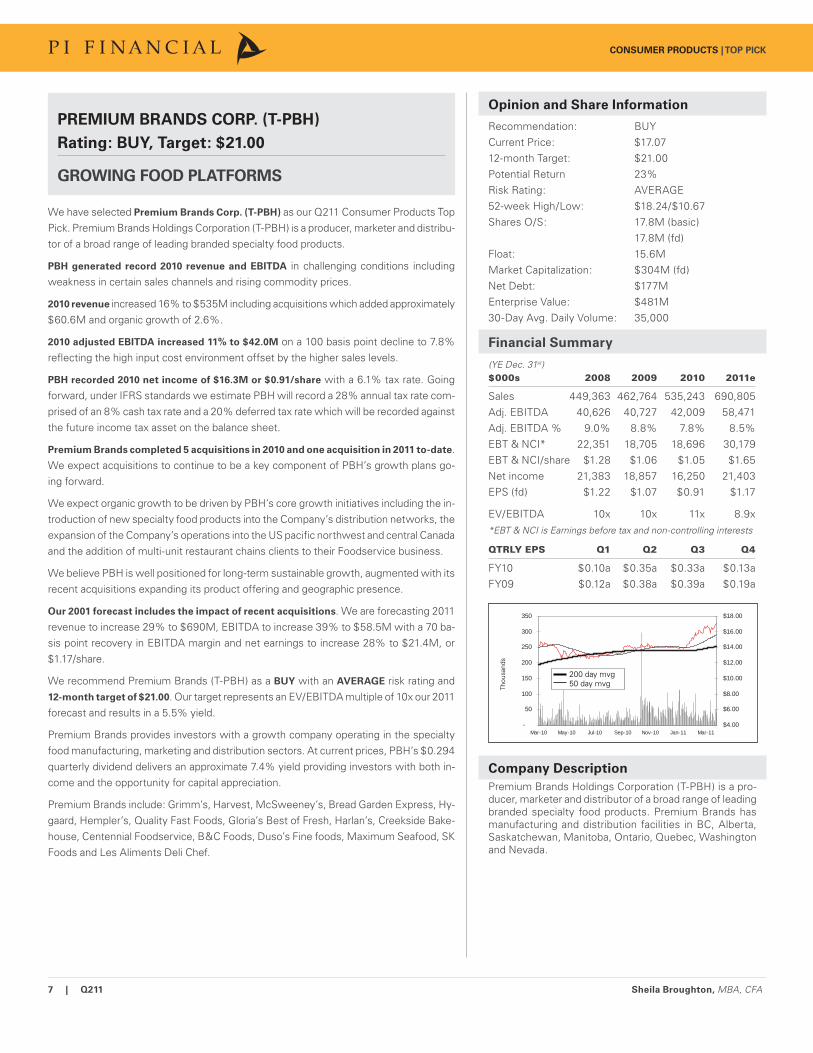
Recommendation: BUYCurrent Price: $17.0712-month Target: $21.00Potential Return 23%Risk Rating: AVERAGE52-week High/Low: $18.24/$10.67Shares O/S: 17.8M (basic) 17.8M (fd)Float: 15.6M Market Capitalization: $304M (fd)Net Debt: $177MEnterprise Value: $481M30-Day Avg. Daily Volume: 35,000
Financial Summary
(YE Dec. 31st)$000s 2008 2009 2010 2011e
Sales 449,363 462,764 535,243 690,805Adj. EBITDA 40,626 40,727 42,009 58,471Adj. EBITDA % 9.0% 8.8% 7.8% 8.5%EBT & NCI* 22,351 18,705 18,696 30,179EBT & NCI/share $1.28 $1.06 $1.05 $1.65Net income 21,383 18,857 16,250 21,403EPS (fd) $1.22 $1.07 $0.91 $1.17
EV/EBITDA 10x 10x 11x 8.9x*EBT & NCI is Earnings before tax and non-controlling interests
QTRLY EPS Q1 Q2 Q3 Q4
FY10 $0.10a $0.35a $0.33a $0.13aFY09 $0.12a $0.38a $0.39a $0.19a
Thou
sand
s
Company Description
Premium Brands Holdings Corporation (T-PBH) is a pro-ducer, marketer and distributor of a broad range of leading branded specialty food products. Premium Brands has manufacturing and distribution facilities in BC, Alberta, Saskatchewan, Manitoba, Ontario, Quebec, Washington and Nevada.
PREMIUM BRANDS CORP. (T-PBH)
Rating: BUY, Target: $21.00
GROWING FOOD PLATFORMS
We have selected Premium Brands Corp. (T-PBH) as our Q211 Consumer Products Top Pick. Premium Brands Holdings Corporation (T-PBH) is a producer, marketer and distribu-tor of a broad range of leading branded specialty food products.
PBH generated record 2010 revenue and EBITDA in challenging conditions including weakness in certain sales channels and rising commodity prices.
2010 revenue increased 16% to $535M including acquisitions which added approximately $60.6M and organic growth of 2.6%.
2010 adjusted EBITDA increased 11% to $42.0M on a 100 basis point decline to 7.8% refl ecting the high input cost environment offset by the higher sales levels.
PBH recorded 2010 net income of $16.3M or $0.91/share with a 6.1% tax rate. Going forward, under IFRS standards we estimate PBH will record a 28% annual tax rate com-prised of an 8% cash tax rate and a 20% deferred tax rate which will be recorded against the future income tax asset on the balance sheet.
Premium Brands completed 5 acquisitions in 2010 and one acquisition in 2011 to-date. We expect acquisitions to continue to be a key component of PBH’s growth plans go-ing forward.
We expect organic growth to be driven by PBH’s core growth initiatives including the in-troduction of new specialty food products into the Company’s distribution networks, the expansion of the Company’s operations into the US pacifi c northwest and central Canada and the addition of multi-unit restaurant chains clients to their Foodservice business.
We believe PBH is well positioned for long-term sustainable growth, augmented with its recent acquisitions expanding its product offering and geographic presence.
Our 2001 forecast includes the impact of recent acquisitions. We are forecasting 2011 revenue to increase 29% to $690M, EBITDA to increase 39% to $58.5M with a 70 ba-sis point recovery in EBITDA margin and net earnings to increase 28% to $21.4M, or $1.17/share.
We recommend Premium Brands (T-PBH) as a BUY with an AVERAGE risk rating and 12-month target of $21.00. Our target represents an EV/EBITDA multiple of 10x our 2011 forecast and results in a 5.5% yield.
Premium Brands provides investors with a growth company operating in the specialty food manufacturing, marketing and distribution sectors. At current prices, PBH’s $0.294 quarterly dividend delivers an approximate 7.4% yield providing investors with both in-come and the opportunity for capital appreciation.
Premium Brands include: Grimm’s, Harvest, McSweeney’s, Bread Garden Express, Hy-gaard, Hempler’s, Quality Fast Foods, Gloria’s Best of Fresh, Harlan’s, Creekside Bake-house, Centennial Foodservice, B&C Foods, Duso’s Fine foods, Maximum Seafood, SK Foods and Les Aliments Deli Chef.
CONSUMER PRODUCTS | TOP PICK
200 day mvg50 day mvg
8 | Q211 Alistair Toward, B.Comm, CFA
OIL & GAS
SECTOR OVERVIEW
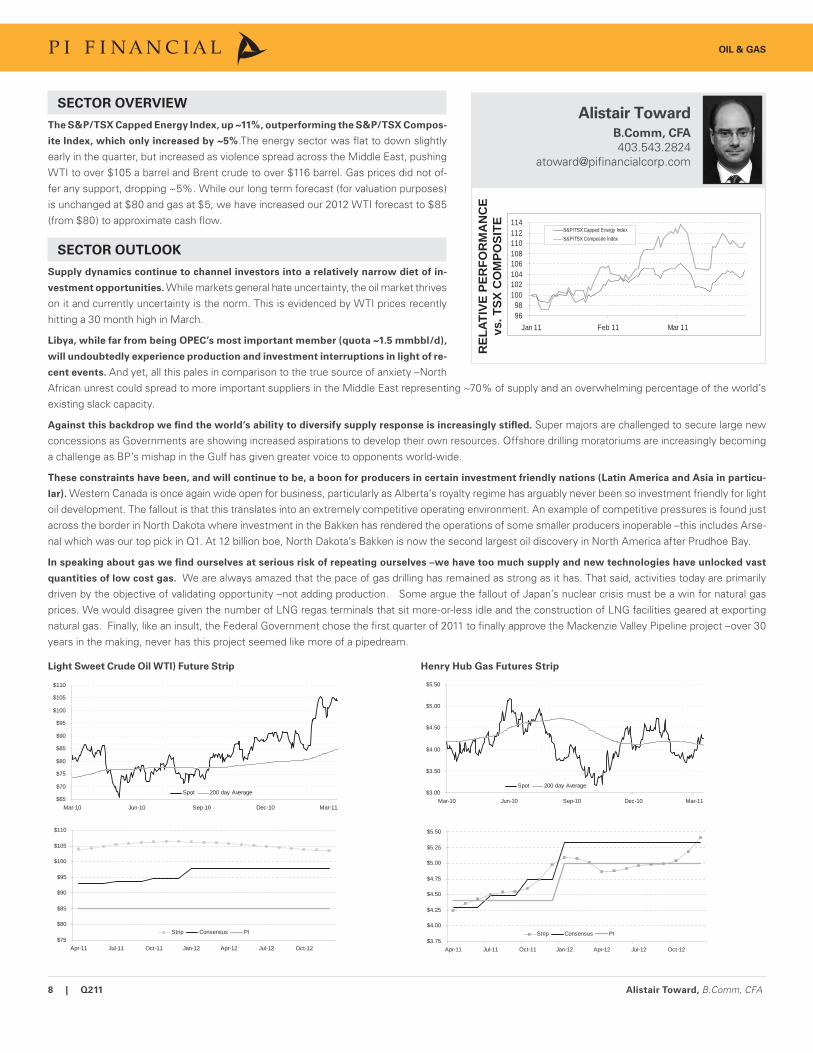
The S&P/TSX Capped Energy Index, up ~11%, outperforming the S&P/TSX Compos-
ite Index, which only increased by ~5%.The energy sector was fl at to down slightly early in the quarter, but increased as violence spread across the Middle East, pushing WTI to over $105 a barrel and Brent crude to over $116 barrel. Gas prices did not of-fer any support, dropping ~5%. While our long term forecast (for valuation purposes) is unchanged at $80 and gas at $5, we have increased our 2012 WTI forecast to $85 (from $80) to approximate cash fl ow.
SECTOR OUTLOOK
Supply dynamics continue to channel investors into a relatively narrow diet of in-
vestment opportunities. While markets general hate uncertainty, the oil market thrives on it and currently uncertainty is the norm. This is evidenced by WTI prices recently hitting a 30 month high in March.
Libya, while far from being OPEC’s most important member (quota ~1.5 mmbbl/d),
will undoubtedly experience production and investment interruptions in light of re-
cent events. And yet, all this pales in comparison to the true source of anxiety –North African unrest could spread to more important suppliers in the Middle East representing ~70% of supply and an overwhelming percentage of the world’s existing slack capacity.
Against this backdrop we fi nd the world’s ability to diversify supply response is increasingly stifl ed. Super majors are challenged to secure large new concessions as Governments are showing increased aspirations to develop their own resources. Offshore drilling moratoriums are increasingly becoming a challenge as BP’s mishap in the Gulf has given greater voice to opponents world-wide.
These constraints have been, and will continue to be, a boon for producers in certain investment friendly nations (Latin America and Asia in particu-
lar). Western Canada is once again wide open for business, particularly as Alberta’s royalty regime has arguably never been so investment friendly for light oil development. The fallout is that this translates into an extremely competitive operating environment. An example of competitive pressures is found just across the border in North Dakota where investment in the Bakken has rendered the operations of some smaller producers inoperable –this includes Arse-nal which was our top pick in Q1. At 12 billion boe, North Dakota’s Bakken is now the second largest oil discovery in North America after Prudhoe Bay.
In speaking about gas we fi nd ourselves at serious risk of repeating ourselves –we have too much supply and new technologies have unlocked vast
quantities of low cost gas. We are always amazed that the pace of gas drilling has remained as strong as it has. That said, activities today are primarily driven by the objective of validating opportunity –not adding production. Some argue the fallout of Japan’s nuclear crisis must be a win for natural gas prices. We would disagree given the number of LNG regas terminals that sit more-or-less idle and the construction of LNG facilities geared at exporting natural gas. Finally, like an insult, the Federal Government chose the fi rst quarter of 2011 to fi nally approve the Mackenzie Valley Pipeline project –over 30 years in the making, never has this project seemed like more of a pipedream.
Light Sweet Crude Oil WTI) Future Strip
$65
$70
$75
$80
$85
$90
$95
$100
$105
$110
Mar-10 Jun-10 Sep-10 Dec-10 Mar-11
Spot 200 day Average
$75
$80
$85
$90
$95
$100
$105
$110
Apr-11 Jul-11 Oct-11 Jan-12 Apr-12 Jul-12 Oct-12
Strip Consensus PI
Henry Hub Gas Futures Strip
$3.00
$3.50
$4.00
$4.50
$5.00
$5.50
Mar-10 Jun-10 Sep-10 Dec-10 Mar-11
Spot 200 day Average
$3.75
$4.00
$4.25
$4.50
$4.75
$5.00
$5.25
$5.50
Apr-11 Jul-11 Oct-11 Jan-12 Apr-12 Jul-12 Oct-12
Strip Consensus PI
REL
ATIV
E PE
RFO
RM
AN
CE
vs. T
SX C
OM
POSI
TE
Alistair Toward
B.Comm, CFA
403.543.2824atoward@pifi nancialcorp.com
9698
100102104106108110112114
Jan 11 Feb 11 Mar 11
S&P/TSX Capped Energy IndexS&P/TSX Composite Index
9 | Q211 Alistair Toward, B.Comm, CFA
COVERAGE LIST OVERVIEW
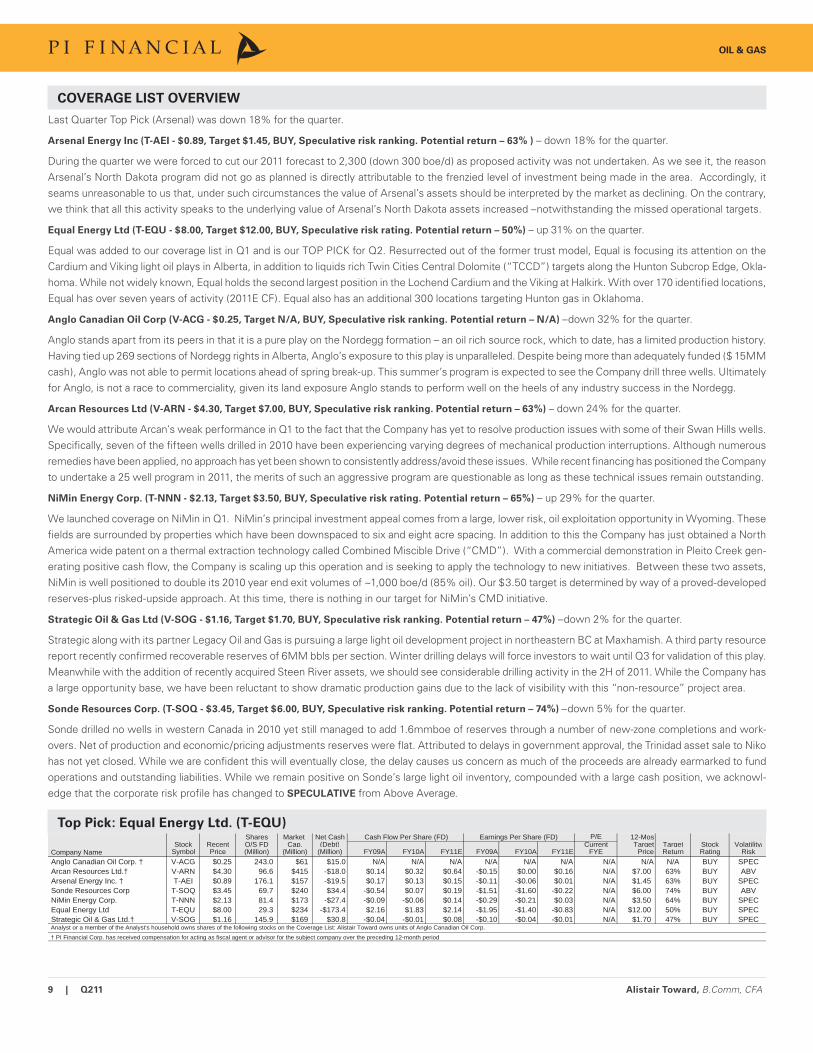
Last Quarter Top Pick (Arsenal) was down 18% for the quarter.
Arsenal Energy Inc (T-AEI - $0.89, Target $1.45, BUY, Speculative risk ranking. Potential return – 63% ) – down 18% for the quarter.
During the quarter we were forced to cut our 2011 forecast to 2,300 (down 300 boe/d) as proposed activity was not undertaken. As we see it, the reason Arsenal’s North Dakota program did not go as planned is directly attributable to the frenzied level of investment being made in the area. Accordingly, it seams unreasonable to us that, under such circumstances the value of Arsenal’s assets should be interpreted by the market as declining. On the contrary, we think that all this activity speaks to the underlying value of Arsenal’s North Dakota assets increased –notwithstanding the missed operational targets.
Equal Energy Ltd (T-EQU - $8.00, Target $12.00, BUY, Speculative risk rating. Potential return – 50%) – up 31% on the quarter.
Equal was added to our coverage list in Q1 and is our TOP PICK for Q2. Resurrected out of the former trust model, Equal is focusing its attention on the Cardium and Viking light oil plays in Alberta, in addition to liquids rich Twin Cities Central Dolomite (“TCCD”) targets along the Hunton Subcrop Edge, Okla-homa. While not widely known, Equal holds the second largest position in the Lochend Cardium and the Viking at Halkirk. With over 170 identifi ed locations, Equal has over seven years of activity (2011E CF). Equal also has an additional 300 locations targeting Hunton gas in Oklahoma.
Anglo Canadian Oil Corp (V-ACG - $0.25, Target N/A, BUY, Speculative risk ranking. Potential return – N/A) –down 32% for the quarter.
Anglo stands apart from its peers in that it is a pure play on the Nordegg formation – an oil rich source rock, which to date, has a limited production history. Having tied up 269 sections of Nordegg rights in Alberta, Anglo’s exposure to this play is unparalleled. Despite being more than adequately funded ($ 15MM cash), Anglo was not able to permit locations ahead of spring break-up. This summer’s program is expected to see the Company drill three wells. Ultimately for Anglo, is not a race to commerciality, given its land exposure Anglo stands to perform well on the heels of any industry success in the Nordegg.
Arcan Resources Ltd (V-ARN - $4.30, Target $7.00, BUY, Speculative risk ranking. Potential return – 63%) – down 24% for the quarter.
We would attribute Arcan’s weak performance in Q1 to the fact that the Company has yet to resolve production issues with some of their Swan Hills wells. Specifi cally, seven of the fi fteen wells drilled in 2010 have been experiencing varying degrees of mechanical production interruptions. Although numerous remedies have been applied, no approach has yet been shown to consistently address/avoid these issues. While recent fi nancing has positioned the Company to undertake a 25 well program in 2011, the merits of such an aggressive program are questionable as long as these technical issues remain outstanding.
NiMin Energy Corp. (T-NNN - $2.13, Target $3.50, BUY, Speculative risk rating. Potential return – 65%) – up 29% for the quarter.
We launched coverage on NiMin in Q1. NiMin’s principal investment appeal comes from a large, lower risk, oil exploitation opportunity in Wyoming. These fi elds are surrounded by properties which have been downspaced to six and eight acre spacing. In addition to this the Company has just obtained a North America wide patent on a thermal extraction technology called Combined Miscible Drive (“CMD”). With a commercial demonstration in Pleito Creek gen-erating positive cash fl ow, the Company is scaling up this operation and is seeking to apply the technology to new initiatives. Between these two assets, NiMin is well positioned to double its 2010 year end exit volumes of ~1,000 boe/d (85% oil). Our $3.50 target is determined by way of a proved-developed reserves-plus risked-upside approach. At this time, there is nothing in our target for NiMin’s CMD initiative.
Strategic Oil & Gas Ltd (V-SOG - $1.16, Target $1.70, BUY, Speculative risk ranking. Potential return – 47%) –down 2% for the quarter.
Strategic along with its partner Legacy Oil and Gas is pursuing a large light oil development project in northeastern BC at Maxhamish. A third party resource report recently confi rmed recoverable reserves of 6MM bbls per section. Winter drilling delays will force investors to wait until Q3 for validation of this play. Meanwhile with the addition of recently acquired Steen River assets, we should see considerable drilling activity in the 2H of 2011. While the Company has a large opportunity base, we have been reluctant to show dramatic production gains due to the lack of visibility with this “non-resource” project area.
Sonde Resources Corp. (T-SOQ - $3.45, Target $6.00, BUY, Speculative risk ranking. Potential return – 74%) –down 5% for the quarter.
Sonde drilled no wells in western Canada in 2010 yet still managed to add 1.6mmboe of reserves through a number of new-zone completions and work-overs. Net of production and economic/pricing adjustments reserves were fl at. Attributed to delays in government approval, the Trinidad asset sale to Niko has not yet closed. While we are confi dent this will eventually close, the delay causes us concern as much of the proceeds are already earmarked to fund operations and outstanding liabilities. While we remain positive on Sonde’s large light oil inventory, compounded with a large cash position, we acknowl-edge that the corporate risk profi le has changed to SPECULATIVE from Above Average.
Top Pick: Equal Energy Ltd. (T-EQU)Shares Market Net Cash Cash Flow Per Share (FD) Earnings Per Share (FD) P/E 12-Mos
Stock Recent O/S FD Cap. (Debt) Current Target Target Stock Volatility/Symbol Price (Million) (Million) (Million) FY09A FY10A FY11E FY09A FY10A FY11E FYE Price Return Rating Risk
Anglo Canadian Oil Corp. † V-ACG $0.25 243.0 $61 $15.0 N/A N/A N/A N/A N/A N/A N/A N/A N/A BUY SPECArcan Resources Ltd.† V-ARN $4.30 96.6 $415 -$18.0 $0.14 $0.32 $0.64 -$0.15 $0.00 $0.16 N/A $7.00 63% BUY ABVArsenal Energy Inc. † T-AEI $0.89 176.1 $157 -$19.5 $0.17 $0.13 $0.15 -$0.11 -$0.06 $0.01 N/A $1.45 63% BUY SPECSonde Resources Corp T-SOQ $3.45 69.7 $240 $34.4 -$0.54 $0.07 $0.19 -$1.51 -$1.60 -$0.22 N/A $6.00 74% BUY ABVNiMin Energy Corp. T-NNN $2.13 81.4 $173 -$27.4 -$0.09 -$0.06 $0.14 -$0.29 -$0.21 $0.03 N/A $3.50 64% BUY SPECEqual Energy Ltd T-EQU $8.00 29.3 $234 -$173.4 $2.16 $1.83 $2.14 -$1.95 -$1.40 -$0.83 N/A $12.00 50% BUY SPECStrategic Oil & Gas Ltd.† V-SOG $1.16 145.9 $169 $30.8 -$0.04 -$0.01 $0.08 -$0.10 -$0.04 -$0.01 N/A $1.70 47% BUY SPECAnalyst or a member of the Analyst's household owns shares of the following stocks on the Coverage List: Alistair Toward owns units of Anglo Canadian Oil Corp.
Company Name
† PI Financial Corp. has received compensation for acting as fiscal agent or advisor for the subject company over the preceding 12-month period
OIL & GAS

10 | Q211 Alistair Toward, B.Comm, CFA
-
50
100
150
200
250
300
350
Mar-10 May-10 Jul-10 Sep-10 Nov-10 Jan-11 Mar-11$-
$1.00
$2.00
$3.00
$4.00
$5.00
$6.00
$7.00
$8.00
$9.00
$10.00
Opinion and Share Information
Recommendation: BUYCurrent Price: $8.00Potential Return: 50%Risk: SPECULATIVEShares O/S: 27.7MM (basic) 29.3MM (fd)Market Capitalization: $222MM52-week Range: $9.24/$4.4130 Day Ave Trading Volume: 86,511 Enterprise Value: $395MM
Financial Summary
Assumptions 2009A 2010A 2011E 2012E
Oil (US$/bbl) $62.09 $79.50 $85.00 $85.00Gas (US$/mmbtu) $4.16 $4.38 $4.40 $5.00Exchange Rate (US$/C$) $0.88 $0.97 $1.00 $1.00Light Oil (bbl/d) 2,779 2,481 3,000 3,050NGLs (bbl/d) 2,156 2,491 2,500 2,700Gas (mmcf/d) 29,657 24,878 21,000 19,500Boe/d (6:1) 9,878 9,118 9,000 9,000Cash Flow (MM) $46.2 $45.1 $59.4 $67.8CFPS (FD) $2.16 $1.83 $2.14 $2.45Net Debt Year-End (MM) $156.1 $156.2 $172.7 $165.0NAVPS (Engineering) $11.60Price/NAVPS 69%EV/P+P Reserves (boe) $11.84EV/Production (boe/d) $38,249 $41,438 $43,825 $42,964EV/DACF 6.5x 6.4x 5.5x 5.0xTarget implied EV/DACF 7.0x 8.5x 7.0x 6.5xPrice/CFPS 3.7x 4.4x 3.7x 3.3x
Thou
sand
s
Company Description
Equal Energy is a Calgary based E&P corporation with oil and gas properties located principally in Alberta, Sas-katchewan and Oklahoma.
EQUAL ENERGY LTD. (T-EQU)
Rating: BUY, Target: $12.00
REINVENTED, RESTRUCTURED AND READY TO GO!
Formally known as Enterra Energy Trust, Equal Energy Ltd., currently producing 9,100
boe/d (45% gas), is well on the way to transitioning from an over-levered gas weighted
trust to an oil focused corporate growth model. Since taking over in 2008, CEO Don Klapko, has managed to reduce debt to cash fl ow from >7x to ~3.5x currently. Further improvements on this are expected by way of expanding netbacks through a Cardium and Viking light oil focus.
Equal’s Cardium and Viking light oil opportunities interlock with the industry’s leaders. Equal is second only to NAL for Cardium drilling at Lochend. At Halkirk, Equal is second only to Cutpick –a company delivering Viking results an order of magnitude better than regional averages.
Set to capitalize on new found operational fl exibility. Equal’s Oklahoma partnership with Petrofl ow has been dissolved leaving Equal in control of this unique and highly prof-itable resource play in the Hunton.
Seven years of great inventory. Between the Viking, the Cardium and the best of Hunton (namely the Twin Cities Central Dolomite), Equal has ~$390 MM worth of inventory –or 6.5x Equal’s 2011E capital budget.
Conservatively booked reserves. Equal’s P+P future development capital is just 1.5x our FY11E CF of ~$60MM.
Upside beyond our forecast and target. Even at our now conservative US$80/bbl WTI pricing assumption, Equal’s 2011 drilling program is set to deliver a 2.7x recycle ratio –at strip pricing this may be closer to 3.8x. Meanwhile our $12.00 target ignores Equal’s booked probable reserves (independently valued at~$2.75/share) and over 300 Hunton locations.
Value priced. Equal is currently trading at ~70 cents on the dollar to its NAV, at $41,500 per fl owing boe and at an EV/DACF of just 6.4x. This attractive valuation is compounded by a small share count –just 28 mm shares. We see the valuation increasing as the Com-pany’s Viking and Cardium plays gain momentum and with the return (after a 25 month hiatus) to drilling in Oklahoma.
We reiterate our recommendation of Equal Energy Ltd. with a BUY rating and a $12.00
target price. This recommendation carries a SPECULATIVE risk designation.
200 day mvg50 day mvg
OIL & GAS | TOP PICK
11 | Q211 Jason Zandberg, B.B.A, CFA
SECTOR OVERVIEW
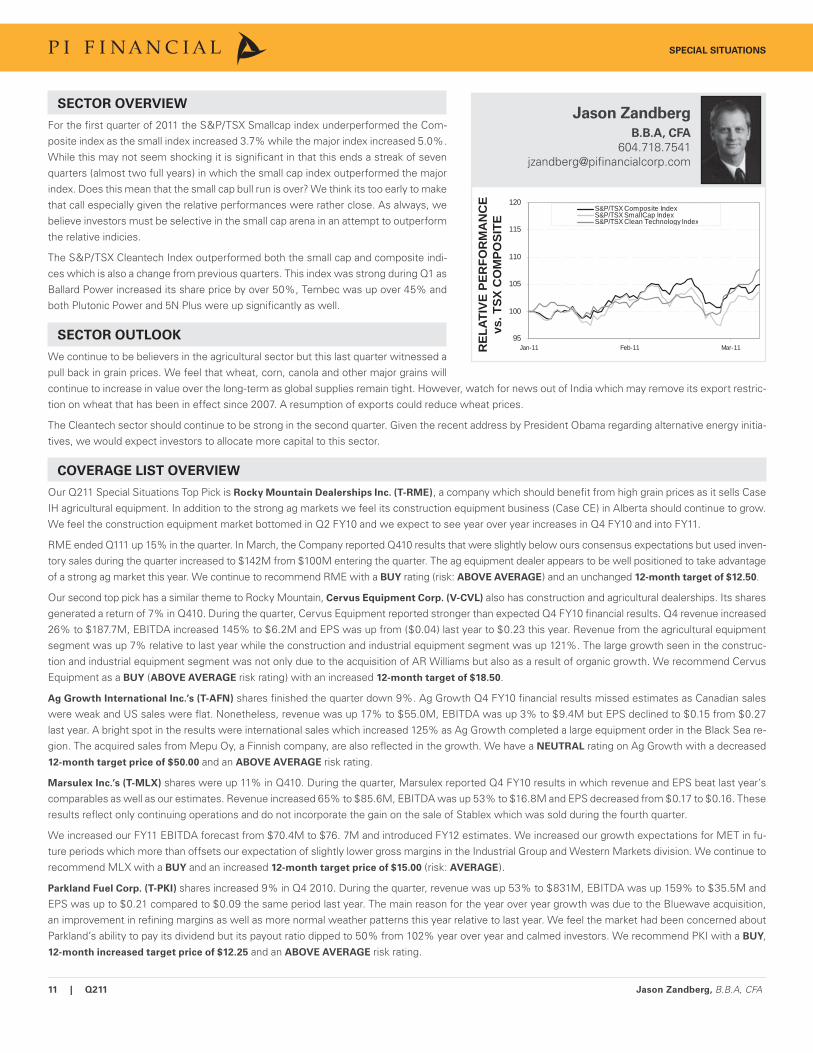
For the fi rst quarter of 2011 the S&P/TSX Smallcap index underperformed the Com-posite index as the small index increased 3.7% while the major index increased 5.0%. While this may not seem shocking it is signifi cant in that this ends a streak of seven quarters (almost two full years) in which the small cap index outperformed the major index. Does this mean that the small cap bull run is over? We think its too early to make that call especially given the relative performances were rather close. As always, we believe investors must be selective in the small cap arena in an attempt to outperform the relative indicies.
The S&P/TSX Cleantech Index outperformed both the small cap and composite indi-ces which is also a change from previous quarters. This index was strong during Q1 as Ballard Power increased its share price by over 50%, Tembec was up over 45% and both Plutonic Power and 5N Plus were up signifi cantly as well.
SECTOR OUTLOOK
We continue to be believers in the agricultural sector but this last quarter witnessed a pull back in grain prices. We feel that wheat, corn, canola and other major grains will continue to increase in value over the long-term as global supplies remain tight. However, watch for news out of India which may remove its export restric-tion on wheat that has been in effect since 2007. A resumption of exports could reduce wheat prices.
The Cleantech sector should continue to be strong in the second quarter. Given the recent address by President Obama regarding alternative energy initia-tives, we would expect investors to allocate more capital to this sector.
COVERAGE LIST OVERVIEW
Our Q211 Special Situations Top Pick is Rocky Mountain Dealerships Inc. (T-RME), a company which should benefi t from high grain prices as it sells Case IH agricultural equipment. In addition to the strong ag markets we feel its construction equipment business (Case CE) in Alberta should continue to grow. We feel the construction equipment market bottomed in Q2 FY10 and we expect to see year over year increases in Q4 FY10 and into FY11.
RME ended Q111 up 15% in the quarter. In March, the Company reported Q410 results that were slightly below ours consensus expectations but used inven-tory sales during the quarter increased to $142M from $100M entering the quarter. The ag equipment dealer appears to be well positioned to take advantage of a strong ag market this year. We continue to recommend RME with a BUY rating (risk: ABOVE AVERAGE) and an unchanged 12-month target of $12.50.
Our second top pick has a similar theme to Rocky Mountain, Cervus Equipment Corp. (V-CVL) also has construction and agricultural dealerships. Its shares generated a return of 7% in Q410. During the quarter, Cervus Equipment reported stronger than expected Q4 FY10 fi nancial results. Q4 revenue increased 26% to $187.7M, EBITDA increased 145% to $6.2M and EPS was up from ($0.04) last year to $0.23 this year. Revenue from the agricultural equipment segment was up 7% relative to last year while the construction and industrial equipment segment was up 121%. The large growth seen in the construc-tion and industrial equipment segment was not only due to the acquisition of AR Williams but also as a result of organic growth. We recommend Cervus Equipment as a BUY (ABOVE AVERAGE risk rating) with an increased 12-month target of $18.50.
Ag Growth International Inc.’s (T-AFN) shares fi nished the quarter down 9%. Ag Growth Q4 FY10 fi nancial results missed estimates as Canadian sales were weak and US sales were fl at. Nonetheless, revenue was up 17% to $55.0M, EBITDA was up 3% to $9.4M but EPS declined to $0.15 from $0.27 last year. A bright spot in the results were international sales which increased 125% as Ag Growth completed a large equipment order in the Black Sea re-gion. The acquired sales from Mepu Oy, a Finnish company, are also refl ected in the growth. We have a NEUTRAL rating on Ag Growth with a decreased 12-month target price of $50.00 and an ABOVE AVERAGE risk rating.
Marsulex Inc.’s (T-MLX) shares were up 11% in Q410. During the quarter, Marsulex reported Q4 FY10 results in which revenue and EPS beat last year’s comparables as well as our estimates. Revenue increased 65% to $85.6M, EBITDA was up 53% to $16.8M and EPS decreased from $0.17 to $0.16. These results refl ect only continuing operations and do not incorporate the gain on the sale of Stablex which was sold during the fourth quarter.
We increased our FY11 EBITDA forecast from $70.4M to $76. 7M and introduced FY12 estimates. We increased our growth expectations for MET in fu-ture periods which more than offsets our expectation of slightly lower gross margins in the Industrial Group and Western Markets division. We continue to recommend MLX with a BUY and an increased 12-month target price of $15.00 (risk: AVERAGE).
Parkland Fuel Corp. (T-PKI) shares increased 9% in Q4 2010. During the quarter, revenue was up 53% to $831M, EBITDA was up 159% to $35.5M and EPS was up to $0.21 compared to $0.09 the same period last year. The main reason for the year over year growth was due to the Bluewave acquisition, an improvement in refi ning margins as well as more normal weather patterns this year relative to last year. We feel the market had been concerned about Parkland’s ability to pay its dividend but its payout ratio dipped to 50% from 102% year over year and calmed investors. We recommend PKI with a BUY, 12-month increased target price of $12.25 and an ABOVE AVERAGE risk rating.
SPECIAL SITUATIONS
REL
ATIV
E PE
RFO
RM
AN
CE
vs. T
SX C
OM
POSI
TE
Jason Zandberg
B.B.A, CFA
604.718.7541jzandberg@pifi nancialcorp.com
95
100
105
110
115
120
Jan-11 Feb-11 Mar-11
S&P/TSX Composite IndexS&P/TSX SmallCap IndexS&P/TSX Clean Technology Index
12 | Q211 Jason Zandberg, B.B.A, CFA
Pure Technology Inc.’s (T-PUR) shares fi nished the quarter up 0.4%. During the quarter, Revenues increased by 28% to $16.5M, EBITDA increased by 14% to $3.5M and EPS increased to $0.09 versus $0.07 last year. The results were stronger than expected due to higher contributions from inspection services. PPIC, a FY10 acquisition, derives most of its revenue through inspection services and was behind the strong revenue fi gures.
Given the events in Libya and the associated sanctions between Canada and Libya, we have removed scheduled revenue in our FY11 estimates. Our rev-enue forecast for FY11 drops from $71.6M to $59.2M however, we feel that Pure’s market opportunity remains substantial and that North America, South America and China will represent the bulk of the growth opportunities. We continue to recommend Pure with a BUY rating (risk: ABOVE AVERAGE) and a 12-month target price of $6.00.
Viterra Inc. (T-VT) shares fi nished Q1 2011 up 27% year to date. During the quarter, Viterra reported Q1 FY11 results which were above our esti¬mates. Revenues were $2.5B, up 38% year over year while EBITDA was $211M, up 135%, and EPS was $0.27 versus $0.03 in Q1 FY10. These results were strong due to a strong crop in Australia, strong food processing margins and continued strength in fertilizer prices. Viterra’s Australian operations were not materi-ally impacted by the excessive fl ooding / typhoon / other weather issues. Gross margins are trending higher in all three of the Company’s segments.
We believe VT offers investors a unique investment opportunity to participate in the global agricultural space which we believe has strong long-term fun-damentals. Currently, grain prices are strong which we feel will result in improving fundamentals for Viterra in the coming years. We have a BUY rating on Viterra Inc. (risk: AVERAGE) with an increased 12-month target of $13.00.
Westport Innovations Inc.’s (T-WPT) share price increased 16% during the quarter. During Q3 FY11, the results were disappointing as we were expecting revenue of $45.8M and a loss of only ($0.16). The Company fell well short of our expectations for its HD systems sales as the Company reported no sales for the quarter. CWI revenues were also slightly below expectations as sales dropped 6%. Research and development, which is the largest operating ex-pense, increased 55% to $9.6M. Operating expenses increased 46% while revenue increased just 9% and gross profi t actually declined by 10% over the same period. We still recommend WPT as a SELL with a 12-month target price of $12.50 and SPECULATIVE risk rating.
Winpak Ltd. (T-WPK) shares were up 1% in Q410. Winpak reported strong Q410 numbers - Sales increased 14.4% to $154.9M, EBITDA increased 13.5% to $28.6M and EPS increased to $0.22 from $0.18. These results were above our expectations due to higher than forecasted volume growth, price in-creases and gross margins. The operating expense was higher than we had modeled but this increase was outpaced by the revenue and gross profi t gains. Margins expanded due to an increase in selling prices, enhanced manufacturing productivity, lower waste and a favourable product sales mix. These gains more than offset the 11.6% increase in raw material costs.
We have increased FY11 EPS estimates from $0.88 to $0.93 and have introduced FY12 estimates which include an EPS forecast of $1.01. We are fore-casting 10% revenue growth and gross margins in the 27%-28% range (lower than this quarters 29.9% gross margin) as we feel raw material costs will eventually catch up. We continue to recommend Winpak Inc. (T-WPK) as a BUY with a new 12-month target of $15.00 (previously $14.00) and an AVER-
AGE risk rating.
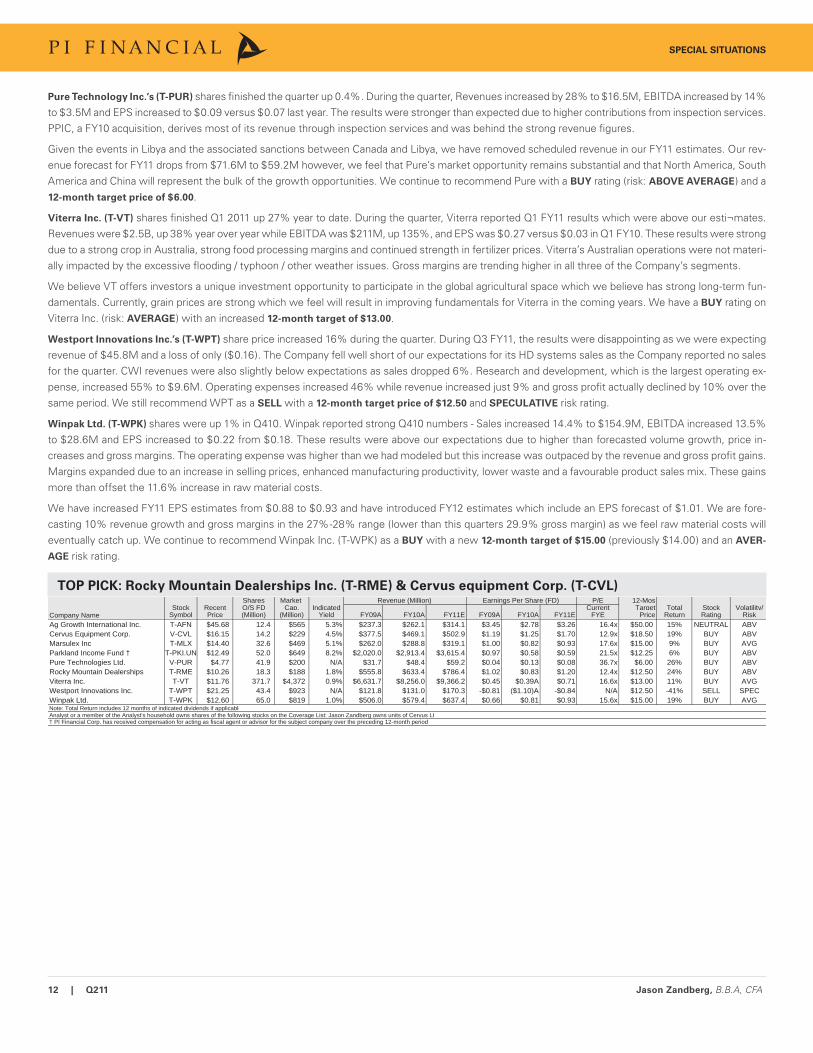
TOP PICK: Rocky Mountain Dealerships Inc. (T-RME) & Cervus equipment Corp. (T-CVL)Shares Market Revenue (Million) Earnings Per Share (FD) P/E 12-Mos
Stock Recent O/S FD Cap. Indicated Current Target Total Stock Volatility/Symbol Price (Million) (Million) Yield FY09A FY10A FY11E FY09A FY10A FY11E FYE Price Return Rating Risk
Ag Growth International Inc. T-AFN $45.68 12.4 $565 5.3% $237.3 $262.1 $314.1 $3.45 $2.78 $3.26 16.4x $50.00 15% NEUTRAL ABVCervus Equipment Corp. V-CVL $16.15 14.2 $229 4.5% $377.5 $469.1 $502.9 $1.19 $1.25 $1.70 12.9x $18.50 19% BUY ABVMarsulex Inc T-MLX $14.40 32.6 $469 5.1% $262.0 $288.8 $319.1 $1.00 $0.82 $0.93 17.6x $15.00 9% BUY AVGParkland Income Fund † T-PKI.UN $12.49 52.0 $649 8.2% $2,020.0 $2,913.4 $3,615.4 $0.97 $0.58 $0.59 21.5x $12.25 6% BUY ABVPure Technologies Ltd. V-PUR $4.77 41.9 $200 N/A $31.7 $48.4 $59.2 $0.04 $0.13 $0.08 36.7x $6.00 26% BUY ABVRocky Mountain Dealerships T-RME $10.26 18.3 $188 1.8% $555.8 $633.4 $786.4 $1.02 $0.83 $1.20 12.4x $12.50 24% BUY ABVViterra Inc. T-VT $11.76 371.7 $4,372 0.9% $6,631.7 $8,256.0 $9,366.2 $0.45 $0.39A $0.71 16.6x $13.00 11% BUY AVGWestport Innovations Inc. T-WPT $21.25 43.4 $923 N/A $121.8 $131.0 $170.3 -$0.81 ($1.10)A -$0.84 N/A $12.50 -41% SELL SPECWinpak Ltd. T-WPK $12.60 65.0 $819 1.0% $506.0 $579.4 $637.4 $0.66 $0.81 $0.93 15.6x $15.00 19% BUY AVGNote: Total Return includes 12 months of indicated dividends if applicable
Company Name
Analyst or a member of the Analyst's household owns shares of the following stocks on the Coverage List: Jason Zandberg owns units of Cervus LP† PI Financial Corp. has received compensation for acting as fiscal agent or advisor for the subject company over the preceding 12-month period
SPECIAL SITUATIONS
13 | Q211 Jason Zandberg, B.B.A, CFA
-
200
400
600
800
1,000
1,200
1,400
Mar-10 Apr-10 Jun-10 Aug-10 Oct-10 Dec-10 Feb-11$0.80
$2.80
$4.80
$6.80
$8.80
$10.80
$12.80
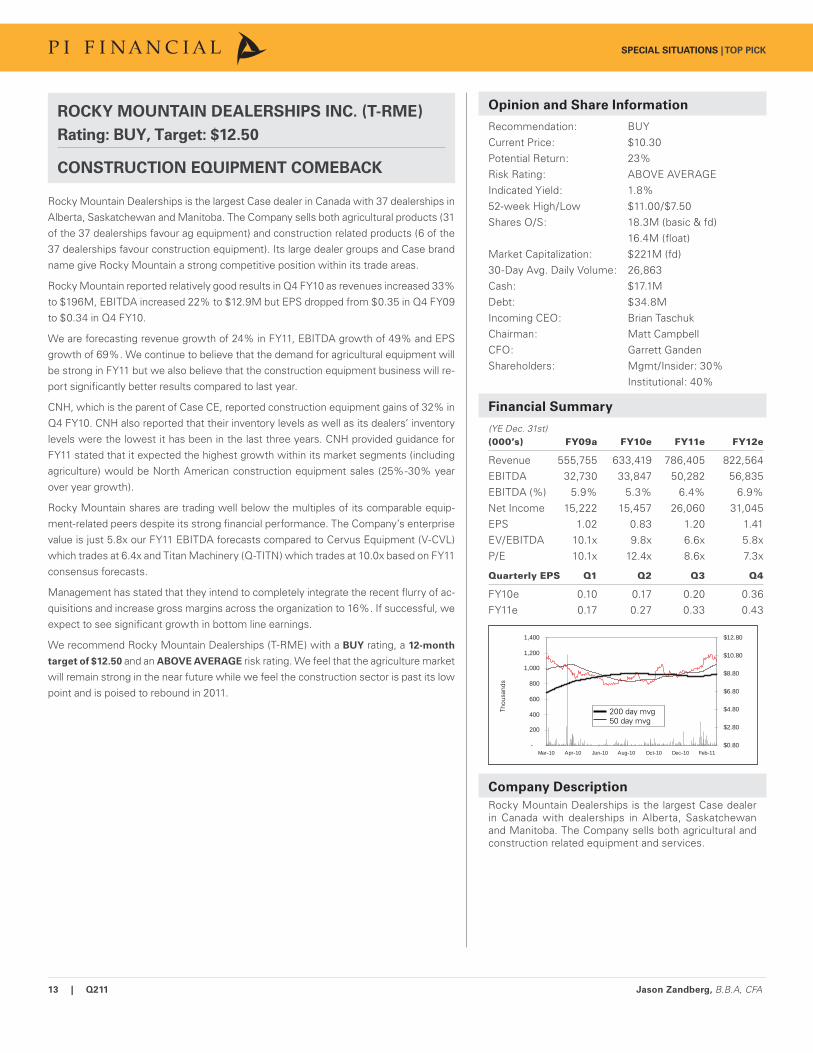
ROCKY MOUNTAIN DEALERSHIPS INC. (T-RME)
Rating: BUY, Target: $12.50
CONSTRUCTION EQUIPMENT COMEBACK
Rocky Mountain Dealerships is the largest Case dealer in Canada with 37 dealerships in Alberta, Saskatchewan and Manitoba. The Company sells both agricultural products (31 of the 37 dealerships favour ag equipment) and construction related products (6 of the 37 dealerships favour construction equipment). Its large dealer groups and Case brand name give Rocky Mountain a strong competitive position within its trade areas.
Rocky Mountain reported relatively good results in Q4 FY10 as revenues increased 33% to $196M, EBITDA increased 22% to $12.9M but EPS dropped from $0.35 in Q4 FY09 to $0.34 in Q4 FY10.
We are forecasting revenue growth of 24% in FY11, EBITDA growth of 49% and EPS growth of 69%. We continue to believe that the demand for agricultural equipment will be strong in FY11 but we also believe that the construction equipment business will re-port signifi cantly better results compared to last year.
CNH, which is the parent of Case CE, reported construction equipment gains of 32% in Q4 FY10. CNH also reported that their inventory levels as well as its dealers’ inventory levels were the lowest it has been in the last three years. CNH provided guidance for FY11 stated that it expected the highest growth within its market segments (including agriculture) would be North American construction equipment sales (25%-30% year over year growth).
Rocky Mountain shares are trading well below the multiples of its comparable equip-ment-related peers despite its strong fi nancial performance. The Company’s enterprise value is just 5.8x our FY11 EBITDA forecasts compared to Cervus Equipment (V-CVL) which trades at 6.4x and Titan Machinery (Q-TITN) which trades at 10.0x based on FY11 consensus forecasts.
Management has stated that they intend to completely integrate the recent fl urry of ac-quisitions and increase gross margins across the organization to 16%. If successful, we expect to see signifi cant growth in bottom line earnings.
We recommend Rocky Mountain Dealerships (T-RME) with a BUY rating, a 12-month
target of $12.50 and an ABOVE AVERAGE risk rating. We feel that the agriculture market will remain strong in the near future while we feel the construction sector is past its low point and is poised to rebound in 2011.
Opinion and Share Information
Recommendation: BUYCurrent Price: $10.30Potential Return: 23%Risk Rating: ABOVE AVERAGEIndicated Yield: 1.8%52-week High/Low $11.00/$7.50Shares O/S: 18.3M (basic & fd) 16.4M (fl oat) Market Capitalization: $221M (fd)30-Day Avg. Daily Volume: 26,863Cash: $17.1MDebt: $34.8MIncoming CEO: Brian TaschukChairman: Matt CampbellCFO: Garrett GandenShareholders: Mgmt/Insider: 30% Institutional: 40%
Financial Summary
(YE Dec. 31st)(000’s) FY09a FY10e FY11e FY12e
Revenue 555,755 633,419 786,405 822,564 EBITDA 32,730 33,847 50,282 56,835 EBITDA (%) 5.9% 5.3% 6.4% 6.9%Net Income 15,222 15,457 26,060 31,045 EPS 1.02 0.83 1.20 1.41 EV/EBITDA 10.1x 9.8x 6.6x 5.8xP/E 10.1x 12.4x 8.6x 7.3x
Quarterly EPS Q1 Q2 Q3 Q4
FY10e 0.10 0.17 0.20 0.36 FY11e 0.17 0.27 0.33 0.43
Thou
sand
s
Company Description
Rocky Mountain Dealerships is the largest Case dealer in Canada with dealerships in Alberta, Saskatchewan and Manitoba. The Company sells both agricultural and construction related equipment and services.
SPECIAL SITUATIONS | TOP PICK
200 day mvg50 day mvg
14 | Q211 Jason Zandberg, B.B.A, CFA
-
50
100
150
200
250
Mar-10 May-10 Jul-10 Sep-10 Nov-10 Jan-11 Mar-11$6.00
$8.00
$10.00
$12.00
$14.00
$16.00
$18.00
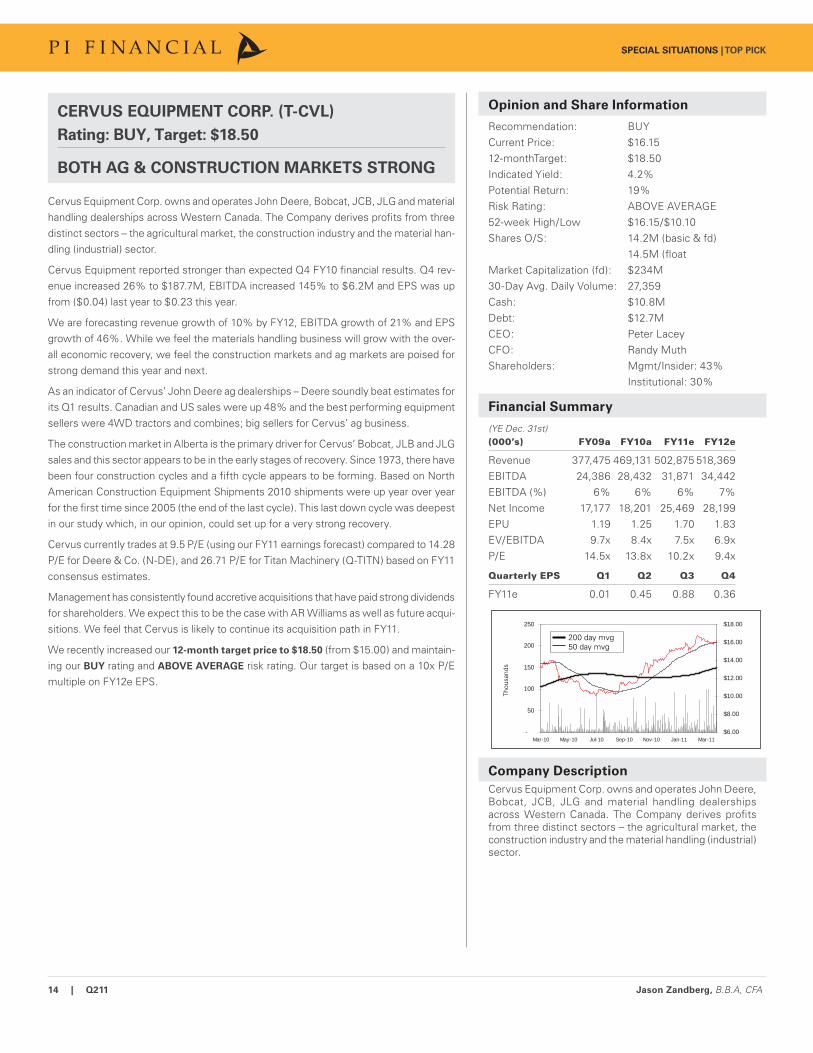
CERVUS EQUIPMENT CORP. (T-CVL)
Rating: BUY, Target: $18.50
BOTH AG & CONSTRUCTION MARKETS STRONG
Cervus Equipment Corp. owns and operates John Deere, Bobcat, JCB, JLG and material handling dealerships across Western Canada. The Company derives profi ts from three distinct sectors – the agricultural market, the construction industry and the material han-dling (industrial) sector.
Cervus Equipment reported stronger than expected Q4 FY10 fi nancial results. Q4 rev-enue increased 26% to $187.7M, EBITDA increased 145% to $6.2M and EPS was up from ($0.04) last year to $0.23 this year.
We are forecasting revenue growth of 10% by FY12, EBITDA growth of 21% and EPS growth of 46%. While we feel the materials handling business will grow with the over-all economic recovery, we feel the construction markets and ag markets are poised for strong demand this year and next.
As an indicator of Cervus’ John Deere ag dealerships – Deere soundly beat estimates for its Q1 results. Canadian and US sales were up 48% and the best performing equipment sellers were 4WD tractors and combines; big sellers for Cervus’ ag business.
The construction market in Alberta is the primary driver for Cervus’ Bobcat, JLB and JLG sales and this sector appears to be in the early stages of recovery. Since 1973, there have been four construction cycles and a fi fth cycle appears to be forming. Based on North American Construction Equipment Shipments 2010 shipments were up year over year for the fi rst time since 2005 (the end of the last cycle). This last down cycle was deepest in our study which, in our opinion, could set up for a very strong recovery.
Cervus currently trades at 9.5 P/E (using our FY11 earnings forecast) compared to 14.28 P/E for Deere & Co. (N-DE), and 26.71 P/E for Titan Machinery (Q-TITN) based on FY11 consensus estimates.
Management has consistently found accretive acquisitions that have paid strong dividends for shareholders. We expect this to be the case with AR Williams as well as future acqui-sitions. We feel that Cervus is likely to continue its acquisition path in FY11.
We recently increased our 12-month target price to $18.50 (from $15.00) and maintain-ing our BUY rating and ABOVE AVERAGE risk rating. Our target is based on a 10x P/E multiple on FY12e EPS.
Opinion and Share Information
Recommendation: BUYCurrent Price: $16.1512-monthTarget: $18.50Indicated Yield: 4.2%Potential Return: 19%Risk Rating: ABOVE AVERAGE52-week High/Low $16.15/$10.10Shares O/S: 14.2M (basic & fd) 14.5M (fl oatMarket Capitalization (fd): $234M30-Day Avg. Daily Volume: 27,359Cash: $10.8MDebt: $12.7MCEO: Peter LaceyCFO: Randy MuthShareholders: Mgmt/Insider: 43% Institutional: 30%
Financial Summary
(YE Dec. 31st)(000’s) FY09a FY10a FY11e FY12e
Revenue 377,475 469,131 502,875 518,369 EBITDA 24,386 28,432 31,871 34,442 EBITDA (%) 6% 6% 6% 7%Net Income 17,177 18,201 25,469 28,199 EPU 1.19 1.25 1.70 1.83 EV/EBITDA 9.7x 8.4x 7.5x 6.9xP/E 14.5x 13.8x 10.2x 9.4x
Quarterly EPS Q1 Q2 Q3 Q4
FY11e 0.01 0.45 0.88 0.36
Thou
sand
s
Company Description
Cervus Equipment Corp. owns and operates John Deere, Bobcat, JCB, JLG and material handling dealerships across Western Canada. The Company derives profi ts from three distinct sectors – the agricultural market, the construction industry and the material handling (industrial) sector.
SPECIAL SITUATIONS | TOP PICK
200 day mvg50 day mvg
15 | Q211 Pardeep S. Sangha, B.A. Sc., MBA
TECHNOLOGY
SECTOR OVERVIEW
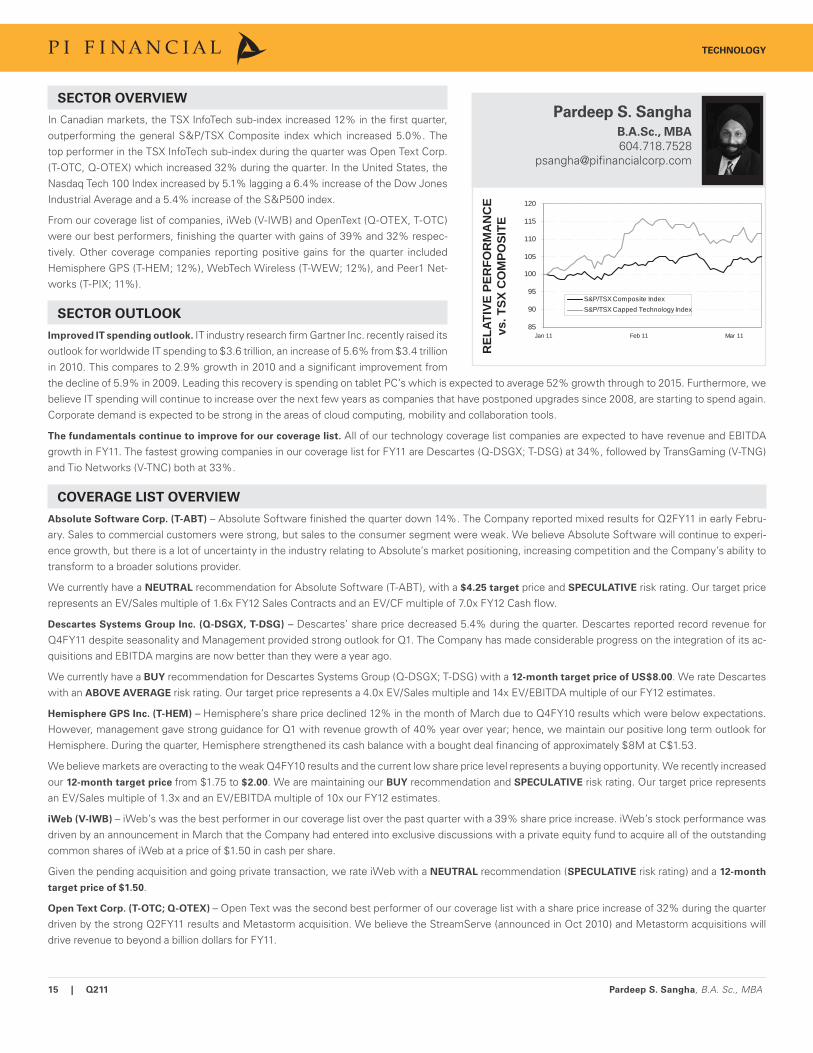
In Canadian markets, the TSX InfoTech sub-index increased 12% in the fi rst quarter, outperforming the general S&P/TSX Composite index which increased 5.0%. The top performer in the TSX InfoTech sub-index during the quarter was Open Text Corp. (T-OTC, Q-OTEX) which increased 32% during the quarter. In the United States, the Nasdaq Tech 100 Index increased by 5.1% lagging a 6.4% increase of the Dow Jones Industrial Average and a 5.4% increase of the S&P500 index.
From our coverage list of companies, iWeb (V-IWB) and OpenText (Q-OTEX, T-OTC) were our best performers, fi nishing the quarter with gains of 39% and 32% respec-tively. Other coverage companies reporting positive gains for the quarter included Hemisphere GPS (T-HEM; 12%), WebTech Wireless (T-WEW; 12%), and Peer1 Net-works (T-PIX; 11%).
SECTOR OUTLOOK
Improved IT spending outlook. IT industry research fi rm Gartner Inc. recently raised its outlook for worldwide IT spending to $3.6 trillion, an increase of 5.6% from $3.4 trillion in 2010. This compares to 2.9% growth in 2010 and a signifi cant improvement from the decline of 5.9% in 2009. Leading this recovery is spending on tablet PC’s which is expected to average 52% growth through to 2015. Furthermore, we believe IT spending will continue to increase over the next few years as companies that have postponed upgrades since 2008, are starting to spend again. Corporate demand is expected to be strong in the areas of cloud computing, mobility and collaboration tools.
The fundamentals continue to improve for our coverage list. All of our technology coverage list companies are expected to have revenue and EBITDA growth in FY11. The fastest growing companies in our coverage list for FY11 are Descartes (Q-DSGX; T-DSG) at 34%, followed by TransGaming (V-TNG) and Tio Networks (V-TNC) both at 33%.
COVERAGE LIST OVERVIEW
Absolute Software Corp. (T-ABT) – Absolute Software fi nished the quarter down 14%. The Company reported mixed results for Q2FY11 in early Febru-ary. Sales to commercial customers were strong, but sales to the consumer segment were weak. We believe Absolute Software will continue to experi-ence growth, but there is a lot of uncertainty in the industry relating to Absolute’s market positioning, increasing competition and the Company’s ability to transform to a broader solutions provider.
We currently have a NEUTRAL recommendation for Absolute Software (T-ABT), with a $4.25 target price and SPECULATIVE risk rating. Our target price represents an EV/Sales multiple of 1.6x FY12 Sales Contracts and an EV/CF multiple of 7.0x FY12 Cash fl ow.
Descartes Systems Group Inc. (Q-DSGX, T-DSG) – Descartes’ share price decreased 5.4% during the quarter. Descartes reported record revenue for Q4FY11 despite seasonality and Management provided strong outlook for Q1. The Company has made considerable progress on the integration of its ac-quisitions and EBITDA margins are now better than they were a year ago.
We currently have a BUY recommendation for Descartes Systems Group (Q-DSGX; T-DSG) with a 12-month target price of US$8.00. We rate Descartes with an ABOVE AVERAGE risk rating. Our target price represents a 4.0x EV/Sales multiple and 14x EV/EBITDA multiple of our FY12 estimates.
Hemisphere GPS Inc. (T-HEM) – Hemisphere’s share price declined 12% in the month of March due to Q4FY10 results which were below expectations. However, management gave strong guidance for Q1 with revenue growth of 40% year over year; hence, we maintain our positive long term outlook for Hemisphere. During the quarter, Hemisphere strengthened its cash balance with a bought deal fi nancing of approximately $8M at C$1.53.
We believe markets are overacting to the weak Q4FY10 results and the current low share price level represents a buying opportunity. We recently increased our 12-month target price from $1.75 to $2.00. We are maintaining our BUY recommendation and SPECULATIVE risk rating. Our target price represents an EV/Sales multiple of 1.3x and an EV/EBITDA multiple of 10x our FY12 estimates.
iWeb (V-IWB) – iWeb’s was the best performer in our coverage list over the past quarter with a 39% share price increase. iWeb’s stock performance was driven by an announcement in March that the Company had entered into exclusive discussions with a private equity fund to acquire all of the outstanding common shares of iWeb at a price of $1.50 in cash per share.
Given the pending acquisition and going private transaction, we rate iWeb with a NEUTRAL recommendation (SPECULATIVE risk rating) and a 12-month
target price of $1.50.
Open Text Corp. (T-OTC; Q-OTEX) – Open Text was the second best performer of our coverage list with a share price increase of 32% during the quarter driven by the strong Q2FY11 results and Metastorm acquisition. We believe the StreamServe (announced in Oct 2010) and Metastorm acquisitions will drive revenue to beyond a billion dollars for FY11.
REL
ATIV
E PE
RFO
RM
AN
CE
vs. T
SX C
OM
POSI
TE
Pardeep S. Sangha
B.A.Sc., MBA
604.718.7528psangha@pifi nancialcorp.com
85
90
95
100
105
110
115
120
Jan 11 Feb 11 Mar 11
S&P/TSX Composite IndexS&P/TSX Capped Technology Index
16 | Q211 Pardeep S. Sangha, B.A. Sc., MBA
We rate Open Text with a BUY recommendation (AVERAGE risk rating) and a 12-month target price of US$60. Our target price represents a 3.1x EV/Sales, 10x EV/EBITDA and 14x PE multiple of our FY12 estimates.
Peer1 Network Enterprises Inc. (T-PIX) – Peer1’s share price increased 11% during the quarter. Peer1 reported solid Q2FY11 results in February and has begun construction of its 50,000 square foot green datacenter in UK. Meanwhile, the build out for PODs B and C in Toronto are near completion. We be-lieve the UK expansion and the completion of the Toronto PODs are the key growth drivers for FY11 and FY12.
We currently have a BUY recommendation (ABOVE AVERAGE risk rating) and a 12-month target price of $2.50. Our target price represents a 2.9x EV/Sales, 10x EV/EBITDA of our FY12 estimates.
PNI Digital Media Inc. (V-PN, U-PNWIF) – PNI reported disappointing results for Q1FY11 that were well below consensus estimates. PNI’s results were negatively affected by the weakening US dollars and a decline in the average order value. On a positive note, the new verticals for social stationary and online business printing are in “Launch Mode”. We are expecting both new services to start generating revenues in Q3FY11 (April to June) and ramping upwards in Q4FY11.
We currently have a BUY recommendation on PNI Digital Media with a 12-month target price of $2.20, and a SPECULATIVE risk rating.
Radiant Communications (V-RCN) – Radiant will be reporting results for Q4FY10 on April 4, 2011. The Company now has 115 customers signed up for its SureLink Broadband Ethernet service, generating approximately $750K of new annualized recurring revenue. Radiant has deployed SureLink to over 30 central offi ces in Vancouver and Toronto.
We recommend Radiant Communications as a BUY with a 12-month target price of $2.00 and SPECULATIVE risk rating. Our target price represents a 0.7x EV/Sales multiple and 7.2x EV/EBITDA multiple of our FY11 estimates.
Tio Networks Corp. (V-TNC) – During the quarter TIO announced a key partnership with MoneyGram International (MGI) which doubles the size of Tio’s bill payment network to over 58,000 end points. TIO recently reported solid Q2FY11 results with 58% revenue growth year over year. We are projecting breakeven profi tability in FY11 for TIO Networks.
We currently have a 12-month target price of $0.95 for Tio Networks, with a BUY recommendation and a SPECULATIVE risk rating. Our $0.95 price target represents an EV/Sales multiple of 1.0x and an EV/EBITDA multiple of 11x our FY12 estimates.
TransGaming Inc. (V-TNG) – TransGaming announced it is expecting to commercially launch GameTreeTV in April 2011 with a major European managed service operator (MSO). The name of the European MSO will be disclosed at the time of launch in April. We continue to believe that Telecom Italia will be one of the fi rst two service providers to launch. According to management TransGaming is also working closely with a second MSO in Europe.
We currently have a 12-month target price of $1.40 for Transgaming with a BUY recommendation and a SPECULATIVE risk rating. We note that TransGam-ing is a very early stage opportunity with signifi cant growth potential that also faces execution and customer adoption risk.
WebTech Wireless Inc. (T-WEW) – WebTech Wireless (T-WEW) achieved record revenue expectations for FY10, but profi tability was negatively affected by one-time charges. Our outlook still looks favorable given the Company’s increasing recurring revenue. Recurring revenue accounted for 48% of overall revenue in Q4FY10. In the short-term we believe the Company’s share price could appreciate on the speculation of a potential sale of the Company if new investor Goodwood Inc. is successful in its bid to replace the Board.
We currently have a BUY recommendation (SPECULATIVE risk rating) on WebTech Wireless and 12-month target price of $0.70. Our $0.70 target price represents a 1.2x EV/Sales multiple and 9.9x EV/EBITDA multiple of our FY12 estimate.
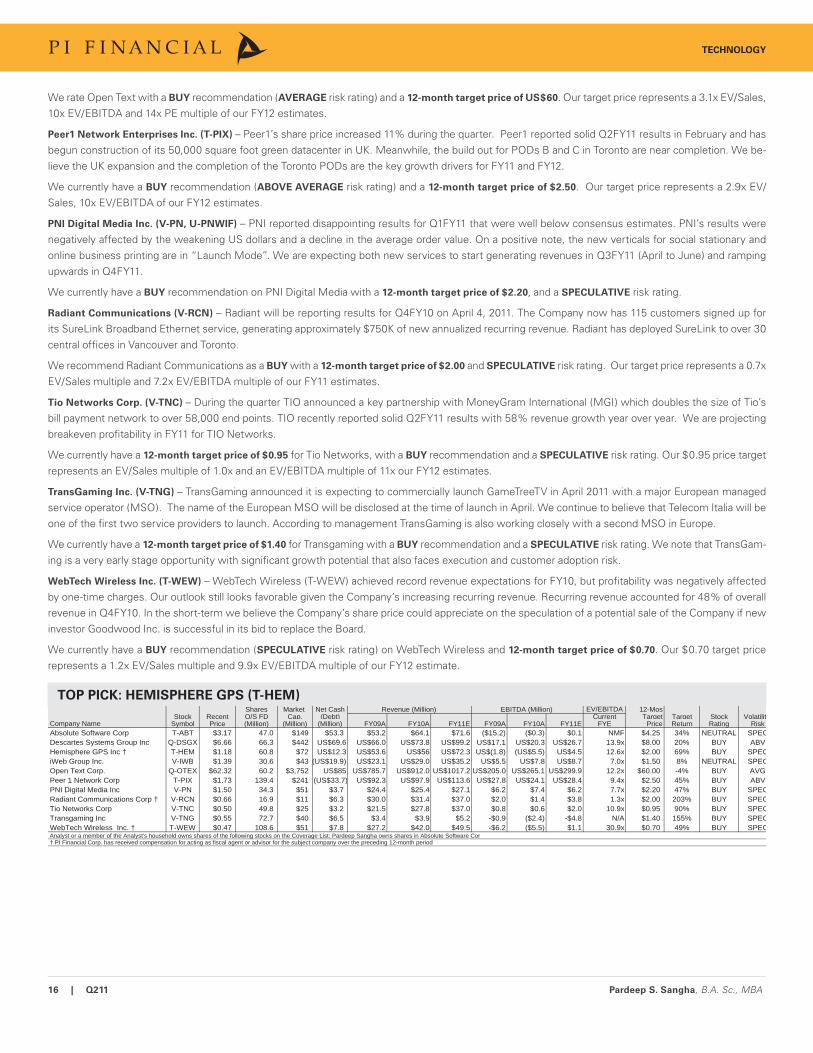
TOP PICK: HEMISPHERE GPS (T-HEM) Shares Market Net Cash Revenue (Million) EBITDA (Million) EV/EBITDA 12-Mos
Stock Recent O/S FD Cap. (Debt) Current Target Target Stock VolatilitSymbol Price (Million) (Million) (Million) FY09A FY10A FY11E FY09A FY10A FY11E FYE Price Return Rating Risk
Absolute Software Corp T-ABT $3.17 47.0 $149 $53.3 $53.2 $64.1 $71.6 ($15.2) ($0.3) $0.1 NMF $4.25 34% NEUTRAL SPECDescartes Systems Group Inc Q-DSGX $6.66 66.3 $442 US$69.6 US$66.0 US$73.8 US$99.2 US$17.1 US$20.3 US$26.7 13.9x $8.00 20% BUY ABVHemisphere GPS Inc † T-HEM $1.18 60.8 $72 US$12.3 US$53.6 US$56 US$72.3 US$(1.8) (US$5.5) US$4.5 12.6x $2.00 69% BUY SPECiWeb Group Inc. V-IWB $1.39 30.6 $43 (US$19.9) US$23.1 US$29.0 US$35.2 US$5.5 US$7.8 US$8.7 7.0x $1.50 8% NEUTRAL SPECOpen Text Corp. Q-OTEX $62.32 60.2 $3,752 US$85 US$785.7 US$912.0 US$1017.2 US$205.0 US$265.1 US$299.9 12.2x $60.00 -4% BUY AVGPeer 1 Network Corp T-PIX $1.73 139.4 $241 (US$33.7) US$92.3 US$97.9 US$113.6 US$27.8 US$24.1 US$28.4 9.4x $2.50 45% BUY ABVPNI Digital Media Inc V-PN $1.50 34.3 $51 $3.7 $24.4 $25.4 $27.1 $6.2 $7.4 $6.2 7.7x $2.20 47% BUY SPECRadiant Communications Corp † V-RCN $0.66 16.9 $11 $6.3 $30.0 $31.4 $37.0 $2.0 $1.4 $3.8 1.3x $2.00 203% BUY SPECTio Networks Corp V-TNC $0.50 49.8 $25 $3.2 $21.5 $27.8 $37.0 $0.8 $0.6 $2.0 10.9x $0.95 90% BUY SPECTransgaming Inc V-TNG $0.55 72.7 $40 $6.5 $3.4 $3.9 $5.2 -$0.9 ($2.4) -$4.8 N/A $1.40 155% BUY SPECWebTech Wireless Inc. † T-WEW $0.47 108.6 $51 $7.8 $27.2 $42.0 $49.5 -$6.2 ($5.5) $1.1 30.9x $0.70 49% BUY SPEC
Company Name
Analyst or a member of the Analyst's household owns shares of the following stocks on the Coverage List: Pardeep Sangha owns shares in Absolute Software Cor† PI Financial Corp. has received compensation for acting as fiscal agent or advisor for the subject company over the preceding 12-month period
TECHNOLOGY
17 | Q211 Pardeep S. Sangha, B.A. Sc., MBA
-
500
1,000
1,500
2,000
2,500
Mar-10 May-10 Jul-10 Sep-10 Nov-10 Jan-11 Mar-11$-
$0.20
$0.40
$0.60
$0.80
$1.00
$1.20
$1.40
$1.60
$1.80
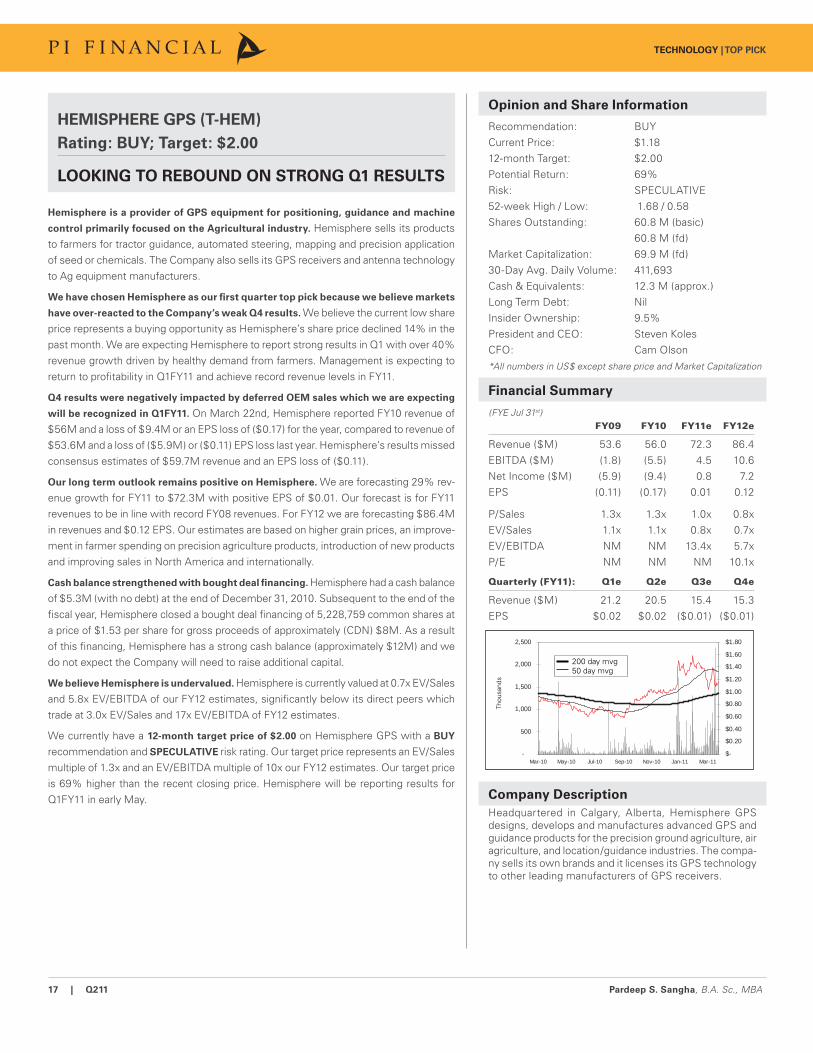
HEMISPHERE GPS (T-HEM)
Rating: BUY; Target: $2.00
LOOKING TO REBOUND ON STRONG Q1 RESULTS
Hemisphere is a provider of GPS equipment for positioning, guidance and machine
control primarily focused on the Agricultural industry. Hemisphere sells its products to farmers for tractor guidance, automated steering, mapping and precision application of seed or chemicals. The Company also sells its GPS receivers and antenna technology to Ag equipment manufacturers.
We have chosen Hemisphere as our fi rst quarter top pick because we believe markets
have over-reacted to the Company’s weak Q4 results. We believe the current low share price represents a buying opportunity as Hemisphere’s share price declined 14% in the past month. We are expecting Hemisphere to report strong results in Q1 with over 40% revenue growth driven by healthy demand from farmers. Management is expecting to return to profi tability in Q1FY11 and achieve record revenue levels in FY11.
Q4 results were negatively impacted by deferred OEM sales which we are expecting
will be recognized in Q1FY11. On March 22nd, Hemisphere reported FY10 revenue of $56M and a loss of $9.4M or an EPS loss of ($0.17) for the year, compared to revenue of $53.6M and a loss of ($5.9M) or ($0.11) EPS loss last year. Hemisphere’s results missed consensus estimates of $59.7M revenue and an EPS loss of ($0.11).
Our long term outlook remains positive on Hemisphere. We are forecasting 29% rev-enue growth for FY11 to $72.3M with positive EPS of $0.01. Our forecast is for FY11 revenues to be in line with record FY08 revenues. For FY12 we are forecasting $86.4M in revenues and $0.12 EPS. Our estimates are based on higher grain prices, an improve-ment in farmer spending on precision agriculture products, introduction of new products and improving sales in North America and internationally.
Cash balance strengthened with bought deal fi nancing. Hemisphere had a cash balance of $5.3M (with no debt) at the end of December 31, 2010. Subsequent to the end of the fi scal year, Hemisphere closed a bought deal fi nancing of 5,228,759 common shares at a price of $1.53 per share for gross proceeds of approximately (CDN) $8M. As a result of this fi nancing, Hemisphere has a strong cash balance (approximately $12M) and we do not expect the Company will need to raise additional capital.
We believe Hemisphere is undervalued. Hemisphere is currently valued at 0.7x EV/Sales and 5.8x EV/EBITDA of our FY12 estimates, signifi cantly below its direct peers which trade at 3.0x EV/Sales and 17x EV/EBITDA of FY12 estimates.
We currently have a 12-month target price of $2.00 on Hemisphere GPS with a BUY
recommendation and SPECULATIVE risk rating. Our target price represents an EV/Sales multiple of 1.3x and an EV/EBITDA multiple of 10x our FY12 estimates. Our target price is 69% higher than the recent closing price. Hemisphere will be reporting results for Q1FY11 in early May.
Opinion and Share Information
Recommendation: BUYCurrent Price: $1.18 12-month Target: $2.00 Potential Return: 69%Risk: SPECULATIVE52-week High / Low: 1.68 / 0.58 Shares Outstanding: 60.8 M (basic) 60.8 M (fd)Market Capitalization: 69.9 M (fd)30-Day Avg. Daily Volume: 411,693Cash & Equivalents: 12.3 M (approx.)Long Term Debt: NilInsider Ownership: 9.5%President and CEO: Steven KolesCFO: Cam Olson*All numbers in US$ except share price and Market Capitalization
Financial Summary
(FYE Jul 31st) FY09 FY10 FY11e FY12e
Revenue ($M) 53.6 56.0 72.3 86.4 EBITDA ($M) (1.8) (5.5) 4.5 10.6 Net Income ($M) (5.9) (9.4) 0.8 7.2 EPS (0.11) (0.17) 0.01 0.12
P/Sales 1.3x 1.3x 1.0x 0.8xEV/Sales 1.1x 1.1x 0.8x 0.7xEV/EBITDA NM NM 13.4x 5.7xP/E NM NM NM 10.1x
Quarterly (FY11): Q1e Q2e Q3e Q4e
Revenue ($M) 21.2 20.5 15.4 15.3 EPS $0.02 $0.02 ($0.01) ($0.01)
Thou
sand
s
Company Description
Headquartered in Calgary, Alberta, Hemisphere GPS designs, develops and manufactures advanced GPS and guidance products for the precision ground agriculture, air agriculture, and location/guidance industries. The compa-ny sells its own brands and it licenses its GPS technology to other leading manufacturers of GPS receivers.
TECHNOLOGY | TOP PICK
200 day mvg50 day mvg

18 | Q211 Chris Murray, P.Eng, MBA
SECTOR OVERVIEW
The S&P/TSX Capped Industrials Index rose by 7.8% in Q111 ahead of the broader S&P/TSX Composite Index which increased by 5.0%. Increased order activity and im-proving economic outlooks lent support to many of the names in the Industrials group which tend to be more mid to late cycle performers.
Certain of the transportations names were negatively impacted by the run up in crude oil prices. Top movers in Q111 included our top pick for the quarter, Bombardier Inc. (T-BBD.b), up 42.3% followed by Ritchie Brothers Auctioneers (T-RBA) and Russel Metals Inc. (T-RUS).
SECTOR OUTLOOK
We are continuing to see macro trends improving with a number of key economic in-dicators including factory orders, ISM indices and employment all showing positive signs. We expect demand for travel in Canada and internationally will continue to re-mains robust through the busy summer season as demand pent up over the recession translates into strong load factors and higher yields. We anticipate demand for capital goods in both public and private sectors will continue to remain healthy despite pres-sures on government budgets.
We expect merger and acquisition activity, which has been accelerating since Q409 will continue to be a theme for many of the names on our coverage list as both buyers and targets. The availability of funding to complete acquisitions has improved signifi cantly and a number of private equity buyers have reentered the market which should lead to higher valuations and trading multiples for a number of sectors.
COVERAGE LIST OVERVIEW
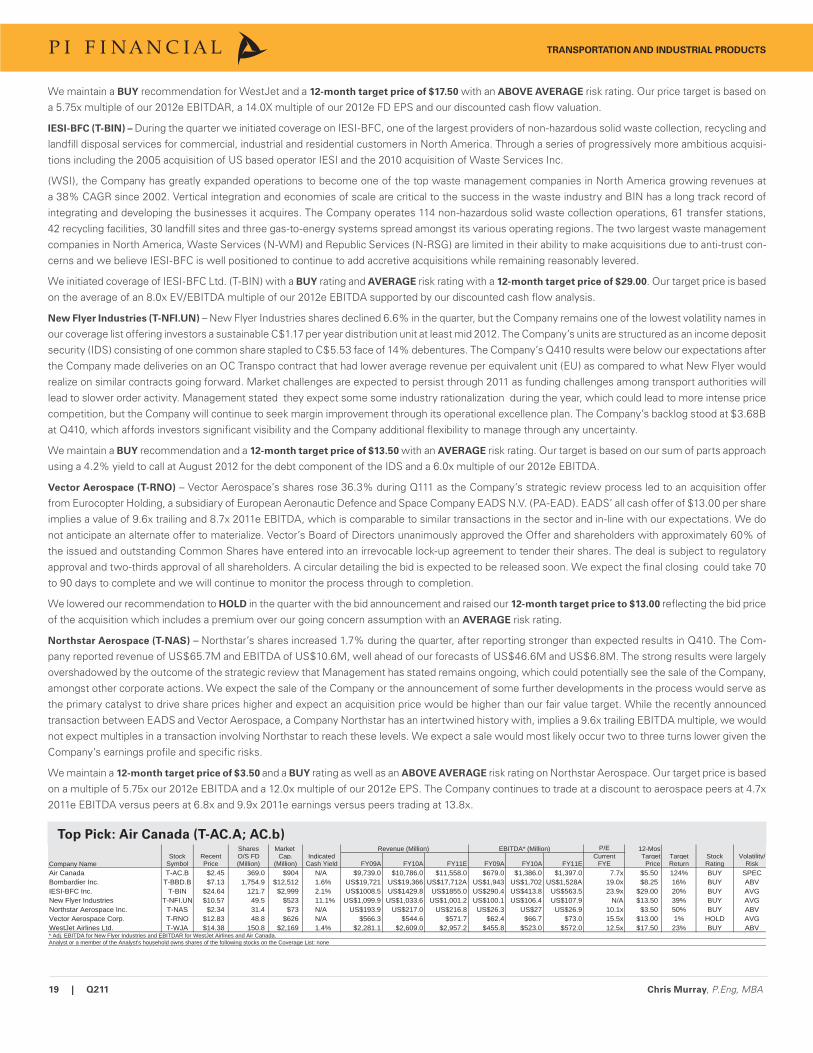
Air Canada (T-AC.A; T-AC.B), Air Canada’s share price declined during the quarter by 29%, but we believe the sell-off is overdone and not indicative of the Company’s future earnings power. During the quarter the Company announced Q410 results that were largely in-line with our expectations, however investor concerns over increasing fuel costs and weaker than expected February traffi c data weighed heavily on share prices as it traded below $3.00 for the fi rst time since October 2010. The Company has indicated that it has implemented surcharges on international fl ights as well as some domestic fares, as oil prices remain above US$100/bbl. The Company has also indicated that they will reduce capacity as passenger sensitivity to price increases resulted in lower than expected load factors. Results were similar among other North American carriers with International routes. The Company continues to take steps to defend its position as the preferred airline among Canadian business travelers with the start of fl ights from the Toronto City Centre airport between Toronto and Montreal. Union negotiations remain ongoing during the quarter and while we expect headline risk into the summer, we believe all parties are seeking settlements without work stoppages or other disruptions. We are making Air Canada our top pick for Q211.
We have a BUY rating and a 12-month target price of $5.50 with a SPECULATIVE risk rating for Air Canada shares based on a 4.25x EV/EBITDAR multiple of our 2012e EBITDAR.
Bombardier (T-BBD.B) – Bombardier was our Top Pick for Q111 fi nishing the quarter with a gain of 42.3%, outperforming the S&P/TSX Capped Industri-als Index which was up 7.8%. Bombardier booked a number of signifi cant contracts in both operating segments, with Bombardier Transport (BT) hav-ing reporting a record backlog of US$33.5B and Bombardier Aerospace (BA) obtaining its largest business aircraft order in its history for 50 Global busi-ness aircraft worth US$2.7B. from NetJets. Results for Q4 FY11 came in ahead of market expectations and management provided a positive outlook for FY2012 with the potential of large new orders at BT and the development of the CSeries and new Lear aircraft by BA. . The Company is in a strong fi nancial position following the quarter with US$4.2B in cash and equivalents, which should ease investor concerns regarding the Company’s ability to fund its de-velopment programs. We expect FY12 to show similar fi nancial results to FY11 with FY13 anticipated to be a year of signifi cant top line growth driven by backlog conversion at BT.
We maintain a BUY rating and a 12-month target price $8.25 with an ABOVE AVERAGE risk rating. Our target price is derived from the average of a 7.5x EBITDA and 15.0x EPS multiple based on our FY2013 estimates and a C$/US$ exchange rate of $0.99.
WestJet Airlines Inc. (T-WJA) – WestJet’s share price was up 2.2% in the quarter, versus a decline by most peers, as strong demand offset fare increases required to support higher oil prices. The Company reported improving load factors in January and February 2011 with strong demand for US transborder and sun destinations. During Q111the Company reported strong growth in passenger yield and its Q410 results exceeded our expectations. Delivery of six aircraft that were to be received between 2012 and 2015 was deferred until 2017 and 2018 with no penalty, which alleviated investor concerns about fl eet growth rates. Efforts to grow business clientele remains a focus of the Company. Their position was strengthened with the signing of an Interline agree-ment with Delta Airlines and a comprehensive code sharing agreement with American Airlines, as well as expanding service between Toronto, Ottawa and Montreal.
REL
ATIV
E PE
RFO
RM
AN
CE
vs. T
SX C
OM
POSI
TE
Chris Murray
P.Eng., MBA
416.883.9047cmurray@pifi nancialcorp.com
90
95
100
105
110
Dec 10 Feb 11 Mar 11
S&P/TSX Composite IndexS&P/TSX Transportation Composite IndexS&P/TSX Capped Industrials Index
TRANSPORTATION AND INDUSTRIAL PRODUCTS
19 | Q211 Chris Murray, P.Eng, MBA
We maintain a BUY recommendation for WestJet and a 12-month target price of $17.50 with an ABOVE AVERAGE risk rating. Our price target is based on a 5.75x multiple of our 2012e EBITDAR, a 14.0X multiple of our 2012e FD EPS and our discounted cash fl ow valuation.
IESI-BFC (T-BIN) – During the quarter we initiated coverage on IESI-BFC, one of the largest providers of non-hazardous solid waste collection, recycling and landfi ll disposal services for commercial, industrial and residential customers in North America. Through a series of progressively more ambitious acquisi-tions including the 2005 acquisition of US based operator IESI and the 2010 acquisition of Waste Services Inc.
(WSI), the Company has greatly expanded operations to become one of the top waste management companies in North America growing revenues at a 38% CAGR since 2002. Vertical integration and economies of scale are critical to the success in the waste industry and BIN has a long track record of integrating and developing the businesses it acquires. The Company operates 114 non-hazardous solid waste collection operations, 61 transfer stations, 42 recycling facilities, 30 landfi ll sites and three gas-to-energy systems spread amongst its various operating regions. The two largest waste management companies in North America, Waste Services (N-WM) and Republic Services (N-RSG) are limited in their ability to make acquisitions due to anti-trust con-cerns and we believe IESI-BFC is well positioned to continue to add accretive acquisitions while remaining reasonably levered.
We initiated coverage of IESI-BFC Ltd. (T-BIN) with a BUY rating and AVERAGE risk rating with a 12-month target price of $29.00. Our target price is based on the average of an 8.0x EV/EBITDA multiple of our 2012e EBITDA supported by our discounted cash fl ow analysis.
New Flyer Industries (T-NFI.UN) – New Flyer Industries shares declined 6.6% in the quarter, but the Company remains one of the lowest volatility names in our coverage list offering investors a sustainable C$1.17 per year distribution unit at least mid 2012. The Company’s units are structured as an income deposit security (IDS) consisting of one common share stapled to C$5.53 face of 14% debentures. The Company’s Q410 results were below our expectations after the Company made deliveries on an OC Transpo contract that had lower average revenue per equivalent unit (EU) as compared to what New Flyer would realize on similar contracts going forward. Market challenges are expected to persist through 2011 as funding challenges among transport authorities will lead to slower order activity. Management stated they expect some some industry rationalization during the year, which could lead to more intense price competition, but the Company will continue to seek margin improvement through its operational excellence plan. The Company’s backlog stood at $3.68B at Q410, which affords investors signifi cant visibility and the Company additional fl exibility to manage through any uncertainty.
We maintain a BUY recommendation and a 12-month target price of $13.50 with an AVERAGE risk rating. Our target is based on our sum of parts approach using a 4.2% yield to call at August 2012 for the debt component of the IDS and a 6.0x multiple of our 2012e EBITDA.
Vector Aerospace (T-RNO) – Vector Aerospace’s shares rose 36.3% during Q111 as the Company’s strategic review process led to an acquisition offer from Eurocopter Holding, a subsidiary of European Aeronautic Defence and Space Company EADS N.V. (PA-EAD). EADS’ all cash offer of $13.00 per share implies a value of 9.6x trailing and 8.7x 2011e EBITDA, which is comparable to similar transactions in the sector and in-line with our expectations. We do not anticipate an alternate offer to materialize. Vector’s Board of Directors unanimously approved the Offer and shareholders with approximately 60% of the issued and outstanding Common Shares have entered into an irrevocable lock-up agreement to tender their shares. The deal is subject to regulatory approval and two-thirds approval of all shareholders. A circular detailing the bid is expected to be released soon. We expect the fi nal closing could take 70 to 90 days to complete and we will continue to monitor the process through to completion.
We lowered our recommendation to HOLD in the quarter with the bid announcement and raised our 12-month target price to $13.00 refl ecting the bid price of the acquisition which includes a premium over our going concern assumption with an AVERAGE risk rating.
Northstar Aerospace (T-NAS) – Northstar’s shares increased 1.7% during the quarter, after reporting stronger than expected results in Q410. The Com-pany reported revenue of US$65.7M and EBITDA of US$10.6M, well ahead of our forecasts of US$46.6M and US$6.8M. The strong results were largely overshadowed by the outcome of the strategic review that Management has stated remains ongoing, which could potentially see the sale of the Company, amongst other corporate actions. We expect the sale of the Company or the announcement of some further developments in the process would serve as the primary catalyst to drive share prices higher and expect an acquisition price would be higher than our fair value target. While the recently announced transaction between EADS and Vector Aerospace, a Company Northstar has an intertwined history with, implies a 9.6x trailing EBITDA multiple, we would not expect multiples in a transaction involving Northstar to reach these levels. We expect a sale would most likely occur two to three turns lower given the Company’s earnings profi le and specifi c risks.
We maintain a 12-month target price of $3.50 and a BUY rating as well as an ABOVE AVERAGE risk rating on Northstar Aerospace. Our target price is based on a multiple of 5.75x our 2012e EBITDA and a 12.0x multiple of our 2012e EPS. The Company continues to trade at a discount to aerospace peers at 4.7x 2011e EBITDA versus peers at 6.8x and 9.9x 2011e earnings versus peers trading at 13.8x.
Top Pick: Air Canada (T-AC.A; AC.b)Shares Market Revenue (Million) EBITDA* (Million) P/E 12-Mos
Stock Recent O/S FD Cap. Indicated Current Target Target Stock Volatility/Symbol Price (Million) (Million) Cash Yield FY09A FY10A FY11E FY09A FY10A FY11E FYE Price Return Rating Risk
Air Canada T-AC.B $2.45 369.0 $904 N/A $9,739.0 $10,786.0 $11,558.0 $679.0 $1,386.0 $1,397.0 7.7x $5.50 124% BUY SPECBombardier Inc. T-BBD.B $7.13 1,754.9 $12,512 1.6% US$19,721 US$19,366 US$17,712A US$1,943 US$1,702 US$1,528A 19.0x $8.25 16% BUY ABVIESI-BFC Inc. T-BIN $24.64 121.7 $2,999 2.1% US$1008.5 US$1429.8 US$1855.0 US$290.4 US$413.8 US$563.5 23.9x $29.00 20% BUY AVGNew Flyer Industries T-NFI.UN $10.57 49.5 $523 11.1% US$1,099.9 US$1,033.6 US$1,001.2 US$100.1 US$106.4 US$107.9 N/A $13.50 39% BUY AVGNorthstar Aerospace Inc. T-NAS $2.34 31.4 $73 N/A US$193.9 US$217.0 US$216.8 US$26.3 US$27 US$26.9 10.1x $3.50 50% BUY ABVVector Aerospace Corp. T-RNO $12.83 48.8 $626 N/A $566.3 $544.6 $571.7 $62.4 $66.7 $73.0 15.5x $13.00 1% HOLD AVGWestJet Airlines Ltd. T-WJA $14.38 150.8 $2,169 1.4% $2,281.1 $2,609.0 $2,957.2 $455.8 $523.0 $572.0 12.5x $17.50 23% BUY ABV* Adj. EBITDA for New Flyer Industries and EBITDAR for WestJet Airlines and Air Canada.
Company Name
Analyst or a member of the Analyst's household owns shares of the following stocks on the Coverage List: none
TRANSPORTATION AND INDUSTRIAL PRODUCTS
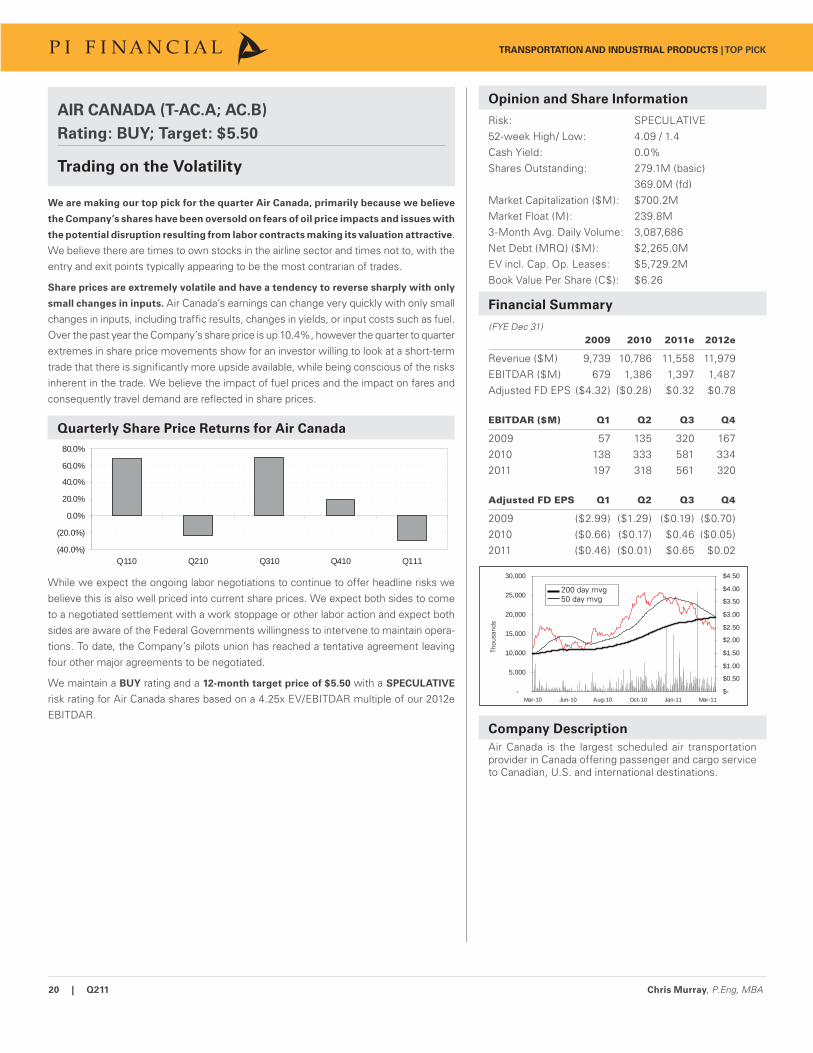
20 | Q211 Chris Murray, P.Eng, MBA
-
5,000
10,000
15,000
20,000
25,000
30,000
Mar-10 Jun-10 Aug-10 Oct-10 Jan-11 Mar-11$-
$0.50
$1.00
$1.50
$2.00
$2.50
$3.00
$3.50
$4.00
$4.50
AIR CANADA (T-AC.A; AC.B)
Rating: BUY; Target: $5.50
Trading on the Volatility
We are making our top pick for the quarter Air Canada, primarily because we believe
the Company’s shares have been oversold on fears of oil price impacts and issues with
the potential disruption resulting from labor contracts making its valuation attractive. We believe there are times to own stocks in the airline sector and times not to, with the entry and exit points typically appearing to be the most contrarian of trades.
Share prices are extremely volatile and have a tendency to reverse sharply with only
small changes in inputs. Air Canada’s earnings can change very quickly with only small changes in inputs, including traffi c results, changes in yields, or input costs such as fuel. Over the past year the Company’s share price is up 10.4%, however the quarter to quarter extremes in share price movements show for an investor willing to look at a short-term trade that there is signifi cantly more upside available, while being conscious of the risks inherent in the trade. We believe the impact of fuel prices and the impact on fares and consequently travel demand are refl ected in share prices.
Quarterly Share Price Returns for Air Canada
(40.0%)
(20.0%)
0.0%
20.0%
40.0%
60.0%
80.0%
Q110 Q210 Q310 Q410 Q111
While we expect the ongoing labor negotiations to continue to offer headline risks we believe this is also well priced into current share prices. We expect both sides to come to a negotiated settlement with a work stoppage or other labor action and expect both sides are aware of the Federal Governments willingness to intervene to maintain opera-tions. To date, the Company’s pilots union has reached a tentative agreement leaving four other major agreements to be negotiated.
We maintain a BUY rating and a 12-month target price of $5.50 with a SPECULATIVE
risk rating for Air Canada shares based on a 4.25x EV/EBITDAR multiple of our 2012e EBITDAR.
Opinion and Share Information
Risk: SPECULATIVE52-week High/ Low: 4.09 / 1.4Cash Yield: 0.0%Shares Outstanding: 279.1M (basic) 369.0M (fd)Market Capitalization ($M): $700.2MMarket Float (M): 239.8M3-Month Avg. Daily Volume: 3,087,686Net Debt (MRQ) ($M): $2,265.0MEV incl. Cap. Op. Leases: $5,729.2MBook Value Per Share (C$): $6.26
Financial Summary
(FYE Dec 31) 2009 2010 2011e 2012e
Revenue ($M) 9,739 10,786 11,558 11,979EBITDAR ($M) 679 1,386 1,397 1,487Adjusted FD EPS ($4.32) ($0.28) $0.32 $0.78 EBITDAR ($M) Q1 Q2 Q3 Q4
2009 57 135 320 1672010 138 333 581 3342011 197 318 561 320 Adjusted FD EPS Q1 Q2 Q3 Q4
2009 ($2.99) ($1.29) ($0.19) ($0.70)2010 ($0.66) ($0.17) $0.46 ($0.05)2011 ($0.46) ($0.01) $0.65 $0.02
Thou
sand
s
Company Description
Air Canada is the largest scheduled air transportation provider in Canada offering passenger and cargo service to Canadian, U.S. and international destinations.
200 day mvg50 day mvg
TRANSPORTATION AND INDUSTRIAL PRODUCTS | TOP PICK
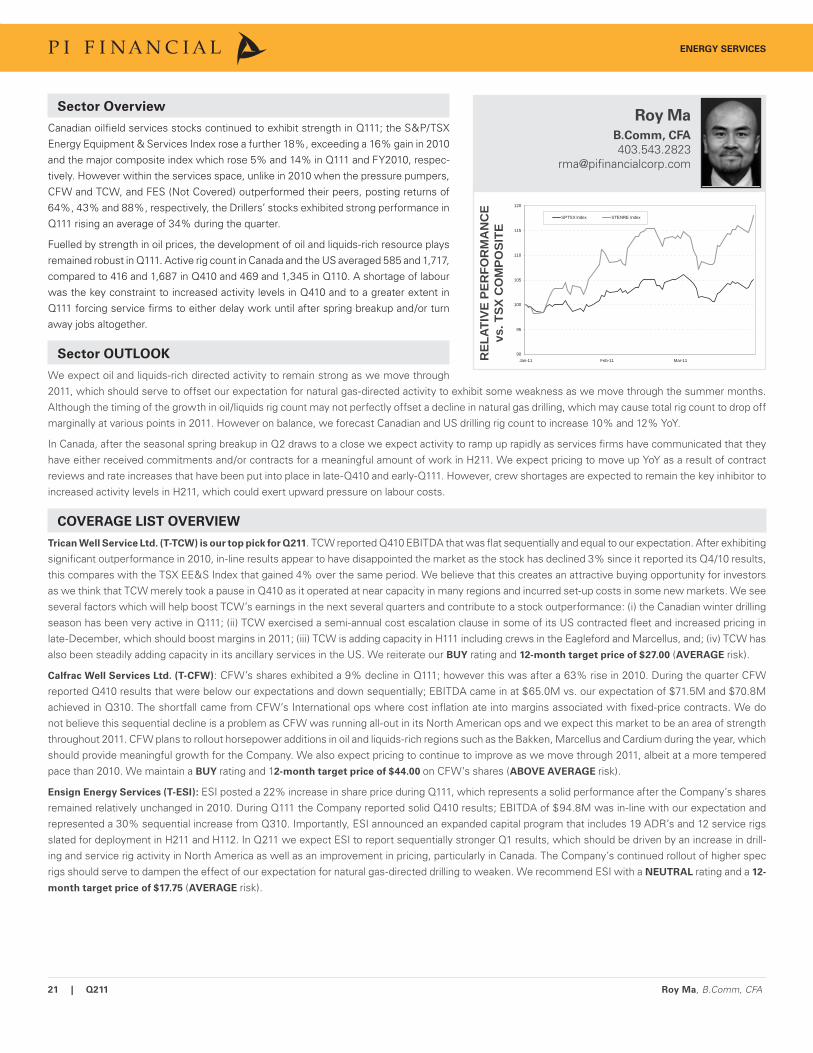
21 | Q211 Roy Ma, B.Comm, CFA
Sector Overview
Canadian oilfi eld services stocks continued to exhibit strength in Q111; the S&P/TSX Energy Equipment & Services Index rose a further 18%, exceeding a 16% gain in 2010 and the major composite index which rose 5% and 14% in Q111 and FY2010, respec-tively. However within the services space, unlike in 2010 when the pressure pumpers, CFW and TCW, and FES (Not Covered) outperformed their peers, posting returns of 64%, 43% and 88%, respectively, the Drillers’ stocks exhibited strong performance in Q111 rising an average of 34% during the quarter.
Fuelled by strength in oil prices, the development of oil and liquids-rich resource plays remained robust in Q111. Active rig count in Canada and the US averaged 585 and 1,717, compared to 416 and 1,687 in Q410 and 469 and 1,345 in Q110. A shortage of labour was the key constraint to increased activity levels in Q410 and to a greater extent in Q111 forcing service fi rms to either delay work until after spring breakup and/or turn away jobs altogether.
Sector OUTLOOK
We expect oil and liquids-rich directed activity to remain strong as we move through 2011, which should serve to offset our expectation for natural gas-directed activity to exhibit some weakness as we move through the summer months. Although the timing of the growth in oil/liquids rig count may not perfectly offset a decline in natural gas drilling, which may cause total rig count to drop off marginally at various points in 2011. However on balance, we forecast Canadian and US drilling rig count to increase 10% and 12% YoY.
In Canada, after the seasonal spring breakup in Q2 draws to a close we expect activity to ramp up rapidly as services fi rms have communicated that they have either received commitments and/or contracts for a meaningful amount of work in H211. We expect pricing to move up YoY as a result of contract reviews and rate increases that have been put into place in late-Q410 and early-Q111. However, crew shortages are expected to remain the key inhibitor to increased activity levels in H211, which could exert upward pressure on labour costs.
COVERAGE LIST OVERVIEW
Trican Well Service Ltd. (T-TCW) is our top pick for Q211. TCW reported Q410 EBITDA that was fl at sequentially and equal to our expectation. After exhibiting signifi cant outperformance in 2010, in-line results appear to have disappointed the market as the stock has declined 3% since it reported its Q4/10 results, this compares with the TSX EE&S Index that gained 4% over the same period. We believe that this creates an attractive buying opportunity for investors as we think that TCW merely took a pause in Q410 as it operated at near capacity in many regions and incurred set-up costs in some new markets. We see several factors which will help boost TCW’s earnings in the next several quarters and contribute to a stock outperformance: (i) the Canadian winter drilling season has been very active in Q111; (ii) TCW exercised a semi-annual cost escalation clause in some of its US contracted fl eet and increased pricing in late-December, which should boost margins in 2011; (iii) TCW is adding capacity in H111 including crews in the Eagleford and Marcellus, and; (iv) TCW has also been steadily adding capacity in its ancillary services in the US. We reiterate our BUY rating and 12-month target price of $27.00 (AVERAGE risk).
Calfrac Well Services Ltd. (T-CFW): CFW’s shares exhibited a 9% decline in Q111; however this was after a 63% rise in 2010. During the quarter CFW reported Q410 results that were below our expectations and down sequentially; EBITDA came in at $65.0M vs. our expectation of $71.5M and $70.8M achieved in Q310. The shortfall came from CFW’s International ops where cost infl ation ate into margins associated with fi xed-price contracts. We do not believe this sequential decline is a problem as CFW was running all-out in its North American ops and we expect this market to be an area of strength throughout 2011. CFW plans to rollout horsepower additions in oil and liquids-rich regions such as the Bakken, Marcellus and Cardium during the year, which should provide meaningful growth for the Company. We also expect pricing to continue to improve as we move through 2011, albeit at a more tempered pace than 2010. We maintain a BUY rating and 12-month target price of $44.00 on CFW’s shares (ABOVE AVERAGE risk).
Ensign Energy Services (T-ESI): ESI posted a 22% increase in share price during Q111, which represents a solid performance after the Company’s shares remained relatively unchanged in 2010. During Q111 the Company reported solid Q410 results; EBITDA of $94.8M was in-line with our expectation and represented a 30% sequential increase from Q310. Importantly, ESI announced an expanded capital program that includes 19 ADR’s and 12 service rigs slated for deployment in H211 and H112. In Q211 we expect ESI to report sequentially stronger Q1 results, which should be driven by an increase in drill-ing and service rig activity in North America as well as an improvement in pricing, particularly in Canada. The Company’s continued rollout of higher spec rigs should serve to dampen the effect of our expectation for natural gas-directed drilling to weaken. We recommend ESI with a NEUTRAL rating and a 12-
month target price of $17.75 (AVERAGE risk).
Roy Ma
B.Comm, CFA
403.543.2823rma@pifi nancialcorp.com
REL
ATIV
E PE
RFO
RM
AN
CE
vs. T
SX C
OM
POSI
TE
90
95
100
105
110
115
120
Jan-11 Feb-11 Mar-11
SPTSX Index STENRE Index
ENERGY SERVICES
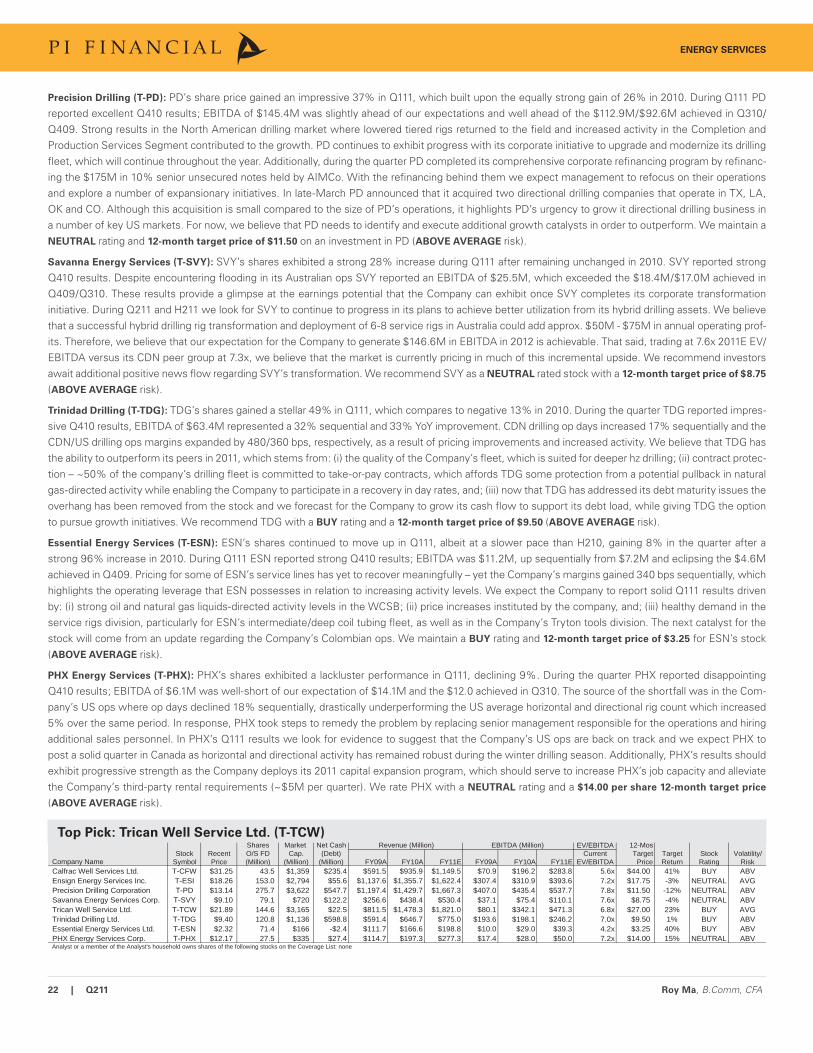
22 | Q211 Roy Ma, B.Comm, CFA
ENERGY SERVICES
Precision Drilling (T-PD): PD’s share price gained an impressive 37% in Q111, which built upon the equally strong gain of 26% in 2010. During Q111 PD reported excellent Q410 results; EBITDA of $145.4M was slightly ahead of our expectations and well ahead of the $112.9M/$92.6M achieved in Q310/Q409. Strong results in the North American drilling market where lowered tiered rigs returned to the fi eld and increased activity in the Completion and Production Services Segment contributed to the growth. PD continues to exhibit progress with its corporate initiative to upgrade and modernize its drilling fl eet, which will continue throughout the year. Additionally, during the quarter PD completed its comprehensive corporate refi nancing program by refi nanc-ing the $175M in 10% senior unsecured notes held by AIMCo. With the refi nancing behind them we expect management to refocus on their operations and explore a number of expansionary initiatives. In late-March PD announced that it acquired two directional drilling companies that operate in TX, LA, OK and CO. Although this acquisition is small compared to the size of PD’s operations, it highlights PD’s urgency to grow it directional drilling business in a number of key US markets. For now, we believe that PD needs to identify and execute additional growth catalysts in order to outperform. We maintain a NEUTRAL rating and 12-month target price of $11.50 on an investment in PD (ABOVE AVERAGE risk).
Savanna Energy Services (T-SVY): SVY’s shares exhibited a strong 28% increase during Q111 after remaining unchanged in 2010. SVY reported strong Q410 results. Despite encountering fl ooding in its Australian ops SVY reported an EBITDA of $25.5M, which exceeded the $18.4M/$17.0M achieved in Q409/Q310. These results provide a glimpse at the earnings potential that the Company can exhibit once SVY completes its corporate transformation initiative. During Q211 and H211 we look for SVY to continue to progress in its plans to achieve better utilization from its hybrid drilling assets. We believe that a successful hybrid drilling rig transformation and deployment of 6-8 service rigs in Australia could add approx. $50M - $75M in annual operating prof-its. Therefore, we believe that our expectation for the Company to generate $146.6M in EBITDA in 2012 is achievable. That said, trading at 7.6x 2011E EV/EBITDA versus its CDN peer group at 7.3x, we believe that the market is currently pricing in much of this incremental upside. We recommend investors await additional positive news fl ow regarding SVY’s transformation. We recommend SVY as a NEUTRAL rated stock with a 12-month target price of $8.75
(ABOVE AVERAGE risk).
Trinidad Drilling (T-TDG): TDG’s shares gained a stellar 49% in Q111, which compares to negative 13% in 2010. During the quarter TDG reported impres-sive Q410 results, EBITDA of $63.4M represented a 32% sequential and 33% YoY improvement. CDN drilling op days increased 17% sequentially and the CDN/US drilling ops margins expanded by 480/360 bps, respectively, as a result of pricing improvements and increased activity. We believe that TDG has the ability to outperform its peers in 2011, which stems from: (i) the quality of the Company’s fl eet, which is suited for deeper hz drilling; (ii) contract protec-tion – ~50% of the company’s drilling fl eet is committed to take-or-pay contracts, which affords TDG some protection from a potential pullback in natural gas-directed activity while enabling the Company to participate in a recovery in day rates, and; (iii) now that TDG has addressed its debt maturity issues the overhang has been removed from the stock and we forecast for the Company to grow its cash fl ow to support its debt load, while giving TDG the option to pursue growth initiatives. We recommend TDG with a BUY rating and a 12-month target price of $9.50 (ABOVE AVERAGE risk).
Essential Energy Services (T-ESN): ESN’s shares continued to move up in Q111, albeit at a slower pace than H210, gaining 8% in the quarter after a strong 96% increase in 2010. During Q111 ESN reported strong Q410 results; EBITDA was $11.2M, up sequentially from $7.2M and eclipsing the $4.6M achieved in Q409. Pricing for some of ESN’s service lines has yet to recover meaningfully – yet the Company’s margins gained 340 bps sequentially, which highlights the operating leverage that ESN possesses in relation to increasing activity levels. We expect the Company to report solid Q111 results driven by: (i) strong oil and natural gas liquids-directed activity levels in the WCSB; (ii) price increases instituted by the company, and; (iii) healthy demand in the service rigs division, particularly for ESN’s intermediate/deep coil tubing fl eet, as well as in the Company’s Tryton tools division. The next catalyst for the stock will come from an update regarding the Company’s Colombian ops. We maintain a BUY rating and 12-month target price of $3.25 for ESN’s stock (ABOVE AVERAGE risk).
PHX Energy Services (T-PHX): PHX’s shares exhibited a lackluster performance in Q111, declining 9%. During the quarter PHX reported disappointing Q410 results; EBITDA of $6.1M was well-short of our expectation of $14.1M and the $12.0 achieved in Q310. The source of the shortfall was in the Com-pany’s US ops where op days declined 18% sequentially, drastically underperforming the US average horizontal and directional rig count which increased 5% over the same period. In response, PHX took steps to remedy the problem by replacing senior management responsible for the operations and hiring additional sales personnel. In PHX’s Q111 results we look for evidence to suggest that the Company’s US ops are back on track and we expect PHX to post a solid quarter in Canada as horizontal and directional activity has remained robust during the winter drilling season. Additionally, PHX’s results should exhibit progressive strength as the Company deploys its 2011 capital expansion program, which should serve to increase PHX’s job capacity and alleviate the Company’s third-party rental requirements (~$5M per quarter). We rate PHX with a NEUTRAL rating and a $14.00 per share 12-month target price (ABOVE AVERAGE risk).
Top Pick: Trican Well Service Ltd. (T-TCW)Shares Market Net Cash Revenue (Million) EBITDA (Million) EV/EBITDA 12-Mos
Stock Recent O/S FD Cap. (Debt) Current Target Target Stock Volatility/Symbol Price (Million) (Million) (Million) FY09A FY10A FY11E FY09A FY10A FY11E EV/EBITDA Price Return Rating Risk
Calfrac Well Services Ltd. T-CFW $31.25 43.5 $1,359 $235.4 $591.5 $935.9 $1,149.5 $70.9 $196.2 $283.8 5.6x $44.00 41% BUY ABVEnsign Energy Services Inc. T-ESI $18.26 153.0 $2,794 $55.6 $1,137.6 $1,355.7 $1,622.4 $307.4 $310.9 $393.6 7.2x $17.75 -3% NEUTRAL AVGPrecision Drilling Corporation T-PD $13.14 275.7 $3,622 $547.7 $1,197.4 $1,429.7 $1,667.3 $407.0 $435.4 $537.7 7.8x $11.50 -12% NEUTRAL ABVSavanna Energy Services Corp. T-SVY $9.10 79.1 $720 $122.2 $256.6 $438.4 $530.4 $37.1 $75.4 $110.1 7.6x $8.75 -4% NEUTRAL ABVTrican Well Service Ltd. T-TCW $21.89 144.6 $3,165 $22.5 $811.5 $1,478.3 $1,821.0 $80.1 $342.1 $471.3 6.8x $27.00 23% BUY AVGTrinidad Drilling Ltd. T-TDG $9.40 120.8 $1,136 $598.8 $591.4 $646.7 $775.0 $193.6 $198.1 $246.2 7.0x $9.50 1% BUY ABVEssential Energy Services Ltd. T-ESN $2.32 71.4 $166 -$2.4 $111.7 $166.6 $198.8 $10.0 $29.0 $39.3 4.2x $3.25 40% BUY ABVPHX Energy Services Corp. T-PHX $12.17 27.5 $335 $27.4 $114.7 $197.3 $277.3 $17.4 $28.0 $50.0 7.2x $14.00 15% NEUTRAL ABV
Company Name
Analyst or a member of the Analyst's household owns shares of the following stocks on the Coverage List: none
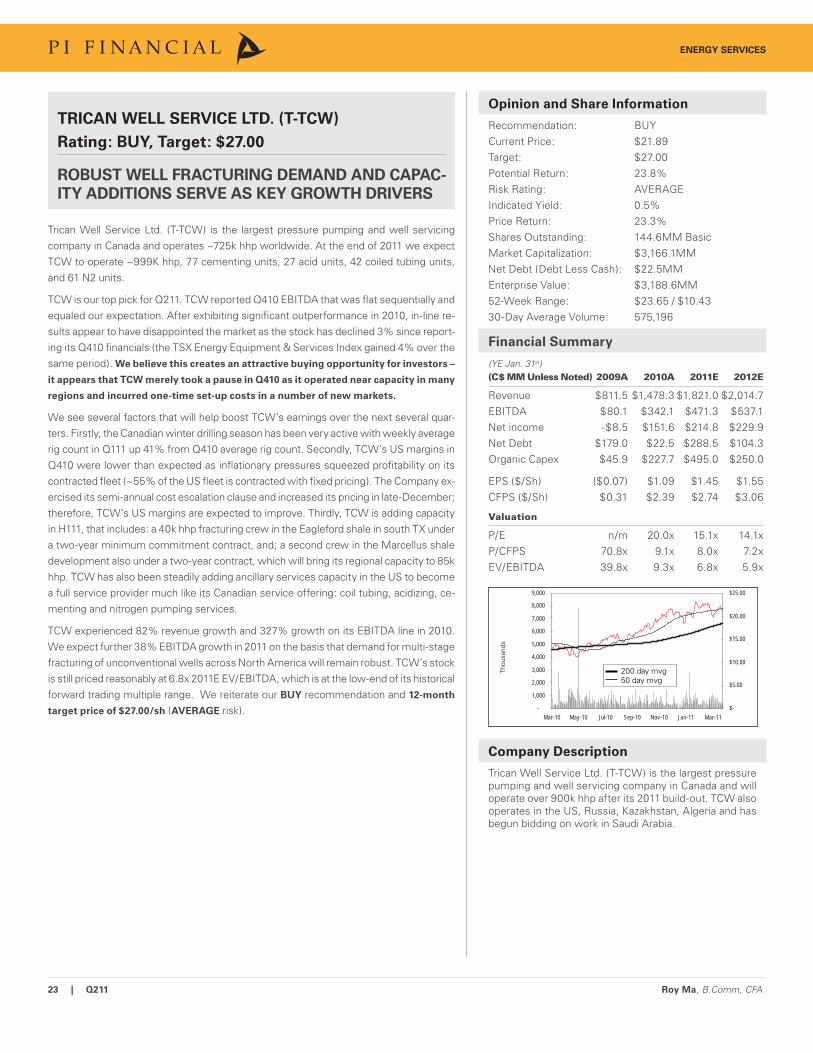
23 | Q211 Roy Ma, B.Comm, CFA
-
1,000
2,000
3,000
4,000
5,000
6,000
7,000
8,000
9,000
Mar-10 May-10 Jul-10 Sep-10 Nov-10 Jan-11 Mar-11$-
$5.00
$10.00
$15.00
$20.00
$25.00
Opinion and Share Information
Recommendation: BUYCurrent Price: $21.89Target: $27.00Potential Return: 23.8%Risk Rating: AVERAGEIndicated Yield: 0.5%Price Return: 23.3%Shares Outstanding: 144.6MM BasicMarket Capitalization: $3,166.1MMNet Debt (Debt Less Cash): $22.5MMEnterprise Value: $3,188.6MM52-Week Range: $23.65 / $10.4330-Day Average Volume: 575,196
Financial Summary
(YE Jan. 31st)(C$ MM Unless Noted) 2009A 2010A 2011E 2012E
Revenue $811.5 $1,478.3 $1,821.0 $2,014.7EBITDA $80.1 $342.1 $471.3 $537.1Net income -$8.5 $151.6 $214.8 $229.9Net Debt $179.0 $22.5 $288.5 $104.3Organic Capex $45.9 $227.7 $495.0 $250.0
EPS ($/Sh) ($0.07) $1.09 $1.45 $1.55 CFPS ($/Sh) $0.31 $2.39 $2.74 $3.06
Valuation
P/E n/m 20.0x 15.1x 14.1xP/CFPS 70.8x 9.1x 8.0x 7.2xEV/EBITDA 39.8x 9.3x 6.8x 5.9x
Thou
sand
s
Company Description
Trican Well Service Ltd. (T-TCW) is the largest pressure pumping and well servicing company in Canada and will operate over 900k hhp after its 2011 build-out. TCW also operates in the US, Russia, Kazakhstan, Algeria and has begun bidding on work in Saudi Arabia.
TRICAN WELL SERVICE LTD. (T-TCW)
Rating: BUY, Target: $27.00
ROBUST WELL FRACTURING DEMAND AND CAPAC-
ITY ADDITIONS SERVE AS KEY GROWTH DRIVERS
Trican Well Service Ltd. (T-TCW) is the largest pressure pumping and well servicing company in Canada and operates ~725k hhp worldwide. At the end of 2011 we expect TCW to operate ~999K hhp, 77 cementing units, 27 acid units, 42 coiled tubing units, and 61 N2 units.
TCW is our top pick for Q211. TCW reported Q410 EBITDA that was fl at sequentially and equaled our expectation. After exhibiting signifi cant outperformance in 2010, in-line re-sults appear to have disappointed the market as the stock has declined 3% since report-ing its Q410 fi nancials (the TSX Energy Equipment & Services Index gained 4% over the same period). We believe this creates an attractive buying opportunity for investors –
it appears that TCW merely took a pause in Q410 as it operated near capacity in many
regions and incurred one-time set-up costs in a number of new markets.
We see several factors that will help boost TCW’s earnings over the next several quar-ters. Firstly, the Canadian winter drilling season has been very active with weekly average rig count in Q111 up 41% from Q410 average rig count. Secondly, TCW’s US margins in Q410 were lower than expected as infl ationary pressures squeezed profi tability on its contracted fl eet (~55% of the US fl eet is contracted with fi xed pricing). The Company ex-ercised its semi-annual cost escalation clause and increased its pricing in late-December; therefore, TCW’s US margins are expected to improve. Thirdly, TCW is adding capacity in H111, that includes: a 40k hhp fracturing crew in the Eagleford shale in south TX under a two-year minimum commitment contract, and; a second crew in the Marcellus shale development also under a two-year contract, which will bring its regional capacity to 85k hhp. TCW has also been steadily adding ancillary services capacity in the US to become a full service provider much like its Canadian service offering: coil tubing, acidizing, ce-menting and nitrogen pumping services.
TCW experienced 82% revenue growth and 327% growth on its EBITDA line in 2010. We expect further 38% EBITDA growth in 2011 on the basis that demand for multi-stage fracturing of unconventional wells across North America will remain robust. TCW’s stock is still priced reasonably at 6.8x 2011E EV/EBITDA, which is at the low-end of its historical forward trading multiple range. We reiterate our BUY recommendation and 12-month
target price of $27.00/sh (AVERAGE risk).
200 day mvg50 day mvg
ENERGY SERVICES
24 | Q211
Disclosure Fact Sheet
Ratings Price Volatility / Risk
Analyst Certifi cation
I, Sheila Broughton, Roy Ma, Chris Murray, Pardeep Sangha, Alistair Toward and Jason Zandberg, hereby certify that all of the views expressed in this report accurately
refl ect my personal views about the subject securities or issuers. I also certify that no part of my compensation was, is, or will be, directly or indirectly related to the specifi c
recommendations or views expressed in this report. I am the research analyst primarily responsible for preparing this report.
Research Disclosures
Company Disclosure Particulars
Air Canada None
Cervus Equipment Corp. None
Equal Energy Ltd. None
Rocky Mountain Dealerships Inc. None
Premium Brands Holdings Corp. 3
Hemisphere GPS 3
Trican Well Service Ltd. None
Applicability
1) PI Financial Corp. and its affi liates’ holdings in the subject company’s securities, in aggregate exceeds 1% of each company’s issued and outstanding securities.
2) The analyst(s) responsible for the report or recommendation on the subject company, a member of the research analyst’s household, and associate of the research
analyst, or any individual directly involved in the preparation of this report, have a fi nancial interest in, or exercises investment discretion or control over, securities is-
sued by the following companies.
3) PI Financial Corp. and/or its affi liates have received compensation for investment banking services for the subject company over the preceding 12-month period.
4) PI Financial Corp. and/or its affi liates expect to receive or intend to seek compensation for investment banking services from all companies under research coverage
within the next 3 months.
5) PI Financial Corp. and/or its affi liates have managed or co-managed a public offering of securities for the subject company in the past 12 months.
6) The following director(s), offi cer(s) or employee(s) of PI Financial Corp. is a director of the subject company in which PI provides research coverage.
7) A member of the research analyst’s household serves as an offi cer, director or advisory board member of the subject company.
8) PI Financial Corp. and/or its affi liates makes a market in the securities of the subject company.
9) Company has partially funded previous analyst visits to its projects.
10) Additional disclosure:
BUY : recommendation: stock is expected to appreciate from its current price level
at least 10-20% in the next 12 months.
NEUTRAL : recommendation: stock is expected to trade in a narrow range from its
current price level in the next 12 months.
SELL : recommendation: stock is expected to decline from its current price level at
least 10-20% in the next 12 months.
U/R : Under Review
N/R : No Rating
Analyst recommendations and targets are based on the stock’s expected return over
a 12-month period or may be based on the company achieving specifi c fundamental
results. Under certain circumstances, and at the discretion of the analyst, a recom-
mendation may be applied for a shorter time period. The basis for the variability in
the expected percentage change for a recommendation, relates to the differences
in the risk ratings applied to individual stocks. For instance stocks that are rated
Speculative must be expected to appreciate at the high end of the range of 10-20%
over a 12-month period.
SPECULATIVE : The Company has no established operating revenue, and/or bal-
ance sheet or cash fl ow concerns exist. Typically low public fl oat or lack of liquidity
exists. Rated for risk tolerant investors only.
ABOVE AVERAGE : Revenue and earnings predictability may not be established.
Balance sheet or cash fl ow concerns may exist. Stock may exhibit low liquidity.
AVERAGE : Average revenue and earnings predictability has been established;
no signifi cant cash fl ow/balance sheet concerns are foreseeable over the next 12
months. Reasonable liquidity exists. Price Volatility/Risk analysis while broad based
includes the risks associated with a company’s balance sheet, variability of revenue
or earnings, industry or sector risks, and liquidity risk.
25 | Q211
General Disclosure
The affi liates of PI Financial Corp. are PI Financial (US) Corp., PI Financial Services Corp., and PI Capital Corp.
Analysts are compensated through a combined base salary and bonus payout system. The bonus payout is amongst other factors determined by revenues generated directly
or indirectly from various departments including Investment Banking. Evaluation is largely on an activity-based system that includes some of the following criteria: reports
generated, timeliness, performance of recommendations, knowledge of industry, quality of research and investment guidance, client feedback. Analysts are not directly
compensated for specifi c Investment Banking transactions.
None of the material, nor its content, nor any copy of it, may be altered in any way, transmitted to, copied or distributed to any other party, without the prior express written
permission of PI Financial Corp.
PI Financial Corp.’s policies and procedures regarding dissemination of research, and stock rating and target changes can be reviewed on our corporate website at www.
pifi nancialcorp.com (Research: Research and Confl ict Disclosure)
The attached summarizes PI’s analysts review of the material operations of the attached company(s).
Analyst Company Type of Review Operations / Project Date
Chris Murray Bombardier Inc. Site Visit / Management Mtg Henningsdorf Germany 10/10
Jason Zandberg Cervus Limited Partnership Marketing Tour Montreal QC 05/09
Alistair Toward Equal Energy Ltd. Management Mtg Calgary AB 02/11
Pardeep S. Sangha Hemisphere GPS Inc. Management Update Vancouver BC 01/11
Sheila Broughton Premium Brands Holdings Corp. Management Meetings Vancouver BC 07/10
Jason Zandberg Rocky Mountain Dealerships Management Mtg Vancouver BC 10/09
Roy Ma Trican Well Service Ltd. Management Mtg Calgary AB 10/10
Disclosure to US Residents
PI Financial (US) Corp. is a U.S. registered broker-dealer and subsidiary of PI Financial Corp. PI Financial (US) Corp. accepts responsibility for the contents of this research
report, subject to the terms and limitations as set out above. U.S. residents seeking to effect a transaction in any security discussed herein should contact PI Financial (US)
Corp. directly.
Global Stock Distribution
Recommendations Number of Recommendations Percentage
BUY 42 82.35%
NEUTRAL 8 15.69%
SELL 1 1.96%
U/R 0 0.00%
N/R 0 0.00%
TOTAL 51
Stock Rating and Target Changes
For reports that cover six subject companies or more, the reader is referred to our corporate web site for information regarding stock ratings and target changes. www.
pifi nancialcorp.com (Research: Research and Confl ict Disclosure)

Members: All major Canadian Stock Exchanges, Investment Industry Regulatory Organization of Canada, Canadian Investor Protection Fund and International Financial Centre (British Columbia).
Estimates and projections contained herein are our own and are based on assumptions which we believe to be reasonable. Information presented herein, while obtained
from sources we believe to be reliable, is not guaranteed either as to accuracy or completeness, nor in providing it does PI Financial Corp. assume any responsibility
or liability. This information is given as of the date appearing on this report, and PI Financial Corp. assumes no obligation to update the information or advise on further
developments relating to securities. PI Financial Corp. and its affi liates, as well as their respective partners, directors, shareholders, and employees may have a posi-
tion in the securities mentioned herein and may make purchases and/or sales from time to time. PI Financial Corp. may act, or may have acted in the past, as a fi nancial
advisor, fi scal agent or underwriter for certain of the companies mentioned herein and may receive, or may have received, a remuneration for their services from those
companies. This report is not to be construed as an offer to sell, or the solicitation of an offer to buy, securities and is intended for distribution only in those jurisdictions
where PI Financial Corp. is registered as an advisor or a dealer in securities. Any distribution or dissemination of this report in any other jurisdiction is strictly prohibited.
For further disclosure information, reader is referred to the disclosure section of our website.
Capital Markets Group
Bert Quattrociocchi, BA, CFA
Executive Vice President, Head of Capital Markets
604.664.2925
Research Analysts
Consumer Products & Special SituationsSheila Broughton, MBA, CFA604.664.2695
Oil & GasAlistair Toward, B.Comm, CFA403.543.2824
Energy ServicesRoy Ma, B.Comm, CFA403.543.2823
MiningEric Zaunscherb, B.Sc., CFA604.664.2937
Special SituationsJason Zandberg, B.B.A, CFA604.718.7541
TechnologyPardeep S. Sangha, B.A.Sc., MBA604.718.7528
Transportation & Industrial ProductsChris Murray, P.Eng, MBA416.883.9047
Research Associates
Todd Brady, MBA, CGA647.789.2406
Issam El-Hourani, MFRM604.718.7534
Chris LeGrow, B.Comm403.543.2822
David Seymour, M.Sc., MBA403.543.2828
Sharon Wang, M.Sc. (Finance)604.664.2789
Marketing and Publishing
Michelle Kwok604.664.2724
Tanya Rosenbrock604.664.2707
Institutional Sales
Head of Institutional SalesJim Danis, B.Sc. (Hons.)604.718.7551
Priya Patil, B.Sc., LL.B.416.883.9044
Denton Creighton, BA, MBA416.883.9043
David Goguen, CFA604.664.2963
Jeremiah Katz604.664.2816
Ian Mellon, BA416.883.9045
Doug Melton, FCSI604.718.7532
Jamie Riff, B.Sc, MBA416.883.9048
Institutional Trading
Donna McGuigan416.883.9042 or 888.525.8811
Darren Ricci604.664.2998 or 800.667.6124 (US) or 877.682.7233 (CDN)
Joe Tibble604.718.7525 or 888.525.8811
Adam Dell, B.Comm604.718.7517 or 888.525.8811
Investment Banking
VancouverBlake Corbet, BA604.664.2967
Jim Mustard, B.A.Sc., P. Eng604.664.3655
Carol Ellis, MBA, P.Geo604.664.3606
Leo Wilson, CA604.718.7510
TorontoDean McPherson, B.Sc, MBA647.789.2405
Bill Murray, B.Sc., MBA, CFA416.883.9049
CalgaryArthur Kwan, MBA, CFA403.543.2918
Equity Capital Markets/SyndicationErica Williamson604.664.3637
Kinga Gadomska604.664.3604
Head Offi ce
Suite 1900, 666 Burrard Street
Vancouver, BC, Canada V6C 3N1
ph: 604.664.2900
fx: 604.664.2666
Calgary Offi ce
Suite 1560, 300 5th Avenue SW
Calgary, AB, Canada T2P 3C4
ph: 403.543.2900
fx: 403.543.2800
Victoria Offi ce
Suite 620, 880 Douglas Street
Victoria, BC, Canada V8W 2B7
ph: 250.405.2900
fx: 250.405.2911
Toronto Offi ce
Suite 3401, 40 King Street West
Toronto, ON, Canada M5H 3Y2
ph: 416.883.9040
fx: 647.789.2401
PI Financial Corp. www.pifi nancialcorp.com