Embed Size (px)
Citation preview

SECOND QUARTER MARKET REPORT
APRIL – JUNE 2018
Malawi’s global portal
Old Reserve Bank Building, Victoria Avenue P/Bag 270 Blantyre
Malawi
Telephone: (265) 01 824 233; Fax: (265) 01 823 636
E-mail: [email protected]
Website: www.mse.co.mw

QUARTERLY MARKET PERFORMANCE REPORT
CONTENTS
Trading Summary 1
Market performance 2
Trade performance analysis 2
Market capitalization and index 2
Market liquidity 2
Company trading performance 3
Bonds/Treasury Notes 4
Economic review 5
1 . T R A D I N G S U M M A R Y
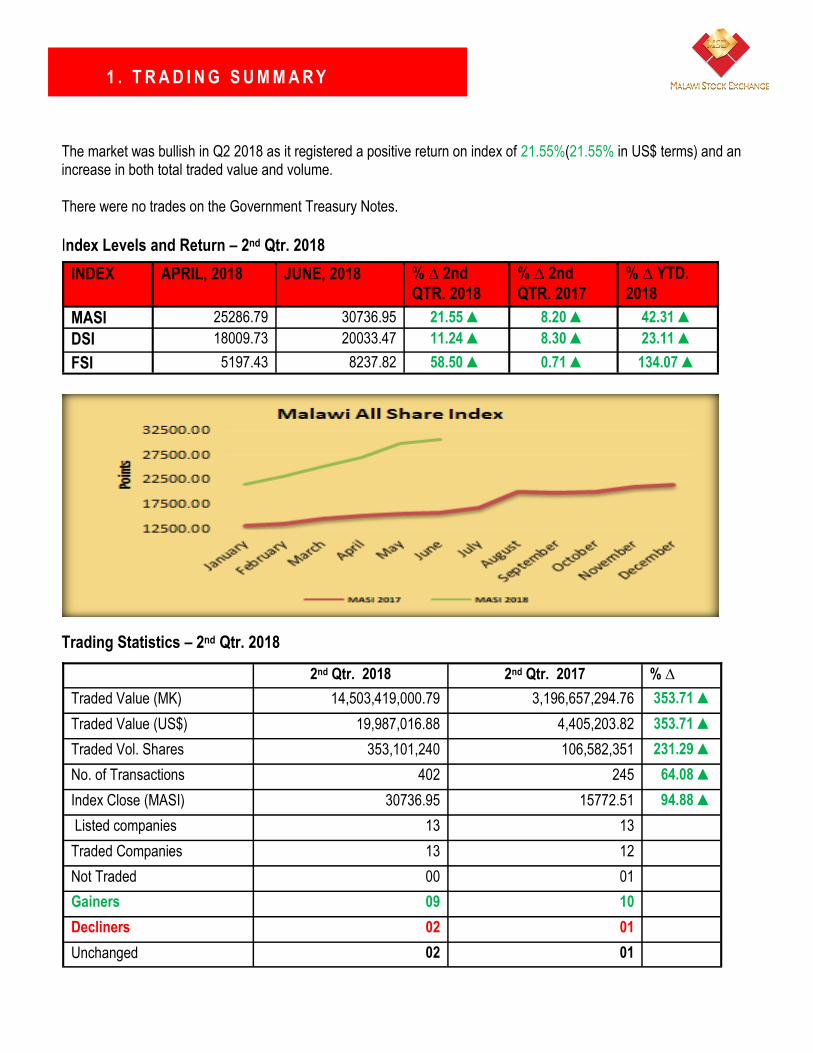
The market was bullish in Q2 2018 as it registered a positive return on index of 21.55%(21.55% in US$ terms) and an increase in both total traded value and volume. There were no trades on the Government Treasury Notes.
Index Levels and Return – 2nd Qtr. 2018
Trading Statistics – 2nd Qtr. 2018
INDEX APRIL, 2018 JUNE, 2018 % ∆ 2nd
QTR. 2018
% ∆ 2nd
QTR. 2017
% ∆ YTD.
2018
MASI 25286.79 30736.95 21.55 ▲ 8.20 ▲ 42.31 ▲
DSI 18009.73 20033.47 11.24 ▲ 8.30 ▲ 23.11 ▲
FSI 5197.43 8237.82 58.50 ▲ 0.71 ▲ 134.07 ▲
2nd Qtr. 2018 2nd Qtr. 2017 % ∆
Traded Value (MK) 14,503,419,000.79 3,196,657,294.76 353.71 ▲
Traded Value (US$) 19,987,016.88 4,405,203.82 353.71 ▲
Traded Vol. Shares 353,101,240 106,582,351 231.29 ▲
No. of Transactions 402 245 64.08 ▲
Index Close (MASI) 30736.95 15772.51 94.88 ▲
Listed companies 13 13
Traded Companies 13 12
Not Traded 00 01
Gainers 09 10
Decliners 02 01
Unchanged 02 01
QUARTERLY MARKET PERFORMANCE REPORT
2 . M A R K E T P E R F O R M A N C E
A. Trade Performance
Analysis
The market transacted a total of 353,101,240 shares at a total consideration of MK14,503,419,000.79 (US$19,987,016.88) in 402 trades. In the corresponding period 2017, the market transacted a total of 106,582,351 shares at a total consideration of
MK3,196,657,294.76 (US$4,405,203.82) in 245 trades. This reflects a 231.29%
increase in terms of share volume and a 353.71% (353.71% in US Dollar terms)
increase in share value.
Old Mutual limited (OMU) listed on 26 June, 2018 and Old Mutual plc (OML) delisted on
29 June, 2018.
Daily average share trades exhibited similar trends where the market registered an
average daily volume of 5,695,181 shares compared to 1,719,070 shares traded in the
corresponding second quarter of 2017.
The average daily turnover for the second quarter 2018 was MK233,926,112.92
(US$322,371.24) compared with MK51,558,988.63 (US$71,051.67) for the
corresponding second quarter 2017, reflecting an increase of 353.71% (353.71% in US
Dollar terms).
The month of May registered the highest in terms of both value of MK10,613,139,506.15
(US$14,625,963.41) and volume of 265,730,032 shares.
B. Market
Capitalization and
Index
The market registered a positive return on index as reflected in the upward
movement of the Malawi All Share Index (MASI) from 25286.79 points registered on
1 April 2018 to 30736.95 points registered on 29th June 2018, giving a return on index of
21.55%, (21.55% in US$ terms) compared to 8.20%, (8.20% in US$ terms) registered in
Q2 of 2017. The price gains registered by FMBCH, MPICO, NBM, NITL, PCL,
STANDARD, SUNBIRD, TNM and OML were enough to offset share price losses
registered by NBS and NICO resulting into an upward movement of the Malawi All Share
Index, arising from an increase in both the Domestic Share Index (11.24%) and the
Foreign Share Index (58.50%).
Market capitalization increased in both Kwacha and United States Dollar terms from MK1,120,104.50 million (US$1,543.5776 million) in April 2018 to MK1,370,739.23 million
(US$1,888.9687 million) in June 2018.
C. Market Liquidity The turnover velocity measured by the ratio of Total Value of Trades to Market Capitalisation (TVT/MCAP*), an indicator of the liquidity of assets traded on the market, in the quarter under review was recorded at 2.12%, higher than 0.93% registered in second quarter 2017. The ratio of Total Value of Trades to Gross Domestic Product (TVT/GDP) recorded a liquidity level of 0.56% in the review period while during the corresponding period of 2017 liquidity was at 0.14%.

2 . M A R K E T P E R F O R M A N C E

QUARTERLY MARKET PERFORMANCE REPORT
3 . C O M P A N Y T R A D I N G P E R F O R M A N C E
A. Top gainers: Nine
Counters registered
gains
B. Top Losers: Two
Counter registered
losses
C. Top Five Traded
Stocks by volume
D. Top Five Traded
Stocks by value
MSE CODE COUNTER NAME % GAIN
FMBCH FMB Capital Holdings plc 60.00 ▲
NITL National Investment Trust plc 32.73 ▲
SUNBIRD Sunbird Tourism plc 31.76 ▲
PCL Press Corporation plc 28.24 ▲
OML Old Mutual plc 26.27 ▲
MSE CODE COUNTER NAME % LOSS
NICO NICO Holdings plc 4.17 ▼
NBS NBS Bank plc 0.46 ▼
MSE CODE COUNTER NAME % of Total SHARES
TNM Telekom Networks Malawi plc 54.43 192,197,456
NICO NICO Holdings plc 17.07 60,260,334
MPICO MPICO plc 10.11 35,708,635
SUNBIRD Sunbird Tourism plc 7.49 26,453,678
FMBCH FMB Capital Holdings plc 5.97 21,096,450
MSE CODE COUNTER NAME % of Total VALUE
TNM Telekom Networks Malawi plc 26.70 3,873,094,572.70
SUNBIRD Sunbird Tourism plc 21.03 3,049,830,424.00
NICO NICO Holdings plc 18.27 2,649,967,092.30
FMBCH FMB Capital Holdings plc 17.32 2,511,395,414.76
ILLOVO Illovo Sugar Malawi plc 7.35 1,065,460,400.00

3 . C O M P A N Y T R A D I N G P E R F O R M A N C E
COUNTER HIGH (MK)
LOW (MK)
MKT CAP (MK’Mln) MKT CAP (US$’Mln) Earnings Yield (%)
P/BV P/E
BHL 7.00 7.00 5,878.25 8.10 8.62 1.14 11.60
FMBCH 160.01 100.00 373,800.00 515.12 6.75 3.60 14.81
ILLOVO 240.00 240.00 171,226.65 235.96 4.13 4.68 24.18
MPICO 19.70 18.96 44,788.94 61.72 11.37 1.62 8.79
NBM 300.00 280.00 140,079.52 193.04 13.67 1.73 7.32
NBS 8.70 8.66 25,205.57 34.73 N/A 2.01 N/A
NICO 48.00 46.00 47,979.89 66.12 23.18 2.13 4.31
NITL 73.00 55.00 9,855.00 13.58 22.54 1.15 4.44
PCL 772.00 602.00 92,837.49 127.94 42.73 0.74 2.34
STANDARD 670.00 610.00 157,227.67 216.67 7.74 2.18 12.93
SUNBIRD 150.00 110.05 37,929.47 52.27 14.99 2.02 6.67
TNM 24.01 18.00 240,970.80 332.07 5.44 8.27 18.38
OML 2,980.00 2,360.00 8.19 12.21 1.40 13,750.43 18.95
OMU 2,513.25 2,513.25 9,209.53 12.69 15.35 0.97 6.52

QUARTERLY MARKET PERFORMANCE REPORT
3 . C O M P A N Y T R A D I N G P E R F O R M A N C E
Company Opening
Price Closing
Price % Price Change Share Vol. Traded % Traded Value Traded MK
BHL 700 700 0.00 572,302 0.16 11,512,370.00
FMBCH 10000 16000 60.00 21,096,450 5.97 2,511,395,414.76
ILLOVO 24000 24000 0.00 5,106,085 1.45 1,065,460,400.00
MPICO 1830 1949 6.50 35,708,635 10.11 698,675,300.48
NBM 28000 30000 7.14 230,676 0.07 68,281,956.19
NBS 870 866 -0.46 9,169,047 2.60 79,712,395.34
NICO 4800 4600 -4.17 60,260,334 17.07 2,649,967,092.30
NITL 5500 7300 32.73 1,826,029 0.52 122,117,590.53
PCL 60200 77200 28.24 135,523 0.04 103,498,740.00
STANDARD 61000 67000 9.84 325,236 0.09 211,752,752.63
SUNBIRD 11005 14500 31.76 26,453,678 7.49 3,049,830,424.00
TNM 2000 2400 20.00 192,197,456 54.43 3,873,094,572.70
OMU 251325 251325 0.00 0 0.00 0.00
OML PLC 236000 298000 26.27 19,789 0.01 58,119,991.86
353,101,240 100.00
14,503,419,000.79
4 . B O N D T R A D I N G P E R F O R M A N C E
B O N D M A T U R I T Y D A T E
C O U P O N D A T E COUPON RATE (%)
N O M I N A L V A L U E ( M K ’ M N )
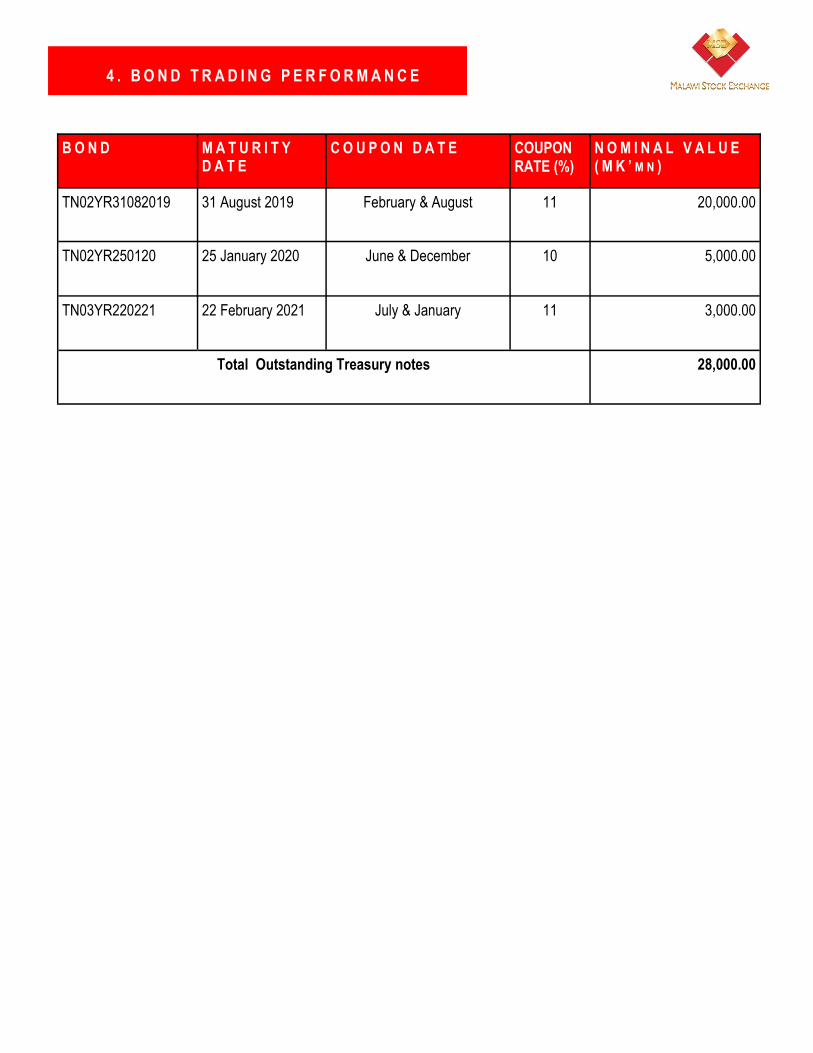
TN02YR31082019 31 August 2019 February & August 11 20,000.00
TN02YR250120 25 January 2020 June & December 10 5,000.00
TN03YR220221 22 February 2021 July & January 11 3,000.00
Total Outstanding Treasury notes 28,000.00

QUARTERLY MARKET PERFORMANCE REPORT
5 . E C O N O M I C R E V I E W
Interest Rates
During the quarter under review, the yield on the 91 Tbill decreased from 14.0000% to 13.9997% whilst the yields on 182 Tbill and the 364 Tbill were steady at
14.5000% and 15.0000% respectively.
Inflation Rates
Headline inflation eased by 0.8 percentage points from
9.7% in April, 2018 to 8.9% in May, 2018.
.
Exchange Rates
The Kwacha was stable against the United States Dollar
in the period under review.
Monetary Policy Rate
The Monetary Policy Committee at its meeting held
on 03 and 04 July, 2018 decided to maintain the
policy rate at 16%.


QUARTERLY MARKET PERFORMANCE REPORT
CONTACTS AND ADDRESSES OF MSE STOCK BROKERS
Stockbrokers Malawi Limited
NBM Business Complex
P.O Box 31180
Blantyre
Tel: +265 1 836 213
Fax: +265 1 824 353
Email: [email protected]
Cedar Capital Ltd (Formerly African Alliance Securities)
4th Floor, Livingstone Towers
P.O Box 3340
Blantyre
Tel:+265 1 831 995
Fax: +265 1 831 859
Email: [email protected]
Continental Capital Limited
1st Floor, Unit House
P.O Box 1444
Blantyre
Tel: +265 1 830 638
Email: [email protected]