Embed Size (px)
Citation preview

Financial and Operational Review
August 1, 2018
Second Quarter 2018

Forward-Looking Statements and Other Matters
2
This presentation (and oral statements made regarding the subjects of this presentation) contains forward-looking statements within the meaning of Section 27A of the Securities Act of 1933 and Section 21E of the Securities Exchange Act of 1934. These are statements, other than statements of historical fact, that give current expectations or forecasts of future events, including, without limitation: the Company's 2018 capital budget and allocations, future performance, organic free cash flow, corporate-level cash returns on invested capital, business strategy, asset quality, drilling plans, production guidance, cost and expense estimates, cash flows, uses of excess cash, returns, including CROIC and CFPDAS, and EG EBITDAX, cash margins, asset sales and acquisitions, leasing and exploration activities, future financial position, tax rates and other plans and objectives for future operations. Words such as“anticipate,” “believe,” “could,” “estimate,” “expect,” “forecast,” “guidance,” “intend,” “may,” “plan,” “project,” “seek,” “should,” “target,” “will,” “would,” or similar words may be used to identify forward-looking statements; however, the absence of these words does not mean that the statements are not forward-looking.
While the Company believes its assumptions concerning future events are reasonable, a number of factors could cause actual results to differ materially from those projected, including, without limitation: conditions in the oil and gas industry, including supply/demand levels and the resulting impact on price; changes in expected reserve or production levels; changes in political or economic conditions in the jurisdictions in which the Company operates, including changes in foreign currency exchange rates, interest rates, inflation rates, and global and domestic market conditions; capital available for exploration and development; risks related to our hedging activities; well production timing; drilling and operating risks; availability of drilling rigs, materials and labor, including the costs associated therewith; difficulty in obtaining necessary approvals and permits; non-performance by third parties of contractual obligations; unforeseen hazards such as weather conditions; acts of war or terrorism, and the governmental or military response thereto; cyber-attacks; changes in safety, health, environmental, tax and other regulations; other geological, operating and economic considerations; and the risk factors, forward-looking statements and challenges and uncertainties described in the Company’s 2017
Annual Report on Form 10-K, Quarterly Reports on Form 10-Q and other public filings and press releases, available at www.Marathonoil.com. Except as required by law, the Company undertakes no obligation to revise or update any forward-looking statements as a result of new information, future events or otherwise.
This presentation includes non-GAAP financial measures, including organic free cash flow and E.G. EBITDAX. Reconciliations of the differences between non-GAAP financial measures used in this presentation and their most directly comparable GAAP financial measures are available at www.Marathonoil.com in the 2Q 2018 Investor Packet.

Multi-Basin Execution Drives Returns and Growth
3
Execution
• Generated ~$250MM of organic free cash flow in 2Q18
• 2Q18 avg. production: MRO 419 MBOED (+5% q/q, ex-Libya); U.S. Resource Play 285 MBOED (+6% q/q)
• Sequential production growth in each of the four U.S. Resource Plays
– Eagle Ford: 39 wells avg. IP 30 rate of 1,880 BOED
– Bakken: oil +14% q/q; Elk Creek pad avg. IP 30 rate of 2,530 BOED; two new record Three Forks wells
– Oklahoma: SCOOP Woodford Lightner pad avg. IP 30 rate of 2,620 BOED (48% oil)
– Northern Delaware: capturing meaningful D&C efficiencies; executed water gathering and disposal agreement and finalizing term oil sales agreement
Resource Play Exploration (REx)
– ~240,000 net acres leased to date in the emerging Louisiana Austin Chalk play at <$900 / acre
– Plan to spud first Louisiana Austin Chalk exploration well by year-end 2018
Portfolio Management
– Closed sale of 3 non-core, non-operated U.S conventional assetswith avg. 1H18 production of 5 MBOED (76% oil)
Full-year guidance raised, budget unchanged

14 - 18%
22 - 26%
28 - 32%
Execution Driving Enhanced Corporate Returns
4
CROIC1 improvement:
CFPDAS2 improvement:
Oil growth:
30%
1CROIC = Cash return on invested capital; calculated by taking cash flow (Operating Cash Flow before working capital + net interest after tax) divided by (average
Stockholder’s Equity + average Net Debt) 2CFPDAS = Cash flow per debt adjusted share; calculated by taking cash flow (Operating Cash Flow before working
capital + net interest after tax) divided by total shares including debt shares. Debt shares is the average net debt during a calendar year divided by the average
annual stock price. Metrics exclude Libya in 2018. See the 4Q 2017 Investor Packet at www.Marathonoil.com for non-GAAP reconciliations
Total production
Boe growth:
10%
65%
45%
Resource play production
(Oil & BOE)
2018 vs 2017 MetricsPrevious
GuidanceOriginal Plan
Current
Guidance
70%
50%
Resource play guidance raised for 2nd consecutive quarter, budget unchanged
10 - 14%
16 - 20%
Development Capital: $2.3B
25 - 30%20 - 25%
@ $50 WTI
@ $50 WTI
@ $65 WTI
@ $65 WTI
@ $65 WTI
@ $65 WTI

1,6131,818
1,667
863 608
43 50
43
154 3
0
500
1,000
1,500
2,000
2,500
3,000
3/31/18 CashBalance
OperatingCash Flow
b/f WC
DevelopmentCapital
Expenditures
Dividends Total WorkingCapital
EG LNGReturn ofCapital& Other
CashBalanceb/f A&D,REx &
Financing
REx Capex Acquisitions&
Disposal ofAssets (Net)
6/30/18Cash
Balance
$M
M
3
2
Total Company Cash Flow for 2Q18
5
1 Organic free cash flow: Operating Cash Flow before working capital (excl. exploration costs other than well costs), less Development Capex, less Dividend,
plus EG return of capital & other2 Excludes $14MM of exploration costs other than well costs3 Total working capital includes $(74)MM and $24MM of working capital changes associated with operating activities and investing activities, respectively
& other. See the 2Q 2018 Investor Packet at www.Marathonoil.com for non-GAAP reconciliations
Avg. WTI $67.91 for 2Q18
• $2.3B full year development capital budget unchanged
• Guiding to 2H18 resource play leasing and exploration (REx) capex of $100-150MM vs 1H18 actual
capex of ~$250MM
• Competitive dividend yield and $1.5B share repurchase authorization in place
$250MM in organic free cash flow 1

Eagle Ford (LLS)
Bakken (Clearbrook)
Permian (Midland)
Oklahoma (Cushing)
International and Other (Brent)
Eagle Ford
2Q 2018 avg. 106 MBOED (59% oil)
145,000 net surface acres
Northern Delaware
2Q 2018 avg. 17 MBOED (63% oil)
>90,000 net surface acres
Appraise / Delineate Early Development Full Field Development
Bakken
2Q 2018 avg. 82 MBOED (84% oil)
270,000 net surface acres
Differentiated Position in Top 4 U.S. Basins
6
Multi-basin portfolio provides flexibility
MRO 2Q18 Oil Mix by Pricing Basis
STACK / SCOOP
2Q 2018 avg. 80 MBOED (23% oil)
>300,000 net surface acres

0
30
60
90
0
40
80
120
3Q 2017 4Q 2017 1Q 2018 2Q 2018
Op
era
ted
We
lls
to
Sa
les
Production Gross Wells Net WI Wells
Another Quarter of Outstanding Eagle Ford Performance
7
• Production averaged 106 net MBOED, 2%higher than 1Q 2018
• 39 gross operated wells to sales with strong performance from the core
– Average IP 30 rate of 1,880 BOED (66% oil)
– Karnes City NE 6-well pad delivers average IP 30 rate of 2,330 BOED (72% oil)
• Continue to confirm extension of core acreage throughout majority of Atascosa County
– Guajillo 10 South 5-well pad achieves average IP 30 rate of 1,660 BOED (75% oil)
• Cumulative volumes continue to show year over year improvement
• Significant free cash flow generation with strong LLS-based oil realizations
MB
OE
D
Production Volumes and Wells to Sales
MRO operated wells across all formations
0
50
100
150
0 30 60 90 120 150 180
2017
2016
2015
2018
Avg
. C
um
Pro
du
cti
on
(M
BO
E)
Well Performance History
50% increase in 90-day cumulative production compared to 2016

Consistent 2Q Results Across Expanded Eagle Ford Core
8
Leske Lott
2 well pad
Avg: 1,417 BOED (46% oil)
~5,080’ LL
Karnes City NE Unit
6 well pad
Avg: 2,331 BOED (72% oil)
~6,200’ LL
Guajillo Unit 10 South
5 well pad
Avg: 1,658 BOED (75% oil)
~4,440’ LL
Egbert Miller Unit/CSEM
3 well pad
Avg: 1,985 BOED (68% oil)
~4,590’ LL
Coy City Ranch Unit B
4 well pad
Avg: 1,357 BOED (79% oil)
~6,430’ LL
May Unit 1
4 well pad
Avg: 2,118 BOED (55% oil)
~5,760’ LL
Franke Johnson Unit
6 well pad
Avg: 1,913 BOED (46% oil)
~5,960’ LL
Franke May Unit B
3 well pad
Avg: 1,646 BOED (78% oil)
~5,790’ LL
Turnbull Unit B-C-G
6 well pad
Avg: 1,980 BOED (70% oil)
~8,070’ LL
IPs shown are 30 day (includes oil, NGL and gas)
Live Oak
Bee
Karnes
Atascosa
WilsonGonzales
De Witt
0
50
100
150
200
250
0 30 60 90 120 150 180
0
10
20
30
0
20
40
60
80
100
3Q 2017 4Q 2017 1Q 2018 2Q 2018
Op
era
ted
Wells t
o S
ale
s
Production Gross Wells Net WI Wells
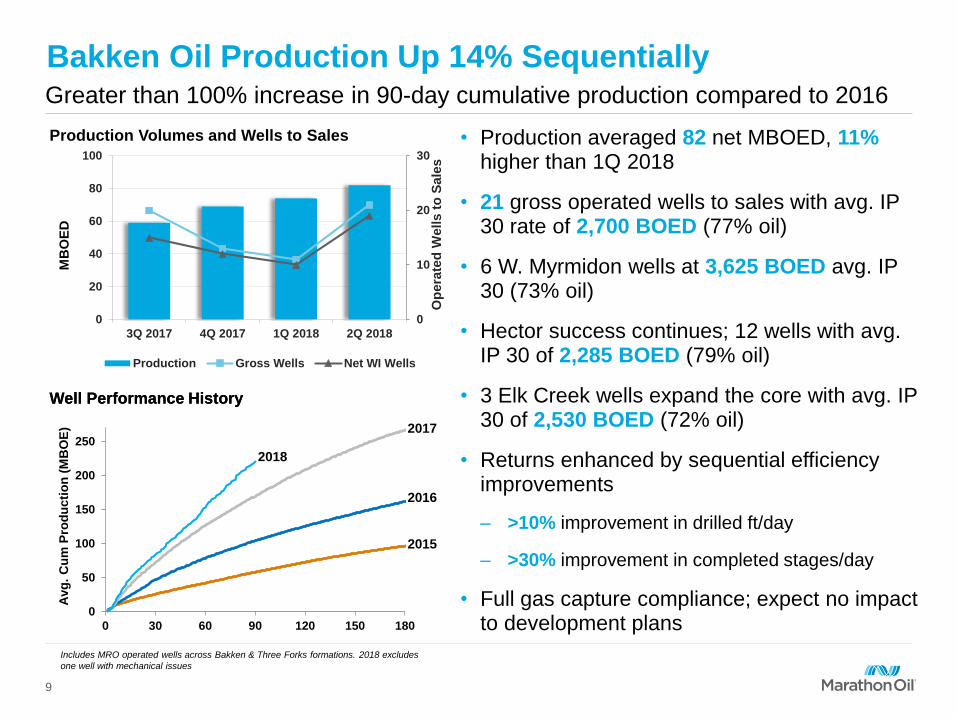
Bakken Oil Production Up 14% Sequentially
9
• Production averaged 82 net MBOED, 11%higher than 1Q 2018
• 21 gross operated wells to sales with avg. IP 30 rate of 2,700 BOED (77% oil)
• 6 W. Myrmidon wells at 3,625 BOED avg. IP 30 (73% oil)
• Hector success continues; 12 wells with avg. IP 30 of 2,285 BOED (79% oil)
• 3 Elk Creek wells expand the core with avg. IP 30 of 2,530 BOED (72% oil)
• Returns enhanced by sequential efficiency improvements
– >10% improvement in drilled ft/day
– >30% improvement in completed stages/day
• Full gas capture compliance; expect no impact to development plans
Production Volumes and Wells to Sales
Well Performance History
MB
OE
D
Includes MRO operated wells across Bakken & Three Forks formations. 2018 excludes
one well with mechanical issues
Well Performance History
Avg
. C
um
Pro
du
cti
on
(M
BO
E) 2017
2016
2015
2018
Greater than 100% increase in 90-day cumulative production compared to 2016
McKenzie
Dunn
Mountrail
Myrmidon
Hector
Elk Creek
Ajax
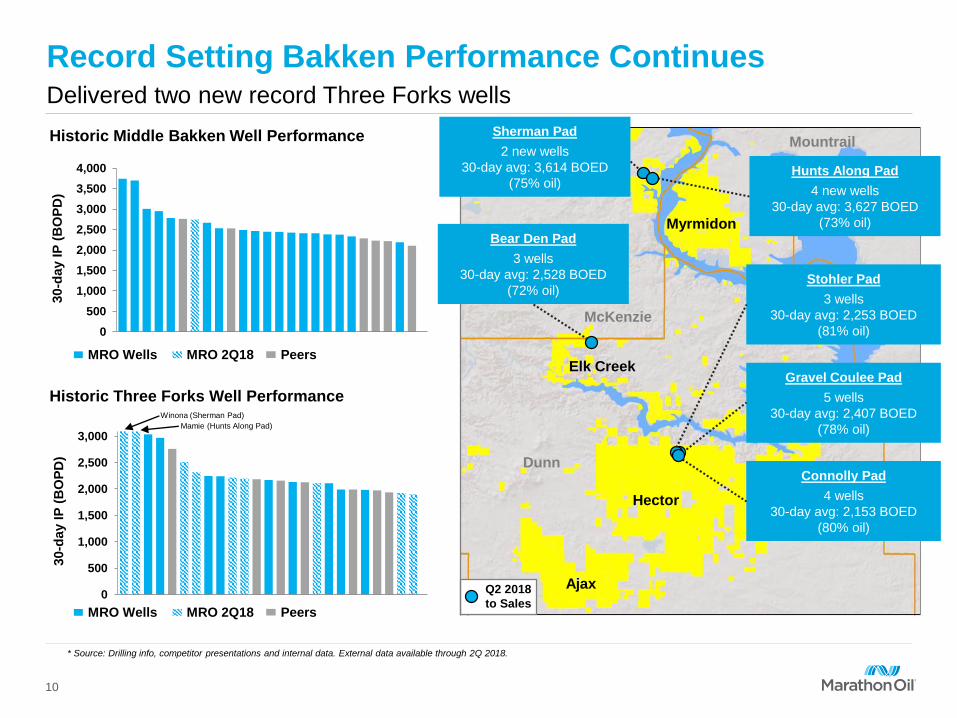
Record Setting Bakken Performance Continues
10
Q2 2018
to Sales
Connolly Pad
4 wells
30-day avg: 2,153 BOED
(80% oil)
Historic Three Forks Well Performance
0
500
1,000
1,500
2,000
2,500
3,000
30-d
ay I
P (
BO
PD
)
* Source: Drilling info, competitor presentations and internal data. External data available through 2Q 2018.
Historic Middle Bakken Well Performance
0
500
1,000
1,500
2,000
2,500
3,000
3,500
4,000
30-d
ay I
P (
BO
PD
)
Bear Den Pad
3 wells
30-day avg: 2,528 BOED
(72% oil)
Winona (Sherman Pad)
Mamie (Hunts Along Pad)
Delivered two new record Three Forks wells
Stohler Pad
3 wells
30-day avg: 2,253 BOED
(81% oil)
Gravel Coulee Pad
5 wells
30-day avg: 2,407 BOED
(78% oil)
MRO Wells MRO 2Q18 Peers
MRO Wells MRO 2Q18 Peers
Sherman Pad
2 new wells
30-day avg: 3,614 BOED
(75% oil)Hunts Along Pad
4 new wells
30-day avg: 3,627 BOED
(73% oil)

0
400
800
1,200
1,600
Lightner Wells Peer Wells
Oklahoma Shifting to Pad Development
11
• Production averaged 80 net MBOED, up7% from 1Q 2018 on flat wells to sales
• 17 gross operated wells to sales; 11 on multi-well pads
• Four Meramec wells from Siegrist infill meeting expectations with strong oil rates
– Average IP 30 rate of 900 BOED (71% oil, 4500’ avg. lateral length)
– >20% lower completed well costs relative to comparable operated wells
• SCOOP Woodford Lightner four-well infill pad exceeding expectations for IP 30 and oil cut
– Average IP 30 rate of 2,620 BOED (48% oil, 6840’ avg. lateral length)
– Differentiated initial oil rates
Top SCOOP Woodford Oil Performance
Source: IHS, competitor presentations and internal data. Data from July 2017 to June 2018
Production Volumes and Wells to Sales
MB
OE
D
0
10
20
30
0
20
40
60
80
100
3Q 2017 4Q 2017 1Q 2018 2Q 2018
Op
era
ted
Wells t
o S
ale
s
Production Gross Wells Net WI Wells
30-d
ay IP
(B
OP
D)
SCOOP Woodford Infill Exceeding Expectations

Lightner Infill
Avg. IP 30: 2,620 BOED (48% oil)
4 Woodford wells
Oklahoma 2H18 Activity Focused on Infill Drilling
12
Caddo
Grady
Stephens
Blaine
Canadian
Kingfisher
Wet Gas
Condensate
Oil
2Q18 Infill to Sales
2H18 Infill to Sales
Irven John
HR Potter
Ellis
Roser
Seth
Olive June Ruthie
Mike Stroud BIA
Siegrist Infill
Avg. IP 30: 900 BOED (71% oil)
4 Meramec wells
2 Woodford delineation wells
3R
2018 Infill Drilled
34 completions in 1H18; full-year guidance of 40-50 wells to sales unchanged

0
300
600
900
1,200
1,500
4Q 2017 1Q 2018 2Q 2018
Avg. Foot Per Day
0
5
10
15
20
25
0
4
8
12
16
20
4Q 2017 1Q 2018 2Q 2018
Op
era
ted
We
lls
to
Sa
les
Production Gross Wells Net WI Wells
• Production averaged 17 net MBOED, up 6%from 1Q 2018 (oil up 7%)
• 13 gross operated wells to sales with avg. IP 30 rate of 1,130 BOED (61% oil)
• Cypress infill pad avg. IP 30 1,235 BOED (52% oil; 60% oil ex-lower Wolfcamp well)
• 3 well Fiddle Fee pad delivers strong initial results; avg. IP 30 1,745 BOED (66% oil)
• Full year gross operated wells to sales guidance of 50-55 unchanged with one less rig
– 45% drilling efficiency improvement since 4Q17
– Avg. 9 stages per day on Fiddle Fee three well pad with one frac crew
– Lowering well costs with use of local sand; 100% utilization in June
13
MB
OE
D
Production Volumes and Wells to Sales
Capturing D&C Efficiencies in Northern Delaware
Drilling Efficiency Improvements
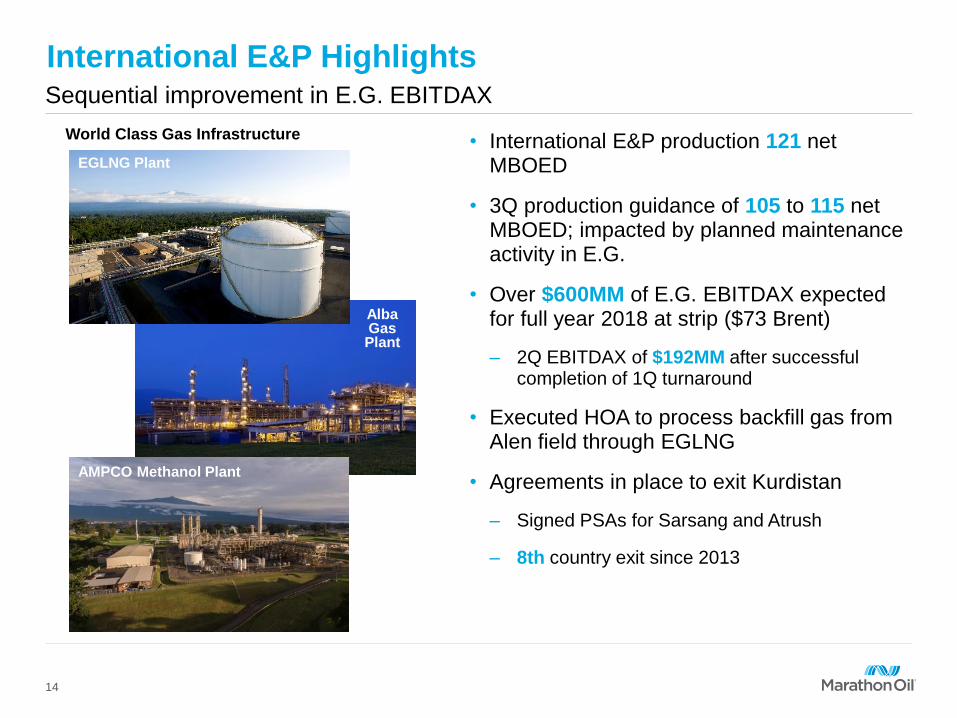
International E&P Highlights
14
Sequential improvement in E.G. EBITDAX
• International E&P production 121 net MBOED
• 3Q production guidance of 105 to 115 net MBOED; impacted by planned maintenance activity in E.G.
• Over $600MM of E.G. EBITDAX expected for full year 2018 at strip ($73 Brent)
– 2Q EBITDAX of $192MM after successful completion of 1Q turnaround
• Executed HOA to process backfill gas from Alen field through EGLNG
• Agreements in place to exit Kurdistan
– Signed PSAs for Sarsang and Atrush
– 8th country exit since 2013
Alba Gas Plant
AMPCO Methanol Plant
EGLNG Plant
World Class Gas Infrastructure
Alba Gas Plant
AMPCO Methanol Plant
EGLNG Plant

GRANT
IBERVILLE
WESTBATONROUGE
CALCASIEU
POINTECOUPEE
VERNON
NATCHITOCHESLA SALLE
WILKINSON
SABINE
ALLEN
RAPIDES
LAFAYETTE
WESTFELICIANA
JEFFERSONDAVIS
ACADIA
ST LANDRY
AVOYELLES
BEAUREGARD
EVANGELINE
CATAHOULA
ADAMS
ST MARTIN
CONCORDIA
States
Parishes
Lease Area
MRO Acreage Position
Resource Play Exploration (REx) Update
15
Louisiana Austin Chalk Activity
• ~240,000 net acres leased to date at <$900/acre
• Contiguous high working interest position adjacent to proven oil production
• Participating in multi-client 400 square mile 3D seismic survey
• Plan to spud first exploration well by year end
Progressing Louisiana Austin Chalk Opportunity
Total 2018 REx Capex
• ~$250MM YTD, including Louisiana Austin Chalk and other opportunities
• Expected spend of $100MM - $150MM for remainder of year; includes leasing, seismic, and exploration drilling
• More than fully funded through 1Q18 divestiture proceeds

2,330 BOED Avg. IP 30 of Karnes City NE
2,530 BOEDAvg. IP 30 in Elk Creek
16
45%YTD drilling efficiency gains
N. Delaware
2,620 BOEDAvg. IP 30 SCOOP Infill
Oklahoma
BakkenEagle Ford
6% BOED Sequential production growth
Δ70%2018 improvement in CROIC
U.S. Resource Plays Corporate Returns
~$250MM 2Q Organic FCF
Financial Flexibility
Profitable Growth
28 – 32%Annual oil and BOE
Resource Play
production growth
Multi-Basin Execution Drives Returns and GrowthFull-year guidance raised, $2.3B development capital budget unchanged
1CROIC = Cash return on invested capital; calculated by taking cash flow (Operating Cash Flow before working capital + net interest after tax) divided by (average Stockholder’s
Equity + average Net Debt) Debt shares is the average net debt during a calendar year divided by the average annual stock price. Metrics exclude Libya in 2018. See the 4Q 2017
and 2Q18 Investor Packets at www.Marathonoil.com for non-GAAP reconciliations
2 Organic free cash flow – Operating Cash Flow before working capital (excl. exploration costs other than well costs), less Development Capex, less Dividend, plus EG return of capital
& other
1
2
Appendix

Volumes, Exploration Expenses & Effective Tax Rate
18
2018 (excluding Libya)
1Q 2Q 3Q 4Q Full Year
United States Net Sales Volumes:
- Crude Oil and Condensate (MBD) 164 168
- Natural Gas Liquids (MBD) 50 57
- Natural Gas (MMCFD) 420 435
- United States Total (MBOED) 284 298
International Net Sales Volumes:
- Crude Oil and Condensate (MBD) 35 32
- Natural Gas Liquids (MBD) 11 12
- Natural Gas (MMCFD) 415 461
- International Total (MBOED) 115 121
Total Sales Volumes (MBOED) 399 419
Total Available for Sale (MBOED) 398 419
Equity Method Investment Net Sales Volumes:
- LNG (metric tonnes/day) 5,541 6,141
- Methanol (metric tonnes/day) 1,195 1,316
- Condensate and LPG (BOED) 12,416 12,689
Exploration Expenses (Pre-tax):
- United States ($ millions) 51 64
- International ($ millions) 1 1
Consolidated Effective Tax Rate (ex. Libya) Provision (Benefit) 2% 31%

2018 Production Estimates
19
Available for Sale
3QE
Available for Sale
Year Estimate
United States Total (MBOED) 290 - 300
- Crude Oil (MBD) 165 - 175
International Total (MBOED) 105 - 115
- Crude Oil (MBD) 25 - 35
Total Segments (MBOED) 395 - 415 400 – 415
- Crude Oil (MBD) 190 – 210 195 – 205
Guidance adjusted for July non-core asset sales (5 MBOED 1H18 production, 76% oil)

2018 Estimates
20
Year Estimate
United States Cost Data
Production Operating $4.75 – 5.75
DD&A $19.75 – 22.25
S&H and Other* $3.75 – 4.25
International Cost Data
Production Operating $4.75 – 5.75
DD&A $4.25 – 5.75
S&H and Other* $1.25 – 1.75
Expected Tax Rates by Jurisdiction:
U.S. and Corporate Tax Rate 0%
Equatorial Guinea Tax Rate 25%
United Kingdom Tax Rate 40%
* Excludes G&A expense

Net Sales Volumes and Realizations
21
U.S. Divestiture-Adj. Sales Volumes
MB
OE
D
219
283 298
0
100
200
300
2Q 2017 1Q 2018 2Q 2018
*
Avg C&C
Realizations
($/BBL)
Excluding Derivatives
$45.81 $62.22 $66.03
Including Derivatives
$46.88 $57.89 $58.99
*Adjusted for divestitures of 3 MBOED in 2Q17 and 1 MBOED in 1Q18. Not
adjusted for 3 non-core, non-operated dispositions that closed in 3Q18 and
produced 5 MBOED during 1H18.
MB
OE
D
Intl Production & Sales Volumes (Ex-Libya)
127 124114 115 121 121
0
25
50
75
100
125
150
2Q 2017 1Q 2018 2Q 2018
Avg C&C
Realizations
($/BBL)**
$45.70 $60.17 $66.12
** Adjusted to exclude Libya of $1.34 in 2Q17 and $6.06 in 1Q18
Cumulative underlift of (202) MBOE in EG, (3) MBOE in
Kurdistan, and a cumulative overlift of 112 MBOE in UK.
SalesAvailable for Sale
2Q 2017 1Q 2018 2Q 2018
*

2018 2Q Production Mix
22
59%21%
20% 23%
29%
48%
84%
9%7%
56%
20%
24%Crude Oil/Condensate
NGLs
Natural Gas
Eagle Ford Oklahoma
Bakken
Total U.S.
Resource Plays
63%20%
17%
Northern Delaware
*
* 2Q oil cut affected by well mix/completion timing and gas/NGL adjustment factors

United States Crude Oil Derivatives
23
As of July 31, 2018
Crude Oil (Benchmark to NYMEX WTI)
3Q 2018 4Q 2018 FY 2019 FY 2020
Three-Way Collars
Volume (Bbls/day) 95,000 95,000 50,000 -
Weighted Avg Price per Bbl:
Ceiling $57.65 $57.65 $71.74 -
Floor $52.11 $52.11 $56.01 -
Sold put $45.21 $45.21 $48.91 -
Swaps
Volume (Bbls/day) - - - -
Weighted Avg Price per Bbl - - - -
Midland to Cushing Basis Swaps
Volume (Bbls/day) 10,000 10,000 10,000 15,000
Weighted Avg Price per Bbl $(0.67) $(0.67) $(0.82) $(0.94)

United States Natural Gas Derivatives
24
As of July 31, 2018
Natural Gas (Benchmark to NYMEX HH)
3Q 2018 4Q 2018
Three-Way Collars
Volume (MMBtu/day) 160,000 160,000
Weighted Avg Price per MMBtu:
Ceiling $3.61 $3.61
Floor $3.00 $3.00
Sold put $2.50 $2.50

Capital, Investment & Exploration
25
2018 budget reconciliation $MM
2018 Budget 2018 YTD
Actual
Cash additions to Property, Plant and Equipment 1,300
Working Capital associated with PPE (16)
Property, Plant and Equipment additions 1,284
M&S Inventory 16
REx expenditures included in capital expenditures (77)
Exploration costs other than well costs 3
Development Capital 2,300 1,226