Embed Size (px)
Citation preview
© AB InBev 2017 – All rights reserved
Second Quarter
2017 Results27 July 2017
Legal Disclaimers
2
Certain statements contained in this report that are not statements of historical fact constitute forward-looking statements, notwithstanding that such statements
are not specifically identified. In addition, certain statements may be contained in the future filings of the Company with the competent securities regulators or
other authorities, in press releases, and in oral and written statements made by or with the approval of the Company that are not statements of historical fact and
constitute forward-looking statements.
Forward-looking statements are not guarantees of future performance. Rather, they are based on current views and assumptions and involve known and unknown
risks, uncertainties and other factors, many of which are outside the Company’s control and are difficult to predict, that may cause actual results or developments
to differ materially from any future results or developments expressed or implied by the forward-looking statements. Factors that could cause actual results to differ
materially from those contemplated by the forward-looking statements include, among others: (i) local, regional, national and international economic conditions,
including the risks of a global recession or a recession in one or more of the Company’s key markets, and the impact they may have on the Company and its
customers and its assessment of that impact; (ii) financial risks, such as interest rate risk, foreign exchange rate risk (in particular as against the U.S. dollar, the
Company’s reporting currency), commodity risk, asset price risk, equity market risk, counterparty risk, sovereign risk, liquidity risk, inflation or deflation; (iii)
continued geopolitical instability, which may result in, among other things, economic and political sanctions and currency exchange rate volatility, and which may
have a substantial impact on the economies of one or more of the Company’s key markets; (iv) changes in government policies and currency controls; (v)
continued availability of financing and the Company’s ability to achieve its targeted coverage and debt levels and terms, inc luding the risk of constraints on
financing in the event of a credit rating downgrade; (vi) the monetary and interest rate policies of central banks; (vii) changes in applicable laws, regulations and
taxes in jurisdictions in which the Company operates; (viii) limitations on the Company’s ability to contain costs and expenses; (ix) the Company’s expectations
with respect to expansion plans, premium growth, accretion to reported earnings, working capital improvements and investment income or cash flow projections;
(x) the Company’s ability to continue to introduce competitive new products and services on a timely, cost-effective basis; (xi) the effects of competition and
consolidation in the markets in which the Company operates; (xii) changes in consumer spending; (xiii) changes in pricing environments; (xiv) volatility in the
prices of raw materials, commodities and energy; (xv) difficulties in maintaining relationships with employees; (xvi) regional or general changes in asset valuations;
(xvii) greater than expected costs (including taxes) and expenses; (xviii) the risk of unexpected consequences resulting from acquisitions (including the
combination with ABI SAB Group Holding Limited (formerly SABMiller Limited, formerly SABMiller plc) (the “Transaction”)), joint ventures, strategic alliances,
corporate reorganizations or divestiture plans, and the Company’s ability to successfully and cost-effectively implement these transactions and integrate the
operations of businesses or other assets it has acquired; (xix) an inability to realize synergies from the Transaction; (xx) the outcome of pending and future
litigation, investigations and governmental proceedings; (xxi) natural and other disasters; (xxii) any inability to economically hedge certain risks; (xxiii) inadequate
impairment provisions and loss reserves; (xxiv) technological changes and threats to cybersecurity; and (xxv) the Company’s success in managing the risks
involved in the foregoing. All subsequent written and oral forward-looking statements attributable to the Company or any person acting on its behalf are expressly
qualified in their entirety by the cautionary statements referenced above. Forward-looking statements speak only as of the date on which such statements are
made.
The Company’s statements regarding financial risks are subject to uncertainty. For example, certain market and financial risk disclosures are dependent on
choices about key model characteristics and assumptions and are subject to various limitations. By their nature, certain of the market or financial risk disclosures
are only estimates and, as a result, actual future gains and losses could differ materially from those that have been estimated. Subject to the Company’s
obligations under Belgian and U.S. law in relation to disclosure and ongoing information, the Company undertakes no obligation to update publicly or revise any
forward-looking statements, whether as a result of new information, future events or otherwise.
This document shall not constitute an offer to sell or the solicitation of an offer to buy any securities, nor shall there be any offer, solicitation or sale of securities in
any jurisdiction in which such offer, solicitation or sale would be unlawful prior to the registration or qualification under the securities laws of such jurisdiction. By
attending the meeting where this presentation is made, or by reading the presentation slides, you agree to be bound by the above limitations.
© AB InBev 2017 – All rights reserved
2Q17 Highlights
• Strong regional performances
• Double-digit beer volume growth in South Africa
• Premiumization in Western Europe driving further revenue growth
• Strong top-line growth in Mexico, led by Victoria, and China,
led by Budweiser
• Commercial strategy in Argentina driving double-digit growth
• Global brand revenues continue to grow
• Integration of new zones fully underway, with 335 million USD in
synergies captured in 2Q17 supporting EBITDA margin expansion in
new markets
3© AB InBev 2017 – All rights reserved
2Q17 Financial Summary
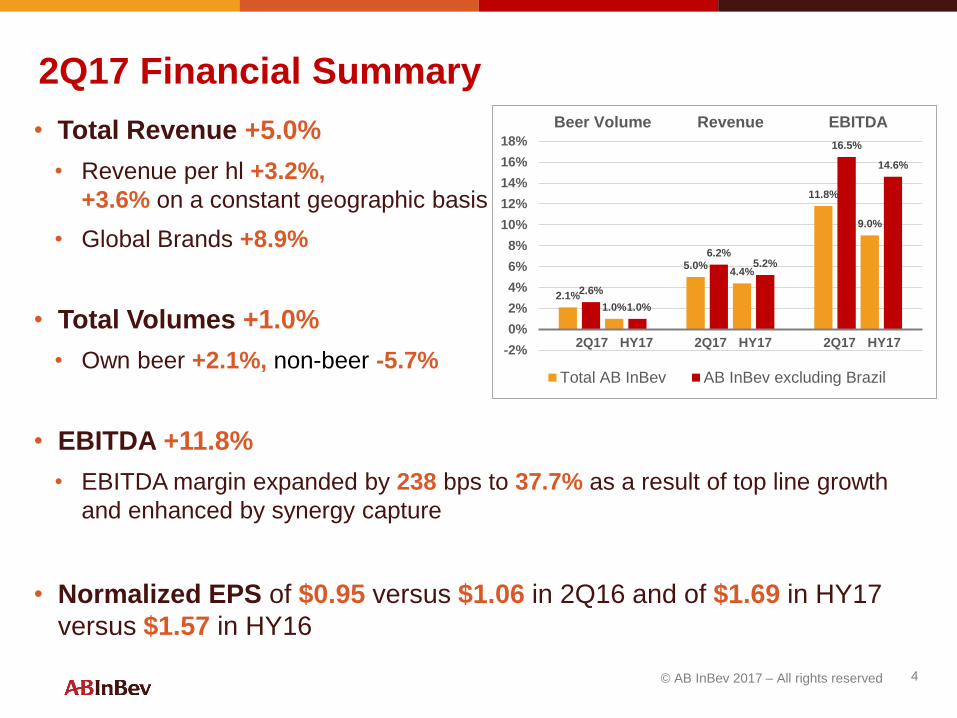
• Total Revenue +5.0%
• Revenue per hl +3.2%,
+3.6% on a constant geographic basis
• Global Brands +8.9%
• Total Volumes +1.0%
• Own beer +2.1%, non-beer -5.7%
• EBITDA +11.8%
• EBITDA margin expanded by 238 bps to 37.7% as a result of top line growth
and enhanced by synergy capture
• Normalized EPS of $0.95 versus $1.06 in 2Q16 and of $1.69 in HY17
versus $1.57 in HY16
4© AB InBev 2017 – All rights reserved
2.1%
5.0%
11.8%
2.6%
6.2%
16.5%
1.0%
4.4%
9.0%
1.0%
5.2%
14.6%
-2%
0%
2%
4%
6%
8%
10%
12%
14%
16%
18%
Beer Volume Revenue EBITDA
Total AB InBev AB InBev excluding Brazil
2Q17 HY17 2Q17 HY17 2Q17 HY17
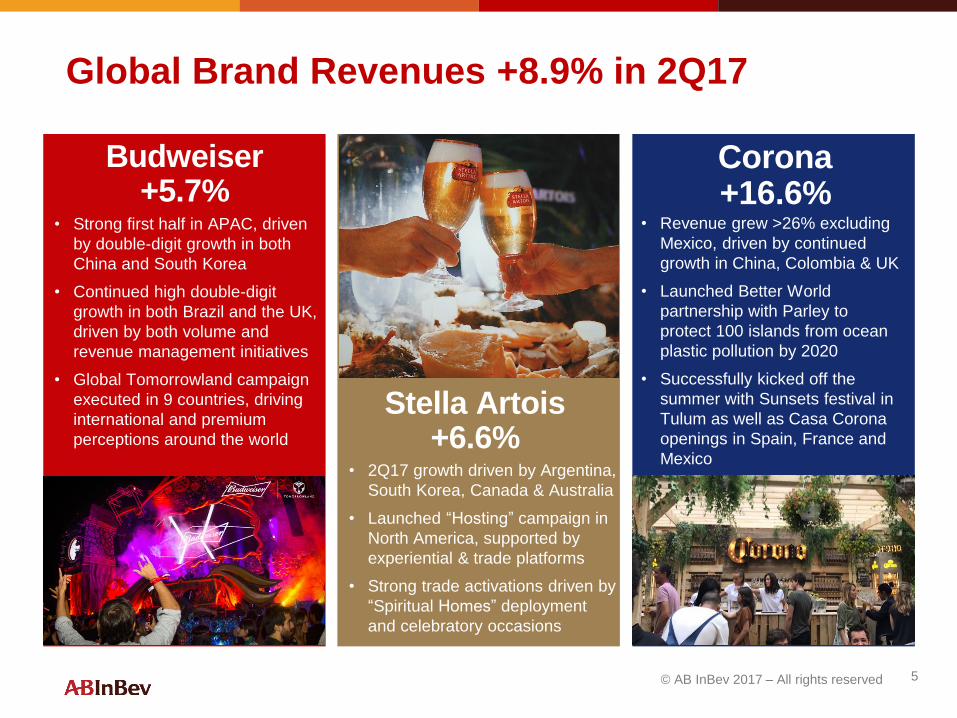
Global Brand Revenues +8.9% in 2Q17
Stella Artois+6.6%
Budweiser+5.7%
Corona+16.6%
5© AB InBev 2017 – All rights reserved
• 2Q17 growth driven by Argentina,
South Korea, Canada & Australia
• Launched “Hosting” campaign in
North America, supported by
experiential & trade platforms
• Strong trade activations driven by
“Spiritual Homes” deployment
and celebratory occasions
• Strong first half in APAC, driven
by double-digit growth in both
China and South Korea
• Continued high double-digit
growth in both Brazil and the UK,
driven by both volume and
revenue management initiatives
• Global Tomorrowland campaign
executed in 9 countries, driving
international and premium
perceptions around the world
• Revenue grew >26% excluding
Mexico, driven by continued
growth in China, Colombia & UK
• Launched Better World
partnership with Parley to
protect 100 islands from ocean
plastic pollution by 2020
• Successfully kicked off the
summer with Sunsets festival in
Tulum as well as Casa Corona
openings in Spain, France and
Mexico
North America – 2Q17 Summary
• Revenue flat
• Revenue per hl +1.0%
• Volumes -1.0%
• EBITDA +3.2% with margin
expansion of 129 bps to 41.6%
6© AB InBev 2017 – All rights reserved
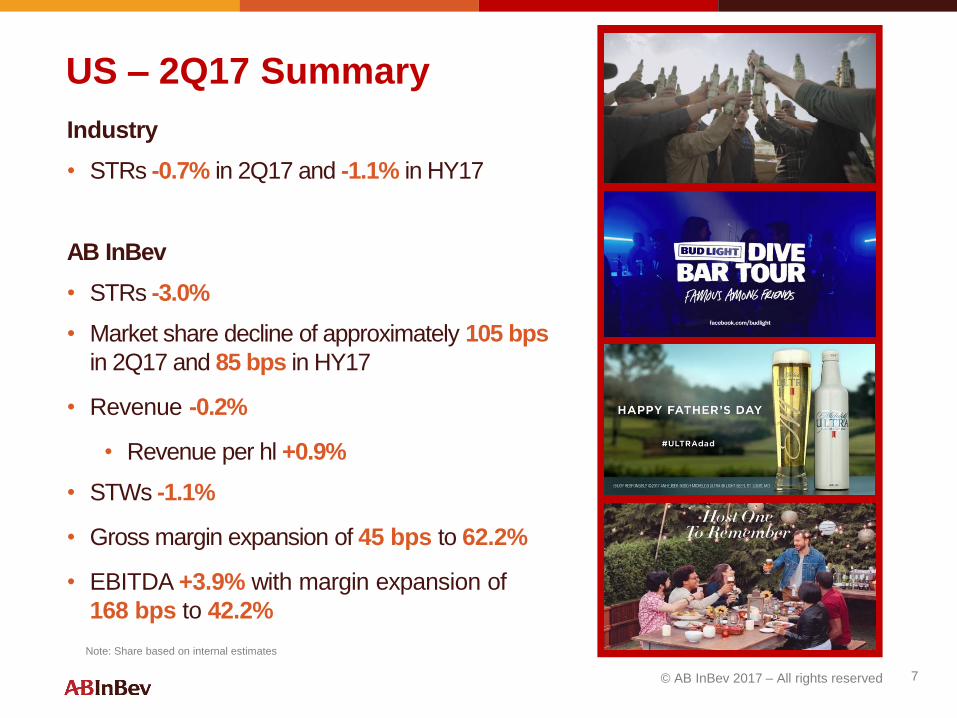
US – 2Q17 Summary
Industry
• STRs -0.7% in 2Q17 and -1.1% in HY17
AB InBev
• STRs -3.0%
• Market share decline of approximately 105 bps
in 2Q17 and 85 bps in HY17
• Revenue -0.2%
• Revenue per hl +0.9%
• STWs -1.1%
• Gross margin expansion of 45 bps to 62.2%
• EBITDA +3.9% with margin expansion of
168 bps to 42.2%
Note: Share based on internal estimates
7© AB InBev 2017 – All rights reserved
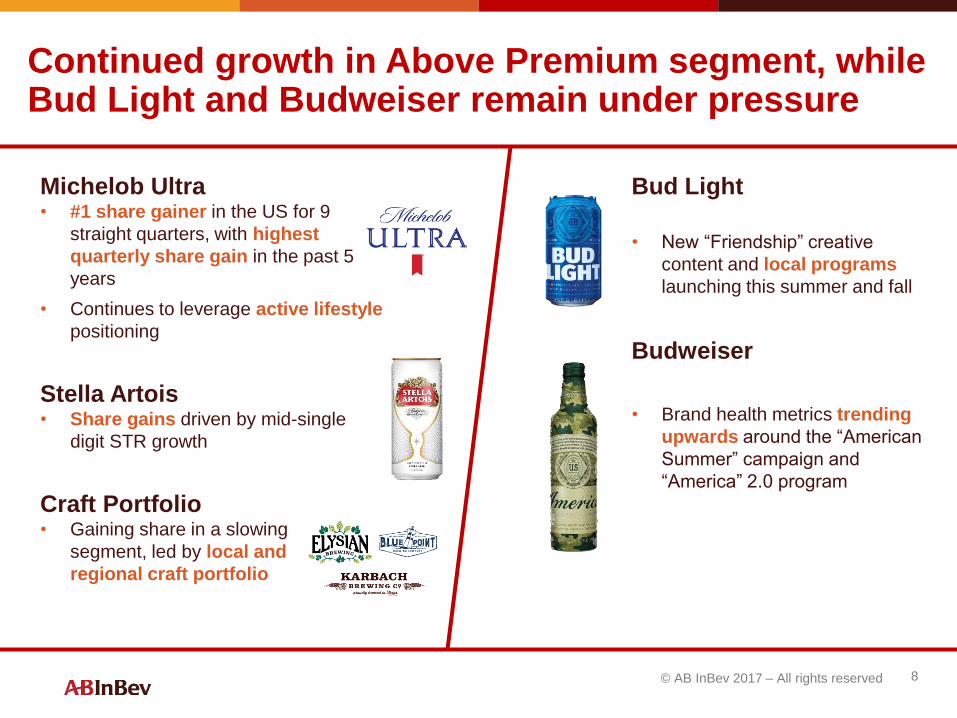
Continued growth in Above Premium segment, while Bud Light and Budweiser remain under pressure
8© AB InBev 2017 – All rights reserved
Michelob Ultra• #1 share gainer in the US for 9
straight quarters, with highest
quarterly share gain in the past 5
years
• Continues to leverage active lifestyle
positioning
Stella Artois• Share gains driven by mid-single
digit STR growth
Craft Portfolio• Gaining share in a slowing
segment, led by local and
regional craft portfolio
Bud Light
• New “Friendship” creative
content and local programs
launching this summer and fall
Budweiser
• Brand health metrics trending
upwards around the “American
Summer” campaign and
“America” 2.0 program
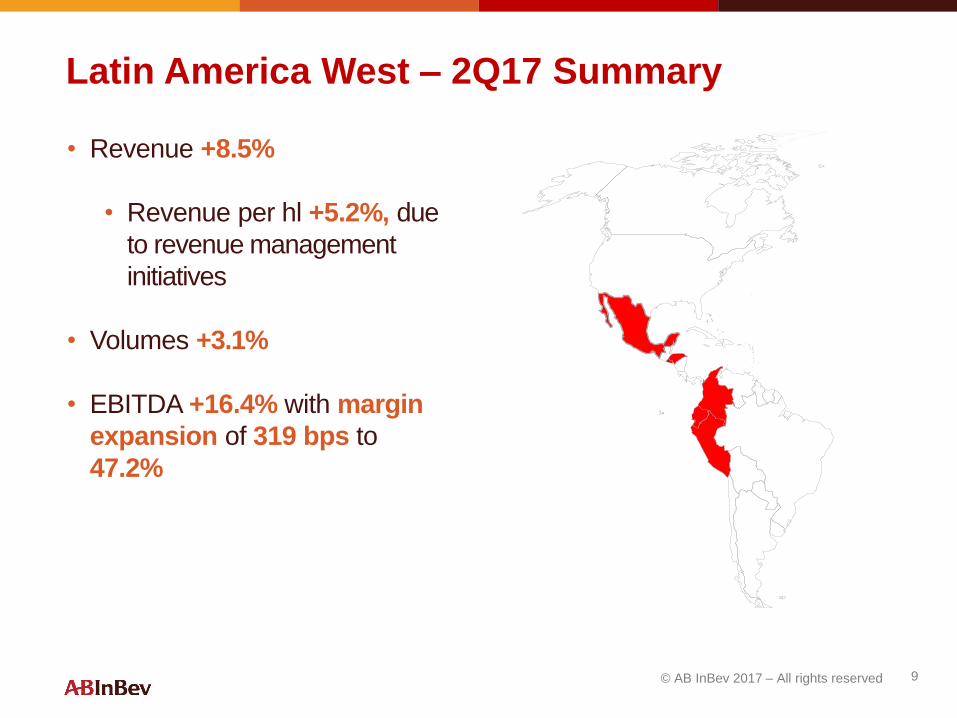
Latin America West – 2Q17 Summary
• Revenue +8.5%
• Revenue per hl +5.2%, due
to revenue management
initiatives
• Volumes +3.1%
• EBITDA +16.4% with margin
expansion of 319 bps to
47.2%
9© AB InBev 2017 – All rights reserved
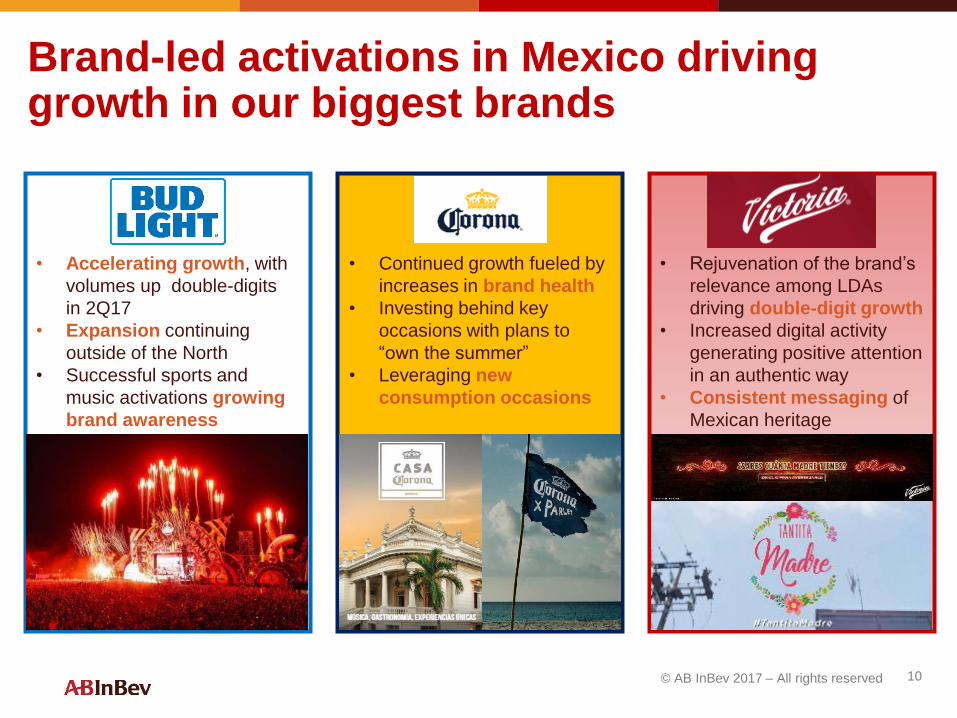
Brand-led activations in Mexico driving growth in our biggest brands
10© AB InBev 2017 – All rights reserved
• Accelerating growth, with
volumes up double-digits
in 2Q17
• Expansion continuing
outside of the North
• Successful sports and
music activations growing
brand awareness
• Continued growth fueled by
increases in brand health
• Investing behind key
occasions with plans to
“own the summer”
• Leveraging new
consumption occasions
• Rejuvenation of the brand’s
relevance among LDAs
driving double-digit growth
• Increased digital activity
generating positive attention
in an authentic way
• Consistent messaging of
Mexican heritage
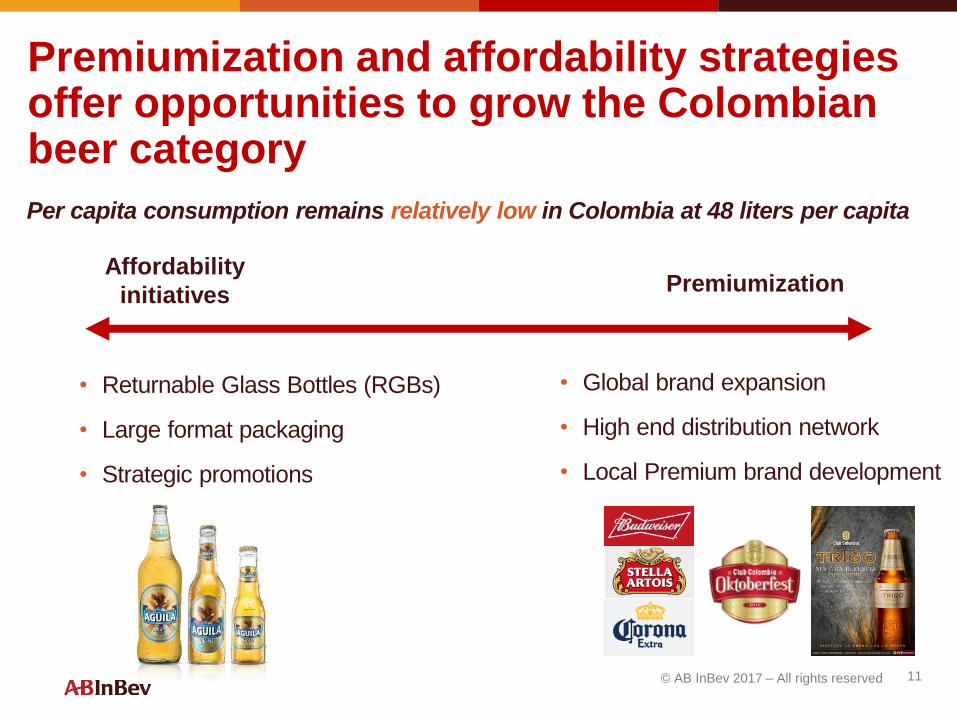
Premiumization and affordability strategies offer opportunities to grow the Colombian beer category
11© AB InBev 2017 – All rights reserved
Affordability
initiativesPremiumization
• Returnable Glass Bottles (RGBs)
• Large format packaging
• Strategic promotions
• Global brand expansion
• High end distribution network
• Local Premium brand development
Per capita consumption remains relatively low in Colombia at 48 liters per capita
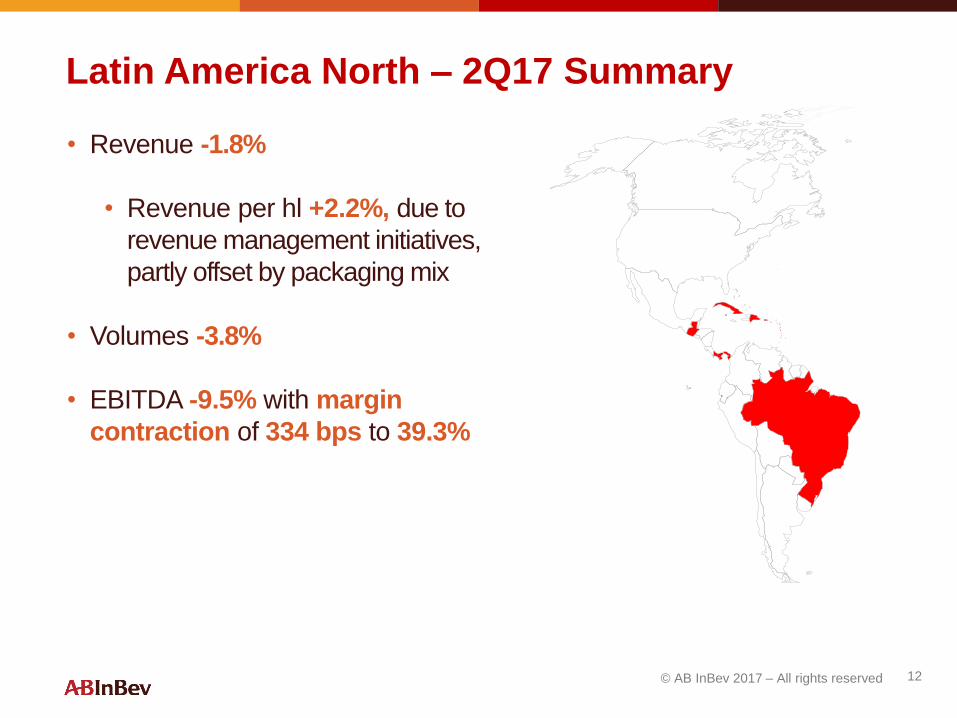
Latin America North – 2Q17 Summary
• Revenue -1.8%
• Revenue per hl +2.2%, due to
revenue management initiatives,
partly offset by packaging mix
• Volumes -3.8%
• EBITDA -9.5% with margin
contraction of 334 bps to 39.3%
12© AB InBev 2017 – All rights reserved
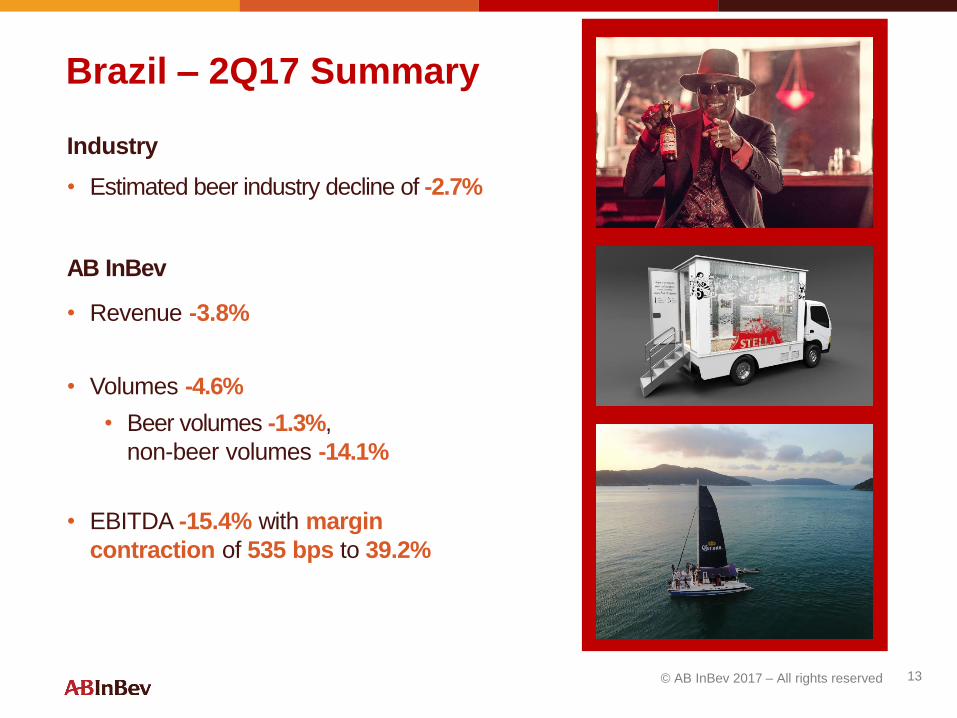
Brazil – 2Q17 Summary
Industry
• Estimated beer industry decline of -2.7%
AB InBev
• Revenue -3.8%
• Volumes -4.6%
• Beer volumes -1.3%,
non-beer volumes -14.1%
• EBITDA -15.4% with margin
contraction of 535 bps to 39.2%
13© AB InBev 2017 – All rights reserved
14© AB InBev 2017 – All rights reserved
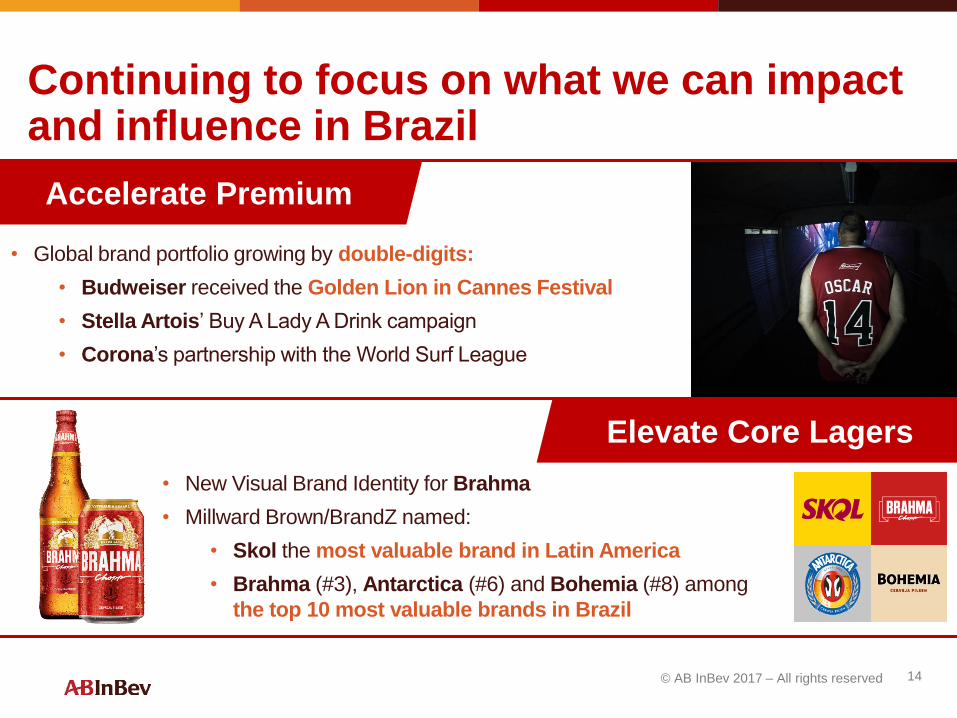
Continuing to focus on what we can impact and influence in Brazil
Accelerate Premium
Elevate Core Lagers
• New Visual Brand Identity for Brahma
• Millward Brown/BrandZ named:
• Skol the most valuable brand in Latin America
• Brahma (#3), Antarctica (#6) and Bohemia (#8) among
the top 10 most valuable brands in Brazil
• Global brand portfolio growing by double-digits:
• Budweiser received the Golden Lion in Cannes Festival
• Stella Artois’ Buy A Lady A Drink campaign
• Corona’s partnership with the World Surf League
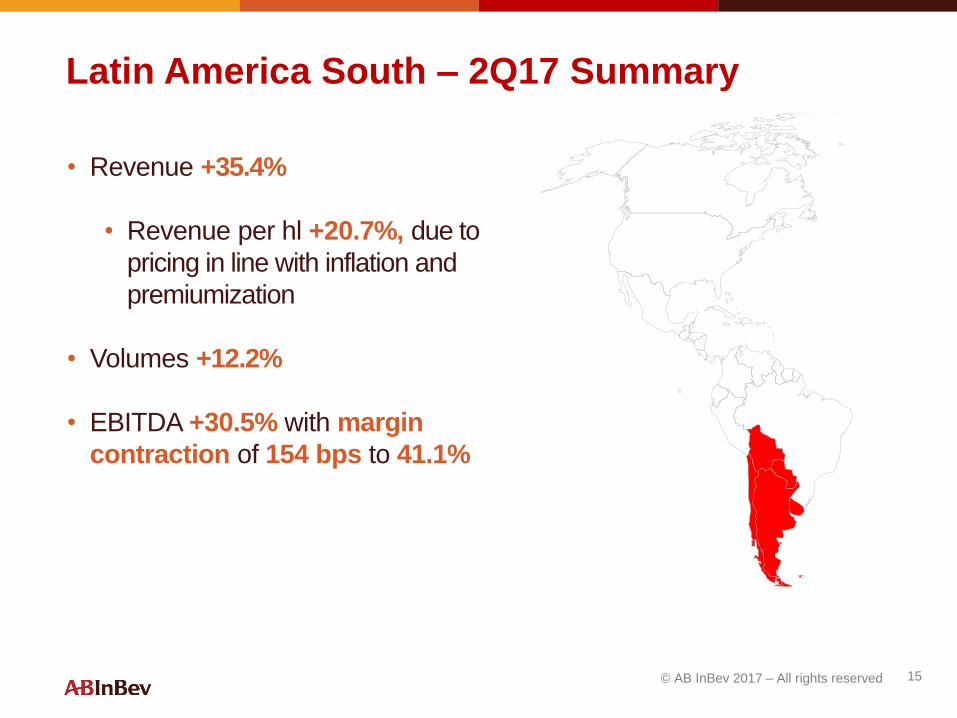
Latin America South – 2Q17 Summary
• Revenue +35.4%
• Revenue per hl +20.7%, due to
pricing in line with inflation and
premiumization
• Volumes +12.2%
• EBITDA +30.5% with margin
contraction of 154 bps to 41.1%
15© AB InBev 2017 – All rights reserved
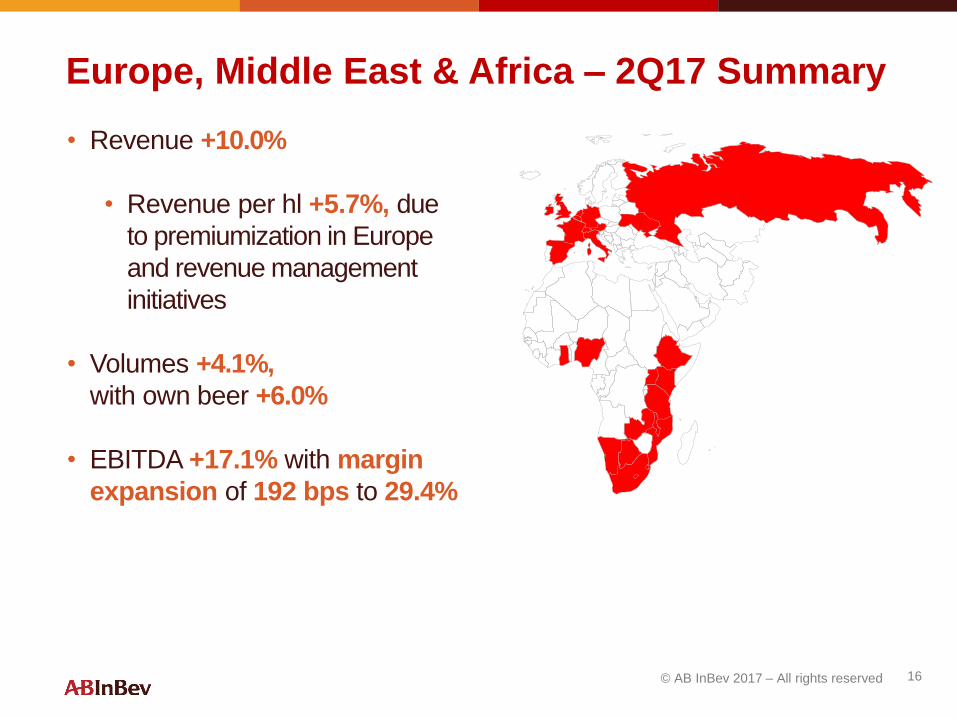
Europe, Middle East & Africa – 2Q17 Summary
• Revenue +10.0%
• Revenue per hl +5.7%, due
to premiumization in Europe
and revenue management
initiatives
• Volumes +4.1%,
with own beer +6.0%
• EBITDA +17.1% with margin
expansion of 192 bps to 29.4%
16© AB InBev 2017 – All rights reserved
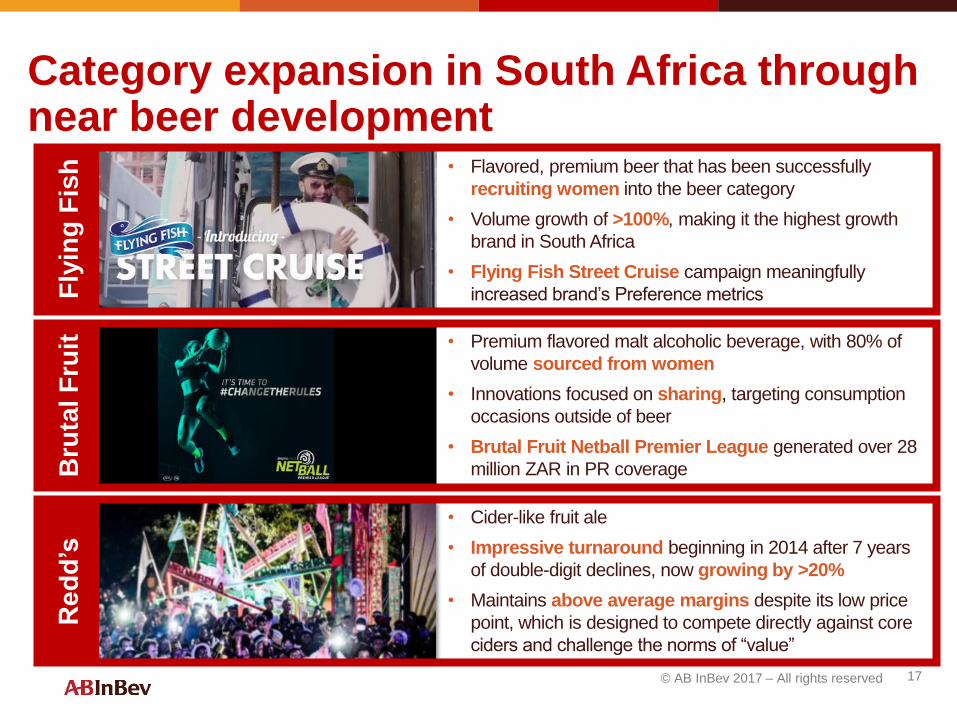
Category expansion in South Africa through near beer development
• Flavored, premium beer that has been successfully
recruiting women into the beer category
• Volume growth of >100%, making it the highest growth
brand in South Africa
• Flying Fish Street Cruise campaign meaningfully
increased brand’s Preference metricsFly
ing
Fis
h
• Premium flavored malt alcoholic beverage, with 80% of
volume sourced from women
• Innovations focused on sharing, targeting consumption
occasions outside of beer
• Brutal Fruit Netball Premier League generated over 28
million ZAR in PR coverageBru
tal F
ruit
• Cider-like fruit ale
• Impressive turnaround beginning in 2014 after 7 years
of double-digit declines, now growing by >20%
• Maintains above average margins despite its low price
point, which is designed to compete directly against core
ciders and challenge the norms of “value”
Redd’s
17© AB InBev 2017 – All rights reserved
Asia Pacific – 2Q17 Summary
• Revenue +5.9%
• Revenue per hl +6.0%,
due primarily to brand mix
• Volumes -0.1%
• EBITDA +22.1% with margin
expansion of 501 bps to 36.9%
18© AB InBev 2017 – All rights reserved
Budweiser
• Continues to lead the Premium segment, achieving all-time
high scores in the “Top 1 Favorite” brand health metric
• Launched first of its kind in-home party campaign, with
in-home consumption gaining importance
• Focused on boosting summer volume during peak
consumption season
19© AB InBev 2017 – All rights reserved
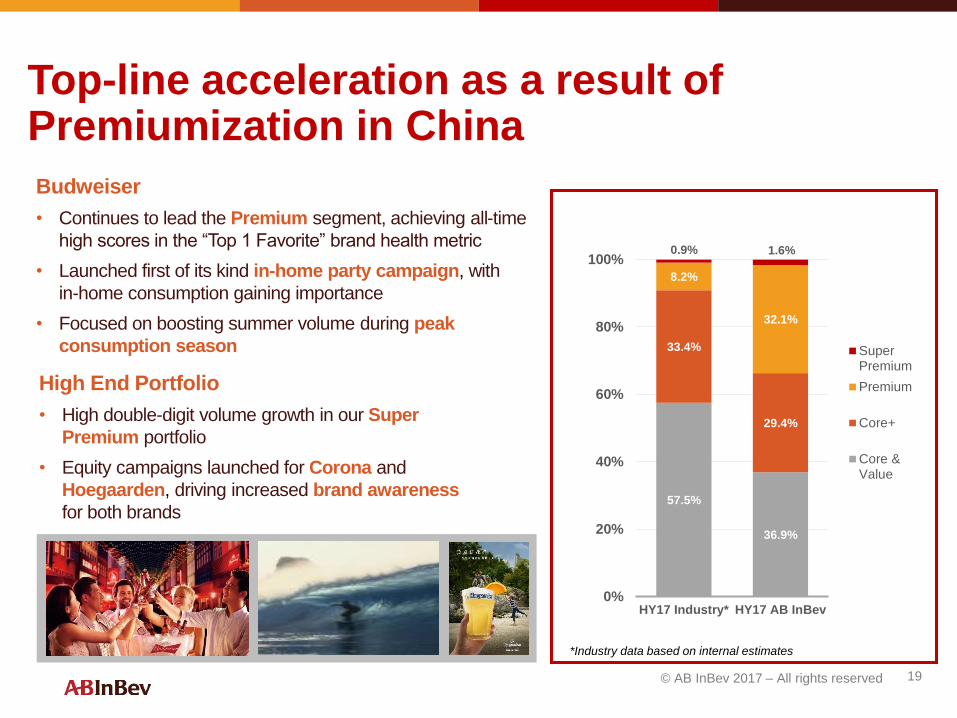
Top-line acceleration as a result of Premiumization in China
57.5%
36.9%
33.4%
29.4%
8.2%
32.1%
0.9% 1.6%
0%
20%
40%
60%
80%
100%
HY17 Industry* HY17 AB InBev
SuperPremium
Premium
Core+
Core &Value
*Industry data based on internal estimates
High End Portfolio
• High double-digit volume growth in our Super
Premium portfolio
• Equity campaigns launched for Corona and
Hoegaarden, driving increased brand awareness
for both brands
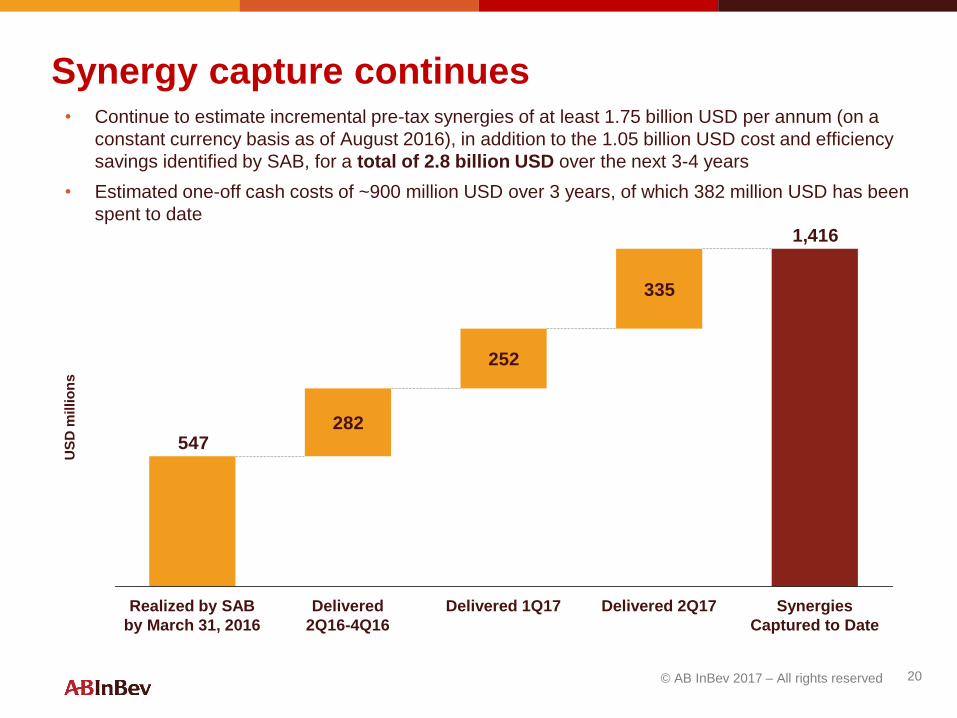
Synergy capture continues• Continue to estimate incremental pre-tax synergies of at least 1.75 billion USD per annum (on a
constant currency basis as of August 2016), in addition to the 1.05 billion USD cost and efficiency
savings identified by SAB, for a total of 2.8 billion USD over the next 3-4 years
• Estimated one-off cash costs of ~900 million USD over 3 years, of which 382 million USD has been
spent to date
1,050
US
D m
illio
ns
20© AB InBev 2017 – All rights reserved
282
252
335
1,416
547
Synergies
Captured to Date
Delivered 2Q17Realized by SAB
by March 31, 2016
Delivered
2Q16-4Q16
Delivered 1Q17
-1,628
-726 107
2056
709
144
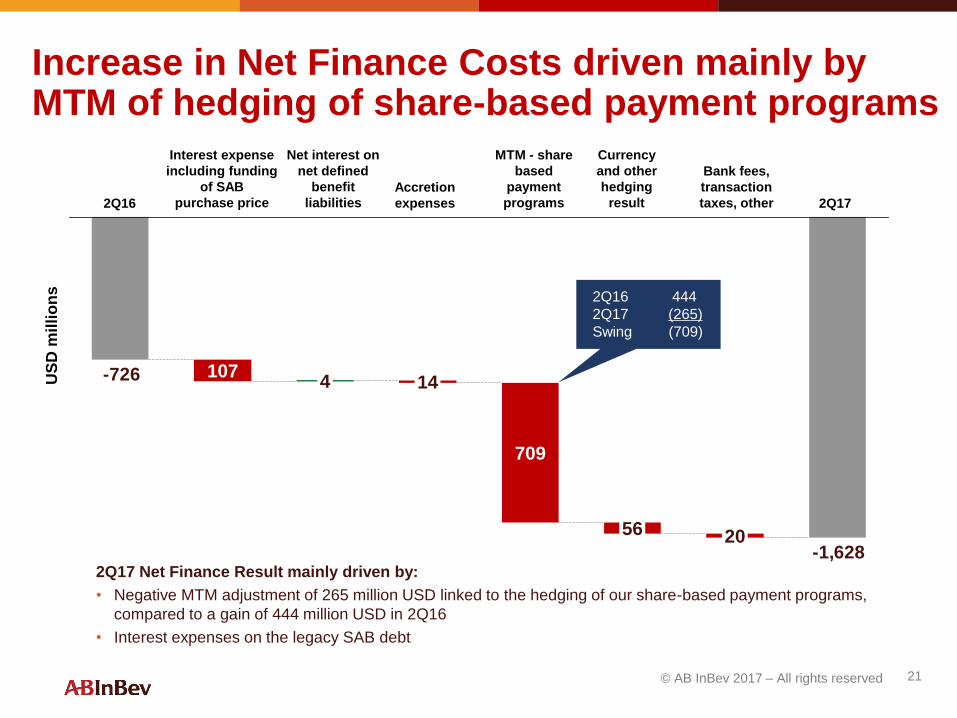
Increase in Net Finance Costs driven mainly by MTM of hedging of share-based payment programs
2Q17 Net Finance Result mainly driven by:
• Negative MTM adjustment of 265 million USD linked to the hedging of our share-based payment programs,
compared to a gain of 444 million USD in 2Q16
• Interest expenses on the legacy SAB debt
US
D m
illi
on
s 2Q16 444
2Q17 (265)
Swing (709)
2Q16
Interest expense
including funding
of SAB
purchase price
Net interest on
net defined
benefit
liabilities
Accretion
expenses
MTM - share
based
payment
programs 2Q17
Currency
and other
hedging
result
Bank fees,
transaction
taxes, other
21© AB InBev 2017 – All rights reserved
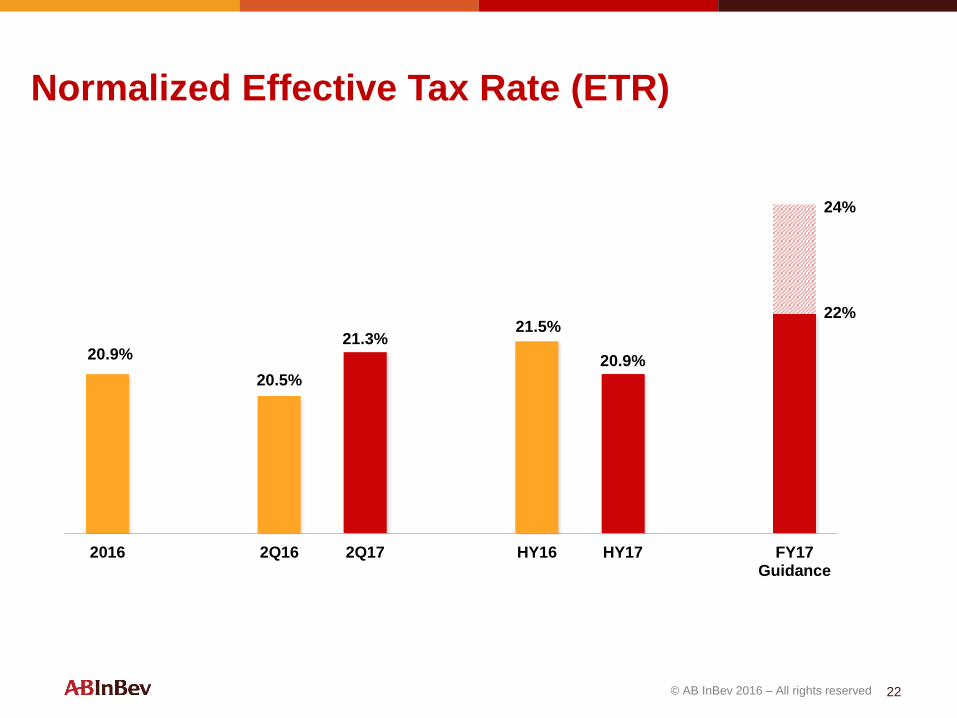
20.9%
20.5%
21.3%21.5%
20.9%
2016 2Q16 2Q17 HY16 HY17 FY17Guidance
Normalized Effective Tax Rate (ETR)
22© AB InBev 2016 – All rights reserved
22%
24%
US
D p
er
sh
are
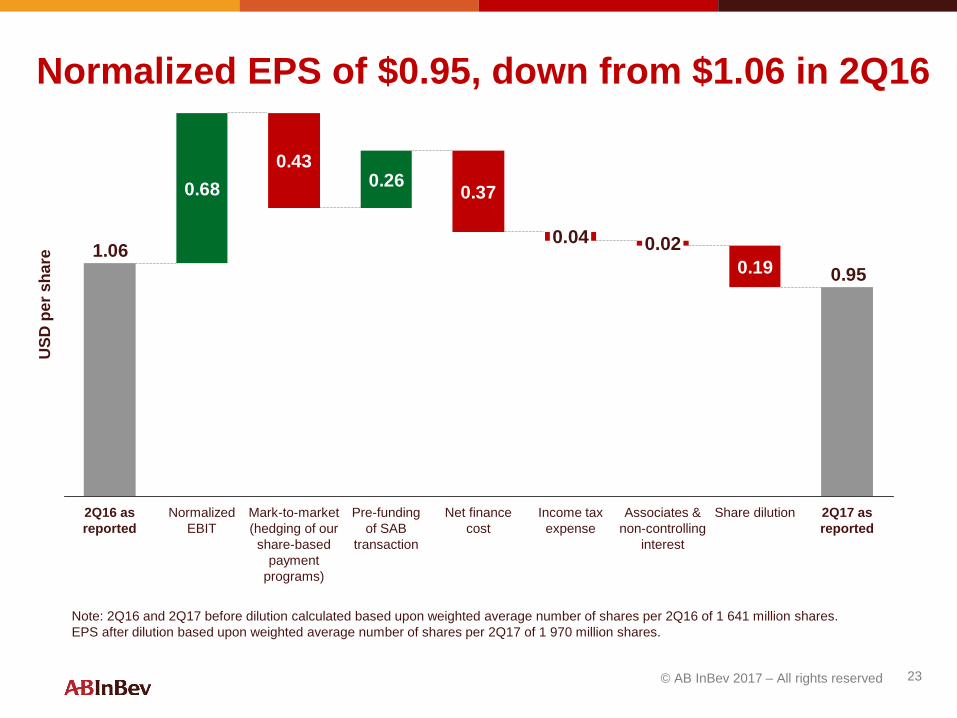
Normalized EPS of $0.95, down from $1.06 in 2Q16
23© AB InBev 2017 – All rights reserved
0.68
0.430.26
0.37
0.19 0.95
1.06
Share dilutionAssociates &
non-controlling
interest
Net finance
cost
Pre-funding
of SAB
transaction
0.02
Income tax
expense
0.04
2Q16 as
reported
Mark-to-market
(hedging of our
share-based
payment
programs)
Normalized
EBIT
2Q17 as
reported
Note: 2Q16 and 2Q17 before dilution calculated based upon weighted average number of shares per 2Q16 of 1 641 million shares.
EPS after dilution based upon weighted average number of shares per 2Q17 of 1 970 million shares.
Capital Allocation objectives
Our optimal capital structure is a Net Debt/EBITDA ratio of approximately 2x.
The priorities for the use of cash are as follows:
1. Organic growth: Investing in the organic growth of our business
2. Deleveraging: Deleveraging to around the 2x level remains our commitment
3. Selective M&A: Non-organic, external growth is a core competency and we
will continue to consider suitable opportunities when and if they arise,
subject to our strict financial discipline and deleveraging commitment
4. Return of cash to shareholders: Our goal is for dividends to be a growing
flow over time in line with the non-cyclical nature of our business. Given the
importance of deleveraging, dividend growth is expected to be modest
24© AB InBev 2017 – All rights reserved
Q & A© AB InBev 2017 – All rights reserved


![[Proposed] Final Judgment : U.S. v. Anheuser-Busch InBev SA/NV and Grupo Modelo S.A.B ... · 2014-08-16 · M. “Distributor Incentive Program” means the Anheuser-Busch Voluntary](https://img.pdfslide.us/doc/110x75/5f0be1bb7e708231d432ad8f/proposed-final-judgment-us-v-anheuser-busch-inbev-sanv-and-grupo-modelo.jpg)