Embed Size (px)
Citation preview

Second-Quarter 2014 Earnings Conference Call
August 6, 2014
Slide 2
Investor Notices
Safe Harbor
Some of the information provided in this presentation includes “forward-looking statements” as defined by the Securities and Exchange Commission. Words such as “forecasts," "projections," "estimates," "plans," "expectations," "targets," and other comparable terminology often identify forward-looking statements. Such statements concerning future performance are subject to a variety of risks and uncertainties that could cause Devon’s actual results to differ materially from the forward-looking statements contained herein, including as a result of the items described under "Risk Factors" in our most recent Form 10-K; and the items described under "Information Regarding Forward-Looking Estimates" in our Form 8-K filed August 6, 2014.
Cautionary Note to Investors
The United States Securities and Exchange Commission permits oil and gas companies, in their filings with the SEC, to disclose only proved, probable and possible reserves that meet the SEC's definitions for such terms, and price and cost sensitivities for such reserves, and prohibits disclosure of resources that do not constitute such reserves. This presentation may contain certain terms, such as resource potential and exploration target size. These estimates are by their nature more speculative than estimates of proved, probable and possible reserves and accordingly are subject to substantially greater risk of being actually realized. The SEC guidelines strictly prohibit us from including these estimates in filings with the SEC. Investors are urged to consider closely the disclosure in our Form 10-K, available from us at Devon Energy Corporation, Attn. Investor Relations, 333 West Sheridan, Oklahoma City, OK 73102-5015. You can also obtain this form from the SEC by calling 1-800-SEC-0330 or from the SEC’s website at www.sec.gov.
NYSE: DVN www.devonenergy.com

Second-Quarter 2014 Highlights
• Completed portfolio transformation announced late last year
— Contracted to sell U.S. non-core assets for $2.3 billion
• Delivered U.S. oil production growth of 79% year over year(1)
— Achieved excellent well results in the Delaware Basin
— Eagle Ford contributed a full quarter of production
• Increased operating cash flow 47% year over year
• Completed several major projects— Jackfish 3
— Access Pipeline
— Victoria Express Pipeline
Slide 3(1) Excludes assets sold or contracted to sell.

Slide 4
Delivering Strong Oil GrowthQ2 2014 Results
Q2 2013 Q2 2014
37%
20%
43%
Q4 2014e Product Mix (1)
Natural GasNGLsOil
(1) Excludes assets sold or contracted to sell.
Q2 2013 Q2 2014
Total Oil Production (1)
(MBOD)U.S. Oil Production (1)
(MBOD)
CanadaU.S.
153
205
71
128

Slide 5
Higher Revenues & Expanding Margins
$30.47
Q2 2013 Q2 2014
$21.82
61%
12%
27%
Q2 2014 Revenue Mix
(1) Pre-tax cash margin is defined as unhedged upstream revenues and midstream operating profit less LOE, production & property taxes, G&A and net financing costs, divided by BOE production.
Oil-Weighted Upstream Revenue Increased 42% Year over Year
Pre-Tax Cash Margin per BOE (1)
Natural GasNGLsOil

Slide 6
Non-Core Asset SalesSharpening The Focus
• Announced U.S. non-core assets sale for $2.3 billion (June 30, 2014)
— Accretive transaction: 7 times 2013 EBITDA
— Expected to close in the third quarter of 2014
• Total U.S. & Canadian divestiture proceeds: >$5 billion (pre-tax)
— Accretive transactions: 7 times 2013 EBITDA
• Completes portfolio transformation announced late last year
• Proceeds utilized to repay debt from Eagle Ford transaction
NYSE: DVN www.devonenergy.com
Slide 7
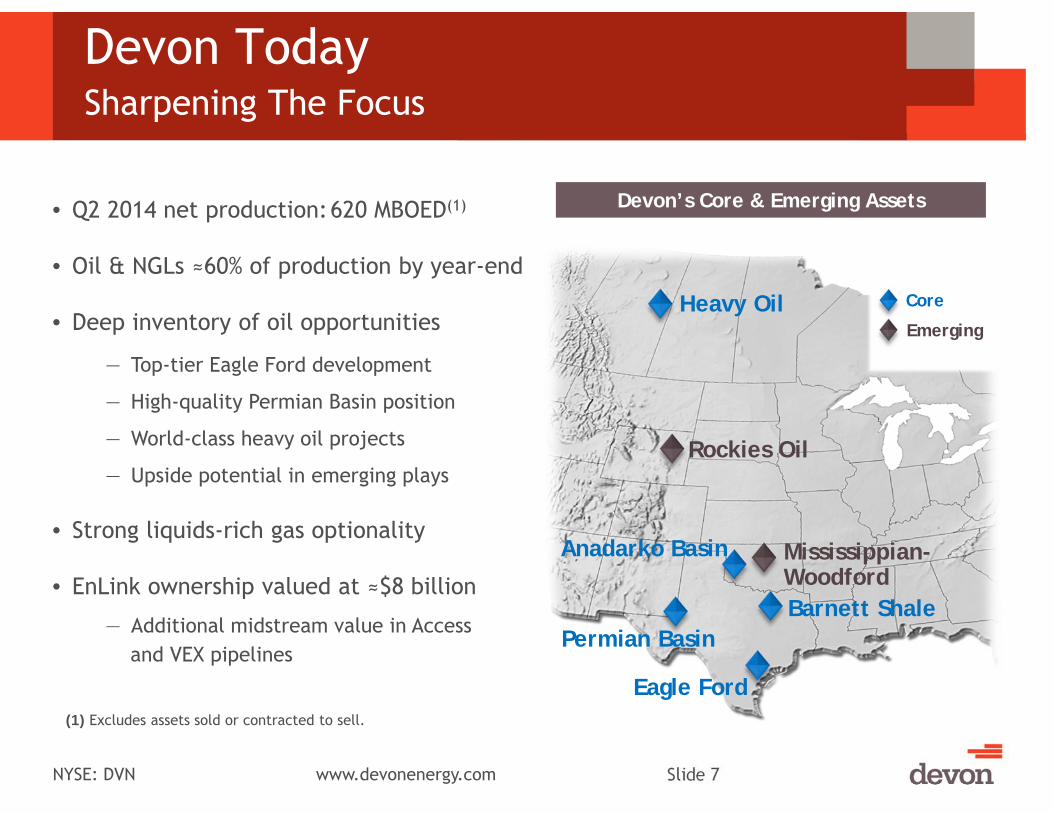
Devon TodaySharpening The Focus
Devon’s Core & Emerging Assets
Core
EmergingHeavy Oil
Rockies Oil
Mississippian-WoodfordBarnett Shale
Permian Basin
Anadarko Basin
Eagle Ford
• Q2 2014 net production:620 MBOED(1)
• Oil & NGLs ≈60% of production by year-end
• Deep inventory of oil opportunities
— Top-tier Eagle Ford development
— High-quality Permian Basin position
— World-class heavy oil projects
— Upside potential in emerging plays
• Strong liquids-rich gas optionality
• EnLink ownership valued at ≈$8 billion
— Additional midstream value in Accessand VEX pipelines
(1) Excludes assets sold or contracted to sell.
NYSE: DVN www.devonenergy.com

Slide 8
2014 Production Growth Targets
2013 2014e
152
198 - 216
U.S. Oil Production (1)
(MBOD)
2013 2014e
539
579 - 622
Total Oil Production (1)
(MBOD)BOE Production (1)
(MBOED)
U.S. Canada
2013 2014e
73
124 - 136
6:1 20:1
(1) Excludes assets sold or contracted to sell.
Slide 9
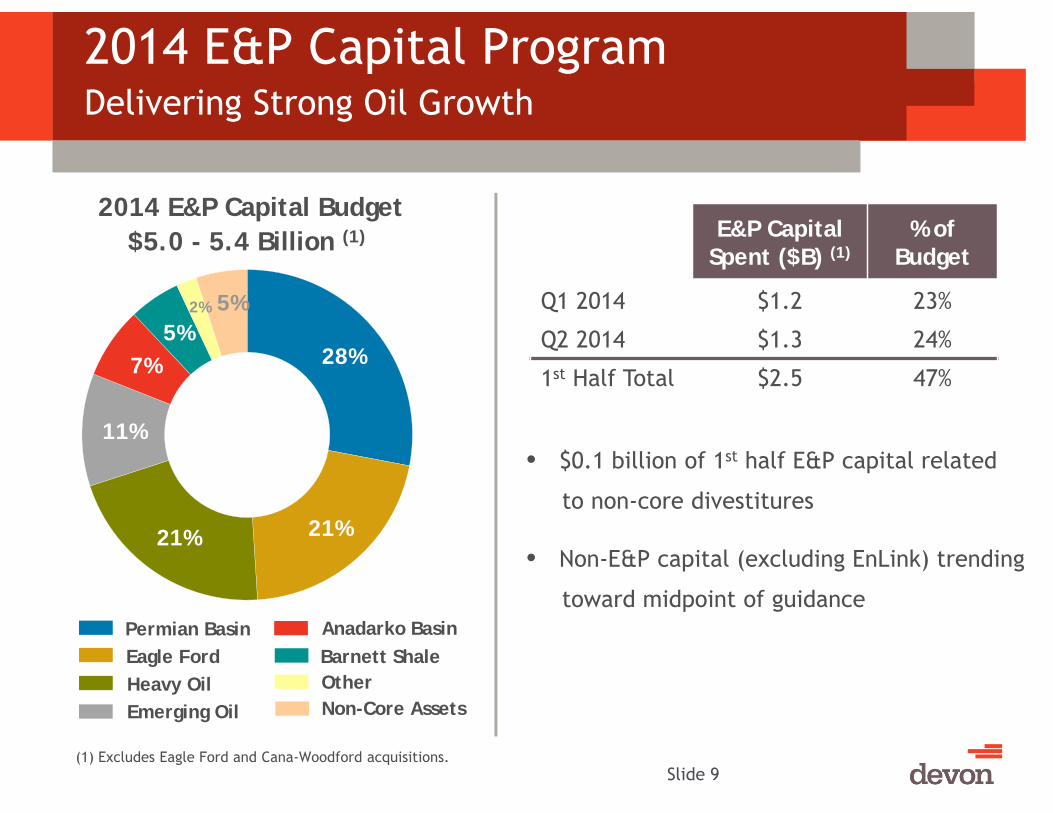
2014 E&P Capital ProgramDelivering Strong Oil Growth
Permian Basin
28%
21%21%
11%
7%5%
2% 5%
2014 E&P Capital Budget$5.0 - 5.4 Billion (1)
Eagle FordHeavy Oil
Anadarko BasinBarnett Shale
Emerging OilOtherNon-Core Assets
E&P CapitalSpent ($B) (1)
% of Budget
Q1 2014 $1.2 23%
Q2 2014 $1.3 24%
1st Half Total $2.5 47%
• $0.1 billion of 1st half E&P capital related
to non-core divestitures
• Non-E&P capital (excluding EnLink) trending
toward midpoint of guidance
(1) Excludes Eagle Ford and Cana-Woodford acquisitions.

Slide 10
Potential Drop Down AssetAccess Pipeline (Heavy Oil Midstream)
EDMONTON
HARDISTY
Express P/LTo U.S. Rockies
16” Diluent Line (Edmonton to Jackfish Area)
Oil Pipelines
JACKFISH & PIKE
Sturgeon Terminal
24” Diluent Line (Sturgeon to Jackfish Area)
42” Blend Line (Jackfish Area to Sturgeon)
30” Blend Line (Sturgeon to Edmonton)
• Three ≈180 mile pipelines from SturgeonTerminal to Devon’s thermal acreage
• ≈30 miles of dual pipeline from SturgeonTerminal to Edmonton
• Devon ownership: 50%
— ≈$1B invested to date
• Capacity net to Devon:— Blended bitumen: 170 MBOPD
— Diluent: 95 MBPD
• Expandable with additional investment
• Access to Edmonton refining and rail, west coast waterborne and U.S. markets
• Flexibility enhances economics

Slide 11
Potential Drop Down AssetVictoria Express Pipeline (VEX) (Eagle Ford)
• ≈56 mile crude oil pipeline from Eagle
Ford core to Port of Victoria terminal
• 50 MBOPD start-up capacity (expandable)
• ≈300,000 barrels of storage available
• Provides additional market options
for crude and condensate
• Devon ownership: 100%
— ≈$70 MM invested to date
• Currently operational
Port of Victoria
Karnes
Gonzales
DeWitt
Lavaca
Victoria
Jackson
Goliad
Wharton
Colorado
Calhoun
Refugio
Aransas
Matagorda
Victoria Express Pipeline (VEX)
Devon Acreage
Gulf ofMexico
NYSE: DVN www.devonenergy.com
Slide 12
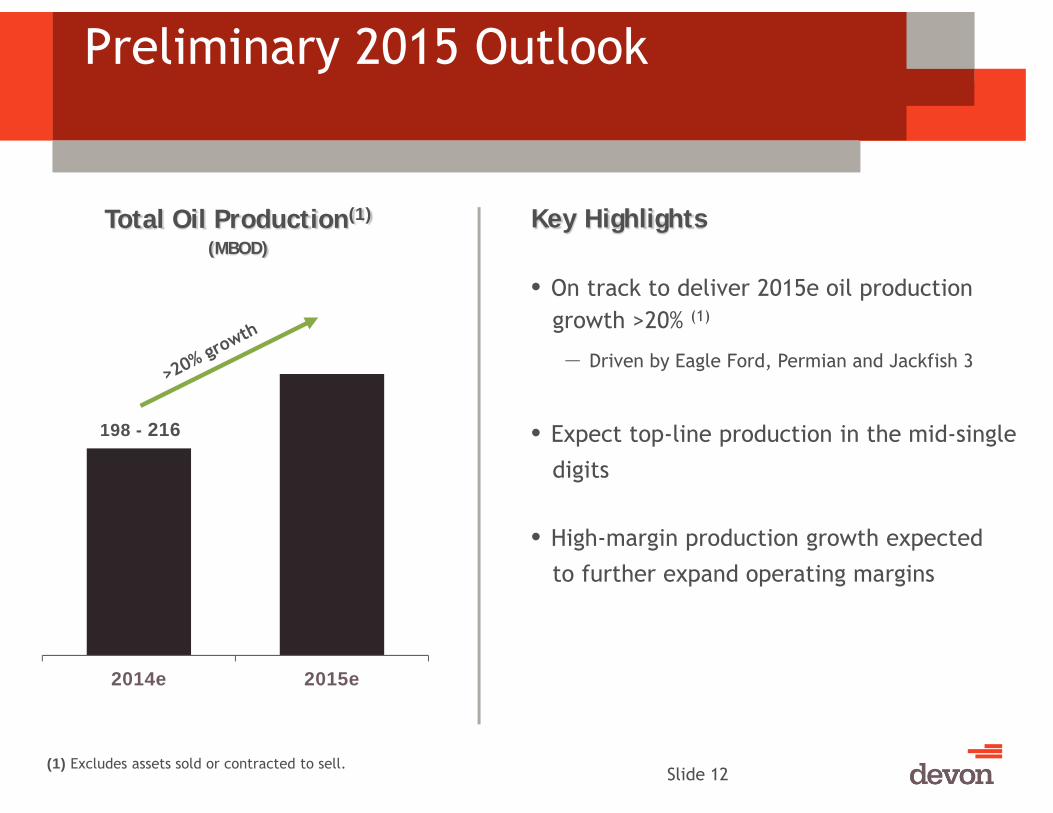
Preliminary 2015 Outlook
2014e 2015e
Total Oil Production(1)
(MBOD)Key Highlights
• On track to deliver 2015e oil productiongrowth >20% (1)
— Driven by Eagle Ford, Permian and Jackfish 3
• Expect top-line production in the mid-single
digits
• High-margin production growth expected
to further expand operating margins
198 - 216
(1) Excludes assets sold or contracted to sell.

Slide 13
Delaware BasinDelivering Outstanding Well Results
Loving
Winkler
WardReeves
Lea
Eddy
Central
New Mexico
Texas
Delaware Sands80,000 net acres
Leonard Shale60,000 net acres
Bone Spring285,000 net acres
Wolfcamp>100,000 net acres
TEXAS
NEW MEXICO OKLAHOMA
• Activity focused on repeatable, high-impact Bone Spring
— Brought 22 wells online in Q2
— 30-day IP rate: 660 BOED
• Recent Delaware Sands success— Two high-rate wells in Q2
— 30-day IP rate: ≈1,000 BOED (70% oil)
• Operated rig count: 12
• 2014 plans: Drill ≈150 wells

Slide 14
Disciplined Risking MethodologyMulti-Variant Analysis
Geology Geophysics• Multi-disciplinary, multi-variantanalysis
• Utilizes geologic, geophysical, completion and production data
• Allows us to characterize and predict future reservoir performance
• Multi-variant model removes engineering and G&G bias
• Approach utilized across portfolio, including Delaware Basin
NYSE: DVN www.devonenergy.com
ProductionCompletions

Slide 15
Disciplined Risking MethodologyDelaware Basin Inventory
Net Prospective
AcresRisk
Factor(1)Net Risked
Acres
RiskedWells Per Section
Gross Risked
UndrilledLocations
160,000 50% 80,000 4 700
85,000 30% 60,000 5 700
440,000 35% 285,000 5 3,500
>100,000 n/a >100,000 n/a UnderEvaluation
40,000 50% 20,000 4 >200
>500,000 >5,000
Delaware Sands
Leonard Shale
Bone Spring
Wolfcamp
Other (Yeso & Strawn)
Formation
Total
(1) Risking includes historical well performance, geologic characteristics, technicalevaluation and economic risk factors.

2014 Results to Date (MBOED)
Slide 16
Eagle Ford Production Results and Outlook
March 2014 Q2 2014 June 2014
73
65
49
Multi-Year Production Outlook (MBOED)
2014e 2015e
70 – 80 (1)
>100
(1) Represents Devon’s estimated net production from March through December.
NYSE: DVN www.devonenergy.com Slide 17
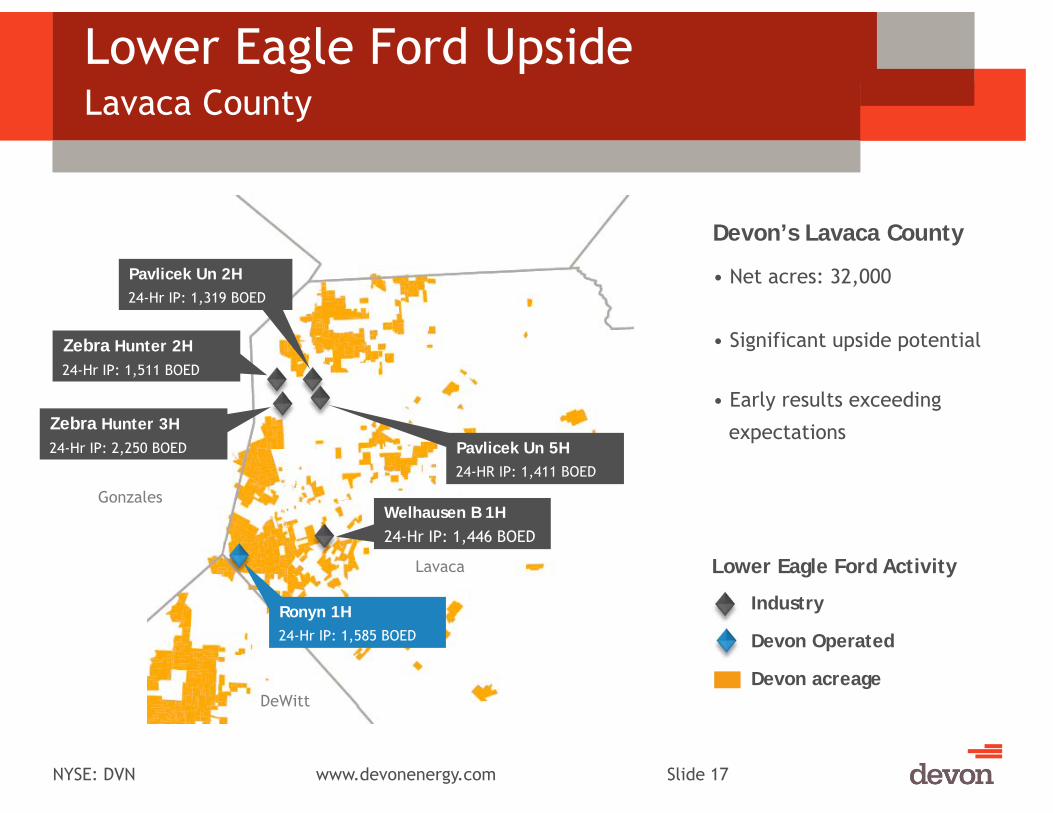
Lower Eagle Ford UpsideLavaca County
Gonzales
DeWitt
Lavaca
Zebra Hunter 3H24-Hr IP: 2,250 BOED
Zebra Hunter 2H24-Hr IP: 1,511 BOED
Welhausen B 1H24-Hr IP: 1,446 BOED
Ronyn 1H24-Hr IP: 1,585 BOED
Devon’s Lavaca County
• Net acres: 32,000
• Significant upside potential
• Early results exceeding
expectations
Pavlicek Un 2H24-Hr IP: 1,319 BOED
Pavlicek Un 5H24-HR IP: 1,411 BOED
Lower Eagle Ford Activity
Industry
Devon Operated
Devon acreage

Slide 18
Upper Eagle Ford Potential
Recent Industry Results
Devon Operated Location
Upper Eagle Ford Activity
Devon acreage
TEXAS
OKLAHOMA
Fojtik #1H24-Hr IP: 1,209 BOED
Sustr #1H24-Hr IP: 1,054 BOED
Medina 2HDrilling
Targac #1H24-Hr IP: 1,398 BOED
Gonzales
Lavaca
DeWitt
Net Pay (ft.)
05
10152025303540
• Encouraging industry results
• Pay thickest in DeWitt County
• Spud first well in Q3
• Additional test planned forlater this year
Welhausen A 2H24-Hr IP: 2,165 BOED
Martinsen 2H24-Hr IP: 1,360 BOED

SAGD Heavy Oil DevelopmentsJackfish & Pike
Slide 19
Ft. McMurray
Edmonton
Calgary
ALBERTABRITISHCOLUMBIA
Jackfish & Pike
Jackfish 1Jackfish 2
Jackfish 3
Access Pipeline
R8 R7 R6 R5 R4
T76
T75
T74
T73
Jackfish Acreage (100% WI)
Pike Acreage (50% WI)
Access Pipeline(50% Ownership)
Pike Project Area
6 Miles
SAGD Characteristics:
• Low F&D
• Low geologic risk
• Flat production profile
• Long reserve life >20 years
Jackfish 1 & 2:• Q2 2014 production:
— Gross production: 60 MBOPD (3% increase YOY)
— Net production: 52 MBOPD
• Delivering top-tier operating results at J1
Jackfish 3:
• Plant start-up began in July
NYSE: DVN www.devonenergy.com Slide 20
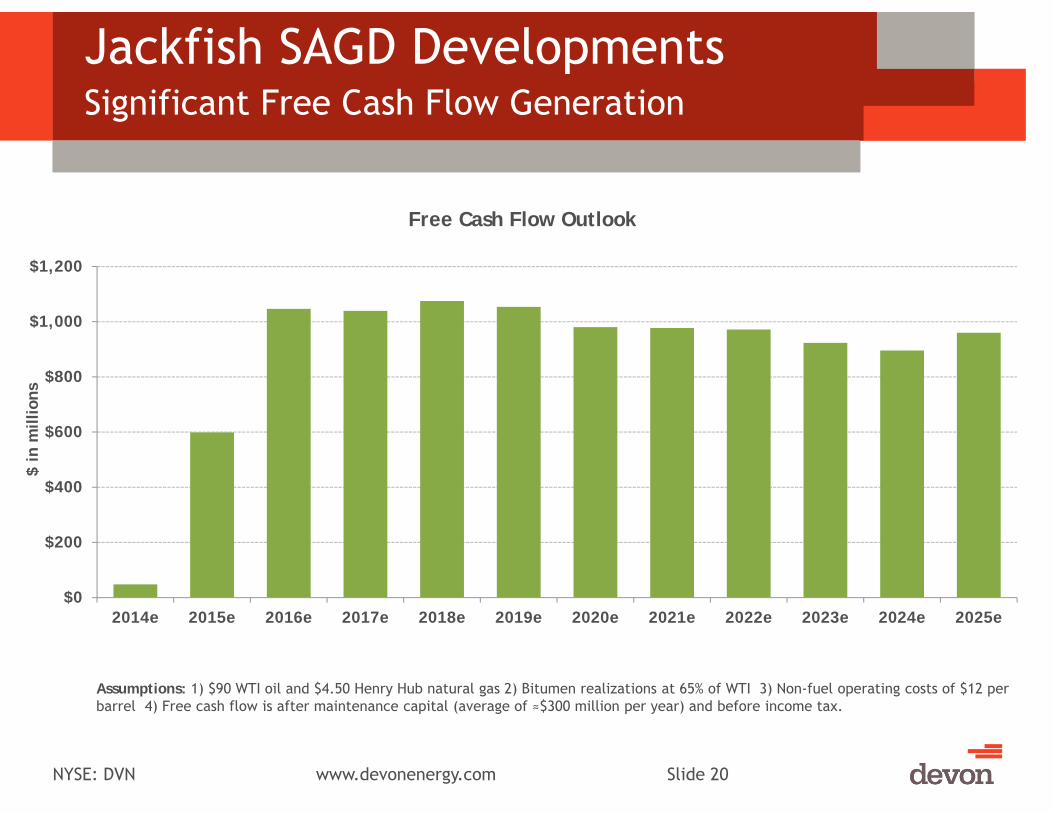
Jackfish SAGD DevelopmentsSignificant Free Cash Flow Generation
Assumptions: 1) $90 WTI oil and $4.50 Henry Hub natural gas 2) Bitumen realizations at 65% of WTI 3) Non-fuel operating costs of $12 per barrel 4) Free cash flow is after maintenance capital (average of ≈$300 million per year) and before income tax.
$0
$200
$400
$600
$800
$1,000
$1,200
2014e 2015e 2016e 2017e 2018e 2019e 2020e 2021e 2022e 2023e 2024e 2025e
$ in
mill
ions
Free Cash Flow Outlook

NYSE: DVN www.devonenergy.com Slide 21
Cana-Woodford Completions Enhanced
Old Design:
Sand: 3.5 MM lbs.
New Design:
Fluid: 130k Bbls.
10 Frac Stages
40 Perf Clusters
Sand: 6.0 MM lbs.
Fluid: 140k Bbls.
20 Frac Stages
80 Perf Clusters
Slide 22
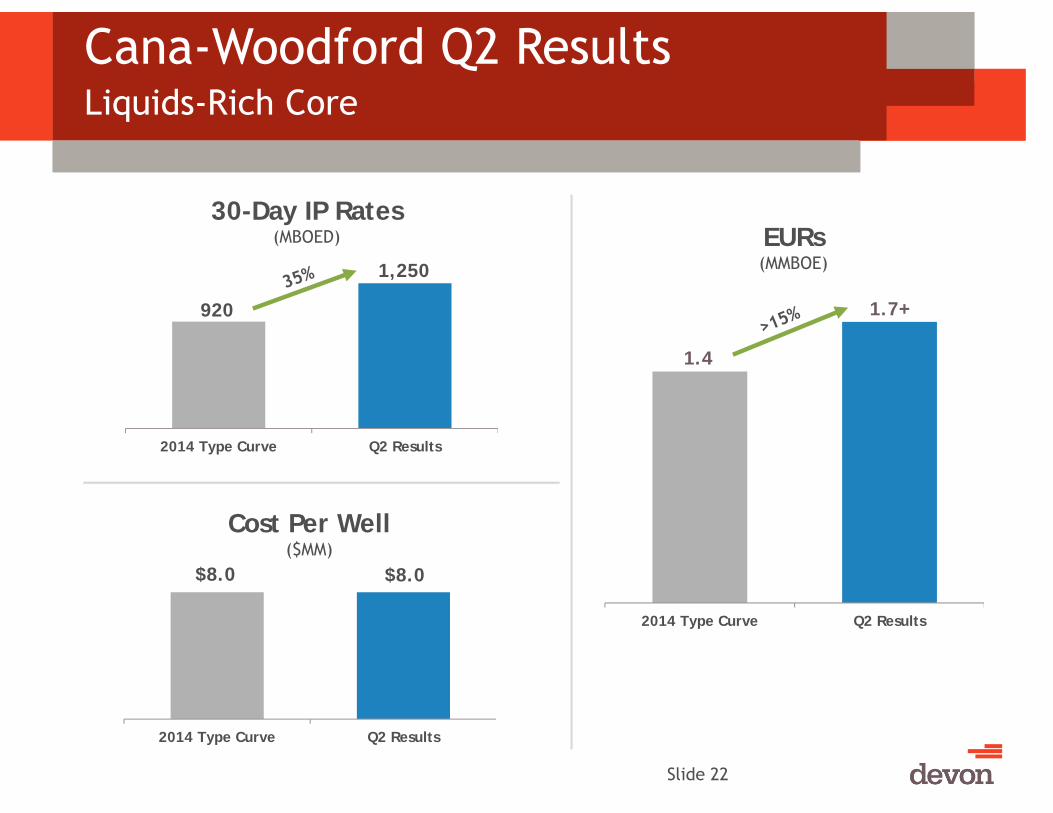
Cana-Woodford Q2 ResultsLiquids-Rich Core
920
1,250
2014 Type Curve Q2 Results
30-Day IP Rates(MBOED)
1.4
1.7+
2014 Type Curve Q2 Results
$8.0 $8.0
2014 Type Curve Q2 Results
Cost Per Well ($MM)
EURs(MMBOE)

NYSE: DVN www.devonenergy.com Slide 23
Cana-Woodford ProductionRevitalizing Base Production
300
320
340
360
380
400
420
440
Oct
-13
Nov
-13
Dec
-13
Jan-
14
Feb-
14
Mar
-14
Apr
-14
May
-14
Jun-
14
Jul-1
4
Aug
-14
Sep
-14
Oct
-14
Nov
-14
Dec
-14
Jan-
15
MM
CFD
Gross Operated Production
Acid Treatments

Slide 24
Cana-Woodford Acquisition Accelerating Activity
• Acquired 50,000 net acres (announced May 2014)
— Directly overlaps existing leasehold
— Increases Cana position to ≈280,000 net acres
• Improved completion design enhancing returns
• Workover activity yielding excellent results
• Significant undrilled well inventory
— Total Cana risked locations: >5,000
• Running around 10 rigs next year with partner
Custer
Dewey
Blaine
Caddo
Canadian
Grady
Cana Plant
Existing Devon acreage Acquired acreage
TEXAS
OKLAHOMA
Kingfisher

Slide 25
Rockies Oil Powder River Basin
• Net acreage: 150,000
• Stacked oil targets (Parkman, Turner, Frontier & others)
• Activity focused on repeatable Parkmanformation
— Two high-rate wells in Q2
— 30-day IP rate: 950 BOED (95% light oil)
• Risked drilling inventory: ≈1,000 (75% Parkman)
• Expected to add 4th rig by year-end
• Accelerating development activity in 2015
Current Focus Area
MONTANA
WYOMING
CAMPBELL
Devon acreage

Q & A

Discussion of Risk Factors
Information provided in this presentation includes “forward-looking statements” as defined by the Securities and Exchange Commission. Forward-lookingstatements are identified in this presentation as “forecasts, projections, estimates, plans, expectations, targets, opportunities, potential, outlook, etc.” andare subject to a variety of risk factors. A discussion of risk factors that could cause Devon’s actual results to differ materially from the forward-lookingstatements contained herein are outlined below.
The forward-looking statements provided in this presentation are based on management’s examination of historical operating trends, the information whichwas used to prepare reserve reports and other data in Devon’s possession or available from third parties. Devon cautions that its future oil, natural gas andNGL production, revenues and expenses are subject to all of the risks and uncertainties normally incident to the exploration for and development, productionand sale of oil, gas and NGLs. These risks include, but are not limited to, price volatility, inflation or lack of availability of goods and services, environmentalrisks, drilling risks, political changes; changes in laws or regulations, the uncertainty inherent in estimating future oil and gas production or reserves, andother risks identified in our Form 10-K and our other filings with the SEC.
Specific Assumptions and Risks Related to Price and Production Estimates Prices for oil, natural gas and NGLs are determined primarily by prevailingmarket conditions. Market conditions for these products are influenced by regional and worldwide economic conditions, weather and other local marketconditions. These factors are beyond Devon’s control and are difficult to predict. In addition to volatility in general, Devon’s oil, gas and NGL prices may varyconsiderably due to differences between regional markets, differing quality of oil produced (i.e., sweet crude versus heavy or sour crude), differing Btucontents of gas produced, transportation availability and costs and demand for the various products derived from oil, natural gas and NGLs. Substantially allof Devon’s revenues are attributable to sales, processing and transportation of these three commodities. Consequently, Devon’s financial results andresources are highly influenced by price volatility.
Estimates for Devon’s future production of oil, natural gas and NGLs are based on the assumption that market demand and prices for oil, gas and NGLs willcontinue at levels that allow for profitable production of these products. There can be no assurance of such stability. Most of Devon’s Canadian production ofoil, natural gas and NGLs is subject to government royalties that fluctuate with prices. Thus, price fluctuations can affect reported production. Estimates forDevon’s future processing and transport of oil, natural gas and NGLs are based on the assumption that market demand and prices for oil, gas and NGLs willcontinue at levels that allow for profitable processing and transport of these products. There can be no assurance of such stability.
The production, transportation, processing and marketing of oil, natural gas and NGLs are complex processes which are subject to disruption due totransportation and processing availability, mechanical failure, human error, meteorological events including, but not limited to, hurricanes, and numerousother factors. The following forward-looking statements were prepared assuming demand, curtailment, producibility and general market conditions forDevon’s oil, natural gas and NGLs will be substantially similar to those of 2013, unless otherwise noted.
Assumptions and Risks Related to Capital Expenditures Estimates Devon’s capital expenditures budget is based on an expected range of future oil, naturalgas and NGL prices as well as the expected costs of the capital additions. Should actual prices received differ materially from Devon’s price expectations forits future production, some projects may be accelerated or deferred and, consequently, may increase or decrease capital expenditures. In addition, if theactual material or labor costs of the budgeted items vary significantly from the anticipated amounts, actual capital expenditures could vary materially fromDevon’s estimates.
Assumptions and Risks Related to Marketing and Midstream Estimates Devon cautions that its future marketing and midstream revenues and expenses aresubject to all of the risks and uncertainties normally incident to the marketing and midstream business. These risks include, but are not limited to, pricevolatility, environmental risks, mechanical failures, regulatory changes, the uncertainty inherent in estimating future processing volumes and pipelinethroughput, cost of goods and services and other risks.
Slide 27

Non-GAAP ReconciliationNet Debt
Slide 28
Devon defines net debt as debt less cash and cash equivalents. Devon believes that netting these sources of cash against debt provides a clearer picture of the future demands on cash to repay debt.
Note: The United States Securities and Exchange Commission has adopted disclosure requirements for public companies such as Devon concerning Non-GAAP financial measures. (GAAP refers to generally accepted accounting principles). The company must reconcile the Non-GAAP financial measure to related GAAP information.
RECONCILIATION TO GAAP INFORMATION (in billions)
June 30, 2014
Total debt (GAAP) $12.4
Adjustments:
Cash and cash equivalents 1.7
Net debt (Non-GAAP) $10.7
Net debt associated with EnLink 1.7
Devon stand-alone net debt (Non-GAAP) $9.0