Embed Size (px)
Citation preview

2005-01-1131
Second-Law Analysis of Indirect Injection Turbocharged Diesel Engine Operation under Steady-State and Transient Conditions
C.D. Rakopoulos and E.G. Giakoumis Mechanical Engineering Department, National Technical University of Athens
Copyright © 2005 SAE International
ABSTRACT
A second-law analysis is performed in both chambers of an indirect injection turbocharged diesel engine and the simulation program developed is used to study the second-law performance of the engine at various operating conditions, steady state and transient. The simulation developed is based on the filling and emptying approach and provides detailed analysis of thermodynamic, dynamic and second-law differential equations on a degree crank angle basis. It incorporates a detailed mathematical simulation of the fuel pump and solves each equation separately for each one of the six cylinders of the engine in hand. The model is validated against experimental data at steady state and transient conditions, obtained at the authors’ laboratory. The prechamber rate and cumulative availability terms and irreversibilities are computed and depicted against the main chamber ones during the 720 degrees crank angle of an engine cycle. Moreover, the effect of certain parameters on the second-law performance of the cylinder is studied, i.e. static injection timing, prechamber diameter and engine load. Explicit diagrams are given to show the response of the various cylinders’ main chamber and prechamber availability terms during transient operation. Thus, the magnitude as well as the evolution of the various terms during a cycle or during a transient event is highlighted.
INTRODUCTION
Diesel engine simulation modeling has long been established as an effective tool for studying engine performance and contributing to evaluation and new developments. Thermodynamic models of the real diesel engine cycle [1-6] have served as effective tools for complete analysis of engine performance and sensitivity to various operating parameters.
Transient response, especially of turbocharged diesel engines, forms a significant part of their operation and is often characterized by short but serious off-design functions, requiring careful and proper modeling for successful study of the speed response [7-12].
Moreover, during the last two decades, it has become clear that second-law (availability) analysis, with detailed study of what is happening during a process, has contributed a new way of thinking about and studying various thermodynamic engine processes [13-24]. Second-law theory introduces the term of irreversibilities, the reduction of which can lead to better engine performance, as well as the ability of increasing the overall engine efficiency by possible recovery of the work potential in the exhaust gases or heat losses. Consequently, a combined first and second-law study is required for better engine design, evaluation and performance.
Second-law research has focused mainly on fundamental [13,14,17,19,23] and on irreversibilities production [13,15,16,21] analyses. Special reference has been paid to the turbocharging system used [18] and to the limited cooled engine case [21] using, mainly, single-zone or even two-zone models [22] for the simulation of the processes inside the cylinder. However, all the previous works dealt exclusively with the steady-state operation of the direct injection diesel engine.
This work expands the second-law analysis so as to cover the intrinsically more complex operation of the indirect injection (IDI) diesel engine fitted with a prechamber, filling a gap in the open literature. The high pressure electronic injection systems applied nowadays to the direct injection (DI) diesel engines, mainly in the automotive market, have decreased the dominance of the IDI engine. Nonetheless, the ability of the latter to operate at high engine speeds thus achieving high power concentration makes it an interesting alternative solution for small size applications. In this work we apply the corresponding availability equations separately to each chamber in the cylinder (main- and prechamber). By so doing we will able to quantify the contribution of each chamber on the total cylinder irreversibilities production as well as on the other availability terms.
Moreover, we extend the second-law analysis to the transient operation of the IDI diesel engine in order to provide useful results about each chamber’s second-law properties response after a ramp increase in load. In Ref. [25] on a fundamental basis and in Ref. [26] as

regards parametric analysis, the whole IDI diesel engine plant operating under transient conditions was studied from the second-law perspective. The second-law analysis included the cylinder (without any differentiation between main- and prechamber), the manifolds, the turbocharger and the aftercooler equations. In this work, we focus on the in-cylinder processes and especially on the interaction and interdependence between main chamber and prechamber.
In order to fulfill the above aim, a steady-state and transient diesel engine simulation code has been developed, which follows the filling and emptying modeling technique.
Particularly, as regards transient response, some important features to account for the peculiarities of the transient operation have been incorporated. These include improved relations concerning indirect fuel injection and combustion, heat transfer to the cylinder walls, friction modeling, fuel pump operation, dynamic analysis, and turbocharger and aftercooler operation [11,12,27]. Furthermore, a multi-cylinder engine model is incorporated, i.e. one which solves the corresponding differential equations individually for each cylinder, providing a more detailed simulation of the transient processes. The latter issue is important since, during a transient event, considerable differentiations in fueling from cylinder to cylinder inside the same cycle are observed, mainly during the first cycles.
The experimental investigation was carried out on a six-cylinder, IDI, turbocharged and aftercooled, medium-high speed diesel engine coupled to a hydraulic brake, located at the authors’ laboratory. A high-speed data acquisition system was set up for measuring engine and turbocharger variables performance, under both steady-state and transient operation. The steady-state and transient behaviour of the engine is predicted adequately by the developed code, despite the long non-linear brake loading times and the indirect injection nature of the engine.
The availability balance equation is applied to both the main chamber and the prechamber of the present diesel engine. Various availability properties developed during steady-state and transient operation such as work, heat transfer, exhaust gas and, particularly, irreversibilities are depicted in detailed diagrams quantifying each chamber’s contribution. The rate and cumulative terms of all important availability properties are also given, in comparison, for the two chambers. Moreover, the effect of certain design and operating parameters is studied, i.e. prechamber diameter, static injection timing and engine load.
FIRST-LAW ANALYSIS
Since the present analysis does not include prediction of exhaust gases emissions and on the other hand deals with transient operation calculations on a degree CA basis, a single-zone model is used as the basis for the
thermodynamic processes evaluation. This approach is the best compromise between accuracy and limited PC program execution time. The fuel is dodecane (C12H26) with a lower heating value, LHV=42,500 kJ/kg. Perfect gas behavior is assumed. Polynomial expressions are used for each of the four species (O2, N2, CO2, and H2O) considered [3], concerning the evaluation of internal energy and specific heat capacities for first-law applications to the engine cylinder contents [1-5,27]. The atmosphere is assumed to be at po=1 bar and To=298.15K.
STEADY-STATE OPERATION
Combustion
For the study of the combustion process, the model proposed by Whitehouse and Way [1,28] is used separately for the main chamber and the prechamber. In this model the combustion process consists of two parts; a preparation limited combustion rate and a reaction limited combustion rate. The corresponding equations are:
p M M K = P yO
xu
x-1i1 (1)
for the preparation rate (kg of fuel per oCA), which controls the burned fuel for the larger part of combustion, while for the reaction rate R (kg of fuel per oCA) which is responsible for the early part of combustion it holds:
� � d RP e TN
p K = R act/T-O2
��� (2)
Mi = �(dmfi/d�) d� is the total mass (kg) of injected fuel up to the crank angle � considered, and (dmfi/d�) is the injection rate found from the analytical fuel injection model described later. Mu=Mi-�Pd� is the total mass (kg) of unprepared fuel, 'act' is the reduced activation energy (K) accounting for the ignition delay and pO is the partial pressure of oxygen (bar) in the main chamber or the prechamber.
It is vital for a proper simulation of transient response that the combustion modeling takes into consideration the continuously changing nature of operating conditions. Thus the constants K1, in the (dominant) preparation rate equations of each chamber, are correlated with the Sauter mean diameter (SMD) of the fuel droplets by a formula of the type K1�(1/SMD)2 [1]. For the evaluation of SMD (�m), the empirical expression proposed by Hiroyasu et al [29] is used:
V p)( 25.1 = SMD 0.131tot
0.12g
-0.135 � (3)
where p is the mean pressure drop across the injection nozzle in MPa (derived by the fuel pump submodel which will be described later), �g is the density of air in kg/m3 at
the time the injection starts, and Vtot is the amount of fuel delivered per cycle in mm3 per pump stroke.
Heat Transfer
The model of Annand [30] is used to simulate heat loss QL to the cylinder walls,
� � � � �4g
4wgw
bL TTc D/TTRea F =dt
dQ��� (4)
where for the main chamber:
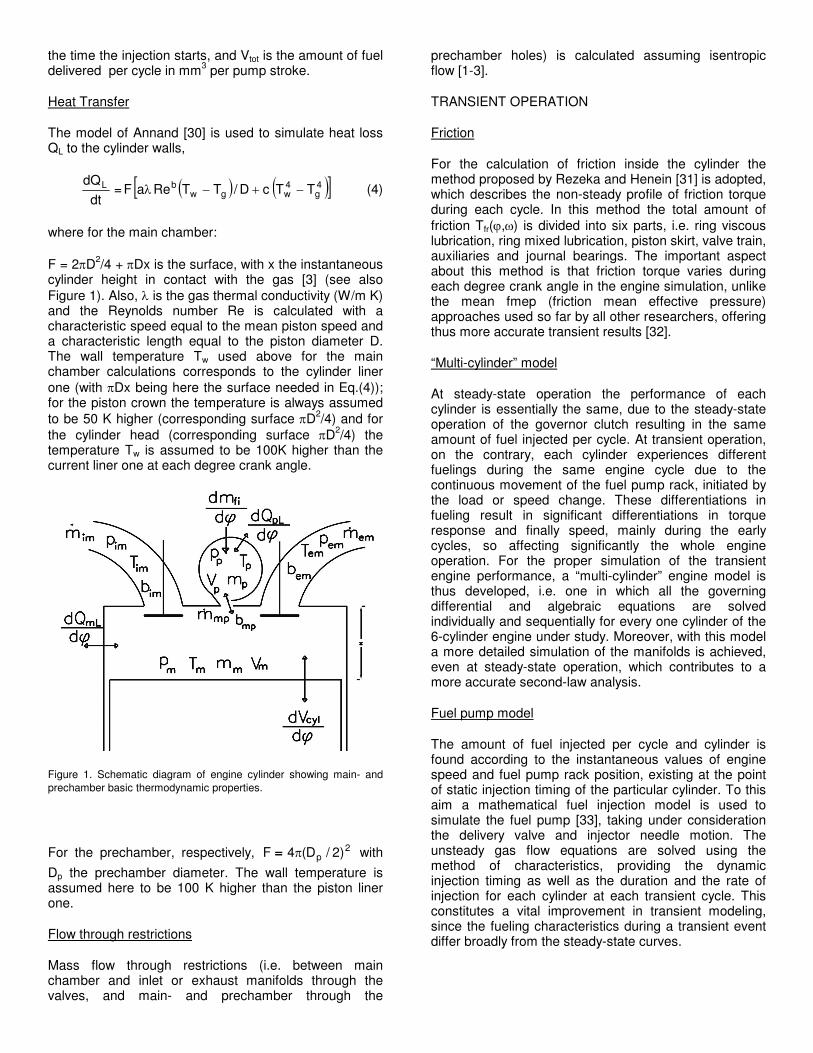
F = 2�D2/4 + �Dx is the surface, with x the instantaneous cylinder height in contact with the gas [3] (see also Figure 1). Also, is the gas thermal conductivity (W/m K) and the Reynolds number Re is calculated with a characteristic speed equal to the mean piston speed and a characteristic length equal to the piston diameter D. The wall temperature Tw used above for the main chamber calculations corresponds to the cylinder liner one (with �Dx being here the surface needed in Eq.(4)); for the piston crown the temperature is always assumed to be 50 K higher (corresponding surface �D2/4) and for the cylinder head (corresponding surface �D2/4) the temperature Tw is assumed to be 100K higher than the current liner one at each degree crank angle.
Figure 1. Schematic diagram of engine cylinder showing main- and prechamber basic thermodynamic properties.
For the prechamber, respectively, 2p )2/D(4F ����� with
Dp the prechamber diameter. The wall temperature is assumed here to be 100 K higher than the piston liner one.
Flow through restrictions
Mass flow through restrictions (i.e. between main chamber and inlet or exhaust manifolds through the valves, and main- and prechamber through the
prechamber holes) is calculated assuming isentropic flow [1-3].
TRANSIENT OPERATION
Friction
For the calculation of friction inside the cylinder the method proposed by Rezeka and Henein [31] is adopted, which describes the non-steady profile of friction torque during each cycle. In this method the total amount of friction Tfr(�,�) is divided into six parts, i.e. ring viscous lubrication, ring mixed lubrication, piston skirt, valve train, auxiliaries and journal bearings. The important aspect about this method is that friction torque varies during each degree crank angle in the engine simulation, unlike the mean fmep (friction mean effective pressure) approaches used so far by all other researchers, offering thus more accurate transient results [32].
“Multi-cylinder” model
At steady-state operation the performance of each cylinder is essentially the same, due to the steady-state operation of the governor clutch resulting in the same amount of fuel injected per cycle. At transient operation, on the contrary, each cylinder experiences different fuelings during the same engine cycle due to the continuous movement of the fuel pump rack, initiated by the load or speed change. These differentiations in fueling result in significant differentiations in torque response and finally speed, mainly during the early cycles, so affecting significantly the whole engine operation. For the proper simulation of the transient engine performance, a “multi-cylinder” engine model is thus developed, i.e. one in which all the governing differential and algebraic equations are solved individually and sequentially for every one cylinder of the 6-cylinder engine under study. Moreover, with this model a more detailed simulation of the manifolds is achieved, even at steady-state operation, which contributes to a more accurate second-law analysis.
Fuel pump model
The amount of fuel injected per cycle and cylinder is found according to the instantaneous values of engine speed and fuel pump rack position, existing at the point of static injection timing of the particular cylinder. To this aim a mathematical fuel injection model is used to simulate the fuel pump [33], taking under consideration the delivery valve and injector needle motion. The unsteady gas flow equations are solved using the method of characteristics, providing the dynamic injection timing as well as the duration and the rate of injection for each cylinder at each transient cycle. This constitutes a vital improvement in transient modeling, since the fueling characteristics during a transient event differ broadly from the steady-state curves.

Engine and governor dynamics
If Gtot represents the total system moment of inertia (engine, flywheel and load), then the conservation of energy principle applied to the total system (engine plus load) yields [2,3,7]:
dtd
G = ),(T -)(T-),(T totfrLe�
����� (5)
where Te(�,�) stands for the instantaneous value of the engine torque, consisting of the gas and the inertia forces torque. Also, TL(�) is the load torque, which, for the hydraulic brake coupled to the engine examined, is TL(�)��2. Lastly, Tfr(�,�) stands for the friction torque, which varies during each cycle and for every cylinder according to the explicit friction analysis based on the Rezeka-Henein method.
To find the instantaneous fuel pump rack position z which is initiated by the mechanical governor clutch movement, during the transient operation, a second order differential equation is used [2,7,27]:
52
42
3212
2
cczczcddz
cd
zd�������������������� ��
�� (6)
with constants ci (i=1-5) derived after calibration against experimental data under transient conditions.
SECOND-LAW ANALYSIS
The availability of a system in a given state is defined as the maximum reversible work that can be produced through interaction of the system with its surroundings, as it reaches thermal, mechanical and chemical equilibrium [13,17,19].
The present thermodynamic analysis, since based on a single zone approach, deals only with the four basic constituents (no dissociation is taken into account) which are also present in the environment, so there are no partial products in the exhaust that could be either oxidised or reduced. Moreover, the work that could be obtained (with the use of semi-permeable membranes or other special devices such as the Van’t Hoff cells) due to the difference in the partial pressures between the system constituents at the dead state and their surroundings counterparts is practically not applicable [17,20]. Thus, for the present study only thermal and mechanical availability terms are taken into account, while chemical availability is involved only in the reaction of fuels to form products.
Application of the availability balance equation to the main chamber and the prechamber of the diesel engine cylinder, on a degree CA basis, yields the following relations [13,19,23,25,26] in accordance to Figure 1. It is assumed that the mass exchange between main chamber and prechamber takes places in an ideal manner through the throats without any mechanical or
thermal loss, i.e. we do not take into account the (extremely small) availability destruction along the throat. In all the following equations index m denotes the main chamber, index p the prechamber and index j the main- or prechamber or cylinder.
MAIN CHAMBER AND PRECHAMBER
For the main chamber, we have:
��
���
ddI
N6
bm
ddA
ddA
ddA
N6bmbm
= ddA
mmpmpmf
mLwememimimm
��������
����������������
�
��
(7a)
while for the prechamber it holds:
���� d
dI
N6
bm
d
dA
d
dA =
d
dA pmpmppLpfp������������
�
(7b)
with imm� the incoming flow rate from the inlet manifold,
emm� the outgoing one to the exhaust manifold, and
mpm� the mass flow rate between the two chambers (assumed negative when directing from main- to prechamber). All the above flow rates are found from the first-law analysis in the engine cylinder;
�� d
dV )p-(p =
ddA cyl
omw (8)
is the work transfer, while dVcyl/d� is the rate of change of cylinder volume with crank angle [3] and pm the instantaneous main chamber cylinder pressure;
)TT
-(1 d
dQ =
d
dA
j
ojLjL
�� (9)
is the heat transfer to the cylinder walls (considered here as external to the examined control volume), dQjL/d� is given by the Annand correlation, and Tj is the instantaneous chamber gas temperature;
fchjfbjf a
d
dm =
d
dA
�� (10)
is the burning fuel availability in each chamber, with afch being the (chemical) availability associated with burning of liquid hydrocarbon fuels of the type CkHn and given by [13]:
)k
0.042kn
0.011925 4 LHV(1.0422 = a fch �� (11)
For the present analysis, k=12, n=26 and afch=1.064 LHV. The fuel burning rate dmjfb/d� is calculated, for

each computational step, and for each chamber j with the use of the Whitehouse-Way model (Eqs (1) and (2)).
The terms bim , bem and bmp in Eqs (7) refer to the flow availability of the corresponding mass flow rates, defined as [13]:
b = h – ho –To (s – so) (12)
The terms dIm/d� and dIp/d� in Eqs (7) denote the rate of irreversibility production within the main chamber and the prechamber respectively, which consist mainly of the combustion term, while inlet-valve throttling and mixing of the incoming air with the cylinder residuals contribute a small amount [25] to the main chamber term.
CYLINDER
Adding Eqs (7a) and (7b), we get the availability equation for the cylinder:
���
����
d
dI)
d
dA
ddA
(
)d
dA
ddA
(ddA
N6bmbm
= d
dA
cylpfmf
pLmLwememimimcyl
��������
�������������������� ��
(13)
The dAj/d� terms, given in the previous equations, represent the change in the availability of the contents of control volume j for the cylinder and the two chambers. They are evaluated according to the following relation [13];
����� d
dG
d
dST
d
dVp+
d
dU =
d
dA jojo
jo
jj�������� (14)
Of course it holds: dAcyl/d�=dAm/d� + dAp/d�.
For the evaluation of internal energy U we have [1-3]:
� �� �
��
��
�
4
1i
4
1i
jviji
jii
j
d
dTcm
d
dmu
d
dU (15)
where mji is the mass of species i (O2, N2, CO2, and H2O) in control volume j and cv is the specific heat capacity under constant volume (a function of temperature only cv=du/dT), with
)T(uu ii ���� (16)
where the constants for the polynomial relation ui(T) can be found in Heywood [3] from the corresponding polynomial hi(T) relations, and dTj/d�, dmji/d� and dpj/d� (in the next equation) are derived from the first-law of thermodynamics applied to the main- and prechamber.
Similarly, the rate of entropy change in Eq.(14) is:
����
��
��
��
�
4
1i
j
j
jjpi
j
ji4
1ijiji
jij
d
dp
T
V
d
dTc
T
m)px,T(s
d
dm
d
dS (17)
with
)p
pxln(R)p,T(s)px,T(s
o
jisojijiji ������������ (18)
and )p,T(s oji���� a function of temperature only [3], with xi
the molar fraction of species i in the mixture.
For the Gibbs free enthalpy:
oi
4
1i
jioj
d
dm
d
dG�
��
� ��
(19)
where )px,T(g oioioi ����� is the chemical potential of
species i at ambient conditions, with
)]xln(R)p,T(s[T)T(h)px,T(sT)T(h)px,T(g
isooiooi
oioiooioioi
������������
������������ (20)
During transient operation, the terms dAj/d� in Eq.(14) do not sum up to zero (as they do for steady-state operation) at the end of a full cycle of the working medium. Their respective cumulative values
��� d)d/dA(720
0
j are, however, small (not more than
0.40% of the incoming fuel’s availability) compared to the other availability terms, due to the large total moment of inertia of the examined engine-brake system, which slows down the reaction of the fuel pump rack and consequently the speed response of the engine.
EXPERIMENTAL PROCEDURE AND MATCHING WITH SIMULATION RESULTS
The objective of the experimental test bed developed was to validate the steady-state and transient performance of the engine simulation. To accomplish this task the engine was coupled to a hydraulic brake (dynamometer). The basic data for the engine and turbocharger can be found in Table 1.
The experimental investigation was conducted on an MWM TbRHS 518S, 6-cylinder, turbocharged and aftercooled, indirect injection, medium-high speed diesel engine. A throat with two holes of 5 mm diameter each connects the main chamber with the prechamber. The prechamber diameter is 4.36 cm thus giving a volume equal to 1/64 of the displacement one. The fuel is injected in the prechamber via a pintle type injector having one hole of 1 mm diameter and an opening pressure of 120 bar. The engine is fitted with a Kuehnle, Kopp & Kausch (KKK) turbocharger and a water aftercooler after the turbocharger compressor. It is fitted

with a variable-speed mechanical governor. The engine is permanently coupled to a Schenck hydraulic dynamometer. This is a variable fill brake, with the loading accomplished via the brake lever that controls the amount of water swirling inside the machine. Details about the experimental setup can be found in Ref. [34].
Table 1. Engine and Turbocharger basic data.
Engine Model and Type
‘MWM TbRHS 518S’, in-line, 6-cylinder, 4-stroke, compression
ignition, IDI, turbocharged, aftercooled
Speed Range 1000-1500 rpm
Bore/Stroke 140 mm/180 mm
Compression Ratio 17.7
Prechamber Diameter / Volume
43.578 mm / 43.332 cm3
Maximum Power 320 HP (236kW) @ 1500 rpm
Maximum Torque 1520 Nm @ 1250 rpm
Intake Valve Opening / Closure
51 oCA bTDC /60 oCA aBDC
Exhaust Valve Opening/Closure
64 oCA bBDC/47 oCA aTDC
Fuel Pump Bosch PE-P series, in-line, 6-cyl. with mechanical governor
Total Moment of Inertia
15.60 kg m2
Turbocharger KKK M4B 754/345
Turbocharger Moment of Inertia
7.5x10⁻⁴ kg m2
The first requirement from the engine test bed instrumentation was to investigate the steady-state performance of the examined engine. For this purpose, an extended series of steady-state trials was conducted in order on the one hand to examine the model’s predictive capabilities and on the other to calibrate successfully the individual submodels. By so doing, the constants for the combustion, heat transfer (different for each chamber), friction and fuel pump simulation was made possible to be estimated. Figure 2 shows the results between experiment and simulation for the whole engine speed operating range and for various loads at steady state conditions. The brake mean effective pressure (bmep), the brake specific fuel consumption (bsfc), the boost pressure and the turbocharger speed are depicted in this figure. It is obvious that the matching between experimental and simulated results is very good for all engine operating conditions, thus providing a sound basis for successful second-law results.
The investigation of transient operation was the next task. Since the particular engine is one with a relatively
small speed range, mainly load changes (increases), with constant governor setting were examined. For the transient tests conducted, the initial speed was 1180 or 1380 rpm and the initial load 10% of the engine full load. The final conditions for the transient events varied from 47 to 95% of the engine full load, as analyzed in detail in Ref. [34].
A typical example of a conducted transient experiment is given in Figure 3. Here, the initial load was 10% of the full engine load at 1180 rpm. The final load applied was almost 75% of the full engine load, which corresponds to a brake load increase of 650%; it was applied in 0.2 s.
20 30 40 50 60 70 80 90
Load (%)
2.0
3.0
4.0
5.0
6.0
7.0
8.0
9.0
10.0
bmep
(bar
)
160.0
170.0
180.0
190.0
200.0
210.0
220.0
230.0
bsfc
(gr/
kWh)
1000 rpm - exper.1250 rpm - exper.1500 rpm - exper.1000 rpm - model1250 rpm - model1500 rpm - model
0
5,000
10,000
15,000
20,000
25,000
30,000
35,000
40,000
45,000
T/C
spe
ed (r
pm)
1.00
1.10
1.20
1.30
1.40
1.50
1.60
1.70
Boo
st P
ress
ure
(bar
)
Figure 2. Predicted and experimental steady state results.
The application of the final load was effected by the movement of the brake control lever (this task lasted 0.2 s), which in turn increased the amount of water inside the brake by appropriately increasing the active surface of the inlet tube. Unfortunately, this hydraulic brake is characterized by a high mass moment of inertia, in the order of 5.375 kgm2, resulting in long, abrupt and non-linear actual load-change profile. The actual duration of the load application was accounted for in the simulation model by increasing the load application time. The non-

linear character of the load application though, which could not be accounted for in the simulation, is responsible for the difference observed between experimental and simulated results during the early cycles in Figure 3. On the other hand, the matching between experimental and predicted transient responses is satisfactory for both engine and turbocharger variables (engine speed, maximum pressure for main chamber, fuel pump rack position and boost pressure), as regards the final conditions.
Initial Speed 1180 rpm, Load-change 10->75%
0 25 50 75 100 125 150
Number of Cycles
40.0
45.0
50.0
55.0
60.0
65.0
70.0
75.0
80.0
Mai
n C
ham
ber
Max
.Pre
ssur
e (b
ar)
1075
1090
1105
1120
1135
1150
1165
1180
1195
Eng
ine
Spe
ed (r
pm)
ExperimentModel
1.00
1.05
1.10
1.15
1.20
1.25
1.30
1.35
1.40
Boo
st P
ress
ure
(bar
)
10.0
20.0
30.0
40.0
50.0
60.0
70.0
80.0
90.0
100.0
Fuel
Pum
p R
ack
Pos
ition
(%)
Figure 3. Predicted and experimental transient results after a ramp increase in load.
SECOND-LAW ANALYSIS RESULTS OF STEADY-STATE OPERATION
Figure 4 shows the development of the rate and cumulative in-cylinder availability terms during the 720 oCA of an engine cycle, at the nominal operating point
(1180 rpm, 75% load). Until the start of combustion, the availability of the cylinder contents increases due to the work offered by the piston during the compression process. As the availability transfer is low during compression, it is obvious that the change of the cylinder availability is almost equal to the work transfer, the irreversibility rate being essentially zero. At the time injection starts, a small fall is observed in the cylinder availability rate due to ignition delay. After the start of combustion, the burning fuel causes a considerable increase in pressure and temperature, and consequently in cylinder availability, heat loss and irreversibility rate. During expansion, the fall of pressure and temperature lead to a considerable decrease in the cylinder availability rate, reaching the first minimum at 280 oCA. After the opening of the exhaust valve, the cylinder availability rate reaches a second minimum due to the exhaust gas leaving the cylinder during the blowdown period. From the respective cumulative terms subdiagram we can calculate total in-cylinder irreversibilities as 14.6% of the fuel chemical availability, with the work produced being 42.24% and the heat loss 17.9%.
0 60 120 180 240 300 360 420 480 540 600 660 720Crank Angle (deg.)
-40.0
-20.0
0.0
20.0
40.0
60.0
80.0
100.0
120.0
In-c
ylin
der
Ava
ilabi
lity
Rat
e Te
rms
(J/d
eg.)
Control VolumeFuelWorkHeat Loss to the WallsIrreversibilities
1180 rpm, 75% Load-2000.0
-1000.0
0.0
1000.0
2000.0
3000.0
4000.0
5000.0
6000.0
7000.0
8000.0
In-c
ylin
der
Cum
ulat
ive
Ava
ilabi
lity
Term
s (J
)
Figure 4. Development of rate and cumulative in-cylinder availability terms during an engine cycle.

0 60 120 180 240 300 360 420 480 540 600 660 720Crank Angle (deg.)
-30.0
-20.0
-10.0
0.0
10.0
20.0
30.0
40.0
50.0
60.0
Con
trol
Vol
ume
(J/d
eg.)
0.0
10.0
20.0
30.0
40.0
50.0
60.0
70.0
80.0
90.0
100.0
Fuel
(J/d
eg.)
0 60 120 180 240 300 360 420 480 540 600 660 720Crank Angle (deg.)
-1.0
0.0
1.0
2.0
3.0
4.0
5.0
6.0
7.0
Hea
t Los
s to
the
Wal
ls (J
/deg
.)
0.0
2.0
4.0
6.0
8.0
10.0
12.0
14.0
16.0
18.0
20.0
Irre
vers
ibili
ties
(J/d
eg.)
Main ChamberPre-Chamber
1180 rpm, 75% Load
Figure 5. Development of main- and prechamber availability rate terms during an engine cycle.
0 60 120 180 240 300 360 420 480 540 600 660 720Crank Angle (deg.)
0.0
500.0
1000.0
1500.0
2000.0
2500.0
3000.0
3500.0
4000.0
Con
trol
Vol
ume
(J)
0.0500.0
1000.01500.02000.02500.03000.03500.04000.04500.05000.05500.06000.0
Fuel
(J)
0 60 120 180 240 300 360 420 480 540 600 660 720Crank Angle (deg.)
-900.0
-600.0
-300.0
0.0
300.0
600.0
900.0
1200.0
1500.0
1800.0
2100.0
Hea
t Los
s to
the
Wal
ls (J
)
0.0
100.0
200.0
300.0
400.0
500.0
600.0
700.0
800.0
900.0
1000.0
Irre
vers
ibili
ties
(J)
Main ChamberPre-Chamber
1180 rpm, 75% Load
Figure 6. Development of main- and prechamber cumulative availability terms during an engine cycle.

Figures 5 (rate) and 6 (cumulative) focus on the development of the main- and prechamber availability properties during the 720 oCA of the same engine cycle. The control volume availability as well as the fuel and the heat losses ones, and the irreversibilities are depicted in these figures. It is obvious how the main chamber incorporates the effect of mass exchange with manifolds (control volume subdiagram), while for the prechamber no important change is observed after the end of combustion. The main chamber presents a greater peak in the availability rate, mainly due to its much greater mass. Although combustion begins in the prechamber, the greatest amount of fuel is clearly burned in the main chamber, where also the dominant air quantity exists affecting significantly its irreversibility amount (it is reminded, that the prechamber volume is 1/64 of the displacement one). Thus, main chamber irreversibilities sum up to 94% of the total. This is aided by the fact that due to the higher pressures and, particularly, temperatures of the prechamber during combustion, the degradation of fuel is lower in the prechamber than in the main chamber. In Ref. [25] it was shown that for the same engine and operating conditions, the cylinder (=main chamber) non-combustion irreversibilities account for 3% of the total. The contribution of the main chamber is expected to be lower if the engine is fitted with a swirl chamber instead of a prechamber, as now only a small amount of fuel is burned in the prechamber.
A similar profile (with the main chamber being the main contributor) holds for the heat losses term. During the early part of compression heat is transferred from the cylinder liner to the working medium leading to negative values of heat loss. Although the prechamber surface is 5% of the total, the higher wall temperatures and, mainly, the turbulent flow in the prechamber which leads to greater values of the Annand constants (Eq.(4)) are responsible for the prechamber contribution of 8% in the total availability term for the heat losses to the cylinder walls.
Figure 7 gives the rate and cumulative flow availability between main- and prechamber. They should be studied together with the corresponding mass exchange graph, as the rate of flow availability is proportional to that at least as regards the positive or negative sign. Around the ‘hot’ TDC we observe the greatest mass flow exchange between the two chambers, which reflects to the greatest rate of the respective flow availability too. The mass flow rate from main- to prechamber is negative almost up to 180 oCA due to compression, while after combustion starts and the prechamber pressure and temperature rise well above the main chamber ones the flow becomes positive. After the opening of the exhaust valve the flow rate is almost zero. It is important to note that the cumulative value of the flow availability transferred from one chamber to the other sums up to 26% of the injected fuel chemical availability due to the high pressures and temperatures of the transferred mass, although for the whole cylinder this term is zero.
0 60 120 180 240 300 360 420 480 540 600 660 720Crank Angle (deg.)
-40
-30
-20
-10
0
10
20
30
40
Mai
n C
ham
ber
to P
rech
ambe
r R
ate
of F
low
Ava
ilabi
lity
(J/d
eg.)
Rate of Flow AvailabilityCumulative Flow AvailabilityMass Exchange
-800
-600
-400
-200
0
200
400
600
800
1000
1200
1400
1600
1800
2000
Mai
n C
ham
ber
to P
rech
ambe
r C
umul
ativ
e Fl
ow A
vaila
bilit
y (J
)
-0.03
-0.02
-0.01
0
0.01
0.02
Mas
s E
xcha
nge
(gr/
deg)
1180 rpm, 75% Load
�
�
�
Figure 7. Development of mass flow, and rate and cumulative flow availability terms between main chamber and prechamber during an engine cycle.
PARAMETRIC STUDY
Due to the small speed range of the engine in hand, all the examined cases to be analyzed below refer to the same nominal engine speed of 1180 rpm, as the previous fundamental second-law analysis.
Figure 8 depicts the effect of the prechamber diameter on the in-cylinder cumulative irreversibilities (again for 75% engine load). The greater the prechamber volume the greater the amount of fuel burned in it, a fact which corresponds accordingly to greater percentage of combustion irreversibilities (the main chamber being almost unaffected). Thus, from the 6% of the nominal case the prechamber irreversibilities rise to 25% of the total for a 40% increase in the prechamber diameter (from 43 to 60mm), while the total irreversibilities have increased by 25%. This is due to the considerable decrease in the level of pressures and temperatures (as depicted in the right-hand subdiagram), resulting in increased degradation of the fuel chemical availability to the “colder” exhaust gases. Consequently, from the second-law perspective, an increase in the prechamber diameter proves unfavorable.
Figure 9 investigates the effect of the static injection timing on the main- and prechamber irreversibilities. Three cases are considered here: the nominal one (static injection timing of 154 oCA bTDC) and also the 144 and 164 oCA bTDC cases. From this figure we can conclude that advancing the static injection timing leads to higher pressures and temperatures in the cylinder, thus decreasing the degradation of the fuel chemical availability which is now transferred to “hotter” gases, decreasing the amount of combustion irreversibilities for

0 60 120 180 240 300 360 420 480 540 600 660 720Crank Angle (deg.)
0.0
100.0
200.0
300.0
400.0
500.0
600.0
700.0
800.0
900.0
1000.0
In-c
ylin
der
Cum
ulat
ive
Irre
vers
ibili
ties
(J)
Main Chamber, Dp=0.043m (nom.)
Prechamber, Dp=0.043m (nom.)
Main Chamber, Dp=0.05m
Prechamber, Dp=0.05m
Main Chamber, Dp=0.06m
Prechamber, Dp=0.06m
0 60 120 180 240 300 360 420 480 540 600 660 720Crank Angle (deg.)
0
10
20
30
40
50
60
70
80
90
Pre
cham
ber
Pre
ssur
e (b
ar)
400
800
1200
1600
2000
2400
Pre
cham
ber
Tem
pera
ture
(K)
1180 rpm, 75% Load
Figure 8. Effect of prechamber diameter on main chamber and prechamber irreversibilities.
0 60 120 180 240 300 360 420 480 540 600 660 720Crank Angle (deg.)
0.0
100.0
200.0
300.0
400.0
500.0
600.0
700.0
800.0
900.0
1000.0
1100.0
1200.0
In-c
ylin
der
Cum
ulat
ive
Irre
vers
ibili
ties
(J)
Main Chamber - St.Inj=154oCA bTDCPrechamber - St.Inj=154oCA bTDCMain Chamber - 144oCA bTDCPrechamber - 144oCA bTDCMain Chamber - 164oCA bTDCPrechamber - 164oCA bTDC
0 60 120 180 240 300 360 420 480 540 600 660 720Crank Angle (deg.)
0
10
20
30
40
50
60
70
80
90
100
Mai
n C
ham
ber
Pre
ssur
e (b
ar)
200
400
600
800
1000
1200
1400
1600
1800
Mai
n C
ham
ber
Tem
pera
ture
(K)1180 rpm, 75% Load
Figure 9. Effect of static injection timing on main chamber and prechamber irreversibilities.
0 60 120 180 240 300 360 420 480 540 600 660 720Crank Angle (deg.)
0.0
100.0
200.0
300.0
400.0
500.0
600.0
700.0
800.0
900.0
1000.0
1100.0
1200.0
1300.0
1400.0
1500.0
In-c
ylin
der
Cum
ulat
ive
Irre
vers
ibili
ties
(J)
Main Chamber - 75% Load (nom.)Prechamber - 75% Load (nom.)Main Chamber - 10% LoadPrechamber -10% LoadMain Chamber - 100% LoadPrechamber - 100% Load
0 60 120 180 240 300 360 420 480 540 600 660 720Crank Angle (deg.)
0.0
0.1
0.2
0.3
0.4
0.5
0.6
0.7
0.8
Cum
ulat
ive
Frac
tion
of F
uel B
urne
d in
Pre
cham
ber
1180 rpm
Figure 10. Effect of engine load on main chamber and prechamber irreversibilities.

both chambers. Of course, an optimization based on the first-law of thermodynamics is needed here in order to establish the optimum injection timing. On the other hand, the percentage of the prechamber irreversibilities compared to the total drops from 6% (nominal case) to 4.5% for the other two static injection timings considered, implying that there is a maximum around the nominal injection timing.
Figure 10 examines the effect of the engine load on the main- and prechamber irreversibilities. It is obvious from the right subdiagram that the lower the engine load the greater the fraction of fuel burned in the prechamber. This leads to a considerable increase in the prechamber irreversibilities which for the 10% load case are as high as 24% of the total, while for the 100% load case drop to 4%. Again, the effect of the increased (in the case of the 100% load case) or the decreased (in the case of the 10% load case) level in pressures and temperatures inside the cylinder affect the final results.
SECOND-LAW ANALYSIS RESULTS OF TRANSIENT OPERATION
In the following diagrams the cylinder, main chamber and prechamber availability response during a transient event will be depicted. In all the cases analysed below the initial engine speed is 1180 rpm, the initial load 10% of the full load and a ramp load increase of 650% (corresponding roughly to a load of 75% at the final engine speed of 1133 rpm) is applied in 0.2 s.
0 5 10 15 20 25 30 35 40 45 50 55 60 65Number of Engine Cycles
-2000.0
-1000.0
0.0
1000.0
2000.0
3000.0
4000.0
5000.0
6000.0
7000.0
8000.0
In-C
ylin
der
Ava
ilabi
lity
Pro
pert
ies
(J)
FuelWorkHeat Loss to Cylinder WallsExhaust Gas from CylinderIn-Cylinder IrreversibilitiesEngine speed
1120
1130
1140
1150
1160
1170
1180
1190
Eng
ine
Spe
ed (r
pm)
Initial Speed 1180rpm, Load-change 10->75%
�
Figure 11. Development of engine speed and in-cylinder cumulative availability terms during a transient event.
Figure 11 shows the response of the various in-cylinder availability terms (fuel work, heat loss to the walls, exhaust gas and irreversibilities) as well as the engine speed as a function of the engine cycles, during the transient event. All of the availability terms are
cumulative values (J) over each cycle (for cylinder No 1 of the engine). The availability term for work and heat loss to the walls increase with the increase in fueling as a function of the engine cycles, because of increases in the charge temperature resulting from increases of the injected fuel quantities and accompanying fuel-air equivalence ratios. Similar results hold for the exhaust gas from the cylinder term and for the irreversibilities term.
Figure 12 focuses on the main chamber and prechamber fuel and irreversibilities response during the transient event. Due to the high mass moment of inertia of the engine-brake configuration there is a slow response to the final conditions, while the main increase in the fuel pump rack position and thus fueling occurs after cycle 20. The slope of the irreversibilities profile for the main chamber is considerably lower than the corresponding fuel one, due to the subsequent increase in the pressures and temperatures associated with the increase in fueling. As regards the prechamber contribution, this is higher at low loads (cf. Figure 10) and decreases as long as the fueling increases reaching a minimum at cycle 24.
0 5 10 15 20 25 30 35 40 45 50 55 60 65Number of Engine Cycles
0.0
500.0
1000.0
1500.0
2000.0
2500.0
3000.0
3500.0
4000.0
4500.0
5000.0
5500.0
6000.0
In-C
ylin
der
Ava
ilabi
lity
Pro
pert
ies
(J)
Fuel - Main ChamberFuel - PrechamberIrreversibilities - Main ChamberIrreversibilities - Prechamber
Initial Speed 1180rpm, Load-change 10->75%
Figure 12. Development of main- and prechamber cumulative burned fuel availability and irreversibilities terms during a transient event.
Figure 13 presents the various in-cylinder availability terms (work, heat loss, main- and prechamber irreversibilities) reduced now to the total injected fuel chemical availability. The reduced main- and prechamber irreversibilities decrease as the transient event develops reaching a minimum of 13.0% of the fuel chemical availability at cycle 24, as a consequence of what was mentioned in the previous figure. In this diagram we also show, for comparative reasons, the

response of the total diesel engine plant irreversibilities term (i.e. including manifolds, turbocharger and aftercooler irreversibilities) as well as the exhaust gas to ambient term. This last term, which refers to the potential for possible work recovery, reaches almost 17.5% of the fuel chemical availability, highlighting its importance, even though a significant amount of the availability in the exhaust gases from the cylinders has already been exploited to drive the turbine. The total irreversibilities and exhaust gas to ambient terms were derived from data made available in Ref. [25].
As is obvious from this figure, the profile of the total diesel engine plant irreversibilities directly follows the main chamber ones being always very close to it, highlighting thus the significant magnitude of the main chamber combustion irreversibilities. Also, the main chamber irreversibilities range from 78% of the total combustion ones (at the low initial load of 10%) reaching almost 97%, at the cycle with the greatest amount of injected fuel.
0 5 10 15 20 25 30 35 40 45 50 55 60 65Number of Engine Cycles
0.0
5.0
10.0
15.0
20.0
25.0
30.0
35.0
40.0
45.0
50.0
Var
ious
Ava
ilabi
lity
Term
s re
duce
d to
Fue
l Ava
ilabi
lity
(%)
WorkHeat Loss to Cylinder WallsExhaust Gas to AmbientTotal Irreversibilities(incl. manifolds, T/C)
Main Chamber IrreversibilitiesPrechamber IrreversibilitiesMain/Total Cylinder Irrevs
0.76
0.80
0.84
0.88
0.92
0.96
1.00
Mai
n C
ham
ber
/ Tot
al C
ylin
der
Irre
vs
Initial Speed 1180rpm, Load-change 10->75%
�
Figure 13. Development of various cumulative availability and irreversibilities terms reduced to the fuel chemical availability, during a transient event.
CONCLUSION
A second-law analysis was performed in an indirect injection, turbocharged diesel engine, with special reference to the development of the main chamber and the prechamber availability terms. The analysis was conducted at both steady-state and transient conditions and revealed the following:
�� Combustion is by far the most important irreversibilities producer. �� The main chamber contributes mostly to the total combustion irreversibilities ranging from 75% at low loads to almost 96% at full load steady-state conditions,
aided by the higher level of pressures and temperatures in the prechamber during combustion. �� An increase in the prechamber volume increases the prechamber total and reduced irreversibilities while also leading to increased total availability destruction. It is, thus, an unfavorable design choice from the second-law perspective. �� The static injection timing does not affect the prechamber irreversibilities significantly, although the main chamber ones increase when retarding injection. �� The transient profile of the main chamber and prechamber irreversibilities roughly follows the steady-state load effect. �� The contribution of the main chamber is expected to be lower if the engine is fitted with a swirl chamber instead of a prechamber. The above study spotted specific engine processes and parameters which, according to the second-law analysis, improve or deteriorate the engine performance by affecting total or main- or prechamber irreversibilities, as for example the prechamber diameter or the static injection timing. A detailed optimization based on both laws of thermodynamic is, however, needed for the establishment of any such aspects.
REFERENCES
1. Benson, R.S. and Whitehouse, N.D., Internal Combustion Engines, Pergamon Press, Oxford, 1979.
2. Horlock, J.H and Winterbone, D.E., The Thermodynamics and Gas Dynamics of Internal Combustion Engines, Vol. II, Clarendon Press, Oxford, 1986.
3. Heywood, J.B., Internal Combustion Engine Fundamentals, McGraw-Hill, New York, 1988.
4. Rakopoulos, C.D. and Hountalas, D.T., “Development and validation of a 3-D multi-zone combustion model for the prediction of DI diesel engines performance and pollutants emissions”, SAE Paper No 981021, SAE Transactions, Journal of Engines, Vol. 107, pp. 1413-1429, 1998.
5. Rakopoulos, C.D. and Hountalas, D.T., “Development of new 3-D multi-zone combustion model for indirect injection diesel engines with a swirl type prechamber”, SAE Paper No 2000-01-0587, SAE Transactions, Journal of Engines, Vol. 109, pp.718-733, 2000.
6. Ciesla, C., Keribar, R. and Morel, T., “Engine/ powertrain/vehicle modeling tool applicable to all stages of the design process”, SAE Paper No 2000-01-0934.
7. Watson, N and Marzouk, M., “A non-linear digital simulation of turbocharged diesel engines under transient conditions”, SAE Paper No 770123, 1977.
8. Winterbone, D.E., Benson, R.S., Mortimer, A.G., Kenyon, P. and Stotter, A., “Transient response of

turbocharged diesel engines”, SAE Paper No 770122, 1977.
9. Watson, N., “Transient performance simulation and analysis of turbocharged diesel engines”, SAE Paper No 810338, 1981.
10. Bazari, Z., “Diesel exhaust emissions prediction under transient operating conditions”, SAE Paper No 940666, 1994.
11. Rakopoulos, C.D. and Giakoumis, E.G., “Simulation and analysis of a naturally aspirated, indirect injection diesel engine under transient conditions comprising the effect of various dynamic and thermodynamic parameters”, Energy Conversion & Management, Vol. 39, pp. 465-484, 1998.
12. Rakopoulos, C.D., Giakoumis, E.G. and Hountalas, D.T., “A simulation analysis of the effect of governor technical characteristics and type on the transient performance of a naturally aspirated IDI diesel engine”, SAE Paper No 970633, SAE Transactions, Journal of Engines, Vol. 106, pp. 905-922, 1997.
13. Moran, M.J., Availability Analysis: A Guide to Efficient Energy Use, Prentice Hall, New Jersey, 1982.
14. Bejan, A., Tsatsaronis, G. and Moran, M., Thermal Design and Optimization, John Wiley and Sons, New York, 1996.
15. Gyftopoulos, E.P. and Beretta, G.P., “Entropy generation rate in a chemically reacting system”, Proceedings ASME-WAM, AES, Vol. 27 and HTD Vol. 228, Anaheim, CA, pp. 329-334, 1992.
16. Dunbar, W.R. and Lior, N., “Sources of combustion irreversibility”, Combustion Science and Technology, Vol. 103, pp. 41-61, 1994.
17. Flynn, P.F., Hoag, K.L., Kamel, M.M. and Primus, R.J., “A new perspective on diesel engine evaluation based on second law analysis”, SAE Paper No 840032, 1984.
18. McKinley, T.L. and Primus, R.J., “An assessment of turbocharging systems for diesel engines from first and second law perspectives”, SAE Paper No 880598, SAE Transactions, Journal of Engines, Vol. 97, pp. 1061-1071, 1988.
19. Van Gerpen, J.H. and Shapiro, H.N., “Second-law analysis of diesel engine combustion”, ASME Transactions, Journal of Engineering for Gas Turbines and Power, Vol. 112, pp. 129-137, 1990.
20. Bozza, F., Nocera, R., Senatore, A., Tuccilo, R., “Second law analysis of turbocharged diesel engine operation”, SAE Paper No 910418, SAE Transactions, Journal of Engines, Vol. 100, pp. 547-560, 1991.
21. Rakopoulos, C.D, Andritsakis E.C. and Kyritsis, D.K., “Availability accumulation and destruction in a DI diesel engine with special reference to the limited cooled case”, Heat Recovery Systems & CHP, Vol. 13, pp. 261-75, 1993.
22. Shapiro, H.N. and van Gerpen, J.H., “Two zone combustion models for second law analysis of internal combustion engines”, SAE Paper No 890823, 1989.
23. Rakopoulos, C.D. and Giakoumis, E.G., “Development of cumulative and availability rate balances in a multi-cylinder turbocharged IDI diesel engine”, Energy Conversion & Management, Vol. 38, pp. 347-369, 1997.
24. Lipkea, W.H. and DeJoode, A.D., “A comparison of the performance of two direct-injection diesel engines from a second-law perspective”, SAE Paper No 890824, 1989.
25. Rakopoulos, C.D. and Giakoumis, E.G., “Availability analysis of a turbocharged diesel engine operating under transient load conditions”, Energy–The international Journal, Vol. 29, No 8, pp. 1085-1104, 2004.
26. Rakopoulos, C.D. and Giakoumis, E.G., “Parametric study of transient turbocharged diesel engine operation from the second-law perspective”, SAE Paper No 2004-01-1679.
27. Rakopoulos, C.D., Giakoumis, E.G., Hountalas, D.T. and Rakopoulos, D.C., “The effect of various dynamic, thermodynamic and design parameters on the performance of a turbocharged diesel engine operating under transient load conditions”, SAE Paper No 2004-01-0926.
28. Whitehouse, N.D. and Way, R.G.B., “Rate of heat release in diesel engines and its correlation with fuel injection data”, Proceedings of the Institution of Mechanical Engineers, Vol. 184, Part 3J, pp. 17-27, 1969-70.
29. Hiroyasu, H., Kadota, T. and Arai, M., “Development and use of a spray combustion modeling to predict diesel engine efficiency and pollutant emissions”, Bulletin JSME, Vol. 26, pp. 569-576, 1983.
30. Annand, W.J.D.,”Heat transfer in the cylinders of reciprocating internal combustion engines”, Proceedings of the Institution of Mechanical Engineers, Vol. 177, pp. 983-990, 1963.
31. Rezeka, S.F. and Henein, N.A., “A new approach to evaluate instantaneous friction and its components in internal combustion engines”, SAE Paper No 840179, 1984.
32. Rakopoulos, C.D., Giakoumis, E.G. and Rakopoulos, D.C., “The effect of friction modeling on the prediction of turbocharged diesel engine transient operation”, SAE Paper No 2004-01-0925.
33. Kouremenos, D.A., Rakopoulos, C.D., Hountalas, D.T. and Kotsiopoulos, P.N., “A simulation technique for the fuel injection system of diesel engines”, Proceedings ASME-WAM, AES Vol. 24, Atlanta, GA, pp. 91-102, 1991.
34. Rakopoulos, C.D., Giakoumis, E.G. and Hountalas, D.T., “Experimental and simulation analysis of the transient operation of a turbocharged multi-cylinder IDI diesel engine”, Energy Research, Vol. 22, pp. 317-332, 1998.
NOMENCLATURE
A: exergy or availability, J

b: flow availability, J/kg bmep: brake mean effective pressure (bar) bsfc: brake specific fuel consumption (gr/kW/h) cp,cv: specific heat capacities, J/kg/K D: cylinder bore, m F: surface, m2 G: (mass) moment of inertia, kg m2, or Gibbs free enthalpy, J h: specific enthalpy, J/kg I: irreversibility, J LHV: fuel lower heating value, kJ/kg m,M: mass, kg m� : mass flow rate, kg/s N: engine speed, rpm p: pressure, Pa Q: heat, J Rs: specific gas constant, J/kg/K S: entropy, J/K s: specific entropy, J/kg K T: absolute temperature, K, or torque,N m t: time, s U: internal energy, J u: specific internal energy, J/kg V: volume, m3 z: fuel pump rack position, m Greek : gas thermal conductivity, W/m/K �: chemical potential, J/kg �: crank angle, deg or rad
�: engine angular velocity, s-1 Subscripts o: atmosphere conditions ch: chemical cyl: cylinder e: engine em: exhaust manifold f: fuel fb: burning fuel fr: friction g: gas im: inlet manifold i: any species O2, N2, CO2, H2O, or injected j: any chamber or cylinder L: heat loss or load m: main chamber mp: main to prechamber p: prechamber w: wall or work Abbreviations oCA: degrees of crank angle aTDC: after top dead centre bTDC: before top dead centre aBDC: after bottom dead centre bBDC: before bottom dead centre DI: direct injection IDI: indirect injection rpm: revolutions per minute