Embed Size (px)
Citation preview

Paper 02-059 Second International Airports Conference: Planning, Infrastructure & Environment
SÃO PAULO – SP - BRAZIL● AUGUST 2- 4, 2006
1
SECOND INTERNATIONAL AIRPORTS CONFERENCE: PLANNING, INFRASTRUCTURE & ENVIRONMENT
SÃO PAULO – SP – BRAZIL ● AUGUST 2-4, 2006
GPR INVESTIGATIONS FOR THE OPTIMIZATION OF RUNWAY MAINTENANCE
Ezio Santagata Full Professor, Department of Hydraulics, Transportation and Civil Infrastructures Politecnico di Torino Corso Duca degli Abruzzi, 24 10129 – Torino – Italy [email protected] Stefano Damiano Barbati Ph.D., Department of Hydraulics, Transportation and Civil Infrastructures Politecnico di Torino Corso Duca degli Abruzzi, 24 10129 – Torino – Italy [email protected] Andrea Graziani Ph.D., Department of Hydraulics and Transportation Infrastructures Università Politecnica delle Marche Via Brecce Bianche 60131 – Ancona – Italy [email protected]

Paper 02-059 Second International Airports Conference: Planning, Infrastructure & Environment
SÃO PAULO – SP - BRAZIL● AUGUST 2- 4, 2006
2
ABSTRACT The Authors present the results obtained during the experimental investigations carried out to support the design of rehabilitation works on runway 04-22 of the “Raffaello Sanzio” Airport of Falconara (Ancona), Italy. Due to the lack of detailed technical information on the existing pavement, it was considered essential to perform both intrusive (coring, Dynamic Cone Penetrometer) and non-intrusive (Heavy Falling Weight Deflectometer, Ground Penetrating Radar) field tests. Among the others, GPR data were especially useful. They were employed to build a complete 3D mapping of the runway, the results of which matched extremely well with those of other investigations and with the historical data available in the airport. Furthermore, GPR data allowed the Authors to carry out a detailed analysis of the structural behavior of the pavement according to a conventional back-calculation approach based on the definition of homogeneous sections and by following a more refined procedure based on single-point measurements. Along the runway it was possible to isolate zones characterized by the presence of different pavement types and by a corresponding variation of structural performance. As a consequence, the design of maintenance works was fine-tuned in order to remain within the allocated budget while still guaranteeing the required levels of expected performance. KEY WORDS Airport maintenance, airport pavements, Ground Penetrating Radar (GPR), HWD back-calculation

Paper 02-059 Second International Airports Conference: Planning, Infrastructure & Environment
SÃO PAULO – SP - BRAZIL● AUGUST 2- 4, 2006
3
INTRODUCTION The “Raffaello Sanzio” Airport of Falconara (Ancona) is located in Central Italy, very close (4 km) to the Adriatic coast and 7 km north of the city of Ancona. Initially part of a military installation, after its conversion to commercial and civil aviation use, it has been characterized for a long time by low traffic volumes to serve the local community. However, in recent times, as a result of the general increase in airborne traffic in Italy, its role has radically changed and is nowadays considered as an infrastructure of strategic importance for Central Italy. The airport has a single runway (RWY 04-22), oriented in the NE-SW direction, which currently has a total length of 2,990 m and a width of 45 m (Figure 1). The Aerodrome Reference Code is 4D (1). The pavement structure is of the flexible type, with the exclusion of the initial and final part, where it is composed of concrete slabs for a length of 375 and 405 m respectively at runway ends 04 and 22. Lateral shoulders are 7.5 m wide, with a bituminous surfacing.
Figure 1. General lay-out of the “Raffaello Sanzio” airport During the period of commercial use of the airport, pavement maintenance was carried out in order to guarantee at all times full serviceability of the only available runway. However, maintenance needs and priorities were usually identified according to engineering judgment, and no specific investigation was devoted to the thorough understanding of the structural performance of the pavement. As a result of the continuous traffic increase and of the frequently observed pavement distresses, in November 2004 the local Airport Authority, Aerdorica S.p.A., realized that it was necessary to finally address a number of issues related to the performance of the runway pavement. Thus, technical support was sought from the Experimental Interuniversity Road and Airport Research Centre (CIRS), which was requested to assess the present structural

Paper 02-059 Second International Airports Conference: Planning, Infrastructure & Environment
SÃO PAULO – SP - BRAZIL● AUGUST 2- 4, 2006
4
condition of the pavement and to define rehabilitation strategies compatible with the available maintenance budget. In this paper the Authors give a general overview of the experimental activities planned and carried out by CIRS on the runway pavement. These included both field and laboratory tests with a prevailing use of non destructive techniques which are compatible with scheduled runway operations. In particular, a special emphasis was placed upon the use of the Ground Penetrating Radar (GPR), which by means of proper data processing proved to give a significant contribution for a reliable representation of actual pavement performance and for the optimal allocation of maintenance resources. AVAILABLE TECHNICAL INFORMATION Unfortunately, from the very beginning of the project it was clear that technical information on the runway pavement was extremely scarce. This was due to the fact that most of the existing records and documents, and in particular those relative to the design and construction phases, presumably went lost when the airport was opened to commercial and civil use. Moreover, maintenance records were seldom stored for future reference and usually consisted in a brief description of the type of work (e.g. resurfacing, patching, strengthening) and of the corresponding expenses. According to the available design cross-sections, the original runway pavement of the military base had a width of 30 m and was composed of three layers over the existing natural subgrade: an unbound granular foundation (30 cm), a bitumen-stabilized base layer (15 cm) and a bituminous surfacing (5-8 cm). In the terminal parts, the rigid pavement was described as composed of an unbound granular foundation (30 cm) and of concrete slabs (20 cm). In the early 80’s the pavement was subjected to important rehabilitation works which included the widening of the runway (brought to 45 m), the construction of paved shoulders (7.5 m wide) and the structural rehabilitation of the distressed pavement along a central strip of 12 m of width for the whole runway length. Both for the widening and for the rehabilitation of the central strip, a semi-rigid pavement structure was considered adequate. The new pavement was constituted by a bituminous surface course, a lean concrete base and a natural gravel unbound subbase. The height of the pavement surface was increased by approximately 20 cm when compared to the original one. Other design documents, dated 1984, indicate that the runway ends were subjected to strengthening with the construction of new pavements composed of a bottom granular anti-capillary layer (20 cm), a cement-stabilized foundation (15 cm) and thicker concrete slabs (30 cm). Traffic data, which are available since 1988, show that there has been a constant increase of the number of movements (departures and arrivals), passengers and payload. In 2004 the number of total departures of major aircrafts, to which most of the pavement damage can be attributed (with a maximum take-off weight greater than 14 t), was equal to 6,132, with a total sum of maximum take-off weight equal to 247,412 t.

Paper 02-059 Second International Airports Conference: Planning, Infrastructure & Environment
SÃO PAULO – SP - BRAZIL● AUGUST 2- 4, 2006
5
EXPERIMENTAL INVESTIGATION Bearing capacity The bearing capacity survey was carried out by means of a Heavy Falling Weight Deflectometer (HWD), which is considered as an appropriate equipment for structural investigations on airport facilities. It is frequently used to assess the quality of construction and the conformity to design requirements; moreover, it can support maintenance decisions especially if repeatedly used as a monitoring tool within a pavement management system (PMS). The HWD survey was planned in accordance with the assessment scheme recommended by the Italian Aviation Authority (ENAC) by means of a specific Technical Circular (2). Thus, tests were performed on the whole runway length along six distinct alignments (located at 4, 9 and 15 m from the centerline, on both sides) with a frequency which was reduced while moving away from the centerline (tests every 50, 100 and 200 m). Supplementary tests were necessary on the rigid pavements for the evaluation of the structural conditions of the slabs and of the load-transfer efficiency of joints. During the HWD survey, temperature readings were made at three different depths in the pavement. Tests were carried out during a single night by employing a standard Dynatest HWD 8082 with a 30 cm diameter loading plate, which was operated at a nominal vertical load of 160 kN. The adopted geophone configuration was composed of 9 sensors located at 0, 300, 600, 900, 1,200, 1,500, 1,800, 2,100 and 2,400 mm from the center of the loading plate. The results derived from HWD tests were subjected to an initial processing the goal of which was to locate structurally homogeneous areas. This was done by subjecting the deflection bowl data to three different analysis procedures carried out by considering data sets of increasing size (single test points, longitudinal alignments, homogeneous sections). For each test point the measured deflection data were normalized to the reference loading of 160 kN and thereafter used for the calculation of the Surface Curvature Index (SCI) which does not require information on the actual thickness of pavement layers. The set of normalized HWD data collected along each alignment were analyzed in order to define homogeneous sections along the runway longitudinal direction. After checking for the existence of possible outlier values, which should be removed if derived from inaccuracies of data acquisition or testing procedure, normalized maximum deflection and corresponding cumulative sum profiles were derived from the valid data. Deflection and cumulative sum profiles proved that the runway was characterized by the presence of areas with significantly different structural response under loading, either because of differences in the composition of the pavement structure or because of different levels of structural damage. As an example, this is shown in Figure 2 for the central band of the runway, where the data collected along the two alignments located at 4 m from the centerline (on both sides) have been simultaneously plotted. The existence of seven distinct areas characterized by different structural conditions is extremely clear and is graphically highlighted on the profiles.

Paper 02-059 Second International Airports Conference: Planning, Infrastructure & Environment
SÃO PAULO – SP - BRAZIL● AUGUST 2- 4, 2006
6
2.102
2.351
1.100
1.549
1.801
2.074
2.325
1.125
1.526
1.825
0
2000
4000
6000
8000
10000
12000
0.400 0.600 0.800 1.000 1.200 1.400 1.600 1.800 2.000 2.200 2.400 2.600 2.800
Distance [km]
Cum
ulat
ive
Sum
Alignment -4 m
Alignment +4 m
from 0+390 to 1+110 from 1+110 to 1+535 1+535 to 1+810 1+810 to 2+080 from 2+080 to 2+340
from 2+3402+000 2+080
Figure 2. Cumulative sum profile obtained from HWD maximum deflection data
The data collected in each homogeneous section were treated statistically for the calculation of deflection bowls characterized by 85% reliability: as described later in the paper, linear elastic back-calculation was then carried out by referring to pavement layer thicknesses derived from GPR surveys. Layer thicknesses As indicated previously, the 04-22 runway is characterized by a great variety of materials and thicknesses due to past maintenance and rehabilitation activities. Given the scarce amount of available information, a detailed investigation on the composition of the actual pavement structures was deemed necessary. Therefore, a considerable importance was given to GPR surveys, the results of which were integrated with results obtained from Dynamic Cone Penetrometer (DCP) tests and from measurements made on cores extracted from the pavement. In the case of GPR surveys ENAC recommendations indicate the need of performing measurements along at least five longitudinal alignments matching those used to locate HWD test points (2). However, given the expected complexity of the pavement structure, the runway was scanned in much more detail by operating the GPR equipment along 17 longitudinal and 12 transverse alignments, the positions of which were defined in order to cover the entire runway and to intersect points selected for DCP tests or coring. The GPR equipment employed during the investigation is composed of a GSSI air-launched horn antenna (1 GHz) connected with a dual-channel data acquisition unit. The antenna was mounted on a standard vehicle at a height from the pavement equal to 50 cm. Tests were carried out at a speed of approximately 20 km/h. Preliminary analysis of the grey-scale radargrams showed the existence of a multitude of dielectric interfaces within the pavement structure: this confirms the fact that the pavement has been repeatedly subjected to maintenance over time (Figure 3). In the specific case of the runway end slabs, a distinct interface was detected at mid-height: as proven by coring this was due to a two-stage construction during which a polyethylene sheet interlayer was used. In all cases, for the sake of simplicity it was decided to carry out pavement layering by grouping together materials of the same type (e.g. bituminous, cement-bound, unbound).

Paper 02-059 Second International Airports Conference: Planning, Infrastructure & Environment
SÃO PAULO – SP - BRAZIL● AUGUST 2- 4, 2006
7
Figure 3. Typical grey-scale radargram in which multiple interfaces are well visible Regardless of the type of pavement structure, in all the runway area the position of the subbase-subgrade interface could not be detected due to the frequency of the employed antenna (1 GHz) and as a result of three distinct physical phenomena: the presence of water, the existence of a cement-bound base which has damping effects on the GPR signal, and the contamination of the unbound subbase with subgrade fines (Figure 4). It should also be pointed out that the preliminary interpretation of the data collected along transverse alignments proved to be especially complicated as a result of the presence of many discontinuities (e.g. construction joints, longitudinal cracks).
Figure 4. Grey-scale radargrams in which contamination and water effects are well visible For a detailed interpretation of the GPR data the Authors integrated the equipment software (RADAN) with specific routines implemented on standard datasheets. Time-delay and amplitude raw data recorded during test acquisition were subjected to preliminary filtering based on the identification of interlayers on the standard output grey-scale radargrams. Scans were available every 28 cm and were carefully referenced to the runway by adopting a common longitudinal axis, the origin of which was fixed at the 04 end. Semi-delay values were then calculated for each distinct material through which the GPR signals propagated. In order to convert the semi-delay data to thickness values, for each material the characteristic propagation speed of the GPR signal should be known. However, while in standard GPR data processing average speed values are assumed for each material type, in the case of a structure
true interfaces
contamination
water
contamination
multitude of interfaces
pavement surface

Paper 02-059 Second International Airports Conference: Planning, Infrastructure & Environment
SÃO PAULO – SP - BRAZIL● AUGUST 2- 4, 2006
8
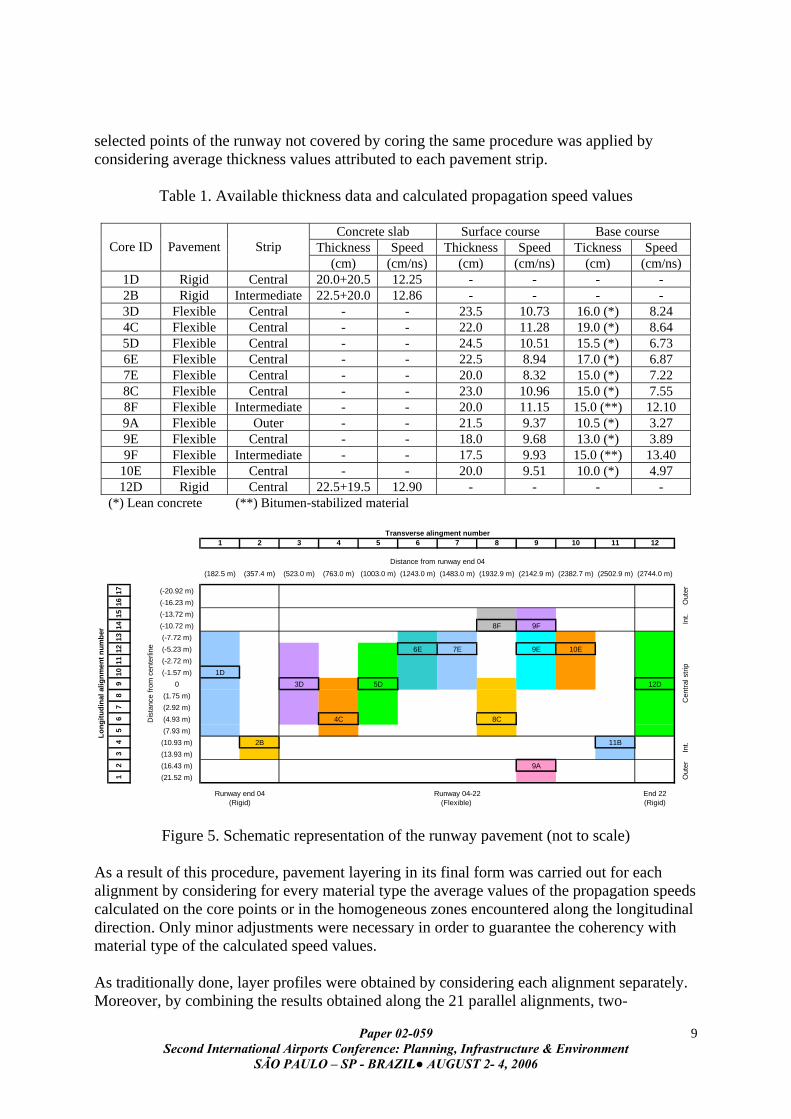
as complex as the 04-22 runway a more detailed analysis was considered necessary. Thus, the thickness data derived from cores extracted from the pavement were used to calculate reference propagation speeds. Propagation speed values were obtained for each material by averaging the semi-delay data corresponding to 20 scans centered on the position of each core, which correspond to a longitudinal extension of 5.6 m. A summary of the available thickness data and of the calculated speed values is given in Table 1. It can be observed that for each material type variations of propagation speed may be non negligible due to the fact that the dielectric properties of pavement materials are strongly dependent upon a number of factors (e.g. composition, water content, damage, ageing). It should also be pointed out that the visual inspection of the cores revealed the existence of a bitumen-stabilized base layer along alignments 4 and 14, while elsewhere the base was observed to be made of lean concrete. These observations, which were confirmed by GPR transverse profiles, are coherent with the previously summarized technical information and maintenance records: it was therefore concluded that the runway pavement could be divided, for ease of description and evaluation, into five adjacent strips. The pavement structure of the central strip (16 m wide) and the two outer ones (each approximately 8.5 m wide) clearly derives from the one built in the early 80’s as part of the major strengthening and widening project: it is therefore characterized by the presence of a bituminous surfacing (variable in thickness and composed of 3 to 6 sub-layers of different type and age), a lean concrete base and an unbound granular subbase. The intermediate strips, which extend on both sides of the runway between 8 and 14 m from the centerline, are representative of the original pavement structure of the military base: in fact, under the multi-layer bituminous surfacing they have a bitumen-stabilized base and an unbound subbase. It should be pointed out that by referring to such a scheme, HWD alignments are evenly distributed on the various strips: two on the central one (± 4 m), two on the intermediate ones (± 9 m) and two on the outer ones (± 15 m). GPR alignments are also well distributed, with four alignments on the outer and intermediate strips and eight alignments on the central one. A schematic representation of the runway pavement is given in Figure 5. It contains information on the position of the abovementioned strips, of the GPR alignments and, by means of core identification codes, of the points were cores were taken from the pavement. As explained in detail further on in the paper, the scheme also shows, in color, the influence zones which were associated to each core in order to obtain propagation speed data on an extended portion of the pavement. The available propagation speed data shown in Table 1 offer a description of the dielectric properties of the existing materials in a number of points which is certainly insufficient to be representative of the whole runway pavement. The Authors therefore devised a procedure to generate a wider array of propagation speed values on which to base the successive layering. An influence zones was associated to each core sample as depicted in Figure 5 (different colors). Within each zone, sets of propagation speed values were calculated along the various alignments by assuming a constant thickness of the layers and by performing local scan processing (on 20 semi-delay data points) according to the previously described method. In
Paper 02-059 Second International Airports Conference: Planning, Infrastructure & Environment
SÃO PAULO – SP - BRAZIL● AUGUST 2- 4, 2006
9
selected points of the runway not covered by coring the same procedure was applied by considering average thickness values attributed to each pavement strip.
Table 1. Available thickness data and calculated propagation speed values
Concrete slab Surface course Base course Thickness Speed Thickness Speed Tickness Speed
Core ID
Pavement
Strip
(cm) (cm/ns) (cm) (cm/ns) (cm) (cm/ns) 1D Rigid Central 20.0+20.5 12.25 - - - - 2B Rigid Intermediate 22.5+20.0 12.86 - - - - 3D Flexible Central - - 23.5 10.73 16.0 (*) 8.24 4C Flexible Central - - 22.0 11.28 19.0 (*) 8.64 5D Flexible Central - - 24.5 10.51 15.5 (*) 6.73 6E Flexible Central - - 22.5 8.94 17.0 (*) 6.87 7E Flexible Central - - 20.0 8.32 15.0 (*) 7.22 8C Flexible Central - - 23.0 10.96 15.0 (*) 7.55 8F Flexible Intermediate - - 20.0 11.15 15.0 (**) 12.10 9A Flexible Outer - - 21.5 9.37 10.5 (*) 3.27 9E Flexible Central - - 18.0 9.68 13.0 (*) 3.89 9F Flexible Intermediate - - 17.5 9.93 15.0 (**) 13.40
10E Flexible Central - - 20.0 9.51 10.0 (*) 4.97 12D Rigid Central 22.5+19.5 12.90 - - - -
(*) Lean concrete (**) Bitumen-stabilized material
1 2 3 4 5 6 7 8 9 10 11 12
(182.5 m) (357.4 m) (523.0 m) (763.0 m) (1003.0 m) (1243.0 m) (1483.0 m) (1932.9 m) (2142.9 m) (2382.7 m) (2502.9 m) (2744.0 m)
17 (-20.92 m)
16 (-16.23 m)
15 (-13.72 m)
14 (-10.72 m) 8F 9F
13 (-7.72 m)
12 (-5.23 m) 6E 7E 9E 10E
11 (-2.72 m)
10 (-1.57 m) 1D
9 0 3D 5D 12D
8 (1.75 m)
7 (2.92 m)
6 (4.93 m) 4C 8C
5 (7.93 m)
4 (10.93 m) 2B 11B
3 (13.93 m)
2 (16.43 m) 9A
1 (21.52 m)
End 22(Rigid)
Transverse alingment number
Long
itudi
nal a
lignm
ent n
umbe
r
Distance from runway end 04
Dis
tanc
e fro
m c
ente
rline
Out
erIn
t.C
entra
l stri
pIn
t.O
uter
Runway end 04(Flexible) (Rigid)
Runway 04-22
Figure 5. Schematic representation of the runway pavement (not to scale)
As a result of this procedure, pavement layering in its final form was carried out for each alignment by considering for every material type the average values of the propagation speeds calculated on the core points or in the homogeneous zones encountered along the longitudinal direction. Only minor adjustments were necessary in order to guarantee the coherency with material type of the calculated speed values. As traditionally done, layer profiles were obtained by considering each alignment separately. Moreover, by combining the results obtained along the 21 parallel alignments, two-

Paper 02-059 Second International Airports Conference: Planning, Infrastructure & Environment
SÃO PAULO – SP - BRAZIL● AUGUST 2- 4, 2006
10
dimensional interface depth maps were also built as shown in Figures 6 and 7, which respectively refer to the surface-base and base-subbase interfaces.
0 100 200 300 400 500 600 700 800 900 1000 1100 1200 1300 1400 1500 1600 1700 1800 1900 2000 2100 2200 2300 2400 2500 2600 2700 2800 21.52
10.93
2.92
-1.57
-7.72
-16.23
[m]
[m]
0.55-0.6 0.5-0.55 0.45-0.5 0.4-0.45 0.35-0.4 0.3-0.35 0.25-0.3 0.2-0.25 0.15-0.2 0.1-0.15 0.05-0.1 0-0.05
Figure 6. Two-dimensional surface-base interface depth map
0 100 200 300 400 500 600 700 800 900 1000 1100 1200 1300 1400 1500 1600 1700 1800 1900 2000 2100 2200 2300 2400 2500 2600 2700 2800 21.52
10.93
2.92
-1.57
-7.72
-16.23
[m]
[m]
0.55-0.60 0.50-0.55 0.45-0.50 0.40-0.45 0.35-0.40 0.30-0.35 0.25-0.30 0.20-0.25 0.15-0.20 0.10-0.15 0.05-0.10 0.00-0.05
Figure 7. Two-dimensional base-subbase interface depth map As shown in Figure 6, most of the runway has a bituminous surfacing with a total thickness comprised between 20 and 25 cm. However, it can be distinctly seen that this thickness is smaller along most of the intermediate strips and across the whole runway in an extended area towards end 22.
Paper 02-059 Second International Airports Conference: Planning, Infrastructure & Environment
SÃO PAULO – SP - BRAZIL● AUGUST 2- 4, 2006
11
The mapping of the base-subbase interface (or of the slab-base interface) reveals a greater variability and cannot be considered uniform within the various strips (Figure 7). In general terms it can be observed that the base interface tends to be less deep towards the runway sides; moreover, such a trend is also detected in the final part of the runway where the bituminous surfacing has been recorded as thinner. As expected, the thickness of the slabs is much more homogeneous, of the order of 40 cm. Longitudinal pavement layering carried out with the procedures described above was checked for coherency with the data collected during GPR surveys performed in the transverse direction. This was done by considering transverse alignments located in correspondence of the cores which were used for the calculation of propagation speed values. Due to a difference in the frequency of acquisition, in the transverse direction semi-delay values were averaged on 15 scans centered on each point of coring, which correspond to a transverse length of 1.96 m. Unfortunately, the propagation speed values calculated in the transverse direction showed a degree of correlation with longitudinal values which was extremely variable. This is due to the fact that in the transverse direction a greater number of discontinuities and of material changes are met: as a result, GPR signals are disturbed and their speed is not always representative of a single material. As an example, by comparing the semi-delay values obtained for the bituminous surfacing in all the longitudinal-transverse intersecting points it was observed that the data are extremely dispersed even though they are centered on the line of equality. However, it was noted that the dispersion deviates from the line of equality in the case of the data points collected on the intermediate strips: this is due to the fact that these strips are extremely thin (only 4 m wide) and therefore transverse readings made on a base of 1.96 m are greatly influenced by longitudinal joints. STRUCTURAL EVALUATION Structural evaluation of the runway pavement was carried out by subjecting the previously mentioned HWD data to linear elastic back-analysis. In this process, the thickness of the surface and base layers were extracted from the interface profiles derived from the GPR survey. However, for all pavement types the thickness of the unbound granular subbase had also to be assigned in order to model structural behavior adequately. This information was obtained from DCP tests: for the central strip a variable subbase-subgrade interface depth was recorded, comprised between 65 and 90 cm, whereas in the case of the intermediate and outer strip a constant depth of 65 cm could be assumed in the back-analysis. HWD data were processed in two different ways: by working on the previously mentioned homogenous sections and by considering individual test points. Following the priorities requested by the Airport Authority, structural evaluation was limited to the flexible portion of the runway. Back-calculation carried out on homogeneous sections was based on deflection bowls characterized by 85% reliability and on average thickness values of the layers. The software program employed for this analysis was ELMOD, in which a four-layer system was considered (surface, base, subbase and subgrade). In the case of single-point processing, the analysis was carried out by considering test points located every 200 m along each alignment, with a resulting grid of 72 nodes (12 positions × 6

Paper 02-059 Second International Airports Conference: Planning, Infrastructure & Environment
SÃO PAULO – SP - BRAZIL● AUGUST 2- 4, 2006
12
alignments) distributed along the flexible portion of the runway. In each point the actual pavement structure derived from GPR interpretation was considered. Elastic moduli were obtained by using the BAKFAA software, developed by the Federal Aviation Administration (FAA). The pavement was simply described as a three-layer system, by grouping together the unbound subbase with the existing subgrade. Since the program considers only the input data derived from 7 sensors, the values measured from the sixth and eighth were discarded. Figures 8, 9 and 10 give a three-dimensional representation of the distribution over the runway of the elastic moduli calculated according to the above outlined approaches. In both analyses the moduli values of the bituminous surface course were reduced to a common reference temperature of 20°C (Figure 8); since four layers were considered in the back-analysis based on homogeneous sections, in order to compare the data derived from the two processing methods, equivalent subbase-subgrade moduli were calculated based on layered-elastic analysis (Figure 10). As expected, the two approaches give a different representation of the structural behavior of the runway. In particular, it can be observed that by modeling the pavement by means of homogeneous sections, only minor variations of the moduli of the surface and base course are obtained (i.e. flatter moduli profiles). Moreover, moduli values tend to be significantly smaller than those derived from single point analysis: this is due to the fact that deflection bowls with 85% reliability have been considered in the homogeneous sections. The single-point moduli profiles highlight the peculiar response of the intermediate strips: the older pavement, presumably damaged mainly by environmental effects (e.g. water, as proven by transverse GPR profiles), is characterized by moduli values which are significantly lower, both for the surface and the base course, than those of the adjacent strips. In the case of the base course this is also due to the fact that, as mentioned previously, in the intermediate strip it is made of bitumen-stabilized material (not of lean concrete). It can also be observed that when considering the initial part of the pavement (in the first 1,200 m starting from end 04) there are only minor differences between the central and outer strips. Such conclusions cannot be easily derived from the profiles obtained from the modeling based on homogeneous sections. Finally, it should be stressed that the analysis of the single-point profiles shows that in the central strip there is a progressive and significant decrease of the moduli values while moving from end 04 to end 22. This observation is coherent with the results obtained from GPR and DCP data which revealed that the thickness of all pavement layers decreases while approaching runway end 22 (Figures 6 and 7), with a corresponding increase of load-induced damage. The comparative analysis of the subbase-subgrade profiles (Figure 10) shows that a completely different description of the available bearing capacity is obtained from the two adopted approaches. In the modeling based on homogeneous sections, which flattens out the moduli profiles of the surface and base course, most of the structural variability is attributed to the subgrade. In the central strip there is a progressive decrease of the estimated elastic modulus from end 04 to end 22; outer strips have a relatively constant and high stiffness; intermediate strips are characterized by an extremely low bearing capacity.

Paper 02-059 Second International Airports Conference: Planning, Infrastructure & Environment
SÃO PAULO – SP - BRAZIL● AUGUST 2- 4, 2006
13
Such observations are not fully coherent with the results obtained from the single-point profile. In fact, while it is confirmed that the outer and central strip are almost equivalent, a relatively uniform bearing capacity is highlighted on all the runway area, with a non negligible reduction which occurs only in the terminal part of the central strip (towards end 22).
400
600
800
1,000
1,200
1,400
1,600
1,800
2,000
2,200
2,400
2,600
15.00 9.00
4.00 -4.00
-9.00 -15.00
10
2,010
4,010
6,010
8,010
10,010
12,010
(MPa)
(m)
(m)
Figure 8. Elastic moduli of the surface course
400
600
800
1,000
1,200
1,400
1,600
1,800
2,000
2,200
2,400
2,600
15.00 9.00
4.00 -4.00
-9.00 -15.00
102,0104,0106,0108,01010,01012,01014,01016,01018,01020,01022,01024,01026,01028,01030,010
(MPa)
(m)
(m)
Figure 9. Elastic moduli of the base course
400
600
800
1,000
1,200
1,400
1,600
1,800
2,000
2,200
2,400
2,600
15.00 9.00
4.00 -4.00
-9.00 -15.00
10
2,010
4,010
6,010
8,010
10,010
12,010
(MPa)
(m)
(m)
Single-point analysis
Analysis based on homogeneous sections
400
600
800
1,000
1,200
1,400
1,600
1,800
2,000
2,200
2,400
2,600
15.00 9.00
4.00 -4.00
-9.00 -15.00
102,0104,0106,0108,01010,01012,01014,01016,01018,01020,01022,01024,01026,01028,01030,010
(MPa)
(m)
(m)
Single-point analysis
Analysis based on homogeneous sections

Paper 02-059 Second International Airports Conference: Planning, Infrastructure & Environment
SÃO PAULO – SP - BRAZIL● AUGUST 2- 4, 2006
14
400
600
800
1,000
1,200
1,400
1,600
1,800
2,000
2,200
2,400
2,600
15.00 9.00
4.00 -4.00
-9.00 -15.00
10
60
110
160
210
260
310
360
410
460
510
(MPa)
(m)
(m)
Figure 10. Elastic moduli of the subbase-subgrade system CONCLUSIONS Based on the results of the investigations described in the previous paragraphs, it may be concluded that GPR surveys represented a key element in the evaluation of the pavement of runway 04-22. GPR data, which required a careful interpretation also based on the information derived from cores extracted from the pavement, yielded a detailed description of the existing layers and allowed the Authors to correctly perform back-analysis activities. It was also observed that the modeling of structural behavior can lead to different results depending upon the adopted approach: in the specific case of runway 04-22 it seems that by carrying out a single-point analysis, a more reliable description can be obtained. The results synthesized in this paper served as the basis for the design of maintenance activities on runway 04-22. The optimal balance between pavement performance and budget limitations was achieved focusing on the central strip of the runway, where two types of maintenance activities were selected. In the first 1,430 m starting from runway end 04, where pavement structural conditions are still satisfactory, it was decided to proceed only with wearing course replacement (3 cm inlay). In the remaining 800 m, where traffic loadings produced major damage to the bitumen-bound and lean-concrete layers, complete pavement reconstruction was considered necessary. However, in order to perform this rehabilitation without the complete closure of the runway, a further refinement of the design process, involving issues related to the operational activities of the airport, is certainly needed. Details of the procedures, investigations and calculations associated with this second design phase will be given elsewhere (3). REFERENCES (1) Aerodromes. Annex 14, Aerodrome Design and Operations, Vol. 1, ICAO, 2004. (2) Acquisizione dei Dati Tecnici, Geometrici e Strutturali delle Infrastrutture di Volo,
ENAC, Roma, 2001. (3) Paper in preparation.
400
600
800
1,000
1,200
1,400
1,600
1,800
2,000
2,200
2,400
2,600
15.00 9.00
4.00 -4.00
-9.00 -15.00
10
60
110
160
210
260
310
360
410
460
510
(MPa)
(m)
(m)
Analysis based on homogeneous sections
Single-point analysis