Embed Size (px)
Citation preview
ELSEVIER
November 1997
Optical Materials 8 (1997) 243-247
PTIC£L
Second harmonic generation investigation on electric poling effects in fused silica
Jianhua Xu a,*, Xingze Lu a, Hongbing Chen b, Liying Liu a, Wencheng Wang a, Congshan Zhu b, Fuxi Gan b
a State Key Joint Laboratory for Materials Modification by Laser, Ion and Electron Beams, Department of Physics, Fudan Universi~, Shanghai 200433, China
b Shanghai Institute of Optics and Fine Mechanics, Chinese Academy of Sciences, Shanghai 201800, China
Received 6 May 1997; revised 2 June 1997; accepted 8 July 1997
Abstract
The influence of electric poling conditions on the optical nonlinearity of fused silica has been investigated by the second harmonic generation (SHG) technique. The SHG intensity of the poled fused silica increased monotonically with increasing the poling voltage or poling time, and reached a maximum at a poling temperature of T = 250°C, but the SHG intensity decreased quickly as the thermal erasure time increased. The experimental results have been explained using an electric field induced dipole orientation model. © 1997 Elsevier Science B.V.
Keywords: Fused silica; Electrical poling; Second harmonic generation (SHG)
I. Introduct ion
Macroscopic second harmonic generation (SHG) in materials with inversion symmetry such as glasses should be forbidden according to nonlinear optics. However, in 1986 Osterberg et al. [1] and later Krol et al. [2,3] reported the efficient second harmonic generation from GeO2-doped SiO 2 glass fibers; CeO 2- or Eu2Oa-doped aluminosilicate glass fibers after these fibers were illuminated by intense in- frared laser beams. They attributed the observed SHG to the broken inversion symmetry by the DC field due to the interference of the incident funda- mental and frequency-doubled laser beams in glasses.
* Corresponding author.
On the other hand, in 1991 Myers et al. [4] found that a large second order nonlinearity could be in- duced in fused silica by an electric-field poling process at elevated temperatures. This electric-field induced second-order nonlinearity was also discov- ered in sol-gel-derived SiO 2 glass [5] and SiO 2 glass films [6]. Those discoveries generate consider- able impact on the current electronic or photonic devices, which are based mainly on semiconductor materials.
Electrically poled fused silica with large X (z) ( ~ 1 p m / V , n "~ ,,(2) v.~a22 for LiNbO 3) have potential applications in fiber optics industry [4], it is neces- sary to understand the relation between the second order nonlinearity and poling conditions. In this pa- per, we report the influence of the poling conditions,
00925-3467/97/$17.00 © 1997 Elsevier Science B.V. All rights reserved. PH S0925-3467(97)00054-2
244 Jianhua Xu et al. / Optical Materials 8 (1997) 243-247
including poling temperature, voltage, and time dura- tion, on the resultant second order nonlinearity of fused silica as well as thermal erasure time.
2. Experiment
2.1. Sample preparation
The samples used in the experiments are commer- cial JGS~ fused silica with an OH- concentration of 300 ppm (parts in 106).
Before poling, the samples were polished to opti- cal grade and cut to 1.6 mm in thickness and 20 mm in diameter. We heated the samples to 150-450°C in an oven, whose temperature could be controlled, and applied a high voltage across the sample plates for 0.5 to 6 h. The voltage was varied from 1.0 to 8.0 kV. The diameter of the anode and cathode were 10 and 30 mm, respectively. Both electrodes were made of stainless steel and closely attached the samples with the same central axis. After poling, the samples were cooled to room temperature, and the high volt- age was removed from the samples.
2.2. SHG measurement
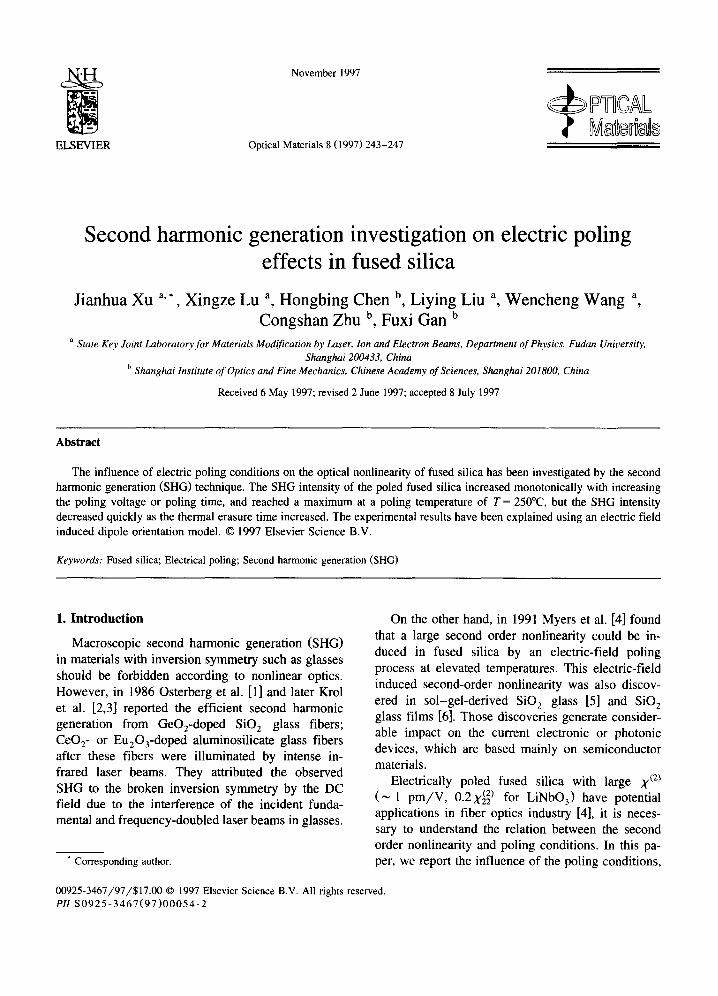
The experimental setup used for SHG measure- ments is shown in Fig. 1. A fundamental beam of 10 ns pulsewidth, 10 Hz repetition rate, 1 rrd pulse-~ at 1.064 /xm in p-polarization from a Q-switched Nd:YAG laser was focused to a spot with a diameter of 1 mm at the center of the samples through a long-pass filter F1, since the signals from the center of the samples was the largest [7]. The p-polarized
t . . . . . . . . . . F I
/~ s//- "i U-:t
F2
?
A T 5-
La . prism
¥ Diode
Fig. 1. The experimental setup for SHG measurement.
SHG signal at 532 nm was detected in transmission by a photomultiplier tube (PMT) cooled to -20°C and a boxcar averager, the output of which was displayed on an x-y recorder. The SHG intensities from the samples were ratioed to those from a z-cut quartz plate reference to eliminate the measurement errors caused by laser power fluctuations. A 532 nm interference filter F2 was inserted to ensure that only the second harmonic radiation was detected. The dependence of SHG intensity on the incident angle ~b was measured by rotating the samples in the incident plane. Special attention was paid to ensure that the same area was measured when the sample was ro- tated.
3. Results and discussion
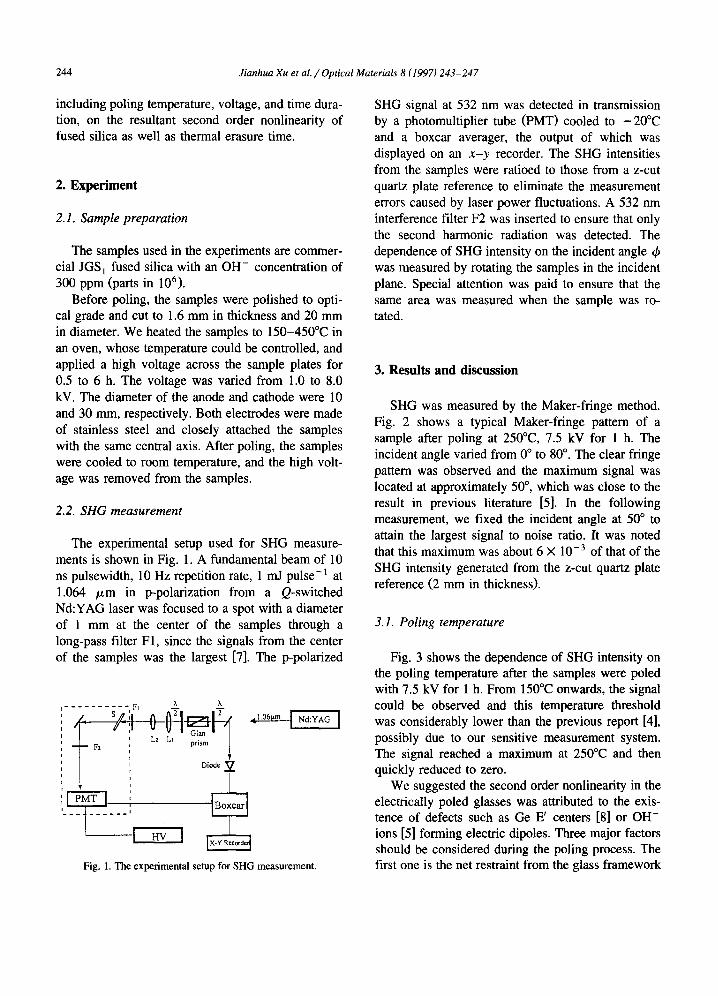
SHG was measured by the Maker-fringe method. Fig. 2 shows a typical Maker-fringe pattern of a sample after poling at 250°C, 7.5 kV for 1 h. The incident angle varied from 0 ° to 80 °. The clear fringe pattern was observed and the maximum signal was located at approximately 50 ° , which was close to the result in previous literature [5]. In the following measurement, we fixed the incident angle at 50 ° to attain the largest signal to noise ratio. It was noted that this maximum was about 6 × 10 -3 of that of the SHG intensity generated from the z-cut quartz plate reference (2 mm in thickness).
3.1. Poling temperature
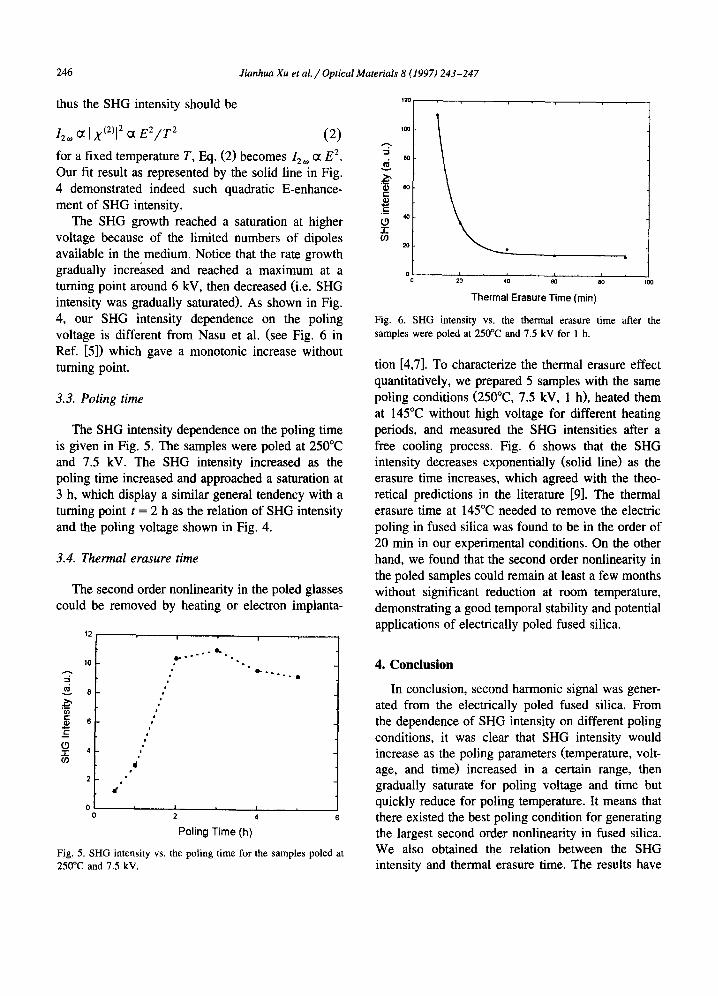
Fig. 3 shows the dependence of SHG intensity on the poling temperature after the samples were poled with 7.5 kV for 1 h. From 150°C onwards, the signal could be observed and this temperature threshold was considerably lower than the previous report [4], possibly due to our sensitive measurement system. The signal reached a maximum at 250°C and then quickly reduced to zero.
We suggested the second order nonlinearity in the electrically poled glasses was attributed to the exis- tence of defects such as Ge E' centers [8] or OH- ions [5] forming electric dipoles. Three major factors should be considered during the poling process. The first one is the net restraint from the glass framework
Jianhua Xu et al. / Optical Materials 8 (1997) 243-247 245
,-, 0.8 i l l l / ~
>, 0.6;
o
o.4 ; '~V ~
02 ~
0 , , , i . . . . i . . . . I . . . . I . . . . i . . . . e . . . . I .
-10 0 10 20 30 40 50 60 70 80 Angle of Incidence (degree)
Fig. 2. A typical Maker-fringe pattern of the poled fused silica.
- '1 10
I -
.~_ o -r
, I I I I I I
2 3 4 5 6 7
Poling Voltage (KV)
Fig. 4. SHG intensity vs. the poling voltage for the samples poled at 250°C for 1 h.
which is very strong at room temperature and re- duces with increasing temperature T. The second one is the applied dc electric field, which forces the source dipoles to reorient themselves towards the field direction. The third factor is the thermal motion against the net restraint and/or poling field. The source dipoles were randomly orientated and 'frozen' at room temperature. The alignment of the dipoles on poling leads to a nonvanishing macroscopic second order nonlinearity.
When the temperature was raised to the threshold temperature T t = 150°C, the applied field just over- came the reduced net restraint and started to align the dipoles leading to a nonvanishing macroscopic
e
I /1
¢ " 3 0
(9 2° -T
e . 09 1o / "".,.. :" " . . . .
0
I I I I e I I 150 2OO 25O 3OO 35O 4OO 45O
Poling Temperature (°C)
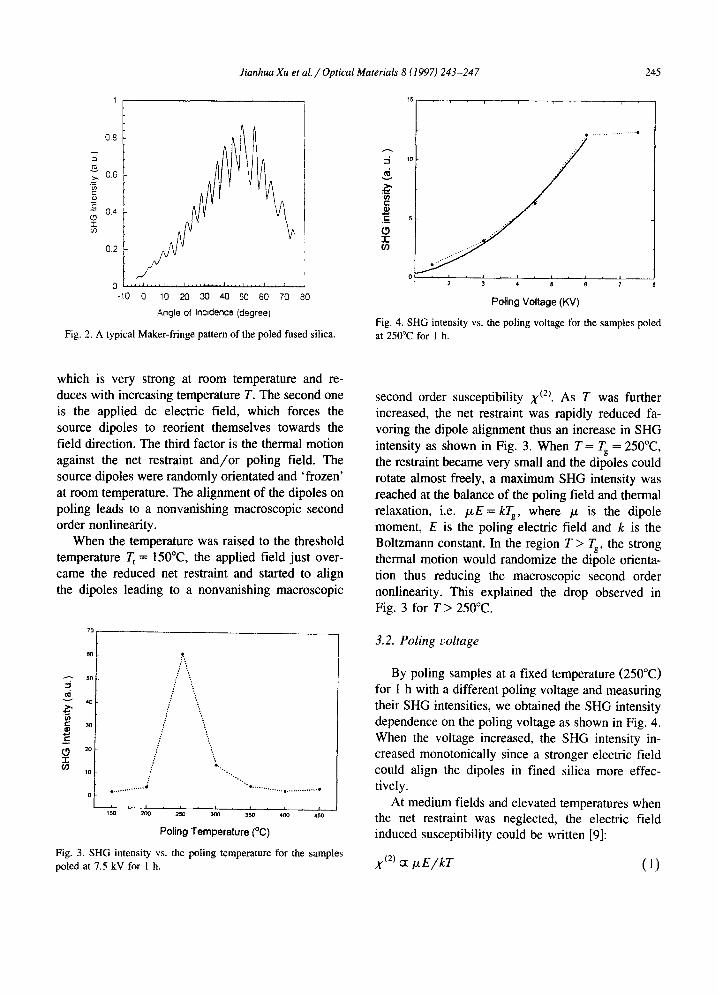
Fig. 3. SHG intensity vs. the poling temperature for the samples poled at 7.5 kV for 1 h.
second order susceptibility X (2). As T was further increased, the net restraint was rapidly reduced fa- voring the dipole alignment thus an increase in SHG intensity as shown in Fig. 3. When T = Tg = 250°C, the restraint became very small and the dipoles could rotate almost freely, a maximum SHG intensity was reached at the balance of the poling field and thermal relaxation, i.e. /xE= kTg, where /x is the dipole moment, E is the poling electric field and k is the Boltzmann constant. In the region T > Tg, the strong thermal motion would randomize the dipole orienta- tion thus reducing the macroscopic second order nonlinearity. This explained the drop observed in Fig. 3 for T > 250°C.
3.2. Poling voltage
By poling samples at a fixed temperature (250°C) for 1 h with a different poling voltage and measuring their SHG intensities, we obtained the SHG intensity dependence on the poling voltage as shown in Fig. 4. When the voltage increased, the SHG intensity in- creased monotonically since a stronger electric field could align the dipoles in fined silica more effec- tively.
At medium fields and elevated temperatures when the net restraint was neglected, the electric field induced susceptibility could be written [9]:
X (2) cc/xE/kT (1)
246 Jianhua Xu et al. / Optical Materials 8 (1997) 243-247
thus the SHG intensity should be
/2o, ~ I x<2)l 2 at E 2 / T 2 (2)
for a fixed temperature T, Eq. (2) becomes 12,o ct E 2. Our fit result as represented by the solid line in Fig. 4 demonstrated indeed such quadratic E-enhance- ment of SHG intensity.
The SHG growth reached a saturation at higher voltage because of the limited numbers of dipoles available in the medium. Notice that the rate growth gradually increased and reached a maximum at a turning point around 6 kV, then decreased (i.e. SHG intensity was gradually saturated). As shown in Fig. 4, our SHG intensity dependence on the poling voltage is different from Nasu et al. (see Fig. 6 in Ref. [5]) which gave a monotonic increase without turning point.
3.3. Poling time
The SHG intensity dependence on the poling time is given in Fig. 5. The samples were poled at 250°C and 7.5 kV. The SHG intensity increased as the poling time increased and approached a saturation at 3 h, which display a similar general tendency with a turning point t = 2 h as the relation of SHG intensity and the poling voltage shown in Fig. 4.
3.4. Thermal erasure time
The second order nonlinearity in the poled glasses could be removed by heating or electron implanta-
~2
i "/ , , 0 ! I f • I ,
0 2 4
Poling Time (h)
Fig. 5. SHG intensity vs. the poling time for the samples poled at 250°C and 7.5 kV.
t20
1 0 0
t.9 4o -r- o9
2O
o i i t 1 20 40 eli rio Ioo
Thermal Erasure Time (min)
Fig. 6. SHG intensity vs. the thermal erasure time after the samples were poled at 250°(3 and 7.5 kV for 1 h.
tion [4,7]. To characterize the thermal erasure effect quantitatively, we prepared 5 samples with the same poling conditions (250°C, 7.5 kV, 1 h), heated them at 145°C without high voltage for different heating periods, and measured the SHG intensities after a free cooling process. Fig. 6 shows that the SHG intensity decreases exponentially (solid line) as the erasure time increases, which agreed with the theo- retical predictions in the literature [9]. The thermal erasure time at 145°C needed to remove the electric poling in fused silica was found to be in the order of 20 min in our experimental conditions. On the other hand, we found that the second order nonlinearity in the poled samples could remain at least a few months without significant reduction at room temperature, demonstrating a good temporal stability and potential applications of electrically poled fused silica.
4. Conclusion
In conclusion, second harmonic signal was gener- ated from the electrically poled fused silica. From the dependence of SHG intensity on different poling conditions, it was clear that SHG intensity would increase as the poling parameters (temperature, volt- age, and time) increased in a certain range, then gradually saturate for poling voltage and time but quickly reduce for poling temperature. It means that there existed the best poling condition for generating the largest second order nonlinearity in fused silica. We also obtained the relation between the SHG intensity and thermal erasure time. The results have

Jianhua Xu et al. / Optical Materials 8 (1997) 243-247 247
been explained using an electrically induced dipole orientation model.
Acknowledgements
This work was supported by the National Natural Science Foundation of China.
References
[1] U. Osterberg, W. Margulis, Opt. Lett. 11 (1986) 516. [2] D.M. Krol, J.R. Simpson, Opt. Lett. 16 (1991) 1650.
[3] D.M. Krol, D.J. Digiovanni, W. Pleibel et al., Opt. Lett. 18 (1993) 1220.
[4] R.A. Myers, N. Mukherjee, S.R.I. Brueck, Opt. Lett. 15 (1991) 1732.
[5] H. Nasu, H. Okamoto, K. Kurachi et al., J. Opt. Soc. Am. B 12 (1995) 644.
[6] A. Okada, K. Ishii, K. Mito et al., Appl. Phys. Lett. 60 (1992) 2853.
[7] P.G. Kazansky, A. Kamal, P.St.J. Russell, Opt. Lett. 18 (1993) 1141.
[8] T.E. Tsai, E.J. Friebele, D.L. Griscom, Opt. Lett. 18 (1993) 935.
[9] D.M. Burland, R.D. Miller, C.A. Walsh, Chem. Rev. 94 (1994) 31.