Embed Size (px)
Citation preview

sec94
contributions plan
No.21
Marsden Park
s e c t i o n

Section 94 Contributions Plan No.21 – Marsden Park
_____________________________________________________________________________________________________
CONTENTS 1. INTRODUCTION AND ADMINISTRATION OF THE PLAN .......................................................................... 1
1.1 NAME OF THE PLAN ............................................................................................................................... 1 1.2 PURPOSE OF PLAN ................................................................................................................................ 1 1.3 COMMENCEMENT OF THIS PLAN .............................................................................................................. 2 1.4 PRINCIPLES OF SECTION 94 ................................................................................................................... 2 1.5 AIMS AND OBJECTIVES .......................................................................................................................... 2 1.6 LAND TO WHICH THE PLAN APPLIES ........................................................................................................ 2 1.7 DEVELOPMENT TO WHICH THE PLAN APPLIES ........................................................................................... 4 1.8 CONSTRUCTION CERTIFICATES AND THE OBLIGATION OF ACCREDITED CERTIFIERS ..................................... 4 1.9 COMPLYING DEVELOPMENT AND THE OBLIGATION OF ACCREDITED CERTIFIERS .......................................... 4 1.10 RELATIONSHIP TO OTHER PLANS ............................................................................................................ 4 1.11 CAPACITY OF EXISTING FACILITIES TO MEET DEVELOPMENT DEMAND ......................................................... 4 1.12 PROJECT MIX OF LAND USES FOR MARSDEN PARK .................................................................................. 4 1.13 PROJECTED DEVELOPMENT YIELD .......................................................................................................... 6 1.14 ANTICIPATED POPULATION GROWTH RATES ............................................................................................ 6 1.15 ASSUMPTIONS BENCHMARKS AND STANDARDS ........................................................................................ 7 1.16 RELATIONSHIP TO SPECIAL INFRASTRUCTURE CONTRIBUTIONS.................................................................. 7 1.17 THE MONITORING AND REVIEW OF THIS PLAN .......................................................................................... 7 1.18 PRIORITY OF WORKS AND FACILITIES ....................................................................................................... 8 1.19 TIMING OF PROVISION OF ITEMS ............................................................................................................. 8 1.20 POOLING OF FUNDS ............................................................................................................................... 9 1.21 FINANCIAL INFORMATION........................................................................................................................ 9 1.22 ENQUIRIES REGARDING THIS PLAN .......................................................................................................... 9 1.23 CONTRIBUTIONS REGISTER .................................................................................................................... 9
2 WATER CYCLE MANAGEMENT FACILITIES ........................................................................................... 10
2.1 NEXUS ............................................................................................................................................... 10 2.2 WATER SENSITIVE URBAN DESIGN (WSUD) ......................................................................................... 10 2.3 CONSISTENCY WITH PRECINCT PLANNING DOCUMENTS .......................................................................... 11 2.4 CONTRIBUTION CATCHMENTS ............................................................................................................... 14 2.5 NEXUS ............................................................................................................................................... 15 2.6 WATER SENSITIVE URBAN DESIGN (WSUD) ......................................................................................... 15 2.7 CONSISTENCY WITH PRECINCT PLANNING DOCUMENTS .......................................................................... 16 2.8 CONTRIBUTION CATCHMENTS ............................................................................................................... 19 2.9 CONTRIBUTION FORMULA .................................................................................................................... 19
3 TRAFFIC & TRANSPORT MANAGEMENT FACILITIES ........................................................................... 21
3.1 NEXUS (MAJOR ROADS) ...................................................................................................................... 21 3.2 CONSISTENCY WITH PRECINCT PLANNING DOCUMENTS .......................................................................... 21 3.3 CONTRIBUTION CATCHMENT ................................................................................................................ 22 3.4 NEXUS (MAJOR ROADS) ...................................................................................................................... 22 3.5 CONSISTENCY WITH PRECINCT PLANNING DOCUMENTS .......................................................................... 22 3.6 CONTRIBUTION CATCHMENT ................................................................................................................ 24 3.7 CONTRIBUTION FORMULA .................................................................................................................... 24
4 OPEN SPACE & RECREATION FACILITIES ............................................................................................. 26
4.1 NEXUS ............................................................................................................................................... 26 4.2 LAND FOR AQUATIC FACILITIES ............................................................................................................. 27 4.3 CONTRIBUTION CATCHMENT ................................................................................................................ 28 4.4 CONTRIBUTION FORMULA .................................................................................................................... 28
5 LAND FOR COMMUNITY FACILITIES ....................................................................................................... 29
5.1 NEXUS ............................................................................................................................................... 29 5.2 COMMUNITY RESOURCE AND RECREATION HUB AND 2ND LOCAL COMMUNITY HUB (LAND ONLY) ................. 31 5.3 SITE LOCATION ................................................................................................................................... 32 5.4 LEVELS OF PROVISION ......................................................................................................................... 32 5.5 ESSENTIAL INFRASTRUCTURE ............................................................................................................... 32 5.6 CONTRIBUTION CATCHMENT ................................................................................................................ 32 5.7 CONTRIBUTION FORMULA .................................................................................................................... 32 5.8 COMMUNITY FACILITIES COSTS AND SCHEDULES ................................................................................... 32
__________________________________________________________________________________________
In force as at 14 December 2016 ii

Section 94 Contributions Plan No.21 – Marsden Park
_____________________________________________________________________________________________________
6 COMBINED PRECINCT FACILITY ............................................................................................................. 34
6.1 NEXUS – E2 CONSERVATION ZONE ...................................................................................................... 34 6.2 CONTRIBUTION FORMULA .................................................................................................................... 34 6.3 COMBINED PRECINCT FACILITY COSTS AND WORKS SCHEDULES ............................................................. 34 6.4 NEXUS – AQUATIC FACILITY ................................................................................................................. 35 6.5 CONTRIBUTION FORMULA .................................................................................................................... 35 6.6 COMBINED PRECINCT FACILITY COSTS AND WORKS SCHEDULES ............................................................. 35
7 EXPLANATION OF CONTRIBUTION FORMULA COMPONENTS............................................................ 36
7.1 INTRODUCTION ................................................................................................................................... 36 7.2 EXPLANATION OF THE LAND COMPONENTS ............................................................................................ 36 7.3 EXPLANATION OF THE CAPITAL COMPONENTS ........................................................................................ 36 7.4 EXPLANATION OF THE CATCHMENT AREAS ............................................................................................ 37 7.5 INDEXATION ........................................................................................................................................ 37 7.6 ASSUMED OCCUPANCY RATES ............................................................................................................. 37 7.7 INDICATIVE CONTRIBUTION RATES (RESIDENTIAL) .................................................................................. 38
8 PAYMENT OF CONTRIBUTIONS ............................................................................................................... 39
8.1 METHODS OF PAYMENT ........................................................................................................................ 39 8.2 TIMING OF PAYMENT ........................................................................................................................... 39 8.3 INDEXATION OF CONTRIBUTIONS ........................................................................................................... 40 8.4 DISCOUNTING OF CONTRIBUTIONS ........................................................................................................ 40 8.5 DEFERRED PAYMENT OF CONTRIBUTIONS ............................................................................................. 40
__________________________________________________________________________________________
In force as at 14 December 2016 iii

Section 94 Contributions Plan No.21 – Marsden Park
_____________________________________________________________________________________________________
LIST OF APPENDICES
APPENDIX A Water Cycle Management Facilities Contribution Catchments and Schedule of Works. Marsden Park Industrial Precinct
APPENDIX B Traffic and Transport Management Facilities Contribution Catchments and Schedule of Works. Marsden Park Industrial Precinct
APPENDIX C Water Cycle Management Facilities Contribution Catchments and Schedule of Works. Marsden Park Precinct
APPENDIX D Traffic and Transport Management Facilities Contribution Catchments and Schedule of Works. Marsden Park Precinct
APPENDIX E Open Space & Recreation Facilities Contribution Catchments and Schedule of Works
APPENDIX F Land for Community Facilities & Aquatic Facilities Contribution Catchment
APPENDIX G Combined Precinct Facility Contribution Catchments and Schedule of Works
APPENDIX H Schedule of Values used in the Contributions Formulae to Calculate Contribution Rates
APPENDIX I Base Contribution Rates
APPENDIX J Supporting Technical Documents and Reports
__________________________________________________________________________________________
In force as at 14 December 2016 iv

Section 94 Contributions Plan No.21 – Marsden Park
_____________________________________________________________________________________________________
1. Introduction and Administration of the Plan
1.1 Name of the Plan This contributions plan is called ‘Section 94 Contributions Plan No.21 – Marsden Park. Unless otherwise stated in this plan, “Marsden Park” means the “Marsden Park and Marsden Park Industrial Precincts”.
1.2 Purpose of Plan This contributions plan outlines Council's policy regarding the application of Section 94 (S.94) of the Environmental Planning and Assessment Act, 1979 in relation to the provision of local infrastructure and baseline facilities within Marsden Park. Within Marsden Park S.94 contributions are levied for the following amenities and services:
• Water Cycle Management Facilities • Traffic & Transport Management Facilities • Open Space and Recreation Facilities • Community Facilities (land only) • Reserve 867, Local Conservation Zone - Riverstone (apportioned).
This plan has been prepared in accordance with:
• Environmental Planning and Assessment Act, 1979 (EPA Act) • Environmental Planning and Assessment Regulation, 2000; (EPA Regulation) • in conjunction with the Indicative Layout Plans for the Marsden Park and Marsden Park
Industrial Precincts • IPART’s assessments of Blacktown City’s Contributions Plans No’s 201, 212,223 and 244 • having regard to the Practice Notes issued by the NSW Department of Planning (2005) in
Accordance with clause 26(1) of the EPA Regulation. The initial contributions plan for the Marsden Park Industrial Precinct only, was assessed by the Independent Pricing and Regulatory Tribunal (IPART) in 2012. IPART’s assessment is available on its website. Following assessment, IPART’s recommended cost adjustments were implemented prior to adoption. The contributions plan was then adopted by Council on 22 May 2013 and came into force on 5 June 2013. This first revision of the contributions plan now includes the Marsden Park Precinct. The S.94 contributions contained in this plan have been determined on the basis of "contribution catchments". This is the area over which a contribution for a particular item is levied. Within each catchment there is an identifiable "list" of works, which are scheduled for provision. Council applies contribution formulae to each catchment for the purpose of calculating the contribution rate applicable to that catchment. The formulae take into account the cost of works to be undertaken, the cost to Council of providing land for a public purpose on which to undertake these works and the size of the catchment area. The total cost of providing these works is distributed over the total catchment on an equitable basis.
1 Assessments of Blacktown City Council’s Section 94 Contributions Plan No 20 – Riverstone and Alex Avenue Precincts July 2016, March 2015 and October 2011 2 Assessment of Blacktown City Council’s Section 94 Contributions Plan No 21 – Marsden Park Industrial Precinct September 2012 3 Assessment of Blacktown City Council’s Section 94 Contributions Plan No 22 – Area 20 Precinct September 2012 4 Assessment of Blacktown City Council’s Section 94 Contributions Plan No 24 – Schofields Precinct August 2014 __________________________________________________________________________________________
In force as at 14 December 2016 1

Section 94 Contributions Plan No.21 – Marsden Park
_____________________________________________________________________________________________________
1.3 Commencement of this Plan This plan takes effect from the date on which public notice was published, pursuant to clause 31 (4) of the EPA Regulation.
1.4 Principles of Section 94 Section 94 permits Council to require persons or entities developing land to pay monetary contributions, provide capital works (works in kind), and/or dedicate land in order to help fund the increased demand for public amenities and public services (amenities and services) generated through their developments. The three general principles in applying Section 94 contributions are:
1. A contribution must be for, or relate to, a planning purpose.
2. A contribution must fairly and reasonably relate to the subject development.
3. The contribution must be such that a reasonable planning authority, duly applying its statutory duties, could have properly imposed.
Council may either:
• require a dedication of land • a monetary contribution • material public benefit (works-in-kind) • a combination of some or all of the above.
One of the fundamental responsibilities of any Council in imposing S.94 contributions is to ensure that the contributions levied are reasonable. That is, the works and facilities to be provided must be as a direct consequence of the development on which the contributions are levied. In keeping with this responsibility, S.94 contributions levied on development as a result of this Plan are limited to providing amenities and services to the minimum level necessary to sustain an acceptable form of urban development.
1.5 Aims and Objectives The aims and objectives of this plan are to:
• ensure that S.94 contributions levied on development within Marsden Park are reasonable • ensure that the method of levying S.94 contributions is practical • ensure that an appropriate level of local infrastructure provision occurs within Marsden Park • employ a user pays policy for the funding of infrastructure within Marsden Park so that the
existing residents of the City are not subsidising new urban development • ensure that the amenities and services provided are not for the purpose of making up
shortfalls in other areas • ensure infrastructure is provided in an orderly manner • make clear Council's intentions regarding the location and timing of infrastructure provision
within Marsden Park.
1.6 Land to Which the Plan Applies This contributions plan applies to land within the Marsden Park Precinct and the Marsden Park Industrial Precinct5, which are two of the release precincts in the North West Growth Centre.
5 For more information of the Precincts, go to http://growthcentres.planning.nsw.gov.au/PriorityGrowthAreas.aspx __________________________________________________________________________________________
In force as at 14 December 2016 2

Section 94 Contributions Plan No.21 – Marsden Park
_____________________________________________________________________________________________________
The Marsden Park Industrial Precinct is bounded by South Street to the north and west, Proposed Freeway to the south and Bells Creek to the east. The Marsden Park Precinct is bounded by South Street to the south, Richmond Road and Bells Creek to the east and South Creek to the north and west. A map showing the location of the Marsden Park and Marsden Park Industrial Precincts is shown below. The boundaries of the specific contribution catchments are detailed in Appendices "A" to "G".
__________________________________________________________________________________________
In force as at 14 December 2016 3

Section 94 Contributions Plan No.21 – Marsden Park
_____________________________________________________________________________________________________
1.7 Development to which the Plan Applies This Plan applies to all developments occurring within the precinct catchment areas that require the submission of a development application or an application for a complying development certificate, including the intensification of use of a site involving expansion of area occupied by a development and/or the addition of population. This Plan does not apply to developments in Marsden Park that are the subject of Voluntary Planning Agreements, if expressly stated in the relevant VPA.
1.8 Construction Certificates and the Obligation of Accredited Certifiers In accordance with section 94EC of the EP&A Act and Clause 146 of the EP&A Regulation, a certifying authority must not issue a construction certificate for building work or subdivision under a development consent unless it has verified that each condition requiring the payment of monetary contributions has been satisfied. In particular, the certifier must ensure that the applicant provides a receipt(s) confirming that Contributions have been fully paid and copies of such receipts must be included with copies of the certified plans provided to Council in accordance with clause 142(2) of the EP&A Regulation. Failure to follow this procedure may render such a certificate invalid. The only exceptions to the requirement are where a works in kind, material public benefit, dedication of land or deferred payment arrangement has been agreed by Council. In such cases, Council will issue a letter confirming that an alternative payment method.
1.9 Complying Development and the Obligation of Accredited Certifiers In accordance with S94EC(1) of the EP&A Act, accredited certifiers must impose a condition requiring monetary contributions in accordance with this contributions plan, which satisfies the following criteria. The conditions imposed must be consistent with Council’s standard section 94 consent conditions and be strictly in accordance with this contributions plan. It is the professional responsibility of accredited certifiers to accurately calculate the contribution and to apply the section 94 condition correctly.
1.10 Relationship to Other Plans Environmental Planning Instruments and controls apply to Marsden Park. These include:
• State Environmental Planning Policy (Sydney Region Growth Centres) 2006 (Appendix No.5) • State Environmental Planning Policy (Sydney Region Growth Centres) 2006 (Appendix No.12) • BCC Growth Centre Precincts DCP 2014 - Schedule 3 (Marsden Park Industrial) • BCC Growth Centre Precincts DCP 2014 - Schedule 6 (Marsden Park) Parts 1 & 2.
1.11 Capacity of Existing Facilities to meet Development Demand The existing facilities do not have the capacity to meet the demand for infrastructure created by the new development. As a predominantly greenfield area Marsden Park requires new infrastructure, as well as infrastructure upgrades to meet the demand for infrastructure created by the new development.
1.12 Project Mix of Land Uses for Marsden Park Marsden Park, through its new land use zones and Indicative Layout Plan, will provide for a range of land uses in the precinct to support the incoming population.
__________________________________________________________________________________________
In force as at 14 December 2016 4

Section 94 Contributions Plan No.21 – Marsden Park
_____________________________________________________________________________________________________
Marsden Park Precinct For the Marsden Park Precinct the Post-Exhibition Planning Report compares the exhibited ILP and final ILPs in the table below:
Land Use Exhibited ILP (Quantity) Final ILP (Quantity)
Low density residential (11 dw/ha) 19.6ha / 216 dw 19.8ha / 218 dw Low density residential (15 dw/ha) 466.4ha / 6,996 dw 462ha / 6,930 dw Medium density residential (25 dw/ha) 78.8ha / 1,970 dw 88.9ha / 2,223 dw High density residential (35 dw/ha) 24.5ha / 858 dw 26.3ha / 919 dw RU6 Transition - 107ha / 10 dw Environmental Management 221.5ha / 11 dw 116.5ha / 8 dw Total Residential 810.8ha / 10,051 dw 820.6ha / 10,308 dw Total Mixed Use a 5.3ha 5.3ha K-12 School 8.0ha
8.0 (1)ha
Primary schools 9.0ha
5.9 (2)ha Total School 17.0ha (4) 13.9 (3)ha Town Centre b 12.8ha (1) 12.9 (1)ha Village Centre 3.2ha(2) 3.3 (2)ha Total Retail Centre 16.0ha (3) 16.2 (3)ha Local active open space c 69ha 64.3ha Local passive open space 44.8ha 44.4ha Total Local Open Space 113.8ha
108.7ha
Aquatic / Leisure Centre 3.0ha
3.0 (1)ha Community Centres 1.1ha
1.0 (2)ha
Total Community Facilities 4.1ha
4.0 (3)ha Environmental Conservation 98.7ha 101.8ha Water Management 84.5ha 75.2ha SP2 Council Roads 13.7ha 12.3ha Private Open Space 10.5ha 10.5ha Substation 1.0ha 1.2ha Conservation (Shanes Park) 598.8ha 598.8ha Richmond Road and South Street reservation
27.7ha 30.0ha
Total others 834.9ha 829.7ha Marsden Park Precinct Area 1,801.9ha 1,801.9ha a Dwelling yield, average dwelling density and population outcomes include an assumed dwelling density of 20 dwellings per hectare within the Mixed Use areas. b Comprised of 25,000 square metres of retail and 15,000 square metres of commercial space c Includes 48 hectares of active open space on the Grange Avenue landfill site and indicates 100% of ‘Local Park’ and ‘Sporting Field’ areas as shown on the ILP
__________________________________________________________________________________________
In force as at 14 December 2016 5

Section 94 Contributions Plan No.21 – Marsden Park
_____________________________________________________________________________________________________
Marsden Park Industrial Precinct For the Marsden Park Industrial Precinct the Marsden Park Industrial Precinct Planning Report 2010 compares the exhibited and revised ILPs in the table below:
¹The reduction in the conservation and open space areas in the revised ILP is a result of the Bells Creek corridor being deferred. The Bells Creek corridor has been calculated separately and no longer included in the conservation and open space calculation.
1.13 Projected Development Yield The Marsden Park Precinct has net development yield of approximately 10,3086 dwellings to cater for a population of approximately 30,238 residents.
The Marsden Park Industrial Precinct has net development yield of approximately 1,228 dwellings to cater for a population of approximately 3,504 residents.
1.14 Anticipated Population Growth Rates Marsden Park has fragmented land ownership which means that no single developer will be responsible for the progressive servicing and development of the Precinct. As a result, development can only occur once the relevant service providers such as Sydney Water have completed the necessary works to enable development to begin. Therefore, in the absence of a development staging plan, it is difficult to determine the anticipated population growth rates for the precinct overtime.
6 Marsden Park Precinct Post-Exhibition Planning Report
Summary statistics Exhibited ILP
(ha)
Revised ILP
(ha) Land use
Detached Residential (R2) 15.7 17.2
Attached Residential (R3) 29.8 29.4
Business Park (B7) 67.4 70.6
Bulky Goods Retailing (B5) 36.5 39.8
General Industrial (IN1) 0 99.3
Light Industrial (IN2) 205 107.3
Drainage 51.9 35.9
Conservation and Open Space 92.5 63.6¹
Road Reserves 51.5 59.9
Deferred land (Bells Creek corridor) 27.5
Total site area 550.3 550.3
Other Indicators
Net density (dwellings/ha) 16.2 16.2
Yield (dwellings) 1,121 1,228
Population 3,200 3,504
Jobs 10,000 10,000
__________________________________________________________________________________________
In force as at 14 December 2016 6

Section 94 Contributions Plan No.21 – Marsden Park
_____________________________________________________________________________________________________
1.15 Assumptions Benchmarks and Standards The following benchmarks have generally been used to determine the land uses, which have been refined during precinct planning:
• Open Space and Recreation: o Overall open space provision: 2.83ha/1,000 residents o Rates for specific uses are based on the rates stipulated in the Growth Centres
Development Code 2006, input from Blacktown City Council and specialist studies.
• Dwelling Yield: There are density controls for the Precincts, which are:
Marsden Park
• 15 dwellings per hectare across the majority of the Precinct. (Note that
lower densities will be specified around Clydesdale House) • 25 dwellings per hectare in the R3 zone close to the Northern and Western
Villages and in land adjoining Richmond Road and South Street • 35 dwellings per hectare in the R3 zone adjoining the Marsden Park Town
Centre.7
Marsden Industrial Precinct
The minimum lot size for areas within the Precinct zoned R3 Medium Density Residential areas has been increased from 240 metres squared to 250 metres squared. The increase was to ensure consistency in the neighbouring Precincts in the North West Precinct such as Alex Avenue which currently has a 250 metres squared minimum lot size. The change provides consistency for Blacktown City Council for this control.8
1.16 Relationship to Special Infrastructure Contributions This Plan does not affect the determination, collection or administration of any special infrastructure contribution (SIC)9 levied under Section 94EF of the EPA Act in respect to development on land to which this Plan applies. Applicants should refer to the most recent SIC Practice Notes issued by the Department of Planning and Infrastructure for details on the application of special infrastructure contributions to the Growth Centres Precincts.
1.17 The Monitoring and Review of this Plan This plan will be subject to regular review by Council. Council’s Section 94 Finance Committee considers the need for reviews of all of Council’s contributions plans when they meet monthly. Council generally aims to have contributions plans reviewed annually in fast-growing release areas. The purpose of any review is to ensure that:
• contribution levels reflect current land and construction costs • the level of provision reflects current planning and engineering practice and likely population
trends
7 Marsden Park Precinct Planning Report September 2012 8 SEPP (Sydney Region Growth Centres) Amendment (Marsden Park Industrial Precinct) 2010 Post-Exhibition Planning Report 9 The Special Infrastructure Contribution is a financial payment made by the developer during the development process to help fund regional infrastructure. For more information go to http://growthcentres.planning.nsw.gov.au/Portals/0/Infrastructure%20Docs/SIC_Practice_Note_November_2008.pdf __________________________________________________________________________________________
In force as at 14 December 2016 7
Section 94 Contributions Plan No.21 – Marsden Park
_____________________________________________________________________________________________________
• work schedules are amended if development levels and income received differ from current expectations.
Any changes to the plan must be prepared in accordance with the Act and Regulation and placed on public exhibition for a minimum period of 28 days. The nature of any changes proposed and the reasons for these will be clearly outlined as part of the public participation process. Council welcomes the comments of interested persons in relation to this plan at any time.
1.18 Priority of works and facilities The Minister for Planning has issued a direction to councils under S.94E of the Environmental Planning and Assessment Act 1979 (EPA Act). The Minister’s direction has the effect of preventing Council from making a s94 contributions plan that authorises the imposition of conditions of consent requiring monetary s94 contributions for certain residential development in excess of the monetary cap specified by or under the Direction. For the North West Growth Centre precincts a cap of $30,000 per residential lot/dwelling applies. This provision aside, this plan would authorise contributions in excess of the monetary cap. For that reason, and for so long as the Direction or any similar replacement direction (Direction) remains in place, it is not possible to fund all of the works and facilities identified in this plan. Accordingly, the categories of works for which contributions are to be sought in respect of the relevant residential development under this plan have been prioritised. The order of priority of the categories of works (from highest to lowest) is as follows:
1. Water Cycle Management Facilities. 2. Traffic & Transport Management Facilities. 3. Open Space and Recreation Facilities. 4. Community Facilities (land).
Based on the above priorities:
• in the event that the contributions imposed under this plan are greater than the monetary cap referred to above, the contributions will be allocated in accordance with the above order of priorities with the contribution for the lowest priority category is reduced commensurately in order to not exceed the monetary cap
• in the unlikely event that the contributions imposed under this plan are less than the monetary cap referred to above, the base rates in Appendix I are applicable.
The categories of works and facilities for which contributions are sought in accordance with the priorities shall be specified in the s94 condition.
1.19 Timing of Provision of Items The provision of the individual items contained in this plan has been prioritised. The priority attached to providing each item has been determined having regard for:
• existing development trends. For example, the provision of parks in faster growing residential areas will have a higher priority than slower growing areas
• anticipated revenue. Council's ability to forward fund Section 94 works is limited. As such the
timing of works is very much dependant on the receipt of adequate S94 funds. The work schedules in the appendices of this plan have been formulated having regard for existing funds available to each of the catchment areas and projected income.
__________________________________________________________________________________________
In force as at 14 December 2016 8

Section 94 Contributions Plan No.21 – Marsden Park
_____________________________________________________________________________________________________
As noted in Section 1.17 above, regular reviews of this plan are undertaken. Development trends are monitored and revenue estimates are revised as part of the review process and as a result, the priority of works can change.
1.20 Pooling of funds This plan authorises monetary Section 94 contributions paid for different purposes to be pooled and applied progressively for those purposes. The priorities for the expenditure of pooled monetary section 94 contributions under this plan are the priorities for works as set out in the works schedules to this plan.
1.21 Financial Information A separate annual statement is prepared by Council following the end of each financial year. This accounting record contains details of total contributions received, total contributions expended and total interest earned for each plan and is available for inspection free of charge from Council's Corporate Finance Section.
1.22 Enquiries regarding this Plan Enquiries in relation to this or any other Contributions Plan can be made either by phoning Council's Information Centre on 9839 6000 between 8.00 am and 5.30 pm Monday to Friday or by visiting the Information Centre on the Ground Floor of the Civic Centre in Flushcombe Road, Blacktown between 8.00 am to 5.30 pm Monday to Friday.
1.23 Contributions Register A copy of the Contributions Register is also available for inspection free of charge, and can be viewed at the Information Centre. As this register spans many years, persons wishing to view the whole register (rather than details in relation to a particular property) will need to contact Council’s Section 94 Officer or Co-ordinator Contributions in advance to ensure suitable arrangements can be made to view this information.
__________________________________________________________________________________________
In force as at 14 December 2016 9

Section 94 Contributions Plan No.21 – Marsden Park
_____________________________________________________________________________________________________
2 Water Cycle Management Facilities This contributions plan was previously only for the Marsden Park Industrial Precinct which has negligible residential land. The Marsden Park Precinct is primarily residential land. To account for the previous plan and the dominant land uses, water cycle management catchments are delineated for each precinct. Marsden Park Industrial Precinct
2.1 Nexus In order to levy S.94 contributions Council must be satisfied that development, the subject of a Development Application or application for a Complying Development Certificate, will or is likely to require the provision of, or increase the demand for amenities and services within the area. This relationship or means of connection is referred to as the nexus. The nexus between development and the increased demand for water cycle management works is based on the community held expectation that urban land, especially residential land, should be satisfactorily drained and flood free. Development produces hard impervious areas and this results in increased stormwater runoff and greater flows occurring in the natural drainage system. If these flows are not controlled by an appropriate drainage system, inundation from floodwaters may occur both within the area being developed and further downstream. The increased flows can also result in damage to downstream watercourses through increased erosion and bank instability. An appropriate drainage system may include pipes, channels, culverts and detention basins. A nexus also exists between urban development and increased pollutant loads entering the stormwater system. Therefore, in order to protect receiving waters from the effects of urban development, stormwater quality improvement measures are required. The Water Cycle Management objectives and criteria are detailed in the Growth Centres State Environmental Planning Policy (SEPP), Development Code and Development Control Plan.
2.2 Water Sensitive Urban Design (WSUD) The draft report by GHD for Marsden Park Industrial Precinct – Water Cycle Management Assessment: Flooding, Stormwater and Water Sensitive Urban Design dated July 2009 identifies that there are a number of opportunities for management of stormwater quality, quantity and flooding at the Marsden Park Industrial Precinct areas. This management would benefit from the implementation of Water Sensitive Urban Design (WSUD) practices. WSUD encompasses all aspects of urban water cycle management including water supply, wastewater and stormwater management that promotes opportunities for linking water infrastructure, landscape design and the urban built form to minimize the impacts of development upon the water cycle and achieve sustainable outcomes. A WSUD strategy for management of stormwater quality, quantity and flooding has been developed for the Marsden Park Industrial Precinct, that nominates at source pollution control measures for industrial, commercial and higher density residential areas combined with precinct scale co-located detention/bio-retention basins, wetlands, and gross pollutant traps at key locations. These systems would essentially comprise a dry basin (to provide detention function) combined with bio-retention (to provide water quality treatment function) situated in the invert of the basin. Bio-retention is sized to treat runoff from low density residential areas and the road network of the other proposed land use areas. Due to the different water quality management principles applied to low density residential land, the precinct is divided into distinct water quality sub-catchments based on land use.
__________________________________________________________________________________________
In force as at 14 December 2016 10

Section 94 Contributions Plan No.21 – Marsden Park
_____________________________________________________________________________________________________
Rainwater tanks were recommended to be provided where possible, together with the use of additional swales within the local road network. These measures are not included in this contributions plan as they will be provided as part of individual developments. For flood management, habitable floor levels of new residences, commercial and industrial developments should be above the flood planning level, and trunk drainage channels are provided where catchments generally exceed 15 hectares. Numerical modelling was used to test the effectiveness of the WSUD strategy and included modelling of flood peaks and flood levels for the creeks within the Marsden Park Industrial Precinct using RAFTS and TUFLOW. Volumes of detention that responded as best possible to the Indicative Layout Plans (ILPs) and restricted flood peaks to pre-development levels were calculated using RAFTS. Stormwater quality management and Stream Stability requirements were determined using MUSIC. The results of the numerical modelling has shown that the proposed WSUD strategy together with the flood plain management can satisfy the requirements of the Growth Centres Development Code (GCC, 2006), Blacktown City Council Priority Precincts Development Control Plan (DPE 2016), Blacktown City Council Engineering Guideline for Development (BCC, 2005), Blacktown Development Control Plan 2015 (BCC, 2015), and the NSW Floodplain Development Manual for management of stormwater quantity, quality and flooding in or at the precincts. Blacktown City Council (BCC) has used WSUD strategy and associated modelling to form the basis of the regional stormwater drainage infrastructure works. Preliminary sizing only was also undertaken by GHD with some amendments by Blacktown City Council. This enabled the preparation of preliminary quantities and estimates by GHD Pty Ltd that were adjusted by BCC to reflect BCC contract rates.
2.3 Consistency with Precinct Planning Documents The Precinct Planning for the Marsden Park Industrial Precinct has developed since the original exhibition in 2009. The initial Water Cycle Management technical assessment was conducted by GHD. Post exhibition, this work was developed by J. Wyndham Prince. However, the original flood modelling was not updated by J. Wyndham Prince except for the Bells Creek flood modelling. Therefore, the technical reports prepared for the Precinct are as follows:
• GHD Draft Report for Marsden Park Industrial Precinct – Water Cycle Management Assessment: Flooding, Stormwater and Water Sensitive Urban Design dated July 2009.
• J. Wyndham Prince Marsden Park Industrial Precinct Post Exhibition Water Cycle Management Strategy Report Including Consideration of Climate Change Impacts dated February 2011.
• J. Wyndham Prince Marsden Park Industrial Precinct Bells Creek Corridor Water Cycle Management Strategy dated January 2011.
• During the Precinct Plan’s post exhibition period, the water cycle management strategy was refined to reduce infrastructure costs and the zoning of Bells Creek was changed to enable it to remain in private ownership. Concept designs for trunk drainage channels and basins were prepared by J. Wyndham Prince and checked and amended by Council as required. Where sizing of drainage infrastructure was not provided as part of the J. Wyndham Prince reports, additional sizing was conducted by Council’s Asset Design Services staff based on the numerical modelling available. The Precinct planning documents relevant to the water cycle management are as follows:
• Department of Planning and Infrastructure Bells Creek Corridor Indicative Layout Plan dated 8 December 2010.
• Department of Planning and Infrastructure Draft Marsden Park Industrial Precinct Indicative Layout Plan dated 16 December 2010.
• Department of Planning and Infrastructure Blacktown City Council Precincts Development Control Plan 2010 including Schedule 3 Marsden Park Industrial Precinct.
__________________________________________________________________________________________
In force as at 14 December 2016 11

Section 94 Contributions Plan No.21 – Marsden Park
_____________________________________________________________________________________________________
• Department of Planning and Infrastructure current version of SEPP Maps. • Department of Planning and Infrastructure Growth Centres Development Code dated October
2006.
The sizing and location of the water cycle management infrastructure was generally acceptable. However, there are several areas where changes are required and these are identified by reference to the infrastructure items in Appendix A. There are also some minor items that have been added to facilitate the proposed water cycle management strategy. The previous draft CP21 included additional bio-retention east of Richmond Road opposite Basin B3.2, which was recommended for removal by IPART. Council has completed additional water quality modelling and by including approximately 360m2 of treatment area the size of B3.3 can be reduce from 6000m2 to 1800m2 which is a major cost saving. For stormwater quality treatment, over treating to account for bypass areas is less efficient. The subsequent subdivision design and acquisitions by RMS result in an acquisition area approximately the same as the zoned SP2 drainage area east of Richmond Road, which means that there is an overall cost saving to the plan. Since the precinct planning, Council has identified an intact chain of ponds tributary of Little Creek immediately downstream of the precinct within the Air Services Site. This area is also identified as a conservation area and is part of the protected biodiversity area underpinning the Growth Centres biodiversity certification. OEH have advised that the ideal stormwater outcome should be used for this part of the precinct. The DCP also includes controls that require ideal stormwater outcomes for conservation areas. To facilitate this outcome, Council commissioned an alternative Stormwater Management Strategy for this tributary of Little Creek by Bligh Tanner. This study identified that a flow diversion system was a feasible solution to achieve these higher standards. The flow management storage volume is approximately equal to the flood detention storage which approximately doubles the design storage for these three basins. Additional flow management measures have been included based on further concept design and analysis by Council. The main changes from the precinct planning outcomes are summarised below. Bells Creek Catchment Item B3.2 The basin concept design was amended to suit Council standards. However, the required land area was the same. Item B4.1 Was sized by Council as no sizing details were provided. Based on the existing topography, it is possible that the design catchment area will be greater than that allowed for the J. Wyndham Prince reports. Costs are based on Council’s sizing. Items B5.1, B5.3 & B5.4 are added and the size of B3.3 significantly reduced. Marsden Creek Catchment Items M1.2 and M1.4 trunk drainage channels. The land zoned for drainage purposes is not consistent with the sizing provided as the width tapers from zero to the required width over the length of the channels. It is not physically possible to maintain the channel capacity with this arrangement. Also, Council does not accept the location of the drainage channel in the median of the proposed sub-arterial road due to operational grounds. The costs in the contributions plan allow for the open channel to run parallel with the sub-arterial road and includes additional land to facilitate this outcome. Little Creek Catchment Item L3.2 Detention Basin. The J. Wyndham Prince reports have an option for providing OSD for part of this catchment west of South Street. There is also the potential option to offset these flows in the basin as indicated in previous versions of the J. Wyndham Prince reports. The basin design assumes J Wyndham Prince optional Basin O is not provided as there is no land zoned for this optional basin. This basin is also located on an area of existing native vegetation to be retained. To
__________________________________________________________________________________________
In force as at 14 December 2016 12
Section 94 Contributions Plan No.21 – Marsden Park
_____________________________________________________________________________________________________
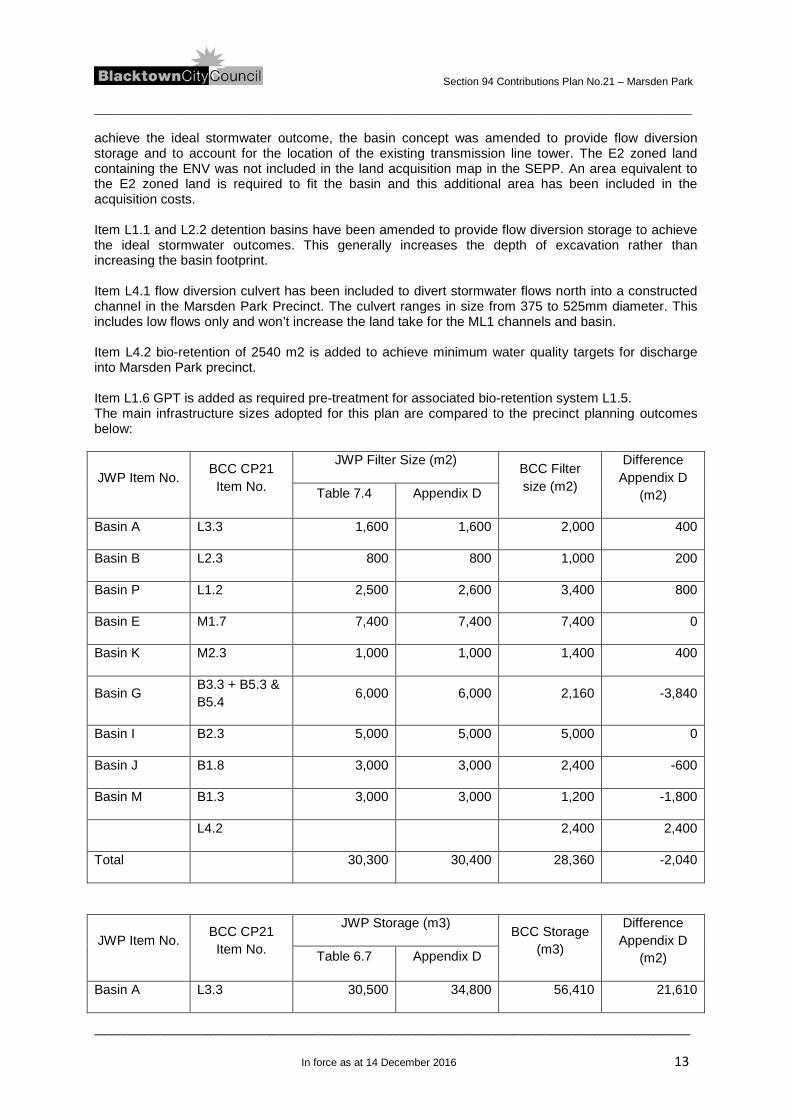
achieve the ideal stormwater outcome, the basin concept was amended to provide flow diversion storage and to account for the location of the existing transmission line tower. The E2 zoned land containing the ENV was not included in the land acquisition map in the SEPP. An area equivalent to the E2 zoned land is required to fit the basin and this additional area has been included in the acquisition costs. Item L1.1 and L2.2 detention basins have been amended to provide flow diversion storage to achieve the ideal stormwater outcomes. This generally increases the depth of excavation rather than increasing the basin footprint. Item L4.1 flow diversion culvert has been included to divert stormwater flows north into a constructed channel in the Marsden Park Precinct. The culvert ranges in size from 375 to 525mm diameter. This includes low flows only and won’t increase the land take for the ML1 channels and basin. Item L4.2 bio-retention of 2540 m2 is added to achieve minimum water quality targets for discharge into Marsden Park precinct. Item L1.6 GPT is added as required pre-treatment for associated bio-retention system L1.5. The main infrastructure sizes adopted for this plan are compared to the precinct planning outcomes below:
JWP Item No. BCC CP21 Item No.
JWP Filter Size (m2) BCC Filter size (m2)
Difference Appendix D
(m2) Table 7.4 Appendix D
Basin A L3.3 1,600 1,600 2,000 400
Basin B L2.3 800 800 1,000 200
Basin P L1.2 2,500 2,600 3,400 800
Basin E M1.7 7,400 7,400 7,400 0
Basin K M2.3 1,000 1,000 1,400 400
Basin G B3.3 + B5.3 & B5.4 6,000 6,000 2,160 -3,840
Basin I B2.3 5,000 5,000 5,000 0
Basin J B1.8 3,000 3,000 2,400 -600
Basin M B1.3 3,000 3,000 1,200 -1,800
L4.2 2,400 2,400
Total 30,300 30,400 28,360 -2,040
JWP Item No. BCC CP21 Item No.
JWP Storage (m3) BCC Storage (m3)
Difference Appendix D
(m2) Table 6.7 Appendix D
Basin A L3.3 30,500 34,800 56,410 21,610
__________________________________________________________________________________________
In force as at 14 December 2016 13

Section 94 Contributions Plan No.21 – Marsden Park
_____________________________________________________________________________________________________
Basin B L2.3 9,000 9,100 26,812 17,712
Basin P L1.2 12,100 12,100 23,580 11,480
Basin E M1.7 40,000 40,000 40,000 0
Basin K M2.3 9,500 9,540 9,540 0
Basin G B3.3 + B5.3 & B5.4 33,000 34,800 48,300 13,500
Basin I B2.3 28,000 28,700 28,700 0
Basin J B1.8 14,000 14,100 16,260 2,160
Basin M B1.3 10,500 10,500 10,500 0
Total 186,600 193,640 260,102 66,462
2.4 Contribution Catchments The Marsden Park Industrial Precinct contains three drainage catchments, Bells Creek Catchment, Marsden Creek Catchment and Little Creek Catchment. The areas of the catchments were determined having regard for the natural watershed and the proposed local road layout which will impact upon drainage flows. Generally, the Marsden Park Industrial Precinct drains to the Bells Creek, Marsden Creek or Little Creek catchments. A map showing the location of the drainage contribution catchments is contained in Appendix A. When considering the size of contribution catchments for Water Cycle Management Facilities, Council took the approach that the catchments should be of a sufficient size to promote efficiency in the timing of the provision of infrastructure. This approach is supported by the Department of Planning and Infrastructure Practice Notes for Development Contributions (2005). The proposed Stormwater Management Strategy for the Marsden Park Industrial Precinct provides for both stormwater quantity (flow) management and quality management. The stormwater quantity management requirements for the various land uses proposed in the Precinct are similar, therefore it is proposed to levy stormwater quantity contributions on the basis of the three main catchments. For stormwater quality management, there are two different approaches depending on land use. For low density residential land use, it is proposed to provide treatment measures on a regional scale particularly for nutrient removal as it is not practical to provide on individual lots. For higher density residential, commercial and industrial land uses, it is proposed that stormwater treatment measures are provided on lot with minor additional regional measures to treat stormwater from precinct roads. Therefore to equitably levy contributions for stormwater quality, seven catchments are proposed to account for different land use types and are shown in Appendix A. To account for the different demand assigned to different land use types in terms of stormwater quality measures, different contribution rates are required. In this precinct, the only regional stormwater quality facilities that serve low density residential and other land use types are located in the Little Creek Catchment. In this instance the stormwater quality costs have been apportioned over 100% of low density residential land plus 15% of the other developable land zone areas. The 15% represents the future public roads that are not serviced by on lot stormwater treatment. In order to determine actual provision levels and, ultimately, contribution rates, the developable area of each drainage catchment are calculated. The developable area is the area over which the cost of providing the works has been distributed and is explained further in Section 7.4. __________________________________________________________________________________________
In force as at 14 December 2016 14
Section 94 Contributions Plan No.21 – Marsden Park
_____________________________________________________________________________________________________
The developable area (Size of Catchment) of the drainage catchments is stated in Appendix H. Marsden Park Precinct
2.5 Nexus In order to levy S.94 contributions Council must be satisfied that development, the subject of a Development Application or application for a Complying Development Certificate, will or is likely to require the provision of, or increase the demand for amenities and services within the area. This relationship or means of connection is referred to as the nexus. The nexus between development and the increased demand for water cycle management works is based on the community held expectation that urban land, especially residential land, should be satisfactorily drained and flood free. Development produces hard impervious areas and this results in increased stormwater runoff and greater flows occurring in the natural drainage system. If these flows are not controlled by an appropriate drainage system, inundation from floodwaters may occur both within the area being developed and further downstream. The increased flows can also result in damage to downstream watercourses through increased erosion and bank instability. An appropriate drainage system may include pipes, channels, culverts and detention basins. A nexus also exists between urban development and increased pollutant loads entering the stormwater system. Therefore, in order to protect receiving waters from the effects of urban development, stormwater quality improvement measures are required. The Water Cycle Management objectives and criteria are detailed in the Growth Centres State Environmental Planning Policy (SEPP) and Development Code.
2.6 Water Sensitive Urban Design (WSUD) The report by J. Wyndham Prince (JWP) for Marsden Park Precinct – Post Exhibition Water Cycle and Flood Management Strategy Report, Report 9351RptC.doc dated July 201310 identifies that there are a number of opportunities for management of stormwater quality, quantity and flooding at the Marsden Park Precinct areas. This management would benefit from the implementation of Water Sensitive Urban Design (WSUD) practices. WSUD encompasses all aspects of urban water cycle management including water supply, wastewater and stormwater management that promotes opportunities for linking water infrastructure, landscape design and the urban built form to minimize the impacts of development upon the water cycle and achieve sustainable outcomes. A WSUD strategy for management of stormwater quality, quantity and flooding has been developed for the Marsden Park Precinct, that nominates at source pollution control measures for commercial and higher density residential areas (R3 and R4) combined with precinct scale co-located detention/bio-retention basins, individual bio-retention basins and gross pollutant traps at key locations. These systems would essentially comprise a dry basin (to provide detention function) combined with bio-retention (to provide water quality treatment function) situated in the basin. Bio-retention is sized to treat runoff from low density residential areas and the road network of the other proposed land use areas. To account for the different demand assigned to different land use types in terms of stormwater quality measures, different contribution rates are required. In this instance the stormwater quality costs have been apportioned over 100% of low density residential land plus 25% of the other developable land zone areas. The 25% represents the future public roads that are not serviced by on lot stormwater treatment.
10 A summary of proposed management measures is provided in Section 9 JWP2 __________________________________________________________________________________________
In force as at 14 December 2016 15

Section 94 Contributions Plan No.21 – Marsden Park
_____________________________________________________________________________________________________
Rainwater tanks are to be provided in accordance with BASIX requirements11 as a minimum as part of development. The sizing of S94 stormwater management works accounts for rainwater tanks being provided. Additional measure such as swales within the local road network may also be incorporated into development. These measures are not included in this contributions plan as they will be provided as part of individual developments to meet their individual treatment requirements for areas other than low density residential land. For flood management, habitable floor levels of new residences, commercial and industrial developments should be above the flood planning level, and trunk drainage channels are provided where catchments generally exceed 15 hectares. As part of the flood management strategy the Precinct incorporates a balanced cutting and filling of the floodplain to reclaim land for development. These floodplain reclamation works are not included in this Plan. Numerical modelling was used to test the effectiveness of the WSUD strategy and included modelling of flood peaks and flood levels for the creeks within the Marsden Park Precinct using XP-RAFTS and TUFLOW. Volumes of detention that responded as best possible to the Indicative Layout Plan (ILP) and restricted flood peaks to pre-development levels were calculated using XP-RAFTS. Stormwater quality management and Stream Stability requirements were determined using MUSIC.12 The results of the numerical modelling has shown that the proposed WSUD strategy together with the flood plain management can satisfy the requirements of the Growth Centres Development Code (GCC, 2006) Blacktown City Council Engineering Guideline for Development (BCC, 2005), Blacktown City Council Growth Centre Precincts Development Control Plan 2010 (DPI, 2010), and the NSW Floodplain Development Manual for management of stormwater quantity, quality and flooding in or at the precincts.13 Development will also need to consider where appropriate Blacktown City Council DCP 2006 Part R - Water Sensitive Urban Development and Integrated Water Cycle Management. Blacktown City Council (BCC) has used WSUD strategy and associated modelling to form the basis of the regional stormwater drainage infrastructure works. Preliminary sizing only was also undertaken by J. Wyndham Prince with amendments by Blacktown City Council. This enabled the preparation of preliminary quantities and estimates by BCC based on BCC contract rates. Given the large land holdings in this precinct, it is likely that that the majority of the stormwater works will be delivered by developers as works-in-kind with the subdivision works. This has been allowed for in the pricing of the disposal costs.
2.7 Consistency with Precinct Planning Documents The Precinct Planning for the Marsden Park Precinct has developed since the original exhibition in 2012. J. Wyndham Prince prepared the exhibition version of the Water Cycle and Flood Management technical assessment and subsequently updated this report to the post exhibition version in response to submissions and direction from DPI. Therefore, the technical reports relevant to the final precinct planning outcome are:
• J. Wyndham Prince for Marsden Park Precinct –Water Cycle and Flooding Management Strategy Report 9351RptC.doc dated August 2012. (JWP1)
• J. Wyndham Prince for Marsden Park Precinct – Post Exhibition Water Cycle and Flooding Management Strategy Report 9351RptC.doc dated July 2013. (JWP2)
Sizing and Concept designs for trunk drainage channels and basins were prepared by J. Wyndham Prince.14 Where sizing of drainage infrastructure was not provided as part of the J. Wyndham Prince
11 Refer to Section 9 page 29 of JWP1 12 Numeric modelling is described in Sections 10, 11, 12 and 13 of JWP1 and Sections 4, 5, 6 and 7 of JWP2 13 The general performance of the strategy is summarised in Section 16, page 69 of JWP1 and Section 9, page 29 of JWP2 14 Detention storage volumes and treatment areas are shown on Figures 5.1 and 5.2 in Appendix E of JWP2, some culvert and channels sizes are shown in Appendix D __________________________________________________________________________________________
In force as at 14 December 2016 16

Section 94 Contributions Plan No.21 – Marsden Park
_____________________________________________________________________________________________________
reports, additional sizing was conducted by Council’s Asset Design Services staff based on the numerical modelling available. The Precinct planning documents relevant to the water cycle management are as follows:
• Department of Planning and Infrastructure Marsden Park Precinct Indicative Layout Plan dated June 2013.
• Department of Planning and Infrastructure Blacktown City Council Growth Centre Precincts Development Control Plan 2010 including Schedule 6 Marsden Park Precinct.
• Department of Planning and Infrastructure current version of SEPP Maps. • Department of Planning and Infrastructure Growth Centres Development Code dated October
2006.
Council internally reviewed the overall precinct modelling. The sizing and location of the water cycle management infrastructure was generally acceptable. However, there are several areas where changes and or further investigations are recommended. Council ADS staff subsequently undertook a more detailed review of the concept designs and made adjustments as required to deliver practical infrastructure outcomes. This review also incorporates current information provided by RMS and Sydney Water in relation to their infrastructure works in this precinct. These main changes include: South Creek Catchment Item MS1.1 size of JWP2 raingarden basin 4 has been increased from 1800m2 to 3300m2 to achieve maximum depth of 1.2m in upstream storage area for safety grounds and to limit hydraulic loading on treatment area to acceptable levels. Little Creek Catchment Item ML3.0 has combined JWP2 items A4 and B3 into a single facility. The JWP concept design for these rain gardens has them located on either side of a small ridge. With the proposed bulk earthworks it is feasible to regrade this area to provide a single basin that serves both of these catchments. Item ML 1.1 size of JWP2 raingarden basin 3 has been increased from 3,000m2 to 7,000m2 to achieve maximum depth of 1.2m in upstream storage area for safety grounds and to limit hydraulic loading on treatment area to acceptable levels. Marsden Creek Catchment Item MM2.1 JWP2 raingardens 5A, 5B & 5C have been combined into single item. Final treatment areas will be allocated based on final development catchments and basin design. Item MM3.5 JWP2 raingardens 6A & 6C have been combined into single item. Final treatment areas will be allocated based on final development catchments and basin design. Items MM3.11 & MM3.13 JWP2 channel TC08 is replaced with culverts and overland flow path. This change is proposed as it would otherwise have relatively short sections of open channel between culverts located in a high pedestrian area at the proposed town centre. The main infrastructure sizes adopted for this plan are compared to the precinct planning outcomes below:
JWP Item No.
BCC CP 21 Item No.
JWP Filter Size m2
BCC Filter Size
m2
Difference (Appendix
D) Figure 5.2 Appendix MUSIC
__________________________________________________________________________________________
In force as at 14 December 2016 17

Section 94 Contributions Plan No.21 – Marsden Park
_____________________________________________________________________________________________________
D model m2
Raingarden/Bio-retention Basin A1 MS 3.1 4,130 4,130 4,060 3,600 -530 Basin A3 MS 2.1 1,450 1,450 1,460 1,600 150 Basin 2 ML 5.1 3,160 3,160 3,160 2,600 -560 Basin 3 ML1.1 1,600 3,000 3,000 7,000 4,000 Basin 4 MS 1.1 1,600 1,800 1,800 5,100 3,300 Basin 5 MM 2.1 6,455 4,335 2,570 5,300 965 Basin 6A MM 3.5 1,375 1,375 250 1,400 25 Basin 6B MM 3.2 250 250 50 400 150 Basin 7A MB 1.1 1,500 1,500 1,500 2,000 500 Basin 7B MB 2.1 1,200 1,200 1,200 1,000 -200 Basin 8 MM 1.1 3,140 3,140 2,220 2,700 -440 Rain A4 ML 3.0 380 380 0 1,200 820 Rain B3 ML 3.0 960 960 1,340 0 -960 Rain B1 ML 7.0 1,820 1,820 1,820 1,700 -120 Rain B2 ML 6.0 980 980 930 600 -380 Rain 1 ML 8.0 1,400 1,400 1,400 1,300 -100 Rain 3F ML 2.0 570 570 570 800 230 5B-OS ML 2.11 600 600 600 600 0 5D ML 2.12 1,600 1,600 1,600 1600 0 6C MM 3.5 50 50 100 0 -50 Rain 6E MM 3.9 1,000 1,000 1,000 2,100 1,100 Total 35,220 34,700 30,630 42,600 7,900
JWP Item No.
CP 25 Item No.
JWP Storage m3 BCC
Storage m3
Difference (Appendix
D) m3 Figure 5.1
Appendix D
XP-RAFTS
Detention basins Basin A1 MS 3.1 23,400 24,300 18,700 24,300 0 Basin A3 MS 2.1 10,200 10,200 6,130 10,058 -142 Basin 2 ML 5.1 35,000 35,030 35,030 35,030 0 Basin 3 ML1.1 121,500 123,430 121,457 123,620 190 Basin 4 MS 1.1 59,600 59,650 59,644 60,100 450 Basin 5 MM 2.1 60,711 60,960 60,711 60,710 -250 Basin 6A MM 3.5 11,300 11,275 11,275 11,275 0 Basin 6B MM 3.2 13,800 13,775 13,773 13,775 0 Basin 7A MB 1.1 17,600 17,390 17,560 17,400 10 Basin 7B MB 2.1 19,200 20,000 19,785 20,000 0 Basin 8 MM 1.1 15,300 23,345 15,284 14,940 -8,405 Total 387,611 399,355 379,349 391,208 -8,147
__________________________________________________________________________________________
In force as at 14 December 2016 18

Section 94 Contributions Plan No.21 – Marsden Park
_____________________________________________________________________________________________________
2.8 Contribution Catchments The Marsden Park Precinct contains four main drainage catchments:
• Catchment MS, the areas that drain directly to South Creek • Catchment ML, the area that drains to Little Creek • Catchment MM, the area that drains to Marsden Creek • Catchment MB, the area that drains to Bells Creek.
The areas of the catchments were determined having regard for the natural watershed and the proposed local road layout which will impact upon drainage flows. A map showing the location of the drainage contribution catchments is contained in Appendix C. When considering the size of contribution catchments for Water Cycle Management Facilities, Council took the approach that the catchments should be of a sufficient size to promote efficiency in the timing of the provision of infrastructure. This approach is supported by the Department of Planning and Infrastructure Practice Notes for Development Contributions (2005). The proposed Stormwater Management Strategy for the Marsden Park Precinct provides for both stormwater quantity (flow) management and quality management. The stormwater quantity management requirements for the various land uses proposed in the Precinct are similar, therefore it is proposed to levy stormwater quantity contributions on the basis of the four main catchments. For stormwater quality management, there are two different approaches depending on land use. For low density residential land use, it is proposed to provide treatment measures on a regional scale particularly for nutrient removal as it is not practical to provide on individual lots. For higher density residential, commercial and industrial land uses, it is proposed that stormwater treatment measures are provided on lot with minor additional regional measures to treat stormwater from precinct roads. To account for the different demand assigned to different land use types in terms of stormwater quality measures, different contribution rates are required. In this instance the stormwater quality costs have been apportioned over 100% of low density residential land plus 25% of the other developable land zone areas. The 25% represents the future public roads that are not serviced by on lot stormwater treatment. In order to determine actual provision levels and, ultimately, contribution rates, the developable area of each drainage catchment are calculated. The developable area is the area over which the cost of providing the works has been distributed and is explained further in Section 7.4. The developable area (Size of Catchment) of the drainage catchments is stated in Appendix H.
2.9 Contribution Formula Given that different strategies apply to stormwater quality management separate costs are required for Stormwater Quantity and Quality management measures. Therefore different cost items and developable areas will apply and the total rate will be the sum the quantity and quality rates. The following formula is used to calculate the contribution rate for Water Cycle Management Works:
CONTRIBUTION RATE = (L1 + L2 + C1 + C2 + PA)
($/HECTARE) A
WHERE: L1 = The actual cost to Council to date of providing land for water cycle management public purposes indexed to current day values.
L2 = The estimated cost of land yet to be provided for water cycle management
purposes.
__________________________________________________________________________________________
In force as at 14 December 2016 19

Section 94 Contributions Plan No.21 – Marsden Park
_____________________________________________________________________________________________________
C1 = The actual cost to Council to date of works constructed for water cycle management facilities indexed to current day values.
C2 = The estimated cost of future water cycle management facilities.
PA = Plan administration fee. This is 1.5% of the construction cost.
A = The total developable area the contribution catchment (hectares).
A more detailed explanation of the components in the contribution formula, including the method of indexing to current day values is provided in Section 7. A schedule of works for the contribution catchments is provided in Appendix "A & C" together with a map of the catchments indicating the location of the works. The values of the components of the contribution formula are contained in the Schedule being Appendix "H". The resultant contribution rates are contained in the Schedule being Appendix "I".
__________________________________________________________________________________________
In force as at 14 December 2016 20

Section 94 Contributions Plan No.21 – Marsden Park
_____________________________________________________________________________________________________
3 Traffic & Transport Management Facilities
Marsden Park Industrial Precinct
3.1 Nexus (Major Roads) The nexus between development and the increased demand for roads is based on the accepted practice that efficient traffic management is facilitated best by a hierarchy of roads from local roads which are characterised by low traffic volumes, slow speeds and serve a small number of residential units up to arterial roads which are characterised by large volumes of traffic travelling at higher speeds. In establishing new land release precincts it is desirable for Council to provide for major roads to allow for the large volumes of relatively high-speed traffic. It would be unreasonable to require the developments that adjoin these roads to be responsible for their total construction as the standard of construction is greater than that required for subdivisional roads and direct access is not permitted to these roads. It is reasonable that all development in a particular area share the cost of providing the Major Roads, as all development will benefit from the provision of these roads.
3.2 Consistency with Precinct Planning Documents The overall road network layout has remained similar since the exhibition of the Precinct Planning Documents. The only notable change is the classification of South Street as an arterial road with the RTA as the acquisition authority. The technical reports prepared for the Precinct are as follows:
• Arup Marsden Park Industrial (Employment) Precinct Transport and Access Study Final Report for ILP Exhibition dated August 2009 prepared for the Department of Planning and Infrastructure.
• J. Wyndham Prince Marsden Park Draft S94 Basin Review Road No 1 Plan and Longitudinal Sections 3 sheets 8955/SK19-A, 8955/SK20-A, 8955/SK21-A dated 08/06/10.
Planning documents are as listed in Section 2.3. South Street is not included in this contributions plan as it is now proposed to be a classified road under RMS control. The realignment and extension of the existing Hollinsworth Road has been included and will form a significant traffic link and facilitate connectivity to South Street and is designated as Road No 1 in the J Wyndham Prince plans. Some minor adjustment of the Road No 1 concept design was undertaken by Council to suit updated drainage basin levels and the north south sub-arterial road. The north south sub-arterial road was designed and estimated by Council’s Asset Design Services to run parallel to the proposed drainage channel on the western side. Having a drainage channel in the centre of the sub-arterial road as shown in the Development Control Plan Schedule 3 is not acceptable to Council. The Development Control Plan Schedule 3 does not include an industrial sub-arterial road standard without a drainage channel in the median which is required for sections of both Road No 1 (Hollinsworth) and the north south road. The main body of the Development Control Plan does contain a typical sub-arterial road detail. However, this is primarily applicable to residential areas. As industrial roads have a higher proportion of heavy vehicles, additional lane widths are required. The Development Code has a sub-arterial road occupying a 35m reserve and comprising two 3.5m travel lanes and 1.8m on road cycleways in each direction separated by a 7.2m wide median. This width was considered excessive and as part of the Precinct planning process the proposed sub-arterial standard was modified to dual minimum 7m wide carriageways separated by 4.5m wide median and minimum 2.5m wide off road shared paths within a 27m road reserve. __________________________________________________________________________________________
In force as at 14 December 2016 21

Section 94 Contributions Plan No.21 – Marsden Park
_____________________________________________________________________________________________________
The transport report also identifies a bus-only connection to the adjoining urban areas to facilitate access to the main western railway line. This item has not been included in this contributions plan as it is assumed that it will be provided by state level transport agencies responsible for bus services. Standards of road construction are:
• Sub-Arterial – 2 x 7m divided carriageway (27m wide reserve)
• Industrial Collector – 15.5m carriageway (23m wide reserve)
• Industrial Road – 13.5m carriageway (20.5m wide reserve)
• Collector - 11m wide carriageway (20m wide reserve)
• Subdivision Road - 9m wide carriageway (16m wide reserve)
3.3 Contribution Catchment There is one contribution catchment for Traffic and Transport Traffic Management Facilities. Maps showing the location of the Traffic and Transport Management Facilities contribution catchments are contained in Appendix "B". In order to determine contribution rates, the developable area of the Traffic and Transport Management Facilities contribution catchments has been calculated. The developable area is the area over which the cost of providing the works has been distributed and is explained further in Section 7.4. The developable area (Size of Catchment) of the contribution catchments are stated in Appendix "H". Marsden Park Precinct
3.4 Nexus (Major Roads) The nexus between development and the increased demand for roads is based on the accepted practice that efficient traffic management is facilitated best by a hierarchy of roads from local roads which are characterised by low traffic volumes, slow speeds and serve a small number of residential units up to arterial roads which are characterised by large volumes of traffic travelling at higher speeds. In establishing new land release precincts it is desirable for Council to provide for major roads to allow for the large volumes of relatively high-speed traffic. It would be unreasonable to require the developments that adjoin these roads to be responsible for their total construction as the standard of construction is greater than that required for subdivisional roads and direct access is not permitted to these roads. It is reasonable that all development in a particular area share the cost of providing the Major Roads, as all development will benefit from the provision of these roads.
3.5 Consistency with Precinct Planning Documents The overall road network layout has remained similar since the exhibition of the Precinct Planning Documents. The technical reports prepared for the Precinct are as follows:
• Aecom Marsden Park Precinct Traffic and Transport Assessment Final Report revision 2 dated 17 September 2012 prepared for Worong Park Pty Ltd on behalf of the Department of Planning and Infrastructure.
• Department of Planning and Infrastructure Blacktown City Council Growth Centre Precincts Development Control Plan 2010 including Schedule 6 Marsden Park Precinct.
Planning documents are as listed in Section 2.3. The current SIC Practice Note identifies four roads within the Precinct: __________________________________________________________________________________________
In force as at 14 December 2016 22

Section 94 Contributions Plan No.21 – Marsden Park
_____________________________________________________________________________________________________
• the upgrade of Richmond Road from Townsend Road to South Creek • the upgrade of Garfield Road West (the intersection with Richmond Road and new sub arterial
are the only works located within the Precinct) • the upgrade of Grange Avenue East from Richmond Road to Carnarvon Road • the extension of Shanes Park Road East (from Stony Creek Road to Grange Avenue East).
These road works and all associated intersections are not included in this contributions plan. It is understood that the Shanes Park Road East and Grange Avenue East link to Schofields Road has been replaced as the east west connection through the Growth Centre by the Schofields Road extension on the South Street alignment to the future Castlereagh Motorway. Currently, South Street is not included in the SIC Practice note, however, under the SEPP gazettal the RMS is noted as the acquisition authority. The precinct traffic and transport assessment identifies the connection across the Precinct in an east-west direction (i.e. the previously nominated Shanes Park Road east extension) as a sub arterial road and a collector road. The first kilometre of road from Richmond Road in a westerly direction is nominated as a sub arterial road and is included in the contributions plan. The rest of the road is nominated as a collector road and is not part of the contributions plan. Where the East - West sub arterial section meets the collector road, the sub arterial road turns at right angle to meet another sub arterial road (Glengarrie Road), which runs in a southerly direction to South Street. This road is included in the contributions plan, although the intersection with South Street has been allowed as a temporary arrangement until the ultimate design and construction of South Street is completed. With both the sub arterial roads, they have been costed in the contribution plan as collector roads, although they are to be built to a sub arterial standard. There are 2 bridges proposed over Little Creek.
• the first is located on the east west collector road (Item ML 4.1, WCM BR 1) • the other is on an internal collector road to the north (Item ML 4.0, WCM BR 5).
The JWP concept design for the bridges has assumed a 12m wide deck and only allows for a footpath on one side only. Both of these bridges are located on proposed collector roads and as a result the full width profile of the street is to be carried over the bridge. This has then increased the width of the deck to 20m. The increase in deck width has significantly increased the estimate of cost for the bridges. There is one collector road included as part of the contribution plan. This collector is to be constructed along the alignment of the proposed stormwater channel and culvert TC08 and runs in a north - south direction between the East - West sub arterial and South Street. It is proposed that the section of this road north of the landfill site be diverted further west, as the proposed intersection with the East - West collector is too close to the intersection with Richmond Road. This intersection is to be constructed as a roundabout. Grange Avenue east of Richmond Road is also included as it requires significant cut to achieve safe stopping site distance to the Richmond Road intersection. The upgrade of Vine Street from TC08 to Richmond Road has been included as a collector road. The upgrade of the full length of Stony Creek Road along the precinct boundary has been included as a collector road, with half width construction. It is noted that these works are not included in the transport assessment, however, are required to achieve a satisfactory transport outcome for the precinct.
__________________________________________________________________________________________
In force as at 14 December 2016 23

Section 94 Contributions Plan No.21 – Marsden Park
_____________________________________________________________________________________________________
Half width and or full width road costs have been included for existing roads fronting public or environmental land or for new roads with no development potential. Road concept designs and estimates were prepared by Council’s Asset Design using its design estimating rates based on contract rates. The Development Control Plan Schedule 6 nominates typical road cross sections for various road types. It is noted that these are not consistent with previous precincts or Council’s own DCP. The schedule nominates local roads as 9m carriageway in 16.6m road reserve. The schedule nominates collector roads as 12m carriageway in 20.8m road reserve. The schedule nominates sub arterial roads as 13m (2 x 6.5m divided) carriageway in 26.4m road reserve The main difference in road reserve widths is in the provision of wider footways on the local streets (3.8m instead of 3.5m) and the allowance for a shared path on the sub arterial and collector roads. Standards of road construction adopted are:
• Sub-Arterial – 2 x 7m divided carriageway (26m wide reserve)
• Collector - 11m wide carriageway (20 wide reserve)
• Subdivision Road - 9m wide carriageway (16m wide reserve).
3.6 Contribution Catchment There is one contribution catchments for Traffic and Transport Traffic Management Facilities. Maps showing the location of the Traffic and Transport Management Facilities contribution catchments are contained in Appendix "D". In order to determine contribution rates, the developable area of the Traffic and Transport Management Facilities contribution catchments has been calculated. The developable area is the area over which the cost of providing the works has been distributed and is explained further in Section 7.4. The developable area (Size of Catchment) of the contribution catchments are stated in Appendix "H"
3.7 Contribution Formula The following formula is used to calculate the contribution rate for Traffic and Transport Traffic Management Facilities:
CONTRIBUTION RATE = (L1 + L2 + C1 + C2 + PA)
($/HECTARE) A
WHERE: L1 = The actual cost to Council to date of land provided for Traffic and Transport Management purposes indexed to current day values.
L2 = The estimated cost of land to be provided for Traffic and Transport Management purposes.
C1 = The actual cost to Council to date of Traffic and Transport Management Facilities that have been constructed up to the appropriate standard indexed to current day values.
C2 = The estimated cost of Traffic and Transport Management Facilities yet to be
constructed up to the appropriate standard.
PA = PA = Plan administration fee. This is 1.5% of the construction cost.
__________________________________________________________________________________________
In force as at 14 December 2016 24

Section 94 Contributions Plan No.21 – Marsden Park
_____________________________________________________________________________________________________
A = The total developable area in the contribution catchment (hectares).
A more detailed explanation of the components in the contribution formula, including the method of indexing to current day values is provided in Section 7. A schedule of works for the contribution catchments is provided in Appendix "B & D". The values of the components of the contribution formula are contained in the Schedule being Appendix "H". The resultant contribution rates are contained in the schedule being Appendix “I” Traffic & Transport
__________________________________________________________________________________________
In force as at 14 December 2016 25

Section 94 Contributions Plan No.21 – Marsden Park
_____________________________________________________________________________________________________
4 Open Space & Recreation Facilities
4.1 Nexus The provision of adequate open space and recreational areas by Council is an integral component of Council’s framework that contributes to the long term wellbeing of the community. Providing for clean, green open spaces ensures that all residents receive the opportunity to partake in the many health benefits derived from open space. Open space, whether in the form of playing fields, civic spaces or parks and public places are considered a crucial ingredient in the creation of new communities and in the ongoing engagement of existing communities. Council has a varied yet vast provision of open space areas across the LGA and all future provision is a valued addition to this integrated network where a hierarchical structure reflects the rational provision in an equitable manner. Demand for open space is high in Blacktown reflecting the value the community places on this asset. Planning context for Marsden Park has occurred via:
• North West Subregional Strategy (NSW Government, 2007) • Growth Centre Development Code (Growth Centres Commission, 2006) • Recreational Open Space Planning Guidelines for Local Government (Department of
Planning, ) State planning is also given a more detailed local context by Council and the Nexus is further influenced by research and detail included in the following:
• Blacktown City 2030 – Delivering the Vision (Blacktown City Council, 2013) • Macroplan Consulting – Community Facilities and Open Space Assessment – Marsden Park
(2012) • Northwest Growth Centres Recreational Framework (Blacktown City Council, 2009) • Wellness Through Physical Activity Policy (Blacktown City Council, 2008) • Blacktown City Council Social Plan (2012) • Recreation and Open Space Strategy (Blacktown City Council, 2009)
Collectively, these studies contribute information towards the rational basis for a set of baseline recreation planning benchmarks which service as a guide to the provision of the suitable level of open space and recreational opportunities in the release areas. While providing for future communities, Council has considered the existing demand on current facilities and what impact these facilities will have on the growing region. Council has applied a demographic / needs based approach to provision levels rather than a land-use approach. Comparative standards based approaches were also reviewed within the studies. Noting that a large percentage of open space in the North West has a limited recreation use due to its topography, susceptibility to flooding, contamination and soil structure, proximity of sensitive bushland and rugged linear nature, focus on provision has been on what “demand” will require. This “needs-based” approach has involved comparative benchmarks both within and outside of the LGA, coupled with input from other influences including State Sporting Associations, Local Councils, State Government Departments and major interest stakeholders. The resultant provision of open space varies throughout the release area; a reflection in most cases of land constraints, dwelling establishments and drainage functions. Acknowledging that in the absence of any alternatively acceptable industry benchmark, the standard Open Space provision outlined in the
__________________________________________________________________________________________
In force as at 14 December 2016 26

Section 94 Contributions Plan No.21 – Marsden Park
_____________________________________________________________________________________________________
GCC Development Code of 2.83 hectares of usable open space per 1,000 persons has been applied15. The spread and distribution of passive parks ensures that residents are within a 400-500 metre walking distance from open space. The open space network reflects a hierarchy of provision and allows for character and diversity in provision while also incorporating the natural features of the area where feasible. Council has also attempted to meet the identified playing field demand by provision of 1 full field per 1,850 persons which has been established via a needs analysis that has examined the Blacktown LGA current provision, participation rates, previous studies, analysis of suburbs with similar demographics to that forecasted in the new release Precincts, review of provision in other new release areas, information provided by peak bodies as well as forecasted trends in sport participation16. In planning for the diverse sporting landscape and various demands of the incoming population across the North West Growth Centre precincts, Blacktown has reviewed the location and distribution of all sporting codes to provide fair and equitable access. This ensures that our planning reflects the differing formats of the various codes. An example of this is netball, which requires a centralised competition venue with supporting smaller training facilities. Council has identified a centralised venue for netball competition within the Schofields precinct that new release precincts will contribute towards through an equitable apportionment formula based on the forecast population. As outlined within the objectives of the Growth Centres Development Code17, integration of stormwater management and water sensitive urban design with networked open space is supported. Further, the Development Code outlines the objective to provide a balance of useable and accessible open space with neighbourhood and district stormwater management. Accordingly, where land has a dual drainage and open space function, separate costings associated with reserve embellishments have been outlined. These costings are identified within the respective sections of the plan and have been calculated to provide optimal community outcome without unnecessary duplication. Certain reserves provide a dual drainage and open space function. Costs associated with drainage embellishments are outlined within the respective section of this plan and are not duplicated.
4.2 Land for Aquatic Facilities Riverstone Swimming Centre is the only swimming pool situated within the North West Growth Centre. It is a small rural outdoor pool and will not be able to accommodate the leisure needs of the incoming population of the North West Precincts18. As such, land has been planned within the Marsden Park Precinct for a new aquatic/leisure facility to cater for the needs of the Marsden Park, Shanes Park, Marsden Park Industrial, Marsden Park North, West Schofields and the Schofields Precinct. However, as this facility is not included in the scope of the Department of Planning & Environment’s “Essential Infrastructure List” its construction cost has not been included in this contributions plan. Refer to Section 6.5 for details on the contribution formula for the Aquatic Facility. It is noted that this facility is proposed to be integrated with the Marsden Park Community Resource Hub. This will result in enhanced community outcomes whilst providing costs savings in both land acquisitions and capital costs.
15 Growth Centres Commission Development Code 2006 – Page A-11 16 Elton Consulting – Demographic and Social Infrastructure Report - Page 48 and Northwest Growth Centres Recreational Framework - Page 48. 17 Growth Centres Commission Development Code 2006 – Page B-16. 18 Elton Consulting – Demographic and Social Infrastructure Report - Page 29, 48.
__________________________________________________________________________________________
In force as at 14 December 2016 27

Section 94 Contributions Plan No.21 – Marsden Park
_____________________________________________________________________________________________________
4.3 Contribution Catchment There is one open space & recreation contribution catchment. This corresponds to the boundaries of the Marsden Park Industrial and Marsden Park Precincts. A map showing the open space contribution catchment is contained in Appendix "E". In order to determine actual provision levels and, ultimately, the contribution rate, the potential population of the open space contribution catchment has been calculated. The potential population is the number of people over which the cost of providing the open space has been distributed and is explained further in Section 7.4. The potential population of the open space contribution catchment is stated in Appendix "H".
4.4 Contribution Formula The following formula is used to calculate the contribution rate for Open Space and Recreation Facilities: CONTRIBUTION RATE = (L1 + L2 + C1 + C2 + PA)
($/PERSON) P WHERE: L1 = The actual cost to Council to date of land provided for an open space & recreation public purpose adjusted to current day values. L2 = The estimated cost of land yet to be provided for a public open space & recreation purpose. C1 = The actual cost to Council to date of open space embellishments that have been constructed to the appropriate standard adjusted to current day. C2 = The estimated cost of future open space embellishments.
PA = Plan administration fee. This is 1.5% of the construction cost.
P = The estimated eventual population in the contribution catchment. A more detailed explanation of the components in the contribution formula, including the indexation to current day values is provided in Section 7. A schedule of works for the contribution catchment is provided in Appendix "E" together with a map of the catchment indicating the location of the works. The values of the components of the contribution formula are contained in the Schedule being Appendix “H”. The resultant contribution rates are contained in the Schedule being Appendix “I”.
__________________________________________________________________________________________
In force as at 14 December 2016 28

Section 94 Contributions Plan No.21 – Marsden Park
_____________________________________________________________________________________________________
5 Land for Community Facilities
5.1 Nexus Planning in the context for Marsden Park has occurred via state government documentation in the form of:
• North West Sub Regional Strategy (NSW Government, 2007) • Growth Centre Development Code (Growth Centres Commission, 2006).
More detailed local planning and context has been provided by Council and consultants through the following:
• Elton Consulting – Community Facilities and Open Space Assessment – Marsden Park Industrial Precinct.(2009)
• Community Facilities and Open Space Assessment – Marsden Park (Macroplan 2012) • Northwest Growth Centres Recreational Framework (Blacktown City Council, 2009) • Wellness Through Physical Activity Policy (Blacktown City Council, 2008) • Recreation and Open Space Strategy (Blacktown City Council, 2009) • Northwest Growth Centres Recreation Planning Framework (Blacktown City Council, 2009) • The Section 94 Community Facilities Report (May 2008) • Blacktown City 2030 – City of Excellence (Blacktown City Council 2013) • Blacktown City Council Social Plan (2012) • Strategic review of social infrastructure for the North West Growth Centre (Elton 2014)
The Community Facilities and Open Space Assessment – Marsden Park (2012) and Community Facilities and Open Space Assessment – Marsden Park Industrial Precinct (2009) outlined the nexus for community, recreation and open space facilities required for Marsden Park and Marsden Park Industrial Precincts. These studies identified that Council's role in the development of community facilities in the Marsden Park and Marsden Park Industrial Precinct will need to respond to the needs of both precincts and encompass the provision of a range of activities and functions. In addition preliminary assessments have identified a number of facilities would need to also provide for Marsden Park North, West Schofields and Shanes Park precincts. Resulting from this work the following facilities were recommended:
• Community Resource and Recreation Hub (multipurpose including activities and functions of the following)
o Leisure centre (aquatics, indoor recreation, health and fitness – aquatic servicing Marsden Park, Marsden Park Industrial, Marsden Park North, Schofields, Shanes Park and West Schofields Precincts)
o Library (servicing Marsden Park, Marsden Park Industrial, Marsden Park North, Shanes Park and West Schofields Precincts)
o Neighbourhood centre, community and cultural development (servicing Marsden Park and Marsden Park Industrial Precincts)
o Child and family services and facilities o Youth centre o Arts centre function.
• 2nd Local Community Hub (multipurpose including the activities and functions of the following) (servicing Marsden Park and Marsden Park Industrial Precincts)
o Neighbourhood centre, community and cultural development facilities o Children and family services and facilities.
__________________________________________________________________________________________
In force as at 14 December 2016 29

Section 94 Contributions Plan No.21 – Marsden Park
_____________________________________________________________________________________________________
The Community Facilities and Open Space Assessment – Marsden Park (2012) (5.3.1 – Page 28) and Community Facilities and Open Space Assessment – Marsden Park Industrial Precinct (2009) found there was not adequate existing district or regional level social infrastructure within the precincts and its neighbouring precincts to meet the needs generated by a new residential population. The provision of appropriate community and recreation facilities is an important requirement to ensuring Marsden Park and Marsden Park Industrial Precincts is developed appropriately. The future projected resident population of 33,742 meets the threshold for a district and local facility. The findings of the Community Facilities and Open Space Assessment – Marsden Park (2012) (5 – Pages 26-33) and Community Facilities and Open Space Assessment – Marsden Park Industrial Precinct (2009) (6 – Pages 20 – 28) examines what community and recreation facilities would be required to service the new population of Marsden Park and Marsden Park Industrial Precinct and refers to the Growth Centres Commission (2006) Structure Plan - Community Infrastructure Standards as well as Council’s Community Resource Hub model. The table below indicates the community facilities required to meet the needs of Marsden Park and Marsden Park Industrial Precinct. Table **: Community Infrastructure Estimates, Marsden Park and Marsden Park Industrial Precincts
Type of facility
Benchmark Estimated
requirements Marsden Park
Industrial
Estimated requirements Marsden Park
Number per population Population 3,504 Dwellings 1, 228
Population 30,238
Dwellings 10,308
Youth Centres 1:20,000 people 0.2 1.45
Community Service Centre 1:60,000 0.1 0.48
Childcare facility 1 place:5 children 0-4 years 58 566.88
After school care facility 1 place:25 children 5-12 years 17 107.80
Performing Arts/Cultural Centre 1:30,000 people 0.1 0.97
Community Services Local 1:6,000 people 0.5 4.84
Community Services District 1:20,000 people 0.2 1.45
__________________________________________________________________________________________
In force as at 14 December 2016 30

Section 94 Contributions Plan No.21 – Marsden Park
_____________________________________________________________________________________________________
Table **: Library Estimates, Marsden Park, Marsden Park Industrial, Marsden Park North, West Schofields, Shanes Park Precincts
Type of facility
Benchmark Estimated
requirements Marsden Park
Industrial
Estimated requirements Marsden Park
Estimated requirements Marsden Park
North
Estimated requirements
West Schofields
Estimated requirements Shanes Park
Number per population
Population 3,504
Dwellings 1,228
Population 30,238
Dwellings 10,308
Population 11,200
Population 5,600
Population 1,400
Branch library
1:33,000 people
0.1 0.88 0.3 0.2 0.2
District Library
1:40,000 people 0.1 0.73 0.3 0.1 0.1
Source: Community Facilities and Open Space Assessment – Marsden Park (2012) (5.3 – Page 28), Community Facilities and Open Space Assessment – Marsden Park Industrial Precinct (2009) (6 – Page 23-24) and Blacktown City Council preliminary assessment Shanes Park/Marsden Park North.
The Section 94 Community Facilities Report (May 2008), identified a new model for delivery of community facilities – the Community Hub Model. Community Hubs will be local, multipurpose community facilities. They will provide a focus for local communities to come together for social, life-long learning and human service activities and services. Further research and development of this concept has resulted in a more efficient, cost effective and innovative model that provides greater opportunities for community engagement and outcomes proposed for these precincts.
5.2 Community Resource and Recreation Hub and 2nd Local Community Hub (Land only)
The Community Resource and Recreation Hub and Local Community Hub are proposed to include the principles of a Community Resource Hub and provide opportunities for increased co-location of agencies (and thus improved delivery of services and programs). The Community Resource and Recreation Hub and Local Community Hub located in the Marsden Park Precinct would enable the range of services and community facility requirements identified above to be co-located to meet the needs of the future Marsden Park and Marsden Park Industrial Precincts residents and for the aquatic and library needs of the future Marsden Park, Marsden Park Industrial, Marsden Park North, West Schofields and Shanes Park precincts. This would include, but not be limited, to the following defined functions.
• Leisure centre (aquatics, indoor recreation, health and fitness – aquatic servicing Marsden Park, Marsden Park Industrial Precinct, Marsden Park North, Shanes Park and West Schofields)
• Library (servicing Marsden Park, Marsden Park Industrial Precinct, Marsden Park North, Shanes Park and West Schofields)
• Neighbourhood centre, community and cultural development facilities • Child and family services and facilities • Youth centre • Arts centre function • Children and Family Services and Facilities.
__________________________________________________________________________________________
In force as at 14 December 2016 31

Section 94 Contributions Plan No.21 – Marsden Park
_____________________________________________________________________________________________________
5.3 Site Location In other release areas Council has not specifically zoned land for community facilities and had difficulty in locating suitable land for open space and recreation. This has led to problems in finding suitable locations for community facility sites due to resident objections. By zoning land specifically for community and recreation facility purposes the incoming population is aware at the time they purchase their property that community and recreation facilities will be provided on the nominated sites. Also Council can proceed with acquisition of each parcel of land when it is needed. The location of the Community Resource and Recreation Hub and 2nd Local Community Hub land required for community facilities is contained in Appendix "F".
5.4 Levels of Provision The types of community facilities and the number of items required by the incoming population in the release area were identified in the Community Facilities and Open Space Assessment – Marsden Park (2012) (5.3 – Page 28) undertaken by Macroplan Consulting as well as the Section 94 Community Facilities Report May 2008, undertaken by Council.
5.5 Essential Infrastructure However, as Community Facilities are not listed by the State Government as “Essential Infrastructure” only the land acquisition for these facilities will be levied under this Plan.
5.6 Contribution Catchment There is one community facilities contribution catchment and this corresponds to the boundaries of the Marsden Park and Marsden Industrial Park Precincts. A map showing the location of the community facilities contribution catchment is contained in Appendix "F". In order to determine actual provision levels and, ultimately, the contribution rate, the potential population of the community facilities contribution catchment has been calculated. The potential population is the number of people over which the cost of providing the works has been distributed and is explained further in Section 7.4. The population of the community facilities catchment is stated in Appendix "H".
5.7 Contribution Formula The following formula is used to calculate the contribution rate for Community Facilities:
CONTRIBUTION RATE = (L1 + L2)
($/PERSON) P
WHERE: L1 = The actual cost to Council to date of land provided for public community facilities purposes indexed to current day values.
L2 = The estimated cost of land yet to be provided for public community facilities purposes.
P = The estimated eventual population in the contribution catchment.
5.8 Community Facilities Costs and Schedules A more detailed explanation of the components in the contribution formula, including the indexation to current day values is provided in Section 7. A map of the catchment indicating possible locations of the Community Facilities is provided in Appendix "F".
__________________________________________________________________________________________
In force as at 14 December 2016 32

Section 94 Contributions Plan No.21 – Marsden Park
_____________________________________________________________________________________________________
The values of the components of the contribution formula are contained in the Schedule being Appendix "H". The resultant contribution rate is contained in the Schedule being Appendix "I".
__________________________________________________________________________________________
In force as at 14 December 2016 33

Section 94 Contributions Plan No.21 – Marsden Park
_____________________________________________________________________________________________________
6 Combined Precinct Facility
6.1 Nexus – E2 Conservation Zone The Conservation Zone located in the Riverstone Precinct services a number of precincts within the North West Growth Centre. The total costs for the Conservation Zone haves been apportioned amongst all residential precincts within the Blacktown LGA component of the North West Growth Centre. 27% of these costs are attributed to the Marsden Park Industrial and Marsden Park Precincts.
6.2 Contribution Formula The following formula is used to calculate the contribution rate for Combined Precinct Facilities:
CONTRIBUTION RATE = (L1 + L2 + C1 + C2 + PA)
($/PERSON) P
WHERE: L1 = The actual cost to Council to date of land provided for public combined precinct facilities purposes indexed to current day values.
L2 = The estimated cost of land yet to be provided for public combined precinct facilities purposes.
C1 = The actual cost to Council to date of constructing combined precinct facilities to the appropriate standard indexed to current day values.
C2 = The estimated cost of constructing future combined precinct facilities.
PA = Plan administration fee. This is 1.5% of the construction cost.
P = The estimated eventual population in the contribution catchment.
6.3 Combined Precinct Facility Costs and Works Schedules A more detailed explanation of the components in the contribution formula, including the indexation to current day values is provided in Section 7.
Precinct Expected Population % Apportioned
Riverstone 26,229 21.0%Alex Avenue 17,999 14.4%Riverstone East 15,000 12.0%Area 20 6,400 5.1%Marsden Park Industrial 3,504 2.8%Schofields 7,440 6.0%Marsden Park 30,238 24.2%Marsden Park North 11,200 9.0%Schofields West 5,600 4.5%Shanes Park 1,400 1.1%
Total 125,010 100.0%
__________________________________________________________________________________________
In force as at 14 December 2016 34

Section 94 Contributions Plan No.21 – Marsden Park
_____________________________________________________________________________________________________
A schedule of works for the contribution catchment is provided in Appendix "G" together with a map of the catchment indicating the location of the works. The values of the components of the contribution formula are contained in the Schedule being Appendix "H". The resultant contribution rate is contained in the Schedule being Appendix "I".
6.4 Nexus – Aquatic Facility The Aquatic Facility located in the Marsden Park Precinct services a number of Precincts within the North West Growth Centre. The total costs for the Aquatic Facility have been apportioned over the six Precincts of Marsden Park, Marsden Park Industrial, Schofields, Marsden Park North, Schofield West and Shanes Park. 56.8% of these costs are attributed to the Marsden Park Industrial and Marsden Park Precincts.
6.5 Contribution Formula The following formula is used to calculate the contribution rate for Aquatic Facility:
CONTRIBUTION RATE = (L1 + L2)
($/PERSON) P
WHERE: L1 = The actual cost to Council to date of land provided for an Aquatic facility public purpose adjusted to current day values. L2 = The estimated cost of land yet to be provided for an Aquatic facility public purpose. P = The estimated eventual population in the contribution catchment.
6.6 Combined Precinct Facility Costs and Works Schedules A more detailed explanation of the components in the contribution formula, including the indexation to current day values is provided in Section 7. The map of the catchment is provided in Appendix “G” indicating the location of the land. The values of the components of the contribution formula are contained in the Schedule being Appendix "H". The resultant contribution rate is contained in the Schedule being Appendix "I".
Precinct Expected Population % Apportioned
Marsden Park Industrial 3,504 5.9%Schofields 7,440 12.5%Marsden Park 30,238 50.9%Marsden Park North 11,200 18.9%Schofields West 5,600 9.4%Shanes Park 1,400 2.4%
Total 59,382 100.0%
__________________________________________________________________________________________
In force as at 14 December 2016 35

Section 94 Contributions Plan No.21 – Marsden Park
_____________________________________________________________________________________________________
7 Explanation of Contribution Formula Components
7.1 Introduction This Section provides an explanation of the various components of the contribution formulae detailed in Sections 2 to 6.
7.2 Explanation of the Land Components Before Council can construct amenities and services it must first provide the land on which the amenities and services are to be constructed. The land to be provided is often zoned for the specific purpose of the works to be constructed. For example, in the case of open space, the land to be acquired will be zoned RE1 - Public Recreation. In the contribution formulae:
L1 - Represents land that has previously been provided by Council for the purpose of providing the particular works. This amount reflects the actual cost to Council of acquiring these parcels (including valuation and conveyancing charges), indexed to current day $ values using the Consumer Price Index (CPI).
L2 - Represents the estimated average cost to Council of providing the lands required for the
purpose of providing works. As this figure is an estimated average total cost of acquisition, the amount adopted does not necessarily reflect the value of any individual property. Each parcel of land to be acquired is subject to detailed valuation at the time of its acquisition. The “L2” figure is supplied by Council's Valuer and takes into account the following matters:
• Acquisitions are undertaken in accordance with the provisions of the Land Acquisition
(Just Terms Compensation) Act, 1991, which requires that land is to be acquired for an amount not less than its market value (unaffected by the proposal) at the date of acquisition.
• That one of Council's objectives is to ensure that the funds Council receives for land
acquisition from Section 94 Contributions in a particular catchment are equivalent to the amount required to fund the purchase of all land Council must acquire in that catchment. Therefore, valuation and conveyancing charges incurred by Council when acquiring land are taken into account.
Council has calculated the total value of L1 and L2 in the contribution formulae. These values are detailed in Appendix "H".
7.3 Explanation of the Capital Components Schedules of works to be provided for the various items are detailed in Appendices "A" to "G" together with maps of each catchment showing the location of the works. In the contribution formula: C1 - Represents the actual cost to Council of constructing works already provided in the catchment
indexed to current day values using the Consumer Price Index (CPI).
C2 - Represents the estimated cost to Council of constructing works, which have yet to be provided in the catchment and are based on the most detailed designs that were available at the time of preparing the estimates.
__________________________________________________________________________________________
In force as at 14 December 2016 36

Section 94 Contributions Plan No.21 – Marsden Park
_____________________________________________________________________________________________________
7.4 Explanation of the Catchment Areas The area of the catchment is the total "developable area" in the catchment. In calculating the "developable area", land, which will never be required to pay a contribution, has been excluded. These "exclusions" include, amongst others, existing roads and roads which are themselves Section 94 items, but not subdivisional roads, land zoned for open space or drainage purposes and uses which existed prior to the land being rezoned for urban development and which are unlikely to be redeveloped. The purpose of identifying these exclusions is to ensure that only the new development (which is generating the need for the amenities and services) pays for their provision. The catchment area for Open Space, Recreation and Community Facilities are based on the estimated potential populations of the Marsden Park and Marsden Park Industrial Precincts.
7.5 Indexation In the formulae, previous land provisions (L1) and capital expenditures (C1) are indexed to current day values using the Consumer Price Index – All Groups Sydney (CPI). This index is published by the Australian Bureau of Statistics on a quarterly basis. The reason for indexing past expenditure is that every developer pays for a small proportion of the cost of providing each individual item identified in the Plan. This means that if/when items are constructed prior to all contributions within a catchment being collected, then "borrowing" (between items) occurs. If retrospective contributions are not indexed this "borrowing" will have occurred without any interest having been paid. This will result in a shortfall of funds when future items are constructed using the "paid back" contributions. What indexing effectively does is to make up the lost interest on the funds that have been borrowed between individual items. The CPI is one of the indices recommended for use by the Department of Planning and Infrastructure.
7.6 Assumed Occupancy Rates For the purpose of calculating open space and community facility contributions, occupancy rates have been determined for different types of development. These are as follows:
Dwelling houses 2.9 Persons / Dwelling
Dual Occupancy
1 Bedroom 1.2 Persons / Dwelling
2 Bedroom 1.9 Persons / Dwelling
3+ Bedroom 2.9 Persons / Dwelling
Integrated Housing
1 Bedroom 1.2 Persons / Dwelling
2 Bedroom 1.9 Persons / Dwelling
3+ Bedroom 2.9 Persons / Dwelling
Other Medium density
1 Bedroom Dwelling 1.2 Persons / Dwelling
2 Bedroom Dwelling 1.9 Persons / Dwelling
3 Bedroom Dwelling 2.7 Persons / Dwelling
For the purpose of this plan medium density includes all residential development other than that separately defined above, including but not limited to residential flat buildings and shop top housing.
__________________________________________________________________________________________
In force as at 14 December 2016 37

Section 94 Contributions Plan No.21 – Marsden Park
_____________________________________________________________________________________________________
Note: A bedroom is a room designed or intended for use as a bedroom or any room capable of being adapted to or used as a separate bedroom.
7.7 Indicative Contribution Rates (Residential) IPART has recommended that Council should provide indicative contributions per lot for various types of development and dwelling types. As such, indicative contributions per lot for Marsden Park are provided in the table below:
It should be noted that a survey and formal detailed plan is needed to accurately determine the actual amount of contributions payable. In the event that the contributions imposed under this plan are greater than the monetary cap referred to in Section 1.18, the contributions levied on development consent will not exceed the monetary cap imposed on development consent under the Minister’s Direction.
Density (Dwellings Per Ha) 12.5 15 25 28 35 40
Occupancy (No. Persons Per Dwelling) 2.9 2.9 2.7 2.7 2.7 2.7
South Creek Marsden Park Precinct $67,229 $61,012 $45,645
Little Creek Marsden Park Precinct $74,952 $67,450 $48,899
Marsden Creek Marsden Park Precinct $100,029 $66,416 $55,403
Bells Creek Marsden Park Precinct $101,538 $89,616 $60,771 $51,366
Bells Creek MPIP $38,653
Marsden Creek MPIP $45,884 $43,185
Little Creek MPIP SWQ4 $48,408
Little Creek MPIP SWQ7 $54,736
* Marsden Park Industrial Precinct - MPIP
Indicative Contributions Per Dwelling
__________________________________________________________________________________________
In force as at 14 December 2016 38

Section 94 Contributions Plan No.21 – Marsden Park
_____________________________________________________________________________________________________
8 Payment of Contributions
8.1 Methods of payment There are 3 possible methods of payment of S.94 Contributions - monetary contribution, dedication of land and works-in-kind agreements. Monetary Contribution This is the usual method of payment. When development consent is issued that involves the payment of a S.94 contribution, it contains a condition outlining the amount payable in monetary terms subject to indexation by the CPI. See section 7.5 for more details on indexation. Dedication of Land Where appropriate Council will permit S.94 public zoned land to offset the monetary contribution payable. The land that is to be provided must be in accordance with the zonings indicated on Council's planning instruments for the area. The assessment of the suitability of land for such an offset occurs at the development or subdivision application stage. If consent is issued for a development, and it requires the creation of the S.94 public zoned land then the applicant needs to negotiate the value of the S.94 public zoned land with Council. Upon agreement being formally reached as to the land's value, Council will offset the value of the land against the monetary contribution payable. It should be noted that Council will not release the final (linen) plan of subdivision which creates the land to be dedicated until a contract for the sale of the land (which confirms the purchase price/amount of compensation) has been entered into. Works-in-kind Agreements Council may accept the construction of works listed in the schedules to this plan to offset the monetary contribution payable. The applicant will need to initiate this option by providing Council with full details of the work proposed to be undertaken. Council will then consider the request and advise the applicant accordingly. The applicant will need to provide Council with suitable financial guarantees (normally by way of a Bank Guarantee) for 1.25 times the amount of the works in addition to a maintenance allowance and any GST amounts applicable. Upon completion of the works to Council's satisfaction the guarantee will be discharged by Council. Approval of any Works-In-Kind is conditional upon the developer paying all Council’s legal costs incurred in the preparation of the Works-In-Kind (Deed of) Agreement. Cost estimates for works include a component for supervision (equivalent to 3% of the cost of the works being undertaken). Where Works In Kind are undertaken Council requires that the supervision fee be in the form of a cash payment. Thus this particular part of the cost of the works is included as an offset against contributions.
8.2 Timing of Payment Council's policy regarding the timing of payment of S.94 contributions is as follows:
Approved under the EP & A Act as it existed pre July 1998 -
• Development Applications involving subdivisions Prior to the release of the "linen plan" of subdivision.
__________________________________________________________________________________________
In force as at 14 December 2016 39

Section 94 Contributions Plan No.21 – Marsden Park
_____________________________________________________________________________________________________
• Development Applications involving building work - Prior to release of the Building Permit.
Note: Applications for combined building and subdivision approval are required to pay contributions upon whichever of these events occurs first.
• Development Applications where no building approval is required - Prior to occupation.
Approved under the EP & A Act as amended on and from July 1 1998 -
• Development Applications involving subdivisions Prior to release of the Subdivision Certificate
• Development Applications involving building work Prior to release of Building Construction Certificate.
• Development Applications where no building approval is required Prior to occupation or use of the development.
Note: Applications for combined building and subdivision approval are required to pay contributions upon whichever of these events occurs first.
8.3 Indexation of Contributions Contribution rates are indexed quarterly in accordance with the Consumer Price Index – All Groups Sydney (CPI). The method of indexing the contribution rates is to multiply the base contribution rate by the most recently published CPI at the time of payment and in the case of this version of the Plan, divide it by the June 2016 CPI (116.7).
8.4 Discounting of Contributions Council does not discount contributions both for equity and financial reasons, as it would be inequitable to recoup a discount from remaining development. Discounting would also compromise Council’s ability to provide the facilities and would place an additional burden on existing residents to subsidise new development.
8.5 Deferred Payment of Contributions Council has a policy for the deferred payment of S.94 contributions as follows:
• an applicant requesting deferred payment needs to apply in writing to Council. All requests are considered on their merits having regard to (but not exclusively) the type of work for which the contribution is sought, the rate of development occurring within the area and the impending need to construct the works for which S.94 Contributions are being levied
• where deferred payment is approved by Council the period of time for deferring
payment will generally be limited to 12 months • if Council approves of the request for deferred payment it is conditional upon the
applicant providing a suitable Bank Guarantee and Deed of Agreement • interest is charged on deferred contributions. Council also charges an administrative
fee for deferred payment. The interest rate and administrative fee levied for the deferred payment of contributions are reviewed annually and appear in Council's
__________________________________________________________________________________________
In force as at 14 December 2016 40

Section 94 Contributions Plan No.21 – Marsden Park
_____________________________________________________________________________________________________
Schedule of Fees. A copy of this Schedule is available from Council's Development Services Unit
• the amount of the bank guarantee shall be the sum of the amount of contributions
outstanding at the time of deferring payment plus the expected "interest" accrued over the deferral period. This amount will also represent the amount payable at the end of the deferral period
• the Deed of Agreement is to be prepared by one of Council's Solicitors at full cost to
the applicant. In this regard the applicant is to pay Council's Solicitor's costs direct to the Solicitor and not through Council
• should contributions not be paid by the due date, the bank guarantee will be called up
by Council • Council has a separate deferral policy specifically for dual occupancies, which are to
be occupied by elderly and/or disabled persons (i.e. traditional granny flats) • enquiries regarding deferred payment can be made through contacting the relevant
Council officer dealing with the development application.
__________________________________________________________________________________________
In force as at 14 December 2016 41

Section 94 Contributions Plan No.21 – Marsden Park
_____________________________________________________________________________________________________
Appendices
__________________________________________________________________________________________
In force as at 14 December 2016 42

Section 94 Contributions Plan No.21 – Marsden Park
_____________________________________________________________________________________________________
Catchment Areas indicative only Map information is not necessarily up-to-date or correct and Blacktown City Council accepts no responsibility in that regard. As such no reliance on these maps should be made without reference to Council’s GIS mapping of catchment zones.
MARSDEN PARK INDUSTRIAL PRECINCT WATER CYCLE MANAGEMENT FACILITIES
APPENDIX A1 of 13
CONTRIBUTION ITEM Water Cycle
Management
CATCHMENT AREA Marsden Park Industrial
Precinct __________________________________________________________________________________________
In force as at 14 December 2016 43

Section 94 Contributions Plan No.21 – Marsden Park
_____________________________________________________________________________________________________
MARSDEN PARK INDUSTRIAL PRECINCT WATER CYCLE MANAGEMENT FACILITIES
BELLS CREEK STORMWATER QUANTITY
APPENDIX A2 of 13
CONTRIBUTION ITEM Stormwater Quantity
Management
CATCHMENT AREA Bells Creek
Marsden Park Industrial Precinct
Catchment Areas indicative only Map information is not necessarily up-to-date or correct and Blacktown City Council accepts no responsibility in that regard. As such no reliance on these maps should be made without reference to Council’s GIS mapping of catchment zones.
__________________________________________________________________________________________
In force as at 14 December 2016 44

Section 94 Contributions Plan No.21 – Marsden Park
_____________________________________________________________________________________________________
MARSDEN PARK INDUSTRIAL PRECINCT WATER CYCLE MANAGEMENT FACILITIES
BELLS CREEK STORMWATER QUANTITY
June 2016 2016 - 2021 2021-2026 2027-2032
Marsden Park Industrial Precinct - Bells Creek Catchment - Quantity
B1.1 Landscaped tail out drain, variable width $457,275 $457,275
B1.2 Detention basin $788,479 $788,479
B1.4 20.5m Wide landscaped open channel $398,513 $398,513
B1.5 4200x1200 Culvert under future road $170,944 $170,944
B1.6 20.5m Wide landscaped open channel $325,862 $325,862
B1.7 2.1859 Detention basin $0 $2,535,000 $2,535,000
B2.1 0.3873 26.6m Wide landscaped open channel $0 $527,000 $527,000
B2.2 Detention basin $4,990,496 $4,990,496
B2.4 26.6m Wide landscaped open channel $1,517,128 $1,517,128
B2.6 1350mm Trunk drainage line $1,071,605 $1,071,605
B3.1 1.1609 Variable width channel stabilisation $402,000 $402,000
B3.2 4.8666 Detention basin $0 $7,680,000 $7,680,000
B3.4 5x3900x1200 Culvert under existing access
$0 $445,000 $445,000
B3.5 1.3820 52.5m Wide landscaped open channel $0 $3,487,000 $3,487,000
B4.1 1x3600x900 Culvert and 16.5m overland flow path
$0 $1,471,000 $1,471,000
17.2041 $10,122,302 $11,686,000 $527,000 $3,932,000 $26,267,302
4.4174
Site No. Description of WorksLand Area (Ha)
2.8040
TotalEstimated Cost & Indicative Timing of DeliveryCompleted cost
Indexed to
CONTRIBUTION ITEM Stormwater Quantity
Management
CATCHMENT AREA Bells Creek
Marsden Park Industrial Precinct
APPENDIX A3 of 13
The land areas in the second column are indicative only. For confirmation, please contact Council.
__________________________________________________________________________________________
In force as at 14 December 2016 45

Section 94 Contributions Plan No.21 – Marsden Park
_____________________________________________________________________________________________________
MARSDEN PARK INDUSTRIAL PRECINCT WATER CYCLE MANAGEMENT FACILITIES
BELLS CREEK STORMWATER QUALITY – SWQ1 & SWQ2
APPENDIX A4 of 13
CONTRIBUTION ITEM Stormwater Quality
Management
CATCHMENT AREA Bells Creek
Marsden Park Industrial Precinct
Catchment Areas indicative only Map information is not necessarily up-to-date or correct and Blacktown City Council accepts no responsibility in that regard. As such no reliance on these maps should be made without reference to Council’s GIS mapping of catchment zones.
__________________________________________________________________________________________
In force as at 14 December 2016 46

Section 94 Contributions Plan No.21 – Marsden Park
_____________________________________________________________________________________________________
MARSDEN PARK INDUSTRIAL PRECINCT WATER CYCLE MANAGEMENT FACILITIES
BELLS CREEK STORMWATER QUALITY – SWQ1
BELLS CREEK STORMWATER QUALITY – SWQ2
June 2016 2016 - 2021 2021-2026 2027-2032
Marsden Park Industrial Precinct - Bells Creek Catchment - Quality SWQ1
B1.3 Bio-retention located in detention basin $353,221 $133,000 $486,221
B1.8 Bio-retention located in detention basin $0 $615,000 $615,000
B1.9 Gross pollutant trap at inlet to basin $0 $253,300 $253,300
B1.10 Gross pollutant trap at inlet to basin $117,524 $117,524
B1.11 Gross pollutant trap $0 $91,800 $91,800
B1.12 Gross pollutant trap $58,762 $58,762
B2.3 Bio-retention located in detention basin $2,427,405 $2,427,405
B2.5 Gross pollutant trap at inlet to channel $149,576 $149,576
B2.7 Gross pollutant trap at inlet to basin $0 $253,300 $253,300
B3.3 Bio-retention located in detention basin $0 $655,000 $655,000
B4.2 Gross pollutant trap at inlet to basin $0 $166,600 $166,600
$3,106,488 $1,461,200 $706,800 $0 $5,274,488
Site No. Description of WorksLand Area (Ha) Total
Estimated Cost & Indicative Timing of DeliveryCompleted cost Indexed to
June 2016 2016 - 2021 2021-2026 2027-2032
Marsden Park Industrial Precinct - Bells Creek Catchment - Quality SWQ2
B5.1 Gross pollutant trap at inlet to bio-retention $120,000 $120,000
B5.2 Gross pollutant trap at inlet to bio-retention $120,000 $120,000
B5.3 Stand alone Bio-retention $30,000 $30,000
B5.4 Stand alone Bio-retention $67,000 $67,000
$337,000 $0 $0 $0 $337,000
Site No. Description of WorksLand Area (Ha) Total
Estimated Cost & Indicative Timing of DeliveryCompleted cost Indexed to
APPENDIX A5 of 13
CONTRIBUTION ITEM Stormwater Quality
Management
CATCHMENT AREA Bells Creek
Marsden Park Industrial Precinct __________________________________________________________________________________________
In force as at 14 December 2016 47

Section 94 Contributions Plan No.21 – Marsden Park
_____________________________________________________________________________________________________
MARSDEN PARK INDUSTRIAL PRECINCT WATER CYCLE MANAGEMENT FACILITIES MARSDEN CREEK STORMWATER QUANTITY
CATCHMENT AREA Marsden Creek
Marsden Park Industrial Precinct
Catchment Areas indicative only Map information is not necessarily up-to-date or correct and Blacktown City Council accepts no responsibility in that regard. As such no reliance on these maps should be made without reference to Council’s GIS mapping of catchment zones.
APPENDIX A6 of 13
CONTRIBUTION ITEM Stormwater Quantity
Management __________________________________________________________________________________________
In force as at 14 December 2016 48

Section 94 Contributions Plan No.21 – Marsden Park
_____________________________________________________________________________________________________
MARSDEN PARK INDUSTRIAL PRECINCT WATER CYCLE MANAGEMENT FACILITIES
MARSDEN CREEK STORMWATER QUANTITY
June 2016 2016 - 2021 2021-2026 2027-2032
Marsden Park Industrial Precinct - Marsden Creek Catchment - Quantity
M1.1 3x2700x1200 Culvert under South Street $0 $656,000 $656,000
M1.2 1.3032 30.5m Wide landscaped open channel $0 $595,000 $595,000
M1.3 3x2700x1200 Culvert under future road $0 $388,000 $388,000
M1.4 1.4035 30.5m Wide landscaped open channel $0 $1,392,000 $1,392,000
M1.5 3x2700x1200 Culvert under future road $0 $994,000 $994,000
M1.6 Detention basin $0 $4,392,000 $4,392,000
M1.8 36.5m Wide landscaped open channel $0 $1,197,000 $1,197,000
M1.9 3x3600x1200 Culvert under future road $0 $515,000 $515,000
M1.10 1.4674 35m Wide landscaped open channel $0 $1,714,000 $1,714,000
M1.11 1x3600x1200 Culvert under future road $0 $228,000 $228,000
M2.1 900mm Drainage line under South Street $0 $70,000 $70,000
M2.2 1.2165 Detention Basin $0 $2,016,000 $2,016,000
12.8290 $0 $12,071,000 $2,086,000 $0 $14,157,000
7.4384
Site No. Description of WorksLand Area (Ha) Total
Estimated Cost & Indicative Timing of DeliveryCompleted cost Indexed to
APPENDIX A7 of 13
CATCHMENT AREA Marsden Creek
Marsden Park Industrial Precinct
CONTRIBUTION ITEM Stormwater Quantity
Management
The land areas in the second column are indicative only. For confirmation, please contact Council.
__________________________________________________________________________________________
In force as at 14 December 2016 49

Section 94 Contributions Plan No.21 – Marsden Park
_____________________________________________________________________________________________________
Catchment Areas indicative only Map information is not necessarily up-to-date or correct and Blacktown City Council accepts no responsibility in that regard. As such no reliance on these maps should be made without reference to Council’s GIS mapping of catchment zones.
CONTRIBUTION ITEM Stormwater Quality
Management
CATCHMENT AREA Marsden Creek
Marsden Park Industrial Precinct
MARSDEN PARK INDUSTRIAL PRECINCT WATER CYCLE MANAGEMENT FACILITIES
MARSDEN CREEK STORMWATER QUALITY – SWQ3
APPENDIX A8 of 13
__________________________________________________________________________________________
In force as at 14 December 2016 50

Section 94 Contributions Plan No.21 – Marsden Park
_____________________________________________________________________________________________________
CATCHMENT AREA Marsden Creek
Marsden Park Industrial Precinct
CONTRIBUTION ITEM Stormwater Quality
Management
APPENDIX A9 of 13
MARSDEN PARK INDUSTRIAL PRECINCT WATER CYCLE MANAGEMENT FACILITIES
MARSDEN CREEK STORMWATER QUALITY – SWQ3
__________________________________________________________________________________________
In force as at 14 December 2016 51
June 2016 2016 - 2021 2021-2026 2027-2032
Marsden Park Industrial Precinct - Marsden Creek Catchment - Quality SWQ3
M1.7 Bio-retention located in detention basin $0 $2,702,000 $2,702,000
M1.13 Gross pollutant trap at inlet to channel $0 $79,600 $79,600
M1.14 Gross pollutant trap at inlet to channel $0 $79,600 $79,600
M1.15 Gross pollutant trap at inlet to channel $0 $79,600 $79,600
M1.16 Gross pollutant trap at inlet to basin $0 $166,600 $166,600
M1.17 Gross pollutant trap at inlet to channel $0 $137,400 $137,400
M2.3 Bio-retention located in detention basin $0 $471,000 $471,000
M2.4 Gross pollutant trap at inlet to basin $0 $91,800 $91,800
$0 $2,960,400 $847,200 $0 $3,807,600
Site No. Description of WorksLand Area (Ha) Total
Estimated Cost & Indicative Timing of DeliveryCompleted cost Indexed to

Section 94 Contributions Plan No.21 – Marsden Park
_____________________________________________________________________________________________________
MARSDEN PARK INDUSTRIAL PRECINCT WATER CYCLE MANAGEMENT FACILITIES
LITTLE CREEK STORMWATER QUANTITY
APPENDIX A10 of 13
Catchment Areas indicative only Map information is not necessarily up-to-date or correct and Blacktown City Council accepts no responsibility in that regard. As such no reliance on these maps should be made without reference to Council’s GIS mapping of catchment zones.
CATCHMENT AREA Little Creek
Marsden Park Industrial Precinct
CONTRIBUTION ITEM Stormwater Quantity
Management __________________________________________________________________________________________
In force as at 14 December 2016 52

Section 94 Contributions Plan No.21 – Marsden Park
_____________________________________________________________________________________________________
MARSDEN PARK INDUSTRIAL PRECINCT WATER CYCLE MANAGEMENT FACILITIES
LITTLE CREEK STORMWATER QUANTITY
June 2016 2016 - 2021 2021-2026 2027-2032
Marsden Park Industrial Precinct - Little Creek Catchment - Quantity
L1.1 1.8599 Detention basin $0 $5,219,000 $5,219,000
L1.3 3000x900mm Drainage line from South St to Basin L1.1
$0 $850,000 $850,000
L2.1 1800x900 Culvert under South Street $0 $227,000 $227,000
L2.2 1.3845 Detention basin $0 $5,411,000 $5,411,000
L3.1 4x3300x1200 Culvert under South Street $0 $1,024,000 $1,024,000
L3.2 4.2824 Detention basin $0 $9,214,000 $9,214,000
L3.5 4x3000x1200 Culvert under future road $0 $888,000 $888,000
L3.6 1.1109 37.5m Wide landscaped open channel $0 $1,047,000 $1,047,000
L4.1 Flow diversion culvert $0 $3,771,000 $3,771,000
L4.2 Stand alone Bio-retention $0 $3,443,000 $3,443,000
8.6377 $0 $19,246,000 $10,597,000 $1,251,000 $31,094,000
Site No. Description of WorksLand Area (Ha) Total
Estimated Cost & Indicative Timing of DeliveryCompleted cost Indexed to
APPENDIX A11 of 13
CONTRIBUTION ITEM Stormwater Quantity
Management
CATCHMENT AREA Little Creek
Marsden Park Industrial Precinct
The land areas in the second column are indicative only. For confirmation, please contact Council.
__________________________________________________________________________________________
In force as at 14 December 2016 53

Section 94 Contributions Plan No.21 – Marsden Park
_____________________________________________________________________________________________________
MARSDEN PARK INDUSTRIAL PRECINCT WATER CYCLE MANAGEMENT FACILITIES
LITTLE CREEK STORMWATER QUALITY – SWQ4 to SWQ7
Catchment Areas indicative only Map information is not necessarily up-to-date or correct and Blacktown City Council accepts no responsibility in that regard. As such no reliance on these maps should be made without reference to Council’s GIS mapping of catchment zones.
APPENDIX A12 of 13
CONTRIBUTION ITEM Stormwater Quality
Management
CATCHMENT AREA Little Creek
Marsden Park Industrial Precinct
__________________________________________________________________________________________
In force as at 14 December 2016 54

Section 94 Contributions Plan No.21 – Marsden Park
_____________________________________________________________________________________________________
Catchment Areas indicative only Map information is not necessarily up-to-date or correct and Blacktown City Council accepts no responsibility in that regard. As such no reliance on these maps should be made without reference to Council’s GIS mapping of catchment zones.
MARSDEN PARK INDUSTRIAL PRECINCT WATER CYCLE MANAGEMENT FACILITIES
LITTLE CREEK STORMWATER QUALITY – SWQ4 to SWQ7
June 2016 2016 - 2021 2021-2026 2027-2032
Marsden Park Industrial Precinct - Little Creek Catchment - Quality SWQ4
L1.2Bio-retention located in detention basin (83% of total cost) $0 $435,750 $435,750
L1.4Gross pollutant trap at inlet to basin (83% of total cost) $0 $210,239 $210,239
$0 $210,239 $435,750 $0 $645,989
Marsden Park Industrial Precinct - Little Creek Catchment - Quality SWQ5
L1.2 Bio-retention located in detention basin (17% of total cost)
$0 $89,250 $89,250
L1.4 Gross pollutant trap at inlet to basin (17% of total cost)
$0 $43,061 $43,061
$0 $43,061 $89,250 $0 $132,311
Marsden Park Industrial Precinct - Little Creek Catchment - Quality SWQ6
L2.3 Bio-retention located in detention basin $0 $336,000 $336,000
L2.4 Gross pollutant trap at inlet to basin $0 $79,600 $79,600
L3.3 Bio-retention located in detention basin $0 $946,000 $946,000
L3.7 Gross pollutant trap at inlet to basin $0 $137,400 $137,400
$0 $415,600 $1,083,400 $0 $1,499,000
Marsden Park Industrial Precinct - Little Creek Catchment - Quality SWQ7
L1.5 0.1600 Stand alone Bio-retention $0 $713,000 $713,000
L1.6 Gross pollutant trap at inlet to basin $0 $91,800 $91,800
$0 $0 $0 $804,800 $804,800
Site No. Description of WorksLand Area (Ha) Total
Estimated Cost & Indicative Timing of DeliveryCompleted cost Indexed to
APPENDIX A13 of 13
CONTRIBUTION ITEM Stormwater Quality
Management
CATCHMENT AREA Little Creek SWQ4
to SWQ7
The land areas in the second column are indicative only. For confirmation, please contact Council.
__________________________________________________________________________________________
In force as at 14 December 2016 55

Section 94 Contributions Plan No.21 – Marsden Park
_____________________________________________________________________________________________________
MARSDEN PARK INDUSTRIAL PRECINCT TRAFFIC AND TRANSPORT MANAGEMENT FACILITIES
Catchment Areas indicative only Map information is not necessarily up-to-date or correct and Blacktown City Council accepts no responsibility in that regard. As such no reliance on these maps should be made without reference to Council’s GIS mapping of catchment zones.
CATCHMENT AREA Marsden Park Industrial
Precinct
APPENDIX B1 of 2
CONTRIBUTION ITEM Traffic & Transport
Management
__________________________________________________________________________________________
In force as at 14 December 2016 56

Section 94 Contributions Plan No.21 – Marsden Park
_____________________________________________________________________________________________________
MARSDEN PARK INDUSTRIAL PRECINCT TRAFFIC AND TRANSPORT MANAGEMENT FACILITIES
MAJOR ROADS
June 2016 2016 - 2021 2021-2026 2027-2032
R1 3.8542 MAIN NORTH SOUTH ROADIndustrial Sub-arterial road full width from South Street to Hollinsworth Road.
$1,783,570 $6,192,000 $7,975,570
R2 2.4490 HOLLINSWORTH ROAD Industrial Sub-arterial road full width from Richmond Road
$5,262,982 $4,788,000 $10,050,982
R3 2.6516 HOLLINSWORTH ROAD EXTENSION
Industrial collector full width from end of existing Hollinsworth Road to South Street
$0 $7,025,000 $7,025,000
Miscellaneous
0.1200LOCAL TRAFFIC MANAGEMENT ROUNDABOUTS
3 x Additional roundabouts for local area traffic managment
$0 $818,000 $818,000
Allow for shelters near locations designated in DCP Schedule 3 (approx 6)
$0 $99,000 $99,000
9.0748 $7,046,552 $10,980,000 $7,942,000 $0 $25,968,552
BUS SHELTERS
Location Estimated Cost & Indicative Timing of Delivery Completed
cost Indexed to Description of Works
Area of Land to be Acquired
(Ha)
Site No. Total
APPENDIX B2 of 2
CONTRIBUTION ITEM Traffic & Transport
Management
CATCHMENT AREA Major Roads
Marsden Park Industrial Precinct
The land areas in the second column are indicative only. For confirmation, please contact Council.
__________________________________________________________________________________________
In force as at 14 December 2016 57

Section 94 Contributions Plan No.21 – Marsden Park
_____________________________________________________________________________________________________
MARSDEN PARK PRECINCT WATER CYCLE MANAGEMENT FACILITIES
Catchment Areas indicative only Map information is not necessarily up-to-date or correct and Blacktown City Council accepts no responsibility in that regard. As such no reliance on these maps should be made without reference to Council’s GIS mapping of catchment zones.
APPENDIX C1 of 15
CONTRIBUTION ITEM Water Cycle
Management
CATCHMENT AREA Marsden Park Precinct
__________________________________________________________________________________________
In force as at 14 December 2016 58

Section 94 Contributions Plan No.21 – Marsden Park
_____________________________________________________________________________________________________
MARSDEN PARK PRECINCT WATER CYCLE MANAGEMENT FACILITIES
BELLS CREEK STORMWATER QUANTITY
Catchment Areas indicative only Map information is not necessarily up-to-date or correct and Blacktown City Council accepts no responsibility in that regard. As such no reliance on these maps should be made without reference to Council’s GIS mapping of catchment zones.
June 2016 2016 - 2021 2021-2026 2027-2032
Marsden Park Precinct - Bells Creek Catchment - Quantity
MB 1.0 1.8047 Detention basin $0 $3,946,000 $3,946,000
MB 2.0 3.0290 Detention basin $0 $2,897,000 $2,897,000
4.8337 $0 $0 $0 $6,843,000 $6,843,000
Site No. Description of WorksLand Area (Ha) Total
Estimated Cost & Indicative Timing of DeliveryCompleted cost Indexed to
CATCHMENT AREA Bells Creek
Marsden Park Precinct
CONTRIBUTION ITEM Stormwater Quantity
Management
APPENDIX C2 of 15
The land areas in the second column are indicative only. For confirmation, please contact Council.
__________________________________________________________________________________________
In force as at 14 December 2016 59

Section 94 Contributions Plan No.21 – Marsden Park
_____________________________________________________________________________________________________
MARSDEN PARK PRECINCT WATER CYCLE MANAGEMENT FACILITIES
BELLS CREEK STORMWATER QUALITY – SWQ8
June 2016 2016 - 2021 2021-2026 2027-2032
Marsden Park Precinct - Bells Creek Catchment - Quality SWQ8
MB 1.1 Bio-retention located in detention basin $0 $834,000 $834,000
MB 1.2 Gross pollutant trap at inlet to basin $0 $253,300 $253,300
MB 2.1 Bio-retention located in detention basin $0 $354,000 $354,000
MB 2.2 Gross pollutant trap at inlet to basin $0 $253,300 $253,300
$0 $0 $0 $1,694,600 $1,694,600
Site No. Description of WorksLand Area (Ha) Total
Estimated Cost & Indicative Timing of DeliveryCompleted cost Indexed to
APPENDIX C3 of 15
CONTRIBUTION ITEM Stormwater Quality
Management
CATCHMENT AREA Bells Creek
Marsden Park Precinct __________________________________________________________________________________________
In force as at 14 December 2016 60

Section 94 Contributions Plan No.21 – Marsden Park
_____________________________________________________________________________________________________
MARSDEN PARK PRECINCT WATER CYCLE MANAGEMENT FACILITIES
MARSDEN CREEK STORMWATER QUANTITY
Catchment Areas indicative only Map information is not necessarily up-to-date or correct and Blacktown City Council accepts no responsibility in that regard. As such no reliance on these maps should be made without reference to Council’s GIS mapping of catchment zones.
APPENDIX C4 of 15
CONTRIBUTION ITEM Stormwater Quantity
Management
CATCHMENT AREA Marsden Creek
Marsden Park Precinct
__________________________________________________________________________________________
In force as at 14 December 2016 61

Section 94 Contributions Plan No.21 – Marsden Park
_____________________________________________________________________________________________________
MARSDEN PARK PRECINCT WATER CYCLE MANAGEMENT FACILITIES
MARSDEN CREEK STORMWATER QUANTITY
June 2016 2016 - 2021 2021-2026 2027-2032
Marsden Park Precinct - Marsden Creek Catchment - Quantity
MM 1.0 1.8454 Detention basin $0 $3,181,000 $3,181,000
MM 2.0 Detention basin $1,383,613 $23,934,387 $25,318,000
MM 2.6 21.4m Wide landscaped open channel $0 $2,830,000 $2,830,000
MM 2.9 28.6m Wide landscaped open channel $737,725 $134,000 $871,725
MM 3.0 5x3600x1200mm Culvert under future road $0 $624,000 $624,000
MM 3.1 2.0389 Detention basin $0 $3,832,500 $3,832,500
MM 3.4 Detention basin $0 $6,493,500 $6,493,500
MM 3.8 30m Wide landscaped open channel $0 $2,037,000 $2,037,000
MM 3.11 3x3000x1200mm Culvert under future road $0 $2,682,000 $2,682,000
MM 3.13 3x2700x1200mm Culvert under future road $0 $2,732,000 $2,732,000
21.9262 $2,121,338 $134,000 $34,839,387 $13,507,000 $50,601,725
Site No. Description of WorksLand Area (Ha)
14.4800
3.5619
TotalEstimated Cost & Indicative Timing of DeliveryCompleted cost
Indexed to
APPENDIX C5 of 15
CONTRIBUTION ITEM Stormwater Quantity
Management
CATCHMENT AREA Marsden Creek
Marsden Park Precinct
The land areas in the second column are indicative only. For confirmation, please contact Council.
__________________________________________________________________________________________
In force as at 14 December 2016 62

Section 94 Contributions Plan No.21 – Marsden Park
_____________________________________________________________________________________________________
MARSDEN PARK PRECINCT WATER CYCLE MANAGEMENT FACILITIES
MARSDEN CREEK STORMWATER QUALITY – SWQ9
Catchment Areas indicative only Map information is not necessarily up-to-date or correct and Blacktown City Council accepts no responsibility in that regard. As such no reliance on these maps should be made without reference to Council’s GIS mapping of catchment zones.
APPENDIX C6 of 15
CONTRIBUTION ITEM Stormwater Quality
Management
CATCHMENT AREA Marsden Creek
Marsden Park Precinct __________________________________________________________________________________________
In force as at 14 December 2016 63

Section 94 Contributions Plan No.21 – Marsden Park
_____________________________________________________________________________________________________
MARSDEN PARK PRECINCT WATER CYCLE MANAGEMENT FACILITIES
MARSDEN CREEK STORMWATER QUALITY – SWQ9
June 2016 2016 - 2021 2021-2026 2027-2032
Marsden Park Precinct - Marsden Creek Catchment - Quality SWQ9
MM 1.1 Bio-retention located in detention basin $0 $1,123,000 $1,123,000
MM 1.2 Gross pollutant trap at inlet to basin $0 $108,700 $108,700
MM 1.3 Gross pollutant trap at inlet to basin $0 $253,300 $253,300
MM 2.1 Bio-retention located in detention basin $246,032 $1,946,211 $2,192,243
MM 2.2 Gross pollutant trap at inlet to basin $100,920 $100,920
MM 2.3 Gross pollutant trap at inlet to basin $0 $253,300 $253,300
MM 2.4 Gross pollutant trap at inlet to basin $0 $108,700 $108,700
MM 2.5 Gross pollutant trap at inlet to channel $0 $79,600 $79,600
MM 2.7 Gross pollutant trap at inlet to channel $0 $91,800 $91,800
MM 2.8 Gross pollutant trap at inlet to channel $0 $253,300 $253,300
MM 2.10 Gross pollutant trap at inlet to channel $262,392 $262,392
MM 2.12 Gross pollutant trap at inlet to channel $0 $91,800 $91,800
MM2.13 Stand alone Bio-retention $0 $743,000 $743,000
MM 2.14 Stand alone Bio-retention $0 $1,321,000 $1,321,000
MM 3.2 Bio-retention located in detention basin $0 $180,000 $180,000
MM 3.3 Gross pollutant trap at inlet to basin $0 $91,800 $91,800
MM 3.5 Bio-retention located in detention basin $0 $592,000 $592,000
MM 3.6 Gross pollutant trap at inlet to basin $0 $91,800 $91,800
MM 3.7 Gross pollutant trap at inlet to basin $0 $91,800 $91,800
MM 3.9 Stand alone Bio-retention $0 $1,538,000 $1,538,000
MM 3.10 Gross pollutant trap at inlet to channel $0 $137,400 $137,400
MM 3.12 Gross pollutant trap at inlet to channel $0 $253,300 $253,300
$609,344 $506,600 $7,522,211 $1,321,000 $9,959,155
Site No. Description of WorksLand Area (Ha) Total
Estimated Cost & Indicative Timing of DeliveryCompleted cost Indexed to
APPENDIX C7 of 15
CONTRIBUTION ITEM Stormwater Quality
Management
CATCHMENT AREA Marsden Creek
Marsden Park Precinct
__________________________________________________________________________________________
In force as at 14 December 2016 64
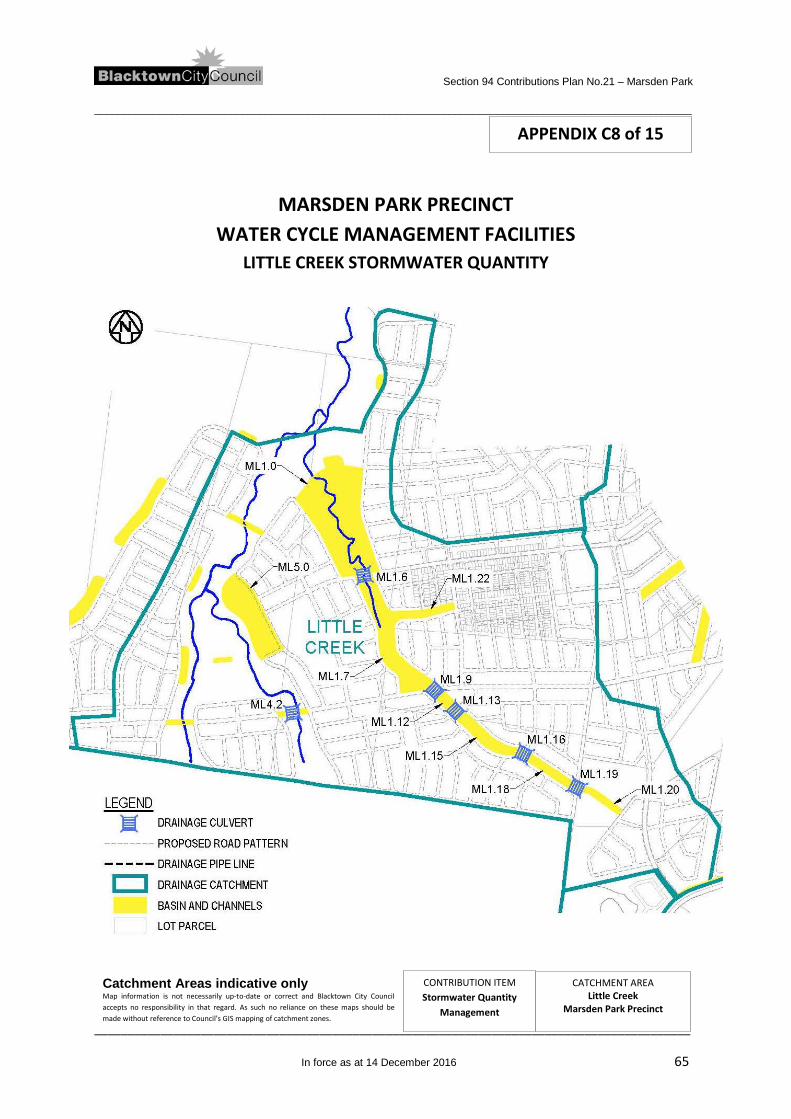
Section 94 Contributions Plan No.21 – Marsden Park
_____________________________________________________________________________________________________
Catchment Areas indicative only Map information is not necessarily up-to-date or correct and Blacktown City Council accepts no responsibility in that regard. As such no reliance on these maps should be made without reference to Council’s GIS mapping of catchment zones.
APPENDIX C8 of 15
CONTRIBUTION ITEM Stormwater Quantity
Management
CATCHMENT AREA Little Creek
Marsden Park Precinct
MARSDEN PARK PRECINCT
WATER CYCLE MANAGEMENT FACILITIES
LITTLE CREEK STORMWATER QUANTITY
__________________________________________________________________________________________
In force as at 14 December 2016 65

Section 94 Contributions Plan No.21 – Marsden Park
_____________________________________________________________________________________________________
MARSDEN PARK PRECINCT WATER CYCLE MANAGEMENT FACILITIES
LITTLE CREEK STORMWATER QUANTITY
June 2016 2016 - 2021 2021-2026 2027-2032
Marsden Park Precinct - Little Creek Catchment - Quantity
ML 1.0 23.3760 Detention basin $0 $16,185,000 $16,185,000
ML 1.6 9x3600x1500mm Culvert under future road $0 $1,094,000 $1,094,000
ML 1.7 55m Wide landscaped open channel $0 $6,427,000 $6,427,000
ML 1.9 9x3600x1200mm Culvert under future road $0 $1,073,000 $1,073,000
ML 1.12 50.4m Wide landscaped open channel $0 $5,287,000 $5,287,000
ML 1.13 5x3600x1200mm Culvert under future road $0 $519,000 $519,000
ML 1.15 50.4m Wide landscaped open channel $0 $3,240,000 $3,240,000
ML 1.16 5x3600x1200mm Culvert under future road $0 $519,000 $519,000
ML 1.18 22.6m Wide landscaped open channel $0 $1,826,000 $1,826,000
ML 1.19 5x2400x1200mm Culvert under future road $0 $341,000 $341,000
ML 1.20 17.3m Wide landscaped open channel $0 $1,204,000 $1,204,000
ML 1.22 33m Wide landscaped open channel $0 $2,859,000 $2,859,000
ML 4.2 13x3600x1200mm Culvert under future road
$0 $1,521,000 $1,521,000
ML 5.0 5.0079 Detention basin $0 $4,378,000 $4,378,000
28.3839 $0 $38,101,000 $8,372,000 $0 $46,473,000
Site No. Description of WorksLand Area (Ha) Total
Estimated Cost & Indicative Timing of DeliveryCompleted cost Indexed to
APPENDIX C9 of 15
CONTRIBUTION ITEM Stormwater Quantity
Management
CATCHMENT AREA Little Creek
Marsden Park Precinct
The land areas in the second column are indicative only. For confirmation, please contact Council.
__________________________________________________________________________________________
In force as at 14 December 2016 66

Section 94 Contributions Plan No.21 – Marsden Park
_____________________________________________________________________________________________________
MARSDEN PARK PRECINCT WATER CYCLE MANAGEMENT FACILITIES LITTLE CREEK STORMWATER QUALITY – SWQ10
Catchment Areas indicative only Map information is not necessarily up-to-date or correct and Blacktown City Council accepts no responsibility in that regard. As such no reliance on these maps should be made without reference to Council’s GIS mapping of catchment zones.
APPENDIX C10 of 15
CONTRIBUTION ITEM Stormwater Quality
Management
CATCHMENT AREA Little Creek
Marsden Park Precinct __________________________________________________________________________________________
In force as at 14 December 2016 67

Section 94 Contributions Plan No.21 – Marsden Park
_____________________________________________________________________________________________________
MARSDEN PARK PRECINCT WATER CYCLE MANAGEMENT FACILITIES
LITTLE CREEK STORMWATER QUALITY – SWQ10
June 2016 2016 - 2021 2021-2026 2027-2032
Marsden Park Precinct - Little Creek Catchment - Quality SWQ10
ML1.1 Bio-retention located in detention basin $0 $2,369,000 $2,369,000
ML 1.2 Gross pollutant trap at inlet to basin $0 $91,800 $91,800
ML 1.3 Gross pollutant trap at inlet to basin $0 $91,800 $91,800
ML 1.4 Gross pollutant trap at inlet to basin $0 $137,400 $137,400
ML 1.5 Gross pollutant trap at inlet to basin $0 $91,800 $91,800
ML 1.8 Gross pollutant trap at inlet to channel $0 $91,800 $91,800
ML 1.10 Gross pollutant trap at inlet to channel $0 $253,300 $253,300
ML 1.11 Gross pollutant trap at inlet to channel $0 $253,300 $253,300
ML 1.14 Gross pollutant trap at inlet to channel $0 $137,400 $137,400
ML 1.17 Gross pollutant trap at inlet to channel $0 $137,400 $137,400
ML 1.21 Gross pollutant trap at inlet to channel $0 $79,600 $79,600
ML 1.23 Gross pollutant trap at inlet to channel $0 $289,200 $289,200
ML 2.0 0.1722 Stand alone Bio-retention $0 $584,000 $584,000
ML 2.1 Gross pollutant trap at inlet to basin $0 $91,800 $91,800
ML 2.2 Gross pollutant trap at inlet to basin $0 $91,800 $91,800
ML 3.0 0.2002 Stand alone Bio-retention $0 $749,000 $749,000
ML 3.1 Gross pollutant trap at inlet to basin $0 $137,400 $137,400
ML 5.1 Bio-retention located in detention basin $0 $581,000 $581,000
ML 5.2 Gross pollutant trap at inlet to basin $0 $137,400 $137,400
ML 5.3 Gross pollutant trap at inlet to basin $0 $166,600 $166,600
ML 6.0 0.2711 Stand alone Bio-retention $0 $543,000 $543,000
ML 6.1 Gross pollutant trap at inlet to basin $0 $108,700 $108,700
ML 7.0 0.5387 Stand alone Bio-retention $0 $1,199,000 $1,199,000
ML 7.1 Gross pollutant trap at inlet to basin $0 $253,300 $253,300
ML 8.0 0.1446 Stand alone Bio-retention $0 $766,000 $766,000
ML 8.1 Gross pollutant trap at inlet to basin $0 $137,400 $137,400
1.3268 $0 $1,184,500 $6,870,700 $1,515,000 $9,570,200
Site No. Description of WorksLand Area (Ha) Total
Estimated Cost & Indicative Timing of DeliveryCompleted cost Indexed to
APPENDIX C11 of 15
CATCHMENT AREA Little Creek
Marsden Park Precinct
CONTRIBUTION ITEM Stormwater Quality
Management
The land areas in the second column are indicative only. For confirmation, please contact Council.
__________________________________________________________________________________________
In force as at 14 December 2016 68
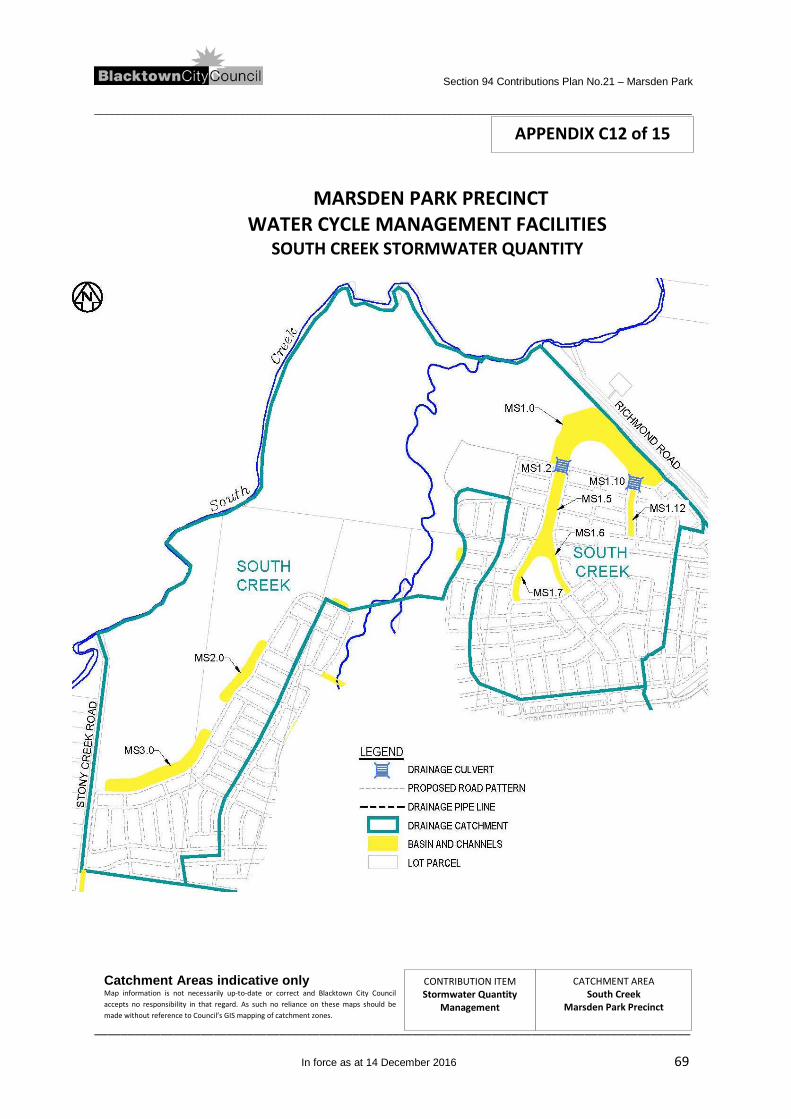
Section 94 Contributions Plan No.21 – Marsden Park
_____________________________________________________________________________________________________
MARSDEN PARK PRECINCT WATER CYCLE MANAGEMENT FACILITIES
SOUTH CREEK STORMWATER QUANTITY
Catchment Areas indicative only Map information is not necessarily up-to-date or correct and Blacktown City Council accepts no responsibility in that regard. As such no reliance on these maps should be made without reference to Council’s GIS mapping of catchment zones.
APPENDIX C12 of 15
CATCHMENT AREA South Creek
Marsden Park Precinct
CONTRIBUTION ITEM Stormwater Quantity
Management __________________________________________________________________________________________
In force as at 14 December 2016 69

Section 94 Contributions Plan No.21 – Marsden Park
_____________________________________________________________________________________________________
MARSDEN PARK PRECINCT WATER CYCLE MANAGEMENT FACILITIES
SOUTH CREEK STORMWATER QUANTITY
June 2016 2016 - 2021 2021-2026 2027-2032
Marsden Park Precinct -South Creek Catchment - Quantity
MS 1.0 Detention basin $0 $12,497,000 $12,497,000
MS 1.2 7x3600x1200mm Culvert under future road $0 $797,000 $797,000
MS 1.5 48.7m Wide landscaped open channel $0 $1,813,000 $1,813,000
MS 1.6 20.6m Wide landscaped open channel $0 $1,446,000 $1,446,000
MS 1.7 27.7m Wide landscaped open channel $0 $1,553,000 $1,553,000
MS 1.10 3x3600x1200mm Culvert under future road $0 $373,000 $373,000
MS 1.12 23.2m Wide landscaped open channel $0 $938,000 $938,000
MS 2.0 1.6373 Detention basin $0 $3,465,500 $3,465,500
MS 3.0 3.8301 Detention basin $0 $5,180,000 $5,180,000
19.6467 $0 $19,417,000 $8,645,500 $0 $28,062,500
Site No. Description of WorksLand Area (Ha) Total
14.1793
Estimated Cost & Indicative Timing of DeliveryCompleted cost Indexed to
APPENDIX C13 of 15
CATCHMENT AREA South Creek
Marsden Park Precinct
CONTRIBUTION ITEM Stormwater Quantity
Management
The land areas in the second column are indicative only. For confirmation, please contact Council.
__________________________________________________________________________________________
In force as at 14 December 2016 70

Section 94 Contributions Plan No.21 – Marsden Park
_____________________________________________________________________________________________________
MARSDEN PARK PRECINCT WATER CYCLE MANAGEMENT FACILITIES
SOUTH CREEK STORMWATER QUALITY – SWQ11
Catchment Areas indicative only Map information is not necessarily up-to-date or correct and Blacktown City Council accepts no responsibility in that regard. As such no reliance on these maps should be made without reference to Council’s GIS mapping of catchment zones.
APPENDIX C14 of 15
CONTRIBUTION ITEM Stormwater Quality
Management
CATCHMENT AREA South Creek
Marsden Park Precinct
__________________________________________________________________________________________
In force as at 14 December 2016 71

Section 94 Contributions Plan No.21 – Marsden Park
_____________________________________________________________________________________________________
MARSDEN PARK PRECINCT WATER CYCLE MANAGEMENT FACILITIES
SOUTH CREEK STORMWATER QUALITY – SWQ11
June 2016 2016 - 2021 2021-2026 2027-2032
Marsden Park Precinct - South Creek Catchment - Quality SWQ11
MS 1.1 Bio-retention located in detention basin $0 $1,728,000 $1,728,000
MS 1.3 Gross pollutant trap at inlet to basin $0 $137,400 $137,400
MS 1.4 Gross pollutant trap at inlet to basin $0 $137,400 $137,400
MS 1.8 Gross pollutant trap at inlet to channel $0 $253,300 $253,300
MS 1.9 Gross pollutant trap at inlet to channel $0 $253,300 $253,300
MS 1.11 Gross pollutant trap at inlet to basin $0 $108,700 $108,700
MS 1.13 Gross pollutant trap at inlet to channel $0 $137,400 $137,400
MS 2.1 Bio-retention located in detention basin $0 $320,000 $320,000
MS 2.2 Gross pollutant trap at inlet to basin $0 $137,400 $137,400
MS 3.1 Bio-retention located in detention basin $0 $689,000 $689,000
MS 3.2 Gross pollutant trap at inlet to basin $0 $253,300 $253,300
MS 3.3 Gross pollutant trap at inlet to basin $0 $137,400 $137,400
$0 $781,400 $3,511,200 $0 $4,292,600
Site No. Description of WorksLand Area (Ha) Total
Estimated Cost & Indicative Timing of DeliveryCompleted cost Indexed to
APPENDIX C15 of 15
CONTRIBUTION ITEM Stormwater Quality
Management
CATCHMENT AREA South Creek
Marsden Park Precinct
__________________________________________________________________________________________
In force as at 14 December 2016 72

Section 94 Contributions Plan No.21 – Marsden Park
_____________________________________________________________________________________________________
MARSDEN PARK PRECINCT TRAFFIC AND TRANSPORT MANAGEMENT FACILITIES
APPENDIX D1 of 3
CONTRIBUTION ITEM Traffic & Transport
Management
CATCHMENT AREA Marsden Park Precinct
Catchment Areas indicative only Map information is not necessarily up-to-date or correct and Blacktown City Council accepts no responsibility in that regard. As such no reliance on these maps should be made without reference to Council’s GIS mapping of catchment zones.
__________________________________________________________________________________________
In force as at 14 December 2016 73

Section 94 Contributions Plan No.21 – Marsden Park
_____________________________________________________________________________________________________
MARSDEN PARK PRECINCT TRAFFIC AND TRANSPORT MANAGEMENT FACILITIES
2016 - 2021 2022 - 2027 2028 -2032
ROADS
MP 1.1 1.5069 Glengarrie RoadSub-arterial road full width from South Street to Garfield Road west extension. One roundabout near South Street
$0 $6,590,000 $6,590,000
MP 1.2 3.051Garfield Road West Extension
Sub-arterial full width Richmond Road to Glengarrie street with one traffic signal at Glengarrie street and two roundabouts
$0 $6,560,000 $6,560,000
MP 2.1 1.6991 New RoadCollector Road full width from South Street to Pius Lane. Traffic signals at Town Centre road
$0 $3,150,000 $3,150,000
MP 2.2 1.2284 New Road Collector Road full width from Pius Lane to Garfield Road West extension.
$0 $2,362,000 $2,362,000
MP 3.1 0.2000 Pius Lane Collector road full width west of Richmond Road
$0 $653,000 $653,000
MP 4.1 0.0200 Stony Creek Road Collector road half width to Palmyra Road including half roundabout
$0 $4,369,000 $4,369,000
MP 4.2 Stony Creek Road Collector road half width to South Creek
$0 $2,576,000 $2,576,000
MP 5.1 Grange Avenue Collector road full width Richmond Road to Bell's Creek
$0 $3,980,000 $3,980,000
MP 6.1 Vine Street Collector Road. Half width fronting Drainage Basin MM 3.1
$0 $362,000 $362,000
MP 6.2 Vine StreetCollector Road. Half width fronting Drainage Basin MB 1.0 to eastern boundary of the precinct
$0 $185,000 $185,000
MP 7.1 0.3294 New Road R3 Local Road - Full width eastern side of Drainage Basin MM 3.1
$0 $454,000 $454,000
MP 7.2 0.0931 New Road R3 Local Road - Half width southern side of Drainage Basin MM 3.1
$0 $128,000 $128,000
MP 8.1 0.0702 New Road R3 Local Road - Half width northern side of Reserve 969
$0 $97,000 $97,000
MP 9.1 0.3458 New Road R3 Local Road - Full width eastern side of Drainage Basin MB 2.0
$0 $476,000 $476,000
Description of WorksSite No.Land Area (Ha)
Estimated Cost & Indicative Timing of DeliveryTotal
Completed cost Indexed to June 2016
APPENDIX D2 of 3
CATCHMENT AREA Marsden Park Precinct
CONTRIBUTION ITEM Traffic & Transport
Management
The land areas in the second column are indicative only. For confirmation, please contact Council.
__________________________________________________________________________________________
In force as at 14 December 2016 74

Section 94 Contributions Plan No.21 – Marsden Park
_____________________________________________________________________________________________________
MARSDEN PARK PRECINCT TRAFFIC AND TRANSPORT MANAGEMENT FACILITIES
2016 - 2021 2022 - 2027 2028 -2032
ROADS
MP 10.1 New Road Local Road - Full width crossing Culvert MS 1.2
$0 $159,000 $159,000
MP 10.2 New Road Local Road - Full width crossing Culvert MS 1.10
$0 $66,000 $66,000
MP 10.3 0.1553 New Road Collector Road - Full width crossing Culvert ML 1.6
$0 $323,000 $323,000
MP 10.4 0.1389 New Road Collector Road - Full width crossing Culvert ML 1.9
$0 $286,000 $286,000
MP 10.5 New Road Local Road - Full width crossing Culvert ML 1.13
$0 $118,000 $118,000
MP 10.6 New Road Local Road - Full width crossing Culvert ML 1.16
$0 $88,000 $88,000
MP 10.7 New Road Local Road - Full width crossing Culvert ML 1.19
$0 $105,000 $105,000
MP 10.8 0.2807 New Road Collector Road - Full width crossing Culvert ML 4.2
$0 $587,000 $587,000
MP 11.1 New RoadR3 Local Road - Full width crossing between Reserve 972 and Reserve 973
$0 $179,000 $179,000
MP 11.2 0.5888 New RoadR3 Local Road - Full width crossing between Reserve 972 and Community Facility Site 2
$0 $711,000 $711,000
MP 12.1 0.1161 Fermoy Road Local Road - Full width $0 $788,000 $788,000
MISCELLANEOUSAllow for shelters along collector roads to achieve bilk 400m walking distance (approx 14)
$0 $228,900 $228,900
6 x Additional roundabouts for local area traffic managment $0 $1,635,000 $1,635,000
Traffic signals for local area traffic managment $0 $359,700 $359,700
BRIDGES / CULVERTS
ML 4.0 0.3795 Bridge Crossing Little Creek
142m span bridge 20.8 W $0 $12,467,000 $12,467,000
ML 4.1 0.2595 Bridge Crossing Little Creek
138m span bridge 20.8 W $0 $12,105,000 $12,105,000
10.4627 $0 $10,123,000 $39,288,600 $12,736,000 $62,147,600
Local Traffic Management Signals
Description of WorksSite No.Land Area (Ha)
Estimated Cost & Indicative Timing of DeliveryTotal
Completed cost Indexed to June 2016
Bus Shelters
Local Traffic Management Roundabouts
APPENDIX D3 of 3
CONTRIBUTION ITEM Traffic & Transport
Management
CATCHMENT AREA Marsden Park Precinct
The land areas in the second column are indicative only. For confirmation, please contact Council.
__________________________________________________________________________________________
In force as at 14 December 2016 75

Section 94 Contributions Plan No.21 – Marsden Park
_____________________________________________________________________________________________________
MARSDEN PARK OPEN SPACE & RECREATION FACILITIES
CONTRIBUTION ITEM Open Space &
Recreation
CATCHMENT AREA Marsden Park
APPENDIX E1 of 4
Catchment Areas indicative only Map information is not necessarily up-to-date or correct and Blacktown City Council accepts no responsibility in that regard. As such no reliance on these maps should be made without reference to Council’s GIS mapping of catchment zones.
__________________________________________________________________________________________
In force as at 14 December 2016 76

Section 94 Contributions Plan No.21 – Marsden Park
_____________________________________________________________________________________________________
MARSDEN PARK OPEN SPACE & RECREATION FACILITIES
APPENDIX E2 of 4
Catchment Areas indicative only Map information is not necessarily up-to-date or correct and Blacktown City Council accepts no responsibility in that regard. As such no reliance on these maps should be made without reference to Council’s GIS mapping of catchment zones.
CONTRIBUTION ITEM Open Space &
Recreation
CATCHMENT AREA Marsden Park
__________________________________________________________________________________________
In force as at 14 December 2016 77

Section 94 Contributions Plan No.21 – Marsden Park
_____________________________________________________________________________________________________
MARSDEN PARK OPEN SPACE & RECREATION FACILITIES
June 2016 2016 - 2021 2022 - 2027 2028 -2032
934 0.7574 Local Park including playground and landscaping $622,877 $622,877
990 0.4765 Local park including playground and landscaping. $0 $572,000 $572,000
991 0.6121 Local park including playground and landscaping. $0 $658,000 $658,000
992 2.1716 Transmission easement adjoining Reserve 972. $0 $1,500,000 $1,500,000
993 11.7052 Local park including playground and natural vegetation areas adjoining a transmission easement.
$0 $10,926,000 $10,926,000
994 0.9083 Local park including playground and landscaping opposite a retail area.
$0 $1,261,000 $1,261,000
995 4.2645 Active reserve with playing fields, including playground and landscaping.
$0 $9,949,000 $9,949,000
996 5.0766 Transmission easement adjoining Reserve 972. $0 $3,065,000 $3,065,000
997 4.3180 Active reserve with playing fields, including playground and landscaping.
$0 $10,145,000 $10,145,000
998 0.6297 Local park including playground and landscaping. $0 $601,116 $601,116
999 4.8280Active reserve with playing fields, including playground, youth recreation and landscaping opposite a retail area.
$0 $10,689,628 $10,689,628
1000 0.7470 Local park including playground and landscaping. $0 $762,000 $762,000
1001 0.1996 Urban park within retail area $0 $414,000 $414,000
1002 6.7568 Active reserve with playing fields, including playground and landscaping adjoining a riparian zone.
$0 $11,447,000 $11,447,000
1003 0.8972 Local park including playground and landscaping adjoining a riparian zone.
$0 $916,000 $916,000
1004 0.6172 Local park including playground and landscaping. $0 $669,000 $669,000
Reserve Number Description
Completed cost Indexed to Total
Estimated Cost & Indicative Timing of DeliveryArea (Ha)
APPENDIX E3 of 4
CATCHMENT AREA Marsden Park
CONTRIBUTION ITEM Open Space &
Recreation
The land areas in the second column are indicative only. For confirmation, please contact Council.
__________________________________________________________________________________________
In force as at 14 December 2016 78

Section 94 Contributions Plan No.21 – Marsden Park
_____________________________________________________________________________________________________
MARSDEN PARK OPEN SPACE & RECREATION FACILITIES
June 2016 2016 - 2021 2022 - 2027 2028 -2032
1005 0.4176 Local park including playground and landscaping. $0 $556,000 $556,000
Large active reserve with playing fields, playgrounds, youth recreation and lookout areas. Land previously used as a waste disposal facility, remediation required.
$0 $70,790,000 $70,790,000
Remediation cost estimate $0 $33,040,000 $33,040,000
980Marsden Park Combined Precincts approtionment of centralised netball competition venue located in the Schofields Precinct
$0 $3,239,000 $3,239,000
Addition Passive Open Space Co-Located within Stormwater Management Facilities
APathway, landscaping and seating area co-located within Drainage Basin MS 1.0 $0 $208,000 $208,000
BPathway, landscaping and seating area co-located within Drainage Basin MM 1.0 $0 $248,000 $248,000
CPathway, landscaping and seating area co-located within Drainage Basin MM 2.0 $0 $383,000 $383,000
DPathway, landscaping and seating area co-located within Drainage Channels MS1.5 to MS 1.7 $0 $371,000 $371,000
EPathway, landscaping and seating area co-located within Drainage Basin ML 1.0 $0 $316,000 $316,000
FPathway, landscaping and seating area co-located within Drainage Channels ML1.7, ML1.12, ML 1.15 & ML 1.18
$0 $601,000 $601,000
GPathway, landscaping and seating area co-located within Bio Retention Basin ML 8.0 $0 $75,000 $75,000
HCycleway, landscaping and seating area co-located within Drainage Channels ML1.20 $0 $263,000 $263,000
109.6373 $622,877 $13,493,744 $89,381,000 $70,790,000 $174,287,621
1006 64.2540
Reserve Number Description
Completed cost Indexed to Total
Estimated Cost & Indicative Timing of DeliveryArea (Ha)
APPENDIX E4 of 4
CATCHMENT AREA Marsden Park
CONTRIBUTION ITEM Open Space &
Recreation
The land areas in the second column are indicative only. For confirmation, please contact Council.
__________________________________________________________________________________________
In force as at 14 December 2016 79

Section 94 Contributions Plan No.21 – Marsden Park
_____________________________________________________________________________________________________
MARSDEN PARK LAND FOR COMMUNITY FACILITIES & AQUATIC FACILITIES
APPENDIX F1 of 1
CATCHMENT AREA Marsden Park
Catchment Areas indicative only Map information is not necessarily up-to-date or correct and Blacktown City Council accepts no responsibility in that regard. As such no reliance on these maps should be made without reference to Council’s GIS mapping of catchment zones.
CONTRIBUTION ITEM Land for Community Facilities & Aquatic
Facilities
Approximate Community Facilities Land Acquisition 1.0477 ha
Approximate Apportioned Aquatic Facilities Land Acquisition 3.0ha
(Part Site 2- See Section 6)
__________________________________________________________________________________________
In force as at 14 December 2016 80

Section 94 Contributions Plan No.21 – Marsden Park
_____________________________________________________________________________________________________
APPENDIX G1 of 2
CATCHMENT AREA Marsden Park
CONTRIBUTION ITEM E2 Conservation Zone
Catchment Areas indicative only Map information is not necessarily up-to-date or correct and Blacktown City Council accepts no responsibility in that regard. As such no reliance on these maps should be made without reference to Council’s GIS mapping of catchment zones.
COMBINED PRECINCT FACILITY E2 CONSERVATION ZONE
(Servicing Blacktown’s Residential Growth Centre Precincts)
Catchment Area
Location of E2 Conservation Zone Riverstone Precinct
__________________________________________________________________________________________
In force as at 14 December 2016 81

Section 94 Contributions Plan No.21 – Marsden Park
_____________________________________________________________________________________________________
APPENDIX G2 of 2
CONTRIBUTION ITEM E2 Conservation Zone
CATCHMENT AREA Marsden Park
COMBINED PRECINCT FACILITY E2 CONSERVATION ZONE
FULL FACILITY CONSTRUCTION COSTS (Servicing Blacktown’s Residential Growth Centre Precincts)
E2 CONSERVATION ZONE APPORTIONED FACILITY CONSTRUCTION COSTS FOR
MARSDEN PARK
The land areas in the second column are indicative only. For confirmation, please contact Council.
The land areas in the second column are indicative only. For confirmation, please contact Council.
__________________________________________________________________________________________
In force as at 14 December 2016 82
2016-2021 2022-2027 2028-2032
867 20.3712 Conservation Zone $0 $10,052,000 $10,052,000
$0 $0 $10,052,000 $0 $10,052,000
Reserve No.
Land Area (Ha) Description of Works
Estimated Cost & Indicative Timing of Delivery Total
Completed cost Indexed to
June 2016
2016-2021 2022-2027 2028-2032
867 20.3712 Conservation Zone $0 $2,713,179 $2,713,179
$0 $0 $2,713,179 $0 $2,713,179
TotalReserve No.
Land Area (Ha) Description of Works
Completed cost Indexed to
June 2016
Estimated Cost & Indicative Timing of Delivery

Section 94 Contributions Plan No.21 – Marsden Park
_____________________________________________________________________________________________________
APPENDIX H
SCHEDULE OF VALUES IN THE CONTRIBUTION FORMULAE
__________________________________________________________________________________________
In force as at 14 December 2016 83
L1 L2 C1 C2 (PA) L1+L2+C1+C2 +PA($) ($) ($) ($) ($) ($)
WATER MANAGEMENT HectaresSTORMWATER QUANTITY
Marsden Park Industrial PrecinctBELLS CREEK 174.3984 $43,782,176 $10,122,302 $16,145,000 $394,010 $70,443,488
MARSDEN CREEK 90.1317 $37,332,000 $14,157,000 $212,355 $51,701,355
LITTLE CREEK 99.7485 $18,485,000 $31,094,000 $466,410 $50,045,410Marsden Park PrecinctBELLS CREEK 34.1367 $14,888,000 $6,843,000 $102,645 $21,833,645
MARSDEN CREEK 146.2218 $62,071,573 $2,121,338 $48,480,387 $759,026 $113,432,324
LITTLE CREEK 265.0543 $46,833,000 $46,473,000 $697,095 $94,003,095
SOUTH CREEK 164.4348 $17,289,000 $28,062,500 $420,938 $45,772,438STORMWATER QUALITY
Marsden Park Industrial PrecinctBELLS CREEK - SWQ1 171.0904 $3,106,488 $2,168,000 $79,117 $5,353,605
BELLS CREEK - SWQ2 3.3080 $337,000 $5,055 $342,055
MARSDEN CREEK - SWQ3 90.1317 $3,807,600 $57,114 $3,864,714
LITTLE CREEK - SWQ4 8.5903 $645,989 $9,690 $655,679
LITTLE CREEK - SWQ5 17.1548 $132,311 $1,985 $134,296
LITTLE CREEK - SWQ6 69.5934 $1,499,000 $22,485 $1,521,485
LITTLE CREEK - SWQ7 4.5700 $342,000 $804,800 $12,072 $1,158,872Marsden Park Precinct
BELLS CREEK - SWQ8 18.0685 $1,694,600 $25,419 $1,720,019
MARSDEN CREEK - SWQ9 87.7908 $609,344 $9,349,811 $149,387 $10,108,542
LITTLE CREEK - SWQ10 248.9684 $2,189,000 $9,570,200 $143,553 $11,902,753
SOUTH CREEK SWQ11 158.0219 $4,292,600 $64,389 $4,356,989
TRAFFIC MANAGEMENT HectaresMARSDEN PARK INDUSTRIAL PRECINCT 301.2461 $6,668,409 $13,794,000 $7,046,552 $18,922,000 $389,528 $46,820,489
MARSDEN PARK PRECINCT 609.8476 $35,450,211 $62,147,600 $932,214 $98,530,025
OPEN SPACE PopulationMARSDEN PARK 33742 $2,603,719 $146,233,146 $622,877 $173,664,744 $2,614,314 $325,738,800
COMMUNITY FACILITIES PopulationMARSDEN PARK 33742 $4,191,000 $4,191,000
COMBINED PRECINCT FACILITY PopulationE2 CONSERVATION ZONE 33742 $4,280,521 $3,333,000 $2,713,179 $40,698 $10,367,398
AQUATIC FACILITY 33742 $6,819,000 $6,819,000
TOTAL $13,552,649 $453,032,106 $23,965,901 $482,667,321 $7,599,499 $980,817,476
CATCHMENTLAND ACQUIRED YET TO ACQUIRE ITEMS
CONSTRUCTEDYET TO
CONSTRUCT TOTALSIZE OF
CATCHMENT
PLAN ADMINISTRATION

Section 94 Contributions Plan No.21 – Marsden Park
_____________________________________________________________________________________________________
INDEXATION METHOD The method of indexing the base contribution rate is to multiply the most recently published All Groups Sydney CPI at the time of payment and divide it by the June 2016 All Groups Sydney CPI.
Base CPI All Groups Sydney - June 2016 - 109.3
CONTRIBUTIONRATE ($)
WATER MANAGEMENT $ Per HaSTORMWATER QUANTITY
Marsden Park Industrial PrecinctBELLS CREEK $403,923
MARSDEN CREEK $573,620
LITTLE CREEK $501,716Marsden Park Precinct
BELLS CREEK $639,594
MARSDEN CREEK $775,755
LITTLE CREEK $354,656
SOUTH CREEK $278,362STORMWATER QUALITY
Marsden Park Industrial PrecinctBELLS CREEK - SWQ1 $31,291
BELLS CREEK - SWQ2 $103,402
MARSDEN CREEK - SWQ3 $42,879
LITTLE CREEK - SWQ4 $76,328
LITTLE CREEK - SWQ5 $7,828
LITTLE CREEK - SWQ6 $21,862
LITTLE CREEK - SWQ7 $253,582Marsden Park Precinct
BELLS CREEK - SWQ8 $95,194
MARSDEN CREEK - SWQ9 $115,144
LITTLE CREEK - SWQ10 $47,808
SOUTH CREEK SWQ11 $27,572
TRAFFIC MANAGEMENT $ Per HaMARSDEN PARK INDUSTRIAL PRECINCT $155,423
MARSDEN PARK PRECINCT $161,565
OPEN SPACE $ Per PersonMARSDEN PARK $9,654
COMMUNITY FACILITIES $ Per PersonMARSDEN PARK $124
COMBINED PRECINCT FACILITY $ Per PersonE2 CONSERVATION ZONE $307
AQUATIC FACILITY $202
CATCHMENT
BASE CONTRIBUTION RATES
APPENDIX I
__________________________________________________________________________________________
In force as at 14 December 2016 84

Section 94 Contributions Plan No.21 – Marsden Park
_____________________________________________________________________________________________________
SUPPORTING TECHNICAL DOCUMENTS AND REPORTS
The following identifies technical documents, studies, relevant legislation, and reports which have been used for researching this contributions plan:
• GHD (2009) Marsden Park Developments Report for Marsden park Industrial Development Watercycle Management Assessment: Flooding, Stormwater and Water Sensitive Urban Design (July 2009) prepared for Department of Planning.
• J. Wyndham Prince Marsden Park Industrial Precinct Post Exhibition Water Cycle Management Strategy Report Including Consideration of Climate Change Impacts dated February 2011.
• J. Wyndham Prince Marsden Park Industrial Precinct Bells Creek Corridor Water Cycle
Management Strategy dated January 2011.
• Arup (2009) Marsden Park Industrial (Employment) Precinct Transport and Access Study Final report for ILP Exhibition, August 2009 prepared for the Department of Planning and Infrastructure.
• J. Wyndham Prince Marsden Park Draft S94 Basin Review Road No 1 Plan and Longitudinal Sections 3 sheets 8955/SK19-A, 8955/SK20-A, 8955/SK21-A dated 08/06/10
• Elton Pty Ltd (2009) Community Facilities and Open Space Assessment – Marsden Park Industrial Precinct, 27 July 2009 prepared for the Department of Planning and Infrastructure.
• Blacktown City 2025 – Delivering the Vision (Blacktown City Council 2008).
• Wellness Through Physical Activity Policy (Blacktown City Council, 2007).
• Blacktown City Council Social Plan (2007 and 2012).
• Recreation and Open Space Strategy (Blacktown City Council, 2009).
• Northwest Growth Centres Recreation Planning Framework (Blacktown City Council, 2009).
• Section 94 Community Facilities Report (Blacktown City Council May 2008).
• Department of Planning and Infrastructure Blacktown City Council Precincts Development Control Plan 2010 including Schedule 3 Marsden Park Industrial Precinct.
• Department of Planning and Infrastructure current version of SEPP Maps.
• Department of Planning and Infrastructure Growth Centres Development Code dated October 2006.
• Department of Planning Blacktown City Council Priority Precincts Development Control Plan 2016
including Schedule 3 Marsden Park Industrial Precinct and Schedule 6 Marsden Park Precinct
• Protecting Little Creek Marsden Park Industrial Precinct Little Creek Catchment Alternate Stormwater Management Strategy (Bligh Tanner June 2015)
APPENDIX J
__________________________________________________________________________________________
In force as at 14 December 2016 85

Section 94 Contributions Plan No.21 – Marsden Park
_____________________________________________________________________________________________________
• Draft Concept drainage design report CP21 Basin L1.1, L2.2 & L3.2 to protect The Little Creek Tributary, South Street Marsden Park (Blacktown City Council May 2016)
• Coffeys Environments Australia Pty Ltd - Grange Avenue Closed Landfill, Marsden Park, NSW -
Advice on Landfill Closure Work (Blacktown City Council 2015)
__________________________________________________________________________________________
In force as at 14 December 2016 86