Embed Size (px)
Citation preview
DealPointData.comCognex Corporation10-K on 02/13/2020 SEC DocumentSEC FilingTable of Contents
UNITED STATESSECURITIES AND EXCHANGE COMMISSION
Washington, D.C. 20549
FORM 10-K(Mark One)
☒ Annual report pursuant to Section 13 or 15(d) of the Securities Exchange Act of 1934 f or the f iscal year ended December 31, 2019 or
☐ Transition report pursuant to Section 13 or 15(d) of the Securities Exchange Act of 1934 f or the transition period f rom to .Commission File Number 001-34218
COGNEX CORPORATION(Exact name of registrant as specified in its charter)
Massachusetts 04-2713778
(State or other jurisdiction ofincorporation or organization)
(I.R.S. EmployerIdentification No.)
One Vision DriveNatick, Massachusetts 01760-2059
(508) 650-3000
(Address, including zip code, and telephone number,including area code, of principal executive offices)
Securities registered pursuant to Section 12(b) of the Act:
Title of Each Class Trading Symbol(s) Name of Exchange on Which Registered
Common Stock, par value $.002 per share CGNX The NASDAQ Stock Market LLCSecurities registered pursuant to Section 12(g) of the Act: NoneIndicate by check mark if the registrant is a well-known seasoned issuer, as def ined in Rule 405 of the Securities Act.
Yes ☒ No ☐ Indicate by check mark if the registrant is not required to f ile reports pursuant to Section 13 or Section 15(d) of the Act.
Yes ☐ No ☒ Indicate by check mark whether the registrant (1) has f iled all reports required to be f iled by Section 13 or 15(d) of the Securities Exchange Act of 1934 during the preceding 12 months (or f orsuch shorter period that the registrant was required to f ile such reports), and (2) has been subject to such f iling requirements f or the past 90 days.
Yes ☒ No ☐ Indicate by check mark whether the registrant has submitted electronically every Interactive Data File required to be submitted pursuant to Rule 405 of Regulation S-T during the preceding 12months (or f or such shorter period that the registrant was required to submit such f iles).
Yes ☒ No ☐ Indicate by check mark whether the registrant is a large accelerated f iler, an accelerated f iler, a non-accelerated f iler, a smaller reporting company, or emerging growth company. See thedef initions of “large accelerated f iler,” “accelerated f iler,” “smaller reporting company” and "emerging growth company" in Rule 12b-2 of the Exchange Act. (Check one):
☒ Large accelerated f iler ☐ Accelerated f iler
☐ Non-accelerated f iler ☐Smaller reporting company
☐Emerging growth company
If an emerging growth company, indicate by check mark if the registrant has elected not to use the extended transition period f or complying with any new or revised f inancial accountingstandards provided pursuant to Section 13(a) of the Exchange Act. oIndicate by check mark whether the registrant is a shell company (as def ined in Rule 12b-2 of the Exchange Act).
Yes ☐ No ☒ Aggregate market value of voting stock held by non-affiliates of the registrant as of June 30, 2019: $7,800,874,313
Common stock, par value $.002 per share, outstanding as of January 26, 2020: 172,611,232 sharesDOCUMENTS INCORPORATED BY REFERENCE:
The registrant intends to file a Definitive Proxy Statement pursuant to Regulation 14A within 120 days of the end of the fiscal year ended December 31, 2019. Portionsof such Proxy Statement are incorporated by reference in Part III of this report.
Table of Contents
COGNEX CORPORATIONANNUAL REPORT ON FORM 10-K
FOR THE YEAR ENDED DECEMBER 31, 2019
INDEX
PART I 1ITEM 1. BUSINESS 1ITEM 1A. RISK FACTORS 6ITEM 1B. UNRESOLVED STAFF COMMENTS 13ITEM 2. PROPERTIES 13ITEM 3. LEGAL PROCEEDINGS 14ITEM 4. MINE SAFETY DISCLOSURES 14ITEM 4A. INFORMATION ABOUT OUR EXECUTIVE OFFICERS 14
PART II 15ITEM 5. MARKET FOR REGISTRANT’S COMMON EQUITY, RELATED STOCKHOLDER MATTERS, AND
ISSUER PURCHASES OF EQUITY SECURITIES15
ITEM 6. SELECTED FINANCIAL DATA 17ITEM 7. MANAGEMENT’S DISCUSSION AND ANALYSIS OF FINANCIAL CONDITION AND RESULTS OF
OPERATIONS18
ITEM 7A. QUANTITATIVE AND QUALITATIVE DISCLOSURES ABOUT MARKET RISK 30ITEM 8. FINANCIAL STATEMENTS AND SUPPLEMENTARY DATA 33ITEM 9. CHANGES IN AND DISAGREEMENTS WITH ACCOUNTANTS ON ACCOUNTING AND FINANCIAL
DISCLOSURE75
ITEM 9A. CONTROLS AND PROCEDURES 75ITEM 9B. OTHER INFORMATION 77
PART III 77ITEM 10. DIRECTORS, EXECUTIVE OFFICERS, AND CORPORATE GOVERNANCE 77ITEM 11. EXECUTIVE COMPENSATION 77ITEM 12. SECURITY OWNERSHIP OF CERTAIN BENEFICIAL OWNERS AND MANAGEMENT AND RELATED
STOCKHOLDER MATTERS77
ITEM 13. CERTAIN RELATIONSHIPS AND RELATED TRANSACTIONS, AND DIRECTOR INDEPENDENCE 78ITEM 14. PRINCIPAL ACCOUNTING FEES AND SERVICES 78
PART IV 78ITEM 15. EXHIBITS AND FINANCIAL STATEMENT SCHEDULES 78ITEM 16. FORM 10-K SUMMARY 78
Table of Contents
PART IThis Annual Report on Form 10-K contains forward-looking statements within the meaning of the federal securities laws. Readers can identify theseforward-looking statements by our use of the words “expects,” “anticipates,” “estimates,” “believes,” “projects,” “intends,” “plans,” “will,” “may,” “shall,”“could,” “should,” and similar words and other statements of a similar sense. Our future results may differ materially from current results and from thoseprojected in the forward-looking statements as a result of known and unknown risks and uncertainties. Readers should pay particular attention toconsiderations described in the section captioned “Risk Factors,” appearing in Part I - Item 1A of this Annual Report on Form 10-K. We caution readersnot to place undue reliance upon any such forward-looking statements, which speak only as of the date made. We disclaim any obligation to subsequentlyrevise forward-looking statements to ref lect the occurrence of anticipated or unanticipated events or circumstances after the date such statements aremade.Unless the context otherwise requires, the words “Cognex®,” the “Company,” “we,” “our,” “us,” and “our company” refer to Cognex Corporation and itsconsolidated subsidiaries.
ITEM 1: BUSINESSCorporate ProfileCognex Corporation was incorporated in Massachusetts in 1981. Our corporate headquarters are located at One Vision Drive, Natick, Massachusetts01760 and our telephone number is (508) 650-3000.Cognex is a leading worldwide provider of machine vision products that capture and analyze visual information in order to automate manufacturing anddistribution tasks where vision is required. Machine vision is the technology that gives computers and automation equipment the ability to see. Machinevision products are used to automate the manufacture and tracking of discrete items, such as mobile phones, aspirin bottles, and automobile tires, bylocating, identifying, inspecting, and measuring them during the manufacturing or distribution process. Machine vision is important for applications in whichhuman vision is inadequate to meet requirements for size, accuracy, or speed, or in instances where substantial cost savings are obtained through thereduction of labor or improved product quality. Today, many types of manufacturing equipment require machine vision because of the increasingdemands for speed and accuracy in manufacturing processes, as well as the decreasing size of items being manufactured.
What is Machine Vision?Since the beginning of the Industrial Revolution, human vision has played an indispensable role in the process of manufacturing products. Human eyes didwhat no machines could do themselves: locating and positioning work, tracking the f low of parts, and inspecting output for quality and consistency.Today, however, the requirements of many manufacturing processes have surpassed the limits of human eyesight. Manufactured items often areproduced too quickly or with tolerances too small to be analyzed by the human eye. In response to manufacturers’ needs, “machine vision” technologyemerged, providing manufacturing equipment with the gift of sight. Machine vision systems were f irst widely embraced by manufacturers of electroniccomponents who needed this technology to produce computer chips with decreasing geometries. However, advances in technology and ease-of-use,combined with the decreasing cost of implementing vision applications, have made machine vision available to a broader range of users.
1
Table of Contents
Machine vision products combine cameras with innovative software to collect images and then answer questions about these images, such as:
Question Description ExampleGUIDANCE Where is it?
Determining the exact physical location andorientation of an object.
Aligning a screen on a smartphone or guiding a robot to put awindshield on a car.
IDENTIFICATION What is it?
Identifying an object by analyzing its physicalappearance or by reading a serial number orsymbol.
Reading a two-dimensional barcode directly marked on anautomotive airbag so that it can be tracked and processedcorrectly through manufacturing.
INSPECTION How good is it?
Inspecting an object for f laws or defects.
Checking for debris to ensure that foreign objects are notpresent in a product before shipping to consumers.
GAUGING What size is it?
Determining the dimensions of an object.
Using 3D vision to ensure the cap is secure on a bottle ofdetergent prior to packaging.
Machine Vision MarketCognex machine vision is primarily used to automate manufacturing and distribution processes in a variety of industries, where the technology is widelyrecognized as an important component of automated production and quality assurance. Virtually every manufacturer can achieve better quality andmanufacturing eff iciency by using machine vision, and therefore, Cognex products are used by a broad base of customers across a variety of industries,including consumer electronics, automotive, consumer products, food and beverage, pharmaceuticals, and medical devices. Cognex products are alsoused to automate distribution processes in the logistics industry for applications in retail distribution and ecommerce to scan, track, and sort goodsthrough distribution centers.The Company operates in one segment, machine vision technology. We offer a variety of machine vision products that have similar economiccharacteristics, have the same production processes, and are distributed by the same sales channels to the same types of customers. Information aboutsegments may be found in Note 20 to the Consolidated Financial Statements, appearing in Part II - Item 8 of this Annual Report on Form 10-K.In 2018 and 2017, direct and indirect revenue from Apple Inc. accounted for 15% and 20% of total revenue, respectively. In 2019, no customer accountedfor greater than 10% of total revenue.Business StrategyOur goal is to expand our position as a leading worldwide provider of machine vision products for industrial customers. We are selective in choosinggrowth opportunities that we believe will maintain our historically high gross margin percentages, which have ranged in the mid 70s for the past severalyears and reflect the value our customers place on our innovative products. Our high gross margins have the potential to provide us with strong operatingleverage in our f inancial model, as any incremental revenue at such margins is able to fall through to operating income at a high ratio. Our strong andunique corporate culture reinforces our values of customer f irst and innovation, and enables us to attract and retain smart, highly-educated, experiencedtalent who are motivated to solve the most challenging vision tasks.We invest heavily in research and development in order to maintain our position as a technology leader in machine vision. We invest in technology thatmakes vision easier to use and more affordable, and therefore, available to a broader base of customers, such as our vision sensor products that enablecustomers with a lower budget to use machine vision without the help of sophisticated engineers. We also invest in technology that addresses the mostchallenging vision applications, such as our 3D vision products that solve applications where a height or volume measurement is required and our deeplearning vision software that solves complex applications with unpredictable defects and deviations. We invest through internal development, as well asthe acquisition of businesses and technologies. We believe that our acquisition of Sualab Co., Ltd. in the fourth quarter of 2019 will expand our deeplearning technology to visual inspection tasks that replace human inspectors and make automated inspection tasks fast, easy, and cost-effective.We continue to invest in our core markets, such as consumer electronics and automotive, where we are a leading provider of vision and ID products forfactory automation, while making signif icant investments in the logistics market,
2
Table of Contents
where we see opportunity to move beyond barcode reading into vision for applications in retail distribution and ecommerce.We reach a broad base of customers through our worldwide direct sales force that sells to large, strategic customers, as well as through our network ofdistributors and integrators that sell primarily to smaller customers who may be more geographically remote and may require supplemental technicalsupport or integration assistance. We invest in emerging, high-growth regions where many manufacturers can benefit from incorporating machine visioninto their production processes. This includes investment in China, where rising wages for assembly workers and a greater focus on product quality aredriving assembly automation, particularly in the consumer electronics industry.AcquisitionsOur business strategy includes selective expansion into new machine vision applications and markets through the acquisition of businesses andtechnologies. In 2017 and 2016, we completed six small business acquisitions, which were not signif icant individually or in the aggregate. The purchaseprice for each business ranged from $2.5 million to $23 million. In addition to completed technology and customer relationships, these acquisitionsincluded engineering talent expected to help accelerate the development of future products.On October 16, 2019, Cognex acquired Sualab Co., Ltd. (Sualab), a provider of deep learning-based vision software for industrial image analysis basedin Korea. The total consideration of $195 million included cash payments of $171 million upon closing and deferred payments of $24 million that maybecome payable on the fourth anniversary date of the closing, contingent upon continued employment of key talent. Sualab's intellectual property,engineering expertise, and market coverage are expected to increase the Company's existing deep learning capabilities. Combined with intellectualproperty acquired from ViDI Systems S.A. in 2017, we believe that Cognex is now a leading provider of deep learning-based industrial vision software.Management considers business acquisitions to be an important part of our growth strategy, and although we continue to actively seek out acquisitionopportunities, we are selective in choosing businesses that we believe will enhance our long-term growth rate and profitability, as well as f it within ourcorporate culture. We plan to continue to seek opportunities to expand our product lines, customer base, distribution network, and technical talent throughacquisitions in the machine vision industry.ProductsCognex offers a full range of machine vision systems and sensors, vision software, and industrial image-based barcode readers designed to meetcustomer needs at dif ferent performance and price points. Our products range from low-cost vision sensors that conduct simple presence/absenceinspections, to deep learning vision software that solves complex applications with unpredictable defects and deviations. Our products also have a varietyof physical forms, depending upon the user's needs. For example, customers can purchase vision software to use with their own camera and processor, orthey can purchase a standalone unit that combines camera, processor, and software into a single package.Vision Systems and SensorsVision systems combine camera, processor, and vision software into a single, rugged package with a simple and f lexible user interface for configuringapplications. General-purpose vision systems are designed to be easily programmed to perform a wide range of vision tasks including part location,identif ication, measurement, assembly verif ication, and robotic guidance. Unlike general-purpose vision systems, vision sensors deliver an easy-to-use,low-cost, reliable solution for simple pass/fail vision applications, such as checking the presence and size of parts. Cognex offers the In-Sight® productline of vision systems and sensors in a wide range of models to meet various price and performance requirements. Cognex also offers a series of 3Dvision systems for use in highly demanding applications that require surface feature measurements that go beyond the capabilities of 2D visiontechnology.Vision SoftwareVision software provides users with the most f lexibility by combining the full general-purpose library of Cognex vision tools with the cameras, framegrabbers, and peripheral equipment of their choice. Applications based upon Cognex vision software perform a wide range of vision tasks, including partlocation, identif ication, measurement, assembly verif ication, and robotic guidance. Cognex VisionPro® software offers an extensive suite of patentedvision tools for advanced programming, while Cognex Designer allows customers to build complete vision applications with the simplicity of a graphical,f lowchart-based programming environment. Cognex deep learning vision software solves diff icult applications that are too complicated and time-consuming to program and maintain with traditional machine vision rule-based algorithms.
3
Table of Contents
Industrial Image-Based Barcode ReadersCognex barcode readers quickly and reliably read codes (e.g., one-dimensional barcodes or two-dimensional data matrix codes) that have been appliedto, or directly marked on, discrete items during the manufacturing process. Manufacturers of goods ranging from automotive parts, pharmaceutical items,aircraft components, and medical devices are increasingly using direct part mark (DPM) identif ication to ensure that the appropriate manufacturingprocesses are performed in the correct sequence and on the right parts. In addition, DPM is used to track parts throughout the product lifecycle, and isalso used in supply chain management and repair.Cognex bardcode readers are also used outside of the manufacturing sector to automate distribution processes in the logistics industry for applications inretail distribution and ecommerce to scan, track, and sort goods through distribution centers, and in airports to read baggage tags. Cognex offers theDataMan® product line of image-based barcode readers, which includes both hand-held and f ixed-mount models, and barcode verif iers, as well as the MXSeries of vision-enabled mobile terminals that allow customers to leverage the latest mobile device technology for industrial barcode reading applications.
Research, Development, and EngineeringCognex engages in research, development, and engineering (RD&E) to enhance our existing products and to develop new products and functionality toaddress market opportunities. In addition to internal research and development efforts, we intend to continue our strategy of gaining access to newtechnology through strategic relationships and acquisitions where appropriate.As of December 31, 2019, Cognex employed 563 professionals in RD&E, many of whom are software developers. Cognex’s RD&E expenses totaled$119,427,000 in 2019, $116,445,000 in 2018, and $99,205,000 in 2017, or approximately 16%, 14%, and 13% of revenue, respectively. We believe that acontinued commitment to RD&E activities is essential in order to maintain or achieve product leadership with our existing products and to provideinnovative new product offerings, as well as to provide engineering support for large customers. In addition, we consider our ability to accelerate time tomarket for new products to be critical to our revenue growth. Therefore, we expect to continue to make signif icant RD&E investments in the future. At anypoint in time, we have numerous research and development projects underway.Manufacturing and Order FulfillmentCognex’s products are manufactured utilizing a turnkey operation whereby the majority of component procurement, system assembly, and initial testingare performed by third-party contract manufacturers. Cognex’s primary contract manufacturer is located in Indonesia. The contract manufacturers usespecif ied components sourced from a vendor list approved by Cognex and assembly/test documentation created and controlled by Cognex. Certaincomponents are presently sourced from a single vendor that is selected based upon price and performance considerations. In the event of a supplydisruption from a single-source vendor, these components may be purchased from alternative vendors.After the completion of initial testing, a fully assembled product from the contract manufacturers is routed to our facility in Cork, Ireland or Natick,Massachusetts, USA, where trained Cognex personnel load Cognex software onto the product and perform quality control procedures. Finished productfor customers in the Americas is then shipped from our Natick, Massachusetts facility, while f inished product for customers outside of the Americas isshipped from our Cork, Ireland facility.Sales Channels and Support ServicesCognex sells its products through a worldwide direct sales force that focuses on the development of strategic accounts that generate or are expected togenerate signif icant sales volume, as well as through a global network of distribution and integration partners. Our distribution partners provide sales andlocal support to help Cognex reach the many prospects for our products in factories around the world, and our integration partners are experts in visionand complementary technologies that can provide turnkey solutions for complex automation projects using vision.As of December 31, 2019, Cognex’s sales force consisted of 980 professionals, and our partner network consisted of 425 authorized distributors andactive integrators. Sales engineers call directly on targeted accounts, with the assistance of application engineers, and manage the activities of ourdistribution and integration partners within their territories in order to provide an advantageous sales model for our products. Cognex has sales andsupport personnel located throughout the Americas, Europe, and Asia. The majority of our sales engineers are degreed engineers.Sales to customers based outside of the United States represented approximately 66% of total revenue in 2019 compared to approximately 71% of totalrevenue in 2018. In 2019, approximately 31% of our total revenue came from customers based in Europe, 16% from customers based in Greater China,5% from customers based in Japan, and 14% from customers based in other regions outside the United States. Sales to customers based in Europe are
4
Table of Contents
denominated in Euros and U.S. Dollars, sales to customers based in Greater China are denominated in Yuan for sales within Mainland China and U.S.Dollars in other territories, sales to customers based in Japan are denominated in Yen, and sales to customers based in other regions are denominated inU.S. Dollars. Financial information about geographic areas may be found in Note 20 to the Consolidated Financial Statements, appearing in Part II -Item 8 of this Annual Report on Form 10-K.Cognex’s service offerings represent less than 10% of our total revenue and include maintenance and support, consulting, and training services.Maintenance and support programs include hardware support programs that entitle customers to have failed products repaired, as well as softwaresupport programs that provide customers with application support and software updates to the latest software releases. Application support is provided bytechnical support personnel located at Cognex regional off ices, as well as by f ield service engineers that provide support at the customer’s production site.We provide consulting services that range from a specif ic area of functionality to a completely integrated vision application or installed ID application.Training services include a variety of product courses that are available at our off ices worldwide, at customer facilities, and online at www.cognex.com.
Intellectual PropertyWe rely on the technical expertise, creativity, and knowledge of our personnel, and therefore, we utilize patent, trademark, copyright, and trade secretprotection to maintain our competitive position and protect our proprietary rights in our products and technology. While our intellectual property rights areimportant to our success, we believe that our business as a whole is not materially dependent on any particular patent, trademark, copyright, or otherintellectual property right.As of December 31, 2019, Cognex owned 686 patents issued worldwide and had another 514 patent applications pending worldwide. Cognex has used,registered, or applied to register a number of trademark registrations in the United States and in other countries. Cognex’s trademark and servicemarkportfolio includes various registered marks, including, among others, Cognex®, In-Sight®, VisionPro®, and DataMan®, as well as many common-law marks.
Compliance with Environmental ProvisionsCognex’s capital expenditures, earnings, and competitive position are not materially affected by compliance with federal, state, and local environmentalprovisions which have been enacted or adopted to regulate the distribution of materials into the environment.CompetitionThe machine vision market is highly fragmented and competitive. Our competitors include other vendors of machine vision systems, controllers, andcomponents; manufacturers of image processing systems, sensors, and components; and system integrators. In addition, in the semiconductor andelectronics capital equipment market, and with machine builders in the factory automation market, we compete with the internal engineering departmentsof current or prospective customers. In the identif ication and logistics markets, we compete with manufacturers of automatic identif ication systems. In thedeep learning market, we compete with other industrially-focused machine vision companies, deep learning software companies, and engineering teamsthat use open source tools to solve applications. Key competitors in geographies worldwide include Keyence Corporation, Sick AG, Datalogic, and OmronCorporation. Any of these competitors may have greater f inancial and other resources than Cognex. Although we consider Cognex to be one of theleading machine vision companies in the world, reliable estimates of the machine vision market and the number and relative size of competitors are notreadily available.Cognex’s ability to compete depends upon our ability to design, manufacture, and sell high-quality products, as well as our ability to develop new productsand functionality that meet evolving customer requirements. The primary competitive factors affecting the choice of a machine vision or identif icationsystem include vendor reputation, product functionality and performance, ease of use, price, and post-sales support. The importance of each of thesefactors varies depending upon the specif ic customer’s needs.
BacklogAs of December 31, 2019, backlog, which includes deferred revenue, totaled $74,857,000, compared to $65,408,000 as of December 31, 2018. Backlogreflects customer purchase orders for products scheduled for shipment primarily within 120 days for customers in the logistics industry and primarily within60 days for customers in all other industries. The level of backlog at any particular date is not necessarily indicative of future revenue. Delivery schedulesmay be extended and orders may be canceled at any time subject to certain cancellation penalties.
5
Table of Contents
EmployeesAs of December 31, 2019, Cognex employed 2,267 persons, including 1,295 in sales, marketing, and service activities; 563 in research, development, andengineering; 193 in manufacturing and quality assurance; and 216 in information technology, f inance, and administration. Of our 2,267 employees, 1,349are based outside of the United States. We have not experienced any work stoppages due to labor disputes. We believe that our employee relations aregood.
Available InformationCognex maintains a website on the World Wide Web at www.cognex.com. We make available, free of charge, on our website in the “Company” sectionunder the caption “Investor Information” followed by “Financial Information” and then “SEC FiIings,” our Annual Report on Form 10-K, Quarterly Reportson Form 10-Q, and Current Reports on Form 8-K, including exhibits, and amendments to those reports f iled or furnished pursuant to Section 13(a) or15(d) of the Securities Exchange Act of 1934, as amended, as soon as reasonably practicable after such reports are electronically f iled with, or furnishedto, the SEC. Cognex’s reports f iled with, or furnished to, the SEC are also available at the SEC’s website at www.sec.gov. Information contained on ourwebsite is not a part of, or incorporated by reference into, this Annual Report on Form 10-K.
ITEM 1A: RISK FACTORSThe risks and uncertainties described below are not the only ones that we face. Additional risks and uncertainties that we are unaware of, or that wecurrently deem immaterial, also may become important factors that affect our company in the future. If any of these risks were to occur, our business,f inancial condition, or results of operations could be materially and adversely affected. This section includes or refers to certain forward-lookingstatements. We refer you to the explanation of the qualif ications and limitations on such forward-looking statements, appearing under the heading"Forward-Looking Statements" in Part II - Item 7 of this Annual Report on Form 10-K.Global economic conditions may continue to deteriorate and further negatively impact our operating results.Our revenue levels are impacted by global economic conditions, as we have a signif icant business presence in many countries throughout the world. Ourrevenue declined 10% in 2019 from the prior year, as industrial companies delayed and reduced spending for automation projects, including those withmachine vision, amid weaker general manufacturing confidence and heightened uncertainty around global trade. As of the date of this report, theseconditions persist and we have limited visibility beyond the current quarter as to the impact on our 2020 operating results. If global economic conditionswere to continue to deteriorate, our revenue and our ability to generate operating profits could be further materially adversely affected.As a result of global economic conditions, our business is subject to the following risks, among others:
• our customers may not have suff icient cash f low or access to f inancing to purchase our products,• our customers may not pay us within agreed upon terms or may default on their payments altogether,• our vendors may be unable to fulf ill their delivery obligations to us in a timely manner,• lower demand for our products may result in charges for excess and obsolete inventory if we are unable to sell inventory that is either
already on hand or committed to purchase,• lower cash f lows may result in impairment charges for acquired intangible assets or goodwill,• a decline in our stock price may make stock-based awards a less attractive form of compensation and a less effective form of retention
for our employees, and• the trading price of our common stock may be volatile.
As of December 31, 2019, the Company had $845 million in cash and investments. In addition, Cognex has no long-term debt and we do not anticipateneeding debt f inancing in the near future. We believe that our strong cash position puts us in a relatively good position to weather economic downturns.Nevertheless, our operating results have been materially adversely affected in 2019, and could continue to be materially adversely affected in the future,as a result of unfavorable economic conditions and reduced capital spending by manufacturers worldwide.The loss of, or significant curtailment of purchases by, a large customer could continue to have an adverse effect on our business.Revenue from a single customer accounted for 15% and 20% of total revenue in 2018 and 2017, respectively, but less than 10% of total revenue in 2019.The curtailment of purchases by this customer represented a signif icant portion of our total revenue decrease in 2019 from the prior year. Although nocustomer accounted for greater than 10% of
6
Table of Contents
our total revenue in 2019, we continue to have relatively larger customers, particularly in the consumer electronics and logistics industries. In some cases,end customers of our resellers may be large consumers of our products. Large customers may divert management’s attention from other operationalmatters and pull resources from other areas of the business, resulting in potential loss of revenue from other customers. In addition, large customers mayreceive preferred pricing and a higher level of support, which may lower our gross margin percentage. Furthermore, we typically extend credit terms to largecustomers, resulting in signif icant accounts receivable balances, and in certain instances due to long supplier lead times, we may purchase inventory inadvance of receipt of a customer purchase order, which exposes us to an increased risk of excess or obsolete inventory and resulting charges. The lossof, or further curtailment of purchases by, any one or more of our larger customers could have a material adverse effect on our operating results.A continued downturn in the consumer electronics or automotive industries may further adversely affect our business.In 2019, consumer electronics and automotive, our two largest markets that combined represented approximately half of our total revenue, bothcontracted simultaneously. Our business is impacted by the level of capital spending in these industries, as well as the product design cycles of our majorcustomers in these industries. The market leaders in these industries are able to exert purchasing power over their vendors' supply chains, and our largecustomers in these industries may decide to purchase fewer products from Cognex or stop purchasing from Cognex altogether. As a result, our operatingresults could continue to be materially and adversely affected by further declining sales in these industries.Our inability to achieve growth in revenue and profits from our logistics business may negatively impact our operating results.We are pursuing applications to automate distribution processes in the logistics industry for applications including retail distribution and ecommerce toscan, track, and sort goods through distribution centers. Our future growth plans are dependent upon growth in this industry. Our gross margin percentagein this industry is currently lower than our average gross margin percentage, as certain sales in this industry are for application-specif ic customer solutionsthat include deployment services. Our strategy is to shift our focus as the logistics market matures from Cognex providing deployment services to utilizingpartner integrators to provide these services for end users, which we believe will result in improved gross margins that will be more in line with our overallaverage over time. In addition, we are making signif icant investments in engineering and sales to further develop our logistics sales. Failure to generaterevenue in this industry in the amounts anticipated may have a material adverse impact on our revenue growth and operating results.Economic, political, and other risks associated with international sales and operations could continue to adversely affect our business andoperating results.In 2019, approximately 66% of our revenue was derived from customers located outside of the United States. We anticipate that international sales willcontinue to account for a signif icant portion of our revenue. In addition, we source components from suppliers located outside of the United States,including China, and utilize third-party contract manufacturers, primarily located in Indonesia, to assemble certain of our products. We intend to continueto expand our sales and operations outside of the United States and expand our presence in international emerging markets. As a result, our business issubject to the risks inherent in international sales and operations, including, among other things:
• various regulatory and statutory requirements,• diff iculties in injecting and repatriating cash,• export and import restrictions,• trade tarif fs,• transportation delays,• employment regulations and local labor conditions,• diff iculties in staff ing and managing foreign sales operations,• instability in economic or political conditions, including potential adverse effects from Brexit,• public health epidemics, such as the coronavirus currently impacting China and elsewhere,• diff iculties protecting intellectual property,• business systems connectivity issues, and
7
Table of Contents
• potentially adverse tax consequences.Any of these factors could have a material adverse effect on our operating results. In 2019, trade tarif fs imposed by the United States on certaincomponents imported from Chinese suppliers resulted in higher costs for our products. To date, these cost increases have been immaterial to our totalcost of goods sold and primarily relate to components sourced in China for new products that we build in the United States in their infancy before they aremoved to our contract manufacturer in Indonesia; however, cost increases as a result of trade tarif fs could become material in the future.Trade tarif fs have also had an indirect impact on the economic climate in China, which in turn, has had a negative impact on the Company's revenue fromcustomers based in China. Further escalations of trade conflicts between the United States and China, or other countries where Cognex has operations,such as countries in Europe, may have a further adverse effect on our revenue. In addition to trade tarif fs, United States export controls that placerestrictions on the exportation of our products or a subset of our products, including, without limitation, any applicable regulations promulgated by the U.S.Commerce Department’s Bureau of Industry and Security, have had a negative impact on our revenue from customers based in China. To date, the impactof these restrictions has been immaterial to our total revenue; however, further or continued restrictions could have a material adverse effect on ouroperating results in the future.In addition, the coronavirus outbreak originating from China at the beginning of 2020 has resulted in extended shutdown of certain businesses in theregion and disruptions to the supply chain. Health concerns in China or other countries in which we or our customers operate could result in social,economic, and labor instability. These uncertainties could have a material adverse effect on the continuity of our business and our results of operationand f inancial condition.Finally, we are subject to applicable anti-corruption laws, such as the U.S. Foreign Corrupt Practices Act and the U.K. Bribery Act, and similar anti-corruption and anti-kickback laws in the jurisdictions in which we operate. These laws generally prohibit offering, promising, giving, or authorizing others toprovide anything of value, either directly or indirectly, to a government off icial or private party in order to inf luence off icial action or otherwise gain anunfair business advantage, such as to obtain or retain business. Particularly as a result of our global operations, including in developing countries, and ourgrowing international sales force, our relationships with our customers and resellers could expose us to liability under these laws. Violations of anti-corruption laws may result in severe civil and criminal penalties for noncompliance. Even an unsuccessful challenge or investigation into our practices iscostly to defend, and could cause adverse publicity, and thus could have a material adverse effect on our business, f inancial condition, or operatingresults.Fluctuations in foreign currency exchange rates and the use of derivative instruments to hedge these exposures could adversely affect ourreported results, liquidity, and competitive position.We face exposure to foreign currency exchange rate f luctuations, as a signif icant portion of our revenues, expenses, assets, and liabilities aredenominated in currencies other than the functional currencies of our subsidiaries or the reporting currency of our company, which is the U.S. Dollar. Incertain instances, we utilize forward contracts to hedge against foreign currency f luctuations. These contracts are used to minimize foreign currency gainsor losses, as the gains or losses on the derivative are intended to offset the losses or gains on the underlying exposure. We do not engage in foreigncurrency speculation. If the counterparty to any of our hedging arrangements experiences f inancial dif f iculties, or is otherwise unable to honor the terms ofthe contract, we may experience material losses.Our foreign currency hedging program may include foreign currency cash f low hedges that protect our budgeted revenues and expenses against foreigncurrency exchange rate changes compared to our budgeted rates. These derivatives are designated for hedge accounting, and therefore, the effectiveportion of the forward contract's gain or loss is reported in shareholders' equity as other comprehensive income (loss) and is reclassif ied into currentoperations as the hedged transaction impacts current operations. Should these hedges fail to qualify for hedge accounting or be ineffective, the gain orloss on the forward contract would be reported in current operations immediately as opposed to when the hedged transaction impacts current operations,which may result in material foreign currency gains or losses.The success of our foreign currency risk management program depends upon forecasts of transaction activity denominated in various currencies. To theextent that these forecasts are overstated or understated during periods of currency volatility, we could experience unanticipated foreign currency gains orlosses that could have a material impact on our results of operations. In addition, our failure to identify new exposures and hedge them in an effectivemanner may result in material foreign currency gains or losses. Furthermore, our ability to hedge the Chinese Yuan is limited, which has resulted inunhedged exposures. To date, foreign currency gains and losses related to the Chinese Yuan have been immaterial to our total results; however, furtherf luctuations in this currency may result in material foreign currency gains or losses in the future.
8
Table of Contents
A signif icant portion of our revenues and expenses are denominated in the Euro, the Chinese Yuan, and the Japanese Yen. Our predominant currency ofsale is the U.S. Dollar in the Americas, the Euro and U.S. Dollar in Europe, the Yuan in Mainland China, the Yen in Japan, and the U.S. Dollar in otherregions. We estimate that approximately 44% of our sales in 2019 were invoiced in currencies other than the U.S. Dollar, and we expect salesdenominated in foreign currencies to continue to represent a signif icant portion of our total revenue. While we also have expenses denominated in thesesame foreign currencies, the impact on revenues has historically been, and is expected to continue to be, greater than the offsetting impact on expenses.Therefore, in times when the U.S. Dollar strengthens in relation to these foreign currencies, we would expect to report a net decrease in operating income.Conversely, in times when the U.S. Dollar weakens in relation to these foreign currencies, we would expect to report a net increase in operating income.Thus, changes in the relative strength of the U.S. Dollar may have a material impact on our operating results.Information security breaches or business system disruptions may adversely affect our business.We rely on our information technology infrastructure and management information systems to effectively run our business. We may be subject toinformation security breaches caused by hacking, malicious software, or acts of vandalism or terrorism. Our security measures or those of our third-partyservice providers may not detect or prevent such breaches. Any such compromise to our information security could result in theft of our intellectualproperty, including software source code, a misappropriation of our cash or other assets, an interruption in our operations, the unauthorized publication ofour confidential business or proprietary information, the unauthorized release of customer, vendor, or employee data, the violation of privacy or otherlaws, and the exposure to litigation or regulatory penalties, any of which could harm our business and operating results. We have experiencedcybersecurity incidents in the past that have included malware, viruses, phishing attacks, and intrusion attempts to Cognex’s internet-facing systems. Todate, these incidents have not had a material impact on our operations or f inancial results; however, future cybersecurity incidents could have a materialadverse effect on our business, f inancial condition, or operating results.In 2018, we placed into service a new Enterprise Resource Planning (ERP) system, which is the management information system that integrates ourmanufacturing, order fulf illment, and f inancial activities. Disruptions with our management information systems may cause signif icant business disruption,including our ability to process orders, ship products, invoice customers, process payments, and otherwise run our business. Any disruption occurring withour ERP system, or any of our other management information systems, may have a material adverse effect on our operating results.Our business could suffer if we lose the services of, or fail to attract, key personnel.We are highly dependent upon the management and leadership of Robert J. Shillman, our Chairman of the Board of Directors and Chief Culture Off icer,and Robert J. Willett, our President and Chief Executive Off icer, as well as other members of our senior management team. Although we have manyexperienced and qualif ied senior managers, the loss of key personnel could have a material adverse effect on our company.We have historically used stock options as a key component of our employee compensation program in order to align employee interests with the interestsof our shareholders, provide competitive compensation packages, and encourage employee retention. While we currently intend to continue to grant stockoptions as a key component of our compensation program for our senior management team, we are shifting away from granting stock options to grantingrestricted stock units (RSUs) as a retention tool for key employees below the senior management level. Our stock price volatility may cause periods oftime during which option exercise prices might be less than the sale price of our common stock, which may lessen such options' retentive attributes, andtherefore, we believe that RSUs may be a more effective retention tool for employees below the senior management level. We are limited as to thenumber of stock options and RSUs that we may grant under our stock plans, and we are unsure how effective different stock-based awards with dif ferentvesting schedules will be to retain key talent. Accordingly, we may f ind it dif f icult to attract, retain, and motivate employees, and any such diff icultiescould materially adversely affect our business.
If we fail to effectively manage our growth, our business and operating results could suffer.To help support our growth plans, our headcount increased from 2,114 employees as of December 31, 2018 to 2,267 employees as of December 31, 2019,with 90 employees added as a result of the acquisition of Sualab Co., Ltd. in the fourth quarter of 2019. Although the remaining additions represent a netheadcount increase of 63 persons, the number of new employees that we hired and trained was higher due to workforce attrition. In addition, we currentlyutilize a large number of third-party contractors to provide on-site technical support and installation services.To support our growth and execute on our operating plans and strategic initiatives, we must effectively attract, train, develop, motivate, and retain skilledemployees, while maintaining our unique corporate culture. We believe our strong corporate culture is critical to our ability to collaborate, innovate,execute, and adapt in a high-growth, fast-changing business environment. We may not be able to hire and train new employees and contractors quicklyenough to meet
9
Table of Contents
our business needs. If we fail to quickly adapt our hiring and training plans to our business levels or effectively execute on our hiring plans, our eff iciencyand ability to meet our operating goals could suffer. Furthermore, employee productivity, morale, and retention could suffer, which may have a materialadverse effect on our business and operating results.Additionally, the growth and expansion of our business and product offerings place signif icant demand on our employees and, in particular, ourmanagement team. The growth of our business may require signif icant additional resources to meet these daily requirements, which may not scale in acost-effective manner or may negatively impact our customers’ experience. Effective management information systems, including our Enterprise ResourcePlanning (ERP) system placed into service in 2018, and strong internal controls are also necessary to support our growth. If we are unable to manage thegrowth of our organization and business effectively, our operating results may be materially and adversely affected.The failure of a key supplier to deliver quality product in a timely manner or our inability to obtain components for our products couldadversely affect our operating results.A signif icant portion of our product is manufactured by a third-party contractor located in Indonesia. This contractor has agreed to provide Cognex withtermination notif ication periods and last-time-buy rights, if and when that may be applicable. We rely upon this contractor to provide quality product andmeet delivery schedules. We engage in extensive product quality programs and processes, including actively monitoring the performance of our third-partymanufacturers; however, we may not detect all product quality issues through these programs and processes.Certain components are presently sourced from a single vendor that is selected based upon price and performance considerations. In the event of asupply disruption from a single-source vendor, these components may be purchased from alternative vendors, which may result in manufacturing delaysbased on the lead time of the new vendor. Certain key electronic and mechanical components that are purchased from strategic suppliers, such asprocessors or imagers, are fundamental to the design of Cognex products. A disruption in the supply of these key components, such as a last-time-buyannouncement, natural disaster, f inancial bankruptcy, or other event, may require us to purchase a signif icant amount of inventory at unfavorable pricesresulting in lower gross margins and higher risk of carrying excess inventory.We are subject to the requirements of the Dodd-Frank Wall Street Reform and Consumer Protection Act that obligates companies to inquire into theorigin of conflict minerals in their supply chains. We work with our supply chain partners to take reasonable steps to assure conflict minerals are notsourced by Cognex or our supply chain partners. These steps may include purchasing supply from alternative vendors. If we are unable to secureadequate supply from alternative vendors, we may have to redesign our products, which may lead to a delay in manufacturing and a possible loss ofsales. Although we are taking certain actions to mitigate supply risk, an interruption in, termination of, or material change in the purchase terms of any keycomponents could have a material adverse effect on our operating results.Our failure to effectively manage product transitions or accurately forecast customer demand could result in excess or obsolete inventory andresulting charges.Because the market for our products is characterized by rapid technological changes, we frequently introduce new products with improved ease-of-use,improved hardware performance, additional software features and functionality, or lower cost that may replace existing products. Among the risksassociated with the introduction of new products are diff iculty predicting customer demand and effectively managing inventory levels to ensure adequatesupply of the new product and avoid excess supply of the legacy product.We may strategically enter into non-cancelable commitments with vendors to purchase materials for our products in advance of demand to takeadvantage of favorable pricing, address concerns about the availability of future supplies, or build safety stock to help ensure customer shipments are notdelayed should we experience higher than anticipated demand for materials with long lead times. These measures to purchase inventory may expose us toan increased risk of excess or obsolete inventory and resulting charges if actual demand is lower than anticipated. Our failure to effectively manageproduct transitions or accurately forecast customer demand, in terms of both volume and configuration, has led to, and may again in the future lead to, anincreased risk of excess or obsolete inventory and resulting charges.
10
Table of Contents
Our products may contain design or manufacturing defects, which could result in reduced demand, significant delays, or substantial costs.If f laws in either the design or manufacture of our products were to occur, we could experience a rate of failure in our products that could result insignif icant delays in shipment and material repair or replacement costs. Our release-to-market process may not be robust enough to detect signif icantdesign f laws or software bugs. While we engage in product quality programs and processes, including actively monitoring and evaluating the quality of ourcomponent suppliers and contract manufacturers, these actions may not be suff icient to avoid a product failure rate that results in:
• substantial delays in shipment,• signif icant repair or replacement costs,• product liability claims or lawsuits, particularly in connection with life sciences customers or other high-risk end-user industries, or• potential damage to our reputation.
Any of these results could have a material adverse effect on our operating results.Our failure to introduce new products in a successful and timely manner could result in the loss of our market share and a decrease in ourrevenues and profits.The market for our products is characterized by rapidly changing technology. Accordingly, we believe that our future success will depend upon our abilityto accelerate time-to-market for new products with improved functionality, ease-of-use, performance, or price. There can be no assurance that we will beable to introduce new products in accordance with scheduled release dates or that new products will achieve market acceptance. Our inability to keeppace with the rapid rate of technological change in the high-technology marketplace could have a material adverse effect on our operating results.Product development is often a complex, time-consuming, and costly process involving signif icant investment in research and development with noassurance of return on investment. Our strong balance sheet allows us to continue to make signif icant investments in research, development, andmarketing for new products and technologies. Research is by its nature speculative and the ultimate commercial success of a product depends uponvarious factors, many of which are not under our control. We may not achieve signif icant revenue from new product investments for a number of years, ifat all. Moreover, new products, if introduced, may not generate the gross margins that we have experienced historically.Our failure to properly manage the distribution of our products and services could result in the loss of revenues and profits.We utilize a direct sales force, as well as a network of distribution and integration partners, to sell our products and services. Successfully managing theinteraction of our direct and indirect sales channels to reach various potential customers for our products and services is a complex process. In addition,our reliance upon indirect selling methods may reduce visibility to demand and pricing issues. Each sales channel has distinct risks and costs, andtherefore, our failure to implement the most advantageous balance in the sales model for our products and services could adversely affect our revenueand profitability.If we fail to successfully protect our intellectual property, our competitive position and operating results could suffer.We rely on our proprietary software technology and hardware designs, as well as the technical expertise, creativity, and knowledge of our personnel tomaintain our position as a leading provider of machine vision products. Software piracy and reverse engineering, specif ically from companies in Russiaand China, may result in counterfeit products that are misrepresented in the market as Cognex products. Although we use a variety of methods to protectour intellectual property, we rely most heavily on patent, trademark, copyright, and trade secret protection, as well as non-disclosure agreements withcustomers, suppliers, employees, and consultants. We also attempt to protect our intellectual property by restricting access to our proprietary informationby a combination of technical and internal security measures. These measures, however, may not be adequate to:
• protect our proprietary technology,• protect our patents from challenge, invalidation, or circumvention, or• ensure that our intellectual property will provide us with competitive advantages.
11
Table of Contents
Our pending and future patent applications may not issue as patents or, if issued, may not issue in a form that will provide us with any meaningfulprotection or any competitive advantage. Even if issued, existing or future patents may be challenged, narrowed, invalidated, or circumvented, whichcould limit our ability to stop competitors from developing and marketing similar products or limit the length of patent protection we may have for ourproducts. Furthermore, other companies may design around technologies we have patented, licensed, or developed. Moreover, changes in patent laws ortheir interpretation in the United States and other countries could also diminish the value of our intellectual property or narrow the scope of our patentprotection. In addition, the legal systems of certain countries do not favor the aggressive enforcement of patents, and the laws of foreign countries maynot protect our rights to the same extent as the laws of the United States. As a result, our patent portfolio may not provide us with suff icient rights toexclude others from commercializing products similar to ours. Any of these adverse circumstances could have a material adverse effect on our operatingresults.Our Company may be subject to time-consuming and costly litigation.From time to time, we may be subject to various claims and lawsuits by competitors, shareholders, customers, distributors, or other parties arising in theordinary course of business, including lawsuits charging patent infringement, or claims and lawsuits instituted by us to protect our intellectual property andconfidential information or for other reasons. We may be a party to actions that are described in the section captioned “Legal Proceedings,” appearing inPart I - Item 3 of this Annual Report on Form 10-K. These matters can be time consuming, divert management’s attention and resources, and cause us toincur signif icant expenses. Furthermore, the results of any of these actions may have a material adverse effect on our operating results.Increased competition may result in decreased demand or prices for our products and services.The machine vision market is highly fragmented and competitive. Our competitors include other vendors of machine vision systems, controllers, andcomponents; manufacturers of image processing systems, sensors, and components; and system integrators. We may also compete with internalengineering departments of current or prospective customers, as well as open source tools available for free by various companies. Any of thesecompetitors may have greater f inancial and other resources than we do. We may not be able to compete successfully in the future and our investments inresearch and development, sales and marketing, and support activities may be insuff icient to enable us to maintain our competitive advantage. Inaddition, competitive pressures could lead to price erosion that could have a material adverse effect on our gross margins and operating results. We referyou to the section captioned “Competition,” appearing in Part I - Item 1 of this Annual Report on Form 10-K for further information regarding thecompetition that we face.Implementation of our acquisition strategy may not be successful, which could affect our ability to increase our revenue or profitability andresult in the impairment of acquired intangible assets.On October 16, 2019, we completed our largest acquisition to date when we acquired Sualab Co., Ltd., a provider of deep learning-based vision softwarebased in Korea. The total consideration of approximately $195 million included cash payments of approximately $171 million paid at closing and deferredpayments of approximately $24 million payable on the fourth anniversary date of the closing, contingent upon the continued employment of key talent.Our business may be negatively impacted by risks related to this acquisition, as well as other smaller acquisitions we have completed in the past fewyears, and future acquisitions that we may make. These risks include, among others:
• the diversion of management's attention from other operational matters,• diff iculties or delays integrating personnel, operations, technologies, products, and systems of the acquired business, particularly in
remote locations,• the inability to realize expected synergies or other benefits resulting from the acquisition,• the failure to retain key talent,• the impairment of acquired intangible assets resulting from lower-than-expected cash f lows from the acquired assets,• the inability to protect and secure acquired intellectual property or confidential information,• diff iculties or delays completing the development of acquired in-process technology,• the failure to retain key customers, and• the failure to achieve projected sales of acquired products.
Acquisitions are inherently risky and the inability to effectively manage these risks could have a material adverse effect on our operating results.
12
Table of Contents
We are at risk for impairment charges with respect to our investments or for acquired intangible assets or goodwill, which could have amaterial adverse effect on our results of operations.As of December 31, 2019, our investment portfolio of debt securities totaled $669,594,000. These debt securities are reported at fair value, withunrealized gains and losses, net of tax, recorded in shareholders’ equity as other comprehensive income (loss) since these securities are designated asavailable-for-sale securities. As of December 31, 2019, our portfolio of debt securities had a net unrealized gain of $2,351,000. Included in this net gainwere gross unrealized losses totaling $65,000, of which $39,000 were in a loss position for less than twelve months and $26,000 were in a loss position forgreater than twelve months. As of December 31, 2019, these unrealized losses were determined to be temporary. However, if conditions change andfuture unrealized losses were determined to be other-than-temporary, we would be required to record an impairment charge.Management monitors the carrying value of its debt securities compared to their fair value to determine whether an other-than-temporary impairment hasoccurred. In considering whether a decline in fair value is other-than-temporary, we consider many factors, both qualitative and quantitative. Managementconsiders the type of security, the credit rating of the security, the length of time the security has been in a loss position, the size of the loss position, ourability and intent to hold the security to expected recovery of value, and other meaningful information. If a decline in fair value is determined to be other-than-temporary, an impairment charge would be recorded in current operations to reduce the carrying value of the investment to its fair value. Should thefair value of investments decline in future periods below their carrying value, management will need to determine whether this decline is other-than-temporary and future impairment charges may be required.As of December 31, 2019, we had $243 million in acquired goodwill. The fair value of goodwill is susceptible to changes in the fair value of the reportingsegment in which the goodwill resides, and therefore, a decline in our market capitalization or cash f lows relative to our net book value may result in futureimpairment charges.As of December 31, 2019, we had $39 million in acquired intangible assets, consisting primarily of acquired technologies and customer relationships.These assets are susceptible to changes in fair value due to a decrease in the historical or projected cash f lows from the use of these assets, which maybe negatively impacted by economic trends. A decline in the cash f lows generated by these assets may result in future impairment charges.If we determine that any of these investments, goodwill, or intangible assets is impaired, we would be required to take a related charge to earnings thatcould have a material adverse effect on our results of operations.We may have additional tax liabilities, which could adversely affect our operating results and financial condition.We are subject to taxes in the United States, as well as in numerous foreign jurisdictions, including income taxes, indirect taxes such as value-addedtaxes (VAT), and payroll-related taxes and withholding obligations. Signif icant judgment is required in determining our worldwide provision for income andother taxes. In the ordinary course of business, there are many transactions and calculations where the ultimate tax determination is uncertain. We areregularly under audit by tax authorities and may be assessed additional taxes, penalties, fees or interest, which could have an adverse effect on ourf inancial position, liquidity, or results of operation.In the fourth quarter of 2019, we made changes to our international tax structure as a result of tax reform legislation enacted by the European Union. Inaddition, in connection with the acquisition of Sualab Co., Ltd., we migrated acquired intellectual property to certain subsidiaries in order to align with ourcorporate tax structure. The Company has made certain judgments and estimates in connection with these transactions, which have impacted the amountand timing of current and deferred tax expense in 2019 and in future years.Although we believe our tax positions are reasonable, the f inal determination of tax audits and any related litigation could be materially dif ferent than thatwhich is ref lected in our f inancial statements and could have a material adverse effect on our income tax provision, net income, or cash f lows in the periodin which the determination is made.
ITEM 1B: UNRESOLVED STAFF COMMENTSNone
ITEM 2: PROPERTIESIn 1994, Cognex purchased and renovated a 100,000 square-foot building located in Natick, Massachusetts that serves as our corporate headquartersand is occupied by employees primarily in research, development, and engineering, manufacturing and quality assurance, and administration functions. In1997, Cognex completed construction of a 50,000 square-foot addition to this building.
13
Table of Contents
In 1995, Cognex purchased an 83,000 square-foot off ice building adjacent to our corporate headquarters that is occupied by employees primarily in sales,marketing, service, logistics, f inance, and information technology functions.In 1997, Cognex purchased a three and one-half acre parcel of land adjacent to our corporate headquarters. This land is being held for future expansion.In 2007, Cognex purchased a 19,000 square-foot building adjacent to our corporate headquarters. A portion of this facility serves as the distribution centerfor customers in the Americas. The remainder of this building is occupied by a tenant who has a lease agreement that expires in 2022.In 2014, Cognex purchased a 50,000 square foot building in Cork, Ireland where we had previously leased space for several years. This facility serves asthe distribution center for customers outside of the Americas.Cognex conducts certain of its operations in leased facilities. These lease agreements expire at various dates through 2025. Certain of these leasescontain renewal options, retirement obligations, escalation clauses, rent holidays, and leasehold improvement incentives.
ITEM 3: LEGAL PROCEEDINGSVarious claims and legal proceedings generally incidental to the normal course of business are pending or threatened on behalf of or against theCompany. While we cannot predict the outcome of these matters, we believe that any liability arising from them will not have a material adverse effect onour f inancial position, liquidity, or results of operations.
ITEM 4: MINE SAFETY DISCLOSURESNot applicable.
ITEM 4A: INFORMATION ABOUT OUR EXECUTIVE OFFICERSThe following table sets forth the names, ages, and titles of Cognex’s executive off icers as of December 31, 2019:
Name Age TitleRobert J. Shillman 73 Chairman of the Board of Directors and Chief Culture Off icerRobert J. Willett 52 President and Chief Executive Off icerLaura A. MacDonald 51 Vice President and Corporate ControllerSheila M. DiPalma 53 Senior Vice President of Employee Services
Executive off icers are elected annually by the Board of Directors. There are no family relationships among the directors and executive off icers of theCompany.Dr. Shillman and Mr. Willett have been employed by Cognex in their current positions for no less than the past f ive years.Ms. MacDonald joined Cognex in 1994. She has served for more than 25 years in a series of increasingly responsible roles in the f inance function, andhas served as the Company's Vice President and Corporate Controller since 2007. Prior to joining Cognex, Ms. MacDonald was a member of the auditf irm PricewaterhouseCoopers, where she practiced as a Certif ied Public Accountant. She holds a Bachelor of Science degree in Accounting fromProvidence College and a Master of Business Administration from Babson College.Ms. DiPalma joined Cognex in 1992. She has served for more than 25 years in a series of increasingly responsible roles in the f inance function, includingsix years as Cognex Treasurer, before transitioning to Employee Services in 2016. Prior to joining Cognex, Ms. DiPalma was a member of the audit f irmPricewaterhouseCoopers. She holds a Bachelor of Science degree in Accounting from Boston College, a Master of Science degree in Taxation fromBentley College, and is a Certif ied Public Accountant.
14
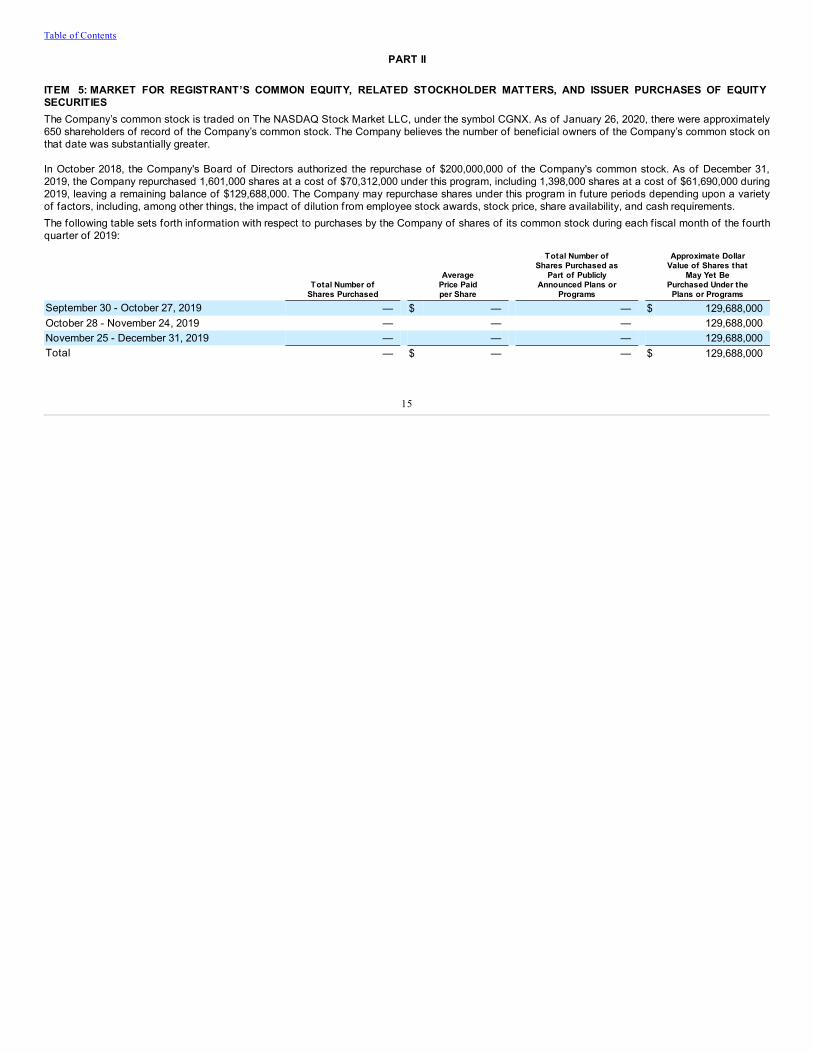
Table of Contents
PART II
ITEM 5: MARKET FOR REGISTRANT’S COMMON EQUITY, RELATED STOCKHOLDER MATTERS, AND ISSUER PURCHASES OF EQUITYSECURITIESThe Company’s common stock is traded on The NASDAQ Stock Market LLC, under the symbol CGNX. As of January 26, 2020, there were approximately650 shareholders of record of the Company’s common stock. The Company believes the number of beneficial owners of the Company’s common stock onthat date was substantially greater.
In October 2018, the Company's Board of Directors authorized the repurchase of $200,000,000 of the Company's common stock. As of December 31,2019, the Company repurchased 1,601,000 shares at a cost of $70,312,000 under this program, including 1,398,000 shares at a cost of $61,690,000 during2019, leaving a remaining balance of $129,688,000. The Company may repurchase shares under this program in future periods depending upon a varietyof factors, including, among other things, the impact of dilution from employee stock awards, stock price, share availability, and cash requirements.The following table sets forth information with respect to purchases by the Company of shares of its common stock during each f iscal month of the fourthquarter of 2019:
Total Number of
Shares Purchased
AveragePrice Paidper Share
Total Number ofShares Purchased as
Part of PubliclyAnnounced Plans or
Programs
Approximate DollarValue of Shares that
May Yet BePurchased Under the
Plans or ProgramsSeptember 30 - October 27, 2019 — $ — — $ 129,688,000October 28 - November 24, 2019 — — — 129,688,000November 25 - December 31, 2019 — — — 129,688,000Total — $ — — $ 129,688,000
15
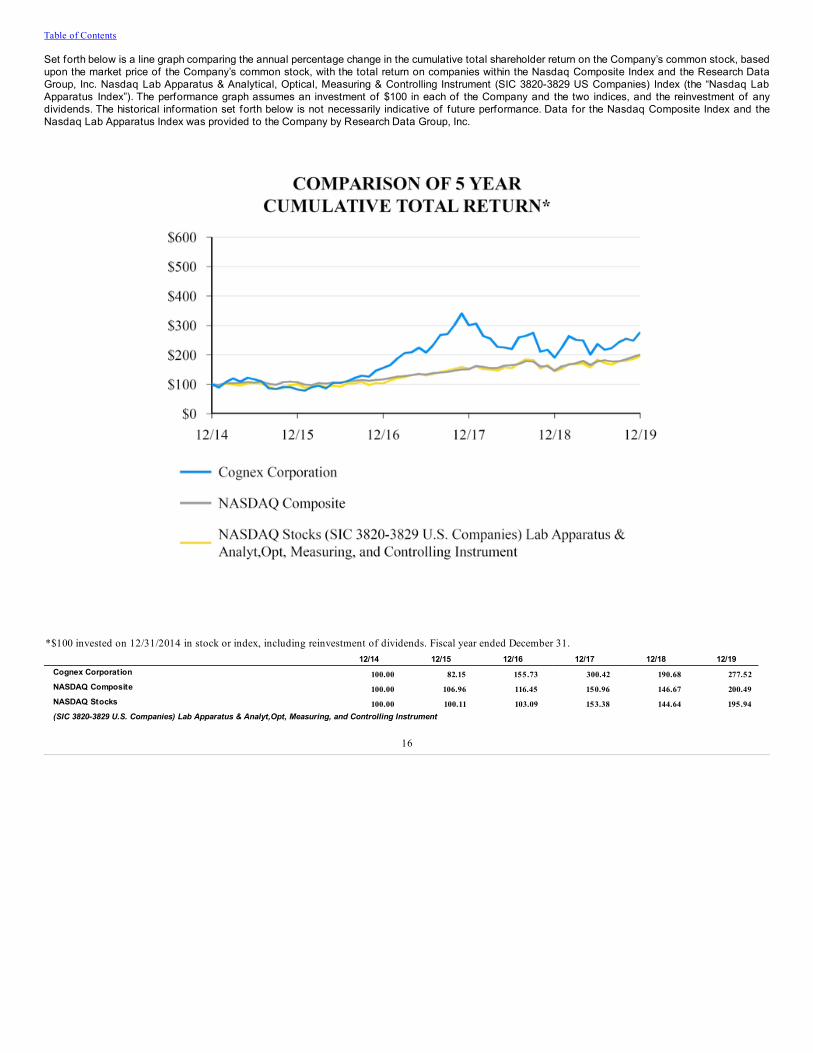
Table of Contents
Set forth below is a line graph comparing the annual percentage change in the cumulative total shareholder return on the Company’s common stock, basedupon the market price of the Company’s common stock, with the total return on companies within the Nasdaq Composite Index and the Research DataGroup, Inc. Nasdaq Lab Apparatus & Analytical, Optical, Measuring & Controlling Instrument (SIC 3820-3829 US Companies) Index (the “Nasdaq LabApparatus Index”). The performance graph assumes an investment of $100 in each of the Company and the two indices, and the reinvestment of anydividends. The historical information set forth below is not necessarily indicative of future performance. Data for the Nasdaq Composite Index and theNasdaq Lab Apparatus Index was provided to the Company by Research Data Group, Inc.
*$100 invested on 12/31/2014 in stock or index, including reinvestment of dividends. Fiscal year ended December 31. 12/14 12/15 12/16 12/17 12/18 12/19
Cognex Corporation 100.00 82.15 155.73 300.42 190.68 277.52NASDAQ Composite 100.00 106.96 116.45 150.96 146.67 200.49NASDAQ Stocks 100.00 100.11 103.09 153.38 144.64 195.94(SIC 3820-3829 U.S. Companies) Lab Apparatus & Analyt,Opt, Measuring, and Controlling Instrument
16
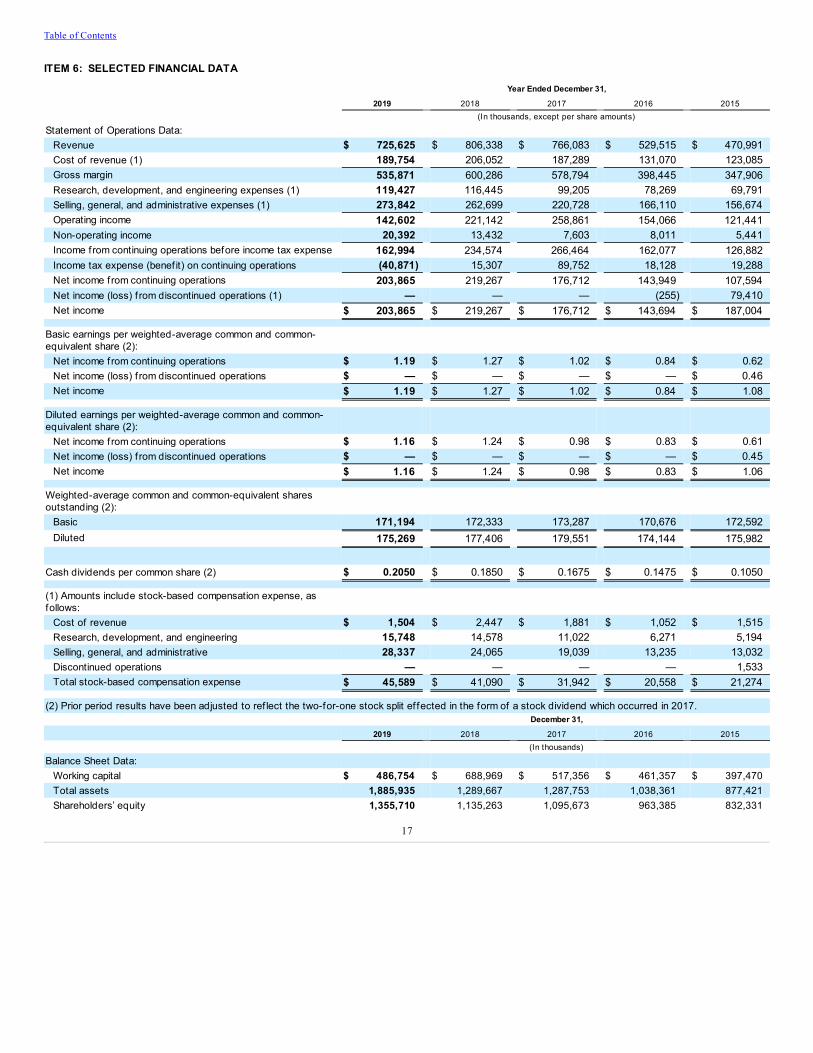
Table of Contents
ITEM 6: SELECTED FINANCIAL DATA
Year Ended December 31,
2019 2018 2017 2016 2015 (In thousands, except per share amounts)
Statement of Operations Data: Revenue $ 725,625 $ 806,338 $ 766,083 $ 529,515 $ 470,991Cost of revenue (1) 189,754 206,052 187,289 131,070 123,085Gross margin 535,871 600,286 578,794 398,445 347,906Research, development, and engineering expenses (1) 119,427 116,445 99,205 78,269 69,791Selling, general, and administrative expenses (1) 273,842 262,699 220,728 166,110 156,674Operating income 142,602 221,142 258,861 154,066 121,441Non-operating income 20,392 13,432 7,603 8,011 5,441Income f rom continuing operations before income tax expense 162,994 234,574 266,464 162,077 126,882Income tax expense (benef it) on continuing operations (40,871) 15,307 89,752 18,128 19,288Net income f rom continuing operations 203,865 219,267 176,712 143,949 107,594Net income (loss) f rom discontinued operations (1) — — — (255) 79,410Net income $ 203,865 $ 219,267 $ 176,712 $ 143,694 $ 187,004
Basic earnings per weighted-average common and common-equivalent share (2):
Net income f rom continuing operations $ 1.19 $ 1.27 $ 1.02 $ 0.84 $ 0.62Net income (loss) f rom discontinued operations $ — $ — $ — $ — $ 0.46Net income $ 1.19 $ 1.27 $ 1.02 $ 0.84 $ 1.08
Diluted earnings per weighted-average common and common-equivalent share (2):
Net income f rom continuing operations $ 1.16 $ 1.24 $ 0.98 $ 0.83 $ 0.61Net income (loss) f rom discontinued operations $ — $ — $ — $ — $ 0.45Net income $ 1.16 $ 1.24 $ 0.98 $ 0.83 $ 1.06
Weighted-average common and common-equivalent sharesoutstanding (2):
Basic 171,194 172,333 173,287 170,676 172,592Diluted 175,269 177,406 179,551 174,144 175,982
Cash dividends per common share (2) $ 0.2050 $ 0.1850 $ 0.1675 $ 0.1475 $ 0.1050 (1) Amounts include stock-based compensation expense, asfollows:
Cost of revenue $ 1,504 $ 2,447 $ 1,881 $ 1,052 $ 1,515Research, development, and engineering 15,748 14,578 11,022 6,271 5,194Selling, general, and administrative 28,337 24,065 19,039 13,235 13,032Discontinued operations — — — — 1,533Total stock-based compensation expense $ 45,589 $ 41,090 $ 31,942 $ 20,558 $ 21,274
(2) Prior period results have been adjusted to ref lect the two-for-one stock split ef fected in the form of a stock dividend which occurred in 2017. December 31,
2019 2018 2017 2016 2015 (In thousands)
Balance Sheet Data: Working capital $ 486,754 $ 688,969 $ 517,356 $ 461,357 $ 397,470Total assets 1,885,935 1,289,667 1,287,753 1,038,361 877,421Shareholders’ equity 1,355,710 1,135,263 1,095,673 963,385 832,331
17
Table of Contents
ITEM 7: MANAGEMENT’S DISCUSSION AND ANALYSIS OF FINANCIAL CONDITION AND RESULTS OF OPERATIONSFORWARD-LOOKING STATEMENTSCertain statements made in this report, as well as oral statements made by the Company from time to time, constitute forward-looking statements withinthe meaning of Section 27A of the Securities Act of 1933, as amended, and Section 21E of the Securities Exchange Act of 1934, as amended. Readerscan identify these forward-looking statements by our use of the words “expects,” “anticipates,” “estimates,” “believes,” “projects,” “intends,” “plans,” “will,”“may,” “shall,” “could,” “should,” and similar words and other statements of a similar sense. These statements are based upon our current estimates andexpectations as to prospective events and circumstances, which may or may not be in our control and as to which there can be no f irm assurances given.These forward-looking statements, which include statements regarding business and market trends, future f inancial performance, customer order ratesand timing of related revenue, expected areas of growth, emerging markets, future product mix, research and development activities, investments,strategic plans, expected benefits from acquisitions, dividends, stock repurchases, and tax matters, involve known and unknown risks and uncertaintiesthat could cause actual results to dif fer materially from those projected. Such risks and uncertainties include: (1) current and future conditions in the globaleconomy, including the imposition of tarif fs or export controls and the impact of the coronavirus outbreak; (2) the loss of, or curtailment of purchases by, alarge customer; (3) the reliance on revenue from the consumer electronics or automotive industries; (4) the inability to penetrate the logistics industry andother new markets; (5) the inability to achieve signif icant international revenue; (6) f luctuations in foreign currency exchange rates and the use ofderivative instruments; (7) information security breaches or business system disruptions; (8) the inability to attract and retain skilled employees; (9) thefailure to effectively manage our growth; (10) the reliance upon key suppliers to manufacture and deliver critical components for our products; (11) thefailure to effectively manage product transitions or accurately forecast customer demand; (12) the inability to design and manufacture high-qualityproducts; (13) the technological obsolescence of current products and the inability to develop new products; (14) the failure to properly manage thedistribution of products and services; (15) the inability to protect our proprietary technology and intellectual property; (16) our involvement in time-consuming and costly litigation; (17) the impact of competitive pressures; (18) the challenges in integrating and achieving expected results from acquiredbusinesses, including the recent acquisition of Sualab; (19) potential impairment charges with respect to our investments or for acquired intangible assetsor goodwill; and (20) exposure to additional tax liabilities. The foregoing list should not be construed as exhaustive and we encourage readers to refer tothe detailed discussion of risk factors included in Part I - Item 1A of this Annual Report on Form 10-K. The Company cautions readers not to place unduereliance upon any such forward-looking statements, which speak only as of the date made. The Company disclaims any obligation to subsequently reviseforward-looking statements to ref lect the occurrence of anticipated or unanticipated events or circumstances after the date such statements are made.EXECUTIVE OVERVIEWCognex Corporation is a leading worldwide provider of machine vision products that capture and analyze visual information in order to automatemanufacturing and distribution tasks where vision is required. In addition to product revenue derived from the sale of machine vision products, theCompany also generates revenue by providing maintenance and support, consulting, and training services to its customers; however, service revenueaccounted for less than 10% of total revenue for all periods presented.Cognex machine vision is used to automate manufacturing and distribution processes in a variety of industries, where the technology is widely recognizedas an important component of automated production and quality assurance. Virtually every manufacturer can achieve better quality and manufacturingeff iciency by using machine vision, and therefore, Cognex products are used by a broad base of customers across a variety of industries, includingconsumer electronics, automotive, consumer products, food and beverage, pharmaceuticals, and medical devices. Cognex products are also used toautomate distribution processes in the logistics industry, including for applications in retail distribution and ecommerce to scan, track, and sort goodsthrough distribution centers.Revenue for the year ended December 31, 2019 totaled $725,625,000, representing a decrease of 10% from 2018 driven by signif icantly lower revenue inthe consumer electronics industry related to smartphone manufacturing. Gross margin as a percentage of revenue was 74% for both years. Operatingexpenses increased by 4% over 2018, as the impact of additional headcount to support our future growth plans was offset by lower expenses related toincentive compensation plans. As a result of the lower revenue level and continued investments, operating income was 20% of revenue in 2019 comparedto 27% of revenue in 2018. A higher level of discrete tax benefits in 2019 related to tax structure changes resulted in net income of 28% of revenue in 2019compared to 27% of revenue in 2018. Net income per diluted share was $1.16 in 2019 compared to $1.24 in 2018.
18
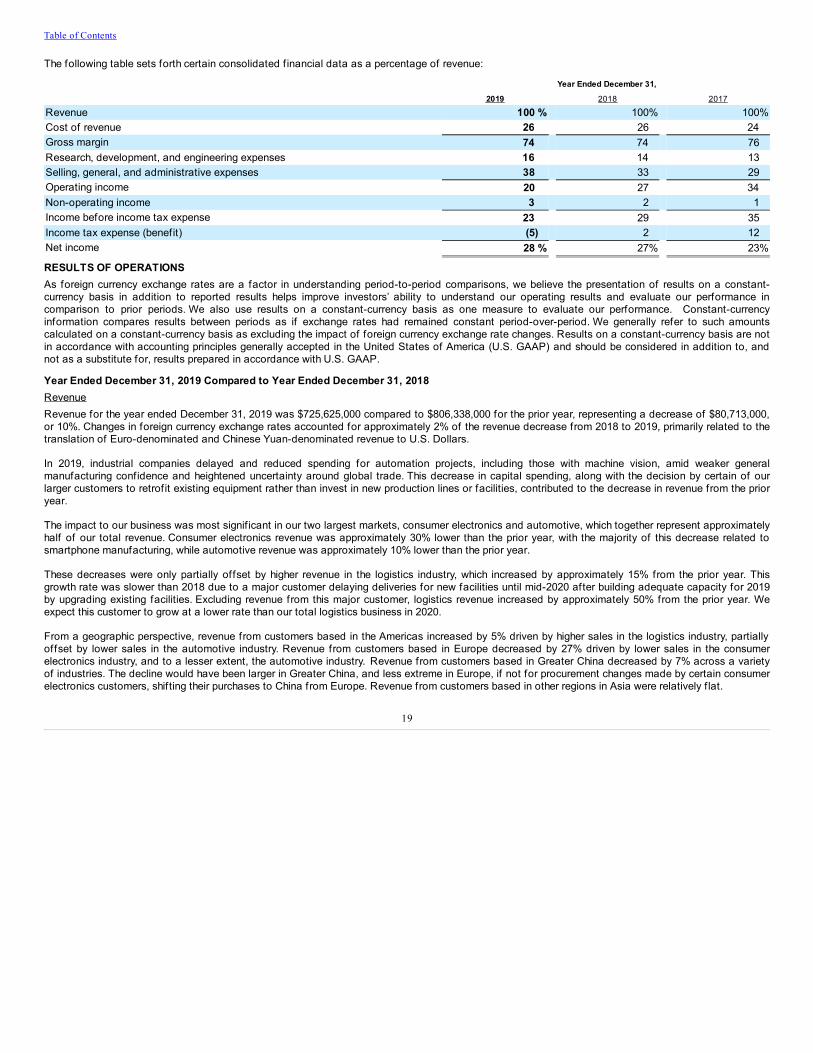
Table of Contents
The following table sets forth certain consolidated f inancial data as a percentage of revenue:
Year Ended December 31, 2019 2018 2017
Revenue 100 % 100% 100%Cost of revenue 26 26 24Gross margin 74 74 76Research, development, and engineering expenses 16 14 13Selling, general, and administrative expenses 38 33 29Operating income 20 27 34Non-operating income 3 2 1Income before income tax expense 23 29 35Income tax expense (benefit) (5) 2 12Net income 28 % 27% 23%
RESULTS OF OPERATIONSAs foreign currency exchange rates are a factor in understanding period-to-period comparisons, we believe the presentation of results on a constant-currency basis in addition to reported results helps improve investors’ ability to understand our operating results and evaluate our performance incomparison to prior periods. We also use results on a constant-currency basis as one measure to evaluate our performance. Constant-currencyinformation compares results between periods as if exchange rates had remained constant period-over-period. We generally refer to such amountscalculated on a constant-currency basis as excluding the impact of foreign currency exchange rate changes. Results on a constant-currency basis are notin accordance with accounting principles generally accepted in the United States of America (U.S. GAAP) and should be considered in addition to, andnot as a substitute for, results prepared in accordance with U.S. GAAP.
Year Ended December 31, 2019 Compared to Year Ended December 31, 2018RevenueRevenue for the year ended December 31, 2019 was $725,625,000 compared to $806,338,000 for the prior year, representing a decrease of $80,713,000,or 10%. Changes in foreign currency exchange rates accounted for approximately 2% of the revenue decrease from 2018 to 2019, primarily related to thetranslation of Euro-denominated and Chinese Yuan-denominated revenue to U.S. Dollars.
In 2019, industrial companies delayed and reduced spending for automation projects, including those with machine vision, amid weaker generalmanufacturing confidence and heightened uncertainty around global trade. This decrease in capital spending, along with the decision by certain of ourlarger customers to retrof it existing equipment rather than invest in new production lines or facilities, contributed to the decrease in revenue from the prioryear.
The impact to our business was most signif icant in our two largest markets, consumer electronics and automotive, which together represent approximatelyhalf of our total revenue. Consumer electronics revenue was approximately 30% lower than the prior year, with the majority of this decrease related tosmartphone manufacturing, while automotive revenue was approximately 10% lower than the prior year.
These decreases were only partially offset by higher revenue in the logistics industry, which increased by approximately 15% from the prior year. Thisgrowth rate was slower than 2018 due to a major customer delaying deliveries for new facilities until mid-2020 after building adequate capacity for 2019by upgrading existing facilities. Excluding revenue from this major customer, logistics revenue increased by approximately 50% from the prior year. Weexpect this customer to grow at a lower rate than our total logistics business in 2020.
From a geographic perspective, revenue from customers based in the Americas increased by 5% driven by higher sales in the logistics industry, partiallyoffset by lower sales in the automotive industry. Revenue from customers based in Europe decreased by 27% driven by lower sales in the consumerelectronics industry, and to a lesser extent, the automotive industry. Revenue from customers based in Greater China decreased by 7% across a varietyof industries. The decline would have been larger in Greater China, and less extreme in Europe, if not for procurement changes made by certain consumerelectronics customers, shifting their purchases to China from Europe. Revenue from customers based in other regions in Asia were relatively f lat.
19
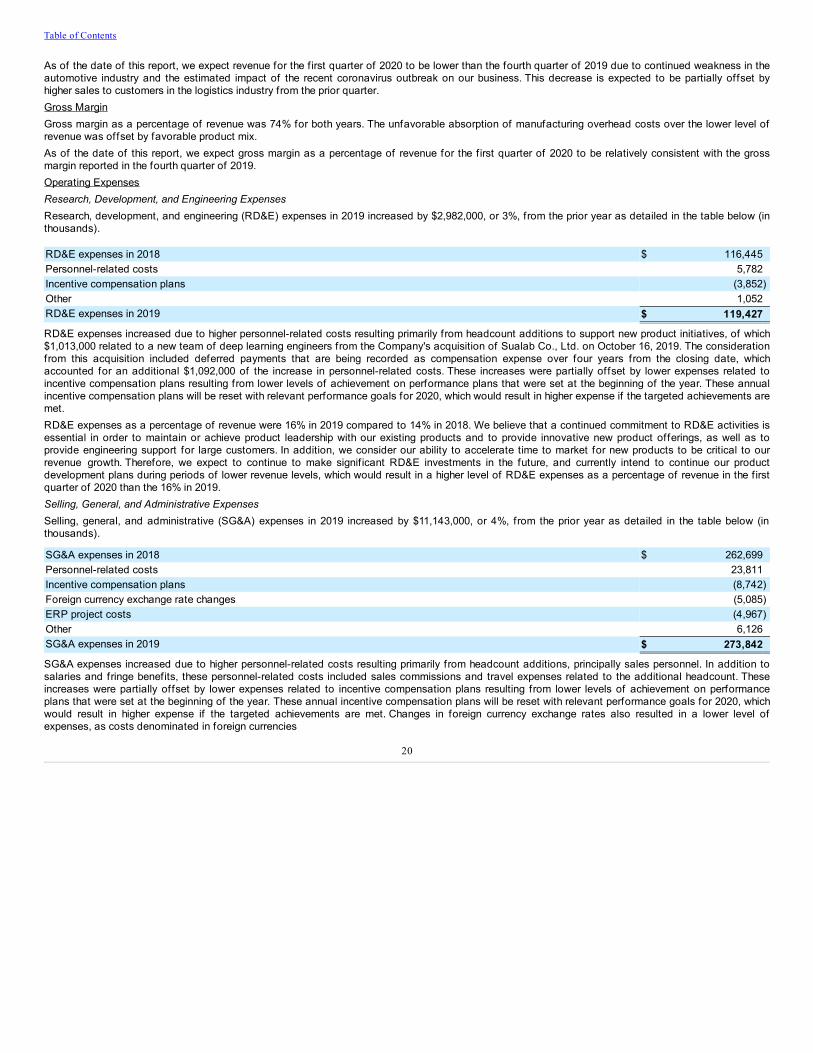
Table of Contents
As of the date of this report, we expect revenue for the f irst quarter of 2020 to be lower than the fourth quarter of 2019 due to continued weakness in theautomotive industry and the estimated impact of the recent coronavirus outbreak on our business. This decrease is expected to be partially offset byhigher sales to customers in the logistics industry from the prior quarter.Gross MarginGross margin as a percentage of revenue was 74% for both years. The unfavorable absorption of manufacturing overhead costs over the lower level ofrevenue was offset by favorable product mix.As of the date of this report, we expect gross margin as a percentage of revenue for the f irst quarter of 2020 to be relatively consistent with the grossmargin reported in the fourth quarter of 2019.Operating ExpensesResearch, Development, and Engineering ExpensesResearch, development, and engineering (RD&E) expenses in 2019 increased by $2,982,000, or 3%, from the prior year as detailed in the table below (inthousands).
RD&E expenses in 2018 $ 116,445Personnel-related costs 5,782Incentive compensation plans (3,852)Other 1,052RD&E expenses in 2019 $ 119,427
RD&E expenses increased due to higher personnel-related costs resulting primarily from headcount additions to support new product initiatives, of which$1,013,000 related to a new team of deep learning engineers from the Company's acquisition of Sualab Co., Ltd. on October 16, 2019. The considerationfrom this acquisition included deferred payments that are being recorded as compensation expense over four years from the closing date, whichaccounted for an additional $1,092,000 of the increase in personnel-related costs. These increases were partially offset by lower expenses related toincentive compensation plans resulting from lower levels of achievement on performance plans that were set at the beginning of the year. These annualincentive compensation plans will be reset with relevant performance goals for 2020, which would result in higher expense if the targeted achievements aremet.RD&E expenses as a percentage of revenue were 16% in 2019 compared to 14% in 2018. We believe that a continued commitment to RD&E activities isessential in order to maintain or achieve product leadership with our existing products and to provide innovative new product offerings, as well as toprovide engineering support for large customers. In addition, we consider our ability to accelerate time to market for new products to be critical to ourrevenue growth. Therefore, we expect to continue to make signif icant RD&E investments in the future, and currently intend to continue our productdevelopment plans during periods of lower revenue levels, which would result in a higher level of RD&E expenses as a percentage of revenue in the f irstquarter of 2020 than the 16% in 2019.Selling, General, and Administrative ExpensesSelling, general, and administrative (SG&A) expenses in 2019 increased by $11,143,000, or 4%, from the prior year as detailed in the table below (inthousands).
SG&A expenses in 2018 $ 262,699Personnel-related costs 23,811Incentive compensation plans (8,742)Foreign currency exchange rate changes (5,085)ERP project costs (4,967)Other 6,126SG&A expenses in 2019 $ 273,842
SG&A expenses increased due to higher personnel-related costs resulting primarily from headcount additions, principally sales personnel. In addition tosalaries and fringe benefits, these personnel-related costs included sales commissions and travel expenses related to the additional headcount. Theseincreases were partially offset by lower expenses related to incentive compensation plans resulting from lower levels of achievement on performanceplans that were set at the beginning of the year. These annual incentive compensation plans will be reset with relevant performance goals for 2020, whichwould result in higher expense if the targeted achievements are met. Changes in foreign currency exchange rates also resulted in a lower level ofexpenses, as costs denominated in foreign currencies
20
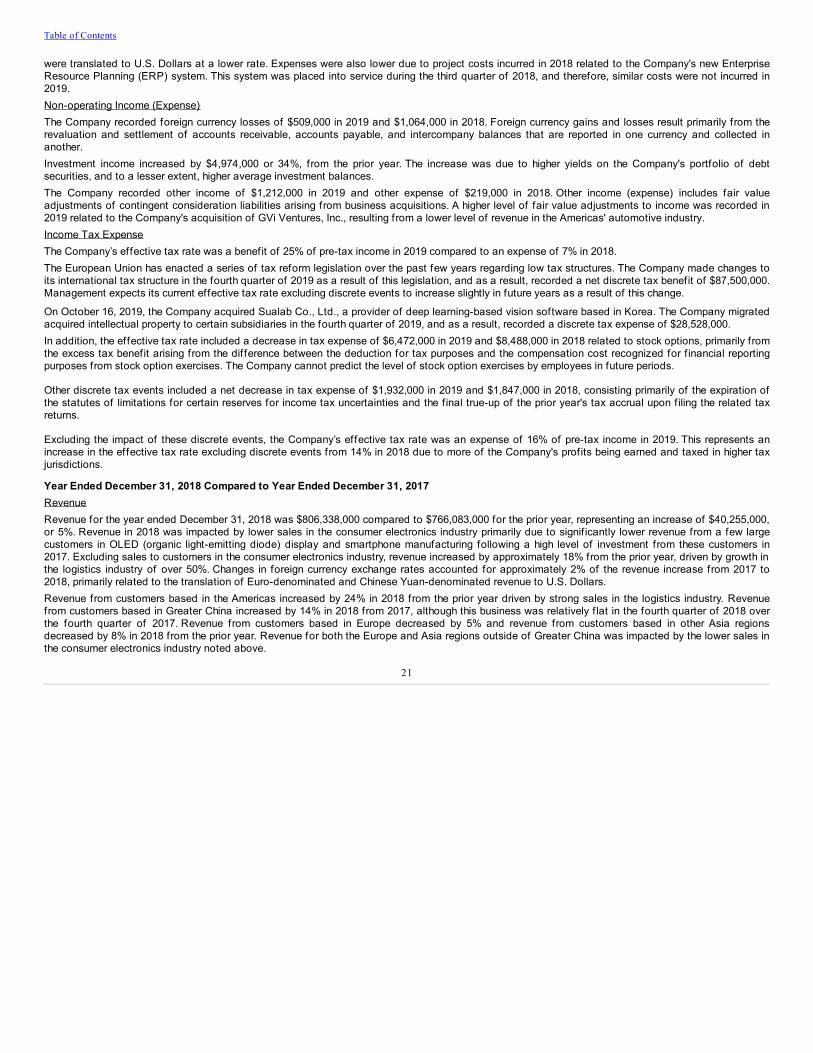
Table of Contents
were translated to U.S. Dollars at a lower rate. Expenses were also lower due to project costs incurred in 2018 related to the Company's new EnterpriseResource Planning (ERP) system. This system was placed into service during the third quarter of 2018, and therefore, similar costs were not incurred in2019.Non-operating Income (Expense)The Company recorded foreign currency losses of $509,000 in 2019 and $1,064,000 in 2018. Foreign currency gains and losses result primarily from therevaluation and settlement of accounts receivable, accounts payable, and intercompany balances that are reported in one currency and collected inanother.Investment income increased by $4,974,000 or 34%, from the prior year. The increase was due to higher yields on the Company's portfolio of debtsecurities, and to a lesser extent, higher average investment balances.The Company recorded other income of $1,212,000 in 2019 and other expense of $219,000 in 2018. Other income (expense) includes fair valueadjustments of contingent consideration liabilities arising from business acquisitions. A higher level of fair value adjustments to income was recorded in2019 related to the Company's acquisition of GVi Ventures, Inc., resulting from a lower level of revenue in the Americas' automotive industry.Income Tax ExpenseThe Company’s effective tax rate was a benefit of 25% of pre-tax income in 2019 compared to an expense of 7% in 2018.The European Union has enacted a series of tax reform legislation over the past few years regarding low tax structures. The Company made changes toits international tax structure in the fourth quarter of 2019 as a result of this legislation, and as a result, recorded a net discrete tax benefit of $87,500,000.Management expects its current effective tax rate excluding discrete events to increase slightly in future years as a result of this change.
On October 16, 2019, the Company acquired Sualab Co., Ltd., a provider of deep learning-based vision software based in Korea. The Company migratedacquired intellectual property to certain subsidiaries in the fourth quarter of 2019, and as a result, recorded a discrete tax expense of $28,528,000.In addition, the effective tax rate included a decrease in tax expense of $6,472,000 in 2019 and $8,488,000 in 2018 related to stock options, primarily fromthe excess tax benefit arising from the difference between the deduction for tax purposes and the compensation cost recognized for f inancial reportingpurposes from stock option exercises. The Company cannot predict the level of stock option exercises by employees in future periods.
Other discrete tax events included a net decrease in tax expense of $1,932,000 in 2019 and $1,847,000 in 2018, consisting primarily of the expiration ofthe statutes of limitations for certain reserves for income tax uncertainties and the f inal true-up of the prior year's tax accrual upon f iling the related taxreturns.
Excluding the impact of these discrete events, the Company’s effective tax rate was an expense of 16% of pre-tax income in 2019. This represents anincrease in the effective tax rate excluding discrete events from 14% in 2018 due to more of the Company's profits being earned and taxed in higher taxjurisdictions.
Year Ended December 31, 2018 Compared to Year Ended December 31, 2017RevenueRevenue for the year ended December 31, 2018 was $806,338,000 compared to $766,083,000 for the prior year, representing an increase of $40,255,000,or 5%. Revenue in 2018 was impacted by lower sales in the consumer electronics industry primarily due to signif icantly lower revenue from a few largecustomers in OLED (organic light-emitting diode) display and smartphone manufacturing following a high level of investment from these customers in2017. Excluding sales to customers in the consumer electronics industry, revenue increased by approximately 18% from the prior year, driven by growth inthe logistics industry of over 50%. Changes in foreign currency exchange rates accounted for approximately 2% of the revenue increase from 2017 to2018, primarily related to the translation of Euro-denominated and Chinese Yuan-denominated revenue to U.S. Dollars.Revenue from customers based in the Americas increased by 24% in 2018 from the prior year driven by strong sales in the logistics industry. Revenuefrom customers based in Greater China increased by 14% in 2018 from 2017, although this business was relatively f lat in the fourth quarter of 2018 overthe fourth quarter of 2017. Revenue from customers based in Europe decreased by 5% and revenue from customers based in other Asia regionsdecreased by 8% in 2018 from the prior year. Revenue for both the Europe and Asia regions outside of Greater China was impacted by the lower sales inthe consumer electronics industry noted above.
21
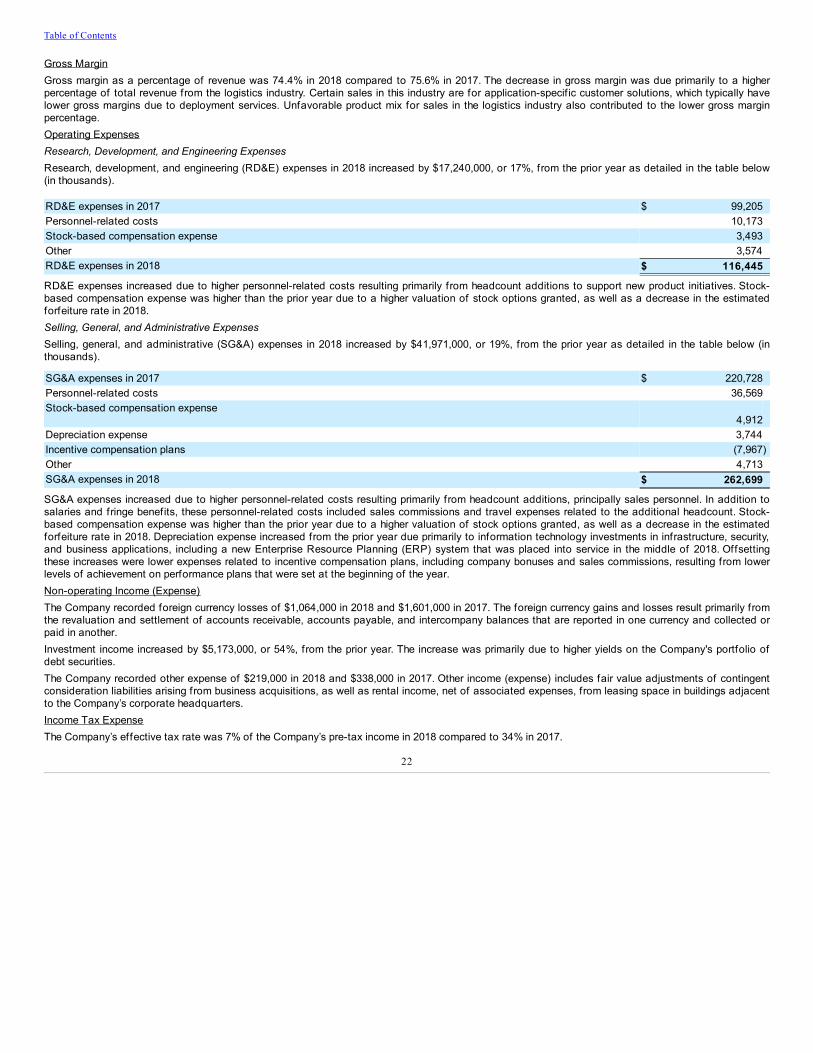
Table of Contents
Gross MarginGross margin as a percentage of revenue was 74.4% in 2018 compared to 75.6% in 2017. The decrease in gross margin was due primarily to a higherpercentage of total revenue from the logistics industry. Certain sales in this industry are for application-specif ic customer solutions, which typically havelower gross margins due to deployment services. Unfavorable product mix for sales in the logistics industry also contributed to the lower gross marginpercentage.Operating ExpensesResearch, Development, and Engineering ExpensesResearch, development, and engineering (RD&E) expenses in 2018 increased by $17,240,000, or 17%, from the prior year as detailed in the table below(in thousands).
RD&E expenses in 2017 $ 99,205Personnel-related costs 10,173Stock-based compensation expense 3,493Other 3,574RD&E expenses in 2018 $ 116,445
RD&E expenses increased due to higher personnel-related costs resulting primarily from headcount additions to support new product initiatives. Stock-based compensation expense was higher than the prior year due to a higher valuation of stock options granted, as well as a decrease in the estimatedforfeiture rate in 2018.Selling, General, and Administrative ExpensesSelling, general, and administrative (SG&A) expenses in 2018 increased by $41,971,000, or 19%, from the prior year as detailed in the table below (inthousands).
SG&A expenses in 2017 $ 220,728Personnel-related costs 36,569Stock-based compensation expense
4,912Depreciation expense 3,744Incentive compensation plans (7,967)Other 4,713SG&A expenses in 2018 $ 262,699
SG&A expenses increased due to higher personnel-related costs resulting primarily from headcount additions, principally sales personnel. In addition tosalaries and fringe benefits, these personnel-related costs included sales commissions and travel expenses related to the additional headcount. Stock-based compensation expense was higher than the prior year due to a higher valuation of stock options granted, as well as a decrease in the estimatedforfeiture rate in 2018. Depreciation expense increased from the prior year due primarily to information technology investments in infrastructure, security,and business applications, including a new Enterprise Resource Planning (ERP) system that was placed into service in the middle of 2018. Offsettingthese increases were lower expenses related to incentive compensation plans, including company bonuses and sales commissions, resulting from lowerlevels of achievement on performance plans that were set at the beginning of the year.Non-operating Income (Expense)The Company recorded foreign currency losses of $1,064,000 in 2018 and $1,601,000 in 2017. The foreign currency gains and losses result primarily fromthe revaluation and settlement of accounts receivable, accounts payable, and intercompany balances that are reported in one currency and collected orpaid in another.Investment income increased by $5,173,000, or 54%, from the prior year. The increase was primarily due to higher yields on the Company's portfolio ofdebt securities.The Company recorded other expense of $219,000 in 2018 and $338,000 in 2017. Other income (expense) includes fair value adjustments of contingentconsideration liabilities arising from business acquisitions, as well as rental income, net of associated expenses, from leasing space in buildings adjacentto the Company’s corporate headquarters.Income Tax ExpenseThe Company’s effective tax rate was 7% of the Company’s pre-tax income in 2018 compared to 34% in 2017.
22
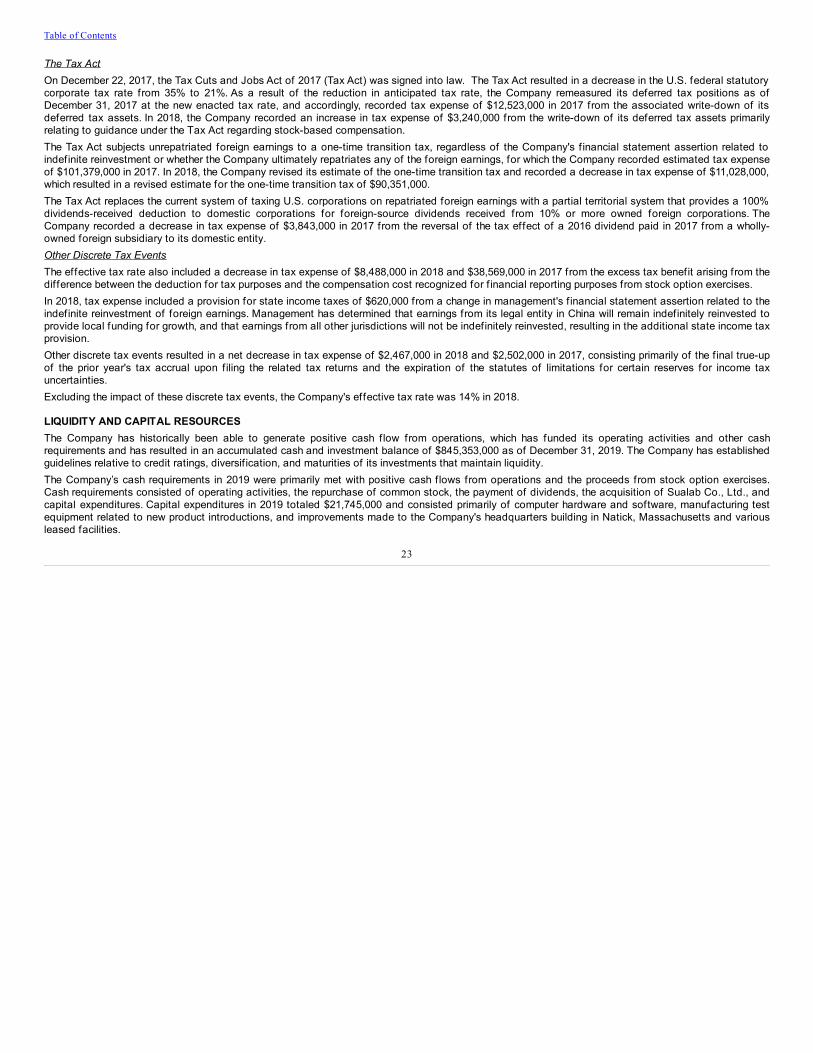
Table of Contents
The Tax ActOn December 22, 2017, the Tax Cuts and Jobs Act of 2017 (Tax Act) was signed into law. The Tax Act resulted in a decrease in the U.S. federal statutorycorporate tax rate from 35% to 21%. As a result of the reduction in anticipated tax rate, the Company remeasured its deferred tax positions as ofDecember 31, 2017 at the new enacted tax rate, and accordingly, recorded tax expense of $12,523,000 in 2017 from the associated write-down of itsdeferred tax assets. In 2018, the Company recorded an increase in tax expense of $3,240,000 from the write-down of its deferred tax assets primarilyrelating to guidance under the Tax Act regarding stock-based compensation.The Tax Act subjects unrepatriated foreign earnings to a one-time transition tax, regardless of the Company's f inancial statement assertion related toindefinite reinvestment or whether the Company ultimately repatriates any of the foreign earnings, for which the Company recorded estimated tax expenseof $101,379,000 in 2017. In 2018, the Company revised its estimate of the one-time transition tax and recorded a decrease in tax expense of $11,028,000,which resulted in a revised estimate for the one-time transition tax of $90,351,000.The Tax Act replaces the current system of taxing U.S. corporations on repatriated foreign earnings with a partial territorial system that provides a 100%dividends-received deduction to domestic corporations for foreign-source dividends received from 10% or more owned foreign corporations. TheCompany recorded a decrease in tax expense of $3,843,000 in 2017 from the reversal of the tax effect of a 2016 dividend paid in 2017 from a wholly-owned foreign subsidiary to its domestic entity.Other Discrete Tax EventsThe effective tax rate also included a decrease in tax expense of $8,488,000 in 2018 and $38,569,000 in 2017 from the excess tax benefit arising from thedifference between the deduction for tax purposes and the compensation cost recognized for f inancial reporting purposes from stock option exercises.In 2018, tax expense included a provision for state income taxes of $620,000 from a change in management's f inancial statement assertion related to theindefinite reinvestment of foreign earnings. Management has determined that earnings from its legal entity in China will remain indefinitely reinvested toprovide local funding for growth, and that earnings from all other jurisdictions will not be indefinitely reinvested, resulting in the additional state income taxprovision.Other discrete tax events resulted in a net decrease in tax expense of $2,467,000 in 2018 and $2,502,000 in 2017, consisting primarily of the f inal true-upof the prior year's tax accrual upon f iling the related tax returns and the expiration of the statutes of limitations for certain reserves for income taxuncertainties.Excluding the impact of these discrete tax events, the Company's effective tax rate was 14% in 2018.
LIQUIDITY AND CAPITAL RESOURCESThe Company has historically been able to generate positive cash f low from operations, which has funded its operating activities and other cashrequirements and has resulted in an accumulated cash and investment balance of $845,353,000 as of December 31, 2019. The Company has establishedguidelines relative to credit ratings, diversif ication, and maturities of its investments that maintain liquidity.The Company’s cash requirements in 2019 were primarily met with positive cash f lows from operations and the proceeds from stock option exercises.Cash requirements consisted of operating activities, the repurchase of common stock, the payment of dividends, the acquisition of Sualab Co., Ltd., andcapital expenditures. Capital expenditures in 2019 totaled $21,745,000 and consisted primarily of computer hardware and software, manufacturing testequipment related to new product introductions, and improvements made to the Company's headquarters building in Natick, Massachusetts and variousleased facilities.
23
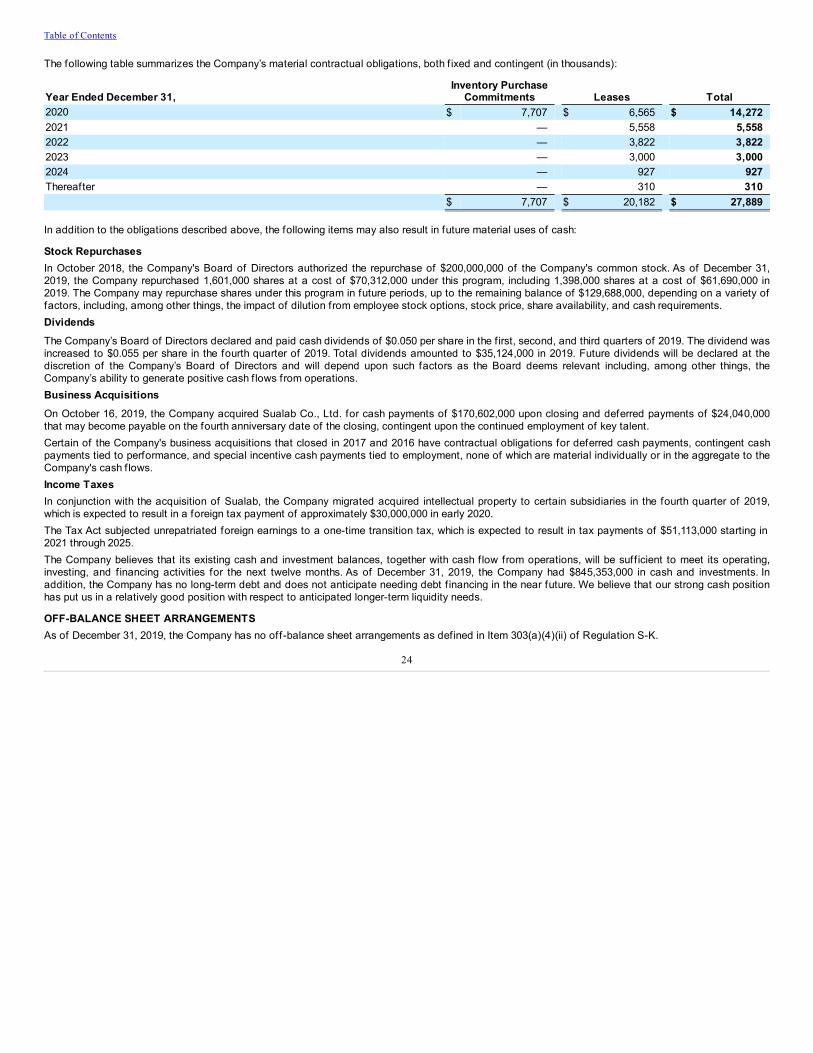
Table of Contents
The following table summarizes the Company’s material contractual obligations, both f ixed and contingent (in thousands):
Year Ended December 31,Inventory Purchase
Commitments Leases Total2020 $ 7,707 $ 6,565 $ 14,2722021 — 5,558 5,5582022 — 3,822 3,8222023 — 3,000 3,0002024 — 927 927Thereafter — 310 310 $ 7,707 $ 20,182 $ 27,889
In addition to the obligations described above, the following items may also result in future material uses of cash:
Stock RepurchasesIn October 2018, the Company's Board of Directors authorized the repurchase of $200,000,000 of the Company's common stock. As of December 31,2019, the Company repurchased 1,601,000 shares at a cost of $70,312,000 under this program, including 1,398,000 shares at a cost of $61,690,000 in2019. The Company may repurchase shares under this program in future periods, up to the remaining balance of $129,688,000, depending on a variety offactors, including, among other things, the impact of dilution from employee stock options, stock price, share availability, and cash requirements.DividendsThe Company’s Board of Directors declared and paid cash dividends of $0.050 per share in the f irst, second, and third quarters of 2019. The dividend wasincreased to $0.055 per share in the fourth quarter of 2019. Total dividends amounted to $35,124,000 in 2019. Future dividends will be declared at thediscretion of the Company’s Board of Directors and will depend upon such factors as the Board deems relevant including, among other things, theCompany’s ability to generate positive cash f lows from operations.Business AcquisitionsOn October 16, 2019, the Company acquired Sualab Co., Ltd. for cash payments of $170,602,000 upon closing and deferred payments of $24,040,000that may become payable on the fourth anniversary date of the closing, contingent upon the continued employment of key talent.Certain of the Company's business acquisitions that closed in 2017 and 2016 have contractual obligations for deferred cash payments, contingent cashpayments tied to performance, and special incentive cash payments tied to employment, none of which are material individually or in the aggregate to theCompany's cash f lows.Income TaxesIn conjunction with the acquisition of Sualab, the Company migrated acquired intellectual property to certain subsidiaries in the fourth quarter of 2019,which is expected to result in a foreign tax payment of approximately $30,000,000 in early 2020.The Tax Act subjected unrepatriated foreign earnings to a one-time transition tax, which is expected to result in tax payments of $51,113,000 starting in2021 through 2025.The Company believes that its existing cash and investment balances, together with cash f low from operations, will be suff icient to meet its operating,investing, and f inancing activities for the next twelve months. As of December 31, 2019, the Company had $845,353,000 in cash and investments. Inaddition, the Company has no long-term debt and does not anticipate needing debt f inancing in the near future. We believe that our strong cash positionhas put us in a relatively good position with respect to anticipated longer-term liquidity needs.
OFF-BALANCE SHEET ARRANGEMENTSAs of December 31, 2019, the Company has no off-balance sheet arrangements as defined in Item 303(a)(4)(ii) of Regulation S-K.
24
Table of Contents
CRITICAL ACCOUNTING POLICIES AND ESTIMATESOur discussion and analysis of the Company’s f inancial condition and results of operations are based upon the consolidated f inancial statementsincluded in this Annual Report on Form 10-K, which have been prepared in accordance with accounting principles generally accepted in the United States.The preparation of these f inancial statements requires management to make estimates and judgments that affect the reported amounts of assets,liabilities, revenue, and expenses, and related disclosure of contingent assets and liabilities. We base our estimates on historical experience and variousother assumptions believed to be reasonable under the circumstances, the results of which form the basis for making judgments about the carrying valuesof assets and liabilities that are not readily apparent from other sources. Actual results could dif fer from these estimates under dif ferent assumptions orcircumstances resulting in charges that could be material in future reporting periods. We believe the following critical accounting policies require the use ofsignif icant estimates and judgments in the preparation of our consolidated f inancial statements.Revenue RecognitionThe Company recognizes revenue in accordance with Accounting Standards Codif ication (ASC) 606, “Revenue from Contracts with Customers.” The coreprinciple of ASC 606 is to recognize revenue in a manner that depicts the transfer of promised goods or services to customers in an amount that ref lectsthe consideration to which the Company expects to be entitled in exchange for those goods or services. The framework in support of this core principleincludes: (1) identifying the contract with the customer; (2) identifying the performance obligations in the contract; (3) determining the transaction price; (4)allocating the transaction price to the performance obligations; and (5) recognizing revenue when (or as) the performance obligations are satisf ied.
Identifying the Contract with the CustomerThe Company identif ies contracts with customers as agreements that create enforceable rights and obligations, which typically take the form of customercontracts or purchase orders.
Identifying the Performance Obligations in the ContractThe Company identif ies performance obligations as promises in contracts to transfer distinct goods or services. Standard products and services that theCompany regularly sells separately are accounted for as distinct performance obligations. Application-specif ic customer solutions that are comprised of acombination of products and services are accounted for as one performance obligation to deliver a total solution to the customer. On-site supportservices that are provided to the customer after the solution is deployed are accounted for as a separate performance obligation. These solutions areprovided to customers in a variety of industries, including the consumer electronics, logistics, and automotive industries.
Shipping and handling activities for which the Company is responsible under the terms and conditions of the sale are not accounted for as performanceobligations but as fulf illment costs. These activities are required to fulf ill the Company’s promise to transfer the goods and are expensed when revenue isrecognized.
The Company does not assess whether promised goods or services are performance obligations if they are immaterial in the context of the contract. Ifrevenue is recognized before immaterial promises have been completed, then the costs related to such immaterial promises are accrued at the time ofsale.
Determining the Transaction PriceThe Company determines the transaction price as the amount of consideration it expects to receive in exchange for transferring promised goods orservices to the customer. Amounts collected from customers for sales taxes are excluded from the transaction price.
If a contract includes a variable amount, such as a rebate, then the Company estimates the transaction price using either the expected value or the mostlikely amount of consideration to be received, depending upon the specif ic facts and circumstances. The Company includes estimated variableconsideration in the transaction price only to the extent it is probable that a signif icant reversal of revenue will not occur when the uncertainty is resolved.The Company updates its estimate of variable consideration at the end of each reporting period to ref lect changes in facts and circumstances.
Allocating the Transaction Price to the Performance ObligationsThe Company allocates the transaction price to each performance obligation at contract inception based on a relative stand-alone selling price basis, orthe price at which the Company would sell the good or service separately to similar customers in similar circumstances.
25
Table of Contents
Recognizing Revenue When (or As) the Performance Obligations are SatisfiedThe Company recognizes revenue when it transfers the promised goods or services to the customer. Revenue for standard products is recognized at thepoint in time when the customer obtains control of the goods, which is typically upon delivery when the customer has legal title, physical possession, therisks and rewards of ownership, and an enforceable obligation to pay for the products. Revenue for services, which are not material, is typicallyrecognized over the time the service is provided.
Revenue for application-specif ic customer solutions is recognized at the point in time when the solution is validated, which is the point in time when theCompany can objectively determine that the agreed-upon specif ications in the contract have been met and the customer will accept the performanceobligations in the arrangement. Although the customer may have taken legal title and physical possession of the goods when they arrived at the customer’sdesignated site, the signif icant risks and rewards of ownership transfer to the customer only upon validation. Revenue for on-site support services relatedto these solutions is recognized over the time the service is provided.
In certain instances, an arrangement may include customer-specif ied acceptance provisions or performance guarantees that allow the customer to acceptor reject delivered products that do not meet the customer’s specif ications. If the Company can objectively determine that control of a good or service hasbeen transferred to the customer in accordance with the agreed-upon specif ications in the contract, then customer acceptance is a formality. Ifacceptance provisions are presumed to be substantive, then revenue is deferred until customer acceptance.
For the Company’s standard products and services, revenue recognition and billing typically occur at the same time. For application-specif ic customersolutions, however, the agreement with the customer may provide for billing terms which differ from revenue recognition criteria, resulting in either deferredrevenue or unbilled revenue. Credit assessments are performed to determine payment terms, which vary by region, industry, and customer. Prepaymentterms result in contract liabilities for customer deposits. When credit is granted to customers, payment is typically due 30 to 90 days from billing. TheCompany's contracts have an original expected duration of less than one year, and therefore as a practical expedient, the Company has elected to ignorethe impact of the time value of money on a contract and to expense sales commissions. The Company recognizes an asset for costs to fulf ill a contract ifthe costs relate directly to the contract and to future performance, and the costs are expected to be recovered.Management exercises judgment when determining the amount of revenue to be recognized each period. Such judgments include, but are not limited to,assessing the customer’s ability and intention to pay substantially all of the contract consideration when due, determining when two or more contractsshould be combined and accounted for as a single contract, determining whether a contract modif ication has occurred, assessing whether promises areimmaterial in the context of the contract, determining whether material promises in a contract represent distinct performance obligations, estimating thetransaction price for a contract that contains variable consideration, determining the stand-alone selling price of each performance obligation, determiningwhether control is transferred over time or at a point in time for performance obligations, and assessing whether formal customer acceptance provisionsare substantive.
InvestmentsAs of December 31, 2019, the Company’s investment portfolio of debt securities totaled $669,594,000. The debt securities are reported at fair value, withunrealized gains and losses, net of tax, recorded in shareholders’ equity as other comprehensive income (loss) since these securities are designated asavailable-for-sale securities. As of December 31, 2019, the Company’s portfolio of debt securities had a net unrealized gain of $2,351,000. Included in thisnet gain were gross unrealized losses totaling $65,000 of which $39,000 were in a loss position for less than twelve months and $26,000 were in a lossposition for greater than twelve months.The Company applies a three-level valuation hierarchy for fair value measurements. The categorization of assets and liabilities within the valuationhierarchy is based upon the lowest level of input that is signif icant to the measurement of fair value. Level 1 inputs to the valuation methodology utilizeunadjusted quoted market prices in active markets for identical assets and liabilities. Level 2 inputs to the valuation methodology are other observableinputs, including quoted market prices for similar assets and liabilities, quoted prices for identical and similar assets and liabilities in markets that are notactive, or other inputs that are observable or can be corroborated by observable market data. Level 3 inputs to the valuation methodology areunobservable inputs based upon management’s best estimate of the inputs that market participants would use in pricing the asset or liability at themeasurement date, including assumptions about risk. Changes in the valuation methodology, interest rates, credit rates, or the market for theseinvestments could result in changes to their fair values. Changes to the Level of an investment within the fair value hierarchy are determined at the end ofthe reporting period.The Company’s debt securities are reported at fair value based upon model-driven valuations in which all signif icant inputs are observable or can bederived from or corroborated by observable market data for substantially the full term
26
Table of Contents
of the asset, and are therefore classif ied as Level 2. Management is responsible for estimating the fair value of these f inancial assets and liabilities, andin doing so, considers valuations provided by a large, third-party pricing service. This service maintains regular contact with market makers, brokers,dealers, and analysts to gather information on market movement, direction, trends, and other specif ic data. They use this information to structure yieldcurves for various types of debt securities and arrive at the daily valuations.Management monitors the carrying value of its debt securities compared to their fair value to determine whether an other-than-temporary impairment hasoccurred. In considering whether a decline in fair value is other-than-temporary, we consider many factors, both qualitative and quantitative in nature,including the type of security, the credit rating of the security, the length of time the security has been in a loss position, the size of the loss position, ourability and intent to hold the security to expected recovery of value, and other meaningful information. If a decline in fair value is determined to be other-than-temporary, an impairment charge would be recorded in current operations to reduce the carrying value of the investment to its fair value. There wereno other-than-temporary impairments of investments in 2019, 2018, or 2017.Accounts ReceivableThe Company maintains reserves against its accounts receivable for potential credit losses. Ongoing credit evaluations of customers are performed andthe Company has historically not experienced signif icant losses related to the collection of its accounts receivable. Allowances for specif ic accountsdetermined to be at risk for collection are estimated by management taking into account the length of time the receivable has been outstanding, thecustomer’s current ability to pay its obligations to the Company, general economic and industry conditions, as well as various other factors. Globaleconomic uncertainty may result in longer payment cycles and challenges in collecting accounts receivable balances, which make these estimates morejudgmental. An adverse change in any of these factors could result in higher than expected customer defaults and may result in the need for additionalbad debt provisions. As of December 31, 2019, the Company’s reserve against accounts receivable was $1,821,000, or 2% of the gross accountsreceivable balance. A 10% difference in the reserve against accounts receivable as of December 31, 2019 would have affected net income byapproximately $153,000.InventoriesInventories are stated at the lower of cost and net realizable value. Net realizable value is the estimated selling price in the ordinary course of business,less readily predictable costs of completion, disposal, and transportation. Management estimates excess and obsolescence exposures based uponassumptions about future demand, product transitions, and market conditions, and records reserves to reduce the carrying value of inventories to their netrealizable value. Volatility in the global economy makes these assumptions about future demand more judgmental. Among the risks associated with theintroduction of new products are diff iculty predicting customer demand and effectively managing inventory levels to ensure adequate supply of the newproduct and avoid excess supply of the legacy product. In addition, we may strategically enter into non-cancelable commitments with vendors to purchasematerials for products in advance of demand to take advantage of favorable pricing or address concerns about the availability of future supplies and longlead times. As of December 31, 2019, the Company’s reserve for excess and obsolete inventory totaled $7,066,000, or 10% of the gross inventorybalance. A 10% difference in inventory reserves as of December 31, 2019 would have affected net income by approximately $595,000.LeasesThe Company accounts for leases in accordance with Accounting Standard Codif ication (ASC) 842, "Leases." The core principle of ASC 842 is that alessee should recognize on the balance sheet the assets and liabilities that arise from leases. The application of this rule requires the Company todetermine whether a contract is or contains a lease by assessing whether there is an identif ied asset and whether the contract conveys the right to controlthe use of the identif ied asset for a period of time in exchange for consideration. In the determination of the lease term, the Company considers theexistence of extension or termination options and the probability of those options being exercised.
The Company must also determine whether the lease meets the criteria for classif ication as a f inance lease by assessing whether the lease transfersownership of the underlying asset to the Company by the end of the lease term, the lease grants the Company an option to purchase the underlying assetthat the Company is reasonably certain to exercise, the lease term is for the major part of the remaining economic life of the underlying asset, the presentvalue of the sum of the lease payments and any residual value guaranteed by the Company equals or exceeds substantially all of the fair value of theunderlying asset, and the underlying asset is of such a specialized nature that it is expected to have no alternative use to the lessor at the end of the leaseterm.
27
Table of Contents
Long-lived AssetsThe Company has long-lived assets, including property, plant, and equipment and acquired intangible assets. These assets are susceptible to shortenedestimated useful lives and changes in fair value due to changes in their use, market or economic changes, or other events or circumstances. The Companyevaluates the potential impairment of these long-lived assets whenever events or circumstances indicate their carrying value may not be recoverable.Factors that could trigger an impairment review include historical or projected results that are less than the assumptions used in the original valuation ofan acquired asset, a change in the Company’s business strategy or its use of an acquired asset, or negative economic or industry trends.If an event or circumstance indicates the carrying value of long-lived assets may not be recoverable, the Company assesses the recoverability of theassets by comparing the carrying value of the assets to the sum of the undiscounted future cash f lows that the assets are expected to generate over theirremaining economic lives. If the carrying value exceeds the sum of the undiscounted future cash f lows, the Company compares the fair value of the long-lived assets to the carrying value and records an impairment loss for the difference. The Company generally estimates the fair value of its long-livedassets using the income approach based upon a discounted cash f low model. The income approach requires the use of many assumptions and estimatesincluding future revenues and expenses, discount factors, income tax rates, the identif ication of groups of assets with highly independent cash f lows, andassets’ economic lives. Volatility in the global economy makes these assumptions and estimates more judgmental. In 2017, the Company determined thatthe carrying value of the customer relationships arising from the acquisition of AQSense S.L. was impaired and reduced this value to zero, resulting in animpairment charge of $469,000. The Company did not record an impairment charge related to long-lived assets in 2019 or 2018. Actual future operatingresults and the remaining economic lives of our long-lived assets could dif fer from those used in assessing the recoverability of these assets and couldresult in an impairment of long-lived assets in future periods.Internal-use SoftwareThe accounting treatment for computer software developed for internal use depends upon the nature of activities performed at each stage ofdevelopment. The preliminary project stage includes conceptual formulation of design alternatives, determination of system requirements, vendordemonstrations, and f inal selection of vendors, and during this stage costs are expensed as incurred. The application development stage includessoftware configuration, coding, hardware installation, and testing. During this stage, certain costs are capitalized, including external direct costs ofmaterials and services, as well as payroll and payroll-related costs for employees who are directly associated with the project, while certain costs areexpensed as incurred, including training and data conversion costs. The post-implementation stage includes support and maintenance, and during thisstage costs are expensed as incurred. Capitalization begins when both the preliminary project stage is completed and management commits to fundingthe project. Capitalization ceases at the point the project is substantially complete and ready for its intended use, that is, after all substantial testing iscompleted. The application of these rules requires the use of judgment to determine when the project has reached the next stage of development, whichcosts are directly associated with the project, and when the asset is ready for its intended use.GoodwillManagement evaluates the potential impairment of goodwill annually each fourth quarter and whenever events or circumstances indicate the carryingvalue may not be recoverable. Impairment of goodwill is the condition that exists when the carrying amount of a reporting unit exceeds its fair value. TheCompany currently operates under one reporting unit which is the level at which the goodwill impairment analysis is performed. Determining the Company’sreporting units requires judgments regarding what constitutes a business and at what level discrete f inancial information is available and reviewed bymanagement.The Company performs a qualitative assessment of goodwill to determine whether further impairment testing is necessary. If this qualitative assessmentindicates that it is more likely than not that the fair value of a reporting unit is less than its carrying amount, the entity would proceed to perform aquantitative impairment test. Under this quantitative analysis, the Company compares the fair value of the reporting unit with its carrying value, includinggoodwill. If the carrying amount exceeds the fair value of the reporting unit, the Company recognizes an impairment charge. The Company estimates thefair value of its reporting unit using the income approach based upon a discounted cash f low model. In addition, the Company uses the market approach,which compares the reporting unit to publicly-traded companies and transactions involving similar businesses, to support the conclusions based upon theincome approach. The income approach requires the use of many assumptions and estimates including future revenues, expenses, capital expenditures,and working capital, as well as discount factors and income tax rates.Factors that management considered in the qualitative assessment include macroeconomic conditions, industry and market considerations, overallf inancial performance (both current and projected), changes in management or strategy,
28
Table of Contents
changes in the composition or carrying amount of net assets, and market capitalization. Based on the qualitative assessment, management does notbelieve that it is more likely than not that the carrying value of its reporting unit exceeds its fair value. No impairment losses were recorded in 2019, 2018,or 2017.Warranty ObligationsThe Company records the estimated cost of fulf illing product warranties at the time of sale based upon historical costs to fulf ill claims. Obligations mayalso be recorded subsequent to the time of sale whenever specif ic events or circumstances impacting product quality become known that would not havebeen taken into account using historical data. While we engage in extensive product quality programs and processes, including actively monitoring andevaluating the quality of our component suppliers and third-party contract manufacturers, the Company’s warranty obligation is affected by product failurerates, material usage, and service delivery costs incurred in correcting a product failure. An adverse change in any of these factors may result in the needfor additional warranty provisions. As of December 31, 2019, the Company’s accrued warranty obligations amounted to $4,713,000. A 10% difference inaccrued warranty obligations as of December 31, 2019 would have affected net income by approximately $397,000.ContingenciesEstimated losses from contingencies are accrued by management based upon whether a loss is probable and whether management has the ability toreasonably estimate the amount of the loss. Estimating potential losses, or even a range of losses, is dif f icult and involves a great deal of judgment.Management relies primarily on assessments made by its internal and external legal counsel to make the determination as to whether a loss contingencyarising from litigation should be recorded or disclosed. This analysis is performed each reporting period or when facts and circumstances dictate. Shouldthe resolution of a contingency result in a loss that we did not accrue because management did not believe that the loss was probable or capable of beingreasonably estimated, then this loss would result in a charge to income in the period the contingency was resolved. The Company did not have anysignif icant accrued contingencies as of December 31, 2019.Derivative InstrumentsIn certain instances, the Company enters into forward contracts to hedge against foreign currency f luctuations. The Company's forward contracts arereported at fair value based upon model-driven valuations in which all signif icant inputs are observable or can be derived from or corroborated byobservable market data for substantially the full term of the asset or liability, and are therefore classif ied as Level 2. The Company's forward contractsare typically traded or executed in over-the-counter markets with a relatively high degree of pricing transparency. The market participants are generallylarge commercial banks.The Company may enter into two types of hedges to manage foreign currency exchange rate risk. The f irst are economic hedges which utilize foreigncurrency forward contracts to manage the exposure to f luctuations in foreign currency exchange rates arising primarily from foreign-denominatedreceivables and payables. The gains and losses on these derivatives are intended to be offset by the changes in the fair value of the assets and liabilitiesbeing hedged. These economic hedges are not designated as effective hedges, and therefore, do not qualify for effective hedge accounting. The secondare cash f low hedges which utilize foreign currency forward contracts to protect our budgeted revenues and expenses against foreign currency exchangerate changes compared to our budgeted rates. These cash f low hedges are designated for hedge accounting, and therefore, the effective portion of theforward contract's gain or loss is reported in shareholders' equity as other comprehensive income (loss) and is reclassif ied into current operations as thehedged transaction impacts current operations. Should these hedges fail to qualify for hedge accounting or be ineffective, the gain or loss on the forwardcontract would be reported in current operations immediately as opposed to when the hedged transaction impacts current operations. This may result inmaterial foreign currency gains or losses.Stock-Based CompensationCompensation expense is recognized for all grants of stock options and restricted stock units. Determining the appropriate valuation model andestimating the fair values of these grants requires the input of subjective assumptions, including expected stock price volatility, dividend yields, expectedterm, and forfeiture rates. The expected volatility assumption is based partially upon the historical volatility of the Company’s common stock, which may ormay not be a true indicator of future volatility. The assumptions used in calculating the fair values of stock option grants represent management’s bestestimates, but these estimates involve inherent uncertainties and the application of judgment. As a result, if factors change and different assumptions areused, stock-based compensation expense could be signif icantly dif ferent from what the Company recorded in the current period.
29
Table of Contents
Income TaxesSignif icant judgment is required in determining worldwide income tax expense based upon tax laws in the various jurisdictions in which the Companyoperates. The Company has established reserves for income taxes by applying the “more likely than not” criteria, under which the recognition threshold ismet when an entity concludes that a tax position, based solely on its technical merits, is more likely than not to be sustained upon examination by therelevant tax authority. All tax positions are analyzed periodically and adjustments are made as events occur that warrant modif ication, such as thecompletion of audits or the expiration of statutes of limitations, which may result in future charges or credits to income tax expense.As part of the process of preparing consolidated f inancial statements, management is required to estimate income taxes in each of the jurisdictions inwhich the Company operates. This process involves estimating the current tax liability, as well as assessing temporary dif ferences arising from thedifferent treatment of items for f inancial statement and tax purposes. These differences result in deferred tax assets and liabilities, which are recorded onthe Consolidated Balance Sheets.The Tax Act imposed a minimum tax on foreign earnings related to intangible assets, known as the Global Intangible Low-Taxed Income (GILTI) tax. Inthe fourth quarter of 2019, the Company elected to account for the impact of the GILTI minimum tax in deferred taxes, a change from the Company’sinitial election made in the third quarter of 2018 whereby the GILTI minimum tax was included in income tax expense as incurred on an annual basis.Management has determined that this change is considered preferable, based upon the conclusion that it appropriately matches the Company’s currentand deferred income tax implications related to the change in tax structure noted below.In the fourth quarter of 2019, the Company made changes to its international tax structure as a result of tax reform legislation enacted by the EuropeanUnion that resulted in an intercompany sale of intellectual property based upon the fair value of this intellectual property. Also in the fourth quarter of2019, in connection with the acquisition of Sualab Co. Ltd., the Company migrated acquired intellectual property to certain subsidiaries to align with itscorporate tax structure. Signif icant judgment was required to estimate the fair value of the migrated intellectual property, including management estimatesrelated to forecasted future cash f lows and discount rates.Business AcquisitionsBusiness combinations are accounted for under the acquisition method of accounting. Determining what constitutes a business to qualify as a businesscombination requires some judgment. Allocating the purchase price requires the Company to identify and estimate the fair values of various assetsacquired and liabilities assumed. Management is responsible for determining the appropriate valuation model and estimated fair values, and in doing so,considers a number of factors, including information provided by an outside valuation advisor. Management primarily establishes fair value using theincome approach based upon a discounted cash f low model. The income approach requires the use of many assumptions and estimates including futurerevenues and expenses, as well as discount factors. Contingent consideration liabilities are reported at their estimated fair values based upon probability-adjusted present values of the consideration expected to be paid, using signif icant inputs and estimates. Key assumptions used in these estimates includeprobability assessments with respect to the likelihood of achieving certain milestones and discount rates consistent with the level of risk of achievement.The fair value of these contingent consideration liabilities are remeasured each reporting period, with changes in the fair value recorded in "Other income(expense)" on the Consolidated Statement of Operations. The remeasured liability amount could be signif icantly dif ferent from the amount at theacquisition date, resulting in material charges or credits in future reporting periods.
NEW PRONOUNCEMENTSRefer to Part II, Item 8 - Note 2 within this Form 10-K, for a full description of recently issued accounting pronouncements including the expected dates ofadoption and expected impact on the f inancial position and results of operations of the Company.
ITEM 7A: QUANTITATIVE AND QUALITATIVE DISCLOSURES ABOUT MARKET RISKThe Company is exposed to certain risks relating to its ongoing business operations, including foreign currency exchange rate risk and interest rate risk.The Company currently mitigates certain foreign currency exchange rate risks with derivative instruments. The Company does not currently manage itsinterest rate risk with derivative instruments.
30
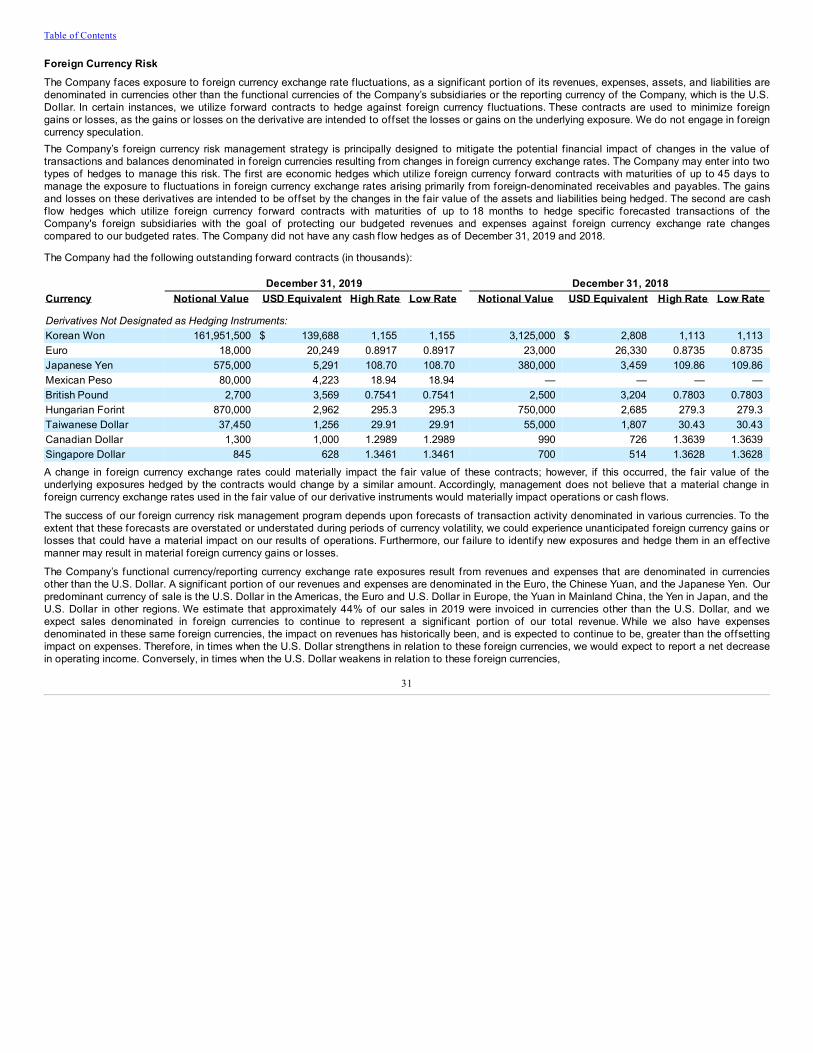
Table of Contents
Foreign Currency RiskThe Company faces exposure to foreign currency exchange rate f luctuations, as a signif icant portion of its revenues, expenses, assets, and liabilities aredenominated in currencies other than the functional currencies of the Company’s subsidiaries or the reporting currency of the Company, which is the U.S.Dollar. In certain instances, we utilize forward contracts to hedge against foreign currency f luctuations. These contracts are used to minimize foreigngains or losses, as the gains or losses on the derivative are intended to offset the losses or gains on the underlying exposure. We do not engage in foreigncurrency speculation.The Company’s foreign currency risk management strategy is principally designed to mitigate the potential f inancial impact of changes in the value oftransactions and balances denominated in foreign currencies resulting from changes in foreign currency exchange rates. The Company may enter into twotypes of hedges to manage this risk. The f irst are economic hedges which utilize foreign currency forward contracts with maturities of up to 45 days tomanage the exposure to f luctuations in foreign currency exchange rates arising primarily from foreign-denominated receivables and payables. The gainsand losses on these derivatives are intended to be offset by the changes in the fair value of the assets and liabilities being hedged. The second are cashflow hedges which utilize foreign currency forward contracts with maturities of up to 18 months to hedge specif ic forecasted transactions of theCompany's foreign subsidiaries with the goal of protecting our budgeted revenues and expenses against foreign currency exchange rate changescompared to our budgeted rates. The Company did not have any cash f low hedges as of December 31, 2019 and 2018.
The Company had the following outstanding forward contracts (in thousands):
December 31, 2019 December 31, 2018Currency Notional Value USD Equivalent High Rate Low Rate Notional Value USD Equivalent High Rate Low Rate Derivatives Not Designated as Hedging Instruments: Korean Won 161,951,500 $ 139,688 1,155 1,155 3,125,000 $ 2,808 1,113 1,113Euro 18,000 20,249 0.8917 0.8917 23,000 26,330 0.8735 0.8735Japanese Yen 575,000 5,291 108.70 108.70 380,000 3,459 109.86 109.86Mexican Peso 80,000 4,223 18.94 18.94 — — — —British Pound 2,700 3,569 0.7541 0.7541 2,500 3,204 0.7803 0.7803Hungarian Forint 870,000 2,962 295.3 295.3 750,000 2,685 279.3 279.3Taiwanese Dollar 37,450 1,256 29.91 29.91 55,000 1,807 30.43 30.43Canadian Dollar 1,300 1,000 1.2989 1.2989 990 726 1.3639 1.3639Singapore Dollar 845 628 1.3461 1.3461 700 514 1.3628 1.3628A change in foreign currency exchange rates could materially impact the fair value of these contracts; however, if this occurred, the fair value of theunderlying exposures hedged by the contracts would change by a similar amount. Accordingly, management does not believe that a material change inforeign currency exchange rates used in the fair value of our derivative instruments would materially impact operations or cash f lows.
The success of our foreign currency risk management program depends upon forecasts of transaction activity denominated in various currencies. To theextent that these forecasts are overstated or understated during periods of currency volatility, we could experience unanticipated foreign currency gains orlosses that could have a material impact on our results of operations. Furthermore, our failure to identify new exposures and hedge them in an effectivemanner may result in material foreign currency gains or losses.
The Company’s functional currency/reporting currency exchange rate exposures result from revenues and expenses that are denominated in currenciesother than the U.S. Dollar. A signif icant portion of our revenues and expenses are denominated in the Euro, the Chinese Yuan, and the Japanese Yen. Ourpredominant currency of sale is the U.S. Dollar in the Americas, the Euro and U.S. Dollar in Europe, the Yuan in Mainland China, the Yen in Japan, and theU.S. Dollar in other regions. We estimate that approximately 44% of our sales in 2019 were invoiced in currencies other than the U.S. Dollar, and weexpect sales denominated in foreign currencies to continue to represent a signif icant portion of our total revenue. While we also have expensesdenominated in these same foreign currencies, the impact on revenues has historically been, and is expected to continue to be, greater than the offsettingimpact on expenses. Therefore, in times when the U.S. Dollar strengthens in relation to these foreign currencies, we would expect to report a net decreasein operating income. Conversely, in times when the U.S. Dollar weakens in relation to these foreign currencies,
31
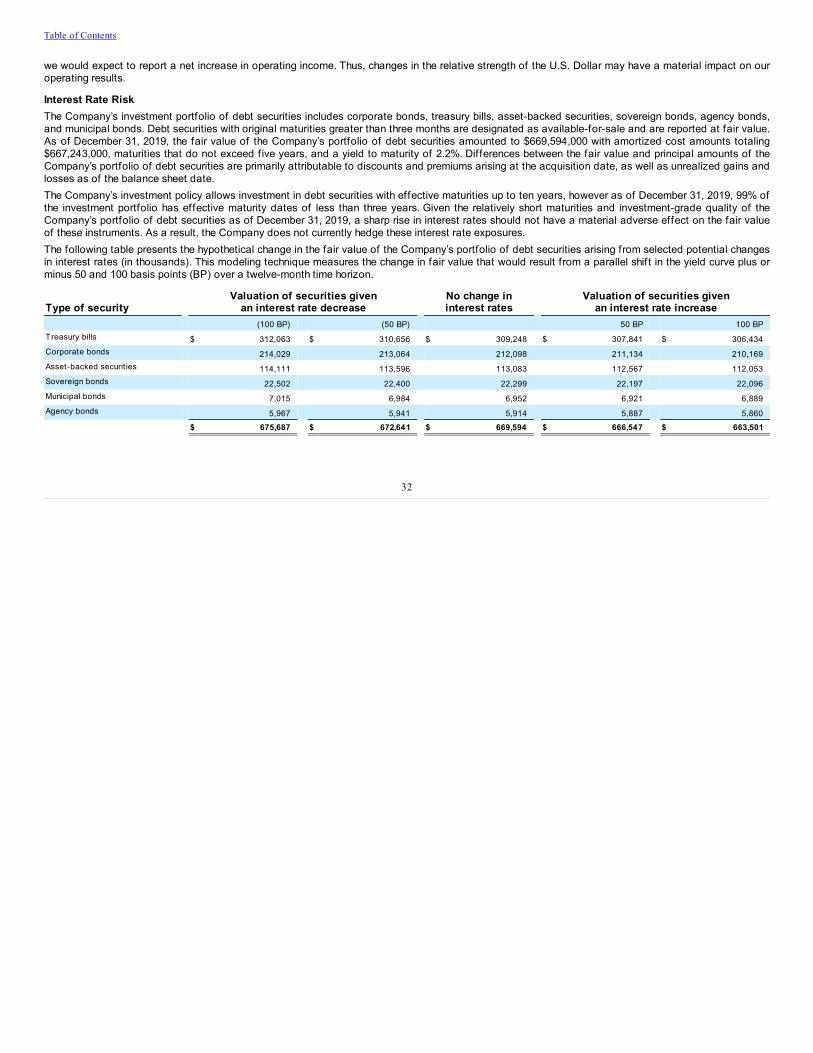
Table of Contents
we would expect to report a net increase in operating income. Thus, changes in the relative strength of the U.S. Dollar may have a material impact on ouroperating results.
Interest Rate RiskThe Company’s investment portfolio of debt securities includes corporate bonds, treasury bills, asset-backed securities, sovereign bonds, agency bonds,and municipal bonds. Debt securities with original maturities greater than three months are designated as available-for-sale and are reported at fair value.As of December 31, 2019, the fair value of the Company’s portfolio of debt securities amounted to $669,594,000 with amortized cost amounts totaling$667,243,000, maturities that do not exceed f ive years, and a yield to maturity of 2.2%. Differences between the fair value and principal amounts of theCompany’s portfolio of debt securities are primarily attributable to discounts and premiums arising at the acquisition date, as well as unrealized gains andlosses as of the balance sheet date.The Company’s investment policy allows investment in debt securities with effective maturities up to ten years, however as of December 31, 2019, 99% ofthe investment portfolio has effective maturity dates of less than three years. Given the relatively short maturities and investment-grade quality of theCompany’s portfolio of debt securities as of December 31, 2019, a sharp rise in interest rates should not have a material adverse effect on the fair valueof these instruments. As a result, the Company does not currently hedge these interest rate exposures.The following table presents the hypothetical change in the fair value of the Company’s portfolio of debt securities arising from selected potential changesin interest rates (in thousands). This modeling technique measures the change in fair value that would result from a parallel shift in the yield curve plus orminus 50 and 100 basis points (BP) over a twelve-month time horizon.
Type of security Valuation of securities given
an interest rate decrease No change ininterest rates
Valuation of securities givenan interest rate increase
(100 BP) (50 BP) 50 BP 100 BPTreasury bills $ 312,063 $ 310,656 $ 309,248 $ 307,841 $ 306,434Corporate bonds 214,029 213,064 212,098 211,134 210,169Asset-backed securities 114,111 113,596 113,083 112,567 112,053Sovereign bonds 22,502 22,400 22,299 22,197 22,096Municipal bonds 7,015 6,984 6,952 6,921 6,889Agency bonds 5,967 5,941 5,914 5,887 5,860
$ 675,687 $ 672,641 $ 669,594 $ 666,547 $ 663,501
32
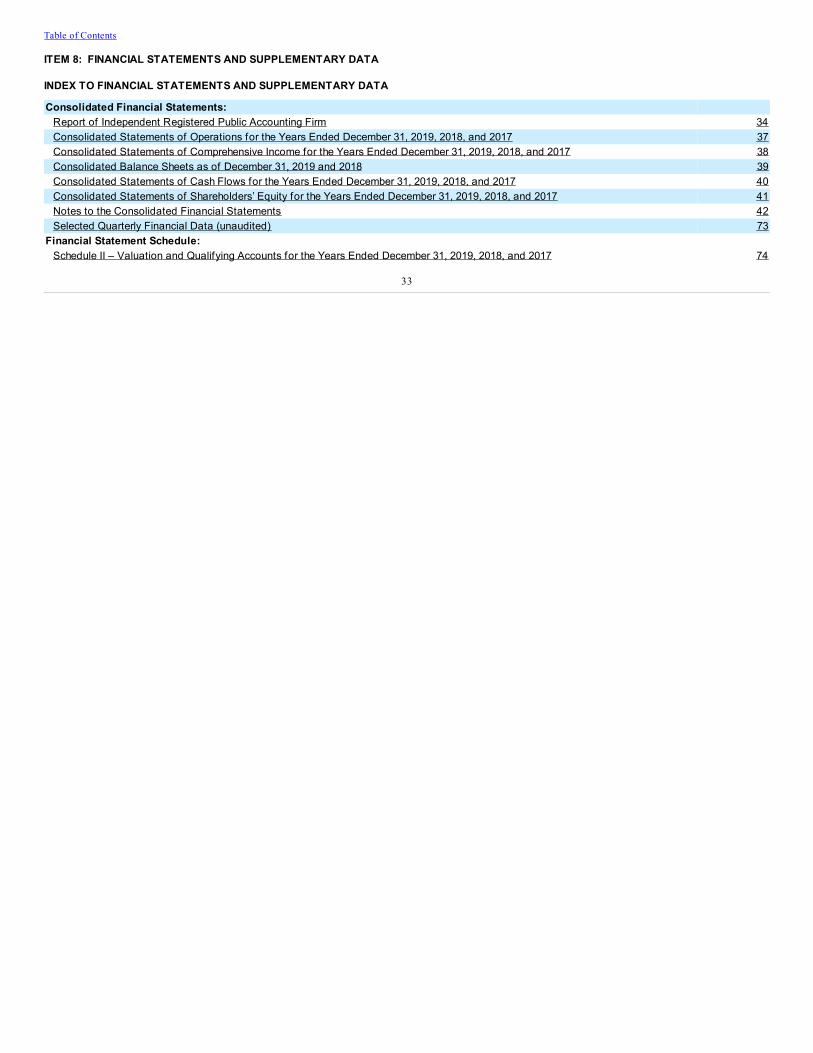
Table of Contents
ITEM 8: FINANCIAL STATEMENTS AND SUPPLEMENTARY DATA
INDEX TO FINANCIAL STATEMENTS AND SUPPLEMENTARY DATA
Consolidated Financial Statements: Report of Independent Registered Public Accounting Firm 34Consolidated Statements of Operations for the Years Ended December 31, 2019, 2018, and 2017 37Consolidated Statements of Comprehensive Income for the Years Ended December 31, 2019, 2018, and 2017 38Consolidated Balance Sheets as of December 31, 2019 and 2018 39Consolidated Statements of Cash Flows for the Years Ended December 31, 2019, 2018, and 2017 40Consolidated Statements of Shareholders’ Equity for the Years Ended December 31, 2019, 2018, and 2017 41Notes to the Consolidated Financial Statements 42Selected Quarterly Financial Data (unaudited) 73
Financial Statement Schedule: Schedule II – Valuation and Qualifying Accounts for the Years Ended December 31, 2019, 2018, and 2017 74
33
Table of Contents
REPORT OF INDEPENDENT REGISTERED PUBLIC ACCOUNTING FIRM
Board of Directors and ShareholdersCognex Corporation
Opinion on the f inancial statementsWe have audited the accompanying consolidated balance sheets of Cognex Corporation (a Massachusetts corporation) and subsidiaries (the “Company”)as of December 31, 2019 and 2018, the related consolidated statements of operations, comprehensive income, shareholders’ equity, and cash f lows foreach of the three years in the period ended December 31, 2019, and the related notes and f inancial statement schedule included under Item 15(2)(collectively referred to as the “f inancial statements”). In our opinion, the f inancial statements present fairly, in all material respects, the f inancial positionof the Company as of December 31, 2019 and 2018, and the results of its operations and its cash f lows for each of the three years in the period endedDecember 31, 2019, in conformity with accounting principles generally accepted in the United States of America.We also have audited, in accordance with the standards of the Public Company Accounting Oversight Board (United States) (“PCAOB”), the Company’sinternal control over f inancial reporting as of December 31, 2019, based on criteria established in the 2013 Internal Control-Integrated Framework issued bythe Committee of Sponsoring Organizations of the Treadway Commission (“COSO”), and our report dated February 13, 2020 expressed an unqualif iedopinion.
Basis for opinionThese f inancial statements are the responsibility of the Company’s management. Our responsibility is to express an opinion on the Company’s f inancialstatements based on our audits. We are a public accounting f irm registered with the PCAOB and are required to be independent with respect to theCompany in accordance with the U.S. federal securities laws and the applicable rules and regulations of the Securities and Exchange Commission and thePCAOB.We conducted our audits in accordance with the standards of the PCAOB. Those standards require that we plan and perform the audit to obtainreasonable assurance about whether the f inancial statements are free of material misstatement, whether due to error or fraud. Our audits includedperforming procedures to assess the risks of material misstatement of the f inancial statements, whether due to error or fraud, and performing proceduresthat respond to those risks. Such procedures included examining, on a test basis, evidence supporting the amounts and disclosures in the f inancialstatements. Our audits also included evaluating the accounting principles used and signif icant estimates made by management, as well as evaluating theoverall presentation of the f inancial statements. We believe that our audits provide a reasonable basis for our opinion.
Critical audit mattersThe critical audit matters communicated below are matters arising from the current period audit of the f inancial statements that were communicated orrequired to be communicated to the audit committee and that: (1) relate to accounts or disclosures that are material to the f inancial statements and (2)involved our especially challenging, subjective, or complex judgments. The communication of critical audit matters does not alter in any way our opinionon the f inancial statements, taken as a whole, and we are not, by communicating the critical audit matters below, providing separate opinions on thecritical audit matters or on the accounts or disclosures to which they relate.Revenue recognition - Application-Specific Customer SolutionsAs described further in Notes 1 and 14 to the consolidated f inancial statements, the Company recognizes revenue from application-specif ic customersolutions. For these transactions, revenue is recognized at the point in time control is transferred to the customer, which is when the solution is validated,and the Company can objectively determine that the agreed-upon specif ications in the contract have been met and the customer will accept theperformance obligation in the contract. We identif ied revenue recognition related to application-specif ic customer solutions as a critical audit matter.The principal considerations for our determination that application-specif ic customer solutions revenue is a critical audit matter are that determining thetiming of validation and that the agreed-upon specif ications in the contract have been met relies on the use of management estimates and requires ahigher degree of auditor subjectivity and judgment in designing and executing audit procedures. Accounting for application-specif ic customer solutionsrequires the Company to monitor and evaluate customer contracts on an ongoing basis to determine the point in time at which the agreed-uponspecif ications in the contract have been met.
34
Table of Contents
Our audit procedures related to the revenue recognition of application-specif ic customer solutions included the following, among others.• We tested the design and operating effectiveness of internal controls related to the monitoring of application-specif ic customer solutions and the
determination of the timing of revenue recognition.• We evaluated management’s signif icant accounting policies related to these customer contracts for appropriate revenue recognition based on key
terms and provisions.• For a sample of transactions, we inspected source documents, including the customer contract or purchase order, third-party shipping information,
invoice, and relevant communications.Income Taxes - Fair Value of Intellectual Property and Change in Accounting Policy for Global Intangible Low-Taxed Income (GILTI)As described further in Notes 1 and 18 to the consolidated f inancial statements, effective December 31, 2019, the Company executed an intercompanysale of intellectual property that resulted in the establishment of a deferred tax asset and an income tax benefit in Ireland based on the fair value of theintellectual property. From a United States tax perspective the sale is disregarded and any future tax deduction in Ireland will not be regarded whendetermining Global Intangible Low-Taxed Income (GILTI). The Company determined that changing their accounting policy to recognize deferred taxassets and liabilities for basis dif ferences that are expected to affect the amount of GILTI inclusion upon reversal is preferable. As a result of this changein accounting policy, the Company recorded a deferred tax liability and corresponding deferred income tax expense representing the future GILTI taximplications related to the fair value of intellectual property transferred to Ireland. We identif ied the Company’s determination of the fair value of theintellectual property sold and related change in accounting policy as a critical audit matter.The principal considerations for our determination that the sale of intellectual property and change in accounting policy is a critical audit matter are thatthe determination of the fair value of the intellectual property relies on the use of management estimates related to forecasted future cash f lows anddiscount rates. This requires management to evaluate historical results and expectations of future operating performance based on relevant informationavailable to them regarding expectations of industry performance, as well as, expectations for company-specif ic performance. Determining the discountrate requires management to evaluate the appropriate risk premium based on their judgment of industry and company-specif ic risks. Signif icantmanagement judgments and estimates utilized to determine the fair value are subject to estimation uncertainty and require signif icant auditor subjectivityin evaluating the reasonableness of those judgments and estimates. In addition, changing the Company’s accounting policy requires management to makea judgment as to the preferability of the accounting policy in relation to the f inancial statements taken as a whole.Our audit procedures related to this critical audit matter included the following, among others.
• We tested the design and operating effectiveness of internal controls related to management’s determination of the fair value of the Company’sintellectual property, including controls over the determination of key inputs related to forecasting of future cash f lows and determination of thediscount rate.
• We evaluated management’s historical ability to achieve forecasted revenue and operating results.• We compared management’s forecasts of future revenue and operating results to third-party industry projections and historical operating results.• We performed sensitivity analysis on the Company’s future cash f lows and discount rate to evaluate the reasonableness of management’s
forecasts.• We utilized a valuation specialist to assist in testing the Company’s discounted cash f low model and in evaluating the reasonableness of
signif icant assumptions to the model, including the discount rate.• We consulted with our national off ice and utilized individuals with specialized skill and knowledge in income tax accounting in evaluating the
preferability of the change in accounting policy.Business Combinations - Acquisition of Sualab Co., Ltd.As described further in notes 1 and 21 to the consolidated f inancial statements, on October 16, 2019, the Company acquired Sualab Co., Ltd. Inaccordance with ASC 805, Business Combinations, the Company allocated the purchase price to the identif iable assets acquired based on their fairvalues. We identif ied the Company’s determination of the fair value of the identif iable intangible assets acquired as a critical audit matter.
35
Table of Contents
The principal considerations for our determination that the fair value of identif iable intangible assets acquired is a critical audit matter are that thedetermination of the fair value of the intangible assets relies on the use of management estimates related to forecasted future cash f lows and discountrates. This requires management to evaluate historical results and expectations of future operating performance based on relevant information availableto them regarding expectations of industry performance, as well as, expectations for company-specif ic performance. Determining the discount raterequires management to evaluate the appropriate risk premium based on their judgment of industry and company-specif ic risks. Signif icant managementjudgments and estimates utilized to determine the fair value are subject to estimation uncertainty and require signif icant auditor subjectivity in evaluatingthe reasonableness of those judgments and estimates.Our audit procedures related to the determination of the fair value of acquired intangible assets included the following, among others.
• We tested the design and operating effectiveness of internal controls relating to management’s determination of the fair value of the acquiredidentif iable intangible assets, including controls over the determination of key inputs related to forecasting of future cash f lows and determinationof the discount rate.
• We evaluated management’s historical ability to achieve forecasted revenue and operating results.• We compared management’s forecasts of future revenue and operating margin to third-party industry projections and historical operating results.• We performed sensitivity analysis on the Company’s future cash f lows and discount rate to evaluate the reasonableness of management’s
forecasts.• We utilized a valuation specialist to assist in testing the Company’s discounted cash f low model and in evaluating the reasonableness of
signif icant assumptions to the model, including the discount rate.
/s/ GRANT THORNTON LLP
We have served as the Company’s auditor since 2007.
Boston, MassachusettsFebruary 13, 2020
36
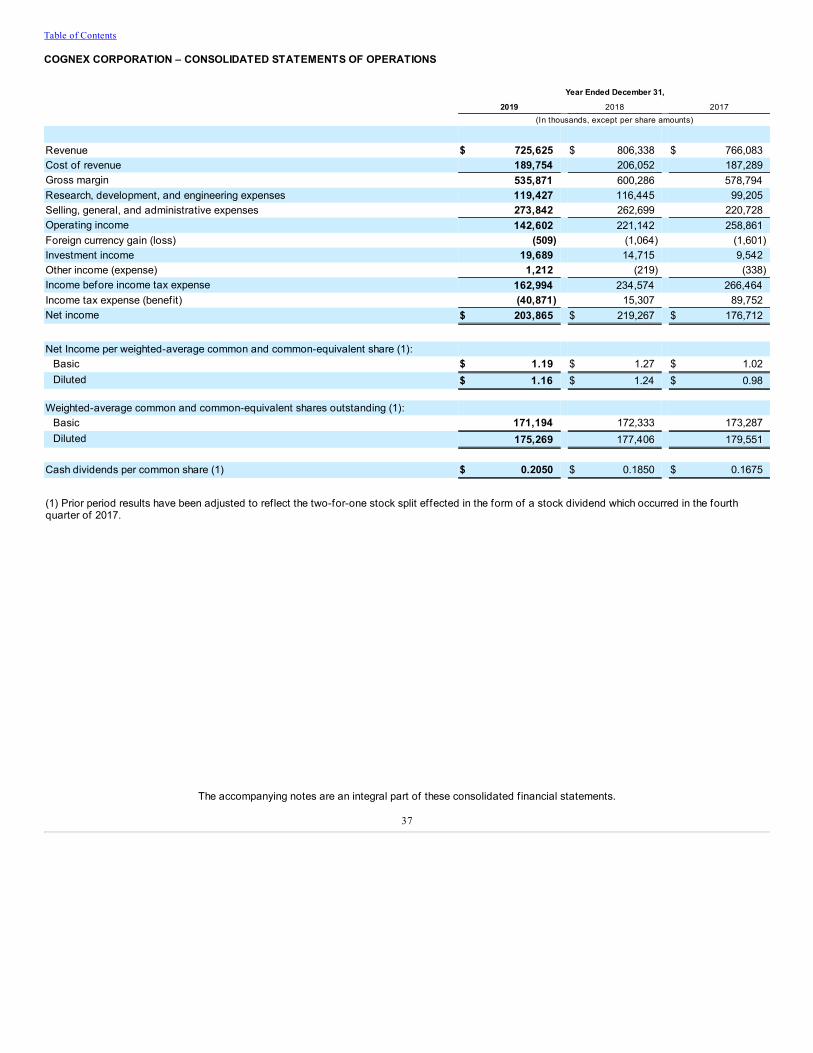
Table of Contents
COGNEX CORPORATION – CONSOLIDATED STATEMENTS OF OPERATIONS
Year Ended December 31, 2019 2018 2017 (In thousands, except per share amounts)
Revenue $ 725,625 $ 806,338 $ 766,083Cost of revenue 189,754 206,052 187,289Gross margin 535,871 600,286 578,794Research, development, and engineering expenses 119,427 116,445 99,205Selling, general, and administrative expenses 273,842 262,699 220,728Operating income 142,602 221,142 258,861Foreign currency gain (loss) (509) (1,064) (1,601)Investment income 19,689 14,715 9,542Other income (expense) 1,212 (219) (338)Income before income tax expense 162,994 234,574 266,464Income tax expense (benefit) (40,871) 15,307 89,752Net income $ 203,865 $ 219,267 $ 176,712 Net Income per weighted-average common and common-equivalent share (1):
Basic $ 1.19 $ 1.27 $ 1.02Diluted $ 1.16 $ 1.24 $ 0.98
Weighted-average common and common-equivalent shares outstanding (1):
Basic 171,194 172,333 173,287Diluted 175,269 177,406 179,551
Cash dividends per common share (1) $ 0.2050 $ 0.1850 $ 0.1675 (1) Prior period results have been adjusted to ref lect the two-for-one stock split effected in the form of a stock dividend which occurred in the fourthquarter of 2017.
The accompanying notes are an integral part of these consolidated f inancial statements.
37
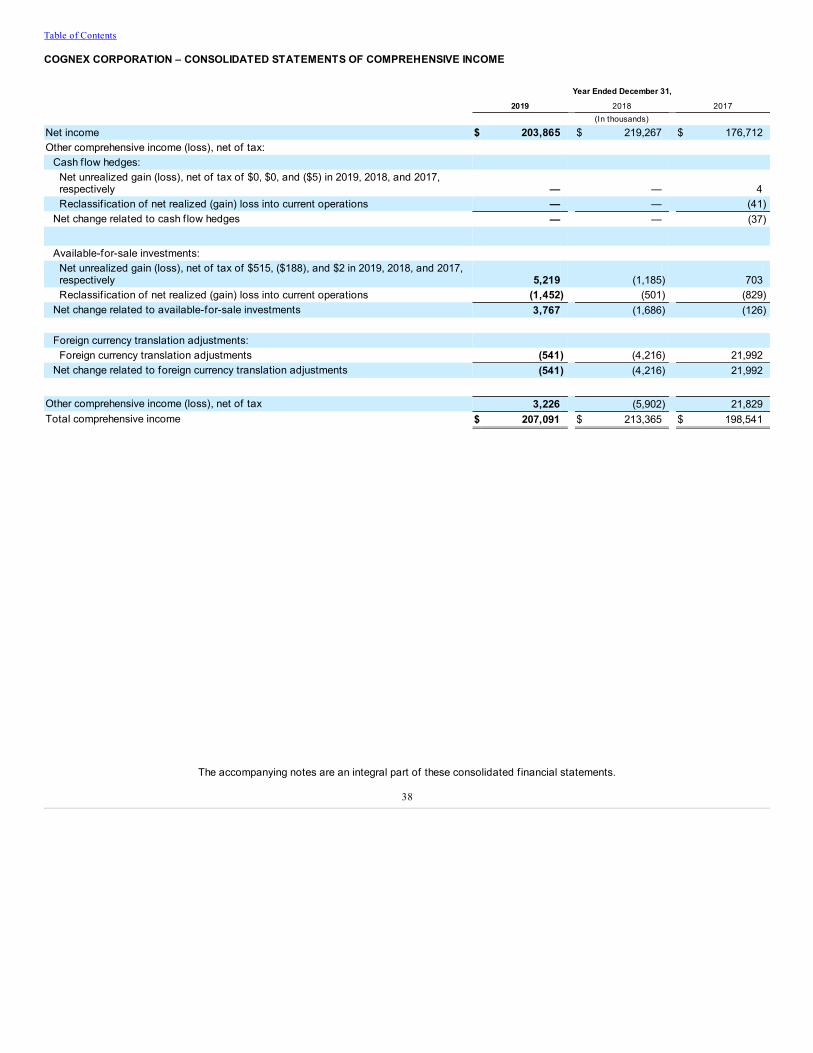
Table of Contents
COGNEX CORPORATION – CONSOLIDATED STATEMENTS OF COMPREHENSIVE INCOME
Year Ended December 31, 2019 2018 2017 (In thousands)
Net income $ 203,865 $ 219,267 $ 176,712Other comprehensive income (loss), net of tax:
Cash f low hedges: Net unrealized gain (loss), net of tax of $0, $0, and ($5) in 2019, 2018, and 2017,respectively — — 4Reclassif ication of net realized (gain) loss into current operations — — (41)
Net change related to cash f low hedges — — (37)
Available-for-sale investments: Net unrealized gain (loss), net of tax of $515, ($188), and $2 in 2019, 2018, and 2017,respectively 5,219 (1,185) 703Reclassif ication of net realized (gain) loss into current operations (1,452) (501) (829)
Net change related to available-for-sale investments 3,767 (1,686) (126)
Foreign currency translation adjustments: Foreign currency translation adjustments (541) (4,216) 21,992
Net change related to foreign currency translation adjustments (541) (4,216) 21,992
Other comprehensive income (loss), net of tax 3,226 (5,902) 21,829Total comprehensive income $ 207,091 $ 213,365 $ 198,541
The accompanying notes are an integral part of these consolidated f inancial statements.
38
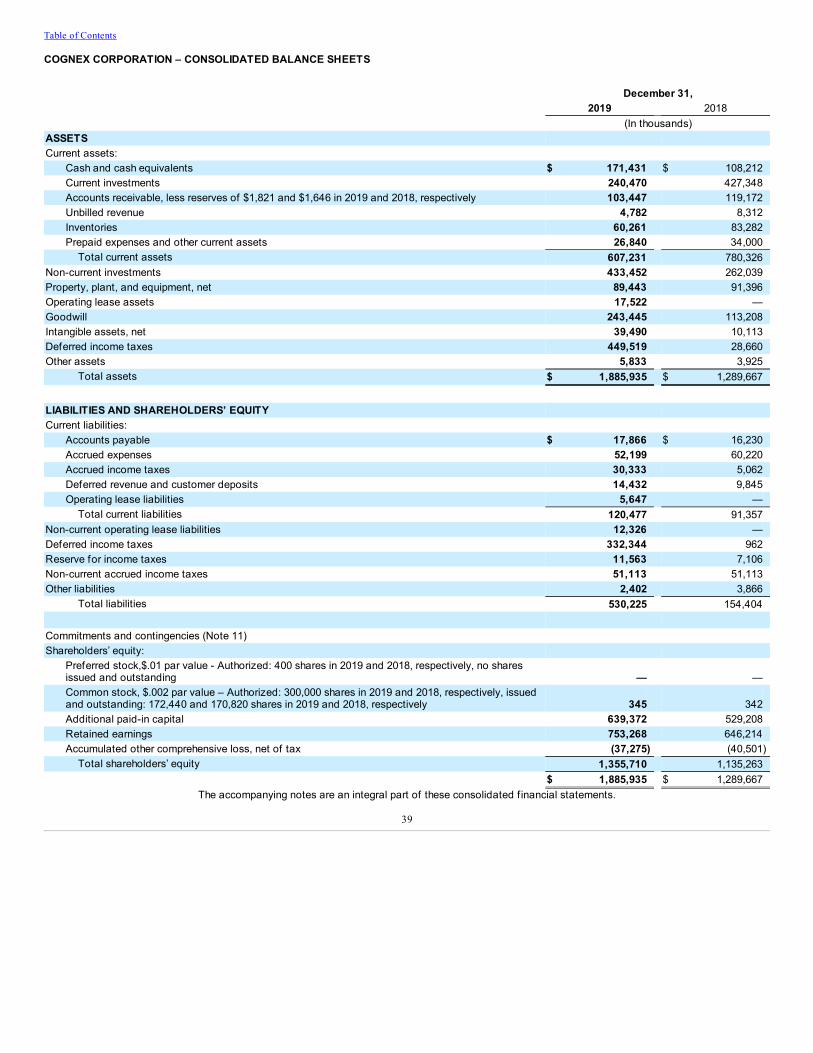
Table of Contents
COGNEX CORPORATION – CONSOLIDATED BALANCE SHEETS
December 31, 2019 2018 (In thousands)ASSETS Current assets:
Cash and cash equivalents $ 171,431 $ 108,212Current investments 240,470 427,348Accounts receivable, less reserves of $1,821 and $1,646 in 2019 and 2018, respectively 103,447 119,172Unbilled revenue 4,782 8,312Inventories 60,261 83,282Prepaid expenses and other current assets 26,840 34,000
Total current assets 607,231 780,326Non-current investments 433,452 262,039Property, plant, and equipment, net 89,443 91,396Operating lease assets 17,522 —Goodwill 243,445 113,208Intangible assets, net 39,490 10,113Deferred income taxes 449,519 28,660Other assets 5,833 3,925
Total assets $ 1,885,935 $ 1,289,667 LIABILITIES AND SHAREHOLDERS’ EQUITY Current liabilities:
Accounts payable $ 17,866 $ 16,230Accrued expenses 52,199 60,220Accrued income taxes 30,333 5,062Deferred revenue and customer deposits 14,432 9,845Operating lease liabilities 5,647 —
Total current liabilities 120,477 91,357Non-current operating lease liabilities 12,326 —Deferred income taxes 332,344 962Reserve for income taxes 11,563 7,106Non-current accrued income taxes 51,113 51,113Other liabilities 2,402 3,866
Total liabilities 530,225 154,404 Commitments and contingencies (Note 11) Shareholders’ equity:
Preferred stock,$.01 par value - Authorized: 400 shares in 2019 and 2018, respectively, no sharesissued and outstanding — —Common stock, $.002 par value – Authorized: 300,000 shares in 2019 and 2018, respectively, issuedand outstanding: 172,440 and 170,820 shares in 2019 and 2018, respectively 345 342Additional paid-in capital 639,372 529,208Retained earnings 753,268 646,214Accumulated other comprehensive loss, net of tax (37,275) (40,501)
Total shareholders’ equity 1,355,710 1,135,263 $ 1,885,935 $ 1,289,667
The accompanying notes are an integral part of these consolidated f inancial statements.
39
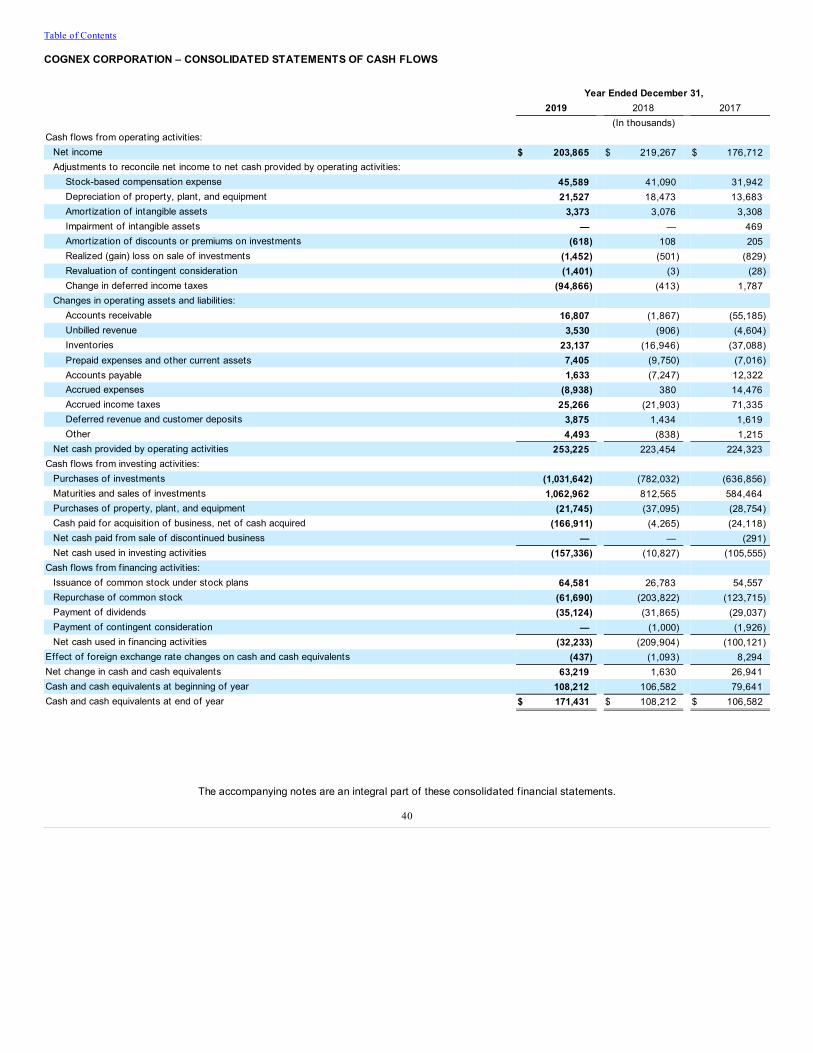
Table of Contents
COGNEX CORPORATION – CONSOLIDATED STATEMENTS OF CASH FLOWS
Year Ended December 31, 2019 2018 2017 (In thousands)Cash flows from operating activities:
Net income $ 203,865 $ 219,267 $ 176,712Adjustments to reconcile net income to net cash provided by operating activities:
Stock-based compensation expense 45,589 41,090 31,942Depreciation of property, plant, and equipment 21,527 18,473 13,683Amortization of intangible assets 3,373 3,076 3,308Impairment of intangible assets — — 469Amortization of discounts or premiums on investments (618) 108 205Realized (gain) loss on sale of investments (1,452) (501) (829)Revaluation of contingent consideration (1,401) (3) (28)Change in deferred income taxes (94,866) (413) 1,787
Changes in operating assets and liabilit ies: Accounts receivable 16,807 (1,867) (55,185)Unbilled revenue 3,530 (906) (4,604)Inventories 23,137 (16,946) (37,088)Prepaid expenses and other current assets 7,405 (9,750) (7,016)Accounts payable 1,633 (7,247) 12,322Accrued expenses (8,938) 380 14,476Accrued income taxes 25,266 (21,903) 71,335Deferred revenue and customer deposits 3,875 1,434 1,619Other 4,493 (838) 1,215
Net cash provided by operating activities 253,225 223,454 224,323Cash flows from investing activities:
Purchases of investments (1,031,642) (782,032) (636,856)Maturities and sales of investments 1,062,962 812,565 584,464Purchases of property, plant, and equipment (21,745) (37,095) (28,754)Cash paid for acquisition of business, net of cash acquired (166,911) (4,265) (24,118)Net cash paid from sale of discontinued business — — (291)Net cash used in investing activities (157,336) (10,827) (105,555)
Cash flows from financing activities: Issuance of common stock under stock plans 64,581 26,783 54,557Repurchase of common stock (61,690) (203,822) (123,715)Payment of dividends (35,124) (31,865) (29,037)Payment of contingent consideration — (1,000) (1,926)Net cash used in financing activities (32,233) (209,904) (100,121)
Effect of foreign exchange rate changes on cash and cash equivalents (437) (1,093) 8,294Net change in cash and cash equivalents 63,219 1,630 26,941Cash and cash equivalents at beginning of year 108,212 106,582 79,641Cash and cash equivalents at end of year $ 171,431 $ 108,212 $ 106,582
The accompanying notes are an integral part of these consolidated f inancial statements.
40
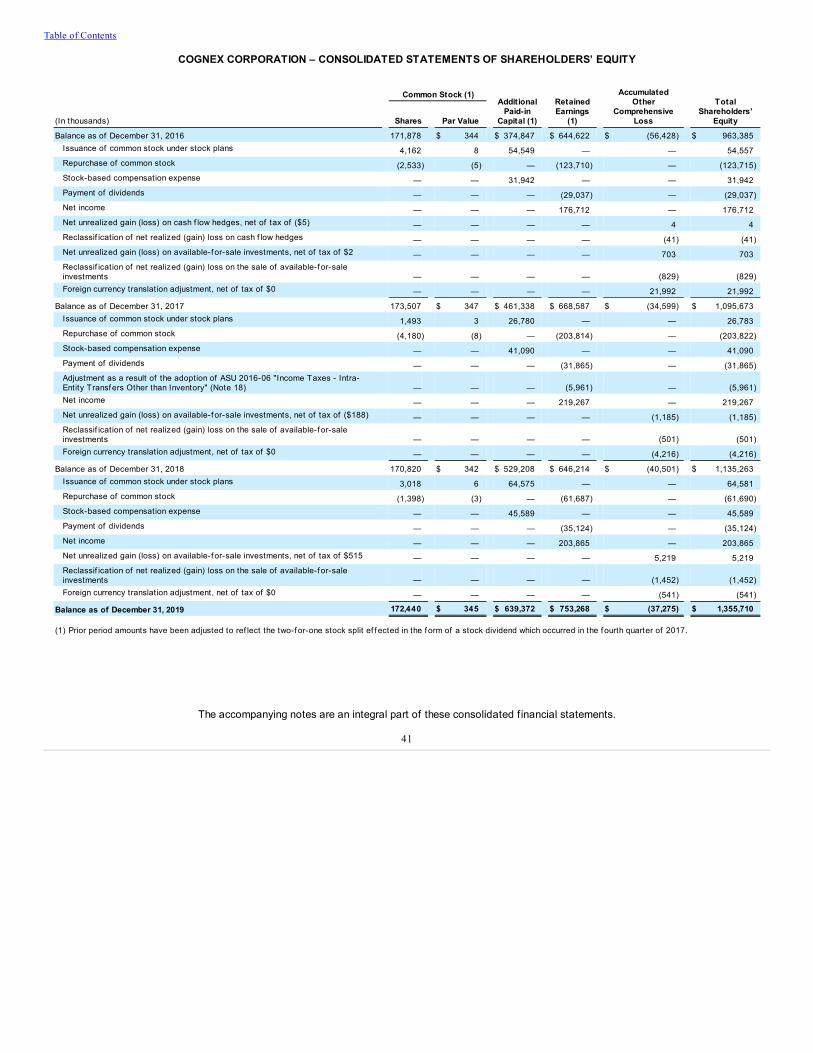
Table of Contents
COGNEX CORPORATION – CONSOLIDATED STATEMENTS OF SHAREHOLDERS’ EQUITY
Common Stock (1) Additional
Paid-inCapital (1)
RetainedEarnings
(1)
AccumulatedOther
ComprehensiveLoss
TotalShareholders’
Equity(In thousands) Shares Par Value Balance as of December 31, 2016 171,878 $ 344 $ 374,847 $ 644,622 $ (56,428) $ 963,385
Issuance of common stock under stock plans 4,162 8 54,549 — — 54,557Repurchase of common stock (2,533) (5) — (123,710) — (123,715)Stock-based compensation expense — — 31,942 — — 31,942Payment of dividends — — — (29,037) — (29,037)Net income — — — 176,712 — 176,712Net unrealized gain (loss) on cash f low hedges, net of tax of ($5) — — — — 4 4Reclassif ication of net realized (gain) loss on cash f low hedges — — — — (41) (41)Net unrealized gain (loss) on available-f or-sale investments, net of tax of $2 — — — — 703 703Reclassif ication of net realized (gain) loss on the sale of available-f or-saleinvestments — — — — (829) (829)Foreign currency translation adjustment, net of tax of $0 — — — — 21,992 21,992
Balance as of December 31, 2017 173,507 $ 347 $ 461,338 $ 668,587 $ (34,599) $ 1,095,673Issuance of common stock under stock plans 1,493 3 26,780 — — 26,783Repurchase of common stock (4,180) (8) — (203,814) — (203,822)Stock-based compensation expense — — 41,090 — — 41,090Payment of dividends — — — (31,865) — (31,865)Adjustment as a result of the adoption of ASU 2016-06 "Income Taxes - Intra-Entity Transfers Other than Inventory" (Note 18) — — — (5,961) — (5,961)Net income — — — 219,267 — 219,267Net unrealized gain (loss) on available-f or-sale investments, net of tax of ($188) — — — — (1,185) (1,185)Reclassif ication of net realized (gain) loss on the sale of available-f or-saleinvestments — — — — (501) (501)Foreign currency translation adjustment, net of tax of $0 — — — — (4,216) (4,216)
Balance as of December 31, 2018 170,820 $ 342 $ 529,208 $ 646,214 $ (40,501) $ 1,135,263Issuance of common stock under stock plans 3,018 6 64,575 — — 64,581Repurchase of common stock (1,398) (3) — (61,687) — (61,690)Stock-based compensation expense — — 45,589 — — 45,589Payment of dividends — — — (35,124) — (35,124)Net income — — — 203,865 — 203,865Net unrealized gain (loss) on available-f or-sale investments, net of tax of $515 — — — — 5,219 5,219Reclassif ication of net realized (gain) loss on the sale of available-f or-saleinvestments — — — — (1,452) (1,452)Foreign currency translation adjustment, net of tax of $0 — — — — (541) (541)
Balance as of December 31, 2019 172,440 $ 345 $ 639,372 $ 753,268 $ (37,275) $ 1,355,710
(1) Prior period amounts have been adjusted to ref lect the two-for-one stock split ef f ected in the f orm of a stock dividend which occurred in the f ourth quarter of 2017.
The accompanying notes are an integral part of these consolidated f inancial statements.
41
Table of Contents
COGNEX CORPORATION - NOTES TO CONSOLIDATED FINANCIAL STATEMENTS
NOTE 1: Summary of Significant Accounting PoliciesThe accompanying consolidated f inancial statements ref lect the application of the signif icant accounting policies described below.
Nature of Operations
Cognex Corporation is a leading provider of machine vision products that capture and analyze visual information in order to automate manufacturing anddistribution tasks where vision is required.
Use of Estimates in the Preparation of Financial Statements
The preparation of f inancial statements in conformity with accounting principles generally accepted in the United States of America (U.S. GAAP) requiresmanagement to make estimates and judgments that affect the reported amounts of assets and liabilities and the disclosure of contingent liabilities as ofthe balance sheet date, and the reported amounts of revenues and expenses during the year. Actual results could dif fer from those estimates. Signif icantestimates and judgments include those related to revenue recognition, investments, accounts receivable, inventories, leases, long-lived assets, internal-use software, goodwill, warranty obligations, contingencies, derivative instruments, stock-based compensation, income taxes, and businesscombinations.
Basis of Consolidation
The consolidated f inancial statements include the accounts of Cognex Corporation and its subsidiaries, all of which are wholly-owned. All intercompanyaccounts and transactions have been eliminated.
Foreign Currency TranslationThe f inancial statements of the Company’s foreign subsidiaries, where the local currency is the functional currency, are translated using exchange rates ineffect at the end of the year for assets and liabilities and average exchange rates during the year for results of operations. The resulting foreign currencytranslation adjustment, net of tax, is recorded in shareholders’ equity as other comprehensive income (loss).
Fair Value MeasurementsThe Company applies a three-level valuation hierarchy for fair value measurements. The categorization of assets and liabilities within the valuationhierarchy is based upon the lowest level of input that is signif icant to the measurement of fair value. Level 1 inputs to the valuation methodology utilizeunadjusted quoted market prices in active markets for identical assets and liabilities. Level 2 inputs to the valuation methodology are other observableinputs, including quoted market prices for similar assets and liabilities, quoted prices for identical and similar assets and liabilities in markets that are notactive, or other inputs that are observable or can be corroborated by observable market data. Level 3 inputs to the valuation methodology areunobservable inputs based upon management’s best estimate of the inputs that market participants would use in pricing the asset or liability at themeasurement date, including assumptions about risk. A change to the level of an asset or liability within the fair value hierarchy is determined at the end ofa reporting period.
Cash, Cash Equivalents, and InvestmentsMoney market instruments, as well as certif icates of deposits and debt securities with original maturities of three months or less, are classif ied as cashequivalents and are stated at amortized cost. Certif icates of deposit and debt securities with original maturities greater than three months and remainingmaturities of one year or less are classif ied as short-term investments. Debt securities with remaining maturities greater than one year are classif ied aslong-term investments. It is the Company’s policy to invest in debt securities with effective maturities that do not exceed ten years.Debt securities with original maturities greater than three months are designated as available-for-sale and are reported at fair value, with unrealized gainsand losses, net of tax, recorded in shareholders’ equity as other comprehensive income (loss). Realized gains and losses are included in currentoperations, along with the amortization of the discount or premium on debt securities arising at acquisition, and are calculated using the specif icidentif ication method. The Company’s limited partnership interest is accounted for using the cost method because the Company’s investment is less than5% of the partnership and the Company has no inf luence over the partnership’s operating and f inancial policies. The carrying value of this investment hasbeen reduced to zero, and therefore, distributions are recorded as investment income as they occur.
42
Table of Contents
COGNEX CORPORATION - NOTES TO CONSOLIDATED FINANCIAL STATEMENTS
Management monitors the carrying value of its investments in debt securities compared to their fair value to determine whether an other-than-temporaryimpairment has occurred. If the fair value of a debt security is less than its amortized cost, the Company assesses whether the impairment is other-than-temporary. In considering whether a decline in fair value is other-than-temporary, we consider many factors. In its evaluation of its debt securities,management considers the type of security, the credit rating of the security, the length of time the security has been in a loss position, the size of the lossposition, our intent and ability to hold the security to expected recovery of value, and other meaningful information. An impairment is considered other-than-temporary if (i) the Company has the intent to sell the security, (ii) it is more likely than not that the Company will be required to sell the securitybefore recovery of the entire amortized cost basis, or (iii) the Company does not expect to recover the entire amortized cost basis of the security. Ifimpairment is considered other-than-temporary based upon condition (i) or (ii) described above, the entire dif ference between the amortized cost and thefair value of the security is recognized in current operations. If an impairment is considered other-than-temporary based upon condition (iii), the amountrepresenting credit losses (defined as the difference between the present value of the cash f lows expected to be collected and the amortized cost basis ofthe security) is recognized in current operations and the amount relating to all other factors is recognized in shareholders' equity as other comprehensiveincome (loss).
Accounts ReceivableThe Company extends credit with various payment terms to customers based upon an evaluation of their f inancial condition. Accounts that areoutstanding longer than the payment terms are considered to be past due. The Company establishes reserves against accounts receivable for potentialcredit losses and records bad debt expense in current operations when it determines receivables are at risk for collection based upon the length of timethe receivable has been outstanding, the customer’s current ability to pay its obligations to the Company, general economic and industry conditions, aswell as various other factors. Receivables are written off against these reserves in the period they are determined to be uncollectible and paymentssubsequently received on previously written-off receivables are recorded as a reversal of the bad debt expense.
InventoriesInventories are stated at the lower of cost and net realizable value. Cost is determined using standard costs, which approximates actual costs under thefirst-in, f irst-out (FIFO) method. Net realizable value is the estimated selling prices in the ordinary course of business, less reasonably predictable costs ofcompletion, disposal, and transportation.The Company’s inventory is subject to technological change or obsolescence. The Company reviews inventory quantities on hand and estimates excessand obsolescence exposures based upon assumptions about future demand, product transitions, and market conditions, and records reserves to reducethe carrying value of inventories to their net realizable value. If actual future demand is less than estimated, additional inventory write-downs would berequired.
The Company generally disposes of obsolete inventory upon determination of obsolescence. The Company does not dispose of excess inventoryimmediately, due to the possibility that some of this inventory could be sold to customers as a result of dif ferences between actual and forecasteddemand. When inventory has been written down below cost, such reduced amount is considered the new cost basis for subsequent accounting purposes.As a result, the Company would recognize a higher than normal gross margin if the reserved inventory were subsequently sold.
Property, Plant, and EquipmentProperty, plant, and equipment are stated at cost and depreciated using the straight-line method over the assets’ estimated useful lives. Buildings’ usefullives are 39 years, building improvements’ useful lives are ten years, and the useful lives of computer hardware and software, manufacturing testequipment, and furniture and f ixtures range from two to ten years. Leasehold improvements are depreciated over the shorter of the estimated useful livesor the remaining terms of the leases. Maintenance and repairs are expensed when incurred; additions and improvements are capitalized. Upon retirementor disposition, the cost and related accumulated depreciation of the disposed assets are removed from the accounts, with any resulting gain or lossincluded in current operations.Leases
The Company accounts for leases in accordance with Accounting Standard Codif ication (ASC) 842, "Leases." The core principle of ASC 842 is that alessee should recognize on the balance sheet the assets and liabilities that arise from leases.
43
Table of Contents
COGNEX CORPORATION - NOTES TO CONSOLIDATED FINANCIAL STATEMENTS
At inception of a contract, the Company determines whether that contract is or contains a lease. The Company determines whether a contract contains alease by assessing whether there is an identif ied asset and whether the contract conveys the right to control the use of the identif ied asset for a period oftime in exchange for consideration. The Company has control of the asset if it has the right to direct the use of the asset and obtains substantially all ofthe economic benefits from the use of the asset throughout the period of use.
As a practical expedient, the Company does not recognize a lease asset or lease liability for leases with a lease term of 12 months or less. In thedetermination of the lease term, the Company considers the existence of extension or termination options and the probability of those options beingexercised.
Lease contracts may include lease components and non-lease components, such as common area maintenance and utilities for property leases. As apractical expedient, the Company accounts for the non-lease components together with the lease components as a single lease component for all of itsleases.
The Company classif ies a lease as a f inance lease when it meets any of the following criteria at the lease commencement date: a) the lease transfersownership of the underlying asset to the Company by the end of the lease term; b) the lease grants the Company an option to purchase the underlyingasset that the Company is reasonably certain to exercise; c) the lease term is for the major part of the remaining economic life of the underlying asset (theCompany considers a major part to be 75% or more of the remaining economic life of the underlying asset); d) the present value of the sum of the leasepayments and any residual value guaranteed by the Company equals or exceeds substantially all of the fair value of the underlying asset (the Companyconsiders substantially all the fair value to be 90% or more of the fair value of the underlying asset amount); or e) the underlying asset is of such aspecialized nature that it is expected to have no alternative use to the lessor at the end of the lease term. When none of the criteria above are met, theCompany classif ies the lease as an operating lease.
On the lease commencement date, the Company records a lease asset and lease liability on the balance sheet. The lease asset consists of: 1) the amountof the initial lease liability; 2) any lease payments made to the lessor at or before the lease commencement date, minus any lease incentives received; and3) any initial direct cost incurred by the Company. Initial direct costs are incremental costs of a lease that would not have been incurred if the lease hadnot been obtained and are capitalized as part of the lease asset. The lease liability equals the present value of the future cash payments discounted usingthe Company's incremental borrowing rate. The Company’s incremental borrowing rate is the rate of interest that the Company would have to pay toborrow an amount equal to the lease payments over a similar term, which is the three-month London Interbank Offered Rate (LIBOR) plus a 2.5% creditrisk spread.
Operating lease expense equals the total cash payments recognized on a straight-line basis over the lease term. The amortization of the lease asset iscalculated as the straight-line lease expense less the accretion of the interest on the lease liability each period. The lease liability is reduced by the cashpayment less the interest each period.
Internal-use Software
Internal-use software is software acquired, internally developed, or modif ied solely to meet the entity's internal needs, and during the software'sdevelopment, no substantive plan exists to sell the software. The accounting treatment for computer software developed for internal use depends uponthe nature of activities performed at each stage of development. The preliminary project stage includes conceptual formulation of design alternatives,determination of system requirements, vendor demonstrations, and f inal selection of vendors, and during this stage costs are expensed as incurred. Theapplication development stage includes software configuration, coding, hardware installation, and testing. During this stage, certain costs are capitalized,including external direct costs of materials and services, as well as payroll and payroll-related costs for employees who are directly associated with theproject, while certain costs are expensed as incurred, including training and data conversion costs. The post-implementation stage includes support andmaintenance, and during this stage costs are expensed as incurred.
Capitalization begins when both the preliminary project stage is completed and management commits to funding the project. Capitalization ceases at thepoint the project is substantially complete and ready for its intended use, that is, after all substantial testing is completed. Costs of specif ied upgradesand enhancements to internal-use software are capitalized if it is probable that those expenditures result in additional functionality. Capitalized costs areamortized on a straight line basis over the estimated useful life.
44
Table of Contents
COGNEX CORPORATION - NOTES TO CONSOLIDATED FINANCIAL STATEMENTS
GoodwillGoodwill is stated at cost. The Company evaluates the possible impairment of goodwill annually each fourth quarter and whenever events orcircumstances indicate the carrying value of the goodwill may not be recoverable. The Company performs a qualitative assessment of goodwill todetermine whether further impairment testing is necessary. Factors that management considers in this assessment include macroeconomic conditions,industry and market considerations, overall f inancial performance (both current and projected), changes in management or strategy, changes in thecomposition or carrying amount of net assets, and market capitalization. If this qualitative assessment indicates that it is more likely than not that the fairvalue of a reporting unit is less than its carrying amount, the entity would proceed to perform a quantitative impairment test. Under this quantitativeanalysis, the fair value of the reporting unit is compared with its carrying value, including goodwill. If the carrying amount exceeds the fair value of thereporting unit, the Company recognizes an impairment charge. The Company estimates the fair value of its reporting unit using the income approach basedupon a discounted cash f low model. In addition, the Company uses the market approach, which compares the reporting unit to publicly-traded companiesand transactions involving similar businesses, to support the conclusions based upon the income approach.
Intangible AssetsIntangible assets are stated at cost and amortized over the assets’ estimated useful lives. Intangible assets are either amortized in relation to the relativecash f lows anticipated from the intangible asset or using the straight-line method, depending upon facts and circumstances. The useful lives of distributionnetworks range from eleven to twelve years, of completed technologies from five to eight years, of customer relationships from five to eight years, of non-compete agreements from three to seven years, and trademarks two years. In-process technology is an indefinite-lived intangible asset until thetechnology is f inalized, at which point it is amortized over its estimated useful life. The Company evaluates the possible impairment of long-lived assets,including intangible assets, whenever events or circumstances indicate the carrying value of the assets may not be recoverable. At the occurrence of acertain event or change in circumstances, the Company evaluates the potential impairment of an asset by estimating the future undiscounted cash f lowsexpected to result from the use and eventual disposition of the asset. If the sum of the estimated future cash f lows is less than the carrying value, theCompany determines the amount of such impairment by comparing the fair value of the asset to its carrying value. The fair value is based upon thepresent value of the estimated future cash f lows using a discount rate commensurate with the risks involved.
Warranty ObligationsThe Company warrants its products to be free from defects in material and workmanship for periods primarily ranging from one to three years from thetime of sale based upon the product being purchased and the terms of the customer arrangement. Warranty obligations are evaluated and recorded at thetime of sale since it is probable that customers will make claims under warranties related to products that have been sold and the amount of these claimscan be reasonably estimated based upon historical costs to fulf ill claims. Obligations may also be recorded subsequent to the time of sale wheneverspecif ic events or circumstances impacting product quality become known that would not have been taken into account using historical data.
ContingenciesLoss contingencies are accrued if the loss is probable and the amount of the loss can be reasonably estimated. Legal costs associated with potential losscontingencies, such as patent infringement matters, are expensed as incurred.
Revenue Recognition
The Company recognizes revenue in accordance with Accounting Standards Codif ication (ASC) 606, “Revenue from Contracts with Customers.” The coreprinciple of ASC 606 is to recognize revenue in a manner that depicts the transfer of promised goods or services to customers in an amount that ref lectsthe consideration to which the Company expects to be entitled in exchange for those goods or services. The framework in support of this core principleincludes: (1) identifying the contract with the customer; (2) identifying the performance obligations in the contract; (3) determining the transaction price; (4)allocating the transaction price to the performance obligations; and (5) recognizing revenue when (or as) the performance obligations are satisf ied.
Identifying the Contract with the CustomerThe Company identif ies contracts with customers as agreements that create enforceable rights and obligations, which typically take the form of customercontracts or purchase orders.
45
Table of Contents
COGNEX CORPORATION - NOTES TO CONSOLIDATED FINANCIAL STATEMENTS
Identifying the Performance Obligations in the ContractThe Company identif ies performance obligations as promises in contracts to transfer distinct goods or services. Standard products and services that theCompany regularly sells separately are accounted for as distinct performance obligations. Application-specif ic customer solutions that are comprised of acombination of products and services are accounted for as one performance obligation to deliver a total solution to the customer. On-site supportservices that are provided to the customer after the solution is deployed are accounted for as a separate performance obligation. These solutions areprovided to customers in a variety of industries, including the consumer electronics, logistics, and automotive industries.
Shipping and handling activities for which the Company is responsible under the terms and conditions of the sale are not accounted for as performanceobligations but as fulf illment costs. These activities are required to fulf ill the Company’s promise to transfer the goods and are expensed when revenue isrecognized.
The Company does not assess whether promised goods or services are performance obligations if they are immaterial in the context of the contract. Ifrevenue is recognized before immaterial promises have been completed, then the costs related to such immaterial promises are accrued at the time ofsale.
Determining the Transaction PriceThe Company determines the transaction price as the amount of consideration it expects to receive in exchange for transferring promised goods orservices to the customer. Amounts collected from customers for sales taxes are excluded from the transaction price.
If a contract includes a variable amount, such as a rebate, then the Company estimates the transaction price using either the expected value or the mostlikely amount of consideration to be received, depending upon the specif ic facts and circumstances. The Company includes estimated variableconsideration in the transaction price only to the extent it is probable that a signif icant reversal of revenue will not occur when the uncertainty is resolved.The Company updates its estimate of variable consideration at the end of each reporting period to ref lect changes in facts and circumstances.
Allocating the Transaction Price to the Performance ObligationsThe Company allocates the transaction price to each performance obligation at contract inception based on a relative stand-alone selling price basis, orthe price at which the Company would sell the good or service separately to similar customers in similar circumstances.
Recognizing Revenue When (or As) the Performance Obligations are SatisfiedThe Company recognizes revenue when it transfers the promised goods or services to the customer. Revenue for standard products is recognized at thepoint in time when the customer obtains control of the goods, which is typically upon delivery when the customer has legal title, physical possession, therisks and rewards of ownership, and an enforceable obligation to pay for the products. Revenue for services, which are not material, is typicallyrecognized over the time the service is provided.
Revenue for application-specif ic customer solutions is recognized at the point in time when the solution is validated, which is the point in time when theCompany can objectively determine that the agreed-upon specif ications in the contract have been met and the customer will accept the performanceobligations in the arrangement. Although the customer may have taken legal title and physical possession of the goods when they arrived at the customer’sdesignated site, the signif icant risks and rewards of ownership transfer to the customer only upon validation. Revenue for on-site support services relatedto these solutions is recognized over the time the service is provided.
In certain instances, an arrangement may include customer-specif ied acceptance provisions or performance guarantees that allow the customer to acceptor reject delivered products that do not meet the customer’s specif ications. If the Company can objectively determine that control of a good or service hasbeen transferred to the customer in accordance with the agreed-upon specif ications in the contract, then customer acceptance is a formality. Ifacceptance provisions are presumed to be substantive, then revenue is deferred until customer acceptance.
For the Company’s standard products and services, revenue recognition and billing typically occur at the same time. For application-specif ic customersolutions, however, the agreement with the customer may provide for billing terms which differ from revenue recognition criteria, resulting in either deferredrevenue or unbilled revenue. Credit assessments are performed to determine payment terms, which vary by region, industry, and customer. Prepaymentterms result in contract liabilities for customer deposits. When credit is granted to customers, payment is typically due 30 to 90 days from billing. TheCompany's contracts have an original expected duration of less than one year, and therefore as a practical expedient, the Company has elected to ignorethe impact of the time value of money on a
46
Table of Contents
COGNEX CORPORATION - NOTES TO CONSOLIDATED FINANCIAL STATEMENTS
contract and to expense sales commissions. The Company recognizes an asset for costs to fulf ill a contract if the costs relate directly to the contract andto future performance, and the costs are expected to be recovered.Management exercises judgment when determining the amount of revenue to be recognized each period. Such judgments include, but are not limited to,assessing the customer’s ability and intention to pay substantially all of the contract consideration when due, determining when two or more contractsshould be combined and accounted for as a single contract, determining whether a contract modif ication has occurred, assessing whether promises areimmaterial in the context of the contract, determining whether material promises in a contract represent distinct performance obligations, estimating thetransaction price for a contract that contains variable consideration, determining the stand-alone selling price of each performance obligation, determiningwhether control is transferred over time or at a point in time for performance obligations, and assessing whether formal customer acceptance provisionsare substantive.
Research and DevelopmentResearch and development costs for internally-developed or acquired products are expensed when incurred until technological feasibility has beenestablished for the product. Thereafter, all software costs may be capitalized until the product is available for general release to customers. The Companydetermines technological feasibility at the time the product reaches beta in its stage of development. Historically, the time incurred between beta andgeneral release to customers has been short, and therefore, the costs have been insignif icant.Advertising Costs
Advertising costs are expensed as incurred and totaled $1,385,000 in 2019, $1,662,000 in 2018, and $1,679,000 in 2017.
Stock-Based CompensationThe Company’s stock-based awards that result in compensation expense consist of stock options and restricted stock units (RSUs). The Company hasreserved a specif ic number of shares of its authorized but unissued shares for issuance upon the exercise of stock options or the settlement of restrictedstock units. When a stock option is exercised or a restricted stock unit is settled, the Company issues new shares from this pool. The fair values of stockoptions are estimated on the grant date using a binomial lattice model. Management is responsible for determining the appropriate valuation model andestimating these fair values, and in doing so, considers a number of factors, including information provided by an outside valuation advisor. The fair valueof RSUs are determined based upon the market value of the Company's common stock on the grant date.
The Company recognizes compensation expense related to stock options and RSUs using the graded attribution method, in which expense is recognizedon a straight-line basis over the service period for each separately vesting portion of the stock option or RSU as if the award was, in substance, multipleawards. The amount of compensation expense recognized at the end of the vesting period is based upon the number of awards for which the requisiteservice has been completed. No compensation expense is recognized for awards that are forfeited for which the employee does not render the requisiteservice. The term “forfeitures” is distinct from “expirations” and represents only the unvested portion of the surrendered award. The Company appliesestimated forfeiture rates to its unvested awards to arrive at the amount of compensation expense that is expected to be recognized over the requisiteservice period. At the end of each separately vesting portion of an award, the expense that was recognized by applying the estimated forfeiture rate iscompared to the expense that should be recognized based upon the employee’s service, and an increase or decrease to compensation expense isrecorded to true up the f inal expense.
TaxesThe Company recognizes a tax position in its f inancial statements when that tax position, based solely upon its technical merits, is more likely than not tobe sustained upon examination by the relevant taxing authority. Those tax positions failing to qualify for initial recognition are recognized in the f irstinterim period in which they meet the more likely than not standard, or are resolved through negotiation or litigation with the taxing authority, or uponexpiration of the statutes of limitations. Derecognition of a tax position that was previously recognized occurs when an entity subsequently determinesthat a tax position no longer meets the more likely than not threshold of being sustained.Only the portion of the liability that is expected to be paid within one year is classif ied as a current liability. As a result, liabilities expected to be resolvedwithout the payment of cash (e.g., resolution due to the expiration of the statutes of limitations) or are not expected to be paid within one year are notclassif ied as current. It is the Company’s policy to record estimated interest and penalties as income tax expense and tax credits as a reduction in incometax expense.
47
Table of Contents
COGNEX CORPORATION - NOTES TO CONSOLIDATED FINANCIAL STATEMENTS
Deferred tax assets and liabilities are determined based upon the differences between the f inancial statement and tax bases of assets and liabilities asmeasured by the enacted tax rates that will be in effect when these differences reverse. Valuation allowances are provided if , based upon the weight ofavailable evidence, it is more likely than not that some or all of the deferred tax assets will not be realized.In December 2017, the Tax Cuts and Jobs Act (“Tax Act”) was signed into law. The Tax Act imposed a minimum tax on foreign earnings related tointangible assets, known as the Global Intangible Low-Taxed Income (GILTI) tax In the fourth quarter of 2019, the Company elected to account for theimpact of the GILTI minimum tax in deferred taxes, a change from the Company’s initial election made in the third quarter of 2018 whereby the GILTIminimum tax was included in income tax expense as incurred on an annual basis. The change is considered preferable, as it appropriately matches theCompany’s current and deferred income tax implications.Sales tax in the United States and similar taxes in other jurisdictions that are collected from customers and remitted to government authorities arepresented on a gross basis (i.e., a receivable from the customer with a corresponding payable to the government). Amounts collected from customers andretained by the Company during tax holidays are recognized as non-operating income when earned.
Net Income Per ShareBasic net income per share is computed by dividing net income available to common shareholders by the weighted-average number of common sharesoutstanding for the period. Diluted net income per share is computed by dividing net income available to common shareholders by the weighted-averagenumber of common shares outstanding for the period plus potential dilutive common shares. Dilutive common equivalent shares consist of stock optionsand restricted stock units and are calculated using the treasury stock method. Common equivalent shares do not qualify as participating securities. Inperiods where the Company records a net loss, potential common stock equivalents are not included in the calculation of diluted net loss per share astheir effect would be anti-dilutive.
Comprehensive IncomeComprehensive income is defined as the change in equity of a company during a period from transactions and other events and circumstances, excludingtransactions resulting from investments by owners and distributions to owners. Accumulated other comprehensive loss, net of tax, consists of foreigncurrency translation adjustment losses of $38,027,000 and $37,486,000, as of December 31, 2019 and December 31, 2018, respectively; net unrealizedgains on available-for-sale investments of $2,023,000 as of December 31, 2019 and net unrealized losses on available-for-sale investments of$1,744,000 as of December 31, 2018; and losses on currency swaps, net of gains on long-term intercompany loans of $1,271,000 at each year end.Amounts reclassif ied from accumulated other comprehensive income (loss) to investment income on the Consolidated Statements of Operations were netrealized gains of $1,452,000, $501,000, and $829,000 for 2019, 2018, and 2017, respectively.Concentrations of RiskFinancial instruments that potentially subject the Company to concentrations of credit risk consist primarily of cash, cash equivalents, investments, andtrade receivables. The Company has certain domestic and foreign cash balances that exceed the insured limits set by the Federal Deposit InsuranceCorporation (FDIC) in the United States and equivalent regulatory agencies in foreign countries. The Company primarily invests in investment-grade debtsecurities and has established guidelines relative to credit ratings, diversif ication, and maturities of its debt securities that maintain safety and liquidity.The Company has not experienced any signif icant realized losses on its debt securities.
The Company performs ongoing credit evaluations of its customers and maintains allowances for potential credit losses. The Company has notexperienced any signif icant losses related to the collection of its accounts receivable.
A signif icant portion of the Company's product is manufactured by a third-party contractor located in Indonesia. This contractor has agreed to provideCognex with termination notif ication periods and last-time-buy rights, if and when that may be applicable. We rely upon this contractor to provide qualityproduct and meet delivery schedules. We engage in extensive product quality programs and processes, including actively monitoring the performance ofour third-party manufacturers; however, we may not detect all product quality issues through these programs and processes.
Certain components are presently sourced from a single vendor that is selected based on price and performance considerations. In the event of a supplydisruption from a single-source vendor, these components may be purchased from alternative vendors, which may result in manufacturing delays basedon the lead time of the new vendor. Certain
48
Table of Contents
COGNEX CORPORATION - NOTES TO CONSOLIDATED FINANCIAL STATEMENTS
key electronic and mechanical components that are purchased from strategic suppliers, such as processors or imagers, are fundamental to the design ofCognex products. A disruption in the supply of these key components, such as a last-time-buy announcement, natural disaster, f inancial bankruptcy, orother event, may require us to purchase a signif icant amount of inventory at unfavorable prices resulting in lower gross margins and higher risk of carryingexcess inventory. If we are unable to secure adequate supply from alternative sources, we may have to redesign our products, which may lead to a delayin manufacturing and a possible loss of sales.
Derivative InstrumentsDerivative instruments are recorded on the Consolidated Balance Sheets at fair value. Changes in the fair value of derivatives are recorded each period incurrent operations or in shareholders' equity as other comprehensive income (loss), depending upon whether the derivative is designated as a hedgetransaction and, if it is, the effectiveness of the hedge. At the inception of the contract, the Company designates foreign currency forward exchangecontracts as either a cash f low hedge of certain forecasted foreign currency denominated sales and purchase transactions or as an economic hedge.Changes in the fair value of a derivative that is highly effective and that is designated and qualif ies as a cash f low hedge are recorded in shareholders'equity as other comprehensive income (loss), and reclassif ied into current operations in the same period during which the hedged transaction affectscurrent operations and in the same f inancial statement line item as that of the forecasted transaction. Cash f low hedges are evaluated for effectivenessquarterly. Any hedge ineffectiveness (which represents the amount by which the changes in the fair value of the derivative exceed the variability in the cashflows of the forecasted transaction) is recorded in current operations in the period in which ineffectiveness is determined. Changes in the fair value of theCompany’s economic hedges (not designated as a cash f low hedge) are reported in current operations. The cash f lows from derivative instruments arepresented in the same category on the Consolidated Statements of Cash Flows as the category for the cash f lows from the hedged item. Generally, thisaccounting policy election results in cash f lows related to derivative instruments being classif ied as an operating activity on the Consolidated Statementsof Cash Flows.
The Company formally documents all relationships between hedging instruments and hedged items, as well as its risk-management objective and strategyfor undertaking various hedge transactions. This process includes linking all derivatives that are designated as cash f low hedges to specif ic forecastedtransactions. The Company also formally assesses (both at the hedge’s inception and on an ongoing basis) whether the derivatives that are used inhedging transactions have been highly effective in offsetting changes in the fair value or cash f lows of hedged items and whether those derivatives may beexpected to remain highly effective in future periods. When it is determined that a derivative is not (or has ceased to be) highly effective as a hedge, theCompany discontinues hedge accounting prospectively, as discussed below.The Company discontinues hedge accounting prospectively when (1) it determines that the derivative is no longer effective in offsetting changes in thecash f lows of a hedged item; (2) the derivative expires or is sold, terminated, or exercised; (3) it is no longer probable that the forecasted transaction willoccur; or (4) management determines that designating the derivative as a hedging instrument is no longer appropriate or desired. When the Companydiscontinues hedge accounting because it is no longer probable that the forecasted transaction will occur in the originally expected period, the gain or losson the derivative remains in accumulated other comprehensive income (loss) and is reclassif ied into current operations when the forecasted transactionaffects current operations. However, if it is probable that a forecasted transaction will not occur by the end of the originally specif ied time period or withinan additional two-month period of time thereafter, the gain or loss that was accumulated in other comprehensive income (loss) is recognized immediatelyin current operations. In all situations in which hedge accounting is discontinued and the derivative remains outstanding, the Company carries thederivative at fair value on the Consolidated Balance Sheets, recognizing changes in the fair value in current operations, unless it is designated in a newhedging relationship.The Company recognizes all derivative instruments as either current assets or current liabilities at fair value on the Consolidated Balance Sheets. Whenthe Company is engaged in more than one outstanding derivative contract with the same counterparty and also has a legally enforceable master nettingagreement with that counterparty, the “net” mark-to-market exposure represents the netting of the positive and negative exposures with that counterparty.Accordingly, cash f low hedges are presented net on the Consolidated Balance Sheets.Business AcquisitionsThe Company determines whether a transaction qualif ies as a business combination by applying the definition of a business, which requires the assetsacquired and liabilities assumed to be inputs and processes that have the ability to contriubte to the creation of outputs. The Company accounts forbusiness combinations under the acquisition method of accounting, which requires the following steps: (1) identifying the acquirer, (2) determining theacquisition date, (3) recognizing and measuring the identif iable assets acquired and the liabilities assumed, and (4) recognizing and
49
Table of Contents
COGNEX CORPORATION - NOTES TO CONSOLIDATED FINANCIAL STATEMENTS
measuring goodwill. The Company measures the identif iable assets acquired and liabilities assumed at their estimated fair values as of the acquisitiondate. Management is responsible for determining the appropriate valuation model and estimated fair values, and in doing so, considers a number offactors, including information provided by an outside valuation advisor. Management primarily establishes fair value using the income approach basedupon a discounted cash f low model. The income approach requires the use of many assumptions and estimates including future revenues and expenses,as well as discount factors. Contingent consideration liabilities are reported at their estimated fair values based upon probability-adjusted present valuesof the consideration expected to be paid, using signif icant inputs and estimates. Key assumptions used in these estimates include probabilityassessments with respect to the likelihood of achieving certain milestones and discount rates consistent with the level of risk of achievement. The fairvalues of these contingent consideration liabilities are remeasured each reporting period with changes in fair value recorded in "Other income (expense)"on the Consolidated Statements of Operations. Goodwill is recognized as of the acquisition date as the excess of the consideration transferred over thenet amount of assets acquired and liabilities assumed. Transaction costs are expensed as incurred.
NOTE 2: New PronouncementsAccounting Standards Update (ASU) 2016-13, "Financial Instruments - Measurement of Credit Losses"
ASU 2016-13 applies to all reporting entities holding f inancial assets that are not accounted for at fair value through net income. The amendments in thisASU eliminate the probable initial recognition threshold to recognize a credit loss under current GAAP and, instead, ref lect an entity’s current estimate ofall expected credit losses. In addition, this ASU broadens the information an entity must consider in developing the credit loss estimate, including the useof reasonable and supportable forecasted information. The amendments in this ASU require that credit losses be presented as an allowance rather thanas a write-down, and an entity will be able to record reversals of credit losses in current period net income. The guidance in this ASU is effective forannual periods, and interim periods within those annual periods, beginning after December 15, 2019. This ASU should be applied through a cumulative-effect adjustment to retained earnings as of the beginning of the f irst reporting period in which the guidance is effective. Available-for-sale debt securitiesand accounts receivable are the account balances primarily impacted by the guidance in this ASU. Management adopted this ASU on January 1, 2020,and we do not expect this ASU to have a material impact on the Company's consolidated f inancial statements and disclosures.
Accounting Standards Update (ASU) 2018-15, "Intangibles - Goodwill and Other - Internal-Use Software"
ASU 2018-15 applies to entities that are a customer in a hosting arrangement that is a service contract. The amendments in this ASU align therequirements for capitalizing implementation costs incurred in a hosting arrangement that is a service contract with the requirements for capitalizingimplementation costs incurred to develop or obtain internal-use software. Accordingly, the amendments in this ASU require an entity in a hostingarrangement that is a service contract to follow the guidance in Subtopic 350-40 to determine which implementation costs to capitalize as an asset relatedto the service contract and which costs to expense. Further, it requires the entity to expense the capitalized implementation costs over the term of thehosting arrangement. In addition, it requires the presentation of the expenses related to the capitalized implementation costs in the same line item in thestatement of income as the fees associated with the hosting element of the arrangement and the classif ication of the payments for the capitalizedimplementation costs in the statement of cash f lows in the same manner as the payments made for the fees associated with the hosting element. Theamendments in this ASU are effective for public entities for annual periods, and for interim periods within those annual periods, beginning after December15, 2019. Management adopted this ASU on January 1, 2020, and we do not expect this ASU to have a material impact on the Company's consolidatedfinancial statements and disclosures.
50
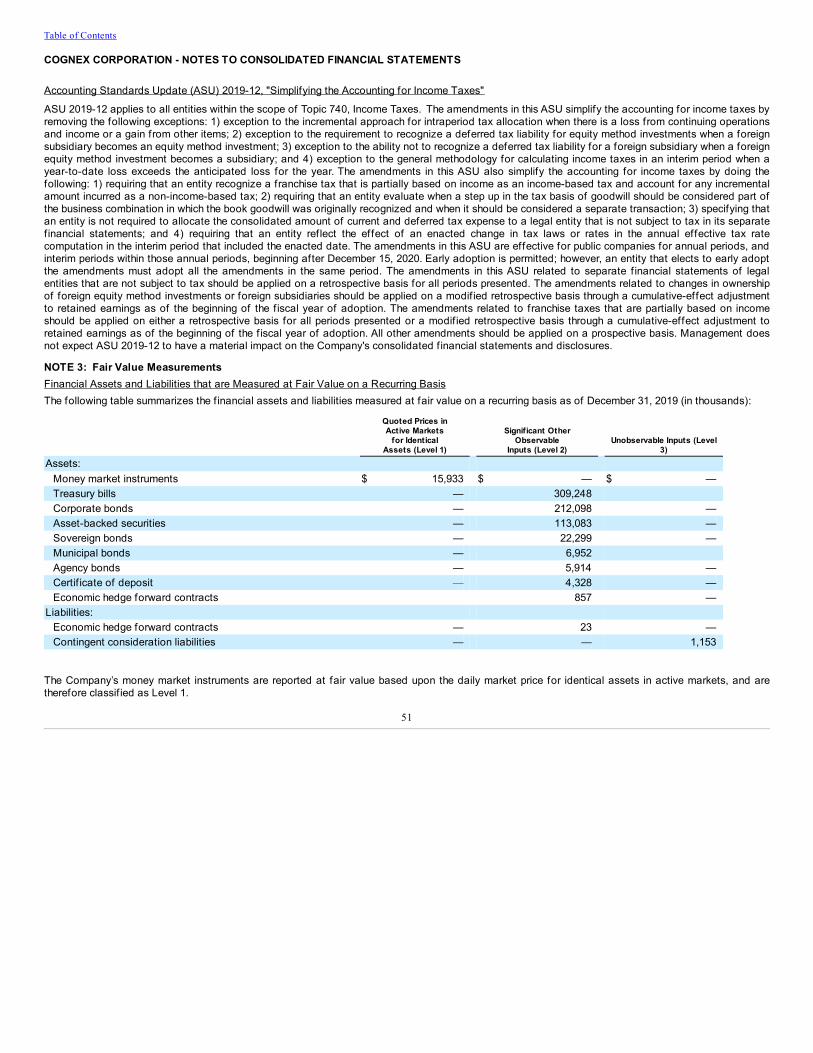
Table of Contents
COGNEX CORPORATION - NOTES TO CONSOLIDATED FINANCIAL STATEMENTS
Accounting Standards Update (ASU) 2019-12, "Simplifying the Accounting for Income Taxes"
ASU 2019-12 applies to all entities within the scope of Topic 740, Income Taxes. The amendments in this ASU simplify the accounting for income taxes byremoving the following exceptions: 1) exception to the incremental approach for intraperiod tax allocation when there is a loss from continuing operationsand income or a gain from other items; 2) exception to the requirement to recognize a deferred tax liability for equity method investments when a foreignsubsidiary becomes an equity method investment; 3) exception to the ability not to recognize a deferred tax liability for a foreign subsidiary when a foreignequity method investment becomes a subsidiary; and 4) exception to the general methodology for calculating income taxes in an interim period when ayear-to-date loss exceeds the anticipated loss for the year. The amendments in this ASU also simplify the accounting for income taxes by doing thefollowing: 1) requiring that an entity recognize a franchise tax that is partially based on income as an income-based tax and account for any incrementalamount incurred as a non-income-based tax; 2) requiring that an entity evaluate when a step up in the tax basis of goodwill should be considered part ofthe business combination in which the book goodwill was originally recognized and when it should be considered a separate transaction; 3) specifying thatan entity is not required to allocate the consolidated amount of current and deferred tax expense to a legal entity that is not subject to tax in its separatefinancial statements; and 4) requiring that an entity ref lect the effect of an enacted change in tax laws or rates in the annual effective tax ratecomputation in the interim period that included the enacted date. The amendments in this ASU are effective for public companies for annual periods, andinterim periods within those annual periods, beginning after December 15, 2020. Early adoption is permitted; however, an entity that elects to early adoptthe amendments must adopt all the amendments in the same period. The amendments in this ASU related to separate f inancial statements of legalentities that are not subject to tax should be applied on a retrospective basis for all periods presented. The amendments related to changes in ownershipof foreign equity method investments or foreign subsidiaries should be applied on a modif ied retrospective basis through a cumulative-effect adjustmentto retained earnings as of the beginning of the f iscal year of adoption. The amendments related to franchise taxes that are partially based on incomeshould be applied on either a retrospective basis for all periods presented or a modif ied retrospective basis through a cumulative-effect adjustment toretained earnings as of the beginning of the f iscal year of adoption. All other amendments should be applied on a prospective basis. Management doesnot expect ASU 2019-12 to have a material impact on the Company's consolidated f inancial statements and disclosures.
NOTE 3: Fair Value MeasurementsFinancial Assets and Liabilities that are Measured at Fair Value on a Recurring BasisThe following table summarizes the f inancial assets and liabilities measured at fair value on a recurring basis as of December 31, 2019 (in thousands):
Quoted Prices inActive Markets
for IdenticalAssets (Level 1)
Significant OtherObservable
Inputs (Level 2) Unobservable Inputs (Level
3)Assets:
Money market instruments $ 15,933 $ — $ —Treasury bills — 309,248 Corporate bonds — 212,098 —Asset-backed securities — 113,083 —Sovereign bonds — 22,299 —Municipal bonds — 6,952 Agency bonds — 5,914 —Certif icate of deposit — 4,328 —Economic hedge forward contracts 857 —
Liabilities: Economic hedge forward contracts — 23 —Contingent consideration liabilities — — 1,153
The Company’s money market instruments are reported at fair value based upon the daily market price for identical assets in active markets, and aretherefore classif ied as Level 1.
51
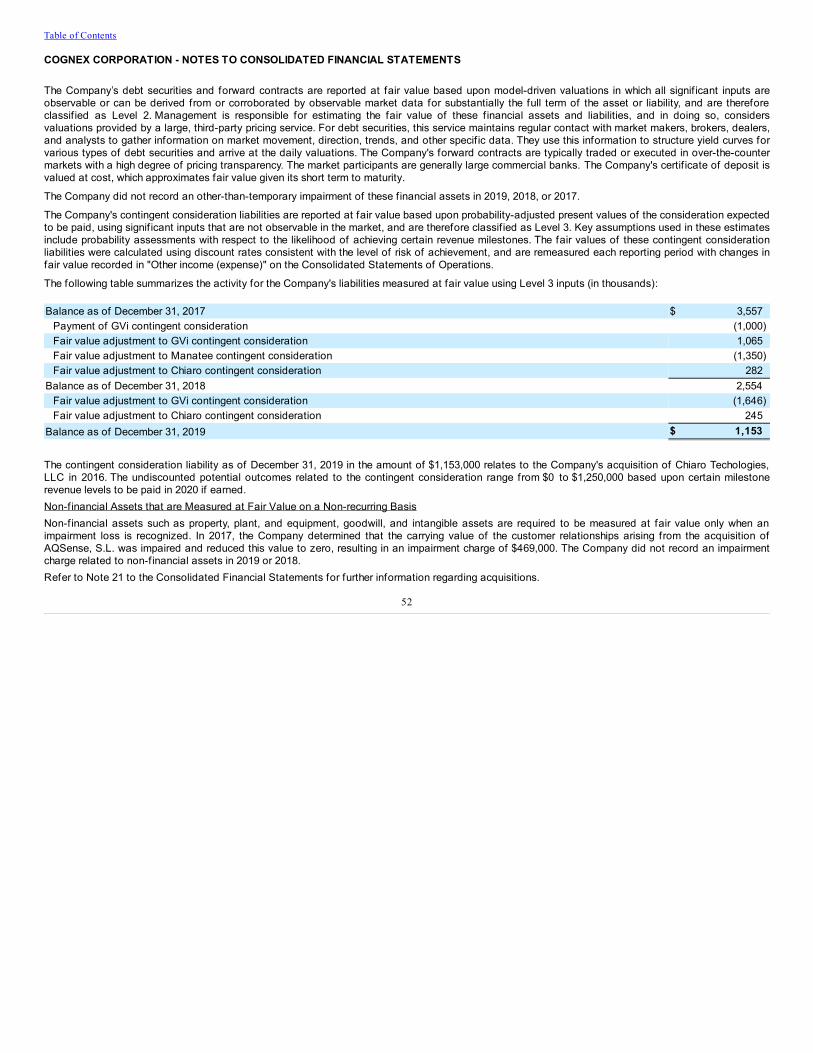
Table of Contents
COGNEX CORPORATION - NOTES TO CONSOLIDATED FINANCIAL STATEMENTS
The Company’s debt securities and forward contracts are reported at fair value based upon model-driven valuations in which all signif icant inputs areobservable or can be derived from or corroborated by observable market data for substantially the full term of the asset or liability, and are thereforeclassif ied as Level 2. Management is responsible for estimating the fair value of these f inancial assets and liabilities, and in doing so, considersvaluations provided by a large, third-party pricing service. For debt securities, this service maintains regular contact with market makers, brokers, dealers,and analysts to gather information on market movement, direction, trends, and other specif ic data. They use this information to structure yield curves forvarious types of debt securities and arrive at the daily valuations. The Company's forward contracts are typically traded or executed in over-the-countermarkets with a high degree of pricing transparency. The market participants are generally large commercial banks. The Company's certif icate of deposit isvalued at cost, which approximates fair value given its short term to maturity.
The Company did not record an other-than-temporary impairment of these f inancial assets in 2019, 2018, or 2017.
The Company's contingent consideration liabilities are reported at fair value based upon probability-adjusted present values of the consideration expectedto be paid, using signif icant inputs that are not observable in the market, and are therefore classif ied as Level 3. Key assumptions used in these estimatesinclude probability assessments with respect to the likelihood of achieving certain revenue milestones. The fair values of these contingent considerationliabilities were calculated using discount rates consistent with the level of risk of achievement, and are remeasured each reporting period with changes infair value recorded in "Other income (expense)" on the Consolidated Statements of Operations.
The following table summarizes the activity for the Company's liabilities measured at fair value using Level 3 inputs (in thousands):
Balance as of December 31, 2017 $ 3,557Payment of GVi contingent consideration (1,000)Fair value adjustment to GVi contingent consideration 1,065Fair value adjustment to Manatee contingent consideration (1,350)Fair value adjustment to Chiaro contingent consideration 282
Balance as of December 31, 2018 2,554Fair value adjustment to GVi contingent consideration (1,646)Fair value adjustment to Chiaro contingent consideration 245
Balance as of December 31, 2019 $ 1,153
The contingent consideration liability as of December 31, 2019 in the amount of $1,153,000 relates to the Company's acquisition of Chiaro Techologies,LLC in 2016. The undiscounted potential outcomes related to the contingent consideration range from $0 to $1,250,000 based upon certain milestonerevenue levels to be paid in 2020 if earned.Non-f inancial Assets that are Measured at Fair Value on a Non-recurring BasisNon-f inancial assets such as property, plant, and equipment, goodwill, and intangible assets are required to be measured at fair value only when animpairment loss is recognized. In 2017, the Company determined that the carrying value of the customer relationships arising from the acquisition ofAQSense, S.L. was impaired and reduced this value to zero, resulting in an impairment charge of $469,000. The Company did not record an impairmentcharge related to non-f inancial assets in 2019 or 2018.Refer to Note 21 to the Consolidated Financial Statements for further information regarding acquisitions.
52
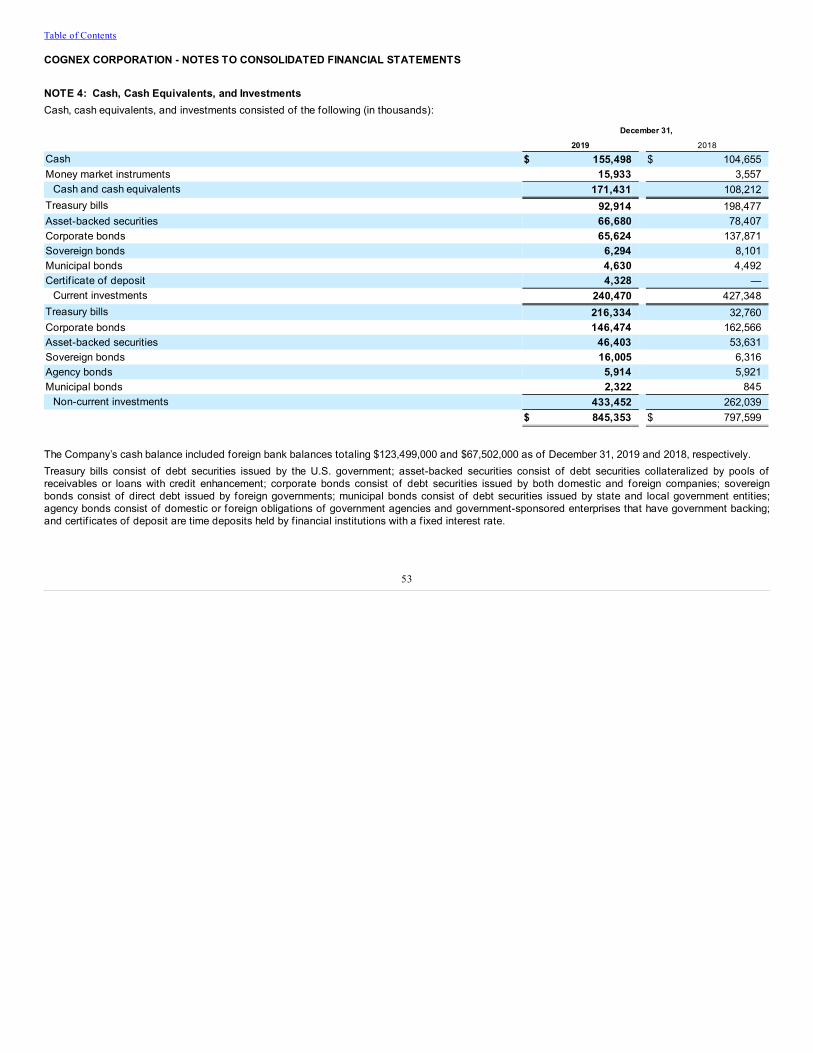
Table of Contents
COGNEX CORPORATION - NOTES TO CONSOLIDATED FINANCIAL STATEMENTS
NOTE 4: Cash, Cash Equivalents, and InvestmentsCash, cash equivalents, and investments consisted of the following (in thousands):
December 31,
2019 2018
Cash $ 155,498 $ 104,655Money market instruments 15,933 3,557
Cash and cash equivalents 171,431 108,212Treasury bills 92,914 198,477Asset-backed securities 66,680 78,407Corporate bonds 65,624 137,871Sovereign bonds 6,294 8,101Municipal bonds 4,630 4,492Certif icate of deposit 4,328 —
Current investments 240,470 427,348Treasury bills 216,334 32,760Corporate bonds 146,474 162,566Asset-backed securities 46,403 53,631Sovereign bonds 16,005 6,316Agency bonds 5,914 5,921Municipal bonds 2,322 845
Non-current investments 433,452 262,039 $ 845,353 $ 797,599
The Company’s cash balance included foreign bank balances totaling $123,499,000 and $67,502,000 as of December 31, 2019 and 2018, respectively.Treasury bills consist of debt securities issued by the U.S. government; asset-backed securities consist of debt securities collateralized by pools ofreceivables or loans with credit enhancement; corporate bonds consist of debt securities issued by both domestic and foreign companies; sovereignbonds consist of direct debt issued by foreign governments; municipal bonds consist of debt securities issued by state and local government entities;agency bonds consist of domestic or foreign obligations of government agencies and government-sponsored enterprises that have government backing;and certif icates of deposit are time deposits held by f inancial institutions with a f ixed interest rate.
53
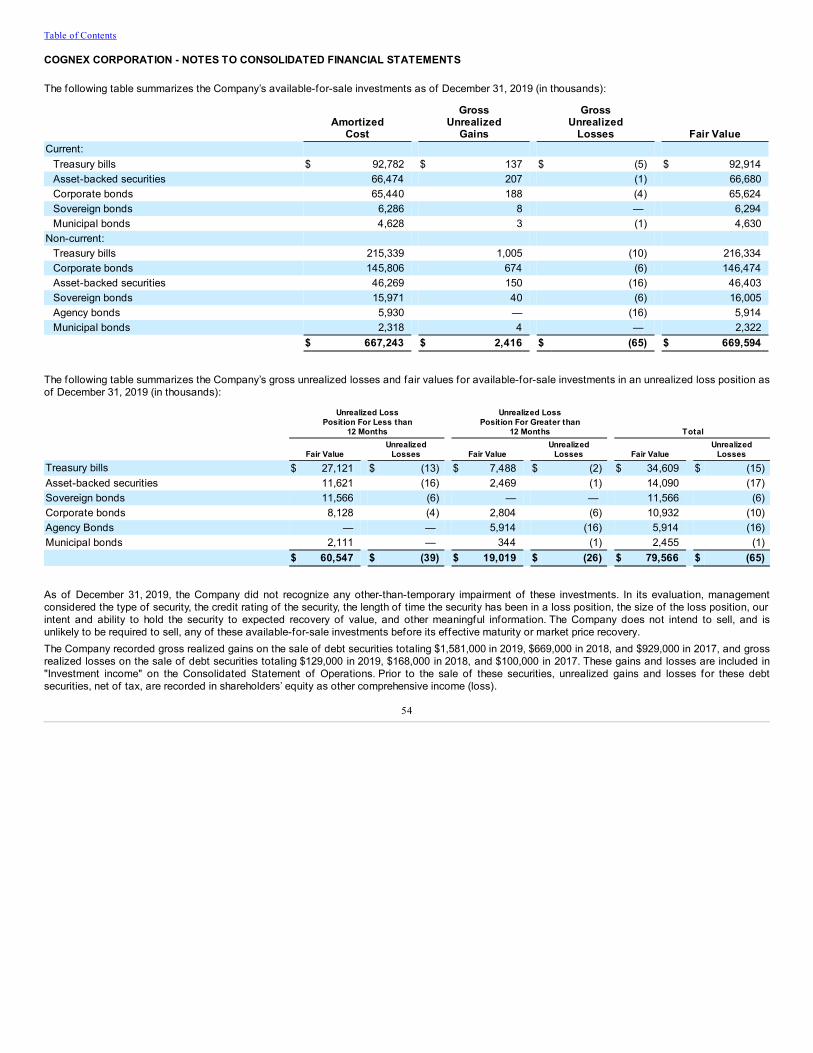
Table of Contents
COGNEX CORPORATION - NOTES TO CONSOLIDATED FINANCIAL STATEMENTS
The following table summarizes the Company’s available-for-sale investments as of December 31, 2019 (in thousands):
Amortized
Cost
GrossUnrealized
Gains
GrossUnrealized
Losses Fair ValueCurrent:
Treasury bills $ 92,782 $ 137 $ (5) $ 92,914Asset-backed securities 66,474 207 (1) 66,680Corporate bonds 65,440 188 (4) 65,624Sovereign bonds 6,286 8 — 6,294Municipal bonds 4,628 3 (1) 4,630
Non-current: Treasury bills 215,339 1,005 (10) 216,334Corporate bonds 145,806 674 (6) 146,474Asset-backed securities 46,269 150 (16) 46,403Sovereign bonds 15,971 40 (6) 16,005Agency bonds 5,930 — (16) 5,914Municipal bonds 2,318 4 — 2,322
$ 667,243 $ 2,416 $ (65) $ 669,594
The following table summarizes the Company’s gross unrealized losses and fair values for available-for-sale investments in an unrealized loss position asof December 31, 2019 (in thousands):
Unrealized LossPosition For Less than
12 Months
Unrealized LossPosition For Greater than
12 Months Total
Fair Value Unrealized
Losses Fair Value Unrealized
Losses Fair Value Unrealized
LossesTreasury bills $ 27,121 $ (13) $ 7,488 $ (2) $ 34,609 $ (15)Asset-backed securities 11,621 (16) 2,469 (1) 14,090 (17)Sovereign bonds 11,566 (6) — — 11,566 (6)Corporate bonds 8,128 (4) 2,804 (6) 10,932 (10)Agency Bonds — — 5,914 (16) 5,914 (16)Municipal bonds 2,111 — 344 (1) 2,455 (1) $ 60,547 $ (39) $ 19,019 $ (26) $ 79,566 $ (65)
As of December 31, 2019, the Company did not recognize any other-than-temporary impairment of these investments. In its evaluation, managementconsidered the type of security, the credit rating of the security, the length of time the security has been in a loss position, the size of the loss position, ourintent and ability to hold the security to expected recovery of value, and other meaningful information. The Company does not intend to sell, and isunlikely to be required to sell, any of these available-for-sale investments before its effective maturity or market price recovery.The Company recorded gross realized gains on the sale of debt securities totaling $1,581,000 in 2019, $669,000 in 2018, and $929,000 in 2017, and grossrealized losses on the sale of debt securities totaling $129,000 in 2019, $168,000 in 2018, and $100,000 in 2017. These gains and losses are included in"Investment income" on the Consolidated Statement of Operations. Prior to the sale of these securities, unrealized gains and losses for these debtsecurities, net of tax, are recorded in shareholders’ equity as other comprehensive income (loss).
54
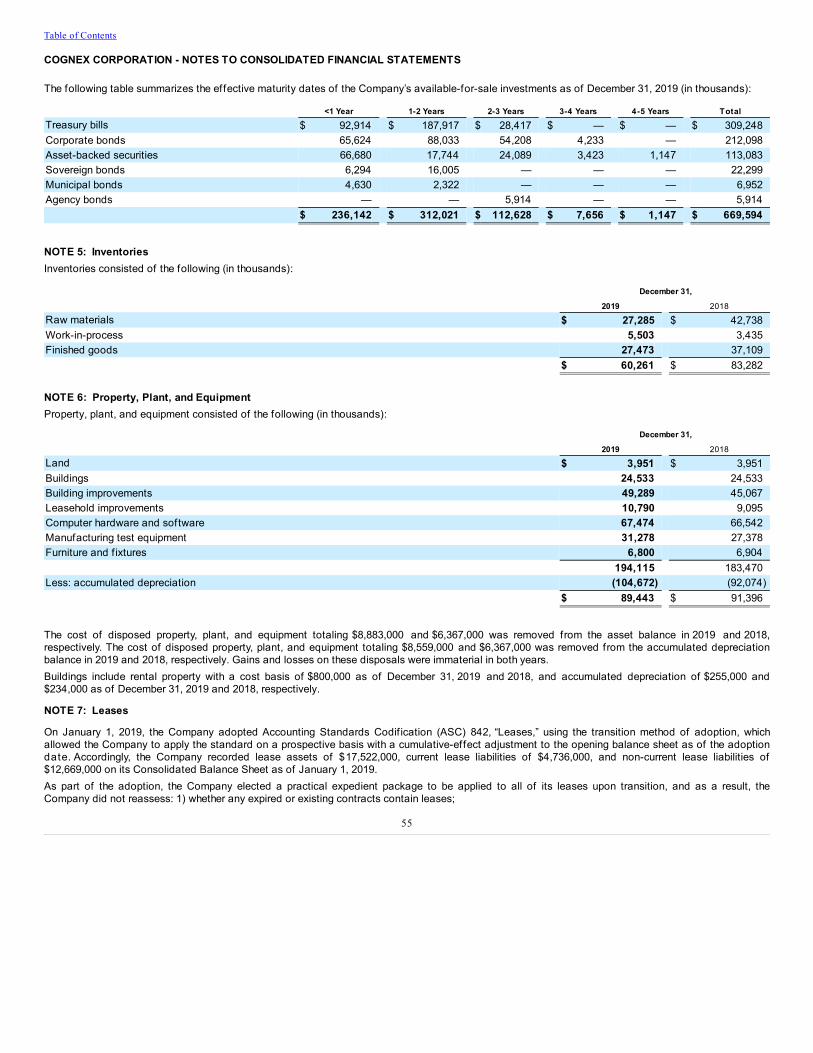
Table of Contents
COGNEX CORPORATION - NOTES TO CONSOLIDATED FINANCIAL STATEMENTS
The following table summarizes the effective maturity dates of the Company’s available-for-sale investments as of December 31, 2019 (in thousands):
<1 Year 1-2 Years 2-3 Years 3-4 Years 4-5 Years TotalTreasury bills $ 92,914 $ 187,917 $ 28,417 $ — $ — $ 309,248Corporate bonds 65,624 88,033 54,208 4,233 — 212,098Asset-backed securities 66,680 17,744 24,089 3,423 1,147 113,083Sovereign bonds 6,294 16,005 — — — 22,299Municipal bonds 4,630 2,322 — — — 6,952Agency bonds — — 5,914 — — 5,914 $ 236,142 $ 312,021 $ 112,628 $ 7,656 $ 1,147 $ 669,594
NOTE 5: InventoriesInventories consisted of the following (in thousands):
December 31,
2019 2018
Raw materials $ 27,285 $ 42,738Work-in-process 5,503 3,435Finished goods 27,473 37,109 $ 60,261 $ 83,282
NOTE 6: Property, Plant, and EquipmentProperty, plant, and equipment consisted of the following (in thousands):
December 31,
2019 2018
Land $ 3,951 $ 3,951Buildings 24,533 24,533Building improvements 49,289 45,067Leasehold improvements 10,790 9,095Computer hardware and software 67,474 66,542Manufacturing test equipment 31,278 27,378Furniture and f ixtures 6,800 6,904 194,115 183,470Less: accumulated depreciation (104,672) (92,074) $ 89,443 $ 91,396
The cost of disposed property, plant, and equipment totaling $8,883,000 and $6,367,000 was removed from the asset balance in 2019 and 2018,respectively. The cost of disposed property, plant, and equipment totaling $8,559,000 and $6,367,000 was removed from the accumulated depreciationbalance in 2019 and 2018, respectively. Gains and losses on these disposals were immaterial in both years.Buildings include rental property with a cost basis of $800,000 as of December 31, 2019 and 2018, and accumulated depreciation of $255,000 and$234,000 as of December 31, 2019 and 2018, respectively.
NOTE 7: Leases
On January 1, 2019, the Company adopted Accounting Standards Codif ication (ASC) 842, “Leases,” using the transition method of adoption, whichallowed the Company to apply the standard on a prospective basis with a cumulative-effect adjustment to the opening balance sheet as of the adoptiondate. Accordingly, the Company recorded lease assets of $17,522,000, current lease liabilities of $4,736,000, and non-current lease liabilities of$12,669,000 on its Consolidated Balance Sheet as of January 1, 2019.As part of the adoption, the Company elected a practical expedient package to be applied to all of its leases upon transition, and as a result, theCompany did not reassess: 1) whether any expired or existing contracts contain leases;
55
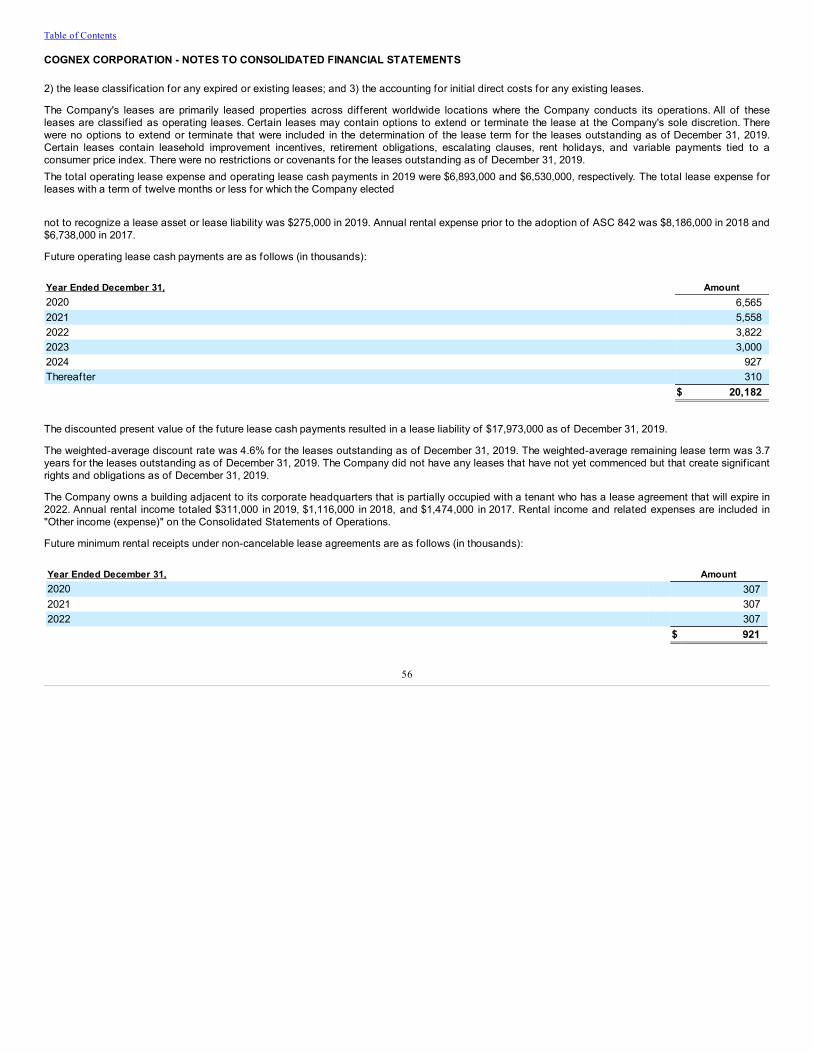
Table of Contents
COGNEX CORPORATION - NOTES TO CONSOLIDATED FINANCIAL STATEMENTS
2) the lease classif ication for any expired or existing leases; and 3) the accounting for initial direct costs for any existing leases.
The Company's leases are primarily leased properties across different worldwide locations where the Company conducts its operations. All of theseleases are classif ied as operating leases. Certain leases may contain options to extend or terminate the lease at the Company's sole discretion. Therewere no options to extend or terminate that were included in the determination of the lease term for the leases outstanding as of December 31, 2019.Certain leases contain leasehold improvement incentives, retirement obligations, escalating clauses, rent holidays, and variable payments tied to aconsumer price index. There were no restrictions or covenants for the leases outstanding as of December 31, 2019.The total operating lease expense and operating lease cash payments in 2019 were $6,893,000 and $6,530,000, respectively. The total lease expense forleases with a term of twelve months or less for which the Company elected
not to recognize a lease asset or lease liability was $275,000 in 2019. Annual rental expense prior to the adoption of ASC 842 was $8,186,000 in 2018 and$6,738,000 in 2017.
Future operating lease cash payments are as follows (in thousands):
Year Ended December 31, Amount2020 6,5652021 5,5582022 3,8222023 3,0002024 927Thereafter 310 $ 20,182
The discounted present value of the future lease cash payments resulted in a lease liability of $17,973,000 as of December 31, 2019.
The weighted-average discount rate was 4.6% for the leases outstanding as of December 31, 2019. The weighted-average remaining lease term was 3.7years for the leases outstanding as of December 31, 2019. The Company did not have any leases that have not yet commenced but that create signif icantrights and obligations as of December 31, 2019.
The Company owns a building adjacent to its corporate headquarters that is partially occupied with a tenant who has a lease agreement that will expire in2022. Annual rental income totaled $311,000 in 2019, $1,116,000 in 2018, and $1,474,000 in 2017. Rental income and related expenses are included in"Other income (expense)" on the Consolidated Statements of Operations.
Future minimum rental receipts under non-cancelable lease agreements are as follows (in thousands):
Year Ended December 31, Amount2020 3072021 3072022 307 $ 921
56
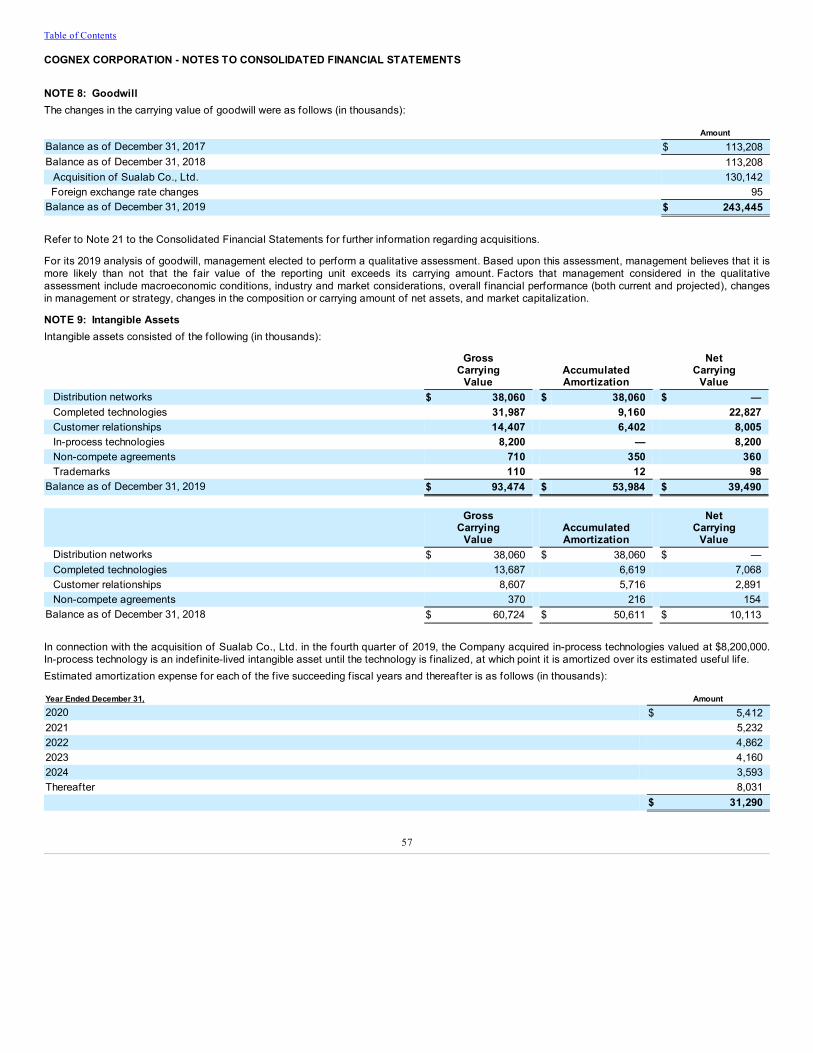
Table of Contents
COGNEX CORPORATION - NOTES TO CONSOLIDATED FINANCIAL STATEMENTS
NOTE 8: GoodwillThe changes in the carrying value of goodwill were as follows (in thousands):
AmountBalance as of December 31, 2017 $ 113,208Balance as of December 31, 2018 113,208
Acquisition of Sualab Co., Ltd. 130,142 Foreign exchange rate changes 95Balance as of December 31, 2019 $ 243,445
Refer to Note 21 to the Consolidated Financial Statements for further information regarding acquisitions.
For its 2019 analysis of goodwill, management elected to perform a qualitative assessment. Based upon this assessment, management believes that it ismore likely than not that the fair value of the reporting unit exceeds its carrying amount. Factors that management considered in the qualitativeassessment include macroeconomic conditions, industry and market considerations, overall f inancial performance (both current and projected), changesin management or strategy, changes in the composition or carrying amount of net assets, and market capitalization.
NOTE 9: Intangible AssetsIntangible assets consisted of the following (in thousands):
GrossCarrying
Value AccumulatedAmortization
NetCarrying
ValueDistribution networks $ 38,060 $ 38,060 $ —Completed technologies 31,987 9,160 22,827Customer relationships 14,407 6,402 8,005In-process technologies 8,200 — 8,200Non-compete agreements 710 350 360Trademarks 110 12 98
Balance as of December 31, 2019 $ 93,474 $ 53,984 $ 39,490
GrossCarrying
Value AccumulatedAmortization
NetCarrying
ValueDistribution networks $ 38,060 $ 38,060 $ —Completed technologies 13,687 6,619 7,068Customer relationships 8,607 5,716 2,891Non-compete agreements 370 216 154
Balance as of December 31, 2018 $ 60,724 $ 50,611 $ 10,113
In connection with the acquisition of Sualab Co., Ltd. in the fourth quarter of 2019, the Company acquired in-process technologies valued at $8,200,000.In-process technology is an indefinite-lived intangible asset until the technology is f inalized, at which point it is amortized over its estimated useful life.Estimated amortization expense for each of the f ive succeeding f iscal years and thereafter is as follows (in thousands):
Year Ended December 31, Amount2020 $ 5,4122021 5,2322022 4,8622023 4,1602024 3,593Thereafter 8,031 $ 31,290
57
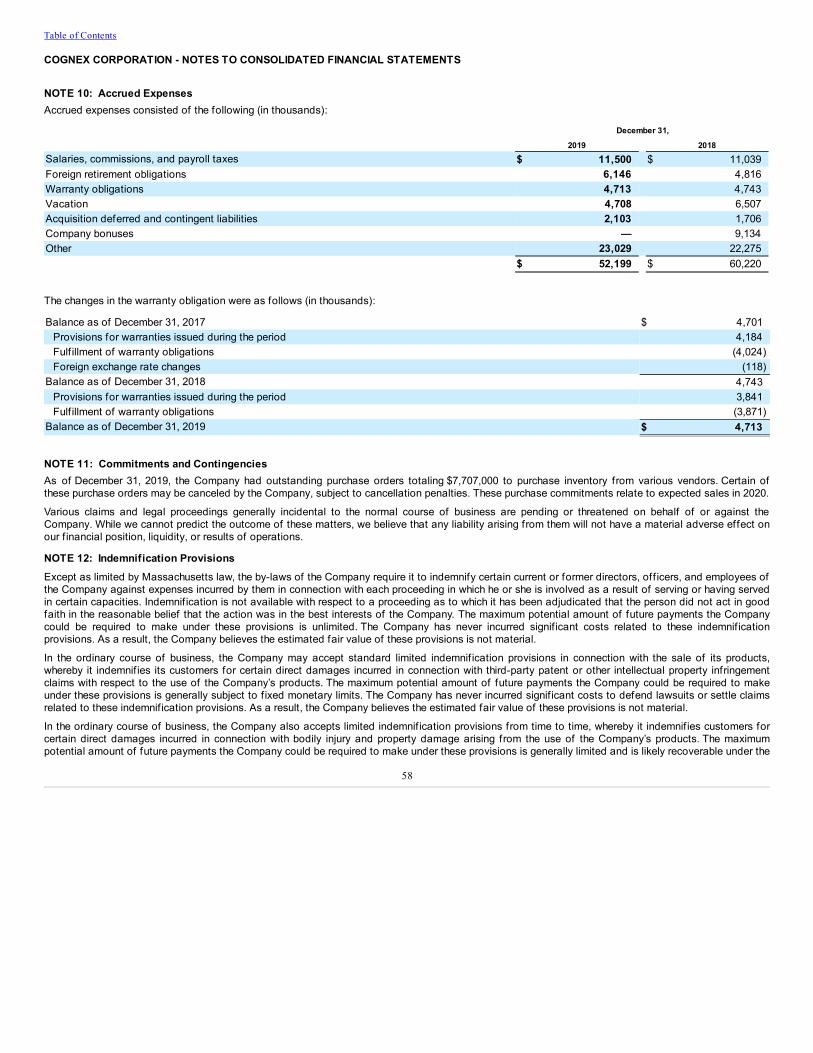
Table of Contents
COGNEX CORPORATION - NOTES TO CONSOLIDATED FINANCIAL STATEMENTS
NOTE 10: Accrued ExpensesAccrued expenses consisted of the following (in thousands):
December 31, 2019 2018Salaries, commissions, and payroll taxes $ 11,500 $ 11,039Foreign retirement obligations 6,146 4,816Warranty obligations 4,713 4,743Vacation 4,708 6,507Acquisition deferred and contingent liabilities 2,103 1,706Company bonuses — 9,134Other 23,029 22,275 $ 52,199 $ 60,220
The changes in the warranty obligation were as follows (in thousands):
Balance as of December 31, 2017 $ 4,701Provisions for warranties issued during the period 4,184Fulf illment of warranty obligations (4,024)Foreign exchange rate changes (118)
Balance as of December 31, 2018 4,743Provisions for warranties issued during the period 3,841Fulf illment of warranty obligations (3,871)
Balance as of December 31, 2019 $ 4,713
NOTE 11: Commitments and ContingenciesAs of December 31, 2019, the Company had outstanding purchase orders totaling $7,707,000 to purchase inventory from various vendors. Certain ofthese purchase orders may be canceled by the Company, subject to cancellation penalties. These purchase commitments relate to expected sales in 2020.
Various claims and legal proceedings generally incidental to the normal course of business are pending or threatened on behalf of or against theCompany. While we cannot predict the outcome of these matters, we believe that any liability arising from them will not have a material adverse effect onour f inancial position, liquidity, or results of operations.
NOTE 12: Indemnification ProvisionsExcept as limited by Massachusetts law, the by-laws of the Company require it to indemnify certain current or former directors, off icers, and employees ofthe Company against expenses incurred by them in connection with each proceeding in which he or she is involved as a result of serving or having servedin certain capacities. Indemnif ication is not available with respect to a proceeding as to which it has been adjudicated that the person did not act in goodfaith in the reasonable belief that the action was in the best interests of the Company. The maximum potential amount of future payments the Companycould be required to make under these provisions is unlimited. The Company has never incurred signif icant costs related to these indemnif icationprovisions. As a result, the Company believes the estimated fair value of these provisions is not material.
In the ordinary course of business, the Company may accept standard limited indemnif ication provisions in connection with the sale of its products,whereby it indemnif ies its customers for certain direct damages incurred in connection with third-party patent or other intellectual property infringementclaims with respect to the use of the Company’s products. The maximum potential amount of future payments the Company could be required to makeunder these provisions is generally subject to f ixed monetary limits. The Company has never incurred signif icant costs to defend lawsuits or settle claimsrelated to these indemnif ication provisions. As a result, the Company believes the estimated fair value of these provisions is not material.
In the ordinary course of business, the Company also accepts limited indemnif ication provisions from time to time, whereby it indemnif ies customers forcertain direct damages incurred in connection with bodily injury and property damage arising from the use of the Company’s products. The maximumpotential amount of future payments the Company could be required to make under these provisions is generally limited and is likely recoverable under the
58
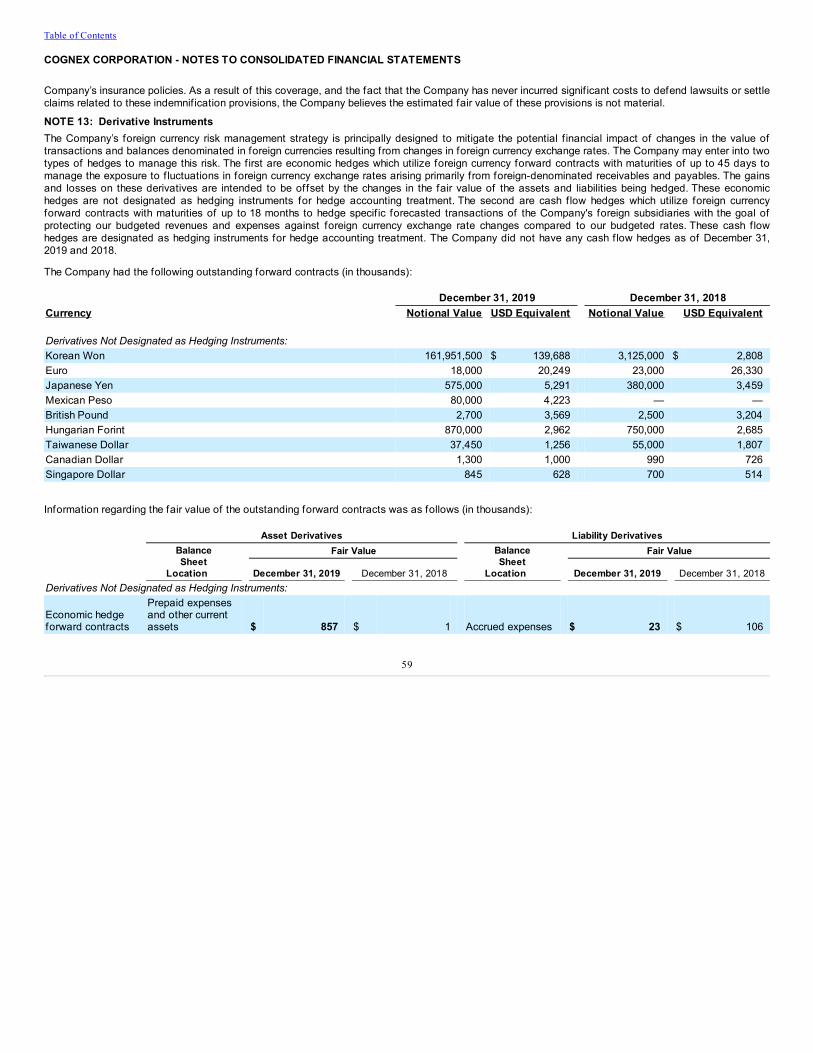
Table of Contents
COGNEX CORPORATION - NOTES TO CONSOLIDATED FINANCIAL STATEMENTS
Company’s insurance policies. As a result of this coverage, and the fact that the Company has never incurred signif icant costs to defend lawsuits or settleclaims related to these indemnif ication provisions, the Company believes the estimated fair value of these provisions is not material.
NOTE 13: Derivative InstrumentsThe Company’s foreign currency risk management strategy is principally designed to mitigate the potential f inancial impact of changes in the value oftransactions and balances denominated in foreign currencies resulting from changes in foreign currency exchange rates. The Company may enter into twotypes of hedges to manage this risk. The f irst are economic hedges which utilize foreign currency forward contracts with maturities of up to 45 days tomanage the exposure to f luctuations in foreign currency exchange rates arising primarily from foreign-denominated receivables and payables. The gainsand losses on these derivatives are intended to be offset by the changes in the fair value of the assets and liabilities being hedged. These economichedges are not designated as hedging instruments for hedge accounting treatment. The second are cash f low hedges which utilize foreign currencyforward contracts with maturities of up to 18 months to hedge specif ic forecasted transactions of the Company's foreign subsidiaries with the goal ofprotecting our budgeted revenues and expenses against foreign currency exchange rate changes compared to our budgeted rates. These cash f lowhedges are designated as hedging instruments for hedge accounting treatment. The Company did not have any cash f low hedges as of December 31,2019 and 2018.
The Company had the following outstanding forward contracts (in thousands):
December 31, 2019 December 31, 2018Currency Notional Value USD Equivalent Notional Value USD Equivalent Derivatives Not Designated as Hedging Instruments:Korean Won 161,951,500 $ 139,688 3,125,000 $ 2,808Euro 18,000 20,249 23,000 26,330Japanese Yen 575,000 5,291 380,000 3,459Mexican Peso 80,000 4,223 — —British Pound 2,700 3,569 2,500 3,204Hungarian Forint 870,000 2,962 750,000 2,685Taiwanese Dollar 37,450 1,256 55,000 1,807Canadian Dollar 1,300 1,000 990 726Singapore Dollar 845 628 700 514
Information regarding the fair value of the outstanding forward contracts was as follows (in thousands):
Asset Derivatives Liability Derivatives Balance
SheetLocation
Fair Value BalanceSheet
Location
Fair Value
December 31, 2019 December 31, 2018 December 31, 2019 December 31, 2018Derivatives Not Designated as Hedging Instruments:
Economic hedgeforward contracts
Prepaid expensesand other currentassets $ 857 $ 1 Accrued expenses $ 23 $ 106
59
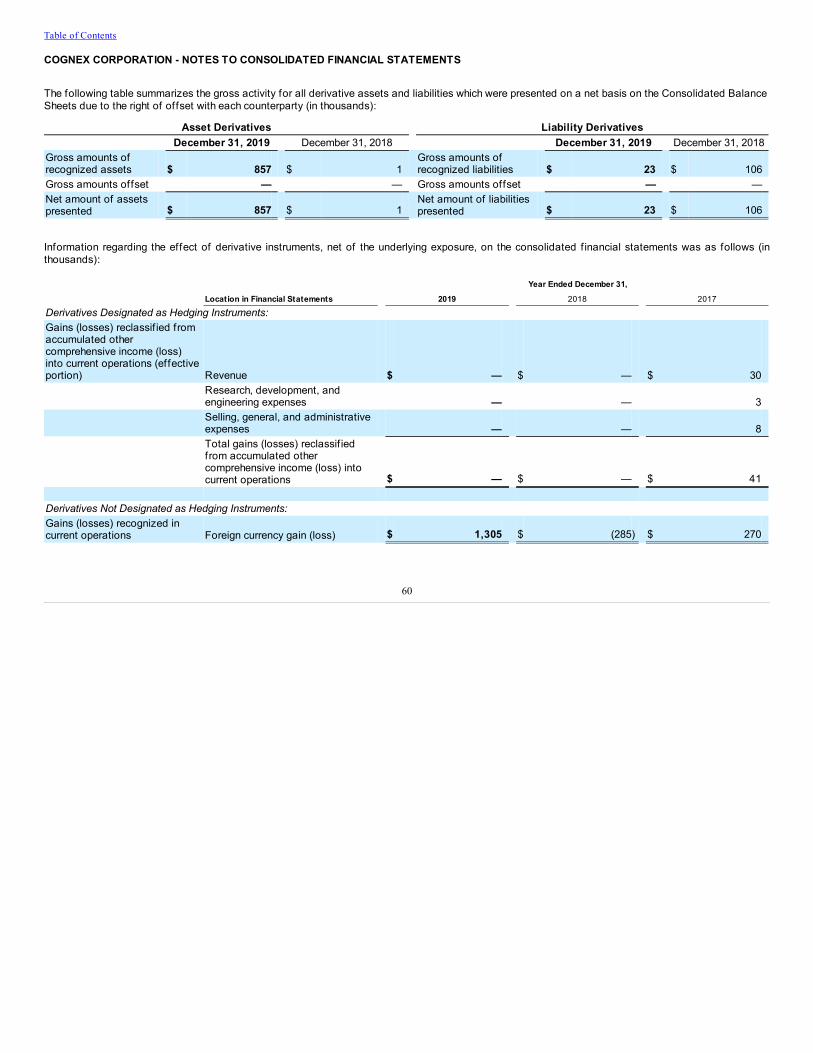
Table of Contents
COGNEX CORPORATION - NOTES TO CONSOLIDATED FINANCIAL STATEMENTS
The following table summarizes the gross activity for all derivative assets and liabilities which were presented on a net basis on the Consolidated BalanceSheets due to the right of offset with each counterparty (in thousands):
Asset Derivatives Liability Derivatives December 31, 2019 December 31, 2018 December 31, 2019 December 31, 2018Gross amounts ofrecognized assets $ 857 $ 1
Gross amounts ofrecognized liabilities $ 23 $ 106
Gross amounts offset — — Gross amounts offset — —Net amount of assetspresented $ 857 $ 1
Net amount of liabilitiespresented $ 23 $ 106
Information regarding the effect of derivative instruments, net of the underlying exposure, on the consolidated f inancial statements was as follows (inthousands):
Location in Financial Statements Year Ended December 31,
2019 2018 2017
Derivatives Designated as Hedging Instruments:Gains (losses) reclassif ied fromaccumulated othercomprehensive income (loss)into current operations (effectiveportion) Revenue $ — $ — $ 30
Research, development, andengineering expenses — — 3
Selling, general, and administrativeexpenses — — 8
Total gains (losses) reclassif iedfrom accumulated othercomprehensive income (loss) intocurrent operations $ — $ — $ 41
Derivatives Not Designated as Hedging Instruments:Gains (losses) recognized incurrent operations Foreign currency gain (loss) $ 1,305 $ (285) $ 270
60
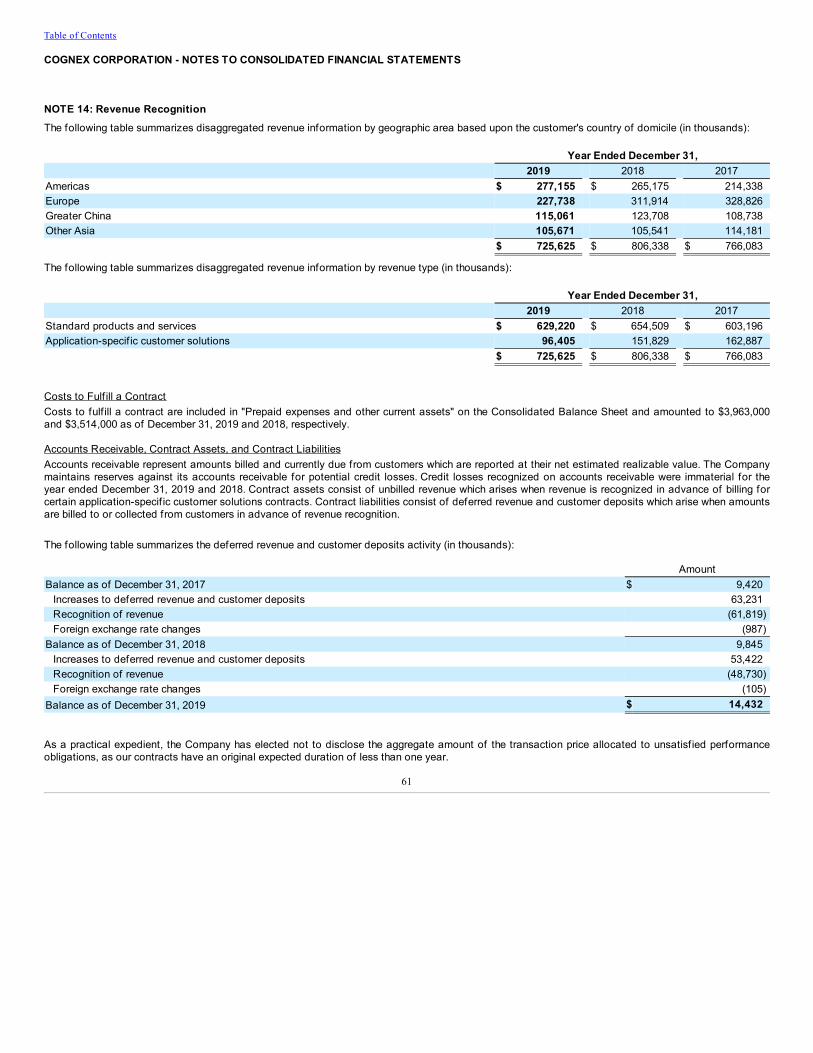
Table of Contents
COGNEX CORPORATION - NOTES TO CONSOLIDATED FINANCIAL STATEMENTS
NOTE 14: Revenue RecognitionThe following table summarizes disaggregated revenue information by geographic area based upon the customer's country of domicile (in thousands):
Year Ended December 31, 2019 2018 2017Americas $ 277,155 $ 265,175 214,338Europe 227,738 311,914 328,826Greater China 115,061 123,708 108,738Other Asia 105,671 105,541 114,181 $ 725,625 $ 806,338 $ 766,083
The following table summarizes disaggregated revenue information by revenue type (in thousands):
Year Ended December 31, 2019 2018 2017Standard products and services $ 629,220 $ 654,509 $ 603,196Application-specif ic customer solutions 96,405 151,829 162,887 $ 725,625 $ 806,338 $ 766,083
Costs to Fulf ill a ContractCosts to fulf ill a contract are included in "Prepaid expenses and other current assets" on the Consolidated Balance Sheet and amounted to $3,963,000and $3,514,000 as of December 31, 2019 and 2018, respectively.
Accounts Receivable, Contract Assets, and Contract LiabilitiesAccounts receivable represent amounts billed and currently due from customers which are reported at their net estimated realizable value. The Companymaintains reserves against its accounts receivable for potential credit losses. Credit losses recognized on accounts receivable were immaterial for theyear ended December 31, 2019 and 2018. Contract assets consist of unbilled revenue which arises when revenue is recognized in advance of billing forcertain application-specif ic customer solutions contracts. Contract liabilities consist of deferred revenue and customer deposits which arise when amountsare billed to or collected from customers in advance of revenue recognition.
The following table summarizes the deferred revenue and customer deposits activity (in thousands):
AmountBalance as of December 31, 2017 $ 9,420
Increases to deferred revenue and customer deposits 63,231Recognition of revenue (61,819)Foreign exchange rate changes (987)
Balance as of December 31, 2018 9,845Increases to deferred revenue and customer deposits 53,422Recognition of revenue (48,730)Foreign exchange rate changes (105)
Balance as of December 31, 2019 $ 14,432
As a practical expedient, the Company has elected not to disclose the aggregate amount of the transaction price allocated to unsatisf ied performanceobligations, as our contracts have an original expected duration of less than one year.
61
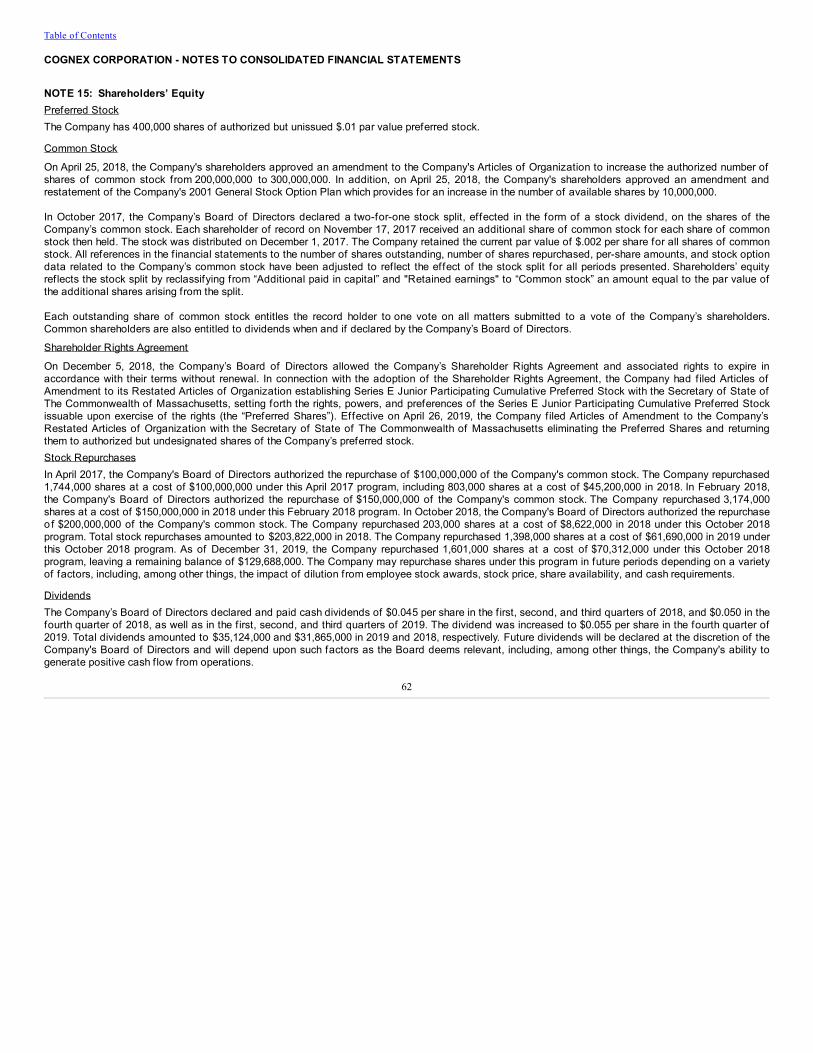
Table of Contents
COGNEX CORPORATION - NOTES TO CONSOLIDATED FINANCIAL STATEMENTS
NOTE 15: Shareholders’ EquityPreferred StockThe Company has 400,000 shares of authorized but unissued $.01 par value preferred stock.
Common Stock
On April 25, 2018, the Company's shareholders approved an amendment to the Company's Articles of Organization to increase the authorized number ofshares of common stock from 200,000,000 to 300,000,000. In addition, on April 25, 2018, the Company's shareholders approved an amendment andrestatement of the Company's 2001 General Stock Option Plan which provides for an increase in the number of available shares by 10,000,000.
In October 2017, the Company’s Board of Directors declared a two-for-one stock split, effected in the form of a stock dividend, on the shares of theCompany’s common stock. Each shareholder of record on November 17, 2017 received an additional share of common stock for each share of commonstock then held. The stock was distributed on December 1, 2017. The Company retained the current par value of $.002 per share for all shares of commonstock. All references in the f inancial statements to the number of shares outstanding, number of shares repurchased, per-share amounts, and stock optiondata related to the Company’s common stock have been adjusted to ref lect the effect of the stock split for all periods presented. Shareholders’ equityreflects the stock split by reclassifying from “Additional paid in capital” and "Retained earnings" to “Common stock” an amount equal to the par value ofthe additional shares arising from the split.
Each outstanding share of common stock entitles the record holder to one vote on all matters submitted to a vote of the Company’s shareholders.Common shareholders are also entitled to dividends when and if declared by the Company’s Board of Directors.
Shareholder Rights Agreement
On December 5, 2018, the Company’s Board of Directors allowed the Company’s Shareholder Rights Agreement and associated rights to expire inaccordance with their terms without renewal. In connection with the adoption of the Shareholder Rights Agreement, the Company had f iled Articles ofAmendment to its Restated Articles of Organization establishing Series E Junior Participating Cumulative Preferred Stock with the Secretary of State ofThe Commonwealth of Massachusetts, setting forth the rights, powers, and preferences of the Series E Junior Participating Cumulative Preferred Stockissuable upon exercise of the rights (the “Preferred Shares”). Effective on April 26, 2019, the Company f iled Articles of Amendment to the Company’sRestated Articles of Organization with the Secretary of State of The Commonwealth of Massachusetts eliminating the Preferred Shares and returningthem to authorized but undesignated shares of the Company’s preferred stock.Stock RepurchasesIn April 2017, the Company's Board of Directors authorized the repurchase of $100,000,000 of the Company's common stock. The Company repurchased1,744,000 shares at a cost of $100,000,000 under this April 2017 program, including 803,000 shares at a cost of $45,200,000 in 2018. In February 2018,the Company's Board of Directors authorized the repurchase of $150,000,000 of the Company's common stock. The Company repurchased 3,174,000shares at a cost of $150,000,000 in 2018 under this February 2018 program. In October 2018, the Company's Board of Directors authorized the repurchaseo f $200,000,000 of the Company's common stock. The Company repurchased 203,000 shares at a cost of $8,622,000 in 2018 under this October 2018program. Total stock repurchases amounted to $203,822,000 in 2018. The Company repurchased 1,398,000 shares at a cost of $61,690,000 in 2019 underthis October 2018 program. As of December 31, 2019, the Company repurchased 1,601,000 shares at a cost of $70,312,000 under this October 2018program, leaving a remaining balance of $129,688,000. The Company may repurchase shares under this program in future periods depending on a varietyof factors, including, among other things, the impact of dilution from employee stock awards, stock price, share availability, and cash requirements.
DividendsThe Company’s Board of Directors declared and paid cash dividends of $0.045 per share in the f irst, second, and third quarters of 2018, and $0.050 in thefourth quarter of 2018, as well as in the f irst, second, and third quarters of 2019. The dividend was increased to $0.055 per share in the fourth quarter of2019. Total dividends amounted to $35,124,000 and $31,865,000 in 2019 and 2018, respectively. Future dividends will be declared at the discretion of theCompany's Board of Directors and will depend upon such factors as the Board deems relevant, including, among other things, the Company's ability togenerate positive cash f low from operations.
62
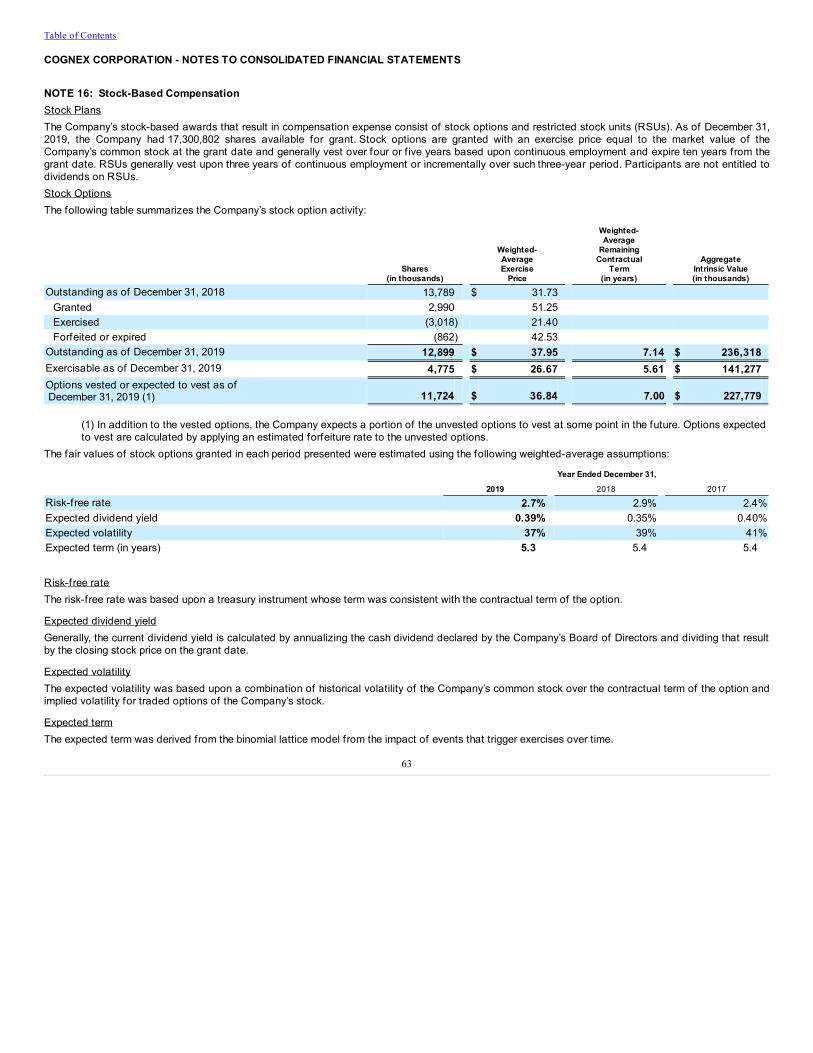
Table of Contents
COGNEX CORPORATION - NOTES TO CONSOLIDATED FINANCIAL STATEMENTS
NOTE 16: Stock-Based CompensationStock PlansThe Company’s stock-based awards that result in compensation expense consist of stock options and restricted stock units (RSUs). As of December 31,2019, the Company had 17,300,802 shares available for grant. Stock options are granted with an exercise price equal to the market value of theCompany’s common stock at the grant date and generally vest over four or f ive years based upon continuous employment and expire ten years from thegrant date. RSUs generally vest upon three years of continuous employment or incrementally over such three-year period. Participants are not entitled todividends on RSUs.Stock OptionsThe following table summarizes the Company’s stock option activity:
Shares
(in thousands)
Weighted-AverageExercise
Price
Weighted-Average
RemainingContractual
Term(in years)
AggregateIntrinsic Value(in thousands)
Outstanding as of December 31, 2018 13,789 $ 31.73 Granted 2,990 51.25 Exercised (3,018) 21.40 Forfeited or expired (862) 42.53
Outstanding as of December 31, 2019 12,899 $ 37.95 7.14 $ 236,318Exercisable as of December 31, 2019 4,775 $ 26.67 5.61 $ 141,277Options vested or expected to vest as of December 31, 2019 (1) 11,724 $ 36.84 7.00 $ 227,779
(1) In addition to the vested options, the Company expects a portion of the unvested options to vest at some point in the future. Options expectedto vest are calculated by applying an estimated forfeiture rate to the unvested options.
The fair values of stock options granted in each period presented were estimated using the following weighted-average assumptions:
Year Ended December 31,
2019 2018 2017
Risk-free rate 2.7% 2.9% 2.4%Expected dividend yield 0.39% 0.35% 0.40%Expected volatility 37% 39% 41%Expected term (in years) 5.3 5.4 5.4
Risk-free rateThe risk-free rate was based upon a treasury instrument whose term was consistent with the contractual term of the option.
Expected dividend yieldGenerally, the current dividend yield is calculated by annualizing the cash dividend declared by the Company’s Board of Directors and dividing that resultby the closing stock price on the grant date.
Expected volatilityThe expected volatility was based upon a combination of historical volatility of the Company’s common stock over the contractual term of the option andimplied volatility for traded options of the Company’s stock.
Expected termThe expected term was derived from the binomial lattice model from the impact of events that trigger exercises over time.
63
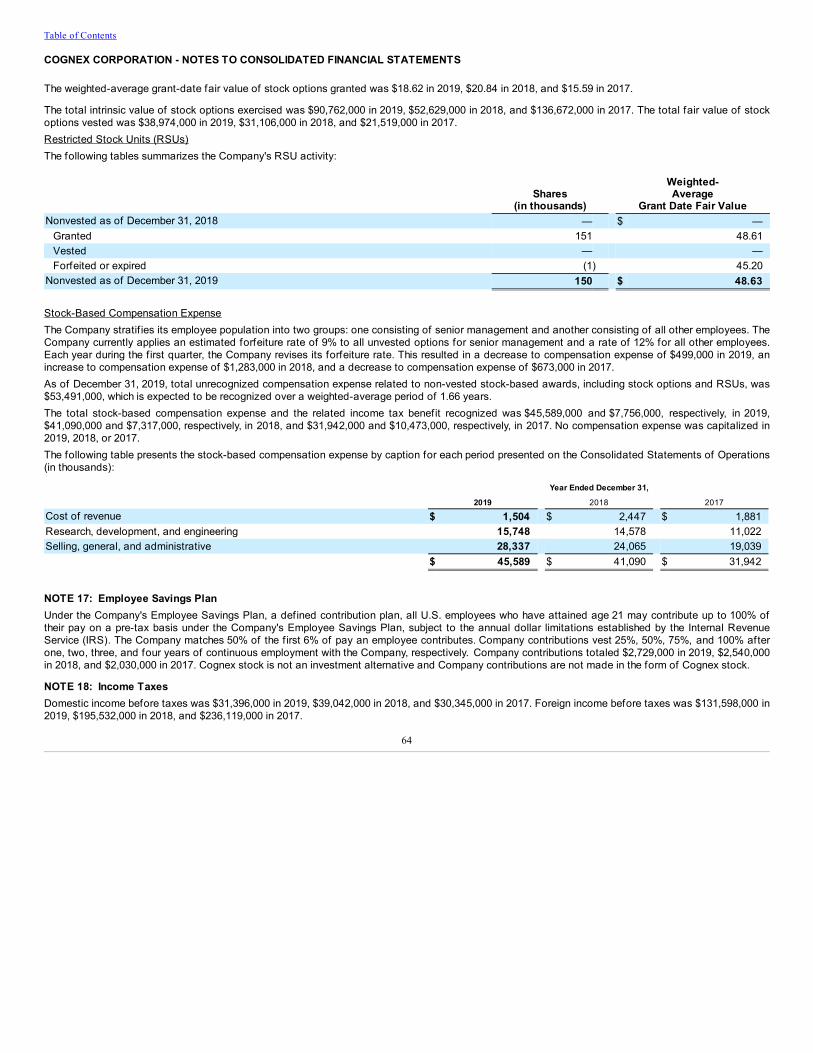
Table of Contents
COGNEX CORPORATION - NOTES TO CONSOLIDATED FINANCIAL STATEMENTS
The weighted-average grant-date fair value of stock options granted was $18.62 in 2019, $20.84 in 2018, and $15.59 in 2017.
The total intrinsic value of stock options exercised was $90,762,000 in 2019, $52,629,000 in 2018, and $136,672,000 in 2017. The total fair value of stockoptions vested was $38,974,000 in 2019, $31,106,000 in 2018, and $21,519,000 in 2017.Restricted Stock Units (RSUs)The following tables summarizes the Company's RSU activity:
Shares
(in thousands)
Weighted-Average
Grant Date Fair ValueNonvested as of December 31, 2018 — $ —
Granted 151 48.61Vested — —Forfeited or expired (1) 45.20
Nonvested as of December 31, 2019 150 $ 48.63
Stock-Based Compensation ExpenseThe Company stratif ies its employee population into two groups: one consisting of senior management and another consisting of all other employees. TheCompany currently applies an estimated forfeiture rate of 9% to all unvested options for senior management and a rate of 12% for all other employees.Each year during the f irst quarter, the Company revises its forfeiture rate. This resulted in a decrease to compensation expense of $499,000 in 2019, anincrease to compensation expense of $1,283,000 in 2018, and a decrease to compensation expense of $673,000 in 2017.As of December 31, 2019, total unrecognized compensation expense related to non-vested stock-based awards, including stock options and RSUs, was$53,491,000, which is expected to be recognized over a weighted-average period of 1.66 years.The total stock-based compensation expense and the related income tax benefit recognized was $45,589,000 and $7,756,000, respectively, in 2019,$41,090,000 and $7,317,000, respectively, in 2018, and $31,942,000 and $10,473,000, respectively, in 2017. No compensation expense was capitalized in2019, 2018, or 2017.The following table presents the stock-based compensation expense by caption for each period presented on the Consolidated Statements of Operations(in thousands):
Year Ended December 31,
2019 2018 2017
Cost of revenue $ 1,504 $ 2,447 $ 1,881Research, development, and engineering 15,748 14,578 11,022Selling, general, and administrative 28,337 24,065 19,039 $ 45,589 $ 41,090 $ 31,942
NOTE 17: Employee Savings PlanUnder the Company's Employee Savings Plan, a defined contribution plan, all U.S. employees who have attained age 21 may contribute up to 100% oftheir pay on a pre-tax basis under the Company's Employee Savings Plan, subject to the annual dollar limitations established by the Internal RevenueService (IRS). The Company matches 50% of the f irst 6% of pay an employee contributes. Company contributions vest 25%, 50%, 75%, and 100% afterone, two, three, and four years of continuous employment with the Company, respectively. Company contributions totaled $2,729,000 in 2019, $2,540,000in 2018, and $2,030,000 in 2017. Cognex stock is not an investment alternative and Company contributions are not made in the form of Cognex stock.
NOTE 18: Income TaxesDomestic income before taxes was $31,396,000 in 2019, $39,042,000 in 2018, and $30,345,000 in 2017. Foreign income before taxes was $131,598,000 in2019, $195,532,000 in 2018, and $236,119,000 in 2017.
64
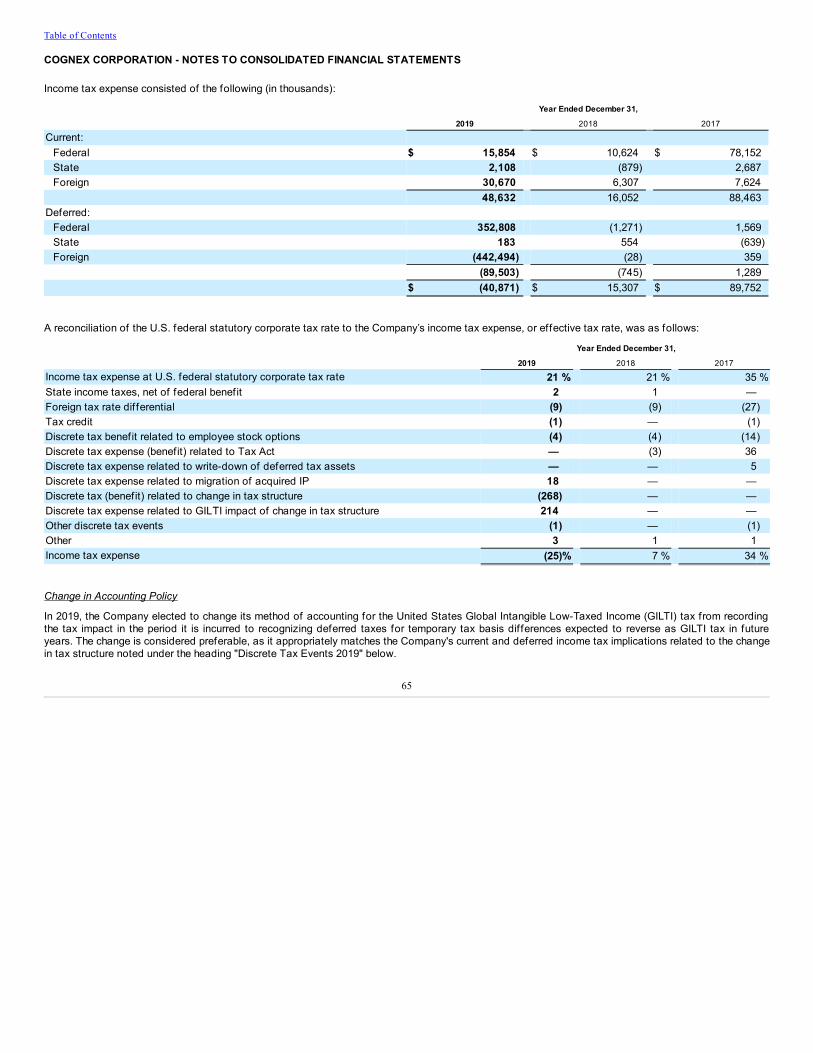
Table of Contents
COGNEX CORPORATION - NOTES TO CONSOLIDATED FINANCIAL STATEMENTS
Income tax expense consisted of the following (in thousands):
Year Ended December 31,
2019 2018 2017
Current: Federal $ 15,854 $ 10,624 $ 78,152State 2,108 (879) 2,687Foreign 30,670 6,307 7,624
48,632 16,052 88,463Deferred:
Federal 352,808 (1,271) 1,569State 183 554 (639)Foreign (442,494) (28) 359
(89,503) (745) 1,289 $ (40,871) $ 15,307 $ 89,752
A reconciliation of the U.S. federal statutory corporate tax rate to the Company’s income tax expense, or effective tax rate, was as follows:
Year Ended December 31,
2019 2018 2017
Income tax expense at U.S. federal statutory corporate tax rate 21 % 21 % 35 %State income taxes, net of federal benefit 2 1 —Foreign tax rate dif ferential (9) (9) (27)Tax credit (1) — (1)Discrete tax benefit related to employee stock options (4) (4) (14)Discrete tax expense (benefit) related to Tax Act — (3) 36Discrete tax expense related to write-down of deferred tax assets — — 5Discrete tax expense related to migration of acquired IP 18 — —Discrete tax (benefit) related to change in tax structure (268) — —Discrete tax expense related to GILTI impact of change in tax structure 214 — —Other discrete tax events (1) — (1)Other 3 1 1Income tax expense (25)% 7 % 34 %
Change in Accounting Policy
In 2019, the Company elected to change its method of accounting for the United States Global Intangible Low-Taxed Income (GILTI) tax from recordingthe tax impact in the period it is incurred to recognizing deferred taxes for temporary tax basis dif ferences expected to reverse as GILTI tax in futureyears. The change is considered preferable, as it appropriately matches the Company's current and deferred income tax implications related to the changein tax structure noted under the heading "Discrete Tax Events 2019" below.
65
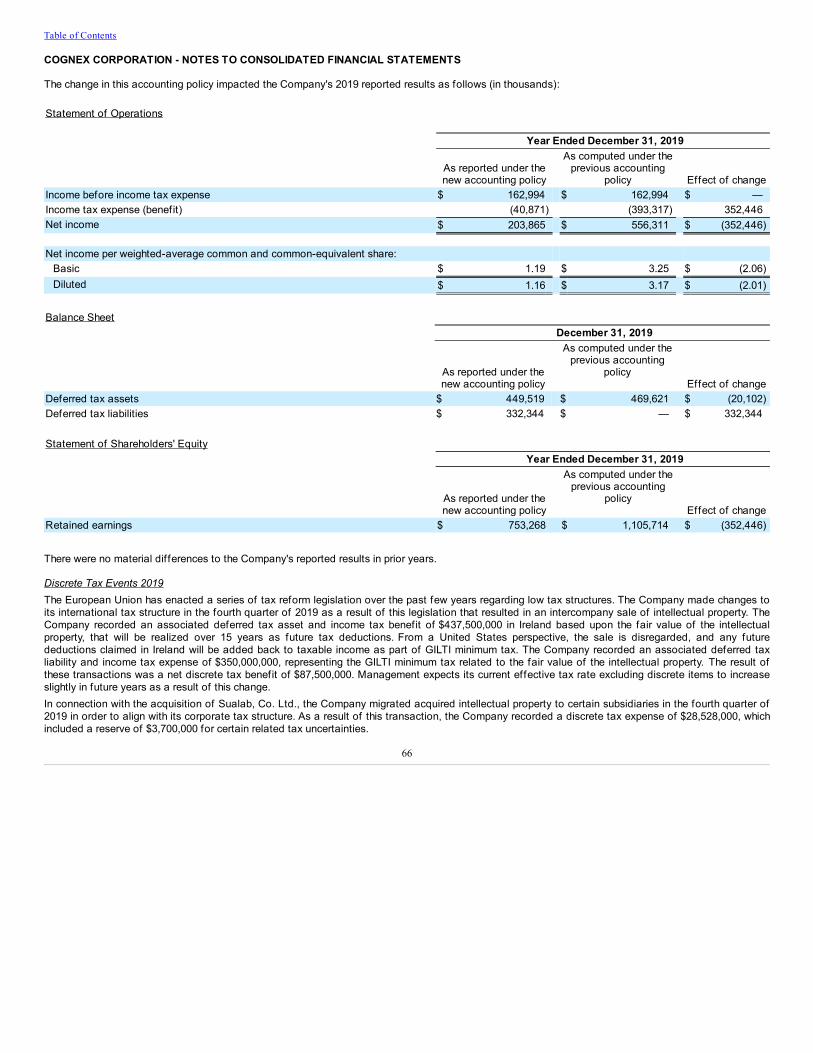
Table of Contents
COGNEX CORPORATION - NOTES TO CONSOLIDATED FINANCIAL STATEMENTS
The change in this accounting policy impacted the Company's 2019 reported results as follows (in thousands):
Statement of Operations
Year Ended December 31, 2019
As reported under thenew accounting policy
As computed under theprevious accounting
policy Effect of changeIncome before income tax expense $ 162,994 $ 162,994 $ —Income tax expense (benefit) (40,871) (393,317) 352,446Net income $ 203,865 $ 556,311 $ (352,446) Net income per weighted-average common and common-equivalent share:
Basic $ 1.19 $ 3.25 $ (2.06)Diluted $ 1.16 $ 3.17 $ (2.01)
Balance Sheet December 31, 2019
As reported under thenew accounting policy
As computed under theprevious accounting
policy Effect of change
Deferred tax assets $ 449,519 $ 469,621 $ (20,102)Deferred tax liabilities $ 332,344 $ — $ 332,344
Statement of Shareholders' Equity Year Ended December 31, 2019
As reported under thenew accounting policy
As computed under theprevious accounting
policy Effect of change
Retained earnings $ 753,268 $ 1,105,714 $ (352,446)
There were no material dif ferences to the Company's reported results in prior years.
Discrete Tax Events 2019The European Union has enacted a series of tax reform legislation over the past few years regarding low tax structures. The Company made changes toits international tax structure in the fourth quarter of 2019 as a result of this legislation that resulted in an intercompany sale of intellectual property. TheCompany recorded an associated deferred tax asset and income tax benefit of $437,500,000 in Ireland based upon the fair value of the intellectualproperty, that will be realized over 15 years as future tax deductions. From a United States perspective, the sale is disregarded, and any futuredeductions claimed in Ireland will be added back to taxable income as part of GILTI minimum tax. The Company recorded an associated deferred taxliability and income tax expense of $350,000,000, representing the GILTI minimum tax related to the fair value of the intellectual property. The result ofthese transactions was a net discrete tax benefit of $87,500,000. Management expects its current effective tax rate excluding discrete items to increaseslightly in future years as a result of this change.In connection with the acquisition of Sualab, Co. Ltd., the Company migrated acquired intellectual property to certain subsidiaries in the fourth quarter of2019 in order to align with its corporate tax structure. As a result of this transaction, the Company recorded a discrete tax expense of $28,528,000, whichincluded a reserve of $3,700,000 for certain related tax uncertainties.
66
Table of Contents
COGNEX CORPORATION - NOTES TO CONSOLIDATED FINANCIAL STATEMENTS
The Tax ActIn December 2017, the Tax Cuts and Jobs Act of 2017 (Tax Act) was signed into law. The Tax Act resulted in a decrease in the U.S. federal statutorycorporate tax rate from 35% to 21%. As a result of the reduction in anticipated tax rate, the Company remeasured its deferred tax positions as ofDecember 31, 2017 at the new enacted tax rate, and accordingly, recorded tax expense of $12,523,000 in 2017 from the associated write-down of itsdeferred tax assets. In 2018, the Company recorded an increase in tax expense of $3,240,000 from the write-down of its deferred tax assets primarilyrelating to guidance under the Tax Act regarding stock-based compensation.
The Tax Act subjects unrepatriated foreign earnings to a one-time transition tax, regardless of the Company's f inancial statement assertion related toindefinite reinvestment or whether the Company ultimately repatriates any of the foreign earnings, for which the Company recorded estimated tax expenseof $101,379,000 in 2017. In 2018, the Company revised its estimate of the one-time transition tax and recorded a decrease in tax expense of $11,028,000,which resulted in a revised estimate for the one-time transition tax of $90,351,000.
The Tax Act replaces the current system of taxing U.S. corporations on repatriated foreign earnings with a partial territorial system that provides a 100%dividends-received deduction to domestic corporations for foreign-source dividends received from 10% or more owned foreign corporations. TheCompany recorded a decrease in tax expense of $3,843,000 in 2017 from the reversal of the tax effect of a 2016 dividend paid in 2017 from a wholly-owned foreign subsidiary to its domestic entity.Other Discrete Tax Events
The effective tax rate also included a decrease in tax expense of $6,472,000 in 2019, $8,488,000 in 2018, and $38,569,000 in 2017 related to stockoptions, primarily from the excess tax benefit arising from the difference between the deduction for tax purposes and the compensation cost recognizedfor f inancial reporting purposes from stock option exercises. The Company cannot predict the level of stock option exercises by employees in futureperiods.
Other discrete tax events included a net decrease in tax expense of $1,932,000 in 2019, $1,847,000 in 2018, and $2,502,000 in 2017, consisting primarilyof the expiration of the statutes of limitations for certain reserves for income tax uncertainties and the f inal true-up of the prior year's tax accrual uponfiling the related tax returns.
The Company is tax resident in numerous jurisdictions around the world and has identif ied its major tax jurisdictions as the United States, Ireland, andChina. Management has determined that earnings from its legal entity in China will remain indefinitely reinvested to provide local funding for growth, andthat earnings from all other jurisdictions will not be indefinitely reinvested. As of December 31, 2019 and 2018, $370,953,000 and $446,346,000,respectively, of the Company’s cash, cash equivalents, and investments were held by foreign subsidiaries and were primarily denominated in U.S. Dollars.
Interest and penalties included in income tax expense were $116,000, $91,000, and $71,000 in 2019, 2018, and 2017, respectively.On January 1, 2018, the Company adopted Accounting Standard Update (ASU) 2016-16, "Income Taxes - Intra-Entity Transfers of Assets Other thanInventory." This ASU requires the recognition of deferred income taxes for an intra-entity transfer of an asset other than inventory. As a result of this ASU,the Company recorded $5,961,000 through a cumulative-effect adjustment directly to retained earnings at the beginning of f iscal year 2018.
67
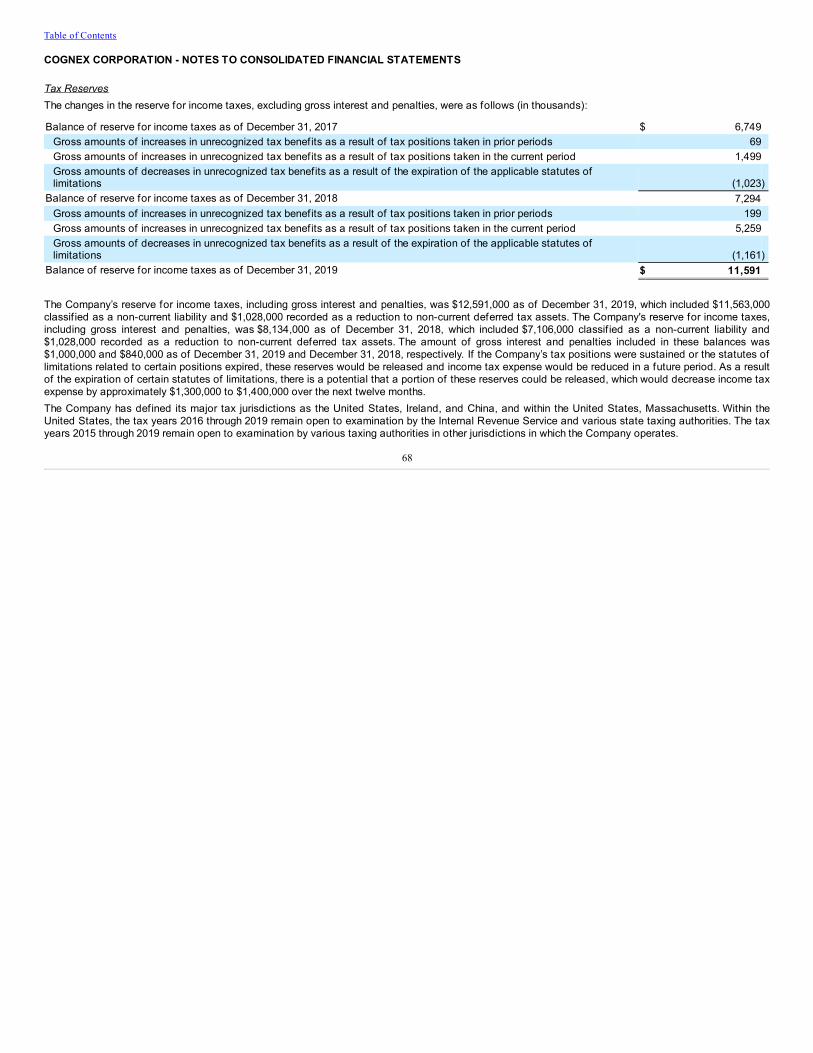
Table of Contents
COGNEX CORPORATION - NOTES TO CONSOLIDATED FINANCIAL STATEMENTS
Tax ReservesThe changes in the reserve for income taxes, excluding gross interest and penalties, were as follows (in thousands):
Balance of reserve for income taxes as of December 31, 2017 $ 6,749Gross amounts of increases in unrecognized tax benefits as a result of tax positions taken in prior periods 69Gross amounts of increases in unrecognized tax benefits as a result of tax positions taken in the current period 1,499Gross amounts of decreases in unrecognized tax benefits as a result of the expiration of the applicable statutes oflimitations (1,023)
Balance of reserve for income taxes as of December 31, 2018 7,294Gross amounts of increases in unrecognized tax benefits as a result of tax positions taken in prior periods 199Gross amounts of increases in unrecognized tax benefits as a result of tax positions taken in the current period 5,259Gross amounts of decreases in unrecognized tax benefits as a result of the expiration of the applicable statutes oflimitations (1,161)
Balance of reserve for income taxes as of December 31, 2019 $ 11,591
The Company’s reserve for income taxes, including gross interest and penalties, was $12,591,000 as of December 31, 2019, which included $11,563,000classif ied as a non-current liability and $1,028,000 recorded as a reduction to non-current deferred tax assets. The Company's reserve for income taxes,including gross interest and penalties, was $8,134,000 as of December 31, 2018, which included $7,106,000 classif ied as a non-current liability and$1,028,000 recorded as a reduction to non-current deferred tax assets. The amount of gross interest and penalties included in these balances was$1,000,000 and $840,000 as of December 31, 2019 and December 31, 2018, respectively. If the Company’s tax positions were sustained or the statutes oflimitations related to certain positions expired, these reserves would be released and income tax expense would be reduced in a future period. As a resultof the expiration of certain statutes of limitations, there is a potential that a portion of these reserves could be released, which would decrease income taxexpense by approximately $1,300,000 to $1,400,000 over the next twelve months.The Company has defined its major tax jurisdictions as the United States, Ireland, and China, and within the United States, Massachusetts. Within theUnited States, the tax years 2016 through 2019 remain open to examination by the Internal Revenue Service and various state taxing authorities. The taxyears 2015 through 2019 remain open to examination by various taxing authorities in other jurisdictions in which the Company operates.
68
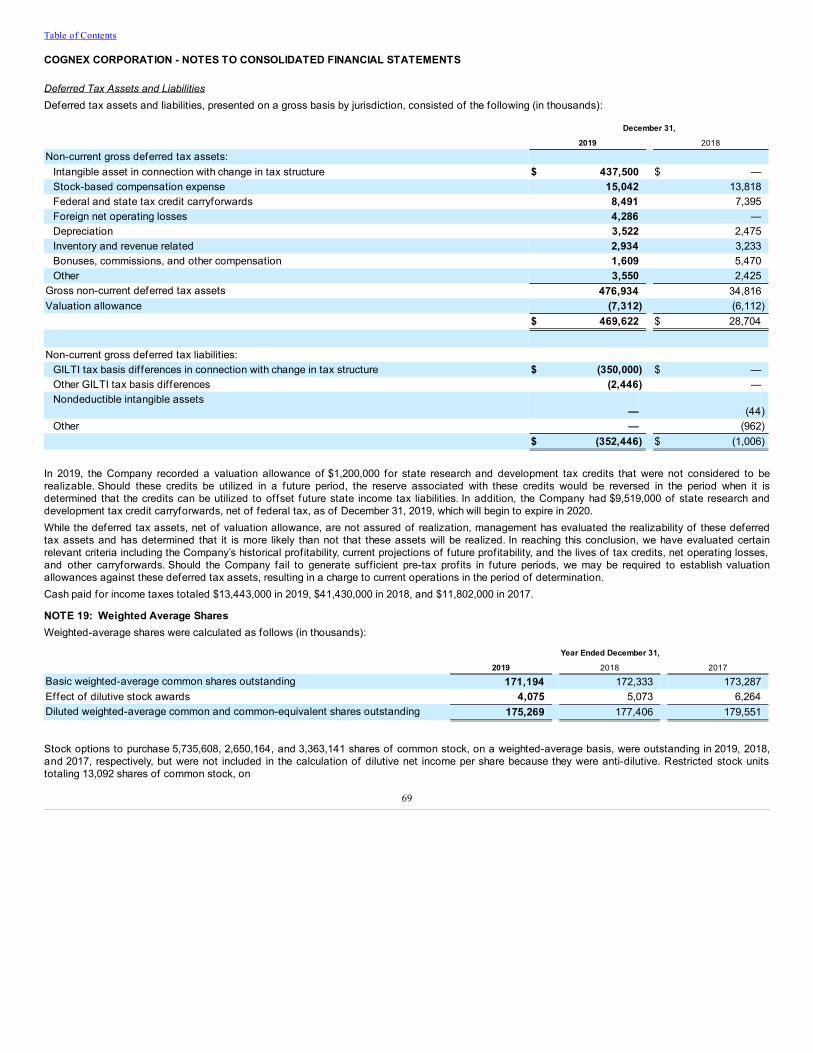
Table of Contents
COGNEX CORPORATION - NOTES TO CONSOLIDATED FINANCIAL STATEMENTS
Deferred Tax Assets and LiabilitiesDeferred tax assets and liabilities, presented on a gross basis by jurisdiction, consisted of the following (in thousands):
December 31,
2019 2018
Non-current gross deferred tax assets: Intangible asset in connection with change in tax structure $ 437,500 $ —Stock-based compensation expense 15,042 13,818Federal and state tax credit carryforwards 8,491 7,395Foreign net operating losses 4,286 —Depreciation 3,522 2,475Inventory and revenue related 2,934 3,233Bonuses, commissions, and other compensation 1,609 5,470Other 3,550 2,425
Gross non-current deferred tax assets 476,934 34,816Valuation allowance (7,312) (6,112) $ 469,622 $ 28,704 Non-current gross deferred tax liabilities:
GILTI tax basis dif ferences in connection with change in tax structure $ (350,000) $ —Other GILTI tax basis dif ferences (2,446) —Nondeductible intangible assets
— (44)Other — (962)
$ (352,446) $ (1,006)
In 2019, the Company recorded a valuation allowance of $1,200,000 for state research and development tax credits that were not considered to berealizable. Should these credits be utilized in a future period, the reserve associated with these credits would be reversed in the period when it isdetermined that the credits can be utilized to offset future state income tax liabilities. In addition, the Company had $9,519,000 of state research anddevelopment tax credit carryforwards, net of federal tax, as of December 31, 2019, which will begin to expire in 2020.While the deferred tax assets, net of valuation allowance, are not assured of realization, management has evaluated the realizability of these deferredtax assets and has determined that it is more likely than not that these assets will be realized. In reaching this conclusion, we have evaluated certainrelevant criteria including the Company’s historical profitability, current projections of future profitability, and the lives of tax credits, net operating losses,and other carryforwards. Should the Company fail to generate suff icient pre-tax profits in future periods, we may be required to establish valuationallowances against these deferred tax assets, resulting in a charge to current operations in the period of determination.Cash paid for income taxes totaled $13,443,000 in 2019, $41,430,000 in 2018, and $11,802,000 in 2017.
NOTE 19: Weighted Average SharesWeighted-average shares were calculated as follows (in thousands):
Year Ended December 31, 2019 2018 2017
Basic weighted-average common shares outstanding 171,194 172,333 173,287Effect of dilutive stock awards 4,075 5,073 6,264Diluted weighted-average common and common-equivalent shares outstanding 175,269 177,406 179,551
Stock options to purchase 5,735,608, 2,650,164, and 3,363,141 shares of common stock, on a weighted-average basis, were outstanding in 2019, 2018,and 2017, respectively, but were not included in the calculation of dilutive net income per share because they were anti-dilutive. Restricted stock unitstotaling 13,092 shares of common stock, on
69
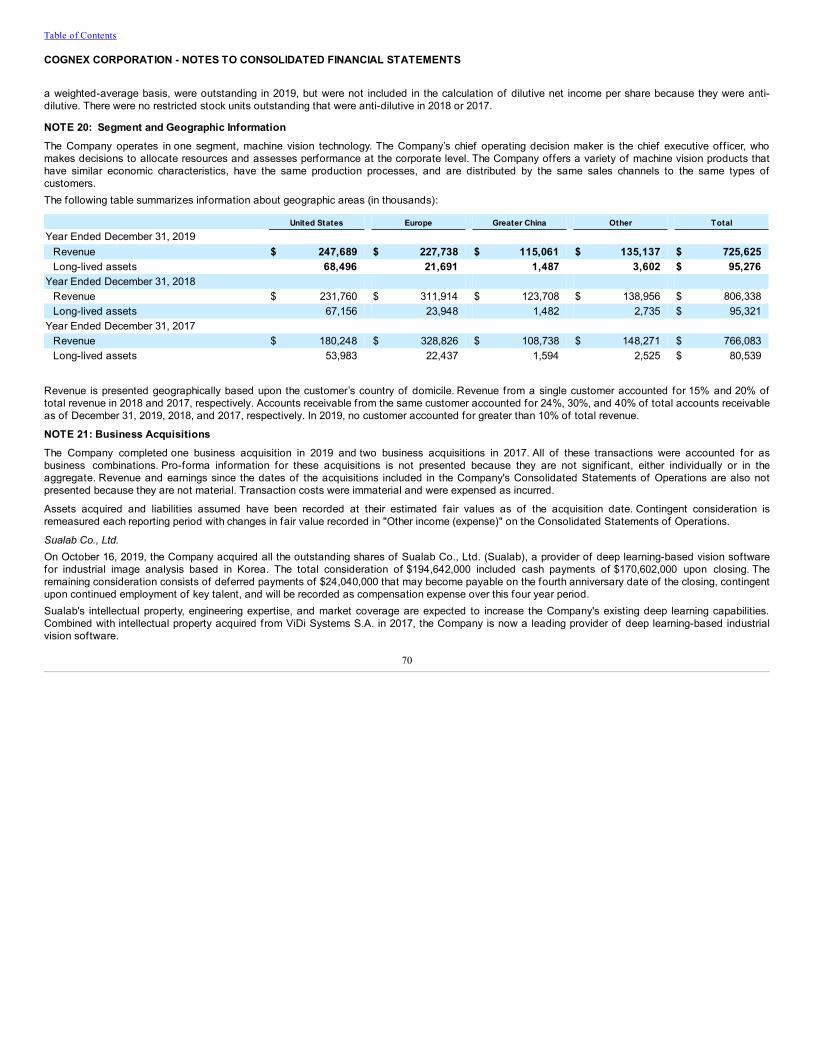
Table of Contents
COGNEX CORPORATION - NOTES TO CONSOLIDATED FINANCIAL STATEMENTS
a weighted-average basis, were outstanding in 2019, but were not included in the calculation of dilutive net income per share because they were anti-dilutive. There were no restricted stock units outstanding that were anti-dilutive in 2018 or 2017.
NOTE 20: Segment and Geographic InformationThe Company operates in one segment, machine vision technology. The Company’s chief operating decision maker is the chief executive off icer, whomakes decisions to allocate resources and assesses performance at the corporate level. The Company offers a variety of machine vision products thathave similar economic characteristics, have the same production processes, and are distributed by the same sales channels to the same types ofcustomers.The following table summarizes information about geographic areas (in thousands):
United States Europe Greater China Other TotalYear Ended December 31, 2019
Revenue $ 247,689 $ 227,738 $ 115,061 $ 135,137 $ 725,625Long-lived assets 68,496 21,691 1,487 3,602 $ 95,276
Year Ended December 31, 2018 Revenue $ 231,760 $ 311,914 $ 123,708 $ 138,956 $ 806,338Long-lived assets 67,156 23,948 1,482 2,735 $ 95,321
Year Ended December 31, 2017 Revenue $ 180,248 $ 328,826 $ 108,738 $ 148,271 $ 766,083Long-lived assets 53,983 22,437 1,594 2,525 $ 80,539
Revenue is presented geographically based upon the customer’s country of domicile. Revenue from a single customer accounted for 15% and 20% oftotal revenue in 2018 and 2017, respectively. Accounts receivable from the same customer accounted for 24%, 30%, and 40% of total accounts receivableas of December 31, 2019, 2018, and 2017, respectively. In 2019, no customer accounted for greater than 10% of total revenue.
NOTE 21: Business AcquisitionsThe Company completed one business acquisition in 2019 and two business acquisitions in 2017. All of these transactions were accounted for asbusiness combinations. Pro-forma information for these acquisitions is not presented because they are not signif icant, either individually or in theaggregate. Revenue and earnings since the dates of the acquisitions included in the Company's Consolidated Statements of Operations are also notpresented because they are not material. Transaction costs were immaterial and were expensed as incurred.
Assets acquired and liabilities assumed have been recorded at their estimated fair values as of the acquisition date. Contingent consideration isremeasured each reporting period with changes in fair value recorded in "Other income (expense)" on the Consolidated Statements of Operations.
Sualab Co., Ltd.On October 16, 2019, the Company acquired all the outstanding shares of Sualab Co., Ltd. (Sualab), a provider of deep learning-based vision softwarefor industrial image analysis based in Korea. The total consideration of $194,642,000 included cash payments of $170,602,000 upon closing. Theremaining consideration consists of deferred payments of $24,040,000 that may become payable on the fourth anniversary date of the closing, contingentupon continued employment of key talent, and will be recorded as compensation expense over this four year period.Sualab's intellectual property, engineering expertise, and market coverage are expected to increase the Company's existing deep learning capabilities.Combined with intellectual property acquired from ViDi Systems S.A. in 2017, the Company is now a leading provider of deep learning-based industrialvision software.
70
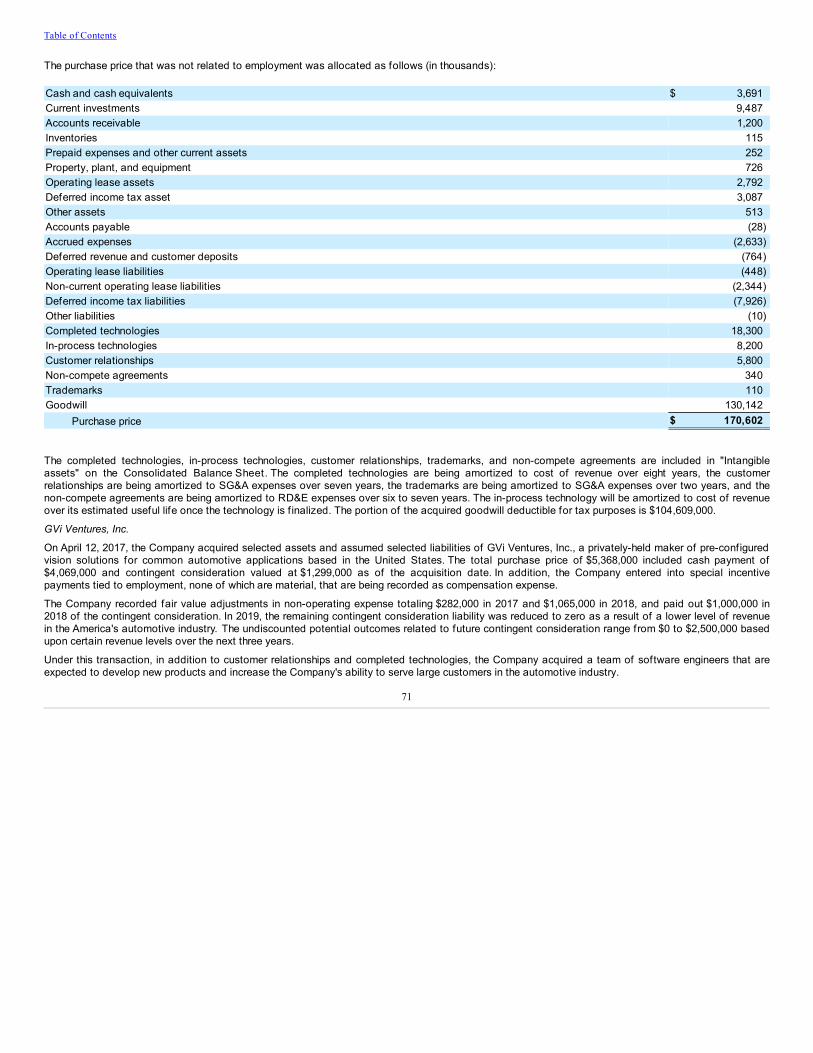
Table of Contents
The purchase price that was not related to employment was allocated as follows (in thousands):
Cash and cash equivalents $ 3,691Current investments 9,487Accounts receivable 1,200Inventories 115Prepaid expenses and other current assets 252Property, plant, and equipment 726Operating lease assets 2,792Deferred income tax asset 3,087Other assets 513Accounts payable (28)Accrued expenses (2,633)Deferred revenue and customer deposits (764)Operating lease liabilities (448)Non-current operating lease liabilities (2,344)Deferred income tax liabilities (7,926)Other liabilities (10)Completed technologies 18,300In-process technologies 8,200Customer relationships 5,800Non-compete agreements 340Trademarks 110Goodwill 130,142
Purchase price $ 170,602
The completed technologies, in-process technologies, customer relationships, trademarks, and non-compete agreements are included in "Intangibleassets" on the Consolidated Balance Sheet. The completed technologies are being amortized to cost of revenue over eight years, the customerrelationships are being amortized to SG&A expenses over seven years, the trademarks are being amortized to SG&A expenses over two years, and thenon-compete agreements are being amortized to RD&E expenses over six to seven years. The in-process technology will be amortized to cost of revenueover its estimated useful life once the technology is f inalized. The portion of the acquired goodwill deductible for tax purposes is $104,609,000.
GVi Ventures, Inc.
On April 12, 2017, the Company acquired selected assets and assumed selected liabilities of GVi Ventures, Inc., a privately-held maker of pre-configuredvision solutions for common automotive applications based in the United States. The total purchase price of $5,368,000 included cash payment of$4,069,000 and contingent consideration valued at $1,299,000 as of the acquisition date. In addition, the Company entered into special incentivepayments tied to employment, none of which are material, that are being recorded as compensation expense.
The Company recorded fair value adjustments in non-operating expense totaling $282,000 in 2017 and $1,065,000 in 2018, and paid out $1,000,000 in2018 of the contingent consideration. In 2019, the remaining contingent consideration liability was reduced to zero as a result of a lower level of revenuein the America's automotive industry. The undiscounted potential outcomes related to future contingent consideration range from $0 to $2,500,000 basedupon certain revenue levels over the next three years.
Under this transaction, in addition to customer relationships and completed technologies, the Company acquired a team of software engineers that areexpected to develop new products and increase the Company's ability to serve large customers in the automotive industry.
71
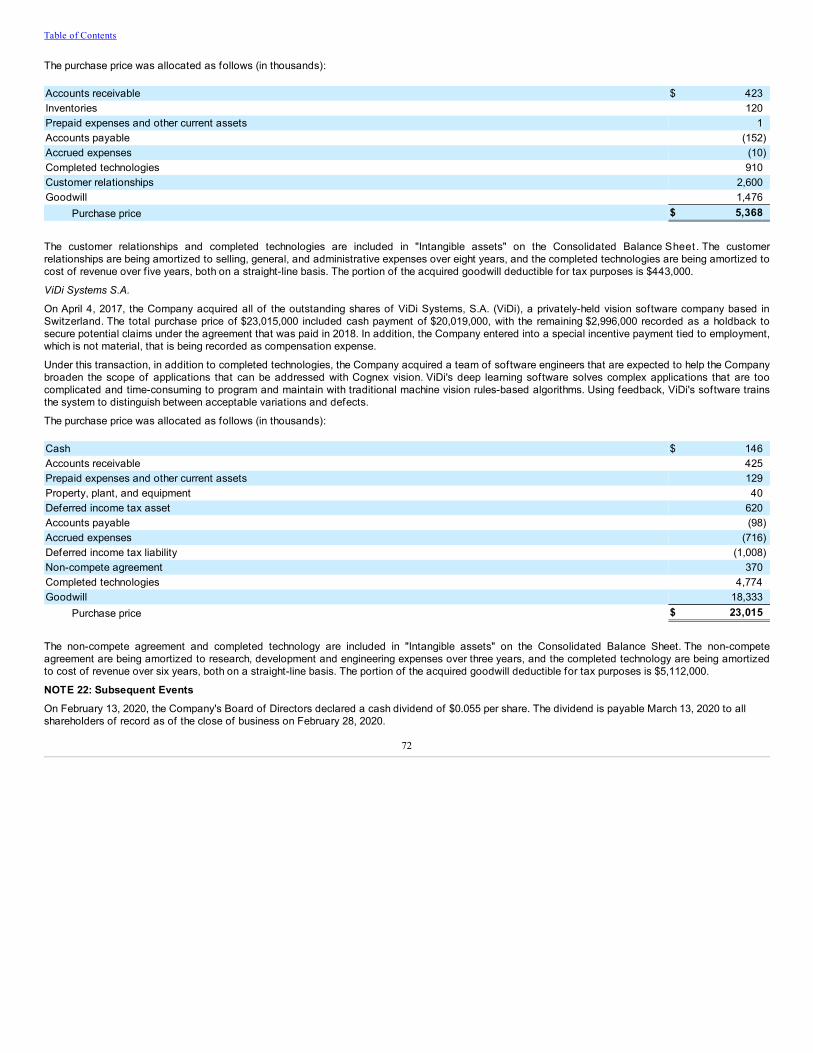
Table of Contents
The purchase price was allocated as follows (in thousands):
Accounts receivable $ 423Inventories 120Prepaid expenses and other current assets 1Accounts payable (152)Accrued expenses (10)Completed technologies 910Customer relationships 2,600Goodwill 1,476
Purchase price $ 5,368
The customer relationships and completed technologies are included in "Intangible assets" on the Consolidated Balance Sheet . The customerrelationships are being amortized to selling, general, and administrative expenses over eight years, and the completed technologies are being amortized tocost of revenue over f ive years, both on a straight-line basis. The portion of the acquired goodwill deductible for tax purposes is $443,000.
ViDi Systems S.A.
On April 4, 2017, the Company acquired all of the outstanding shares of ViDi Systems, S.A. (ViDi), a privately-held vision software company based inSwitzerland. The total purchase price of $23,015,000 included cash payment of $20,019,000, with the remaining $2,996,000 recorded as a holdback tosecure potential claims under the agreement that was paid in 2018. In addition, the Company entered into a special incentive payment tied to employment,which is not material, that is being recorded as compensation expense.
Under this transaction, in addition to completed technologies, the Company acquired a team of software engineers that are expected to help the Companybroaden the scope of applications that can be addressed with Cognex vision. ViDi's deep learning software solves complex applications that are toocomplicated and time-consuming to program and maintain with traditional machine vision rules-based algorithms. Using feedback, ViDi's software trainsthe system to distinguish between acceptable variations and defects.
The purchase price was allocated as follows (in thousands):
Cash $ 146Accounts receivable 425Prepaid expenses and other current assets 129Property, plant, and equipment 40Deferred income tax asset 620Accounts payable (98)Accrued expenses (716)Deferred income tax liability (1,008)Non-compete agreement 370Completed technologies 4,774Goodwill 18,333
Purchase price $ 23,015
The non-compete agreement and completed technology are included in "Intangible assets" on the Consolidated Balance Sheet. The non-competeagreement are being amortized to research, development and engineering expenses over three years, and the completed technology are being amortizedto cost of revenue over six years, both on a straight-line basis. The portion of the acquired goodwill deductible for tax purposes is $5,112,000.
NOTE 22: Subsequent EventsOn February 13, 2020, the Company's Board of Directors declared a cash dividend of $0.055 per share. The dividend is payable March 13, 2020 to allshareholders of record as of the close of business on February 28, 2020.
72
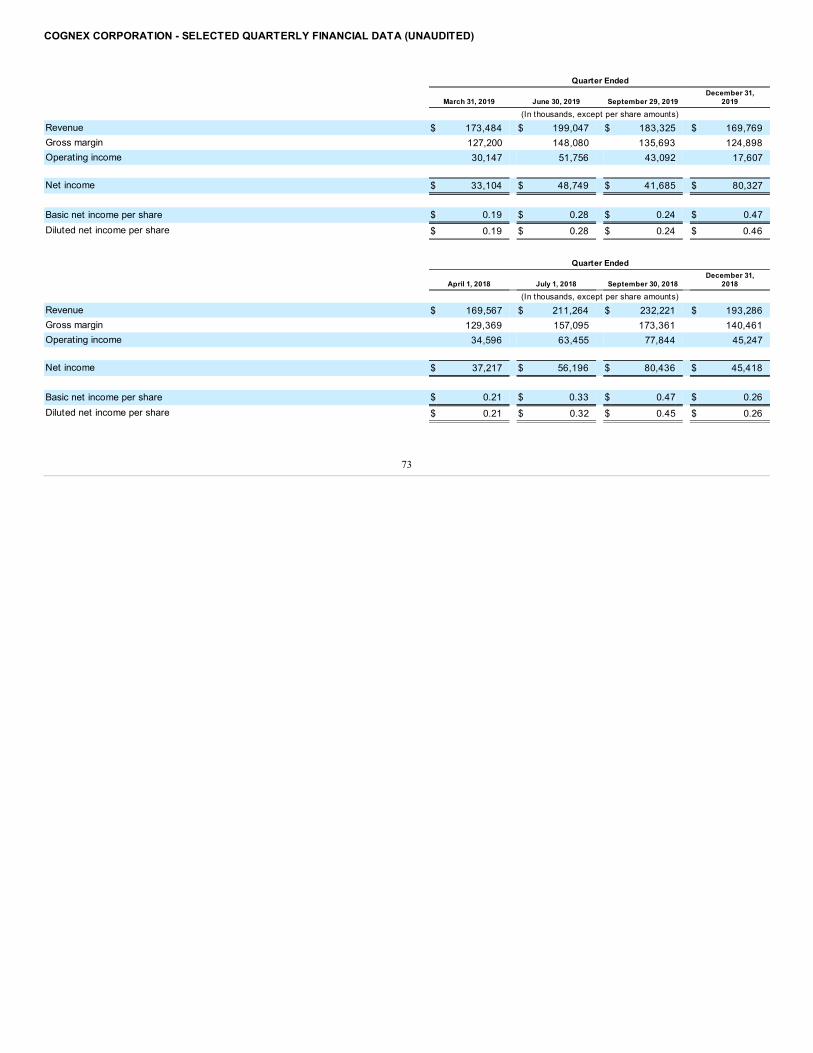
COGNEX CORPORATION - SELECTED QUARTERLY FINANCIAL DATA (UNAUDITED)
Quarter Ended
March 31, 2019 June 30, 2019 September 29, 2019 December 31,
2019
(In thousands, except per share amounts)
Revenue $ 173,484 $ 199,047 $ 183,325 $ 169,769Gross margin 127,200 148,080 135,693 124,898Operating income 30,147 51,756 43,092 17,607 Net income $ 33,104 $ 48,749 $ 41,685 $ 80,327
Basic net income per share $ 0.19 $ 0.28 $ 0.24 $ 0.47Diluted net income per share $ 0.19 $ 0.28 $ 0.24 $ 0.46
Quarter Ended
April 1, 2018 July 1, 2018 September 30, 2018 December 31,
2018
(In thousands, except per share amounts)
Revenue $ 169,567 $ 211,264 $ 232,221 $ 193,286Gross margin 129,369 157,095 173,361 140,461Operating income 34,596 63,455 77,844 45,247 Net income $ 37,217 $ 56,196 $ 80,436 $ 45,418
Basic net income per share $ 0.21 $ 0.33 $ 0.47 $ 0.26Diluted net income per share $ 0.21 $ 0.32 $ 0.45 $ 0.26
73
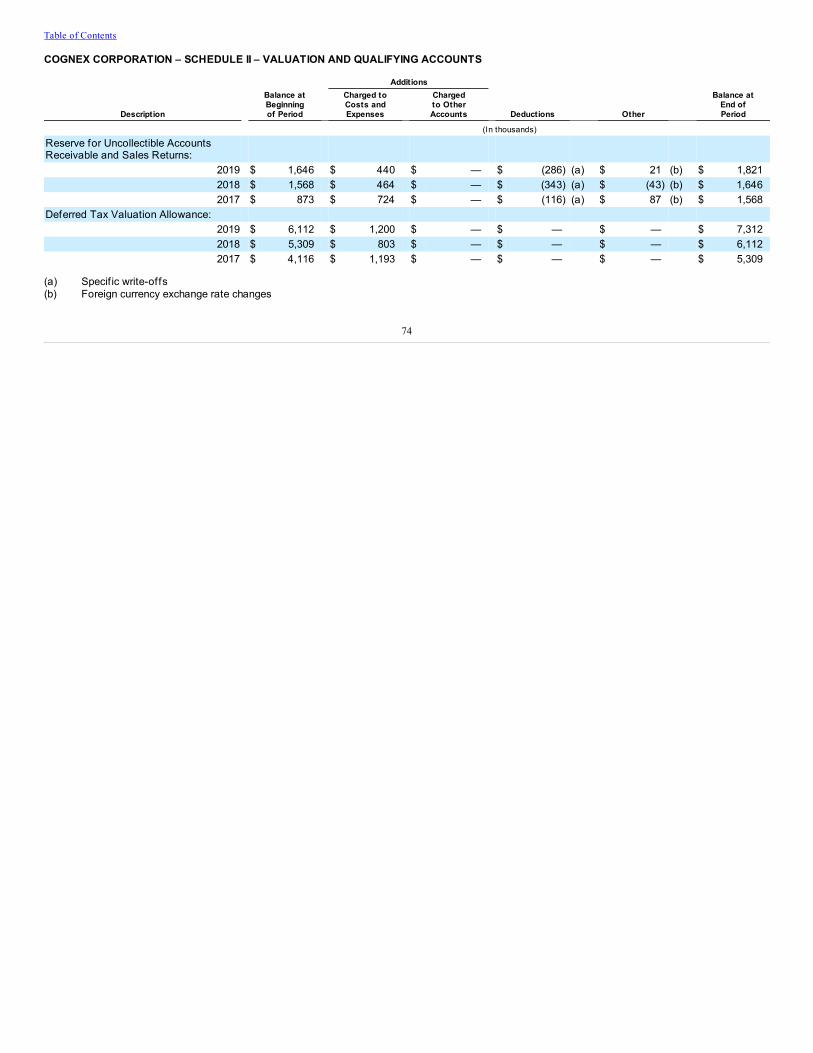
Table of Contents
COGNEX CORPORATION – SCHEDULE II – VALUATION AND QUALIFYING ACCOUNTS
Additions
Description
Balance atBeginningof Period
Charged toCosts andExpenses
Chargedto OtherAccounts Deductions Other
Balance atEnd ofPeriod
(In thousands)
Reserve for Uncollectible AccountsReceivable and Sales Returns:
2019 $ 1,646 $ 440 $ — $ (286) (a) $ 21 (b) $ 1,8212018 $ 1,568 $ 464 $ — $ (343) (a) $ (43) (b) $ 1,6462017 $ 873 $ 724 $ — $ (116) (a) $ 87 (b) $ 1,568
Deferred Tax Valuation Allowance: 2019 $ 6,112 $ 1,200 $ — $ — $ — $ 7,3122018 $ 5,309 $ 803 $ — $ — $ — $ 6,1122017 $ 4,116 $ 1,193 $ — $ — $ — $ 5,309
(a) Specif ic write-offs(b) Foreign currency exchange rate changes
74
Table of Contents
ITEM 9: CHANGES IN AND DISAGREEMENTS WITH ACCOUNTANTS ON ACCOUNTING AND FINANCIAL DISCLOSUREThere were no disagreements with accountants on accounting or f inancial disclosure during 2019 or 2018.
ITEM 9A: CONTROLS AND PROCEDURESDisclosure Controls and ProceduresAs required by Rules 13a-15 and 15d-15 of the Securities Exchange Act of 1934, the Company has evaluated, with the participation of management,including the Chief Executive Off icer and the Principal Financial & Accounting Off icer, the effectiveness of its disclosure controls and procedures (asdefined in such rules) as of the end of the period covered by this report. Based on such evaluation, the Chief Executive Off icer and Principal Financial &Accounting Off icer concluded that such disclosure controls and procedures were effective as of that date.
Management’s Report on Internal Control over Financial ReportingManagement is responsible for establishing and maintaining adequate internal control over f inancial reporting. Management has evaluated theeffectiveness of the Company’s internal control over f inancial reporting based upon the framework in Internal Control – Integrated Framework issued in2013 by the Committee of Sponsoring Organizations of the Treadway Commission (COSO).Based upon our evaluation, management has concluded that the Company’s internal control over f inancial reporting was effective as of December 31,2019.
Attestation Report of the Registered Public Accounting Firm on Internal Control over Financial ReportingThe Company’s internal control over f inancial reporting as of December 31, 2019 has been audited by Grant Thornton LLP, an independent registeredpublic accounting f irm, as stated in their report which is included herein.
Changes in Internal Control over Financial ReportingThere have been no changes in the Company's internal control over f inancial reporting that occurred during the fourth quarter of the year endedDecember 31, 2019 that have materially affected, or are reasonably likely to materially affect, the Company’s internal control over f inancial reporting. TheCompany continues to review its disclosure controls and procedures, including its internal control over f inancial reporting, and may from time to time makechanges aimed at enhancing their effectiveness and to ensure that the Company’s systems evolve with its business.
75
Table of Contents
REPORT OF INDEPENDENT REGISTERED PUBLIC ACCOUNTING FIRM
Board of Directors and Shareholders Cognex Corporation
Opinion on internal control over f inancial reportingWe have audited the internal control over f inancial reporting of Cognex Corporation (a Massachusetts corporation) and subsidiaries (the “Company”) asof December 31, 2019, based on criteria established in the 2013 Internal Control-Integrated Framework issued by the Committee of SponsoringOrganizations of the Treadway Commission ("COSO"). In our opinion, the Company maintained, in all material respects, effective internal control overf inancial reporting as of December 31, 2019, based on criteria established in the 2013 Internal Control-Integrated Framework issued by COSO.
We also have audited, in accordance with the standards of the Public Company Accounting Oversight Board (United States) (“PCAOB”), the consolidatedfinancial statements of the Company as of and for the year ended December 31, 2019, and our report dated February 13, 2020 expressed an unqualif iedopinion on those f inancial statements.
Basis for opinionThe Company’s management is responsible for maintaining effective internal control over f inancial reporting and for its assessment of the effectivenessof internal control over f inancial reporting, included in the accompanying Management’s Report on Internal Control over Financial Reporting. Ourresponsibility is to express an opinion on the Company’s internal control over f inancial reporting based on our audit. We are a public accounting f irmregistered with the PCAOB and are required to be independent with respect to the Company in accordance with the U.S. federal securities laws and theapplicable rules and regulations of the Securities and Exchange Commission and the PCAOB.
We conducted our audit in accordance with the standards of the PCAOB. Those standards require that we plan and perform the audit to obtainreasonable assurance about whether effective internal control over f inancial reporting was maintained in all material respects. Our audit includedobtaining an understanding of internal control over f inancial reporting, assessing the risk that a material weakness exists, testing and evaluating thedesign and operating effectiveness of internal control based on the assessed risk, and performing such other procedures as we considered necessary inthe circumstances. We believe that our audit provides a reasonable basis for our opinion.
Definition and limitations of internal control over f inancial reportingA company’s internal control over f inancial reporting is a process designed to provide reasonable assurance regarding the reliability of f inancial reportingand the preparation of f inancial statements for external purposes in accordance with generally accepted accounting principles. A company’s internalcontrol over f inancial reporting includes those policies and procedures that (1) pertain to the maintenance of records that, in reasonable detail, accuratelyand fairly ref lect the transactions and dispositions of the assets of the company; (2) provide reasonable assurance that transactions are recorded asnecessary to permit preparation of f inancial statements in accordance with generally accepted accounting principles, and that receipts and expendituresof the company are being made only in accordance with authorizations of management and directors of the company; and (3) provide reasonableassurance regarding prevention or timely detection of unauthorized acquisition, use, or disposition of the company’s assets that could have a materialeffect on the f inancial statements.
Because of its inherent limitations, internal control over f inancial reporting may not prevent or detect misstatements. Also, projections of any evaluation ofeffectiveness to future periods are subject to the risk that controls may become inadequate because of changes in conditions, or that the degree ofcompliance with the policies or procedures may deteriorate.
/s/ GRANT THORNTON LLP
Boston, Massachusetts
February 13, 2020
76
Table of Contents
ITEM 9B: OTHER INFORMATIONNone
PART III
ITEM 10: DIRECTORS, EXECUTIVE OFFICERS, AND CORPORATE GOVERNANCEInformation with respect to Directors and Executive Off icers of the Company and the other matters required by Item 10 shall be included in the Company’sdefinitive Proxy Statement for the Annual Meeting of Shareholders to be held on April 23, 2020 and is incorporated herein by reference. In addition, certaininformation with respect to Executive Off icers of the Company may be found in the section captioned “Executive Off icers of the Registrant,” appearing inPart I – Item 4A of this Annual Report on Form 10-K.The Company has adopted a Code of Business Conduct and Ethics covering all employees, which is available, free of charge, on the Company’s website,www.cognex.com under "Company-Investor Information-Governance". The Company intends to disclose on its website any amendments to or waivers ofthe Code of Business Conduct and Ethics on behalf of the Company’s directors and executive off icers that would otherwise be required to be disclosedunder the rules of the SEC or The NASDAQ Stock Market LLC.
ITEM 11: EXECUTIVE COMPENSATIONInformation with respect to executive compensation and the other matters required by Item 11 shall be included in the Company’s definitive ProxyStatement for the Annual Meeting of Shareholders to be held on April 23, 2020 and is incorporated herein by reference.
ITEM 12: SECURITY OWNERSHIP OF CERTAIN BENEFICIAL OWNERS AND MANAGEMENT AND RELATED STOCKHOLDER MATTERSInformation with respect to security ownership and the other matters required by Item 12 shall be included in the Company’s definitive Proxy Statement forthe Annual Meeting of Shareholders to be held on April 23, 2020 and is incorporated herein by reference.The following table provides information as of December 31, 2019 regarding shares of common stock that may be issued under the Company’s existingequity compensation plans:
Plan Category
Number of securities to beissued upon exercise of
outstanding options, warrants andrights, and vesting of restricted
stock units
Weighted-average exerciseprice of outstanding options, restricted
stock units, warrants, and rights
Number of securitiesremaining available f or f uture
issuance under equitycompensation plans
(excluding securities ref lectedin column (a))
(a) Equity compensation plans approved byshareholders (4) 12,798,120 (1) $ 38.4639 17,300,802 (2)Equity compensation plans not approved byshareholders (4) 250,168 (3) 7.2401 - 13,048,288 $ 37.8652 17,300,802
(1) Includes shares to be issued upon exercise of outstanding options under the Company’s 1998 Stock Incentive Plan, 2007 Stock Option and Incentive Plan, and subsequent toshareholder approval, the 2001 General Stock Option Plan, as amended and restated.
(2) Includes shares remaining available f or f uture issuance under the Company’s 2007 Stock Option and Incentive Plan and 2001 General Stock Option Plan, as amended and restated.(3) Includes shares to be issued upon the exercise of outstanding options granted prior to shareholder approval under the 2001 General Stock Option Plan, as amended and restated.(4) All ref erences made to share or per share amounts have been adjusted to ref lect the two-for-one stock split which occurred in the f ourth quarter of 2017.
The 2001 General Stock Option Plan was originally adopted by the Board of Directors in December 2001 without shareholder approval. In December 2011,this plan received shareholder approval for an amendment and restatement of the plan. This plan provides for the granting of nonqualif ied stock optionsand incentive stock options to any employee who is actively employed by the Company and is not an off icer or director of the Company. The maximumnumber of shares of common stock available for grant under this plan is 38,440,000 shares. All option grants must have an exercise price per share that isno less than the fair market value per share of the Company’s common stock on the grant date and must have a term that is no longer than ten years fromthe grant date. 29,991,140 stock options have been granted under the 2001 General Stock Option Plan.
77
Table of Contents
ITEM 13: CERTAIN RELATIONSHIPS AND RELATED TRANSACTIONS, AND DIRECTOR INDEPENDENCEInformation with respect to certain relationships and related transactions and the other matters required by Item 13 shall be included in the Company’sdefinitive Proxy Statement for the Annual Meeting of Shareholders to be held on April 23, 2020 and is incorporated herein by reference.
ITEM 14: PRINCIPAL ACCOUNTING FEES AND SERVICESInformation with respect to principal accounting fees and services and the other matters required by Item 14 shall be included in the Company’s definitiveProxy Statement for the Annual Meeting of Shareholders to be held on April 23, 2020 and is incorporated herein by reference.
PART IV
ITEM 15: EXHIBITS AND FINANCIAL STATEMENT SCHEDULES(1) Financial Statements
The f inancial statements are included in Part II – Item 8 of this Annual Report on Form 10-K.(2) Financial Statement Schedule
Financial Statement Schedule II is included in Part II – Item 8 of this Annual Report on Form 10-K.Other schedules are omitted because of the absence of conditions under which they are required or because the required informationis provided in the consolidated f inancial statements or notes thereto.
(3) ExhibitsThe Exhibits f iled as part of this Annual Report on Form 10-K are listed in the Exhibit Index, immediately preceding the signature pagehereto.
ITEM 16: FORM 10-K SUMMARYNot applicable
78
Table of Contents
EXHIBIT INDEX
EXHIBIT NUMBER
3A
Restated Articles of Organization of Cognex Corporation effective June 27, 1989, as amended through May 5, 2016(incorporated by reference to Exhibit 3.1 of Cognex's Quarterly Report on Form 10-Q for the quarter ended July 3, 2016 [File No.1-34218])
3B
Articles of Amendment to the Articles of Organization of Cognex Corporation establishing Series E Junior Participating PreferredStock (incorporated by reference to Exhibit 3.2 to Cognex's Quarterly Report on Form 10-Q for the quarter ended July 3, 2016[File No. 1-34218])
3C
Articles of Amendment to Restated Articles of Organization of Cognex Corporation, effective May 2, 2018 (incorporated byreference to Exhibit 4.2 of Cognex's Registration Statement on Form S-8 [Registration No. 333-224716])
3D
Articles of Amendment to Restated Articles of Organization of Cognex Corporation, effective April 26, 2019 (incorporated byreference to Exhibit 3.4 of Cognex's Quarterly Report on Form 10-Q for the quarter ended March 31, 2019 [File No. 1-34218])
3E
By-laws of Cognex Corporation, as amended and restated through December 5, 2013 (incorporated by reference to Exhibit 3.3of Cognex’s Quarterly Report on Form 10-Q for the quarter ended July 3, 2016 [File No. 1-34218])
3F
Amendment to Amended and Restated By-laws of Cognex Corporation, effective May 5, 2016 (incorporated by reference toExhibit 3.4 of Cognex's Quarterly Report on Form 10-Q for the quarter ended July 3, 2016 [File No. 1-34218])
4A
Specimen Certif icate for Shares of Common Stock (incorporated by reference to Exhibit 4 to Cognex's Registration Statementon Form S-1 [Registration No. 33-29020])
4B Description of Capital Stock (f iled herewith)10A *
Cognex Corporation 1998 Non-Employee Director Stock Option Plan (incorporated by reference to Exhibit 4.1 to Cognex'sRegistration Statement on Form S-8 [Registration No. 333-60807])
10B *
Amendment to Cognex Corporation 1998 Non-Employee Director Stock Option Plan, effective as of July 26, 2007 (incorporatedby reference to Exhibit 10C of Cognex's Annual Report on Form 10-K for the year ended December 31, 2012 [File No. 1-34218])
10C *
Cognex Corporation 1998 Stock Incentive Plan (incorporated by reference to Exhibit 4.2 to the Registration Statement on FormS-8 [Registration No. 333-60807])
10D *
First Amendment to the Cognex Corporation 1998 Stock Incentive Plan (incorporated by reference to Exhibit 4.3 to Cognex'sRegistration Statement on Form S-8 [Registration No. 333-60807])
10E *
Second Amendment to the Cognex Corporation 1998 Stock Incentive Plan (incorporated by reference to Exhibit 10F of Cognex’sAnnual Report on Form 10-K for the year ended December 31, 2011 [File No. 1-34218])
10F *
Amendment to Cognex Corporation 1998 Stock Incentive Plan, effective as of July 26, 2007 (incorporated by reference toExhibit 10G of Cognex's Annual Report on Form 10-K for the year ended December 31, 2012 [File No. 1-34218])
10G *
Cognex Corporation 2001 General Stock Option Plan, as amended and restated (incorporated by reference to Exhibit 99.1 toCognex's Registration Statement on Form S-8 [Registration No. 333-224716])
10H *
Cognex Corporation 2007 Stock Option and Incentive Plan, as amended and restated (incorporated by reference to Exhibit 10Hof Cognex's Annual Report on Form 10-K for the year ended December 31, 2017 [File No. 1-34218])
10I *
Form of Letter Agreement between Cognex Corporation and each of Robert J. Shillman, Patrick A. Alias and Anthony Sun(incorporated by reference to Exhibit 10K of Cognex's Annual Report on Form 10-K for the year ended December 31, 2012 [FileNo. 1-34218])
10J *
Form of Stock Option Agreement (Non-Qualif ied) under 1998 Stock Incentive Plan (incorporated by reference to Exhibit 10L ofCognex's Annual Report on Form 10-K for the year ended December 31, 2012 [File No. 1-34218])
10K *
Form of Indemnif ication Agreement with each of the Directors of Cognex Corporation (incorporated by reference to Exhibit 10Rof Cognex's Annual Report on Form 10-K for the year ended December 31, 2013 [File No. 1-34218])
10L *
Employment Agreement, dated June 17, 2008, by and between Cognex Corporation and Robert Willett (incorporated byreference to Exhibit 10S of Cognex's Annual Report on Form 10-K for the year ended December 31, 2013 [File No. 1-34218])
79
Table of Contents
10M *
Amendment to Employment Agreement with Robert Willett, dated November 14, 2008 (incorporated by reference to Exhibit 10Tof Cognex's Annual Report on Form 10-K for the year ended December 31, 2013 [File No. 1-34218])
10N *
Form of Stock Option Agreement (Non-Qualif ied) under 2007 Stock Option and Incentive Plan (incorporated by reference toExhibit 10U of Cognex's Annual Report on Form 10-K for the year ended December 31, 2013 [File No. 1-34218])
10O *
Form of Stock Option Agreement under 2001 General Stock Option Plan (incorporated by reference to Exhibit 10O of Cognex'sAnnual Report on Form 10-K for the year ended December 31, 2017 [File No. 1-34218])
10P *
Stock Option Agreements with Robert Willett dated November 3, 2014 (incorporated by reference to Exhibit 10S of Cognex'sAnnual Report on Form 10-K for the year ended December 31, 2014 [File No. 1-34218])
10Q *
Summary of Cognex Annual Bonus Program (incorporated by reference to Exhibit 10Q of Cognex's Annual Report on Form 10-Kfor the year ended December 31, 2017 [File No. 1-34218])
10R *
Letter Agreement dated February 15, 2018 between Cognex Corporation and J. Bruce Robinson (incorporated by reference toCognex's Quarterly Report on Form 10-Q for the quarter ended April 30, 2018 [File No. 1-34218])
10S*
Letter Agreement dated April 1, 2019 between Cognex Corporation and John J. Curran (incorporated by reference to Cognex'sQuarterly Report on Form 10-Q for the quarter ended June 30, 2019 [File No. 1-34218])
10T*
Stock Option Agreement dated May 1, 2019 between Cognex Corporation and Laura MacDonald (incorporated by reference toCognex's Quarterly Report on Form 10-Q for the quarter ended June 30, 2019 [File No. 1-34218])
10U* Form of Restricted Stock Unit Agreement under the 2007 Stock Option and Incentive Plan (f iled herewith)18.1 Preferability Letter of Grant Thornton LLP (f iled herewith)21 Subsidiaries of the registrant (f iled herewith)
23.1 Consent of Grant Thornton LLP (f iled herewith)31.1 Certif ication pursuant to Section 302 of the Sarbanes-Oxley Act of 2002 (CEO) (f iled herewith)31.2
Certif ication pursuant to Section 302 of the Sarbanes-Oxley Act of 2002 (Principal Financial and Accounting Off icer) (f iledherewith)
32.1 Certif ication pursuant to Section 906 of the Sarbanes-Oxley Act of 2002 (CEO) (furnished herewith)32.2
Certif ication pursuant to Section 906 of the Sarbanes-Oxley Act of 2002 (Principal Financial and Accounting Off icer) (furnishedherewith)
101.SCH Inline XBRL Taxonomy Extension Schema Document (f iled herewith)101.CAL Inline XBRL Taxonomy Extension Calculation Linkbase Document (f iled herewith)101.LAB Inline XBRL Taxonomy Extension Label Linkbase Document (f iled herewith)101.PRE Inline XBRL Taxonomy Extension Presentation Linkbase Document (f iled herewith)101.DEF
Inline XBRL Taxonomy Extension Schema Document (f iled herewith)
104
Cover Page Interactive Data File (formatted as Inline XBRL with applicable taxonomy extension information contained inExhibits 101*.) (f iled herewith)
* Indicated management contract or compensatory plan or arrangement
80
Table of Contents
SIGNATURESPursuant to the requirements of Section 13 or 15(d) of the Securities Exchange Act of 1934, the registrant has duly caused this report to be signed on itsbehalf by the undersigned, thereunto duly authorized.
COGNEX CORPORATION By: /s/ Robert J. Willett Robert J. Willett President and Chief Executive Off icerPursuant to the requirements of the Securities Exchange Act of 1934, this report has been signed below by the following persons on behalf of theregistrant and in the capacities and on the dates indicated.
Signature Title Date /s/ Robert J. Shillman Chairman of the Board of Directors and Chief Culture Off icer February 13, 2020Robert J. Shillman /s/ Robert J. Willett President, Chief Executive Off icer, and Director (principal executive off icer) February 13, 2020Robert J. Willett /s/ Laura A. MacDonald Vice President and Corporate Controller (principal
f inancial and accounting off icer) February 13, 2020
Laura A. MacDonald /s/ Patrick Alias
Director February 13, 2020
Patrick Alias /s/ Eugene Banucci
Director February 13, 2020
Eugene Banucci /s/ Theodor Krantz
Director February 13, 2020
Theodor Krantz /s/ Dianne Parrotte
Director February 13, 2020
Dianne Parrotte /s/ Jerry Schneider
Director February 13, 2020
Jerry Schneider /s/ Anthony Sun
Director February 13, 2020
Anthony Sun
81