Embed Size (px)
Citation preview
8/7/2019 SEB’s Commodities Monthly: Will oil kill the recovery?
http://slidepdf.com/reader/full/sebs-commodities-monthly-will-oil-kill-the-recovery 1/20
SEB Commodities MonthlyWill oil kill the recovery?
5 APRIL 2011
8/7/2019 SEB’s Commodities Monthly: Will oil kill the recovery?
http://slidepdf.com/reader/full/sebs-commodities-monthly-will-oil-kill-the-recovery 2/20
2
Commodities Monthly
Will oil kill the recovery?
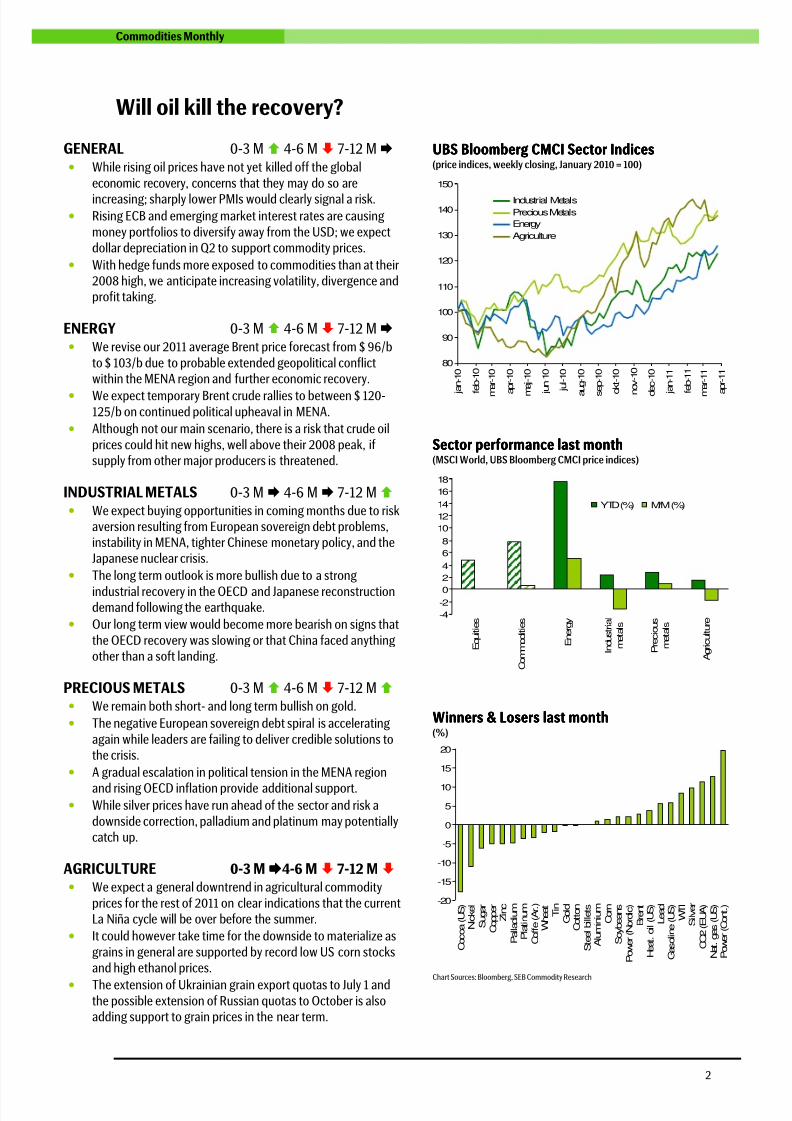
GENERAL 0-3 M 4-6 M 7-12 M • While rising oil prices have not yet killed off the global
economic recovery, concerns that they may do so are
increasing; sharply lower PMIs would clearly signal a risk.• Rising ECB and emerging market interest rates are causing
money portfolios to diversify away from the USD; we expectdollar depreciation in Q2 to support commodity prices.
• With hedge funds more exposed to commodities than at their2008 high, we anticipate increasing volatility, divergence andprofit taking.
ENERGY 0-3 M 4-6 M 7-12 M • We revise our 2011 average Brent price forecast from $ 96/b
to $ 103/b due to probable extended geopolitical conflictwithin the MENA region and further economic recovery.
• We expect temporary Brent crude rallies to between $ 120-125/b on continued political upheaval in MENA.
• Although not our main scenario, there is a risk that crude oil
prices could hit new highs, well above their 2008 peak, ifsupply from other major producers is threatened.
INDUSTRIAL METALS 0-3 M 4-6 M 7-12 M • We expect buying opportunities in coming months due to risk
aversion resulting from European sovereign debt problems,instability in MENA, tighter Chinese monetary policy, and theJapanese nuclear crisis.
• The long term outlook is more bullish due to a strong
industrial recovery in the OECD and Japanese reconstructiondemand following the earthquake.
• Our long term view would become more bearish on signs that
the OECD recovery was slowing or that China faced anythingother than a soft landing.
PRECIOUS METALS 0-3 M 4-6 M 7-12 M • We remain both short- and long term bullish on gold.
• The negative European sovereign debt spiral is accelerating
again while leaders are failing to deliver credible solutions tothe crisis.
• A gradual escalation in political tension in the MENA region
and rising OECD inflation provide additional support.• While silver prices have run ahead of the sector and risk a
downside correction, palladium and platinum may potentiallycatch up.
AGRICULTURE 0-3 M4-6 M 7-12 M • We expect a general downtrend in agricultural commodity
prices for the rest of 2011 on clear indications that the currentLa Niña cycle will be over before the summer.
• It could however take time for the downside to materialize as
grains in general are supported by record low US corn stocksand high ethanol prices.
• The extension of Ukrainian grain export quotas to July 1 andthe possible extension of Russian quotas to October is alsoadding support to grain prices in the near term.
UBS Bloomberg CMCI Sector IndicesUBS Bloomberg CMCI Sector IndicesUBS Bloomberg CMCI Sector IndicesUBS Bloomberg CMCI Sector Indices(price indices, weekly closing, January 2010 = 100)
80
90
100
110
120
130
140
150
jan-10
feb-10
m
ar-10
a
pr-10
m
aj-10
jun-10
jul-10
aug-10
sep-10
o
kt-10
nov-10
dec-10
jan-11
feb-11
m
ar-11
a
pr-11
Industrial Metals
Precious Metals
Energy
Agriculture
Sector performance last monthSector performance last monthSector performance last monthSector performance last month(MSCI World, UBS Bloomberg CMCI price indices)
-4
-20
2
4
6
8
10
12
14
16
18
Equities
Commodities
Energy
Industrial
metals
Precious
metals
Agriculture
YTD (%) M/M (%)
Winners & Losers last monthWinners & Losers last monthWinners & Losers last monthWinners & Losers last month(%)
-20
-15
-10
-5
0
5
10
15
20
Cocoa (US)
Nickel
Sugar
CopperZinc
Palladium
Platinum
Coffe (Ar.)
Wheat Tin
Gold
Cotton
Steel billets
AluminiumCorn
Soybeans
Power (Nordic)
Brent
Heat. oil (US)
Lead
Gasoline (US)WTI
Silver
CO2 (EUA)
Nat. gas (US)
Power (Cont.)
Chart Sources: Bloomberg, SEB Commodity Research
8/7/2019 SEB’s Commodities Monthly: Will oil kill the recovery?
http://slidepdf.com/reader/full/sebs-commodities-monthly-will-oil-kill-the-recovery 3/20
3
Commodities Monthly
General
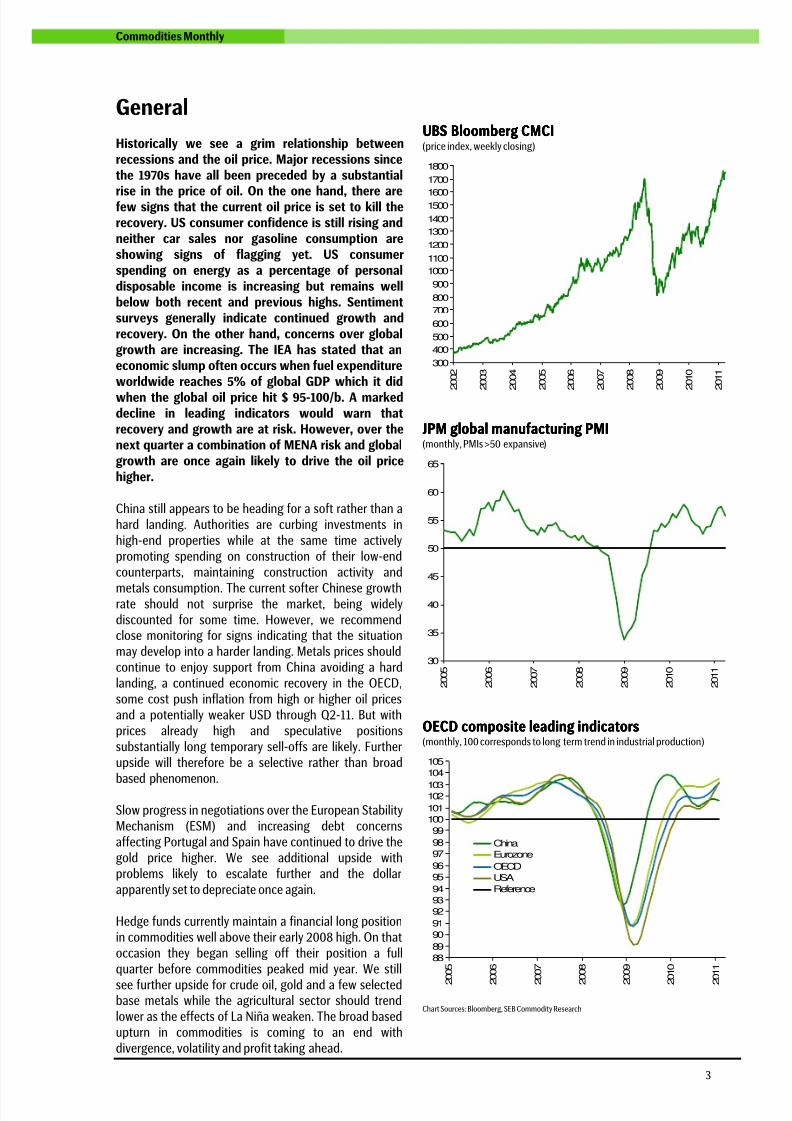
Historically we see a grim relationship betweenrecessions and the oil price. Major recessions sincethe 1970s have all been preceded by a substantial
rise in the price of oil. On the one hand, there arefew signs that the current oil price is set to kill therecovery. US consumer confidence is still rising andneither car sales nor gasoline consumption areshowing signs of flagging yet. US consumerspending on energy as a percentage of personaldisposable income is increasing but remains wellbelow both recent and previous highs. Sentimentsurveys generally indicate continued growth andrecovery. On the other hand, concerns over globalgrowth are increasing. The IEA has stated that aneconomic slump often occurs when fuel expenditureworldwide reaches 5% of global GDP which it did
when the global oil price hit $ 95-100/b. A markeddecline in leading indicators would warn thatrecovery and growth are at risk. However, over thenext quarter a combination of MENA risk and globalgrowth are once again likely to drive the oil pricehigher.
China still appears to be heading for a soft rather than ahard landing. Authorities are curbing investments inhigh-end properties while at the same time activelypromoting spending on construction of their low-endcounterparts, maintaining construction activity and
metals consumption. The current softer Chinese growthrate should not surprise the market, being widelydiscounted for some time. However, we recommendclose monitoring for signs indicating that the situationmay develop into a harder landing. Metals prices shouldcontinue to enjoy support from China avoiding a hardlanding, a continued economic recovery in the OECD,some cost push inflation from high or higher oil pricesand a potentially weaker USD through Q2-11. But withprices already high and speculative positionssubstantially long temporary sell-offs are likely. Furtherupside will therefore be a selective rather than broadbased phenomenon.
Slow progress in negotiations over the European StabilityMechanism (ESM) and increasing debt concernsaffecting Portugal and Spain have continued to drive thegold price higher. We see additional upside withproblems likely to escalate further and the dollarapparently set to depreciate once again.
Hedge funds currently maintain a financial long positionin commodities well above their early 2008 high. On thatoccasion they began selling off their position a fullquarter before commodities peaked mid year. We still
see further upside for crude oil, gold and a few selectedbase metals while the agricultural sector should trendlower as the effects of La Niña weaken. The broad basedupturn in commodities is coming to an end withdivergence, volatility and profit taking ahead.
UBSUBSUBSUBS Bloomberg CMCIBloomberg CMCIBloomberg CMCIBloomberg CMCI(price index, weekly closing)
300
400
500
600
700
800
900
1000
1100
1200
1300
1400
15001600
1700
1800
2002
2003
2004
2005
2006
2007
2008
2009
2010
2011
JPM global manufacturing PMIJPM global manufacturing PMIJPM global manufacturing PMIJPM global manufacturing PMI(monthly, PMIs >50 expansive)
30
35
40
45
50
55
60
65
2005
2006
2007
2008
2009
2010
2011
OECD composite leading indicatorsOECD composite leading indicatorsOECD composite leading indicatorsOECD composite leading indicators(monthly, 100 corresponds to long term trend in industrial production)
88
89
90
91
92
9394
95
96
97
98
99
100101
102103
104
105
2005
2006
2007
2008
2009
2010
2011
ChinaEurozone
OECDUSA
Reference
Chart Sources: Bloomberg, SEB Commodity Research
8/7/2019 SEB’s Commodities Monthly: Will oil kill the recovery?
http://slidepdf.com/reader/full/sebs-commodities-monthly-will-oil-kill-the-recovery 4/20
8/7/2019 SEB’s Commodities Monthly: Will oil kill the recovery?
http://slidepdf.com/reader/full/sebs-commodities-monthly-will-oil-kill-the-recovery 5/20
5
Commodities Monthly
EnergyWTIWTIWTIWTI futures curvefutures curvefutures curvefutures curve(NYMEX, $/b)
BrentBrentBrentBrent futures curvefutures curvefutures curvefutures curve(ICE, $/b)
90919293949596979899
100101102103104105106107
108109110
maj-11
aug-11
nov-11
feb-12
maj-12
aug-12
nov-12
feb-13
maj-13
aug-13
nov-13
feb-14
maj-14
aug-14
nov-14
feb-15
maj-15
11-02-01
11-03-01
11-04-01
100101102103104105106107108109110111112113114115116117
118119120
maj-11
aug-11
nov-11
feb-12
maj-12
aug-12
nov-12
feb-13
maj-13
aug-13
nov-13
feb-14
maj-14
aug-14
nov-14
feb-15
maj-15
11-02-01
11-03-01
11-04-01
Gasoline and heating oil pricesGasoline and heating oil pricesGasoline and heating oil pricesGasoline and heating oil prices(NYMEX, ¢/gal, front month, weekly closing)
Gasoline and distillate inventoriesGasoline and distillate inventoriesGasoline and distillate inventoriesGasoline and distillate inventories(DOE, mb, weekly data)
50
100
150
200
250
300
350
400
450
2002
2003
2004
2005
2006
2007
2008
2009
2010
2011
NYMEX Gasoline
NYMEX Heating oil
110
120
130
140
150
160
170
180
190
200
210
220
230
240
250
j f m a m j j a s o n d
Gasoline 2006-2010 avg.
Gasoline 2011
Distillate fuel oil 2006-2010 avg.
Distillate fuel oil 2011
US natural gas pricesUS natural gas pricesUS natural gas pricesUS natural gas prices(NYMEX, $/MMBtu, front month, weekly closing)
US natural gasUS natural gasUS natural gasUS natural gas futures curvefutures curvefutures curvefutures curve(NYMEX, $/MMBtu)
1
2
3
4
5
6
7
8
9
10
11
12
13
14
15
2
002
2
003
2
004
2
005
2
006
2
007
2
008
2
009
2
010
2
011
3,75
4,00
4,25
4,50
4,75
5,00
5,25
5,50
5,75
6,00
6,25
6,506,75
7,00
7,25
m
aj-11
s
ep-11
jan-12
m
aj-12
s
ep-12
jan-13
m
aj-13
s
ep-13
jan-14
m
aj-14
s
ep-14
jan-15
m
aj-15
s
ep-15
jan-16
m
aj-16
s
ep-16
jan-17
m
aj-17
s
ep-17
11-02-0111-03-01
11-04-01
Chart Sources: Bloomberg, SEB C ommodity Research
8/7/2019 SEB’s Commodities Monthly: Will oil kill the recovery?
http://slidepdf.com/reader/full/sebs-commodities-monthly-will-oil-kill-the-recovery 6/20
8/7/2019 SEB’s Commodities Monthly: Will oil kill the recovery?
http://slidepdf.com/reader/full/sebs-commodities-monthly-will-oil-kill-the-recovery 7/20
7
Commodities Monthly
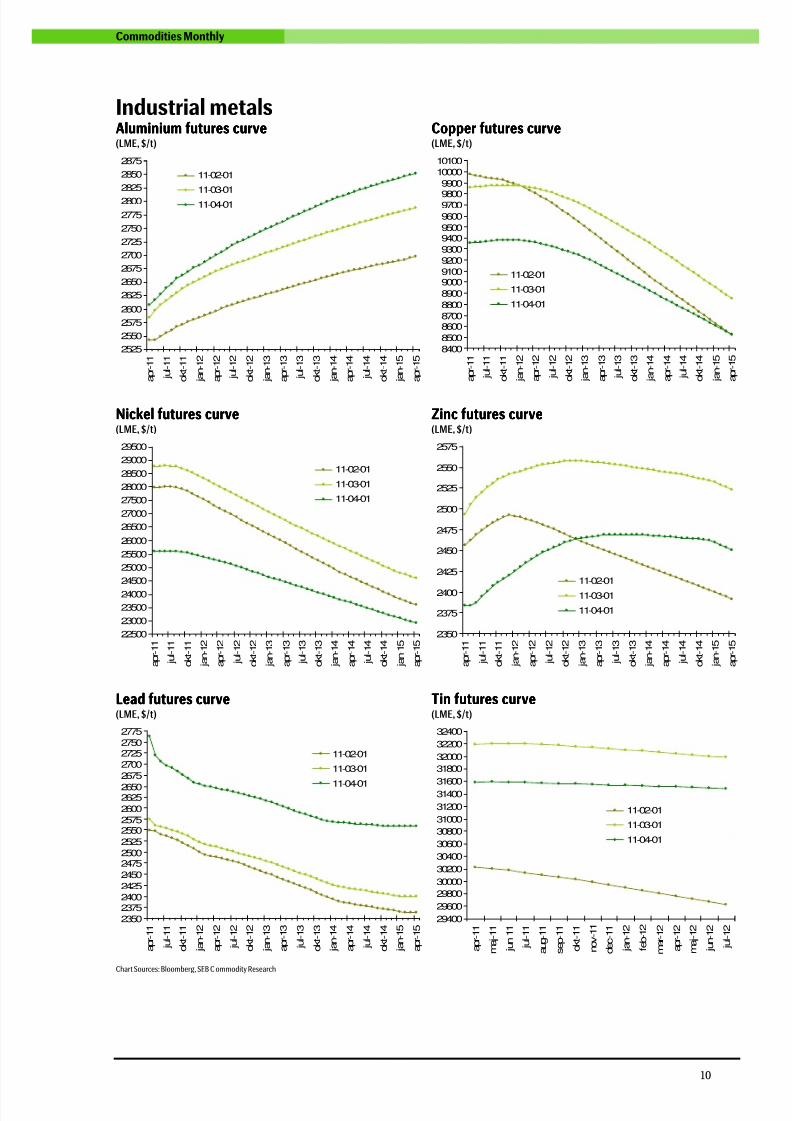
Industrial metals
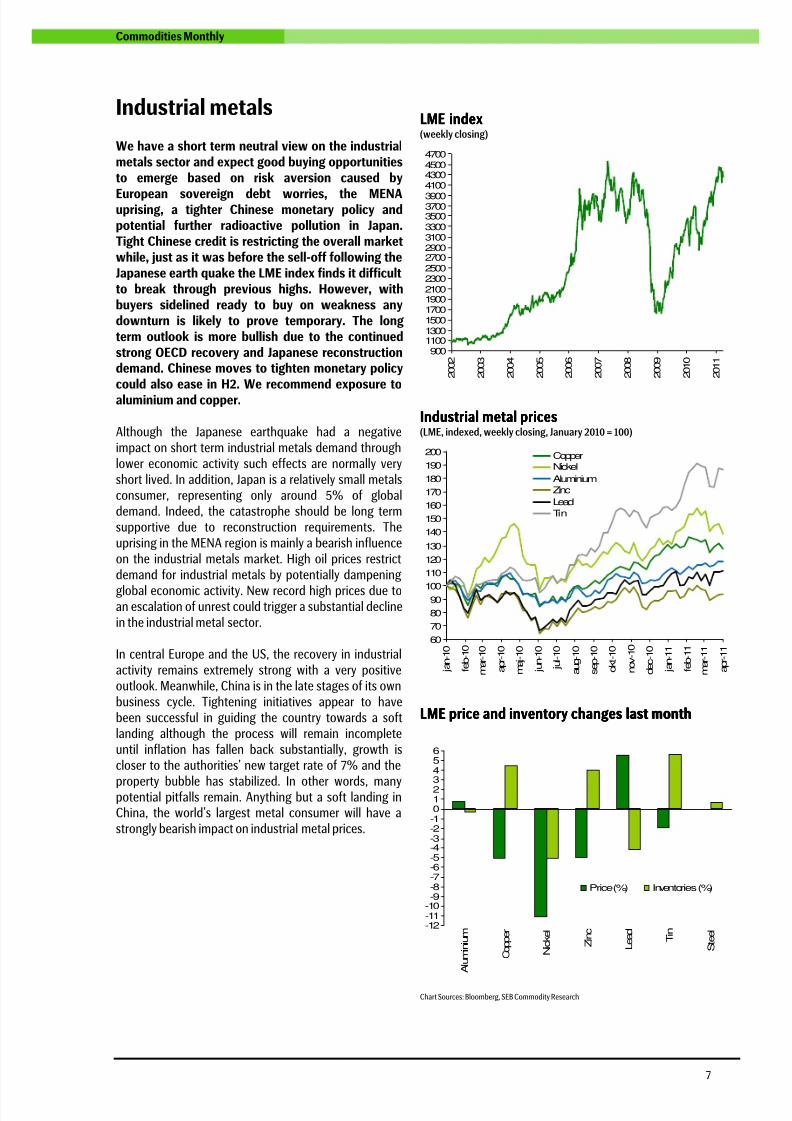
We have a short term neutral view on the industrialmetals sector and expect good buying opportunitiesto emerge based on risk aversion caused by
European sovereign debt worries, the MENAuprising, a tighter Chinese monetary policy andpotential further radioactive pollution in Japan.Tight Chinese credit is restricting the overall marketwhile, just as it was before the sell-off following theJapanese earth quake the LME index finds it difficultto break through previous highs. However, withbuyers sidelined ready to buy on weakness anydownturn is likely to prove temporary. The longterm outlook is more bullish due to the continuedstrong OECD recovery and Japanese reconstructiondemand. Chinese moves to tighten monetary policycould also ease in H2. We recommend exposure toaluminium and copper.
Although the Japanese earthquake had a negativeimpact on short term industrial metals demand throughlower economic activity such effects are normally veryshort lived. In addition, Japan is a relatively small metalsconsumer, representing only around 5% of globaldemand. Indeed, the catastrophe should be long termsupportive due to reconstruction requirements. Theuprising in the MENA region is mainly a bearish influenceon the industrial metals market. High oil prices restrictdemand for industrial metals by potentially dampening
global economic activity. New record high prices due toan escalation of unrest could trigger a substantial declinein the industrial metal sector.
In central Europe and the US, the recovery in industrialactivity remains extremely strong with a very positiveoutlook. Meanwhile, China is in the late stages of its ownbusiness cycle. Tightening initiatives appear to havebeen successful in guiding the country towards a softlanding although the process will remain incompleteuntil inflation has fallen back substantially, growth iscloser to the authorities’ new target rate of 7% and the
property bubble has stabilized. In other words, manypotential pitfalls remain. Anything but a soft landing inChina, the world’s largest metal consumer will have astrongly bearish impact on industrial metal prices.
LMELMELMELME indexindexindexindex(weekly closing)
900110013001500170019002100230025002700290031003300350037003900
4100430045004700
2002
2003
2004
2005
2006
2007
2008
2009
2010
2011
IndustrialIndustrialIndustrialIndustrial metal pricemetal pricemetal pricemetal pricessss(LME, indexed, weekly closing, January 2010 = 100)
60
70
80
90100
110
120
130
140
150
160
170
180
190
200
jan-10
feb-10
mar-10
apr-10
maj-10
jun-10
jul-10
aug-10
sep-10
okt-10
nov-10
dec-10
jan-11
feb-11
mar-11
apr-11
CopperNickel
AluminiumZinc
Lead
Tin
LME price and inventory changesLME price and inventory changesLME price and inventory changesLME price and inventory changes last monthlast monthlast monthlast month
-12-11-10-9-8-7-6-5-4-3-2-10123456
Aluminium
Copper
Nickel
Zinc
Lead Ti
n
Steel
Price (%) Inventories (%)
Chart Sources: Bloomberg, SEB Commodity Research
8/7/2019 SEB’s Commodities Monthly: Will oil kill the recovery?
http://slidepdf.com/reader/full/sebs-commodities-monthly-will-oil-kill-the-recovery 8/20
8
Commodities Monthly
Industrial metalsAluminiumAluminiumAluminiumAluminium LME aluminium price and inventoriesLME aluminium price and inventoriesLME aluminium price and inventoriesLME aluminium price and inventories
(weekly data)
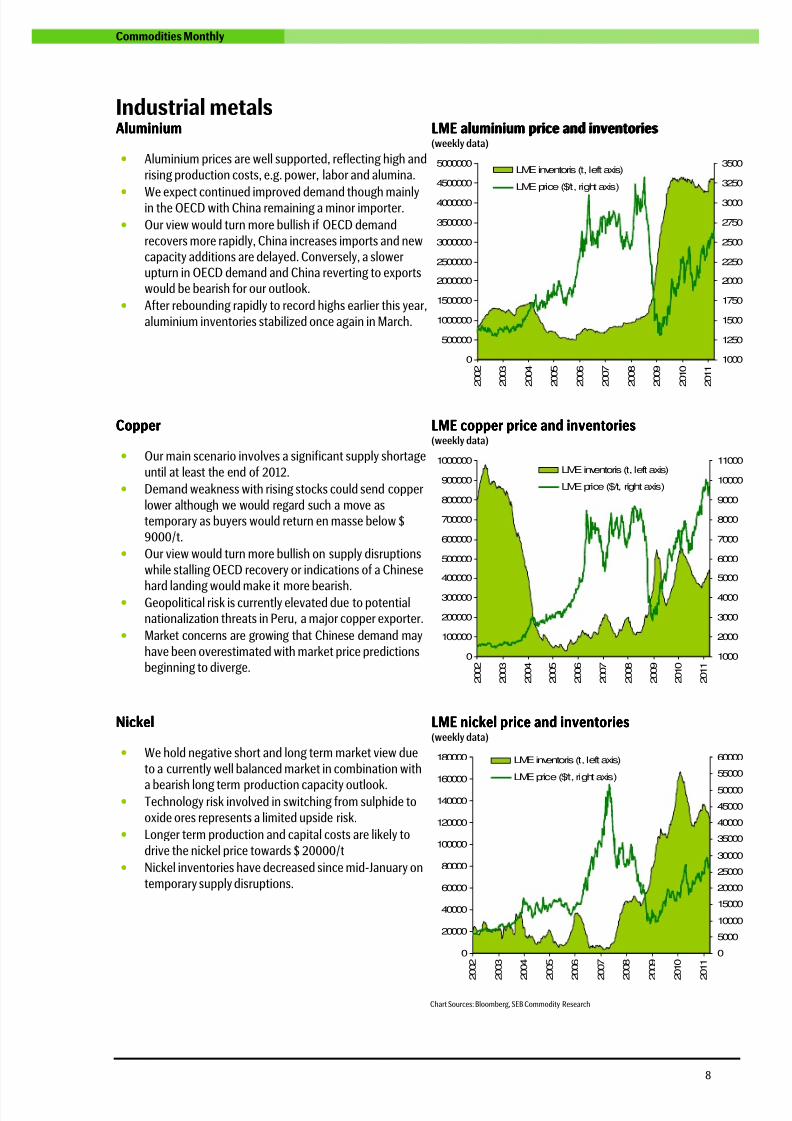
• Aluminium prices are well supported, reflecting high and
rising production costs, e.g. power, labor and alumina.
•
We expect continued improved demand though mainlyin the OECD with China remaining a minor importer.
• Our view would turn more bullish if OECD demand
recovers more rapidly, China increases imports and newcapacity additions are delayed. Conversely, a slowerupturn in OECD demand and China reverting to exportswould be bearish for our outlook.
• After rebounding rapidly to record highs earlier this year,
aluminium inventories stabilized once again in March.
0
500000
1000000
1500000
2000000
2500000
3000000
3500000
4000000
4500000
5000000
2002
2003
2004
2005
2006
2007
2008
2009
2010
2011
1000
1250
1500
1750
2000
2250
2500
2750
3000
3250
3500LME inventoris (t, left axis)
LME price ($/t, right axis)
CopperCopperCopperCopper LME copper price and inventoriesLME copper price and inventoriesLME copper price and inventoriesLME copper price and inventories(weekly data)
• Our main scenario involves a significant supply shortage
until at least the end of 2012.
• Demand weakness with rising stocks could send copper
lower although we would regard such a move astemporary as buyers would return en masse below $9000/t.
• Our view would turn more bullish on supply disruptions
while stalling OECD recovery or indications of a Chinese
hard landing would make it more bearish.• Geopolitical risk is currently elevated due to potential
nationalization threats in Peru, a major copper exporter.
• Market concerns are growing that Chinese demand may
have been overestimated with market price predictionsbeginning to diverge.
0
100000
200000
300000
400000
500000
600000
700000
800000
900000
1000000
2002
2003
2004
2005
2006
2007
2008
2009
2010
2011
1000
2000
3000
4000
5000
6000
7000
8000
9000
10000
11000LME inventoris (t, left axis)
LME price ($/t, right axis)
NickelNickelNickelNickel LME nickel price and inventoriesLME nickel price and inventoriesLME nickel price and inventoriesLME nickel price and inventories(weekly data)
• We hold negative short and long term market view due
to a currently well balanced market in combination with
a bearish long term production capacity outlook.• Technology risk involved in switching from sulphide to
oxide ores represents a limited upside risk.
• Longer term production and capital costs are likely to
drive the nickel price towards $ 20000/t
• Nickel inventories have decreased since mid-January on
temporary supply disruptions.
0
20000
40000
60000
80000
100000
120000
140000
160000
180000
2002
2003
2004
2005
2006
2007
2008
2009
2010
2011
0
5000
10000
15000
20000
25000
30000
35000
40000
45000
50000
55000
60000LME inventoris (t, left axis)
LME price ($/t, right axis)
Chart Sources: Bloomberg, SEB Commodity Research
8/7/2019 SEB’s Commodities Monthly: Will oil kill the recovery?
http://slidepdf.com/reader/full/sebs-commodities-monthly-will-oil-kill-the-recovery 9/20
9
Commodities Monthly
Industrial metalsZinZinZinZincccc LME zinc price and inventoriesLME zinc price and inventoriesLME zinc price and inventoriesLME zinc price and inventories
(weekly data)
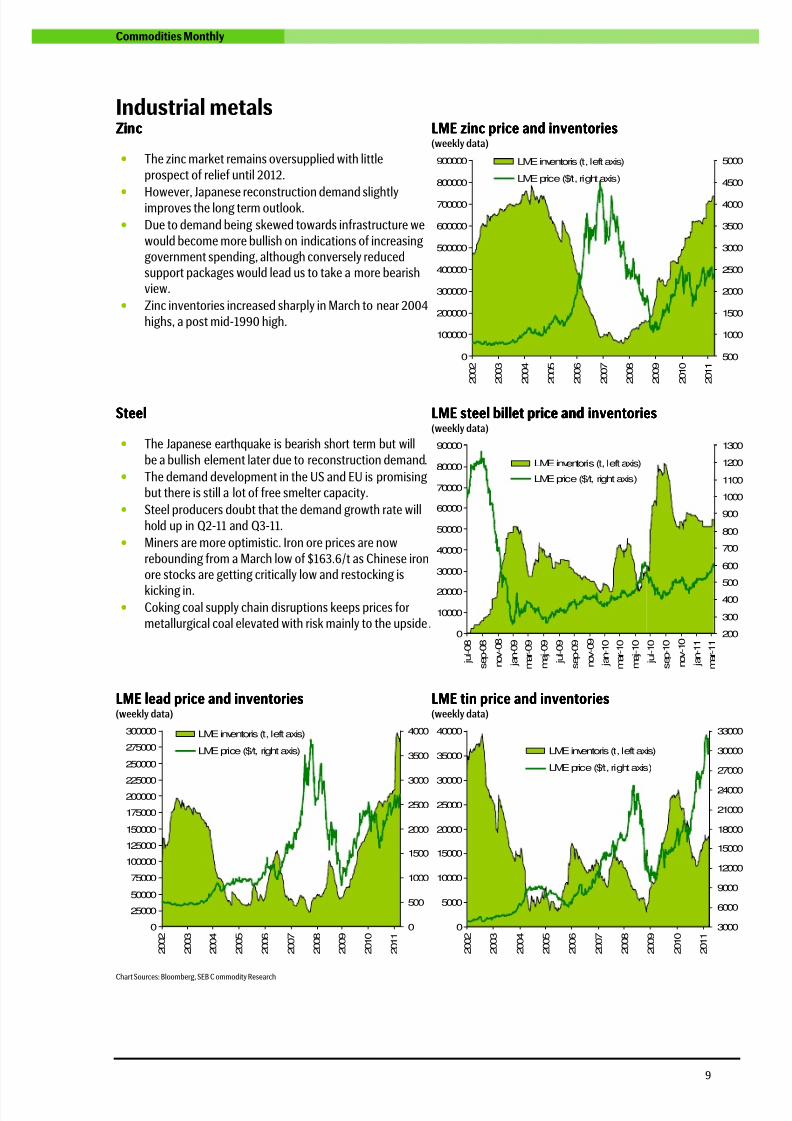
• The zinc market remains oversupplied with little
prospect of relief until 2012.
•
However, Japanese reconstruction demand slightlyimproves the long term outlook.
• Due to demand being skewed towards infrastructure we
would become more bullish on indications of increasinggovernment spending, although conversely reducedsupport packages would lead us to take a more bearishview.
• Zinc inventories increased sharply in March to near 2004
highs, a post mid-1990 high.
0
100000
200000
300000
400000
500000
600000
700000
800000
900000
2002
2003
2004
2005
2006
2007
2008
2009
2010
2011
500
1000
1500
2000
2500
3000
3500
4000
4500
5000LME inventoris (t, left axis)
LME price ($/t, right axis)
SteelSteelSteelSteel LME steel billet price and inventoriesLME steel billet price and inventoriesLME steel billet price and inventoriesLME steel billet price and inventories
(weekly data)
• The Japanese earthquake is bearish short term but will
be a bullish element later due to reconstruction demand.
• The demand development in the US and EU is promisingbut there is still a lot of free smelter capacity.
• Steel producers doubt that the demand growth rate will
hold up in Q2-11 and Q3-11.
• Miners are more optimistic. Iron ore prices are now
rebounding from a March low of $163.6/t as Chinese ironore stocks are getting critically low and restocking is
kicking in.• Coking coal supply chain disruptions keeps prices for
metallurgical coal elevated with risk mainly to the upside. 0
10000
20000
30000
40000
50000
60000
70000
80000
90000
jul-08
sep-08
nov-08
jan-09
mar-09
maj-09
jul-09
sep-09
nov-09
jan-10
mar-10
maj-10
jul-10
sep-10
nov-10
jan-11
mar-11
200
300
400
500
600
700
800
900
1000
1100
1200
1300
LME inventoris (t, left axis)
LME price ($/t, right axis)
LME lead price and inventoriesLME lead price and inventoriesLME lead price and inventoriesLME lead price and inventories(weekly data)
LME tin price and inventoriesLME tin price and inventoriesLME tin price and inventoriesLME tin price and inventories(weekly data)
0
25000
50000
75000
100000
125000
150000
175000
200000
225000
250000
275000
300000
2002
2003
2004
2005
2006
2007
2008
2009
2010
2011
0
500
1000
1500
2000
2500
3000
3500
4000LME inventoris (t, left axis)
LME price ($/t, right axis)
0
5000
10000
15000
20000
25000
30000
35000
40000
2002
2003
2004
2005
2006
2007
2008
2009
2010
2011
3000
6000
9000
12000
15000
18000
21000
24000
27000
30000
33000
LME inventoris (t, left axis)
LME price ($/t, right axis)
Chart Sources: Bloomberg, SEB C ommodity Research
8/7/2019 SEB’s Commodities Monthly: Will oil kill the recovery?
http://slidepdf.com/reader/full/sebs-commodities-monthly-will-oil-kill-the-recovery 10/20
10
Commodities Monthly
Industrial metalsAluminiumAluminiumAluminiumAluminium futures curvefutures curvefutures curvefutures curve(LME, $/t)
Copper futures cCopper futures cCopper futures cCopper futures curveurveurveurve(LME, $/t)
2525
2550
2575
2600
2625
2650
2675
2700
2725
2750
2775
2800
2825
2850
2875
apr-11
jul-11
okt-11
jan-12
apr-12
jul-12
okt-12
jan-13
apr-13
jul-13
okt-13
jan-14
apr-14
jul-14
okt-14
jan-15
apr-15
11-02-01
11-03-01
11-04-01
84008500
860087008800
8900
900091009200930094009500
9600
97009800
9900
1000010100
apr-11
jul-11
okt-11
jan-12
apr-12
jul-12
okt-12
jan-13
apr-13
jul-13
okt-13
jan-14
apr-14
jul-14
okt-14
jan-15
apr-15
11-02-01
11-03-01
11-04-01
Nickel futures curveNickel futures curveNickel futures curveNickel futures curve(LME, $/t)
Zinc futures curveZinc futures curveZinc futures curveZinc futures curve(LME, $/t)
22500
23000
23500
24000
24500
25000
25500
26000
26500
27000
27500
28000
28500
29000
29500
apr-11
jul-11
okt-11
jan-12
apr-12
jul-12
okt-12
jan-13
apr-13
jul-13
okt-13
jan-14
apr-14
jul-14
okt-14
jan-15
apr-15
11-02-01
11-03-01
11-04-01
2350
2375
2400
2425
2450
2475
2500
2525
2550
2575
apr-11
jul-11
okt-11
jan-12
apr-12
jul-12
okt-12
jan-13
apr-13
jul-13
okt-13
jan-14
apr-14
jul-14
okt-14
jan-15
apr-15
11-02-01
11-03-01
11-04-01
Lead futures curveLead futures curveLead futures curveLead futures curve(LME, $/t)
Tin futures curveTin futures curveTin futures curveTin futures curve(LME, $/t)
2350237524002425
2450
247525002525
255025752600
26252650
26752700272527502775
apr-11
jul-11
okt-11
jan-12
apr-12
jul-12
okt-12
jan-13
apr-13
jul-13
okt-13
jan-14
apr-14
jul-14
okt-14
jan-15
apr-15
11-02-01
11-03-01
11-04-01
29400
29600
29800
30000
30200
30400
30600
30800
31000
31200
3140031600
31800
32000
32200
32400
apr-11
maj-11
jun-11
jul-11
aug-11
sep-11
okt-11
nov-11
dec-11
jan-12
feb-12
mar-12
apr-12
maj-12
jun-12
jul-12
11-02-01
11-03-01
11-04-01
Chart Sources: Bloomberg, SEB C ommodity Research
8/7/2019 SEB’s Commodities Monthly: Will oil kill the recovery?
http://slidepdf.com/reader/full/sebs-commodities-monthly-will-oil-kill-the-recovery 11/20
11
Commodities Monthly
Precious metals
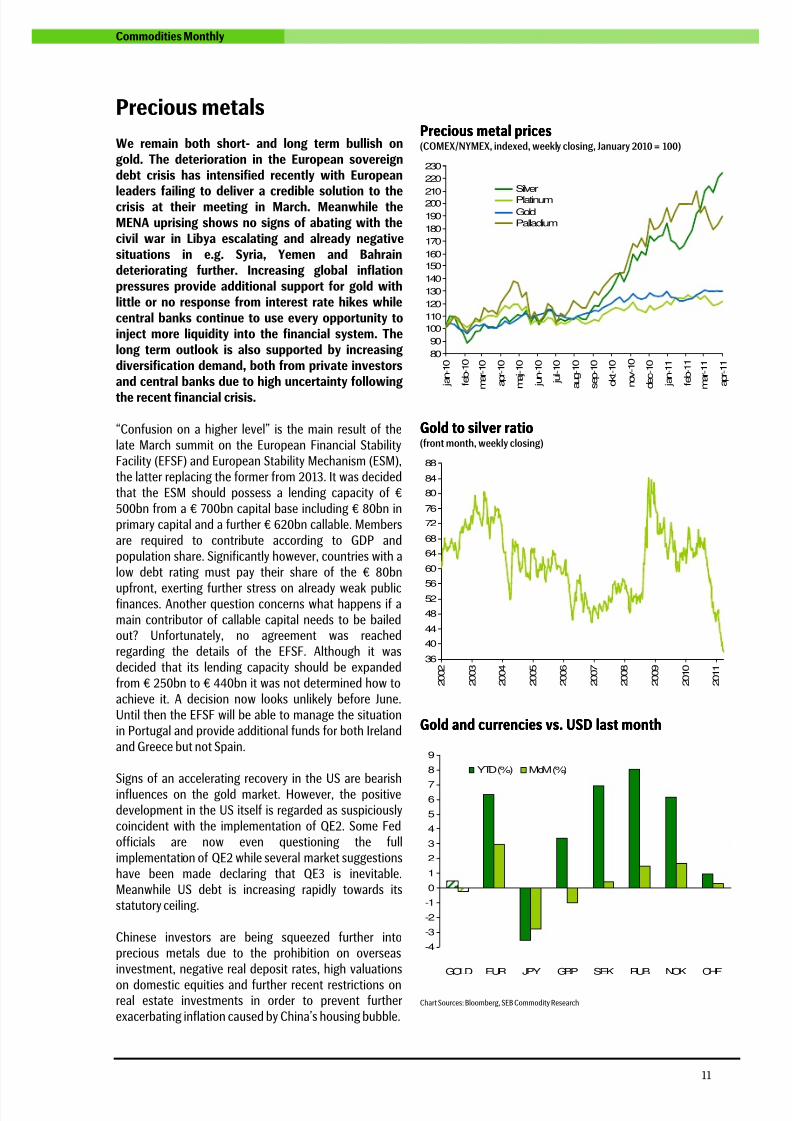
We remain both short- and long term bullish ongold. The deterioration in the European sovereigndebt crisis has intensified recently with European
leaders failing to deliver a credible solution to thecrisis at their meeting in March. Meanwhile theMENA uprising shows no signs of abating with thecivil war in Libya escalating and already negativesituations in e.g. Syria, Yemen and Bahraindeteriorating further. Increasing global inflationpressures provide additional support for gold withlittle or no response from interest rate hikes whilecentral banks continue to use every opportunity toinject more liquidity into the financial system. Thelong term outlook is also supported by increasingdiversification demand, both from private investorsand central banks due to high uncertainty following
the recent financial crisis.
“Confusion on a higher level” is the main result of thelate March summit on the European Financial StabilityFacility (EFSF) and European Stability Mechanism (ESM),the latter replacing the former from 2013. It was decidedthat the ESM should possess a lending capacity of €500bn from a € 700bn capital base including € 80bn inprimary capital and a further € 620bn callable. Membersare required to contribute according to GDP andpopulation share. Significantly however, countries with alow debt rating must pay their share of the € 80bn
upfront, exerting further stress on already weak publicfinances. Another question concerns what happens if amain contributor of callable capital needs to be bailedout? Unfortunately, no agreement was reachedregarding the details of the EFSF. Although it wasdecided that its lending capacity should be expandedfrom € 250bn to € 440bn it was not determined how toachieve it. A decision now looks unlikely before June.Until then the EFSF will be able to manage the situationin Portugal and provide additional funds for both Irelandand Greece but not Spain.
Signs of an accelerating recovery in the US are bearishinfluences on the gold market. However, the positivedevelopment in the US itself is regarded as suspiciouslycoincident with the implementation of QE2. Some Fedofficials are now even questioning the fullimplementation of QE2 while several market suggestionshave been made declaring that QE3 is inevitable.Meanwhile US debt is increasing rapidly towards itsstatutory ceiling.
Chinese investors are being squeezed further intoprecious metals due to the prohibition on overseasinvestment, negative real deposit rates, high valuations
on domestic equities and further recent restrictions onreal estate investments in order to prevent furtherexacerbating inflation caused by China’s housing bubble.
PreciousPreciousPreciousPrecious metal pricesmetal pricesmetal pricesmetal prices(COMEX/NYMEX, indexed, weekly closing, January 2010 = 100)
80
90
100
110
120
130
140
150
160
170
180
190
200210
220
230
jan-10
feb-10
mar-10
apr-10
maj-10
jun-10
jul-10
aug-10
sep-10
okt-10
nov-10
dec-10
jan-11
feb-11
mar-11
apr-11
Silver
Platinum
GoldPalladium
Gold to silver ratioGold to silver ratioGold to silver ratioGold to silver ratio(front month, weekly closing)
36
40
44
48
52
56
60
64
68
72
76
80
84
88
2002
2003
2004
2005
2006
2007
2008
2009
2010
2011
Gold and currencies vs. USD last monthGold and currencies vs. USD last monthGold and currencies vs. USD last monthGold and currencies vs. USD last month
-4
-3
-2
-1
0
1
2
3
4
5
67
8
9
GOLD EUR JPY GBP SEK RUB NOK CHF
YTD (%) MoM (%)
Chart Sources: Bloomberg, SEB Commodity Research
8/7/2019 SEB’s Commodities Monthly: Will oil kill the recovery?
http://slidepdf.com/reader/full/sebs-commodities-monthly-will-oil-kill-the-recovery 12/20
12
Commodities Monthly
Precious metalsGoldGoldGoldGold Gold priceGold priceGold priceGold price
(COMEX, $/ozt, front month, weekly closing)
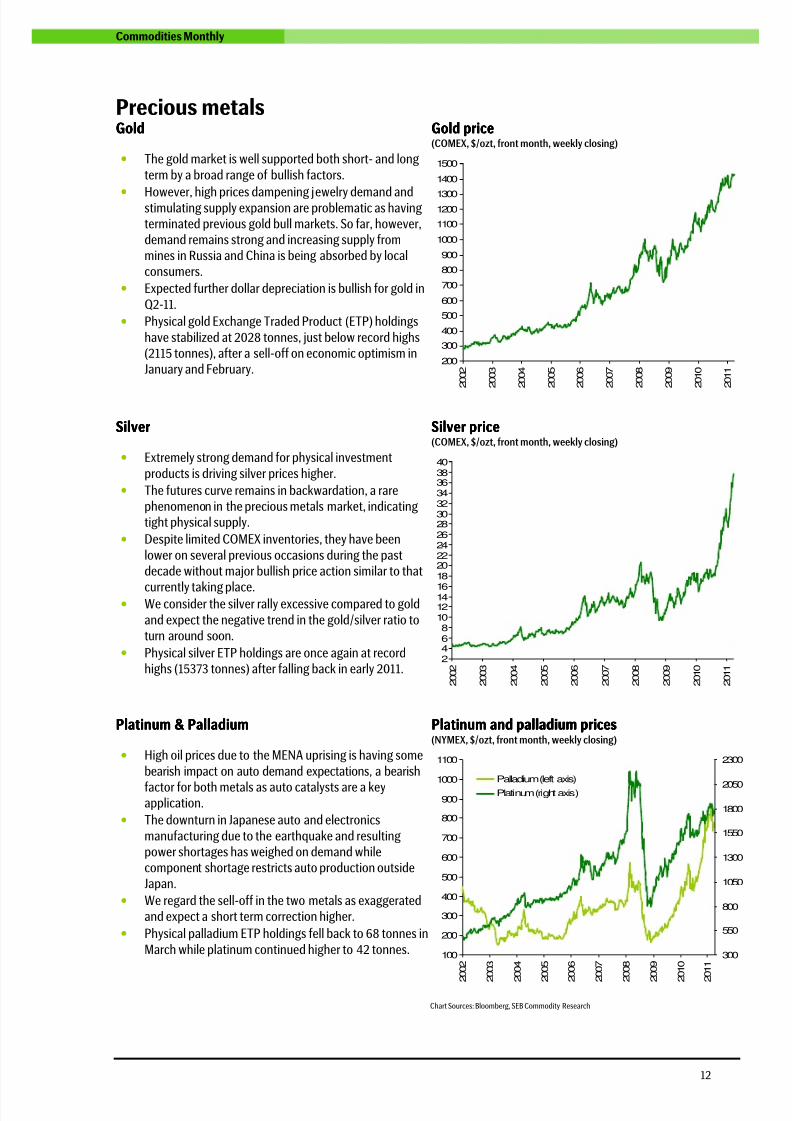
• The gold market is well supported both short- and long
term by a broad range of bullish factors.
•
However, high prices dampening jewelry demand andstimulating supply expansion are problematic as havingterminated previous gold bull markets. So far, however,demand remains strong and increasing supply frommines in Russia and China is being absorbed by localconsumers.
• Expected further dollar depreciation is bullish for gold in
Q2-11.
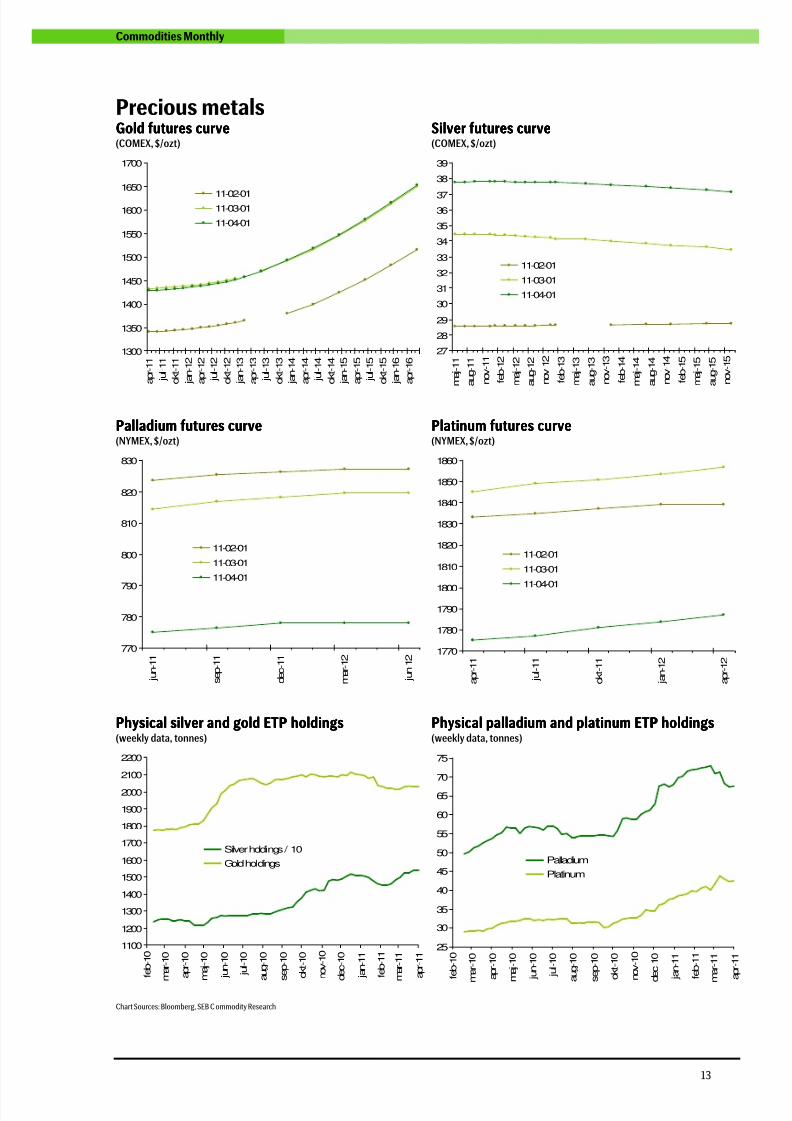
• Physical gold Exchange Traded Product (ETP) holdings
have stabilized at 2028 tonnes, just below record highs(2115 tonnes), after a sell-off on economic optimism inJanuary and February.
200
300
400
500
600
700
800
900
1000
1100
12001300
1400
1500
2002
2003
2004
2005
2006
2007
2008
2009
2010
2011
SilverSilverSilverSilver Silver priceSilver priceSilver priceSilver price(COMEX, $/ozt, front month, weekly closing)
• Extremely strong demand for physical investment
products is driving silver prices higher.
• The futures curve remains in backwardation, a rarephenomenon in the precious metals market, indicatingtight physical supply.
• Despite limited COMEX inventories, they have been
lower on several previous occasions during the pastdecade without major bullish price action similar to that
currently taking place.• We consider the silver rally excessive compared to gold
and expect the negative trend in the gold/silver ratio toturn around soon.
• Physical silver ETP holdings are once again at recordhighs (15373 tonnes) after falling back in early 2011.
2468
10121416
182022242628303234363840
2002
2003
2004
2005
2006
2007
2008
2009
2010
2011
Platinum & PalladiumPlatinum & PalladiumPlatinum & PalladiumPlatinum & Palladium Platinum and palladium priPlatinum and palladium priPlatinum and palladium priPlatinum and palladium pricescescesces(NYMEX, $/ozt, front month, weekly closing)
• High oil prices due to the MENA uprising is having some
bearish impact on auto demand expectations, a bearish
factor for both metals as auto catalysts are a keyapplication.
• The downturn in Japanese auto and electronics
manufacturing due to the earthquake and resultingpower shortages has weighed on demand whilecomponent shortage restricts auto production outsideJapan.
• We regard the sell-off in the two metals as exaggeratedand expect a short term correction higher.
• Physical palladium ETP holdings fell back to 68 tonnes in
March while platinum continued higher to 42 tonnes. 100
200
300
400
500
600
700
800
900
1000
1100
2
002
2
003
2
004
2
005
2
006
2
007
2
008
2
009
2
010
2
011
300
550
800
1050
1300
1550
1800
2050
2300
Palladium (left axis)
Platinum (right axis)
Chart Sources: Bloomberg, SEB Commodity Research
8/7/2019 SEB’s Commodities Monthly: Will oil kill the recovery?
http://slidepdf.com/reader/full/sebs-commodities-monthly-will-oil-kill-the-recovery 13/20
13
Commodities Monthly
Precious metalsGoldGoldGoldGold futures curvefutures curvefutures curvefutures curve(COMEX, $/ozt)
SilverSilverSilverSilver futures curvefutures curvefutures curvefutures curve(COMEX, $/ozt)
1300
1350
1400
1450
1500
1550
1600
1650
1700
apr-11
jul-11
okt-11
jan-12
apr-12
jul-12
okt-12
jan-13
apr-13
jul-13
okt-13
jan-14
apr-14
jul-14
okt-14
jan-15
apr-15
jul-15
okt-15
jan-16
apr-16
11-02-0111-03-01
11-04-01
27
28
29
30
31
32
33
34
35
3637
38
39
maj-11
aug-11
nov-11
feb-12
maj-12
aug-12
nov-12
feb-13
maj-13
aug-13
nov-13
feb-14
maj-14
aug-14
nov-14
feb-15
maj-15
aug-15
nov-15
11-02-01
11-03-01
11-04-01
Palladium futures curvePalladium futures curvePalladium futures curvePalladium futures curve(NYMEX, $/ozt)
Platinum futures curvePlatinum futures curvePlatinum futures curvePlatinum futures curve(NYMEX, $/ozt)
770
780
790
800
810
820
830
jun-11
sep-11
dec-11
mar-12
jun-12
11-02-01
11-03-01
11-04-01
1770
1780
1790
1800
1810
1820
1830
1840
1850
1860
apr-11
jul-11
okt-11
jan-12
apr-12
11-02-01
11-03-01
11-04-01
Physical sPhysical sPhysical sPhysical silver and goldilver and goldilver and goldilver and gold ETETETETPPPP holdingsholdingsholdingsholdings(weekly data, tonnes)
Physical pPhysical pPhysical pPhysical palladium and platinumalladium and platinumalladium and platinumalladium and platinum ETETETETPPPP holdingsholdingsholdingsholdings(weekly data, tonnes)
1100
1200
1300
1400
1500
1600
1700
1800
1900
2000
2100
2200
feb-10
mar-10
apr-10
maj-10
jun-10
jul-10
aug-10
sep-10
okt-10
nov-10
dec-10
jan-11
feb-11
mar-11
apr-11
Silver holdings / 10
Gold holdings
25
30
35
40
45
50
55
60
65
70
75
feb-10
m
ar-10
apr-10
maj-10
jun-10
jul-10
aug-10
sep-10
okt-10
nov-10
dec-10
jan-11
feb-11
m
ar-11
apr-11
Palladium
Platinum
Chart Sources: Bloomberg, SEB C ommodity Research
8/7/2019 SEB’s Commodities Monthly: Will oil kill the recovery?
http://slidepdf.com/reader/full/sebs-commodities-monthly-will-oil-kill-the-recovery 14/20
14
Commodities Monthly
Agriculture
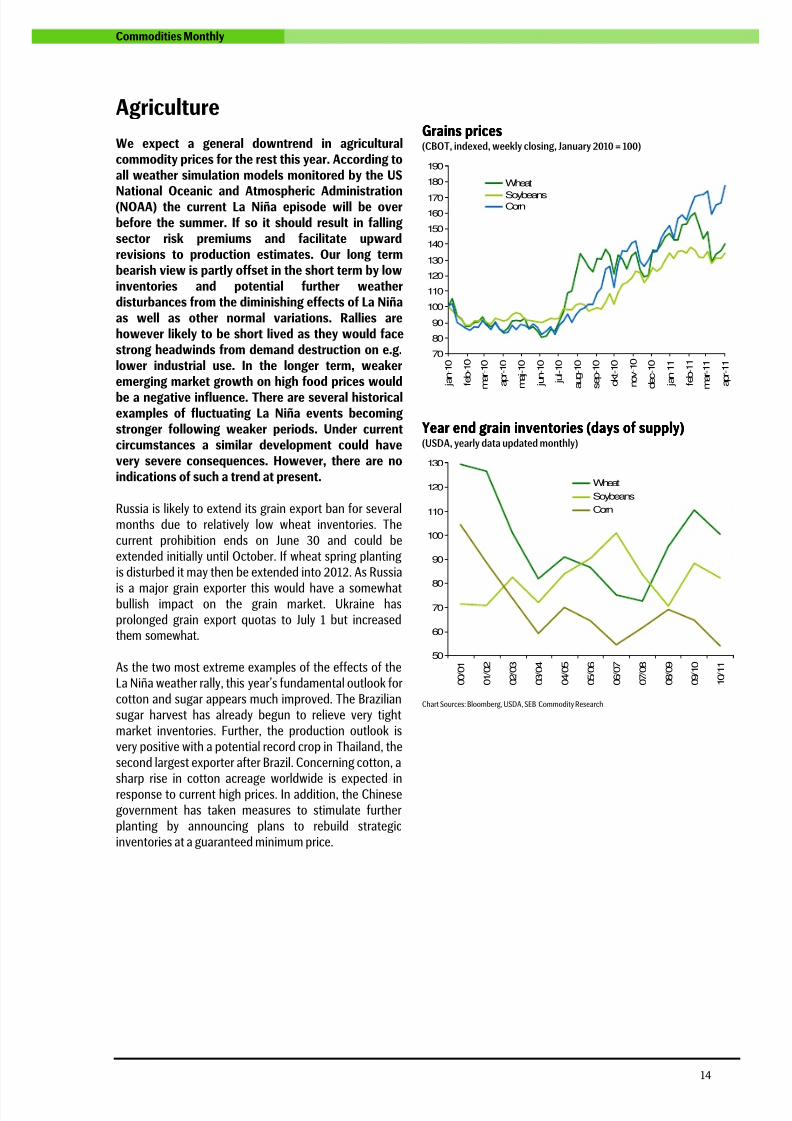
We expect a general downtrend in agriculturalcommodity prices for the rest this year. According toall weather simulation models monitored by the US
National Oceanic and Atmospheric Administration(NOAA) the current La Niña episode will be overbefore the summer. If so it should result in fallingsector risk premiums and facilitate upwardrevisions to production estimates. Our long termbearish view is partly offset in the short term by lowinventories and potential further weatherdisturbances from the diminishing effects of La Niñaas well as other normal variations. Rallies arehowever likely to be short lived as they would facestrong headwinds from demand destruction on e.g.lower industrial use. In the longer term, weakeremerging market growth on high food prices would
be a negative influence. There are several historicalexamples of fluctuating La Niña events becomingstronger following weaker periods. Under currentcircumstances a similar development could havevery severe consequences. However, there are noindications of such a trend at present.
Russia is likely to extend its grain export ban for severalmonths due to relatively low wheat inventories. Thecurrent prohibition ends on June 30 and could beextended initially until October. If wheat spring plantingis disturbed it may then be extended into 2012. As Russia
is a major grain exporter this would have a somewhatbullish impact on the grain market. Ukraine hasprolonged grain export quotas to July 1 but increasedthem somewhat.
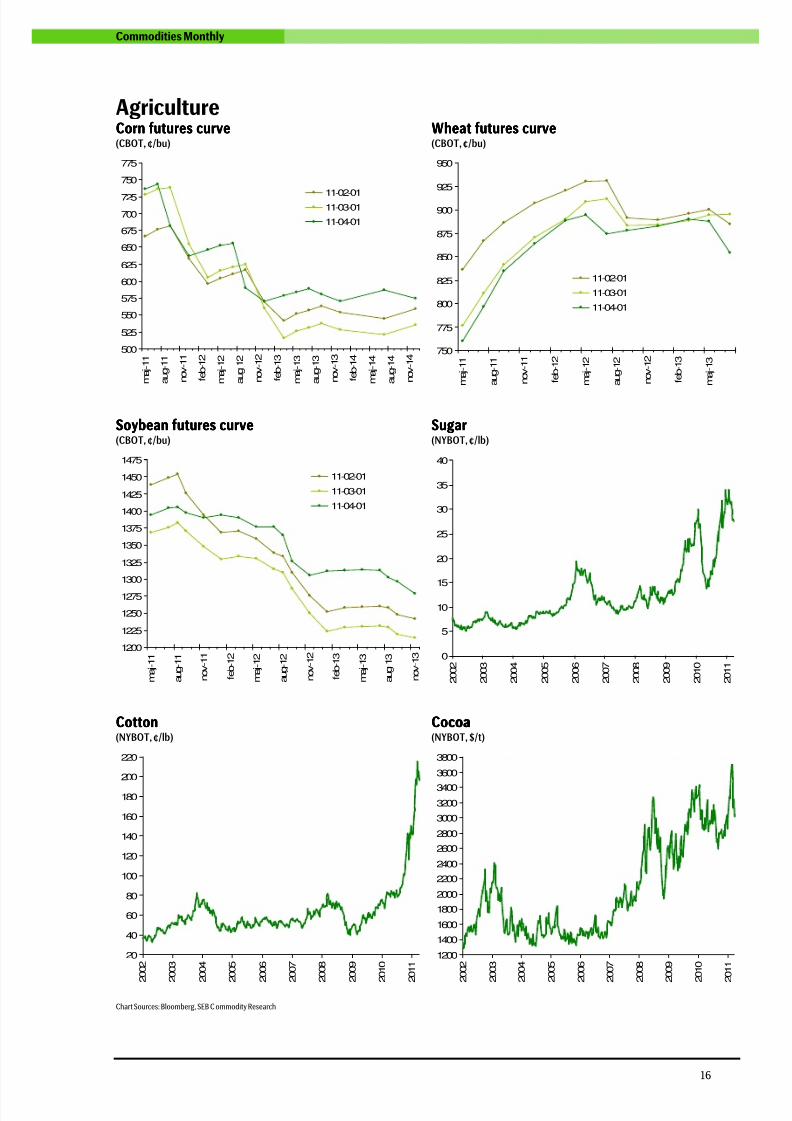
As the two most extreme examples of the effects of theLa Niña weather rally, this year’s fundamental outlook forcotton and sugar appears much improved. The Braziliansugar harvest has already begun to relieve very tightmarket inventories. Further, the production outlook isvery positive with a potential record crop in Thailand, thesecond largest exporter after Brazil. Concerning cotton, asharp rise in cotton acreage worldwide is expected inresponse to current high prices. In addition, the Chinesegovernment has taken measures to stimulate furtherplanting by announcing plans to rebuild strategicinventories at a guaranteed minimum price.
Grains pricesGrains pricesGrains pricesGrains prices(CBOT, indexed, weekly closing, January 2010 = 100)
70
80
90
100
110
120
130
140
150
160
170
180
190
jan-10
feb-10
mar-10
apr-10
maj-10
jun-10
jul-10
aug-10
sep-10
okt-10
nov-10
dec-10
jan-11
feb-11
mar-11
apr-11
Wheat
SoybeansCorn
YYYYear endear endear endear end graingraingraingrain inventoriesinventoriesinventoriesinventories (days of supply)(days of supply)(days of supply)(days of supply)(USDA, yearly data updated monthly)
50
60
70
80
90
100
110
120
130
00/01
01/02
02/03
03/04
04/05
05/06
06/07
07/08
08/09
09/10
10/11
Wheat
Soybeans
Corn
Chart Sources: Bloomberg, USDA, SEB Commodity Research
8/7/2019 SEB’s Commodities Monthly: Will oil kill the recovery?
http://slidepdf.com/reader/full/sebs-commodities-monthly-will-oil-kill-the-recovery 15/20
15
Commodities Monthly
AgricultureCornCornCornCorn Corn priceCorn priceCorn priceCorn price
(CBOT, ¢/bu, front month, weekly closing)
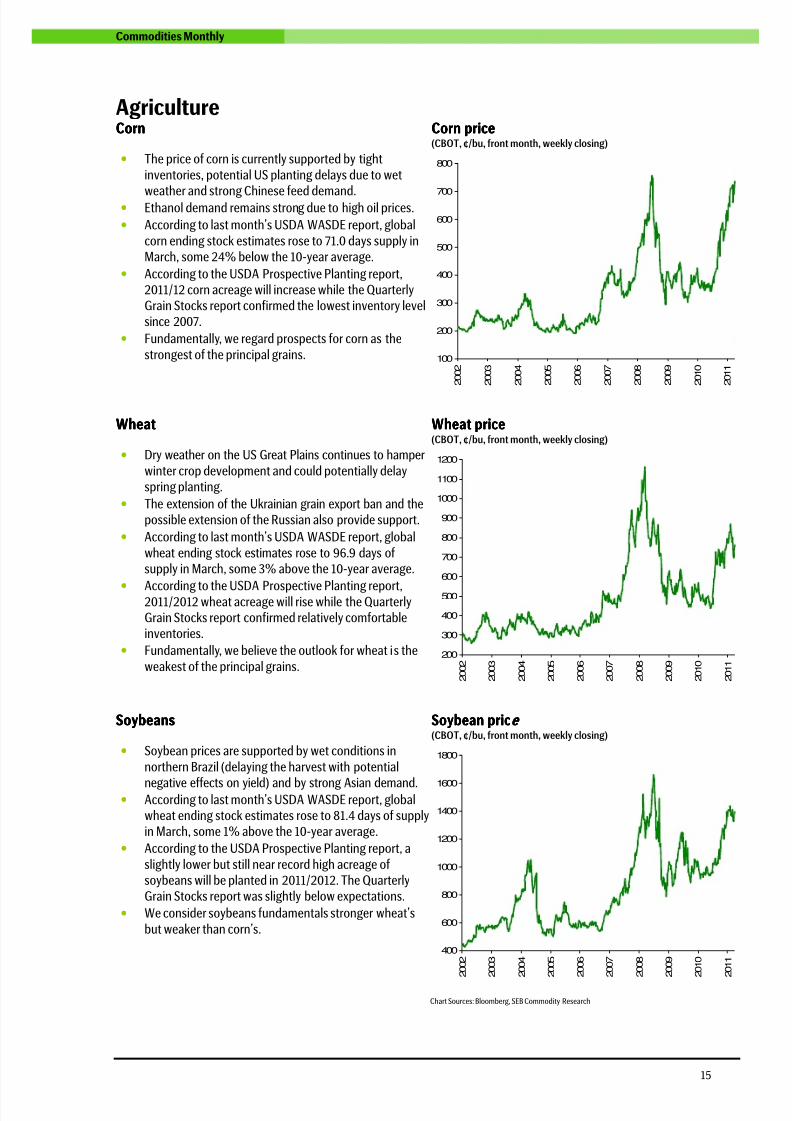
• The price of corn is currently supported by tight
inventories, potential US planting delays due to wet
weather and strong Chinese feed demand.• Ethanol demand remains strong due to high oil prices.
• According to last month’s USDA WASDE report, global
corn ending stock estimates rose to 71.0 days supply inMarch, some 24% below the 10-year average.
• According to the USDA Prospective Planting report,2011/12 corn acreage will increase while the QuarterlyGrain Stocks report confirmed the lowest inventory levelsince 2007.
• Fundamentally, we regard prospects for corn as the
strongest of the principal grains. 100
200
300
400
500
600
700
800
2002
2003
2004
2005
2006
2007
2008
2009
2010
2011
WheatWheatWheatWheat Wheat priceWheat priceWheat priceWheat price(CBOT, ¢/bu, front month, weekly closing)
• Dry weather on the US Great Plains continues to hamper
winter crop development and could potentially delayspring planting.
• The extension of the Ukrainian grain export ban and thepossible extension of the Russian also provide support.
• According to last month’s USDA WASDE report, global
wheat ending stock estimates rose to 96.9 days ofsupply in March, some 3% above the 10-year average.
•
According to the USDA Prospective Planting report,2011/2012 wheat acreage will rise while the QuarterlyGrain Stocks report confirmed relatively comfortableinventories.
• Fundamentally, we believe the outlook for wheat is the
weakest of the principal grains.200
300
400
500
600
700
800
900
1000
1100
1200
2002
2003
2004
2005
2006
2007
2008
2009
2010
2011
SoybeansSoybeansSoybeansSoybeans Soybean pricSoybean pricSoybean pricSoybean price ee e
(CBOT, ¢/bu, front month, weekly closing)
• Soybean prices are supported by wet conditions in
northern Brazil (delaying the harvest with potential
negative effects on yield) and by strong Asian demand.• According to last month’s USDA WASDE report, global
wheat ending stock estimates rose to 81.4 days of supplyin March, some 1% above the 10-year average.
• According to the USDA Prospective Planting report, a
slightly lower but still near record high acreage ofsoybeans will be planted in 2011/2012. The QuarterlyGrain Stocks report was slightly below expectations.
• We consider soybeans fundamentals stronger wheat’s
but weaker than corn’s.
400
600
800
1000
1200
1400
1600
1800
2002
2003
2004
2005
2006
2007
2008
2009
2010
2011
Chart Sources: Bloomberg, SEB Commodity Research
8/7/2019 SEB’s Commodities Monthly: Will oil kill the recovery?
http://slidepdf.com/reader/full/sebs-commodities-monthly-will-oil-kill-the-recovery 16/20
16
Commodities Monthly
AgricultureCornCornCornCorn futures curvefutures curvefutures curvefutures curve(CBOT, ¢/bu)
WheatWheatWheatWheat futures curvefutures curvefutures curvefutures curve(CBOT, ¢/bu)
500
525
550
575
600
625
650
675
700
725
750
775
maj-11
aug-11
nov-11
feb-12
maj-12
aug-12
nov-12
feb-13
maj-13
aug-13
nov-13
feb-14
maj-14
aug-14
nov-14
11-02-0111-03-01
11-04-01
750
775
800
825
850
875
900
925
950
maj-11
aug-11
nov-11
feb-12
maj-12
aug-12
nov-12
feb-13
maj-13
11-02-01
11-03-01
11-04-01
Soybean futures curveSoybean futures curveSoybean futures curveSoybean futures curve(CBOT, ¢/bu)
SugarSugarSugarSugar(NYBOT, ¢/lb)
1200
1225
1250
1275
1300
1325
1350
1375
1400
1425
1450
1475
maj-11
aug-11
nov-11
feb-12
maj-12
aug-12
nov-12
feb-13
maj-13
aug-13
nov-13
11-02-01
11-03-01
11-04-01
0
5
10
15
20
25
30
35
40
2002
2003
2004
2005
2006
2007
2008
2009
2010
2011
CottonCottonCottonCotton(NYBOT, ¢/lb)
CocoaCocoaCocoaCocoa(NYBOT, $/t)
20
40
60
80
100
120
140
160
180
200
220
2
002
2
003
2
004
2
005
2
006
2
007
2
008
2
009
2
010
2
011
1200
1400
1600
1800
2000
2200
2400
2600
2800
3000
3200
3400
3600
3800
2
002
2
003
2
004
2
005
2
006
2
007
2
008
2
009
2
010
2
011
Chart Sources: Bloomberg, SEB C ommodity Research
8/7/2019 SEB’s Commodities Monthly: Will oil kill the recovery?
http://slidepdf.com/reader/full/sebs-commodities-monthly-will-oil-kill-the-recovery 17/20
17
Commodities Monthly
Commodity related economic indicatorsEUROZONE Current Date Previous Date NextIndustrial production (%, YoY) 6,2 2011-01-31 8,9 2010-12-31 2011-04-13
Industrial production (%, MoM) 0,0 2011-01-31 0,3 2010-12-31 2011-04-13
Capacity utilization (%, sa) 80,0 2011-03-31 78,1 2010-12-31
Manufacturing PMI 57,5 2011-03-31 59,0 2011-02-28 2011-04-26
Real GDP (%, YoY) 2,0 2010-12-31 1,9 2010-09-30 2011-04-06
Real GDP (%, QoQ, sa) 0,3 2010-12-31 0,3 2010-09-30 2011-04-06
CPI (%, YoY) 2,4 2011-02-28 2,3 2011-01-31 2011-04-15
CPI (%, MoM) 0,4 2011-02-28 -0,7 2011-01-31 2011-04-15
Consumer confidence -10,6 2011-03-31 -10,0 2011-02-28 2011-04-18
USA
Industrial production (%, YoY) 5,8 2011-02-28 6,0 2011-01-31
Industrial production (%, MoM) 0,0 2011-02-28 0,2 2011-01-31 2011-04-15
Capacity utilization (%) 77,0 2011-02-28 77,1 2011-01-31 2011-04-15
Manufacturing PMI 61,2 2011-03-31 61,4 2011-02-28 2011-05-02
Real GDP (%, YoY) 2,8 2010-12-31 3,2 2010-09-30
Real GDP (%, QoQ, saar) 3,1 2010-12-31 2,6 2010-09-30 2011-04-28
CPI (%, MoM) 2,1 2011-02-28 1,6 2011-01-31 2011-04-15
CPI (%, MoM, sa) 0,5 2011-02-28 0,4 2011-01-31 2011-04-15
OECD Composite Leading Indicator 103,2 2011-01-31 102,5 2010-12-31
Consumer confidence (Michigan) 67,5 2011-03-31 77,5 2011-02-28 2011-04-15
Nonfarm payrolls (net change, sa, ‘000) 216 2011-03-31 194 2011-02-28 2011-05-06
JAPAN
Industrial production (%, YoY, nsa) 2,8 2011-02-28 3,5 2011-01-31 2011-04-15
Industrial production (%, MoM, sa) 0,4 2011-02-28 1,3 2011-01-31 2011-04-15
Capacity utilization (%, sa) 92,5 2011-01-31 89,3 2010-12-31
Manufacturing PMI 46,4 2011-03-31 52,9 2011-02-28
Real GDP (%, YoY, nsa) 2,2 2010-12-31 4,9 2010-09-30
Real GDP (%, QoQ, sa) -0,3 2010-12-31 0,8 2010-09-30 2011-05-19
CPI (%, YoY) -0,3 2011-03-31 -0,1 2011-02-28 2011-04-28
CPI (%, MoM) -0,1 2011-02-28 -0,2 2011-01-31
OECD Composite Leading Indicator 104,7 2011-01-31 103,9 2010-12-31
Consumer confidence 40,7 2011-02-28 41,1 2011-01-31 2011-04-19
CHINAIndustrial production (%, YoY) 14,9 2011-02-28 13,5 2010-12-31 2011-04-15
Manufacturing PMI 53,4 2011-03-31 52,2 2011-02-28 2011-05-01
Real GDP (%, YoY) 9,8 2010-12-31 9,6 2010-09-30 2011-04-15
CPI (%, YoY) 4,9 2011-02-28 4,9 2011-01-31 2011-04-15
OECD Composite Leading Indicator 101,6 2011-01-31 101,7 2010-12-31
Consumer confidence 99,6 2011-02-28 99,9 2011-01-31
Bank lending (%, YoY) 17,7 2011-02-28 18,5 2011-01-31
Fixed asset investment (%, YoY) 23,8 2010-12-31 24,0 2010-09-30
OTHER
OECD Area Comp. Leading Indicator 103,1 2011-01-31 102,8 2010-12-31
Global manufacturing PMI 55,8 2011-03-31 57,4 2011-02-28
Sources: Bloomberg, SEB Commodity Research
8/7/2019 SEB’s Commodities Monthly: Will oil kill the recovery?
http://slidepdf.com/reader/full/sebs-commodities-monthly-will-oil-kill-the-recovery 18/20
18
Commodities Monthly
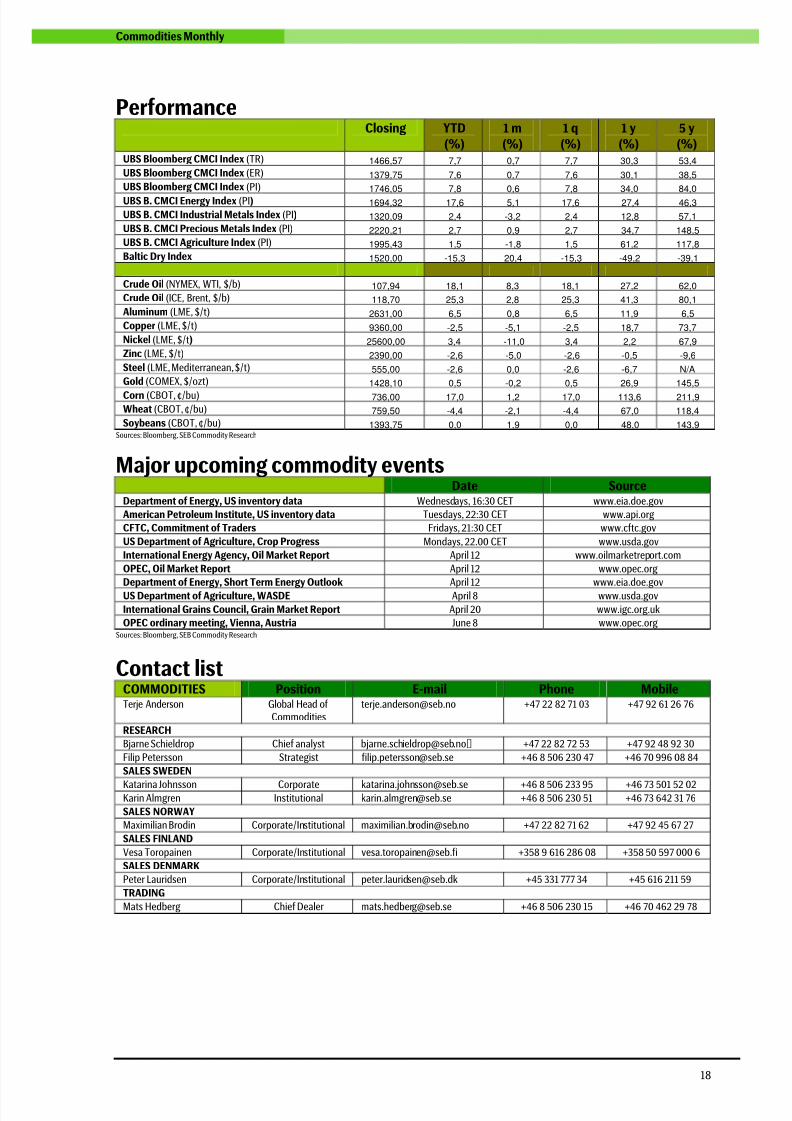
PerformanceClosing YTD
(%)1 m(%)
1 q(%)
1 y(%)
5 y(%)
UBS Bloomberg CMCI Index (TR) 1466,57 7,7 0,7 7,7 30,3 53,4
UBS Bloomberg CMCI Index (ER) 1379,75 7,6 0,7 7,6 30,1 38,5
UBS Bloomberg CMCI Index (PI) 1746,05 7,8 0,6 7,8 34,0 84,0
UBS B. CMCI Energy Index (PI) 1694,32 17,6 5,1 17,6 27,4 46,3
UBS B. CMCI Industrial Metals Index (PI) 1320,09 2,4 -3,2 2,4 12,8 57,1
UBS B. CMCI Precious Metals Index (PI) 2220,21 2,7 0,9 2,7 34,7 148,5
UBS B. CMCI Agriculture Index (PI) 1995,43 1,5 -1,8 1,5 61,2 117,8
Baltic Dry Index 1520,00 -15,3 20,4 -15,3 -49,2 -39,1
Crude Oil (NYMEX, WTI, $/b) 107,94 18,1 8,3 18,1 27,2 62,0
Crude Oil (ICE, Brent, $/b) 118,70 25,3 2,8 25,3 41,3 80,1
Aluminum (LME, $/t) 2631,00 6,5 0,8 6,5 11,9 6,5
Copper (LME, $/t) 9360,00 -2,5 -5,1 -2,5 18,7 73,7
Nickel (LME, $/t) 25600,00 3,4 -11,0 3,4 2,2 67,9
Zinc (LME, $/t) 2390,00 -2,6 -5,0 -2,6 -0,5 -9,6
Steel (LME, Mediterranean, $/t) 555,00 -2,6 0,0 -2,6 -6,7 N/A
Gold (COMEX, $/ozt) 1428,10 0,5 -0,2 0,5 26,9 145,5
Corn (CBOT, ¢/bu) 736,00 17,0 1,2 17,0 113,6 211,9
Wheat (CBOT, ¢/bu) 759,50 -4,4 -2,1 -4,4 67,0 118,4
Soybeans (CBOT, ¢/bu) 1393,75 0,0 1,9 0,0 48,0 143,9Sources: Bloomberg, SEB Commodity Research
Major upcoming commodity eventsDate Source
Department of Energy, US inventory data Wednesdays, 16:30 CET www.eia.doe.gov
American Petroleum Institute, US inventory data Tuesdays, 22:30 CET www.api.org
CFTC, Commitment of Traders Fridays, 21:30 CET www.cftc.gov
US Department of Agriculture, Crop Progress Mondays, 22.00 CET www.usda.gov
International Energy Agency, Oil Market Report April 12 www.oilmarketreport.com
OPEC, Oil Market Report April 12 www.opec.org
Department of Energy, Short Term Energy Outlook April 12 www.eia.doe.gov
US Department of Agriculture, WASDE April 8 www.usda.gov
International Grains Council, Grain Market Report April 20 www.igc.org.uk
OPEC ordinary meeting, Vienna, Austria June 8 www.opec.orgSources: Bloomberg, SEB Commodity Research
Contact listCOMMODITIES Position E-mail Phone MobileTerje Anderson Global Head of
[email protected] +47 22 82 71 03 +47 92 61 26 76
RESEARCH
Bjarne Schieldrop Chief analyst [email protected] +47 22 82 72 53 +47 92 48 92 30
Filip Petersson Strategist [email protected] +46 8 506 230 47 +46 70 996 08 84
SALES SWEDEN
Katarina Johnsson Corporate [email protected] +46 8 506 233 95 +46 73 501 52 02Karin Almgren Institutional [email protected] +46 8 506 230 51 +46 73 642 31 76
SALES NORWAY
Maximilian Brodin Corporate/Institutional [email protected] +47 22 82 71 62 +47 92 45 67 27
SALES FINLAND
Vesa Toropainen Corporate/Institutional [email protected] +358 9 616 286 08 +358 50 597 000 6
SALES DENMARK
Peter Lauridsen Corporate/Institutional [email protected] +45 331 777 34 +45 616 211 59
TRADING
Mats Hedberg Chief Dealer [email protected] +46 8 506 230 15 +46 70 462 29 78
8/7/2019 SEB’s Commodities Monthly: Will oil kill the recovery?
http://slidepdf.com/reader/full/sebs-commodities-monthly-will-oil-kill-the-recovery 19/20
19
Commodities Monthly
DISCLAIMER & CONFIDENTIALITY NOTICE
The information in this document has been compiled by SEB Merchant Banking, a division within Skandinaviska EnskildaBanken AB (publ) (“SEB”).
Opinions contained in this report represent the bank’s present opinion only and are subject to change without notice. All
information contained in this report has been compiled in good faith from sources believed to be reliable. However, norepresentation or warranty, expressed or implied, is made with respect to the completeness or accuracy of its contents andthe information is not to be relied upon as authoritative. Anyone considering taking actions based upon the content of thisdocument is urged to base his or her investment decisions upon such investigations as he or she deems necessary. Thisdocument is being provided as information only, and no specific actions are being solicited as a result of it; to the extentpermitted by law, no liability whatsoever is accepted for any direct or consequential loss arising from use of this documentor its contents.
SEB is a public company incorporated in Stockholm, Sweden, with limited liability. It is a participant at major Nordic andother European Regulated Markets and Multilateral Trading Facilities (as well as some non-European equivalent markets)for trading in financial instruments, such as markets operated by NASDAQ OMX, NYSE Euronext, London Stock Exchange,Deutsche Börse, Swiss Exchanges, Turquoise and Chi-X. SEB is authorized and regulated by Finansinspektionen in Sweden;
it is authorized and subject to limited regulation by the Financial Services Authority for the conduct of designatedinvestment business in the UK, and is subject to the provisions of relevant regulators in all other jurisdictions where SEBconducts operations.
SEB Merchant Banking. All rights reserved.
SEB Commodity Research
Bjarne Schieldrop, Chief Commodity [email protected]
+47 9248 9230
Filip Petersson, Commodity [email protected]
+46 8 506 230 47

8/7/2019 SEB’s Commodities Monthly: Will oil kill the recovery?
http://slidepdf.com/reader/full/sebs-commodities-monthly-will-oil-kill-the-recovery 20/20
www.seb.se/mb