Embed Size (px)
Citation preview

8/7/2019 SEB report: Giddy euphoria about the Swedish economy
http://slidepdf.com/reader/full/seb-report-giddy-euphoria-about-the-swedish-economy 1/55
Recovery becoming moreself-sustaining
Faster Nordic key rate hikes
Nordic OutlookEconomic Research – February 2011
8/7/2019 SEB report: Giddy euphoria about the Swedish economy
http://slidepdf.com/reader/full/seb-report-giddy-euphoria-about-the-swedish-economy 2/55
Contents
Nordic Outlook – February 2011 | 3
International overview 5
Theme: A model for long-term equilibriumexhange rates (SEBEER) 15
The United States 16
Japan 22
Asia 23
The euro zone 26
The United Kingdom 32
Eastern Europe 33
The Baltics 34
Sweden 36
Denmark 45
Norway 46
Finland 50
Economic data 51
Boxes
Risk and opportunities in North Africa 6
“United Debt of Europe” 8
Continued high commodity prices 10
Falling private sector savings boosts GDP 17
Home price drop jeopardises recovery 18
Little risk of 1970s-style stagation 20
Obama rebounding 21
China’s twelfth ve-year plan, 2011-2015 25
ECB questioning core ination as an indicator 31
The Riksbank and macro supervisory rules 41
Fiscal policy has an expansionary bias 47

8/7/2019 SEB report: Giddy euphoria about the Swedish economy
http://slidepdf.com/reader/full/seb-report-giddy-euphoria-about-the-swedish-economy 3/55
4 | Nordic Outlook – February 2011
Economic Research
This report was published on February 8, 2011.
Cut-off date for calculations and foreasts was February 3, 2011.
Robert Bergqvist Håkan FrisénChief Economist Head of Economic Research+ 46 8 506 230 16 + 46 8 763 80 67
Daniel Bergvall Mattias BruérEconomist Economist+46 8 763 85 94 + 46 8 763 85 06
Ann Enshagen Lavebrink Mikael Johansson
Editorial Assistant Economist+ 46 8 763 80 77 + 46 8 763 80 93
Andreas Johnson Tomas LindströmEconomist Economist+46 8 763 80 32 + 46 8 763 80 28
Gunilla Nyström Ingela HemmingGlobal Head of Personal Finance Research Global Head of Small Business Research+ 46 8 763 65 81 + 46 8 763 82 97
Susanne Eliasson Johanna WahlstenPersonal Finance Analyst Small Business Analyst+ 46 8 763 65 88 + 46 8 763 80 72
SEB Economic Research, K-A3, SE-106 40 Stockholm
Contributions to this report have been made by Thomas Köbel, SEB Frankfurt/M and Olle Holmgren,
Trading Strategy. Stein Bruun and Erica Blomgren, SEB Oslo are responsible for the Norwegian analysis.
8/7/2019 SEB report: Giddy euphoria about the Swedish economy
http://slidepdf.com/reader/full/seb-report-giddy-euphoria-about-the-swedish-economy 4/55
International overview
Nordic Outlook – February 2011 | 5
The recovery is becoming more self-sustaining Stronger momentum as the US accelerates
Ination will fall − increasing focus onresource utilisation
ECB hike in September, Fed only in 2012
The Riksbank will speed up its rate hikes
Long-term yields sideways next 6 months
Nordic currencies will keep appreciating
In recent months, the global economic outlook has
improved. US growth expectations have risen. Fiscal
policy will be more expansionary in 2011, now that
Congress has resolved important taxation issues. In
addition, the American recovery is entering a more
self-sustaining phase, despite lingering problems in
the labour and housing markets. Emerging economies,
especially in Asia, are continuing their strong expan-
sion although tighter economic policies will now lead
to a slight deceleration. In Europe, economic signals
are more mixed. In Germany and the Nordic countries,
2011 growth will be stronger than we had previously
expected. The United Kingdom is now beginning to feel
the impact of tight scal policy. In southern Europe and
Ireland, growth will be hampered by continued nancial
turmoil and necessary budget consolidation measures.
Overall, we foresee above-trend GDP growth in the 34
countries of the Organisation for Economic Cooperation
and Development (OECD). We expect GDP increases of
2.8 per cent both in 2011 and 2012, representing an
upward revision of 0.5 and 0.3 percentage points.
The world economy still faces a number of challenges.
Sovereign debts continue to grow, and acute crises inseveral euro zone countries have still not been re-
solved. Global imbalances remain large and a restruc-
turing of the nancial system is under way, yet the
world economy seems to be entering a new phase. In
the corporate sector, optimism is record-high. Strong
balance sheets, expansionary policies and large global
growth potential dominate the picture. Given a more
self-sustaining economic upturn, the focus of nancial
markets and economic policy makers is shifting towards
more traditional economic variables such as growth,
ination and the labour market.
This shift has occurred only after the American econo-my reached slightly rmer ground, yet the world that is
now taking shape has changed in many ways. The role
of the US has weakened, while China and other emerg-
ing economies have increased both their economic and
political clout. Germany’s pivotal role in Europe has
been further conrmed by the euro zone debt crisis and
its nancial consequences. The Nordic economies have
also emerged stronger from the crisis, and Swedish GDP
growth stands out in an international perspective. The
Nordic model is again a focus of international debate.
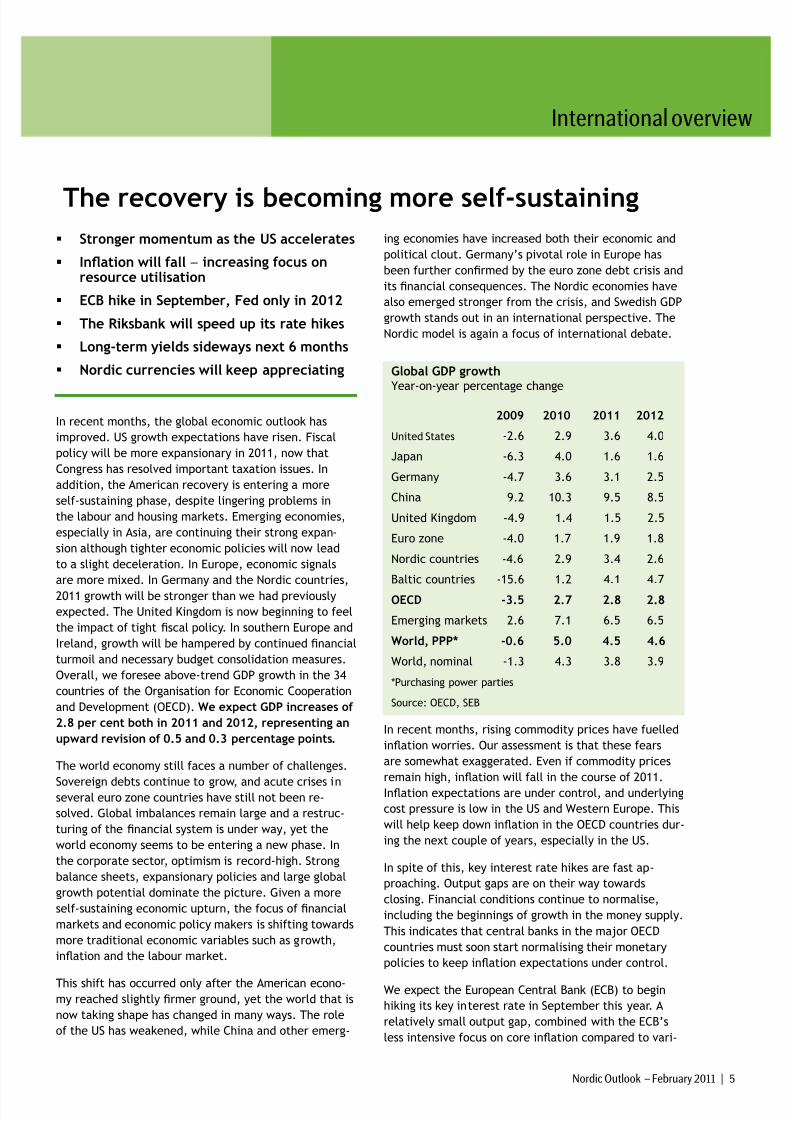
Global GDP growth Year-on-year percentage change
2009 2010 2011 2012
United States -2.6 2.9 3.6 4.0
Japan -6.3 4.0 1.6 1.6
Germany -4.7 3.6 3.1 2.5
China 9.2 10.3 9.5 8.5
United Kingdom -4.9 1.4 1.5 2.5
Euro zone -4.0 1.7 1.9 1.8
Nordic countries -4.6 2.9 3.4 2.6
Baltic countries -15.6 1.2 4.1 4.7
OECD -3.5 2.7 2.8 2.8
Emerging markets 2.6 7.1 6.5 6.5
World, PPP* -0.6 5.0 4.5 4.6
World, nominal -1.3 4.3 3.8 3.9
*Purchasing power parties
Source: OECD, SEB
In recent months, rising commodity prices have fuelled
ination worries. Our assessment is that these fears
are somewhat exaggerated. Even if commodity prices
remain high, ination will fall in the course of 2011.
Ination expectations are under control, and underlying
cost pressure is low in the US and Western Europe. This
will help keep down ination in the OECD countries dur-
ing the next couple of years, especially in the US.
In spite of this, key interest rate hikes are fast ap-
proaching. Output gaps are on their way towards
closing. Financial conditions continue to normalise,
including the beginnings of growth in the money supply.
This indicates that central banks in the major OECD
countries must soon start normalising their monetary
policies to keep ination expectations under control.
We expect the European Central Bank (ECB) to begin
hiking its key interest rate in September this year. A
relatively small output gap, combined with the ECB’s
less intensive focus on core ination compared to vari-
8/7/2019 SEB report: Giddy euphoria about the Swedish economy
http://slidepdf.com/reader/full/seb-report-giddy-euphoria-about-the-swedish-economy 5/55
6 | Nordic Outlook – February 2011
International overview
ous other central banks, will contribute to earlier rate
hikes. To some extent, the expansion of the European
nancial stability mechanism (ESFS/ESM) is also taking
pressure off the ECB, enabling the bank to focus to a
greater extent on its main task: ensuring price stabil-
ity. High ination gures will also help to persuade the
Bank of England (BoE) to begin key rate hikes beforethe end of 2011. Because of high unemployment and
a continued decline in core ination, the US Federal
Reserve (Fed) will hold off until April 2012 before begin-
ning its rate hikes.
The Nordic central banks will continue raising their key
interest rates. Partly due to rapidly climbing resource
utilisation, Sweden’s Riksbank will adopt a more aggres-
sive stance during 2011. We expect it to hike the repo
rate to 2.75 per cent by year-end. Norges Bank, too,
will nd it easier to raise its deposit rate in response to
Norwegian domestic conditions once the ECB and BoE
also begin hiking their key rates.
The US: Private saving now falling againAmerican economic signals have gradually become more
optimistic since worries about a double dip recession
culminated in August 2010. At rst, the Fed’s quantita-
tive easing (QE) helped restore condence. The scal
policy agreements reached in December were also
important to the 2011 growth outlook, not least by
blunting the sharp conicts that dominated Congress
last autumn. This is among the reasons why we have
revised our GDP forecast for 2011 upward from 2.2 to
3.6 per cent.
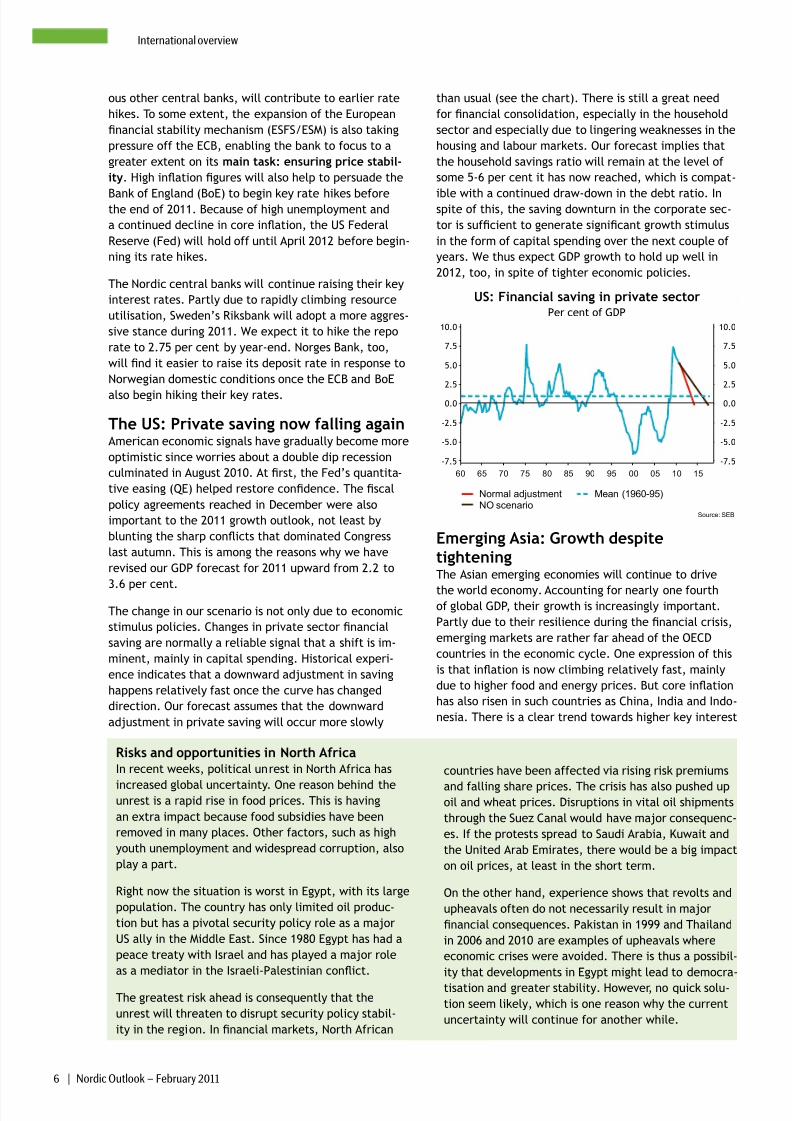
The change in our scenario is not only due to economic
stimulus policies. Changes in private sector nancial
saving are normally a reliable signal that a shift is im-
minent, mainly in capital spending. Historical experi-
ence indicates that a downward adjustment in saving
happens relatively fast once the curve has changed
direction. Our forecast assumes that the downward
adjustment in private saving will occur more slowly
than usual (see the chart). There is still a great need
for nancial consolidation, especially in the household
sector and especially due to lingering weaknesses in the
housing and labour markets. Our forecast implies that
the household savings ratio will remain at the level of
some 5-6 per cent it has now reached, which is compat-
ible with a continued draw-down in the debt ratio. Inspite of this, the saving downturn in the corporate sec-
tor is sufcient to generate signicant growth stimulus
in the form of capital spending over the next couple of
years. We thus expect GDP growth to hold up well in
2012, too, in spite of tighter economic policies.
Per cent of GDP
US: Financial saving in private sector
Normal adjustmentNO scenario
Mean (1960-95)
Source: SEB
60 65 70 75 80 85 90 95 00 05 10 15
-7.5
-5.0
-2.5
0.0
2.5
5.0
7.5
10.0
-7.5
-5.0
-2.5
0.0
2.5
5.0
7.5
10.0
Emerging Asia: Growth despitetighteningThe Asian emerging economies will continue to drive
the world economy. Accounting for nearly one fourthof global GDP, their growth is increasingly important.
Partly due to their resilience during the nancial crisis,
emerging markets are rather far ahead of the OECD
countries in the economic cycle. One expression of this
is that ination is now climbing relatively fast, mainly
due to higher food and energy prices. But core ination
has also risen in such countries as China, India and Indo-
nesia. There is a clear trend towards higher key interest
Risks and opportunities in North AfricaIn recent weeks, political unrest in North Africa has
increased global uncertainty. One reason behind theunrest is a rapid rise in food prices. This is having
an extra impact because food subsidies have been
removed in many places. Other factors, such as high
youth unemployment and widespread corruption, also
play a part.
Right now the situation is worst in Egypt, with its large
population. The country has only limited oil produc-
tion but has a pivotal security policy role as a major
US ally in the Middle East. Since 1980 Egypt has had a
peace treaty with Israel and has played a major role
as a mediator in the Israeli-Palestinian conict.
The greatest risk ahead is consequently that the
unrest will threaten to disrupt security policy stabil-
ity in the region. In nancial markets, North African
countries have been affected via rising risk premiums
and falling share prices. The crisis has also pushed upoil and wheat prices. Disruptions in vital oil shipments
through the Suez Canal would have major consequenc-
es. If the protests spread to Saudi Arabia, Kuwait and
the United Arab Emirates, there would be a big impact
on oil prices, at least in the short term.
On the other hand, experience shows that revolts and
upheavals often do not necessarily result in major
nancial consequences. Pakistan in 1999 and Thailand
in 2006 and 2010 are examples of upheavals where
economic crises were avoided. There is thus a possibil-
ity that developments in Egypt might lead to democra-
tisation and greater stability. However, no quick solu-tion seem likely, which is one reason why the current
uncertainty will continue for another while.
8/7/2019 SEB report: Giddy euphoria about the Swedish economy
http://slidepdf.com/reader/full/seb-report-giddy-euphoria-about-the-swedish-economy 6/55
Nordic Outlook – February 2011 | 7
International overview
rates. In India, for example, the real key rate is well
into negative territory, while economic growth is nearly
9 per cent a year. Many Asian central banks seem more
and more uncomfortable with excessively accommoda-
tive monetary policies. We can thus expect continued
key interest rate hikes during 2011.
Real key rates in selected countriesPer cent
K ey rate Ination Real SEBkey rate forecast
GDP 2011 India 6.5 8.4 -1.9 8.5
Indonesia 6.5 7.0 -0.5 6.3
China 5.8 4.6 1.2 9.5
Euro zone 1.0 2.2 -1.2 1.9
Japan 0.1 0.0 0.1 1.6
United States 0.25 1.5 -1.2 3.6
Source: National statistical ofces, OECD, SEB
Because of their higher trend growth and earlier posi-
tion in the economic cycle, the differences between
nominal emerging market interest rates and those in
the OECD countries will increase this year. This may ex-
acerbate the problems connected to speculative capital
inows, including bubble tendencies in asset markets.
But to a greater extent than before, many countries
seem to accept currency appreciation as an element
of ination-ghting. One reason is that greater risks of
rising food prices might lead to social unrest.
We still foresee an Asian soft landing as the most likely
scenario. Tighter economic policies will decelerate
growth to more sustainable levels, which in the long
term are around 6 per cent. Ination will peak during
the rst half of 2011 and then decline.
Western Europe: Out of stepThe euro zone continues to be characterised by a two-
speed economy. The recovery in Germany is progress-
ing at a rapid pace. Optimism is at record-high levels,
according to the IFO sentiment index. Unemployment
has fallen to its lowest level since 1992. We expect
German GDP to climb by 3.1 per cent in 2011, a bit
less than last year’s 3.6 per cent. Meanwhile powerful
austerity programmes in southern Europe will hamper
growth in the euro zone as a whole. This year, GDP will
fall in Greece and Portugal and will be close to zero in
Spain and Ireland. In France and Italy, growth will end
up around 1½ per cent, both this year and next. Due to
structural decits in both countries, however they also
have a major need for scal austerity measures. Overall
euro zone growth will end up at 1.9 per cent this
year and 1.8 per cent in 2012, somewhat higher than
we believed in November.
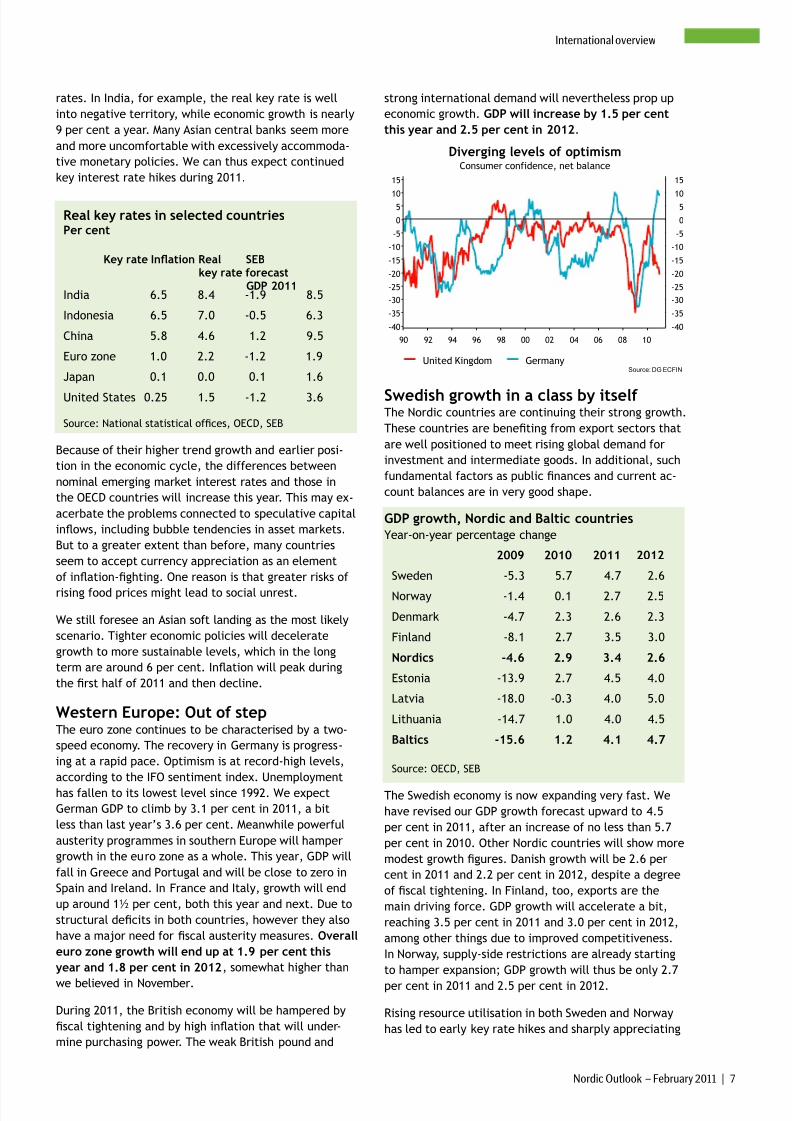
During 2011, the British economy will be hampered by
scal tightening and by high ination that will under-
mine purchasing power. The weak British pound and
strong international demand will nevertheless prop up
economic growth. GDP will increase by 1.5 per cent
this year and 2.5 per cent in 2012.
Consumer confidence, net balance
Diverging levels of optimism
United Kingdom GermanySource: DG ECFIN
90 92 94 96 98 00 02 04 06 08 10
-40
-35
-30
-25
-20
-15
-10
-5
0
510
15
-40
-35
-30
-25
-20
-15
-10
-5
0
510
15
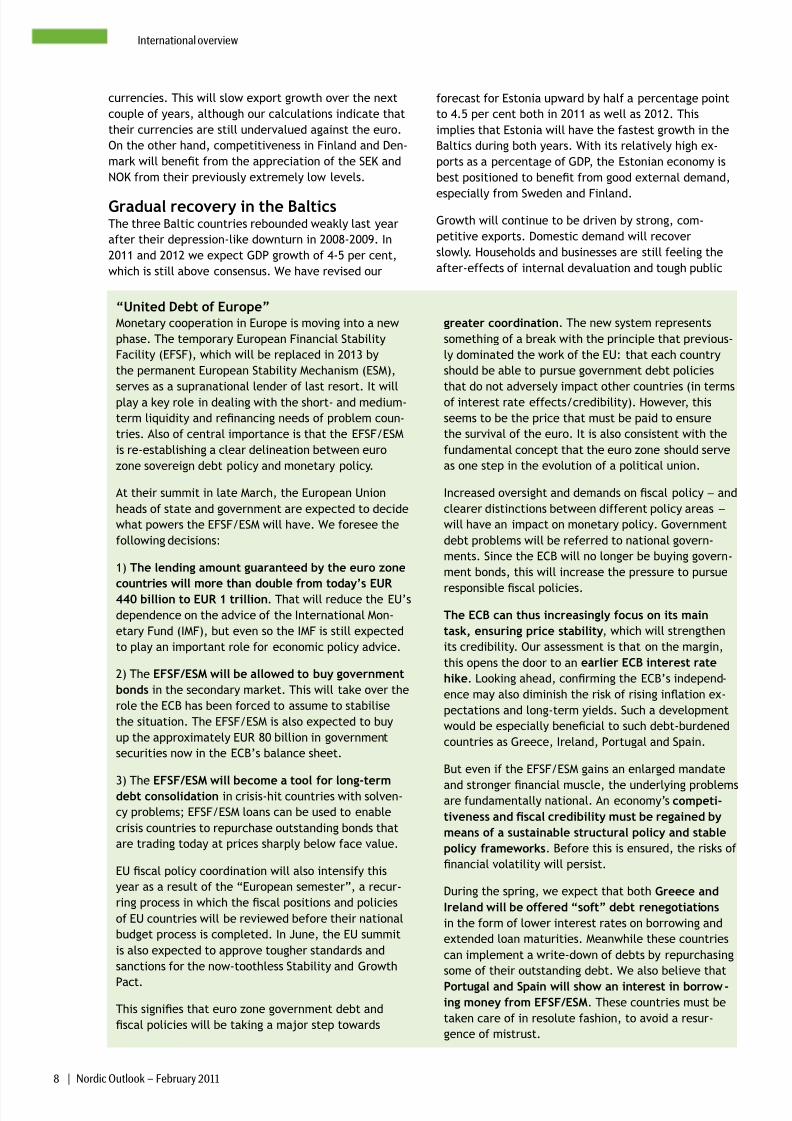
Swedish growth in a class by itself The Nordic countries are continuing their strong growth.
These countries are beneting from export sectors that
are well positioned to meet rising global demand for
investment and intermediate goods. In additional, such
fundamental factors as public nances and current ac-
count balances are in very good shape.
GDP growth, Nordic and Baltic countries Year-on-year percentage change
2009 2010 2011 2012
Sweden -5.3 5.7 4.7 2.6
Norway -1.4 0.1 2.7 2.5
Denmark -4.7 2.3 2.6 2.3
Finland -8.1 2.7 3.5 3.0
Nordics -4.6 2.9 3.4 2.6
Estonia -13.9 2.7 4.5 4.0
Latvia -18.0 -0.3 4.0 5.0
Lithuania -14.7 1.0 4.0 4.5
Baltics -15.6 1.2 4.1 4.7
Source: OECD, SEB
The Swedish economy is now expanding very fast. We
have revised our GDP growth forecast upward to 4.5
per cent in 2011, after an increase of no less than 5.7
per cent in 2010. Other Nordic countries will show more
modest growth gures. Danish growth will be 2.6 per
cent in 2011 and 2.2 per cent in 2012, despite a degree
of scal tightening. In Finland, too, exports are the
main driving force. GDP growth will accelerate a bit,
reaching 3.5 per cent in 2011 and 3.0 per cent in 2012,
among other things due to improved competitiveness.
In Norway, supply-side restrictions are already starting
to hamper expansion; GDP growth will thus be only 2.7
per cent in 2011 and 2.5 per cent in 2012.
Rising resource utilisation in both Sweden and Norway
has led to early key rate hikes and sharply appreciating
8/7/2019 SEB report: Giddy euphoria about the Swedish economy
http://slidepdf.com/reader/full/seb-report-giddy-euphoria-about-the-swedish-economy 7/55
8 | Nordic Outlook – February 2011
International overview
“United Debt of Europe”Monetary cooperation in Europe is moving into a new
phase. The temporary European Financial Stability
Facility (EFSF), which will be replaced in 2013 by
the permanent European Stability Mechanism (ESM),
serves as a supranational lender of last resort. It willplay a key role in dealing with the short- and medium-
term liquidity and renancing needs of problem coun-
tries. Also of central importance is that the EFSF/ESM
is re-establishing a clear delineation between euro
zone sovereign debt policy and monetary policy.
At their summit in late March, the European Union
heads of state and government are expected to decide
what powers the EFSF/ESM will have. We foresee the
following decisions:
1) The lending amount guaranteed by the euro zone
countries will more than double from today’s EUR 440 billion to EUR 1 trillion. That will reduce the EU’s
dependence on the advice of the International Mon-
etary Fund (IMF), but even so the IMF is still expected
to play an important role for economic policy advice.
2) The EFSF/ESM will be allowed to buy government
bonds in the secondary market. This will take over the
role the ECB has been forced to assume to stabilise
the situation. The EFSF/ESM is also expected to buy
up the approximately EUR 80 billion in government
securities now in the ECB’s balance sheet.
3) The EFSF/ESM will become a tool for long-termdebt consolidation in crisis-hit countries with solven-
cy problems; EFSF/ESM loans can be used to enable
crisis countries to repurchase outstanding bonds that
are trading today at prices sharply below face value.
EU scal policy coordination will also intensify this
year as a result of the “European semester”, a recur-
ring process in which the scal positions and policies
of EU countries will be reviewed before their national
budget process is completed. In June, the EU summit
is also expected to approve tougher standards and
sanctions for the now-toothless Stability and Growth
Pact.
This signies that euro zone government debt and
scal policies will be taking a major step towards
greater coordination. The new system represents
something of a break with the principle that previous-
ly dominated the work of the EU: that each country
should be able to pursue government debt policies
that do not adversely impact other countries (in termsof interest rate effects/credibility). However, this
seems to be the price that must be paid to ensure
the survival of the euro. It is also consistent with the
fundamental concept that the euro zone should serve
as one step in the evolution of a political union.
Increased oversight and demands on scal policy − and
clearer distinctions between different policy areas −
will have an impact on monetary policy. Government
debt problems will be referred to national govern-
ments. Since the ECB will no longer be buying govern-
ment bonds, this will increase the pressure to pursue
responsible scal policies.
The ECB can thus increasingly focus on its main
task, ensuring price stability, which will strengthen
its credibility. Our assessment is that on the margin,
this opens the door to an earlier ECB interest rate
hike. Looking ahead, conrming the ECB’s independ-
ence may also diminish the risk of rising ination ex-
pectations and long-term yields. Such a development
would be especially benecial to such debt-burdened
countries as Greece, Ireland, Portugal and Spain.
But even if the EFSF/ESM gains an enlarged mandate
and stronger nancial muscle, the underlying problemsare fundamentally national. An economy’s competi-
tiveness and scal credibility must be regained by
means of a sustainable structural policy and stable
policy frameworks. Before this is ensured, the risks of
nancial volatility will persist.
During the spring, we expect that both Greece and
Ireland will be offered “soft” debt renegotiations
in the form of lower interest rates on borrowing and
extended loan maturities. Meanwhile these countries
can implement a write-down of debts by repurchasing
some of their outstanding debt. We also believe that
Portugal and Spain will show an interest in borrow-
ing money from EFSF/ESM. These countries must be
taken care of in resolute fashion, to avoid a resur-
gence of mistrust.
currencies. This will slow export growth over the next
couple of years, although our calculations indicate that
their currencies are still undervalued against the euro.
On the other hand, competitiveness in Finland and Den-
mark will benet from the appreciation of the SEK and
NOK from their previously extremely low levels.
Gradual recovery in the BalticsThe three Baltic countries rebounded weakly last year
after their depression-like downturn in 2008-2009. In
2011 and 2012 we expect GDP growth of 4-5 per cent,
which is still above consensus. We have revised our
forecast for Estonia upward by half a percentage point
to 4.5 per cent both in 2011 as well as 2012. This
implies that Estonia will have the fastest growth in the
Baltics during both years. With its relatively high ex-
ports as a percentage of GDP, the Estonian economy is
best positioned to benet from good external demand,
especially from Sweden and Finland.
Growth will continue to be driven by strong, com-
petitive exports. Domestic demand will recover
slowly. Households and businesses are still feeling the
after-effects of internal devaluation and tough public
8/7/2019 SEB report: Giddy euphoria about the Swedish economy
http://slidepdf.com/reader/full/seb-report-giddy-euphoria-about-the-swedish-economy 8/55
Nordic Outlook – February 2011 | 9
International overview
budget consolidation; in Latvia, budget austerity meas-
ures will continue. Unemployment will fall slowly, and
at the end of 2012 it will remain far higher than before
the crisis. Ination is being pushed up by international
energy and food price increases. Underlying price pres-
sures remain low but will climb gradually.
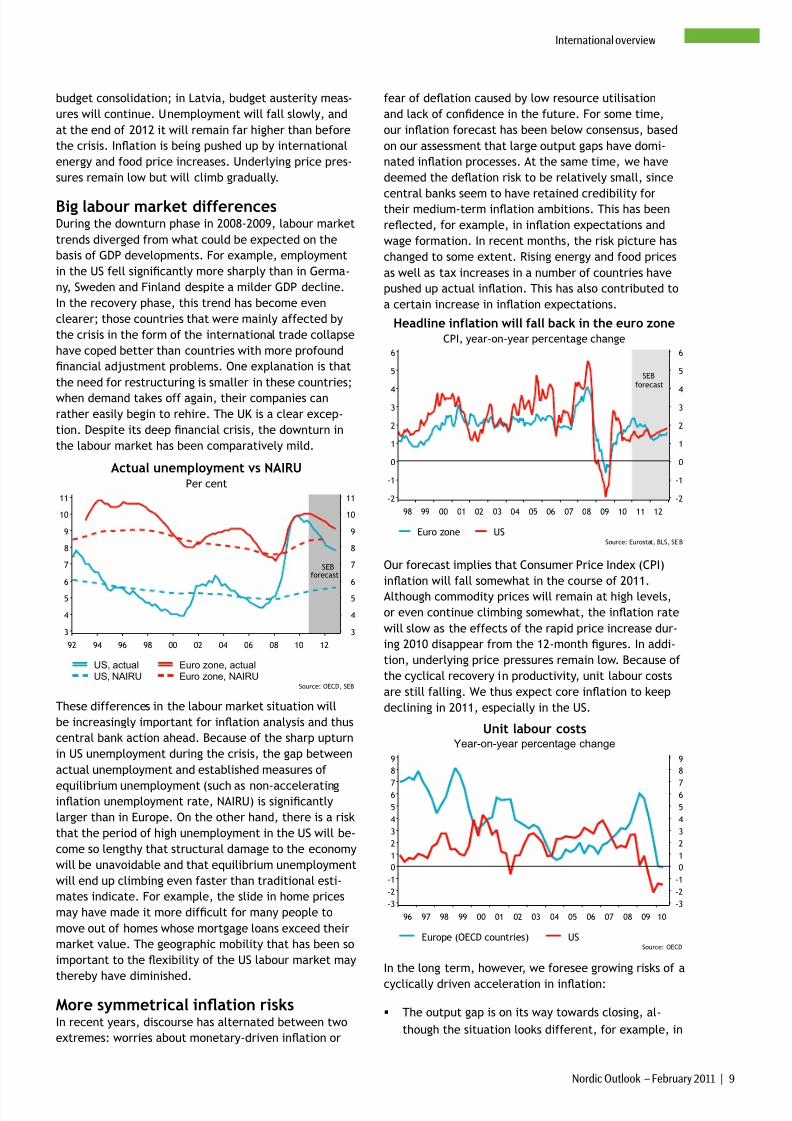
Big labour market differencesDuring the downturn phase in 2008-2009, labour market
trends diverged from what could be expected on the
basis of GDP developments. For example, employment
in the US fell signicantly more sharply than in Germa-
ny, Sweden and Finland despite a milder GDP decline.
In the recovery phase, this trend has become even
clearer; those countries that were mainly affected by
the crisis in the form of the international trade collapse
have coped better than countries with more profound
nancial adjustment problems. One explanation is that
the need for restructuring is smaller in these countries;
when demand takes off again, their companies can
rather easily begin to rehire. The UK is a clear excep-
tion. Despite its deep nancial crisis, the downturn in
the labour market has been comparatively mild.
Per cent
Actual unemployment vs NAIRU
US, actualUS, NAIRU
Euro zone, actualEuro zone, NAIRU
Source: OECD, SEB
92 94 96 98 00 02 04 06 08 10 12
3
4
5
6
7
8
9
10
11
3
4
5
6
7
8
9
10
11
forecastSEB
These differences in the labour market situation will
be increasingly important for ination analysis and thus
central bank action ahead. Because of the sharp upturn
in US unemployment during the crisis, the gap between
actual unemployment and established measures of
equilibrium unemployment (such as non-acceleratingination unemployment rate, NAIRU) is signicantly
larger than in Europe. On the other hand, there is a risk
that the period of high unemployment in the US will be-
come so lengthy that structural damage to the economy
will be unavoidable and that equilibrium unemployment
will end up climbing even faster than traditional esti-
mates indicate. For example, the slide in home prices
may have made it more difcult for many people to
move out of homes whose mortgage loans exceed their
market value. The geographic mobility that has been so
important to the exibility of the US labour market may
thereby have diminished.
More symmetrical ination risksIn recent years, discourse has alternated between two
extremes: worries about monetary-driven ination or
fear of deation caused by low resource utilisation
and lack of condence in the future. For some time,
our ination forecast has been below consensus, based
on our assessment that large output gaps have domi-
nated ination processes. At the same time, we have
deemed the deation risk to be relatively small, since
central banks seem to have retained credibility fortheir medium-term ination ambitions. This has been
reected, for example, in ination expectations and
wage formation. In recent months, the risk picture has
changed to some extent. Rising energy and food prices
as well as tax increases in a number of countries have
pushed up actual ination. This has also contributed to
a certain increase in ination expectations.
CPI, year-on-year percentage change
Headline inflation will fall back in the euro zone
Euro zone USSource: Eurostat, BLS, SEB
98 99 00 01 02 03 04 05 06 07 08 09 10 11 12
-2
-1
0
1
2
34
5
6
-2
-1
0
1
2
34
5
6
forecastSEB
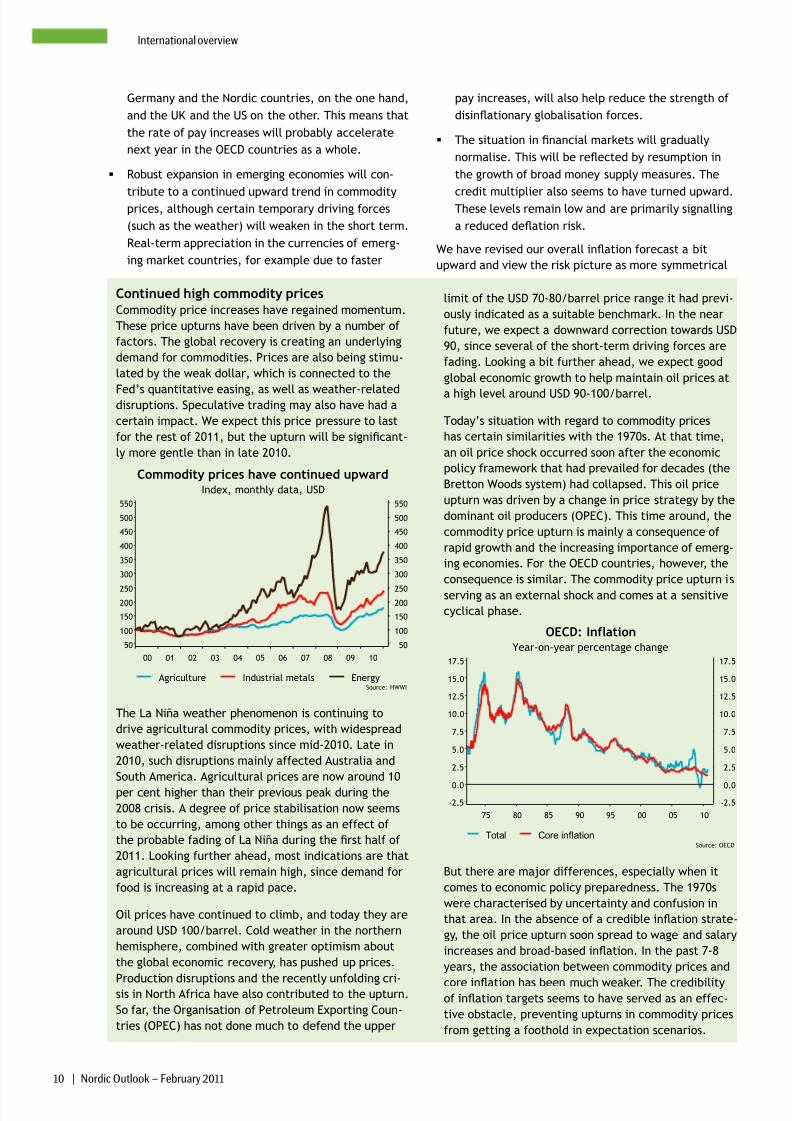
Our forecast implies that Consumer Price Index (CPI)
ination will fall somewhat in the course of 2011.
Although commodity prices will remain at high levels,
or even continue climbing somewhat, the ination rate
will slow as the effects of the rapid price increase dur-
ing 2010 disappear from the 12-month gures. In addi-
tion, underlying price pressures remain low. Because of
the cyclical recovery in productivity, unit labour costs
are still falling. We thus expect core ination to keep
declining in 2011, especially in the US.
Year-on-year percentage change
Unit labour costs
Europe (OECD countries) USSource: OECD
96 97 98 99 00 01 02 03 04 05 06 07 08 09 10
-3
-2
-1
0
1
2
3
4
5
67
8
9
-3
-2
-1
0
1
2
3
4
5
67
8
9
In the long term, however, we foresee growing risks of a
cyclically driven acceleration in ination:
The output gap is on its way towards closing, al-
though the situation looks different, for example, in
8/7/2019 SEB report: Giddy euphoria about the Swedish economy
http://slidepdf.com/reader/full/seb-report-giddy-euphoria-about-the-swedish-economy 9/55
8/7/2019 SEB report: Giddy euphoria about the Swedish economy
http://slidepdf.com/reader/full/seb-report-giddy-euphoria-about-the-swedish-economy 10/55
Nordic Outlook – February 2011 | 11
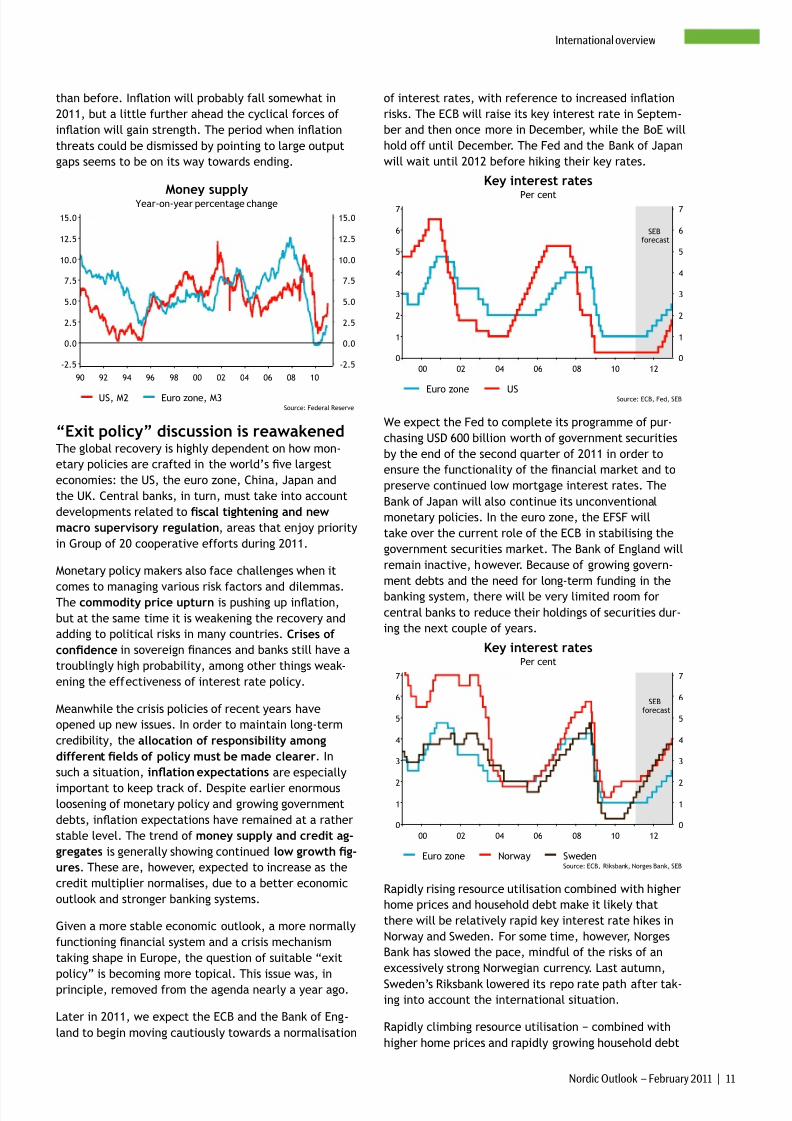
International overview
than before. Ination will probably fall somewhat in
2011, but a little further ahead the cyclical forces of
ination will gain strength. The period when ination
threats could be dismissed by pointing to large output
gaps seems to be on its way towards ending.
Year-on-year percentage changeMoney supply
US, M2 Euro zone, M3Source: Federal Reserve
90 92 94 96 98 00 02 04 06 08 10
-2.5
0.0
2.5
5.0
7.5
10.0
12.5
15.0
-2.5
0.0
2.5
5.0
7.5
10.0
12.5
15.0
“Exit policy” discussion is reawakenedThe global recovery is highly dependent on how mon-
etary policies are crafted in the world’s ve largest
economies: the US, the euro zone, China, Japan and
the UK. Central banks, in turn, must take into account
developments related to scal tightening and new
macro supervisory regulation, areas that enjoy priority
in Group of 20 cooperative efforts during 2011.
Monetary policy makers also face challenges when it
comes to managing various risk factors and dilemmas.The commodity price upturn is pushing up ination,
but at the same time it is weakening the recovery and
adding to political risks in many countries. Crises of
condence in sovereign nances and banks still have a
troublingly high probability, among other things weak-
ening the effectiveness of interest rate policy.
Meanwhile the crisis policies of recent years have
opened up new issues. In order to maintain long-term
credibility, the allocation of responsibility among
different elds of policy must be made clearer. In
such a situation, ination expectations are especially
important to keep track of. Despite earlier enormousloosening of monetary policy and growing government
debts, ination expectations have remained at a rather
stable level. The trend of money supply and credit ag-
gregates is generally showing continued low growth g-
ures. These are, however, expected to increase as the
credit multiplier normalises, due to a better economic
outlook and stronger banking systems.
Given a more stable economic outlook, a more normally
functioning nancial system and a crisis mechanism
taking shape in Europe, the question of suitable “exit
policy” is becoming more topical. This issue was, in
principle, removed from the agenda nearly a year ago.
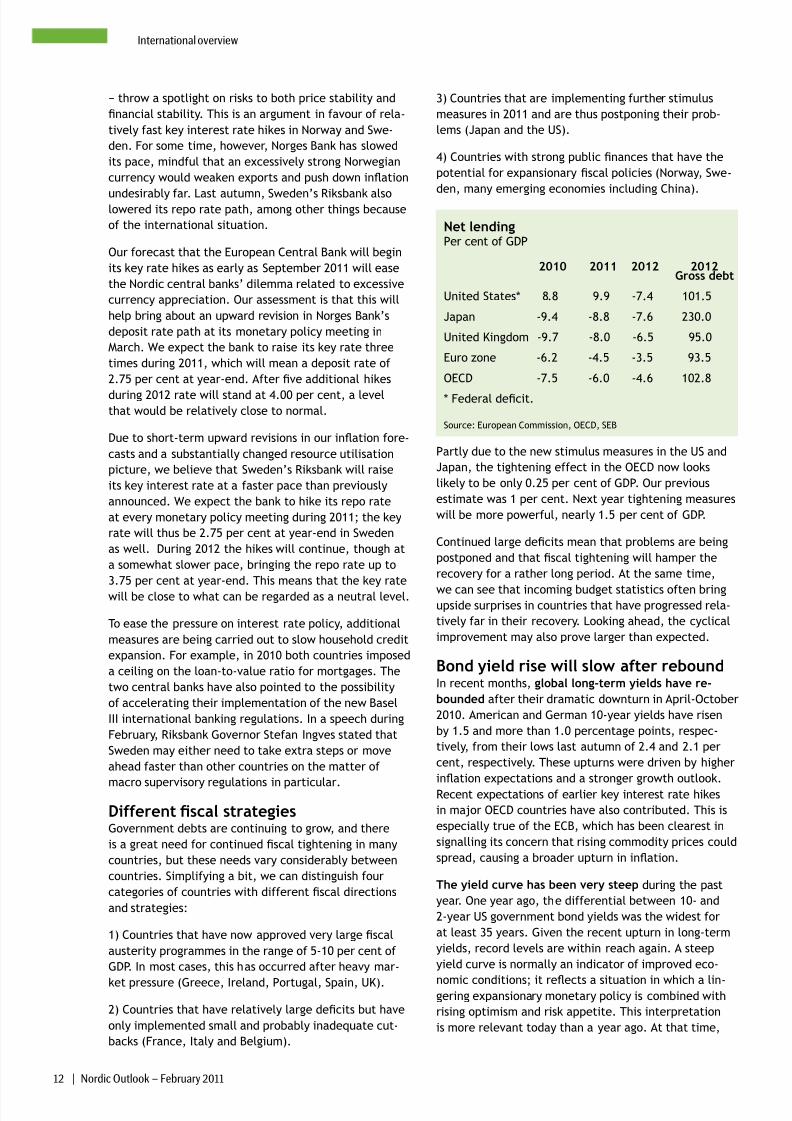
Later in 2011, we expect the ECB and the Bank of Eng-
land to begin moving cautiously towards a normalisation
of interest rates, with reference to increased ination
risks. The ECB will raise its key interest rate in Septem-
ber and then once more in December, while the BoE will
hold off until December. The Fed and the Bank of Japan
will wait until 2012 before hiking their key rates.
Per cent
Key interest rates
Euro zone US Source: ECB, Fed, SEB
00 02 04 06 08 10 120
1
2
3
4
5
6
7
0
1
2
3
4
5
6
7
forecastSEB
We expect the Fed to complete its programme of pur-
chasing USD 600 billion worth of government securities
by the end of the second quarter of 2011 in order to
ensure the functionality of the nancial market and to
preserve continued low mortgage interest rates. The
Bank of Japan will also continue its unconventional
monetary policies. In the euro zone, the EFSF will
take over the current role of the ECB in stabilising the
government securities market. The Bank of England will
remain inactive, however. Because of growing govern-
ment debts and the need for long-term funding in the
banking system, there will be very limited room for
central banks to reduce their holdings of securities dur-
ing the next couple of years.
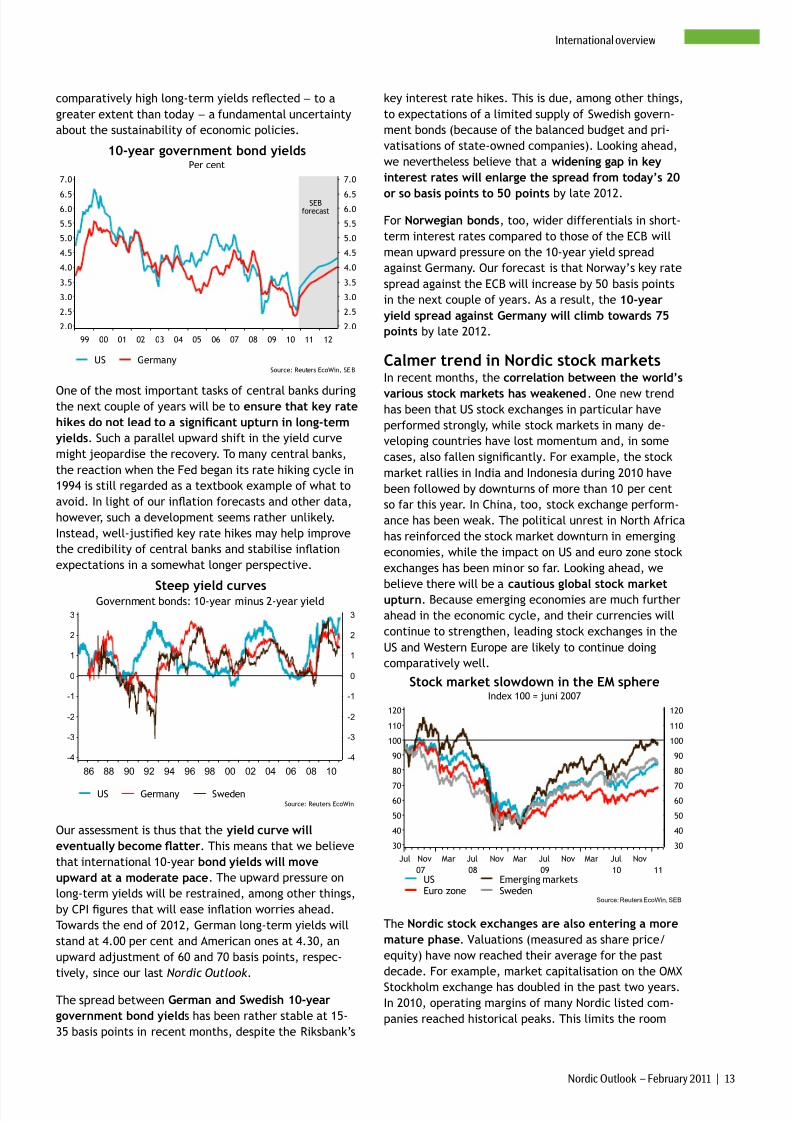
Per cent
Key interest rates
Euro zone Norway SwedenSource: ECB, Riksbank, Norges Bank, SEB
00 02 04 06 08 10 120
1
2
3
4
5
6
7
0
1
2
3
4
5
6
7
forecastSEB
Rapidly rising resource utilisation combined with higher
home prices and household debt make it likely that
there will be relatively rapid key interest rate hikes in
Norway and Sweden. For some time, however, Norges
Bank has slowed the pace, mindful of the risks of an
excessively strong Norwegian currency. Last autumn,
Sweden’s Riksbank lowered its repo rate path after tak-ing into account the international situation.
Rapidly climbing resource utilisation − combined with
higher home prices and rapidly growing household debt
8/7/2019 SEB report: Giddy euphoria about the Swedish economy
http://slidepdf.com/reader/full/seb-report-giddy-euphoria-about-the-swedish-economy 11/55
12 | Nordic Outlook – February 2011
International overview
− throw a spotlight on risks to both price stability and
nancial stability. This is an argument in favour of rela-
tively fast key interest rate hikes in Norway and Swe-
den. For some time, however, Norges Bank has slowed
its pace, mindful that an excessively strong Norwegian
currency would weaken exports and push down ination
undesirably far. Last autumn, Sweden’s Riksbank alsolowered its repo rate path, among other things because
of the international situation.
Our forecast that the European Central Bank will begin
its key rate hikes as early as September 2011 will ease
the Nordic central banks’ dilemma related to excessive
currency appreciation. Our assessment is that this will
help bring about an upward revision in Norges Bank’s
deposit rate path at its monetary policy meeting in
March. We expect the bank to raise its key rate three
times during 2011, which will mean a deposit rate of
2.75 per cent at year-end. After ve additional hikes
during 2012 rate will stand at 4.00 per cent, a levelthat would be relatively close to normal.
Due to short-term upward revisions in our ination fore-
casts and a substantially changed resource utilisation
picture, we believe that Sweden’s Riksbank will raise
its key interest rate at a faster pace than previously
announced. We expect the bank to hike its repo rate
at every monetary policy meeting during 2011; the key
rate will thus be 2.75 per cent at year-end in Sweden
as well. During 2012 the hikes will continue, though at
a somewhat slower pace, bringing the repo rate up to
3.75 per cent at year-end. This means that the key rate
will be close to what can be regarded as a neutral level.
To ease the pressure on interest rate policy, additional
measures are being carried out to slow household credit
expansion. For example, in 2010 both countries imposed
a ceiling on the loan-to-value ratio for mortgages. The
two central banks have also pointed to the possibility
of accelerating their implementation of the new Basel
III international banking regulations. In a speech during
February, Riksbank Governor Stefan Ingves stated that
Sweden may either need to take extra steps or move
ahead faster than other countries on the matter of
macro supervisory regulations in particular.
Different scal strategiesGovernment debts are continuing to grow, and there
is a great need for continued scal tightening in many
countries, but these needs vary considerably between
countries. Simplifying a bit, we can distinguish four
categories of countries with different scal directions
and strategies:
1) Countries that have now approved very large scal
austerity programmes in the range of 5-10 per cent of
GDP. In most cases, this has occurred after heavy mar-
ket pressure (Greece, Ireland, Portugal, Spain, UK).
2) Countries that have relatively large decits but have
only implemented small and probably inadequate cut-
backs (France, Italy and Belgium).
3) Countries that are implementing further stimulus
measures in 2011 and are thus postponing their prob-
lems (Japan and the US).
4) Countries with strong public nances that have the
potential for expansionary scal policies (Norway, Swe-
den, many emerging economies including China).
Net lendingPer cent of GDP
2010 2011 2012 2012Gross debt
United States* 8.8 9.9 -7.4 101.5
Japan -9.4 -8.8 -7.6 230.0
United Kingdom -9.7 -8.0 -6.5 95.0
Euro zone -6.2 -4.5 -3.5 93.5
OECD -7.5 -6.0 -4.6 102.8
* Federal decit.
Source: European Commission, OECD, SEB
Partly due to the new stimulus measures in the US and
Japan, the tightening effect in the OECD now looks
likely to be only 0.25 per cent of GDP. Our previous
estimate was 1 per cent. Next year tightening measures
will be more powerful, nearly 1.5 per cent of GDP.
Continued large decits mean that problems are being
postponed and that scal tightening will hamper the
recovery for a rather long period. At the same time,
we can see that incoming budget statistics often bringupside surprises in countries that have progressed rela-
tively far in their recovery. Looking ahead, the cyclical
improvement may also prove larger than expected.
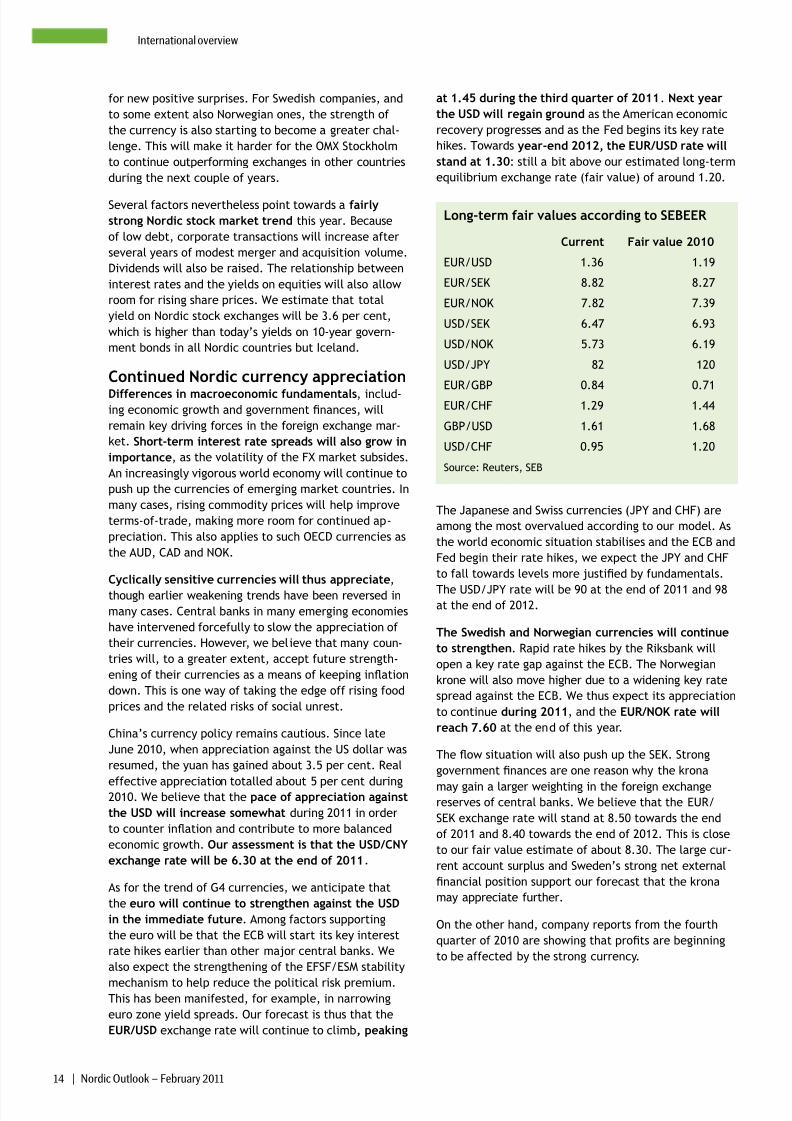
Bond yield rise will slow after reboundIn recent months, global long-term yields have re-
bounded after their dramatic downturn in April-October
2010. American and German 10-year yields have risen
by 1.5 and more than 1.0 percentage points, respec-
tively, from their lows last autumn of 2.4 and 2.1 per
cent, respectively. These upturns were driven by higher
ination expectations and a stronger growth outlook.
Recent expectations of earlier key interest rate hikes
in major OECD countries have also contributed. This is
especially true of the ECB, which has been clearest in
signalling its concern that rising commodity prices could
spread, causing a broader upturn in ination.
The yield curve has been very steep during the past
year. One year ago, the differential between 10- and
2-year US government bond yields was the widest for
at least 35 years. Given the recent upturn in long-term
yields, record levels are within reach again. A steep
yield curve is normally an indicator of improved eco-
nomic conditions; it reects a situation in which a lin-gering expansionary monetary policy is combined with
rising optimism and risk appetite. This interpretation
is more relevant today than a year ago. At that time,
8/7/2019 SEB report: Giddy euphoria about the Swedish economy
http://slidepdf.com/reader/full/seb-report-giddy-euphoria-about-the-swedish-economy 12/55
Nordic Outlook – February 2011 | 13
International overview
comparatively high long-term yields reected − to a
greater extent than today − a fundamental uncertainty
about the sustainability of economic policies.
Per cent
10-year government bond yields
US GermanySource: Reuters EcoWin, SEB
99 00 01 02 03 04 05 06 07 08 09 10 11 12
2.0
2.5
3.0
3.5
4.0
4.5
5.0
5.5
6.06.5
7.0
2.0
2.5
3.0
3.5
4.0
4.5
5.0
5.5
6.06.5
7.0
SEBforecast
One of the most important tasks of central banks duringthe next couple of years will be to ensure that key rate
hikes do not lead to a signicant upturn in long-term
yields. Such a parallel upward shift in the yield curve
might jeopardise the recovery. To many central banks,
the reaction when the Fed began its rate hiking cycle in
1994 is still regarded as a textbook example of what to
avoid. In light of our ination forecasts and other data,
however, such a development seems rather unlikely.
Instead, well-justied key rate hikes may help improve
the credibility of central banks and stabilise ination
expectations in a somewhat longer perspective.
Government bonds: 10-year minus 2-year yieldSteep yield curves
US Germany SwedenSource: Reuters EcoWin
86 88 90 92 94 96 98 00 02 04 06 08 10
-4
-3
-2
-1
0
1
2
3
-4
-3
-2
-1
0
1
2
3
Our assessment is thus that the yield curve will
eventually become atter. This means that we believe
that international 10-year bond yields will move
upward at a moderate pace. The upward pressure on
long-term yields will be restrained, among other things,
by CPI gures that will ease ination worries ahead.
Towards the end of 2012, German long-term yields will
stand at 4.00 per cent and American ones at 4.30, an
upward adjustment of 60 and 70 basis points, respec-
tively, since our last Nordic Outlook.
The spread between German and Swedish 10-year
government bond yields has been rather stable at 15-
35 basis points in recent months, despite the Riksbank’s
key interest rate hikes. This is due, among other things,
to expectations of a limited supply of Swedish govern-
ment bonds (because of the balanced budget and pri-
vatisations of state-owned companies). Looking ahead,
we nevertheless believe that a widening gap in key
interest rates will enlarge the spread from today’s 20
or so basis points to 50 points by late 2012.
For Norwegian bonds, too, wider differentials in short-
term interest rates compared to those of the ECB will
mean upward pressure on the 10-year yield spread
against Germany. Our forecast is that Norway’s key rate
spread against the ECB will increase by 50 basis points
in the next couple of years. As a result, the 10-year
yield spread against Germany will climb towards 75
points by late 2012.
Calmer trend in Nordic stock marketsIn recent months, the correlation between the world’s
various stock markets has weakened. One new trendhas been that US stock exchanges in particular have
performed strongly, while stock markets in many de-
veloping countries have lost momentum and, in some
cases, also fallen signicantly. For example, the stock
market rallies in India and Indonesia during 2010 have
been followed by downturns of more than 10 per cent
so far this year. In China, too, stock exchange perform-
ance has been weak. The political unrest in North Africa
has reinforced the stock market downturn in emerging
economies, while the impact on US and euro zone stock
exchanges has been minor so far. Looking ahead, we
believe there will be a cautious global stock marketupturn. Because emerging economies are much further
ahead in the economic cycle, and their currencies will
continue to strengthen, leading stock exchanges in the
US and Western Europe are likely to continue doing
comparatively well.
Index 100 = juni 2007
Stock market slowdown in the EM sphere
USEuro zone
Emerging marketsSweden
Source: Reuters EcoWin, SEB
Jul
07
Nov
08
Mar Jul Nov
09
Mar Jul Nov
10
Mar Jul Nov
11
30
40
50
6070
80
90
100
110
120
30
40
50
6070
80
90
100
110
120
The Nordic stock exchanges are also entering a more
mature phase. Valuations (measured as share price/
equity) have now reached their average for the past
decade. For example, market capitalisation on the OMX
Stockholm exchange has doubled in the past two years.
In 2010, operating margins of many Nordic listed com-
panies reached historical peaks. This limits the room
8/7/2019 SEB report: Giddy euphoria about the Swedish economy
http://slidepdf.com/reader/full/seb-report-giddy-euphoria-about-the-swedish-economy 13/55
14 | Nordic Outlook – February 2011
International overview
for new positive surprises. For Swedish companies, and
to some extent also Norwegian ones, the strength of
the currency is also starting to become a greater chal-
lenge. This will make it harder for the OMX Stockholm
to continue outperforming exchanges in other countries
during the next couple of years.
Several factors nevertheless point towards a fairly
strong Nordic stock market trend this year. Because
of low debt, corporate transactions will increase after
several years of modest merger and acquisition volume.
Dividends will also be raised. The relationship between
interest rates and the yields on equities will also allow
room for rising share prices. We estimate that total
yield on Nordic stock exchanges will be 3.6 per cent,
which is higher than today’s yields on 10-year govern-
ment bonds in all Nordic countries but Iceland.
Continued Nordic currency appreciation
Differences in macroeconomic fundamentals, includ-ing economic growth and government nances, will
remain key driving forces in the foreign exchange mar-
ket. Short-term interest rate spreads will also grow in
importance, as the volatility of the FX market subsides.
An increasingly vigorous world economy will continue to
push up the currencies of emerging market countries. In
many cases, rising commodity prices will help improve
terms-of-trade, making more room for continued ap-
preciation. This also applies to such OECD currencies as
the AUD, CAD and NOK.
Cyclically sensitive currencies will thus appreciate,
though earlier weakening trends have been reversed in
many cases. Central banks in many emerging economies
have intervened forcefully to slow the appreciation of
their currencies. However, we believe that many coun-
tries will, to a greater extent, accept future strength-
ening of their currencies as a means of keeping ination
down. This is one way of taking the edge off rising food
prices and the related risks of social unrest.
China’s currency policy remains cautious. Since late
June 2010, when appreciation against the US dollar was
resumed, the yuan has gained about 3.5 per cent. Real
effective appreciation totalled about 5 per cent during2010. We believe that the pace of appreciation against
the USD will increase somewhat during 2011 in order
to counter ination and contribute to more balanced
economic growth. Our assessment is that the USD/CNY
exchange rate will be 6.30 at the end of 2011.
As for the trend of G4 currencies, we anticipate that
the euro will continue to strengthen against the USD
in the immediate future. Among factors supporting
the euro will be that the ECB will start its key interest
rate hikes earlier than other major central banks. We
also expect the strengthening of the EFSF/ESM stability
mechanism to help reduce the political risk premium.This has been manifested, for example, in narrowing
euro zone yield spreads. Our forecast is thus that the
EUR/USD exchange rate will continue to climb, peaking
at 1.45 during the third quarter of 2011. Next year
the USD will regain ground as the American economic
recovery progresses and as the Fed begins its key rate
hikes. Towards year-end 2012, the EUR/USD rate will
stand at 1.30: still a bit above our estimated long-term
equilibrium exchange rate (fair value) of around 1.20.
Long-term fair values according to SEBEER
Current Fair value 2010
EUR/USD 1.36 1.19
EUR/SEK 8.82 8.27
EUR/NOK 7.82 7.39
USD/SEK 6.47 6.93
USD/NOK 5.73 6.19
USD/JPY 82 120
EUR/GBP 0.84 0.71
EUR/CHF 1.29 1.44
GBP/USD 1.61 1.68
USD/CHF 0.95 1.20
Source: Reuters, SEB
The Japanese and Swiss currencies (JPY and CHF) are
among the most overvalued according to our model. As
the world economic situation stabilises and the ECB and
Fed begin their rate hikes, we expect the JPY and CHF
to fall towards levels more justied by fundamentals.
The USD/JPY rate will be 90 at the end of 2011 and 98at the end of 2012.
The Swedish and Norwegian currencies will continue
to strengthen. Rapid rate hikes by the Riksbank will
open a key rate gap against the ECB. The Norwegian
krone will also move higher due to a widening key rate
spread against the ECB. We thus expect its appreciation
to continue during 2011, and the EUR/NOK rate will
reach 7.60 at the end of this year.
The ow situation will also push up the SEK. Strong
government nances are one reason why the krona
may gain a larger weighting in the foreign exchangereserves of central banks. We believe that the EUR/
SEK exchange rate will stand at 8.50 towards the end
of 2011 and 8.40 towards the end of 2012. This is close
to our fair value estimate of about 8.30. The large cur-
rent account surplus and Sweden’s strong net external
nancial position support our forecast that the krona
may appreciate further.
On the other hand, company reports from the fourth
quarter of 2010 are showing that prots are beginning
to be affected by the strong currency.
8/7/2019 SEB report: Giddy euphoria about the Swedish economy
http://slidepdf.com/reader/full/seb-report-giddy-euphoria-about-the-swedish-economy 14/55
Theme
Nordic Outlook – February 2011 | 15
SEBEER: A model for long-term equilibriumexchange rates
EUR/USD equilibrium at 1.20
JPY and CHF the most overvalued
NOK and SEK undervalued against theeuro
The economic literature includes many approaches to
calculating equilibrium exchange rates (fair values).Purchasing Power Parity (PPP) emphasises the associa-
tion between relative price levels in different countries
and exchange rate. Other methods focus on internal
and external balance conditions − with the situation
related to resource utilisation and ination rate, on the
one hand, and current account balance and net exter-
nal nancial position, on the other, providing the basis
for estimating equilibrium exchange rates.
In addition to these more fundamental, theoretical
approaches, there are more empirical methods based
on actual historical exchange rate trends. SEB Research
recently estimated such equilibrium rates (BehaviouralEquilibrium Exchange Rate, BEER). The variables that
proved to have the largest impact on fair values in the
model that we have named SEBEER are the following:
Relative prices: Long-term fair value is affected by
relative price levels between countries, in keeping with
the above-mentioned PPP theory. A low domestic price
level relative to other countries indicates that the cur-
rency is undervalued.
Terms-of-trade: Differences in world market price
trends between a country’s exports and imports inu-
ence fair value. A favourable trend with faster-rising
export prices strengthens a country’s fair value.
Relative productivity: Differences in productivity
growth inuence fair value. A country with higher pro-
ductivity growth than its peers can maintain a gradually
appreciating currency without seeing its competitive-
ness undermined.
Current account: In the long term, the current account
balance affects the exchange rate. A surplus leads to
greater demand for the currency, thereby strengthening
its exchange rate.
Interest-rate differentials: Differences in interest rates
generate capital ows, which inuence the exchange
rate. A country with higher interest rates receives an
inow of capital that helps strengthen its exchange rate
in the short and medium term.
The usual way of estimating fair values is to use tradi-
tional time series analysis on individual currencies. One
way of carrying the analysis further is to estimate fair
values for a panel of exchange rates simultaneously.
The number of observations − and the precision of
the estimates−
is larger, without having to extend theestimate period as far back in time. The panel approach
also makes it possible to estimate several fair values
simultaneously, so the approach is internally consistent.
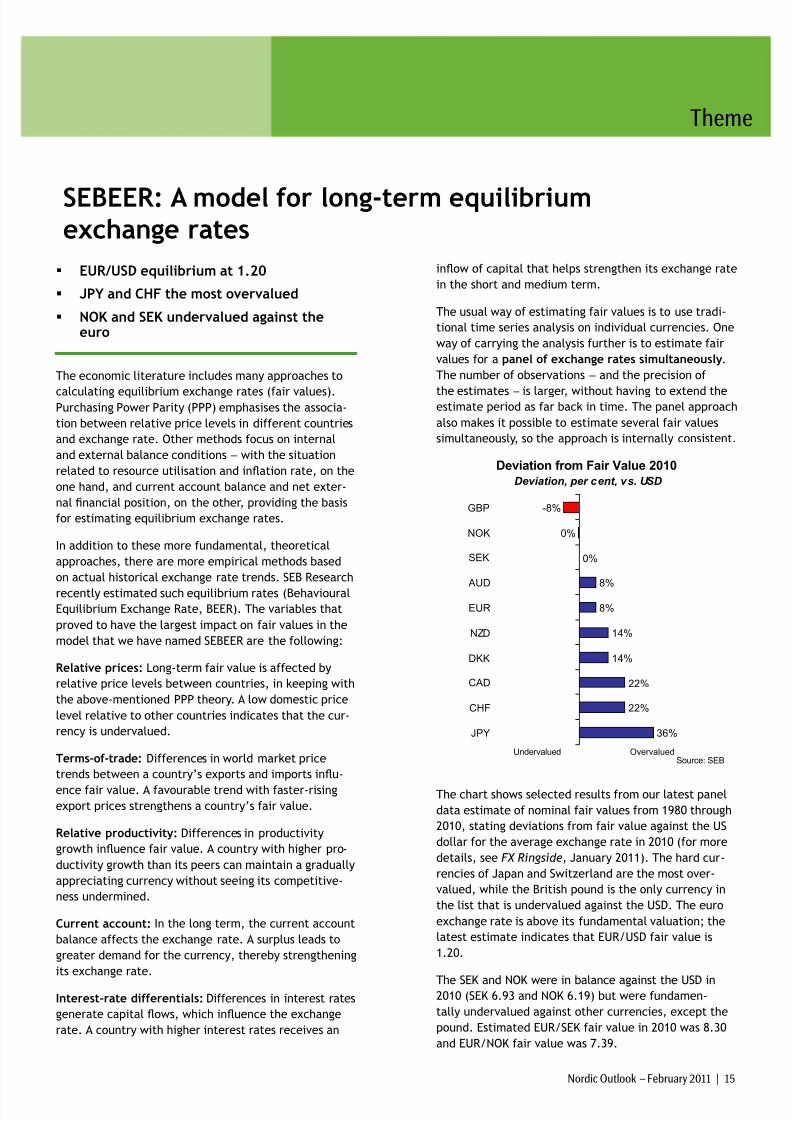
Deviation from Fair Value 2010
Deviation, per cent, vs. USD
36%
22%
22%
14%
14%
8%
8%
0%
0%
-8%
JPY
CHF
CAD
DKK
NZD
EUR
AUD
SEK
NOK
GBP
OvervaluedUndervaluedSource: SEB
The chart shows selected results from our latest panel
data estimate of nominal fair values from 1980 through
2010, stating deviations from fair value against the US
dollar for the average exchange rate in 2010 (for more
details, see FX Ringside, January 2011). The hard cur-
rencies of Japan and Switzerland are the most over-
valued, while the British pound is the only currency in
the list that is undervalued against the USD. The euro
exchange rate is above its fundamental valuation; the
latest estimate indicates that EUR/USD fair value is
1.20.
The SEK and NOK were in balance against the USD in2010 (SEK 6.93 and NOK 6.19) but were fundamen-
tally undervalued against other currencies, except the
pound. Estimated EUR/SEK fair value in 2010 was 8.30
and EUR/NOK fair value was 7.39.
8/7/2019 SEB report: Giddy euphoria about the Swedish economy
http://slidepdf.com/reader/full/seb-report-giddy-euphoria-about-the-swedish-economy 15/55
The United States
16 | Nordic Outlook – February 2011
The US economy gears up above trend
The labour market is improving
Corporate prots will continue upward
The housing market is stumbling
The Fed will hike its key rate in April 2012
The US economic outlook has improved. A combination
of the Federal Reserve’s ultra-loose monetary policy
and a new scal stimulus has bolstered optimism. GDPgrowth in the fourth quarter of 2010 was signicantly
stronger than we expected in the last Nordic Outlook,
and there are many indications of continued good
growth gures early in 2011. Private sector nancial
saving has now started falling, which is usually an
important signal that a recovery is becoming self-
sustaining. Measured as annual averages, we foresee
GDP growth of 3.6 per cent this year and 4.0 per cent
in 2012, which is above consensus and a sharp upward
revision for 2011. Housing market reversals and poor
state government nances will nevertheless keep the
recovery a few percentage points weaker than histori-cal averages during the corresponding cyclical phase.
Employment will increase by an average of about
180,000 per month this year, despite public sector
cutbacks. Unemployment will fall but will remain at
a high 7.8 per cent at the end of our forecast period.
Large output and labour market gaps will lead to low
core ination; our ination forecasts are below consen-
sus. We thus anticipate that the Fed will hike its key
interest rate in April 2012, later than market pricing
indicates.
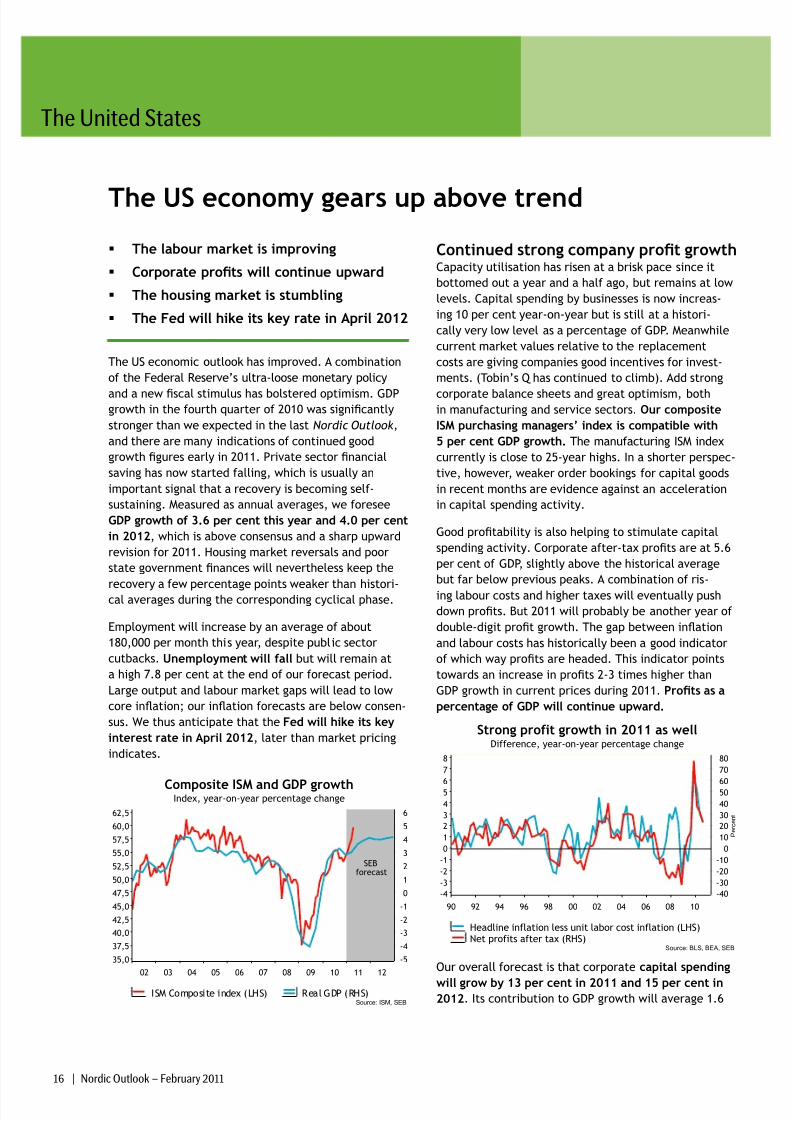
Index, year-on-year percentage changeComposite ISM and GDP growth
ISM Composite index (LHS) Real GDP (RHS)Source: ISM, SEB
02 03 04 05 06 07 08 09 10 11 12
-5
-4
-3
-2
-1
0
1
2
3
4
5
6
35,0
37,5
40,0
42,5
45,0
47,5
50,0
52,5
55,0
57,5
60,0
62,5
SEBforecast
Continued strong company prot growthCapacity utilisation has risen at a brisk pace since it
bottomed out a year and a half ago, but remains at low
levels. Capital spending by businesses is now increas-
ing 10 per cent year-on-year but is still at a histori-
cally very low level as a percentage of GDP. Meanwhile
current market values relative to the replacement
costs are giving companies good incentives for invest-
ments. (Tobin’s Q has continued to climb). Add strong
corporate balance sheets and great optimism, bothin manufacturing and service sectors. Our composite
ISM purchasing managers’ index is compatible with
5 per cent GDP growth. The manufacturing ISM index
currently is close to 25-year highs. In a shorter perspec-
tive, however, weaker order bookings for capital goods
in recent months are evidence against an acceleration
in capital spending activity.
Good protability is also helping to stimulate capital
spending activity. Corporate after-tax prots are at 5.6
per cent of GDP, slightly above the historical average
but far below previous peaks. A combination of ris-
ing labour costs and higher taxes will eventually push
down prots. But 2011 will probably be another year of
double-digit prot growth. The gap between ination
and labour costs has historically been a good indicator
of which way prots are headed. This indicator points
towards an increase in prots 2-3 times higher than
GDP growth in current prices during 2011. Prots as a
percentage of GDP will continue upward.
Difference, year-on-year percentage change
Strong profit growth in 2011 as well
Headline inflation less unit labor cost inflation (LHS)Net profits after tax (RHS)
Source: BLS, BEA, SEB
90 92 94 96 98 00 02 04 06 08 10
P e r c e n t
-40-30
-20
-10
0
10
2030
40
5060
70
80
-4-3
-2
-1
0
1
23
4
56
7
8
Our overall forecast is that corporate capital spending
will grow by 13 per cent in 2011 and 15 per cent in2012. Its contribution to GDP growth will average 1.6
8/7/2019 SEB report: Giddy euphoria about the Swedish economy
http://slidepdf.com/reader/full/seb-report-giddy-euphoria-about-the-swedish-economy 16/55
Nordic Outlook – February 2011 | 17
The United States
percentage points during our forecast period, compared
to 2.1 per cent for private consumption.
Exports will climb in rst half of 2011The weakening of the US dollar will lift exports dur-
ing the next six months, while import gures will be
kept down because an inventory build-up has alreadyoccurred. We foresee increases in exports averaging
11 per cent in 2011-12. Foreign trade will contribute
positively to GDP growth during the rst half of 2011,
followed by a shift to a negative contribution in the
second half and in 2012. The 2010 US current account
balance, which stood at -3.2 per cent of GDP in 2010, is
expected to approach -4 per cent of GDP by the end of
2012.
Consumers getting bolderA strong Christmas shopping season helped lift consump-
tion by 4.4 per cent annualised in the fourth quarter of
2010, the strongest gure since 2006. Several factors
indicate that this positive trend will persist. Extend-
ing the Bush-era tax cuts for another two years as well
as cutting the employees’ federal payroll tax in 2011
will increase room for consumption. Meanwhile the
consumer condence surveys look a bit brighter; for
example the Conference Board indicator posted a heavy
gain in January. We foresee a gradual return to normal
condence levels as the labour market and incomes
strengthen.
Looking further ahead, a stronger labour market will
also help bolster household income. Given the large
role of private consumption in GDP (71 per cent), this
is one key explanation for our brighter economic view.
Household savings adjustment has also come a long way.
According to our calculations, household savings levels
are close to the equilibrium justied by such factors as
wealth position. We are thus expecting only a marginal
additional upturn in household savings ratios during
the next couple of years. Such savings behaviour is also
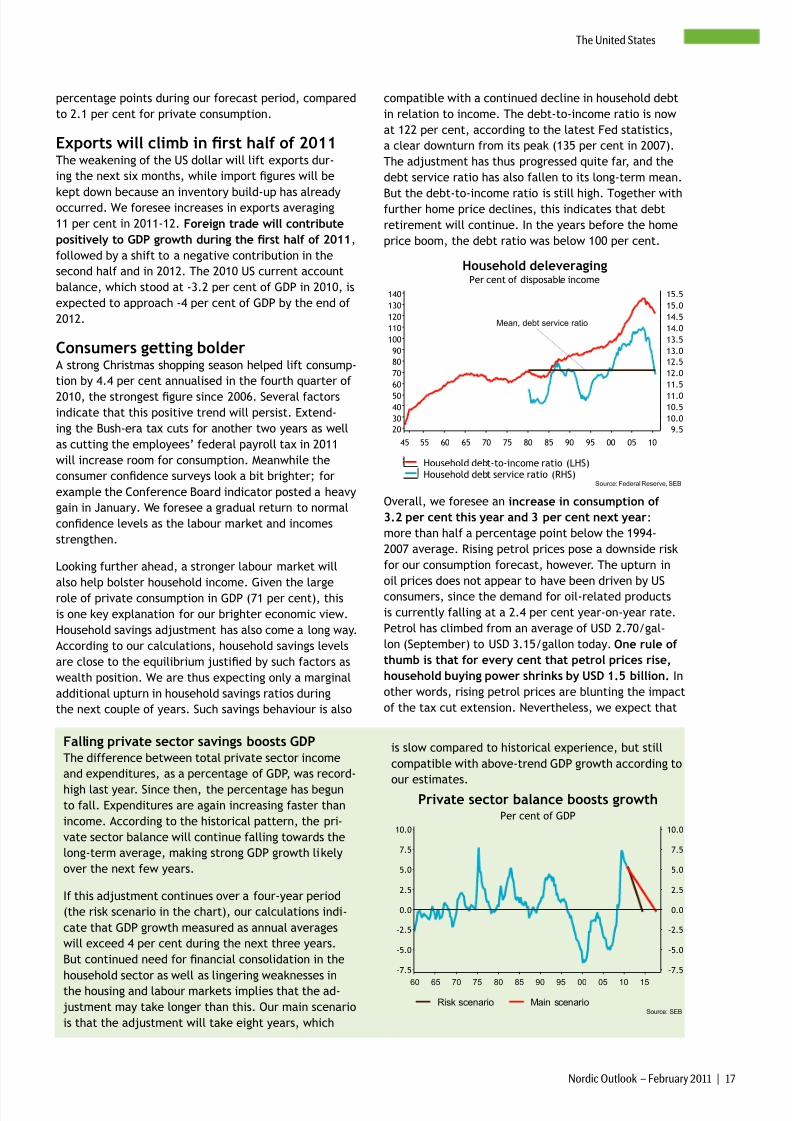
compatible with a continued decline in household debt
in relation to income. The debt-to-income ratio is now
at 122 per cent, according to the latest Fed statistics,
a clear downturn from its peak (135 per cent in 2007).
The adjustment has thus progressed quite far, and the
debt service ratio has also fallen to its long-term mean.
But the debt-to-income ratio is still high. Together withfurther home price declines, this indicates that debt
retirement will continue. In the years before the home
price boom, the debt ratio was below 100 per cent.
Per cent of disposable income
Household deleveraging
Household debt-to-income ratio (LHS)Household debt service ratio (RHS)
Source: Federal Reserve, SEB
45 55 60 65 70 75 80 85 90 95 00 05 10
9.5
10.0
10.5
11.0
11.5
12.0
12.5
13.0
13.5
14.0
14.5
15.0
15.5
2030
4050
60
70
8090
100
110
120
130
140
Mean, debt service ratio
Overall, we foresee an increase in consumption of
3.2 per cent this year and 3 per cent next year:
more than half a percentage point below the 1994-
2007 average. Rising petrol prices pose a downside risk
for our consumption forecast, however. The upturn in
oil prices does not appear to have been driven by US
consumers, since the demand for oil-related products
is currently falling at a 2.4 per cent year-on-year rate.
Petrol has climbed from an average of USD 2.70/gal-
lon (September) to USD 3.15/gallon today. One rule of
thumb is that for every cent that petrol prices rise,
household buying power shrinks by USD 1.5 billion. In
other words, rising petrol prices are blunting the impact
of the tax cut extension. Nevertheless, we expect that
Falling private sector savings boosts GDP
The difference between total private sector income
and expenditures, as a percentage of GDP, was record-
high last year. Since then, the percentage has begun
to fall. Expenditures are again increasing faster than
income. According to the historical pattern, the pri-
vate sector balance will continue falling towards the
long-term average, making strong GDP growth likely
over the next few years.
If this adjustment continues over a four-year period
(the risk scenario in the chart), our calculations indi-
cate that GDP growth measured as annual averages
will exceed 4 per cent during the next three years.
But continued need for nancial consolidation in the
household sector as well as lingering weaknesses in
the housing and labour markets implies that the ad-
justment may take longer than this. Our main scenario
is that the adjustment will take eight years, which
is slow compared to historical experience, but still
compatible with above-trend GDP growth according to
our estimates.
Per cent of GDP
Private sector balance boosts growth
Risk scenario Main scenarioSource: SEB
60 65 70 75 80 85 90 95 00 05 10 15
-7.5
-5.0
-2.5
0.0
2.5
5.0
7.5
10.0
-7.5
-5.0
-2.5
0.0
2.5
5.0
7.5
10.0
8/7/2019 SEB report: Giddy euphoria about the Swedish economy
http://slidepdf.com/reader/full/seb-report-giddy-euphoria-about-the-swedish-economy 17/55
18 | Nordic Outlook – February 2011
The United States
real disposable income will rise at an annualised rate
of 5-6 per cent in the rst quarter, compared to slightly
below 2 per cent in the fourth quarter. Some of the
boost will be saved, thus reversing the recent drop in
the savings ratio. Even so, we expect impressive con-
sumption growth in the current quarter as well.
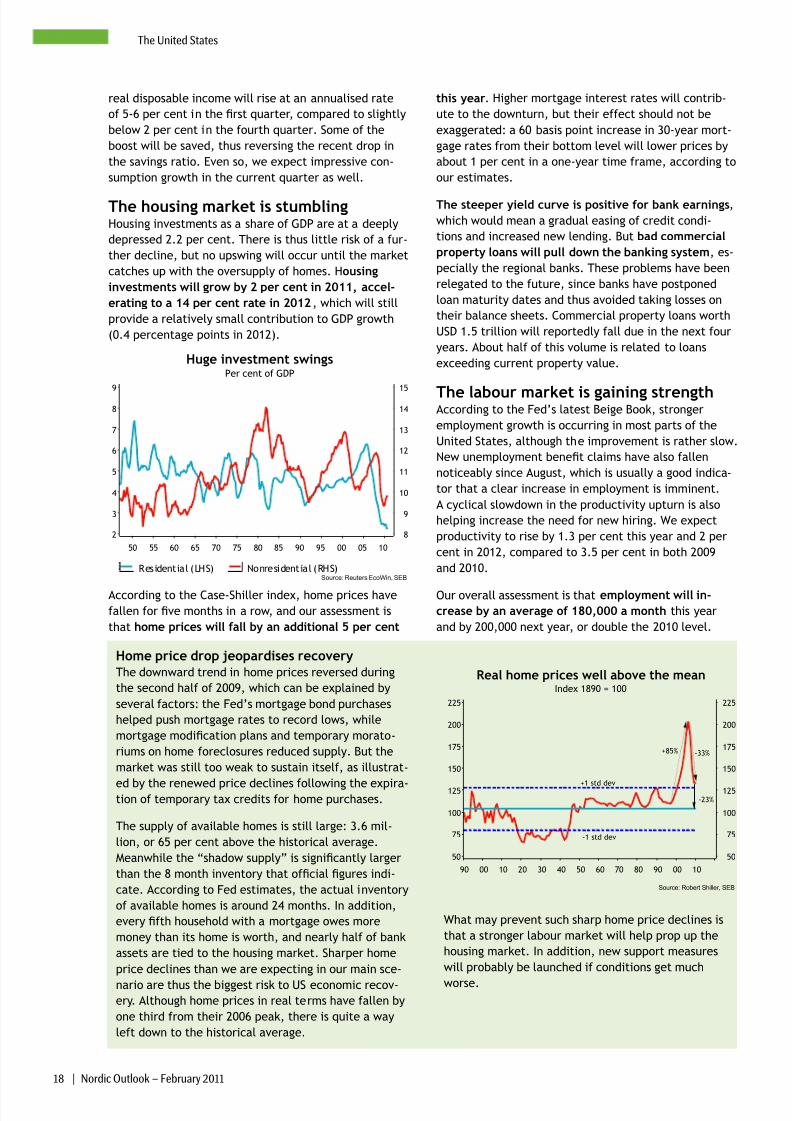
The housing market is stumblingHousing investments as a share of GDP are at a deeply
depressed 2.2 per cent. There is thus little risk of a fur-
ther decline, but no upswing will occur until the market
catches up with the oversupply of homes. Housing
investments will grow by 2 per cent in 2011, accel-
erating to a 14 per cent rate in 2012, which will still
provide a relatively small contribution to GDP growth
(0.4 percentage points in 2012).
Per cent of GDP
Huge investment swings
Residential (LHS) Nonresidential (RHS)Source: Reuters EcoWin, SEB
50 55 60 65 70 75 80 85 90 95 00 05 10
8
9
10
11
12
13
14
15
2
3
4
5
6
7
8
9
According to the Case-Shiller index, home prices have
fallen for ve months in a row, and our assessment is
that home prices will fall by an additional 5 per cent
this year. Higher mortgage interest rates will contrib-
ute to the downturn, but their effect should not be
exaggerated: a 60 basis point increase in 30-year mort-
gage rates from their bottom level will lower prices by
about 1 per cent in a one-year time frame, according to
our estimates.
The steeper yield curve is positive for bank earnings,
which would mean a gradual easing of credit condi-
tions and increased new lending. But bad commercial
property loans will pull down the banking system, es-
pecially the regional banks. These problems have been
relegated to the future, since banks have postponed
loan maturity dates and thus avoided taking losses on
their balance sheets. Commercial property loans worth
USD 1.5 trillion will reportedly fall due in the next four
years. About half of this volume is related to loans
exceeding current property value.
The labour market is gaining strengthAccording to the Fed’s latest Beige Book, stronger
employment growth is occurring in most parts of the
United States, although the improvement is rather slow.
New unemployment benet claims have also fallen
noticeably since August, which is usually a good indica-
tor that a clear increase in employment is imminent.
A cyclical slowdown in the productivity upturn is also
helping increase the need for new hiring. We expect
productivity to rise by 1.3 per cent this year and 2 per
cent in 2012, compared to 3.5 per cent in both 2009
and 2010.
Our overall assessment is that employment will in-
crease by an average of 180,000 a month this year
and by 200,000 next year, or double the 2010 level.
Home price drop jeopardises recovery
The downward trend in home prices reversed during
the second half of 2009, which can be explained by
several factors: the Fed’s mortgage bond purchases
helped push mortgage rates to record lows, while
mortgage modication plans and temporary morato-
riums on home foreclosures reduced supply. But the
market was still too weak to sustain itself, as illustrat-
ed by the renewed price declines following the expira-tion of temporary tax credits for home purchases.
The supply of available homes is still large: 3.6 mil-
lion, or 65 per cent above the historical average.
Meanwhile the “shadow supply” is signicantly larger
than the 8 month inventory that ofcial gures indi-
cate. According to Fed estimates, the actual inventory
of available homes is around 24 months. In addition,
every fth household with a mortgage owes more
money than its home is worth, and nearly half of bank
assets are tied to the housing market. Sharper home
price declines than we are expecting in our main sce-
nario are thus the biggest risk to US economic recov-ery. Although home prices in real terms have fallen by
one third from their 2006 peak, there is quite a way
left down to the historical average.
Index 1890 = 100
Real home prices well above the mean
Source: Robert Shiller, SEB
90 00 10 20 30 40 50 60 70 80 90 00 10
50
75
100
125
150
175
200
225
50
75
100
125
150
175
200
225
-1 std dev
-23%
+1 std dev
+85% -33%
What may prevent such sharp home price declines is
that a stronger labour market will help prop up the
housing market. In addition, new support measures
will probably be launched if conditions get much
worse.
8/7/2019 SEB report: Giddy euphoria about the Swedish economy
http://slidepdf.com/reader/full/seb-report-giddy-euphoria-about-the-swedish-economy 18/55
Nordic Outlook – February 2011 | 19
The United States
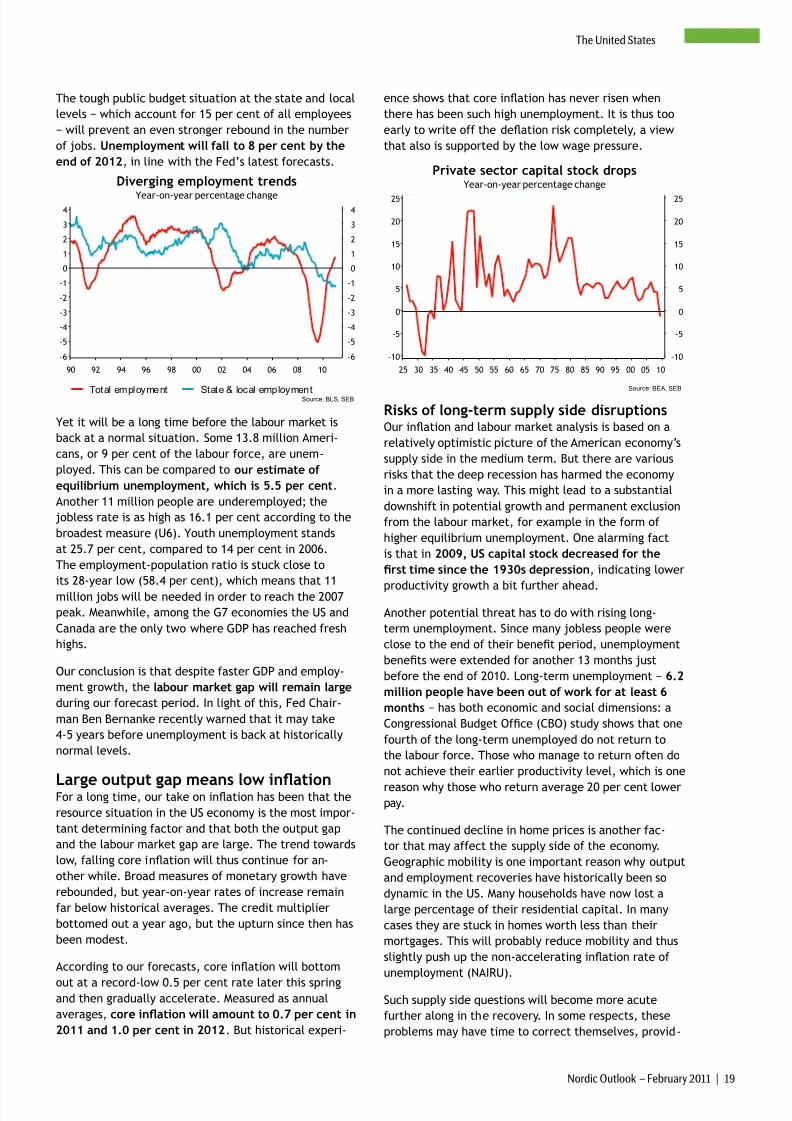
The tough public budget situation at the state and local
levels − which account for 15 per cent of all employees
− will prevent an even stronger rebound in the number
of jobs. Unemployment will fall to 8 per cent by the
end of 2012, in line with the Fed’s latest forecasts.
Year-on-year percentage change
Diverging employment trends
Total employment State & local employmentSource: BLS, SEB
90 92 94 96 98 00 02 04 06 08 10
-6
-5
-4
-3
-2
-1
0
1
2
3
4
-6
-5
-4
-3
-2
-1
0
1
2
3
4
Yet it will be a long time before the labour market is
back at a normal situation. Some 13.8 million Ameri-
cans, or 9 per cent of the labour force, are unem-
ployed. This can be compared to our estimate of
equilibrium unemployment, which is 5.5 per cent.
Another 11 million people are underemployed; the
jobless rate is as high as 16.1 per cent according to the
broadest measure (U6). Youth unemployment stands
at 25.7 per cent, compared to 14 per cent in 2006.
The employment-population ratio is stuck close to
its 28-year low (58.4 per cent), which means that 11
million jobs will be needed in order to reach the 2007
peak. Meanwhile, among the G7 economies the US and
Canada are the only two where GDP has reached fresh
highs.
Our conclusion is that despite faster GDP and employ-
ment growth, the labour market gap will remain large
during our forecast period. In light of this, Fed Chair-
man Ben Bernanke recently warned that it may take
4-5 years before unemployment is back at historically
normal levels.
Large output gap means low inationFor a long time, our take on ination has been that the
resource situation in the US economy is the most impor-
tant determining factor and that both the output gap
and the labour market gap are large. The trend towards
low, falling core ination will thus continue for an-
other while. Broad measures of monetary growth have
rebounded, but year-on-year rates of increase remain
far below historical averages. The credit multiplier
bottomed out a year ago, but the upturn since then has
been modest.
According to our forecasts, core ination will bottom
out at a record-low 0.5 per cent rate later this springand then gradually accelerate. Measured as annual
averages, core ination will amount to 0.7 per cent in
2011 and 1.0 per cent in 2012. But historical experi-
ence shows that core ination has never risen when
there has been such high unemployment. It is thus too
early to write off the deation risk completely, a view
that also is supported by the low wage pressure.
Year-on-year percentage change
Private sector capital stock drops
Source: BEA, SEB
25 30 35 40 45 50 55 60 65 70 75 80 85 90 95 00 05 10
-10
-5
0
5
10
15
20
25
-10
-5
0
5
10
15
20
25
Risks of long-term supply side disruptionsOur ination and labour market analysis is based on a
relatively optimistic picture of the American economy’s
supply side in the medium term. But there are various
risks that the deep recession has harmed the economy
in a more lasting way. This might lead to a substantial
downshift in potential growth and permanent exclusion
from the labour market, for example in the form of
higher equilibrium unemployment. One alarming fact
is that in 2009, US capital stock decreased for the
rst time since the 1930s depression, indicating lower
productivity growth a bit further ahead.
Another potential threat has to do with rising long-
term unemployment. Since many jobless people were
close to the end of their benet period, unemployment
benets were extended for another 13 months just
before the end of 2010. Long-term unemployment − 6.2
million people have been out of work for at least 6
months − has both economic and social dimensions: a
Congressional Budget Ofce (CBO) study shows that one
fourth of the long-term unemployed do not return to
the labour force. Those who manage to return often do
not achieve their earlier productivity level, which is one
reason why those who return average 20 per cent lowerpay.
The continued decline in home prices is another fac-
tor that may affect the supply side of the economy.
Geographic mobility is one important reason why output
and employment recoveries have historically been so
dynamic in the US. Many households have now lost a
large percentage of their residential capital. In many
cases they are stuck in homes worth less than their
mortgages. This will probably reduce mobility and thus
slightly push up the non-accelerating ination rate of
unemployment (NAIRU).
Such supply side questions will become more acute
further along in the recovery. In some respects, these
problems may have time to correct themselves, provid-
8/7/2019 SEB report: Giddy euphoria about the Swedish economy
http://slidepdf.com/reader/full/seb-report-giddy-euphoria-about-the-swedish-economy 19/55
20 | Nordic Outlook – February 2011
The United States
ed that the US economy enters a more positive recovery
dynamic. Otherwise fresh economic policy thinking may
be required to avoid long-term damage.
Ratio
Government spending for each USD of revenues
Source: US Department of the Treasury, SEB
55 60 65 70 75 80 85 90 95 00 05 10
0.8
0.9
1.0
1.1
1.2
1.3
1.4
1.5
1.6
1.7
1.8
0.8
0.9
1.0
1.1
1.2
1.3
1.4
1.5
1.6
1.7
1.8
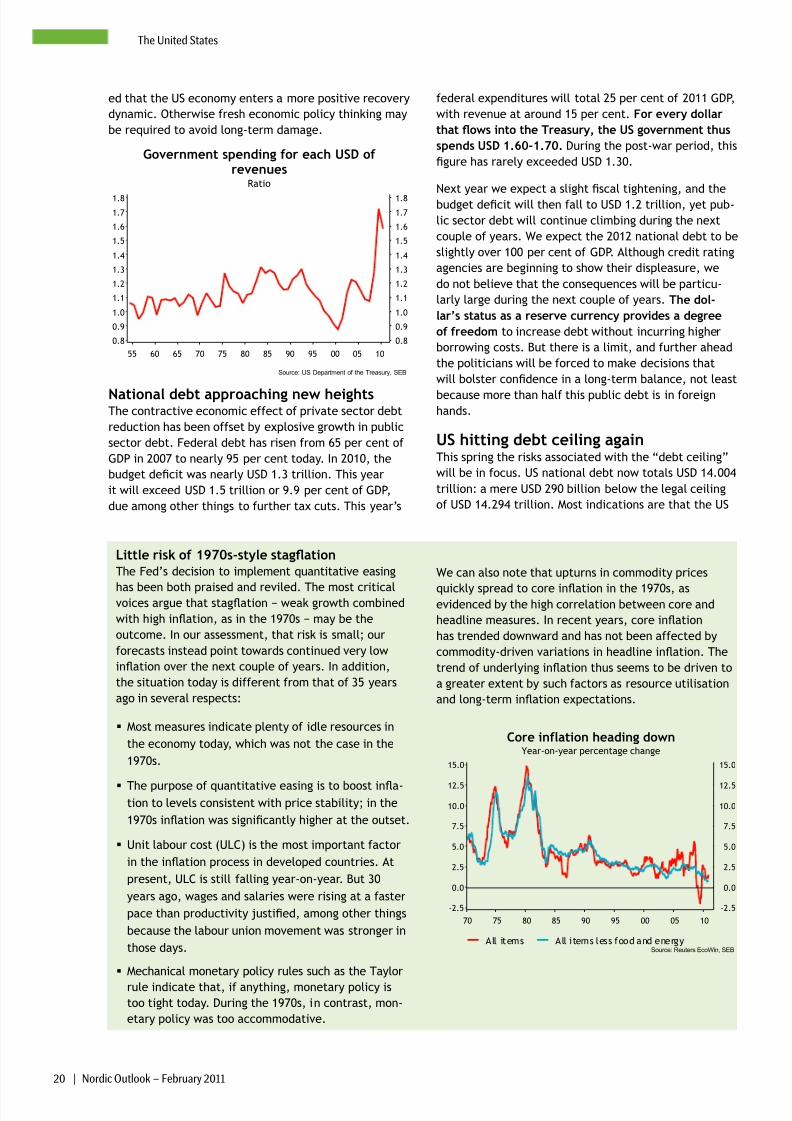
National debt approaching new heightsThe contractive economic effect of private sector debt
reduction has been offset by explosive growth in public
sector debt. Federal debt has risen from 65 per cent of
GDP in 2007 to nearly 95 per cent today. In 2010, the
budget decit was nearly USD 1.3 trillion. This year
it will exceed USD 1.5 trillion or 9.9 per cent of GDP,
due among other things to further tax cuts. This year’s
federal expenditures will total 25 per cent of 2011 GDP,
with revenue at around 15 per cent. For every dollar
that ows into the Treasury, the US government thus
spends USD 1.60-1.70. During the post-war period, this
gure has rarely exceeded USD 1.30.
Next year we expect a slight scal tightening, and the
budget decit will then fall to USD 1.2 trillion, yet pub-
lic sector debt will continue climbing during the next
couple of years. We expect the 2012 national debt to be
slightly over 100 per cent of GDP. Although credit rating
agencies are beginning to show their displeasure, we
do not believe that the consequences will be particu-
larly large during the next couple of years. The dol-
lar’s status as a reserve currency provides a degree
of freedom to increase debt without incurring higher
borrowing costs. But there is a limit, and further ahead
the politicians will be forced to make decisions that
will bolster condence in a long-term balance, not least
because more than half this public debt is in foreignhands.
US hitting debt ceiling againThis spring the risks associated with the “debt ceiling”
will be in focus. US national debt now totals USD 14.004
trillion: a mere USD 290 billion below the legal ceiling
of USD 14.294 trillion. Most indications are that the US
Little risk of 1970s-style stagationThe Fed’s decision to implement quantitative easing
has been both praised and reviled. The most criticalvoices argue that stagation − weak growth combined
with high ination, as in the 1970s − may be the
outcome. In our assessment, that risk is small; our
forecasts instead point towards continued very low
ination over the next couple of years. In addition,
the situation today is different from that of 35 years
ago in several respects:
Most measures indicate plenty of idle resources in
the economy today, which was not the case in the
1970s.
The purpose of quantitative easing is to boost ina-tion to levels consistent with price stability; in the
1970s ination was signicantly higher at the outset.
Unit labour cost (ULC) is the most important factor
in the ination process in developed countries. At
present, ULC is still falling year-on-year. But 30
years ago, wages and salaries were rising at a faster
pace than productivity justied, among other things
because the labour union movement was stronger in
those days.
Mechanical monetary policy rules such as the Taylor
rule indicate that, if anything, monetary policy is
too tight today. During the 1970s, in contrast, mon-
etary policy was too accommodative.
We can also note that upturns in commodity prices
quickly spread to core ination in the 1970s, asevidenced by the high correlation between core and
headline measures. In recent years, core ination
has trended downward and has not been affected by
commodity-driven variations in headline ination. The
trend of underlying ination thus seems to be driven to
a greater extent by such factors as resource utilisation
and long-term ination expectations.
Year-on-year percentage change
Core inflation heading down
All items All items less food and energySource: Reuters EcoWin, SEB
70 75 80 85 90 95 00 05 10
-2.5
0.0
2.5
5.0
7.5
10.0
12.5
15.0
-2.5
0.0
2.5
5.0
7.5
10.0
12.5
15.0
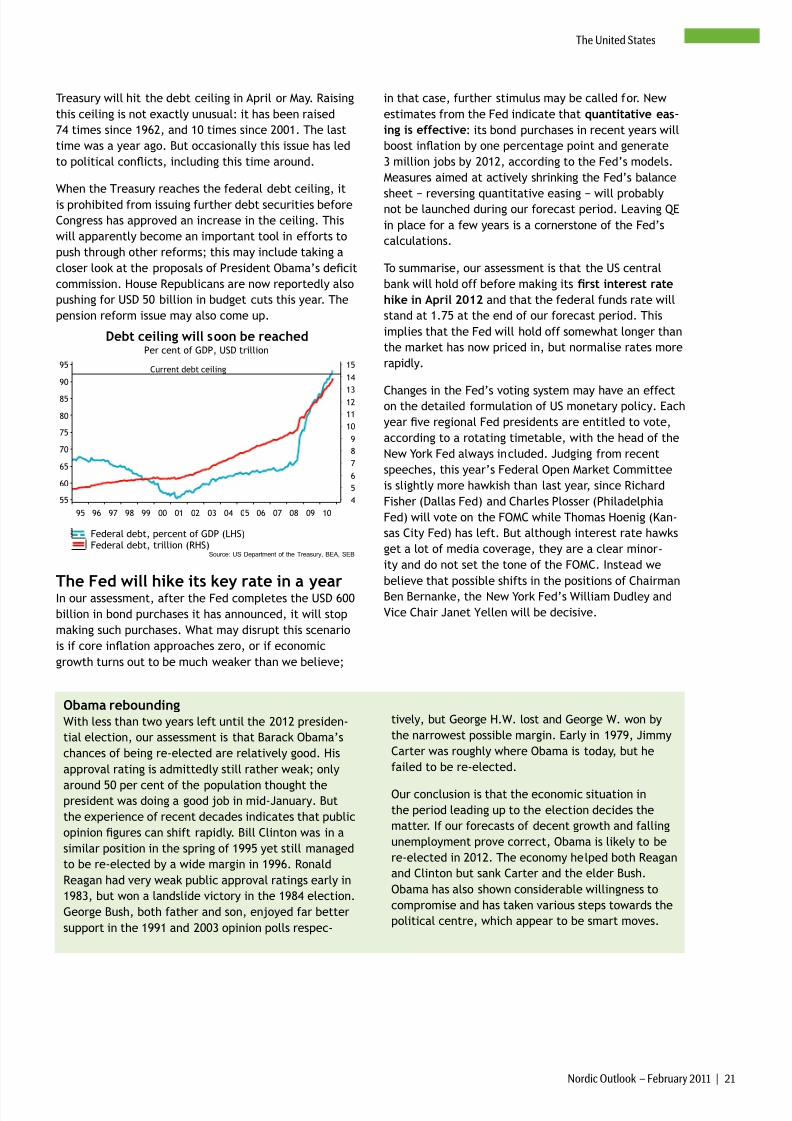
8/7/2019 SEB report: Giddy euphoria about the Swedish economy
http://slidepdf.com/reader/full/seb-report-giddy-euphoria-about-the-swedish-economy 20/55
Nordic Outlook – February 2011 | 21
The United States
Treasury will hit the debt ceiling in April or May. Raising
this ceiling is not exactly unusual: it has been raised
74 times since 1962, and 10 times since 2001. The last
time was a year ago. But occasionally this issue has led
to political conicts, including this time around.
When the Treasury reaches the federal debt ceiling, it
is prohibited from issuing further debt securities before
Congress has approved an increase in the ceiling. This
will apparently become an important tool in efforts to
push through other reforms; this may include taking a
closer look at the proposals of President Obama’s decit
commission. House Republicans are now reportedly also
pushing for USD 50 billion in budget cuts this year. The
pension reform issue may also come up.
Per cent of GDP, USD trillion
Debt ceiling will soon be reached
Federal debt, percent of GDP (LHS)Federal debt, trillion (RHS)
Source: US Department of the Treasury, BEA, SEB
95 96 97 98 99 00 01 02 03 04 05 06 07 08 09 10
4
5
6
7
8
9
10
11
1213
14
15
55
60
65
70
75
80
85
90
95Current debt ceiling
The Fed will hike its key rate in a yearIn our assessment, after the Fed completes the USD 600
billion in bond purchases it has announced, it will stop
making such purchases. What may disrupt this scenario
is if core ination approaches zero, or if economic
growth turns out to be much weaker than we believe;
in that case, further stimulus may be called for. New
estimates from the Fed indicate that quantitative eas-
ing is effective: its bond purchases in recent years will
boost ination by one percentage point and generate
3 million jobs by 2012, according to the Fed’s models.
Measures aimed at actively shrinking the Fed’s balance
sheet − reversing quantitative easing − will probablynot be launched during our forecast period. Leaving QE
in place for a few years is a cornerstone of the Fed’s
calculations.
To summarise, our assessment is that the US central
bank will hold off before making its rst interest rate
hike in April 2012 and that the federal funds rate will
stand at 1.75 at the end of our forecast period. This
implies that the Fed will hold off somewhat longer than
the market has now priced in, but normalise rates more
rapidly.
Changes in the Fed’s voting system may have an effecton the detailed formulation of US monetary policy. Each
year ve regional Fed presidents are entitled to vote,
according to a rotating timetable, with the head of the
New York Fed always included. Judging from recent
speeches, this year’s Federal Open Market Committee
is slightly more hawkish than last year, since Richard
Fisher (Dallas Fed) and Charles Plosser (Philadelphia
Fed) will vote on the FOMC while Thomas Hoenig (Kan-
sas City Fed) has left. But although interest rate hawks
get a lot of media coverage, they are a clear minor-
ity and do not set the tone of the FOMC. Instead we
believe that possible shifts in the positions of Chairman
Ben Bernanke, the New York Fed’s William Dudley and
Vice Chair Janet Yellen will be decisive.
Obama rebounding
With less than two years left until the 2012 presiden-
tial election, our assessment is that Barack Obama’s
chances of being re-elected are relatively good. His
approval rating is admittedly still rather weak; only
around 50 per cent of the population thought thepresident was doing a good job in mid-January. But
the experience of recent decades indicates that public
opinion gures can shift rapidly. Bill Clinton was in a
similar position in the spring of 1995 yet still managed
to be re-elected by a wide margin in 1996. Ronald
Reagan had very weak public approval ratings early in
1983, but won a landslide victory in the 1984 election.
George Bush, both father and son, enjoyed far better
support in the 1991 and 2003 opinion polls respec-
tively, but George H.W. lost and George W. won by
the narrowest possible margin. Early in 1979, Jimmy
Carter was roughly where Obama is today, but he
failed to be re-elected.
Our conclusion is that the economic situation in
the period leading up to the election decides the
matter. If our forecasts of decent growth and falling
unemployment prove correct, Obama is likely to be
re-elected in 2012. The economy helped both Reagan
and Clinton but sank Carter and the elder Bush.
Obama has also shown considerable willingness to
compromise and has taken various steps towards the
political centre, which appear to be smart moves.
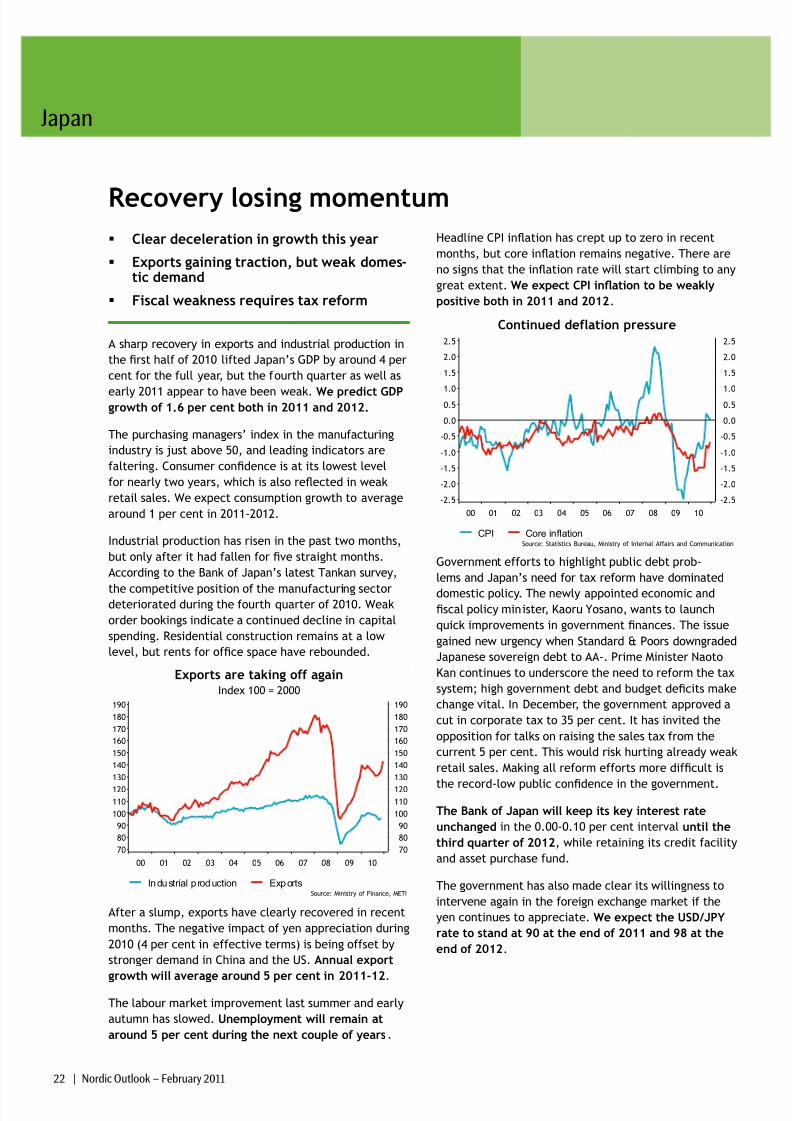
8/7/2019 SEB report: Giddy euphoria about the Swedish economy
http://slidepdf.com/reader/full/seb-report-giddy-euphoria-about-the-swedish-economy 21/55
Japan
22 | Nordic Outlook – February 2011
Recovery losing momentum Clear deceleration in growth this year
Exports gaining traction, but weak domes-tic demand
Fiscal weakness requires tax reform
A sharp recovery in exports and industrial production in
the rst half of 2010 lifted Japan’s GDP by around 4 per
cent for the full year, but the fourth quarter as well as
early 2011 appear to have been weak. We predict GDPgrowth of 1.6 per cent both in 2011 and 2012.
The purchasing managers’ index in the manufacturing
industry is just above 50, and leading indicators are
faltering. Consumer condence is at its lowest level
for nearly two years, which is also reected in weak
retail sales. We expect consumption growth to average
around 1 per cent in 2011-2012.
Industrial production has risen in the past two months,
but only after it had fallen for ve straight months.
According to the Bank of Japan’s latest Tankan survey,
the competitive position of the manufacturing sectordeteriorated during the fourth quarter of 2010. Weak
order bookings indicate a continued decline in capital
spending. Residential construction remains at a low
level, but rents for ofce space have rebounded.
Index 100 = 2000
Exports are taking off again
Industrial p roduction ExportsSource: Ministry of Finance, METI
00 01 02 03 04 05 06 07 08 09 10
70
80
90
100
110
120
130
140
150
160
170
180
190
70
80
90
100
110
120
130
140
150
160
170
180
190
After a slump, exports have clearly recovered in recent
months. The negative impact of yen appreciation during
2010 (4 per cent in effective terms) is being offset by
stronger demand in China and the US. Annual export
growth will average around 5 per cent in 2011-12.
The labour market improvement last summer and early
autumn has slowed. Unemployment will remain at
around 5 per cent during the next couple of years.
Headline CPI ination has crept up to zero in recent
months, but core ination remains negative. There are
no signs that the ination rate will start climbing to any
great extent. We expect CPI ination to be weakly
positive both in 2011 and 2012.
Continued deflation pressure
CPI Core inflationSource: Statistics Bureau, Ministry of Internal Affairs and Communication
00 01 02 03 04 05 06 07 08 09 10
-2.5
-2.0
-1.5
-1.0
-0.5
0.0
0.51.0
1.5
2.0
2.5
-2.5
-2.0
-1.5
-1.0
-0.5
0.0
0.51.0
1.5
2.0
2.5
Government efforts to highlight public debt prob-
lems and Japan’s need for tax reform have dominated
domestic policy. The newly appointed economic and
scal policy minister, Kaoru Yosano, wants to launch
quick improvements in government nances. The issue
gained new urgency when Standard & Poors downgraded
Japanese sovereign debt to AA-. Prime Minister Naoto
Kan continues to underscore the need to reform the tax
system; high government debt and budget decits make
change vital. In December, the government approved a
cut in corporate tax to 35 per cent. It has invited the
opposition for talks on raising the sales tax from the
current 5 per cent. This would risk hurting already weak
retail sales. Making all reform efforts more difcult is
the record-low public condence in the government.
The Bank of Japan will keep its key interest rate
unchanged in the 0.00-0.10 per cent interval until the
third quarter of 2012, while retaining its credit facility
and asset purchase fund.
The government has also made clear its willingness to
intervene again in the foreign exchange market if the
yen continues to appreciate. We expect the USD/JPY
rate to stand at 90 at the end of 2011 and 98 at the
end of 2012.
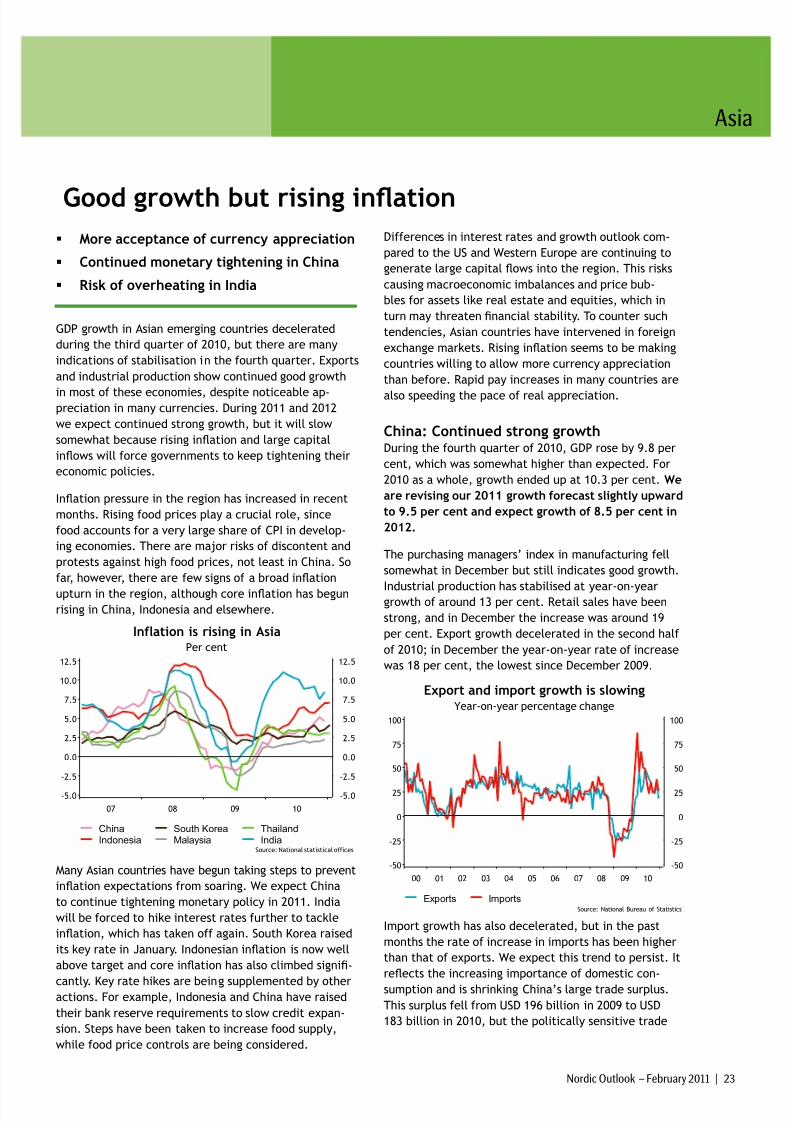
8/7/2019 SEB report: Giddy euphoria about the Swedish economy
http://slidepdf.com/reader/full/seb-report-giddy-euphoria-about-the-swedish-economy 22/55
Asia
Nordic Outlook – February 2011 | 23
Good growth but rising ination More acceptance of currency appreciation
Continued monetary tightening in China
Risk of overheating in India
GDP growth in Asian emerging countries decelerated
during the third quarter of 2010, but there are many
indications of stabilisation in the fourth quarter. Exports
and industrial production show continued good growth
in most of these economies, despite noticeable ap-preciation in many currencies. During 2011 and 2012
we expect continued strong growth, but it will slow
somewhat because rising ination and large capital
inows will force governments to keep tightening their
economic policies.
Ination pressure in the region has increased in recent
months. Rising food prices play a crucial role, since
food accounts for a very large share of CPI in develop-
ing economies. There are major risks of discontent and
protests against high food prices, not least in China. So
far, however, there are few signs of a broad ination
upturn in the region, although core ination has begun
rising in China, Indonesia and elsewhere.
Per cent
Inflation is rising in Asia
ChinaIndonesia
South KoreaMalaysia
ThailandIndia
Source: National statistical offices
07 08 09 10
-5.0
-2.5
0.0
2.5
5.0
7.5
10.0
12.5
-5.0
-2.5
0.0
2.5
5.0
7.5
10.0
12.5
Many Asian countries have begun taking steps to prevent
ination expectations from soaring. We expect China
to continue tightening monetary policy in 2011. India
will be forced to hike interest rates further to tackle
ination, which has taken off again. South Korea raised
its key rate in January. Indonesian ination is now well
above target and core ination has also climbed signi-
cantly. Key rate hikes are being supplemented by otheractions. For example, Indonesia and China have raised
their bank reserve requirements to slow credit expan-
sion. Steps have been taken to increase food supply,
while food price controls are being considered.
Differences in interest rates and growth outlook com-
pared to the US and Western Europe are continuing to
generate large capital ows into the region. This risks
causing macroeconomic imbalances and price bub-
bles for assets like real estate and equities, which in
turn may threaten nancial stability. To counter such
tendencies, Asian countries have intervened in foreign
exchange markets. Rising ination seems to be making
countries willing to allow more currency appreciation
than before. Rapid pay increases in many countries are
also speeding the pace of real appreciation.
China: Continued strong growthDuring the fourth quarter of 2010, GDP rose by 9.8 per
cent, which was somewhat higher than expected. For
2010 as a whole, growth ended up at 10.3 per cent. We
are revising our 2011 growth forecast slightly upward
to 9.5 per cent and expect growth of 8.5 per cent in
2012.
The purchasing managers’ index in manufacturing fell
somewhat in December but still indicates good growth.
Industrial production has stabilised at year-on-yeargrowth of around 13 per cent. Retail sales have been
strong, and in December the increase was around 19
per cent. Export growth decelerated in the second half
of 2010; in December the year-on-year rate of increase
was 18 per cent, the lowest since December 2009.
Year-on-year percentage change
Export and import growth is slowing
Exports ImportsSource: National Bureau of Statistics
00 01 02 03 04 05 06 07 08 09 10
-50
-25
0
25
50
75
100
-50
-25
0
25
50
75
100
Import growth has also decelerated, but in the past
months the rate of increase in imports has been higher
than that of exports. We expect this trend to persist. It
reects the increasing importance of domestic con-
sumption and is shrinking China’s large trade surplus.
This surplus fell from USD 196 billion in 2009 to USD
183 billion in 2010, but the politically sensitive trade
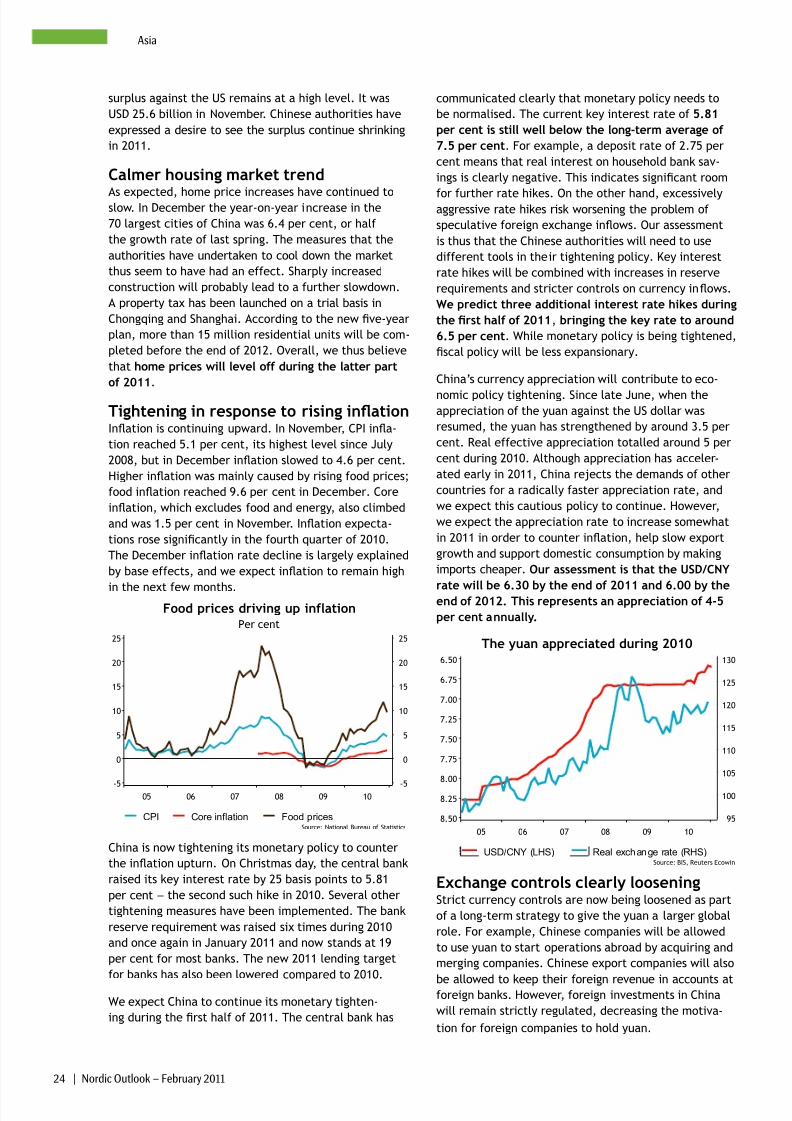
8/7/2019 SEB report: Giddy euphoria about the Swedish economy
http://slidepdf.com/reader/full/seb-report-giddy-euphoria-about-the-swedish-economy 23/55
24 | Nordic Outlook – February 2011
Asia
surplus against the US remains at a high level. It was
USD 25.6 billion in November. Chinese authorities have
expressed a desire to see the surplus continue shrinking
in 2011.
Calmer housing market trend
As expected, home price increases have continued toslow. In December the year-on-year increase in the
70 largest cities of China was 6.4 per cent, or half
the growth rate of last spring. The measures that the
authorities have undertaken to cool down the market
thus seem to have had an effect. Sharply increased
construction will probably lead to a further slowdown.
A property tax has been launched on a trial basis in
Chongqing and Shanghai. According to the new ve-year
plan, more than 15 million residential units will be com-
pleted before the end of 2012. Overall, we thus believe
that home prices will level off during the latter part
of 2011.
Tightening in response to rising inationInation is continuing upward. In November, CPI ina-
tion reached 5.1 per cent, its highest level since July
2008, but in December ination slowed to 4.6 per cent.
Higher ination was mainly caused by rising food prices;
food ination reached 9.6 per cent in December. Core
ination, which excludes food and energy, also climbed
and was 1.5 per cent in November. Ination expecta-
tions rose signicantly in the fourth quarter of 2010.
The December ination rate decline is largely explained
by base effects, and we expect ination to remain high
in the next few months.
Per cent
Food prices driving up inflation
CPI Core inflation Food pricesSource: National Bureau of Statistics
05 06 07 08 09 10-5
0
5
10
15
20
25
-5
0
5
10
15
20
25
China is now tightening its monetary policy to counter
the ination upturn. On Christmas day, the central bank
raised its key interest rate by 25 basis points to 5.81
per cent − the second such hike in 2010. Several other
tightening measures have been implemented. The bank
reserve requirement was raised six times during 2010
and once again in January 2011 and now stands at 19
per cent for most banks. The new 2011 lending target
for banks has also been lowered compared to 2010.
We expect China to continue its monetary tighten-
ing during the rst half of 2011. The central bank has
communicated clearly that monetary policy needs to
be normalised. The current key interest rate of 5.81
per cent is still well below the long-term average of
7.5 per cent. For example, a deposit rate of 2.75 per
cent means that real interest on household bank sav-
ings is clearly negative. This indicates signicant room
for further rate hikes. On the other hand, excessivelyaggressive rate hikes risk worsening the problem of
speculative foreign exchange inows. Our assessment
is thus that the Chinese authorities will need to use
different tools in their tightening policy. Key interest
rate hikes will be combined with increases in reserve
requirements and stricter controls on currency inows.
We predict three additional interest rate hikes during
the rst half of 2011, bringing the key rate to around
6.5 per cent. While monetary policy is being tightened,
scal policy will be less expansionary.
China’s currency appreciation will contribute to eco-
nomic policy tightening. Since late June, when theappreciation of the yuan against the US dollar was
resumed, the yuan has strengthened by around 3.5 per
cent. Real effective appreciation totalled around 5 per
cent during 2010. Although appreciation has acceler-
ated early in 2011, China rejects the demands of other
countries for a radically faster appreciation rate, and
we expect this cautious policy to continue. However,
we expect the appreciation rate to increase somewhat
in 2011 in order to counter ination, help slow export
growth and support domestic consumption by making
imports cheaper. Our assessment is that the USD/CNY
rate will be 6.30 by the end of 2011 and 6.00 by theend of 2012. This represents an appreciation of 4-5
per cent annually.
The yuan appreciated during 2010
USD/CNY (LHS) Real exchange rate (RHS)Source: BIS, Reuters Ecowin
05 06 07 08 09 10
95
100
105
110
115
120
125
1306.50
6.75
7.00
7.25
7.50
7.75
8.00
8.25
8.50
Exchange controls clearly looseningStrict currency controls are now being loosened as part
of a long-term strategy to give the yuan a larger global
role. For example, Chinese companies will be allowed
to use yuan to start operations abroad by acquiring and
merging companies. Chinese export companies will also
be allowed to keep their foreign revenue in accounts atforeign banks. However, foreign investments in China
will remain strictly regulated, decreasing the motiva-
tion for foreign companies to hold yuan.
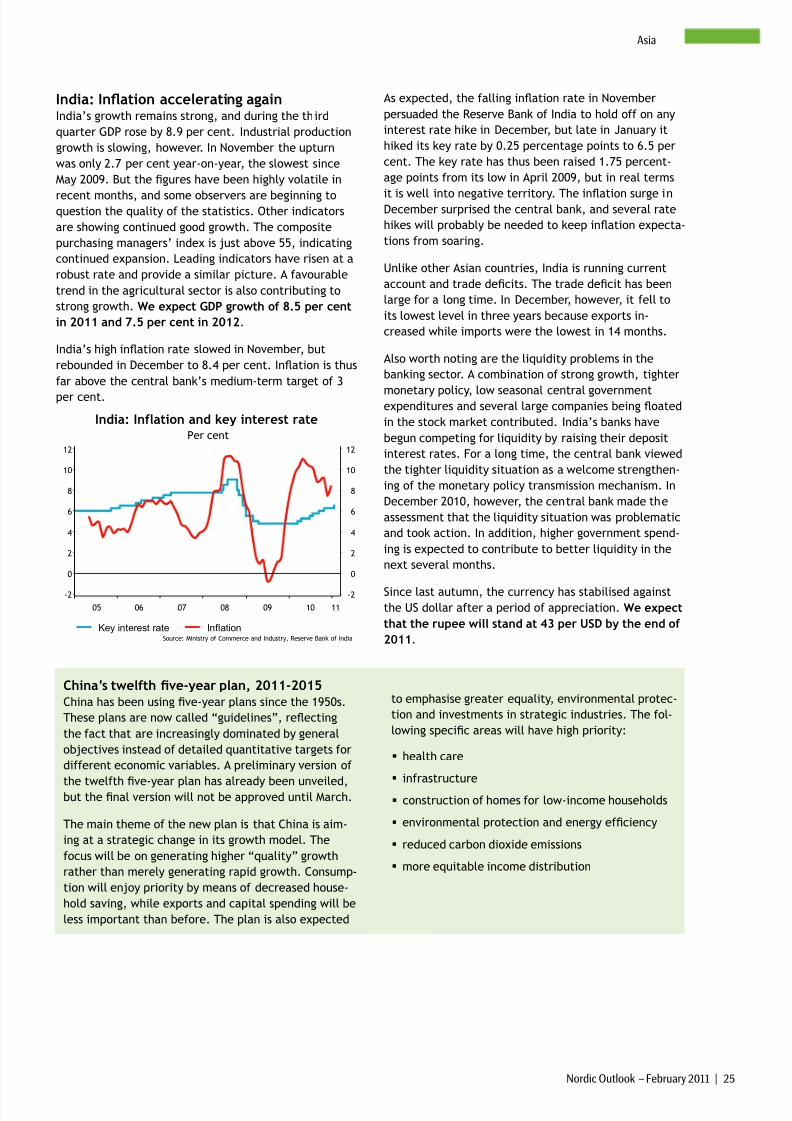
8/7/2019 SEB report: Giddy euphoria about the Swedish economy
http://slidepdf.com/reader/full/seb-report-giddy-euphoria-about-the-swedish-economy 24/55
Nordic Outlook – February 2011 | 25
Asia
India: Ination accelerating againIndia’s growth remains strong, and during the third
quarter GDP rose by 8.9 per cent. Industrial production
growth is slowing, however. In November the upturn
was only 2.7 per cent year-on-year, the slowest since
May 2009. But the gures have been highly volatile in
recent months, and some observers are beginning toquestion the quality of the statistics. Other indicators
are showing continued good growth. The composite
purchasing managers’ index is just above 55, indicating
continued expansion. Leading indicators have risen at a
robust rate and provide a similar picture. A favourable
trend in the agricultural sector is also contributing to
strong growth. We expect GDP growth of 8.5 per cent
in 2011 and 7.5 per cent in 2012.
India’s high ination rate slowed in November, but
rebounded in December to 8.4 per cent. Ination is thus
far above the central bank’s medium-term target of 3
per cent.
Per cent
India: Inflation and key interest rate
Key interest rate InflationSource: Ministry of Commerce and Industry, Reserve Bank of India
05 06 07 08 09 10 11
-2
0
2
4
6
8
10
12
-2
0
2
4
6
8
10
12
As expected, the falling ination rate in November
persuaded the Reserve Bank of India to hold off on any
interest rate hike in December, but late in January it
hiked its key rate by 0.25 percentage points to 6.5 per
cent. The key rate has thus been raised 1.75 percent-
age points from its low in April 2009, but in real terms
it is well into negative territory. The ination surge inDecember surprised the central bank, and several rate
hikes will probably be needed to keep ination expecta-
tions from soaring.
Unlike other Asian countries, India is running current
account and trade decits. The trade decit has been
large for a long time. In December, however, it fell to
its lowest level in three years because exports in-
creased while imports were the lowest in 14 months.
Also worth noting are the liquidity problems in the
banking sector. A combination of strong growth, tighter
monetary policy, low seasonal central governmentexpenditures and several large companies being oated
in the stock market contributed. India’s banks have
begun competing for liquidity by raising their deposit
interest rates. For a long time, the central bank viewed
the tighter liquidity situation as a welcome strengthen-
ing of the monetary policy transmission mechanism. In
December 2010, however, the central bank made the
assessment that the liquidity situation was problematic
and took action. In addition, higher government spend-
ing is expected to contribute to better liquidity in the
next several months.
Since last autumn, the currency has stabilised againstthe US dollar after a period of appreciation. We expect
that the rupee will stand at 43 per USD by the end of
2011.
China’s twelfth ve-year plan, 2011-2015China has been using ve-year plans since the 1950s.
These plans are now called “guidelines”, reecting
the fact that are increasingly dominated by general
objectives instead of detailed quantitative targets for
different economic variables. A preliminary version of
the twelfth ve-year plan has already been unveiled,but the nal version will not be approved until March.
The main theme of the new plan is that China is aim-
ing at a strategic change in its growth model. The
focus will be on generating higher “quality” growth
rather than merely generating rapid growth. Consump-
tion will enjoy priority by means of decreased house-
hold saving, while exports and capital spending will be
less important than before. The plan is also expected
to emphasise greater equality, environmental protec-
tion and investments in strategic industries. The fol-
lowing specic areas will have high priority:
health care
infrastructure
construction of homes for low-income households
environmental protection and energy efciency
reduced carbon dioxide emissions
more equitable income distribution
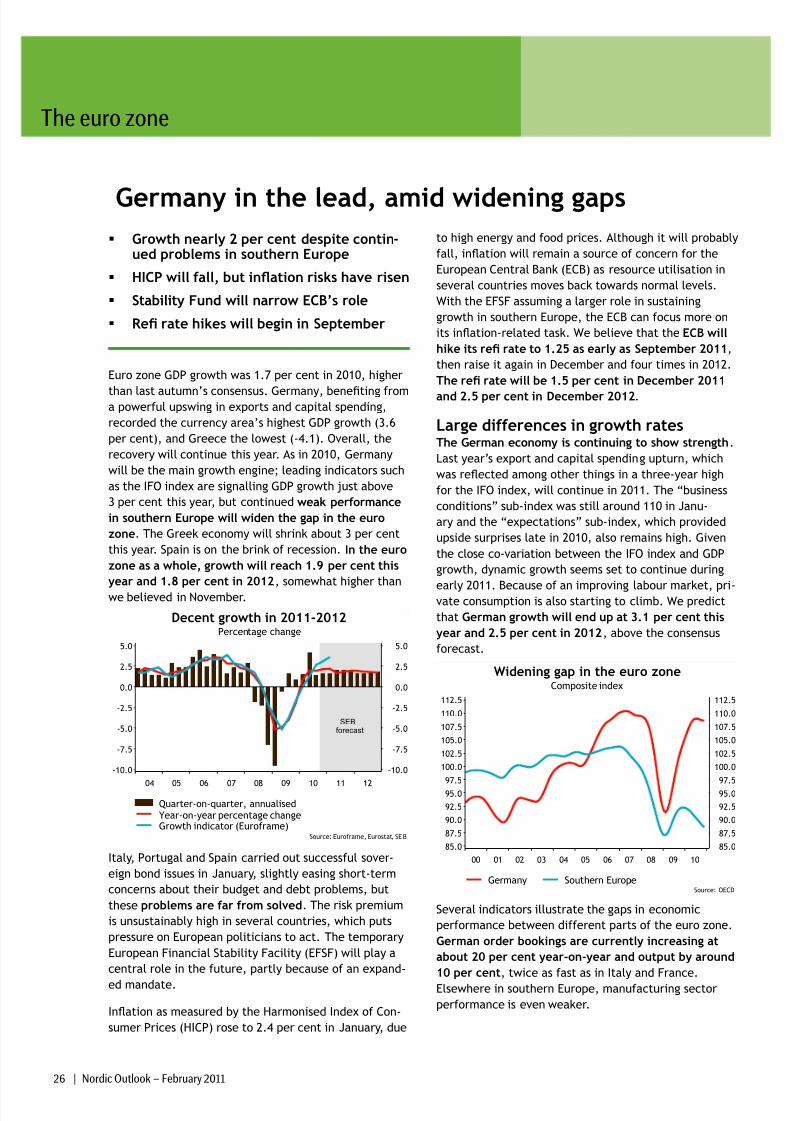
8/7/2019 SEB report: Giddy euphoria about the Swedish economy
http://slidepdf.com/reader/full/seb-report-giddy-euphoria-about-the-swedish-economy 25/55
The euro zone
26 | Nordic Outlook – February 2011
Germany in the lead, amid widening gaps Growth nearly 2 per cent despite contin-
ued problems in southern Europe
HICP will fall, but ination risks have risen
Stability Fund will narrow ECB’s role
Re rate hikes will begin in September
Euro zone GDP growth was 1.7 per cent in 2010, higher
than last autumn’s consensus. Germany, beneting froma powerful upswing in exports and capital spending,
recorded the currency area’s highest GDP growth (3.6
per cent), and Greece the lowest (-4.1). Overall, the
recovery will continue this year. As in 2010, Germany
will be the main growth engine; leading indicators such
as the IFO index are signalling GDP growth just above
3 per cent this year, but continued weak performance
in southern Europe will widen the gap in the euro
zone. The Greek economy will shrink about 3 per cent
this year. Spain is on the brink of recession. In the euro
zone as a whole, growth will reach 1.9 per cent this
year and 1.8 per cent in 2012, somewhat higher than
we believed in November.
Percentage change
Decent growth in 2011-2012
Quarter-on-quarter, annualisedYear-on-year percentage changeGrowth indicator (Euroframe)
Source: Euroframe, Eurostat, SEB
04 05 06 07 08 09 10 11 12
-10.0
-7.5
-5.0
-2.5
0.0
2.5
5.0
-10.0
-7.5
-5.0
-2.5
0.0
2.5
5.0
forecastSEB
Italy, Portugal and Spain carried out successful sover-
eign bond issues in January, slightly easing short-term
concerns about their budget and debt problems, but
these problems are far from solved. The risk premium
is unsustainably high in several countries, which puts
pressure on European politicians to act. The temporary
European Financial Stability Facility (EFSF) will play a
central role in the future, partly because of an expand-
ed mandate.
Ination as measured by the Harmonised Index of Con-
sumer Prices (HICP) rose to 2.4 per cent in January, due
to high energy and food prices. Although it will probably
fall, ination will remain a source of concern for the
European Central Bank (ECB) as resource utilisation in
several countries moves back towards normal levels.
With the EFSF assuming a larger role in sustaining
growth in southern Europe, the ECB can focus more on
its ination-related task. We believe that the ECB will
hike its re rate to 1.25 as early as September 2011,
then raise it again in December and four times in 2012.
The re rate will be 1.5 per cent in December 2011
and 2.5 per cent in December 2012.
Large differences in growth ratesThe German economy is continuing to show strength.
Last year’s export and capital spending upturn, which
was reected among other things in a three-year high
for the IFO index, will continue in 2011. The “business
conditions” sub-index was still around 110 in Janu-
ary and the “expectations” sub-index, which provided
upside surprises late in 2010, also remains high. Given
the close co-variation between the IFO index and GDP
growth, dynamic growth seems set to continue during
early 2011. Because of an improving labour market, pri-vate consumption is also starting to climb. We predict
that German growth will end up at 3.1 per cent this
year and 2.5 per cent in 2012, above the consensus
forecast.
Composite index
Widening gap in the euro zone
Germany Southern EuropeSource: OECD
00 01 02 03 04 05 06 07 08 09 10
85.0
87.5
90.0
92.5
95.0
97.5
100.0
102.5
105.0
107.5
110.0
112.5
85.0
87.5
90.0
92.5
95.0
97.5
100.0
102.5
105.0
107.5
110.0
112.5
Several indicators illustrate the gaps in economic
performance between different parts of the euro zone.
German order bookings are currently increasing at
about 20 per cent year-on-year and output by around
10 per cent, twice as fast as in Italy and France.
Elsewhere in southern Europe, manufacturing sector
performance is even weaker.
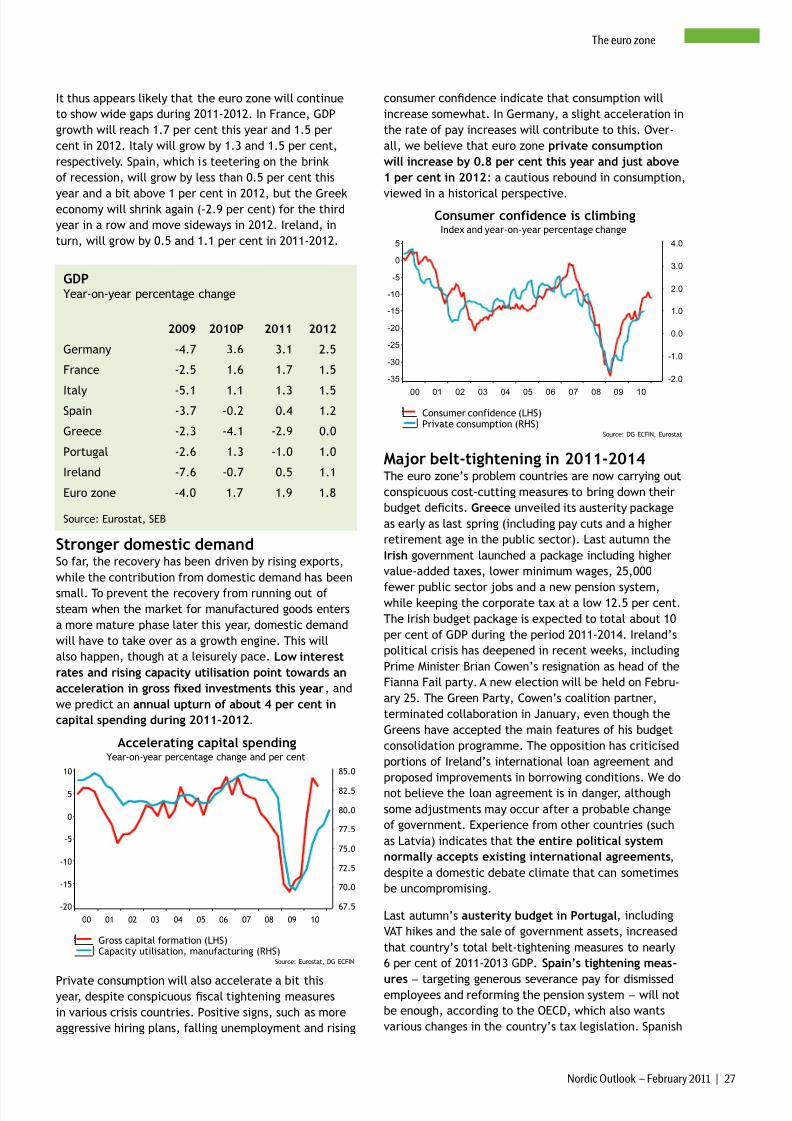
8/7/2019 SEB report: Giddy euphoria about the Swedish economy
http://slidepdf.com/reader/full/seb-report-giddy-euphoria-about-the-swedish-economy 26/55
Nordic Outlook – February 2011 | 27
The euro zone
It thus appears likely that the euro zone will continue
to show wide gaps during 2011-2012. In France, GDP
growth will reach 1.7 per cent this year and 1.5 per
cent in 2012. Italy will grow by 1.3 and 1.5 per cent,
respectively. Spain, which is teetering on the brink
of recession, will grow by less than 0.5 per cent this
year and a bit above 1 per cent in 2012, but the Greekeconomy will shrink again (-2.9 per cent) for the third
year in a row and move sideways in 2012. Ireland, in
turn, will grow by 0.5 and 1.1 per cent in 2011-2012.
GDPYear-on-year percentage change
2009 2010P 2011 2012
Germany -4.7 3.6 3.1 2.5
France -2.5 1.6 1.7 1.5
Italy -5.1 1.1 1.3 1.5Spain -3.7 -0.2 0.4 1.2
Greece -2.3 -4.1 -2.9 0.0
Portugal -2.6 1.3 -1.0 1.0
Ireland -7.6 -0.7 0.5 1.1
Euro zone -4.0 1.7 1.9 1.8
Source: Eurostat, SEB
Stronger domestic demandSo far, the recovery has been driven by rising exports,
while the contribution from domestic demand has been
small. To prevent the recovery from running out of
steam when the market for manufactured goods enters
a more mature phase later this year, domestic demand
will have to take over as a growth engine. This will
also happen, though at a leisurely pace. Low interest
rates and rising capacity utilisation point towards an
acceleration in gross xed investments this year, and
we predict an annual upturn of about 4 per cent in
capital spending during 2011-2012.
Year-on-year percentage change and per cent
Accelerating capital spending
Gross capital formation (LHS)Capacity utilisation, manufacturing (RHS)
Source: Eurostat, DG ECFIN
00 01 02 03 04 05 06 07 08 09 10
67.5
70.0
72.5
75.0
77.5
80.0
82.5
85.0
-20
-15
-10
-5
0
5
10
Private consumption will also accelerate a bit thisyear, despite conspicuous scal tightening measures
in various crisis countries. Positive signs, such as more
aggressive hiring plans, falling unemployment and rising
consumer condence indicate that consumption will
increase somewhat. In Germany, a slight acceleration in
the rate of pay increases will contribute to this. Over-
all, we believe that euro zone private consumption
will increase by 0.8 per cent this year and just above
1 per cent in 2012: a cautious rebound in consumption,
viewed in a historical perspective.
Index and year-on-year percentage change
Consumer confidence is climbing
Consumer confidence (LHS)Private consumption (RHS)
Source: DG ECFIN, Eurostat
00 01 02 03 04 05 06 07 08 09 10
-2.0
-1.0
0.0
1.0
2.0
3.0
4.0
-35
-30
-25
-20
-15
-10
-5
0
5
Major belt-tightening in 2011-2014The euro zone’s problem countries are now carrying out
conspicuous cost-cutting measures to bring down their
budget decits. Greece unveiled its austerity package
as early as last spring (including pay cuts and a higher
retirement age in the public sector). Last autumn the
Irish government launched a package including higher
value-added taxes, lower minimum wages, 25,000
fewer public sector jobs and a new pension system,while keeping the corporate tax at a low 12.5 per cent.
The Irish budget package is expected to total about 10
per cent of GDP during the period 2011-2014. Ireland’s
political crisis has deepened in recent weeks, including
Prime Minister Brian Cowen’s resignation as head of the
Fianna Fail party. A new election will be held on Febru-
ary 25. The Green Party, Cowen’s coalition partner,
terminated collaboration in January, even though the
Greens have accepted the main features of his budget
consolidation programme. The opposition has criticised
portions of Ireland’s international loan agreement and
proposed improvements in borrowing conditions. We do
not believe the loan agreement is in danger, although
some adjustments may occur after a probable change
of government. Experience from other countries (such
as Latvia) indicates that the entire political system
normally accepts existing international agreements,
despite a domestic debate climate that can sometimes
be uncompromising.
Last autumn’s austerity budget in Portugal, including
VAT hikes and the sale of government assets, increased
that country’s total belt-tightening measures to nearly
6 per cent of 2011-2013 GDP. Spain’s tightening meas-
ures−
targeting generous severance pay for dismissedemployees and reforming the pension system − will not
be enough, according to the OECD, which also wants
various changes in the country’s tax legislation. Spanish
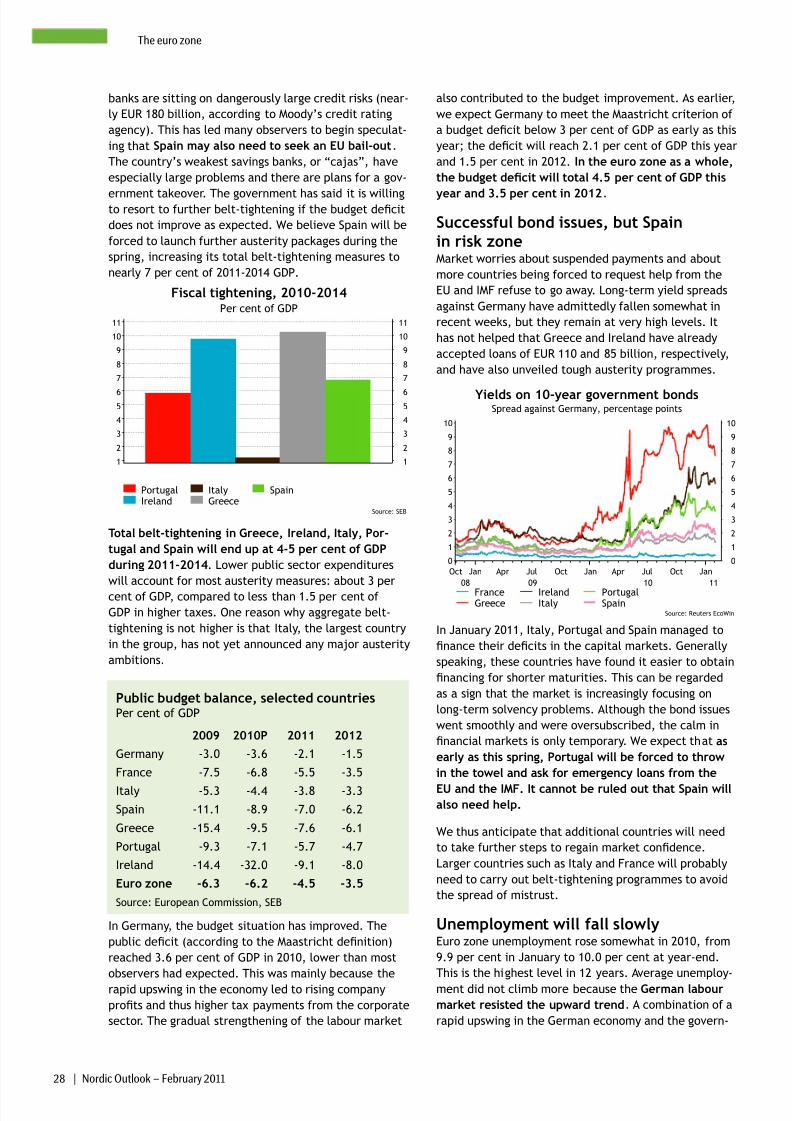
8/7/2019 SEB report: Giddy euphoria about the Swedish economy
http://slidepdf.com/reader/full/seb-report-giddy-euphoria-about-the-swedish-economy 27/55
28 | Nordic Outlook – February 2011
The euro zone
banks are sitting on dangerously large credit risks (near-
ly EUR 180 billion, according to Moody’s credit rating
agency). This has led many observers to begin speculat-
ing that Spain may also need to seek an EU bail-out.
The country’s weakest savings banks, or “cajas”, have
especially large problems and there are plans for a gov-
ernment takeover. The government has said it is willingto resort to further belt-tightening if the budget decit
does not improve as expected. We believe Spain will be
forced to launch further austerity packages during the
spring, increasing its total belt-tightening measures to
nearly 7 per cent of 2011-2014 GDP.
Per cent of GDP
Fiscal tightening, 2010-2014
PortugalIreland
ItalyGreece
Spain
Source: SEB
1
2
3
4
56
7
8
9
10
11
1
2
3
4
56
7
8
9
10
11
Total belt-tightening in Greece, Ireland, Italy, Por-
tugal and Spain will end up at 4-5 per cent of GDP
during 2011-2014. Lower public sector expenditures
will account for most austerity measures: about 3 per
cent of GDP, compared to less than 1.5 per cent of
GDP in higher taxes. One reason why aggregate belt-
tightening is not higher is that Italy, the largest country
in the group, has not yet announced any major austerity
ambitions.
Public budget balance, selected countriesPer cent of GDP
2009 2010P 2011 2012
Germany -3.0 -3.6 -2.1 -1.5
France -7.5 -6.8 -5.5 -3.5
Italy -5.3 -4.4 -3.8 -3.3
Spain -11.1 -8.9 -7.0 -6.2
Greece -15.4 -9.5 -7.6 -6.1
Portugal -9.3 -7.1 -5.7 -4.7
Ireland -14.4 -32.0 -9.1 -8.0
Euro zone -6.3 -6.2 -4.5 -3.5
Source: European Commission, SEB
In Germany, the budget situation has improved. The
public decit (according to the Maastricht denition)
reached 3.6 per cent of GDP in 2010, lower than most
observers had expected. This was mainly because the
rapid upswing in the economy led to rising company
prots and thus higher tax payments from the corporate
sector. The gradual strengthening of the labour market
also contributed to the budget improvement. As earlier,
we expect Germany to meet the Maastricht criterion of
a budget decit below 3 per cent of GDP as early as this
year; the decit will reach 2.1 per cent of GDP this year
and 1.5 per cent in 2012. In the euro zone as a whole,
the budget decit will total 4.5 per cent of GDP this
year and 3.5 per cent in 2012.
Successful bond issues, but Spain
in risk zoneMarket worries about suspended payments and about
more countries being forced to request help from the
EU and IMF refuse to go away. Long-term yield spreads
against Germany have admittedly fallen somewhat in
recent weeks, but they remain at very high levels. It
has not helped that Greece and Ireland have already
accepted loans of EUR 110 and 85 billion, respectively,
and have also unveiled tough austerity programmes.
Spread against Germany, percentage pointsYields on 10-year government bonds
FranceGreece
IrelandItaly
PortugalSpain
Source: Reuters EcoWin
Oct
08
Jan
09
Apr Jul Oct Jan
10
Apr Jul Oct Jan
11
0
1
2
3
4
5
6
7
8
9
10
0
1
2
3
4
5
6
7
8
9
10
In January 2011, Italy, Portugal and Spain managed to
nance their decits in the capital markets. Generally
speaking, these countries have found it easier to obtain
nancing for shorter maturities. This can be regarded
as a sign that the market is increasingly focusing on
long-term solvency problems. Although the bond issues
went smoothly and were oversubscribed, the calm in
nancial markets is only temporary. We expect that as
early as this spring, Portugal will be forced to throw
in the towel and ask for emergency loans from the
EU and the IMF. It cannot be ruled out that Spain willalso need help.
We thus anticipate that additional countries will need
to take further steps to regain market condence.
Larger countries such as Italy and France will probably
need to carry out belt-tightening programmes to avoid
the spread of mistrust.
Unemployment will fall slowlyEuro zone unemployment rose somewhat in 2010, from
9.9 per cent in January to 10.0 per cent at year-end.
This is the highest level in 12 years. Average unemploy-
ment did not climb more because the German labour
market resisted the upward trend. A combination of a
rapid upswing in the German economy and the govern-
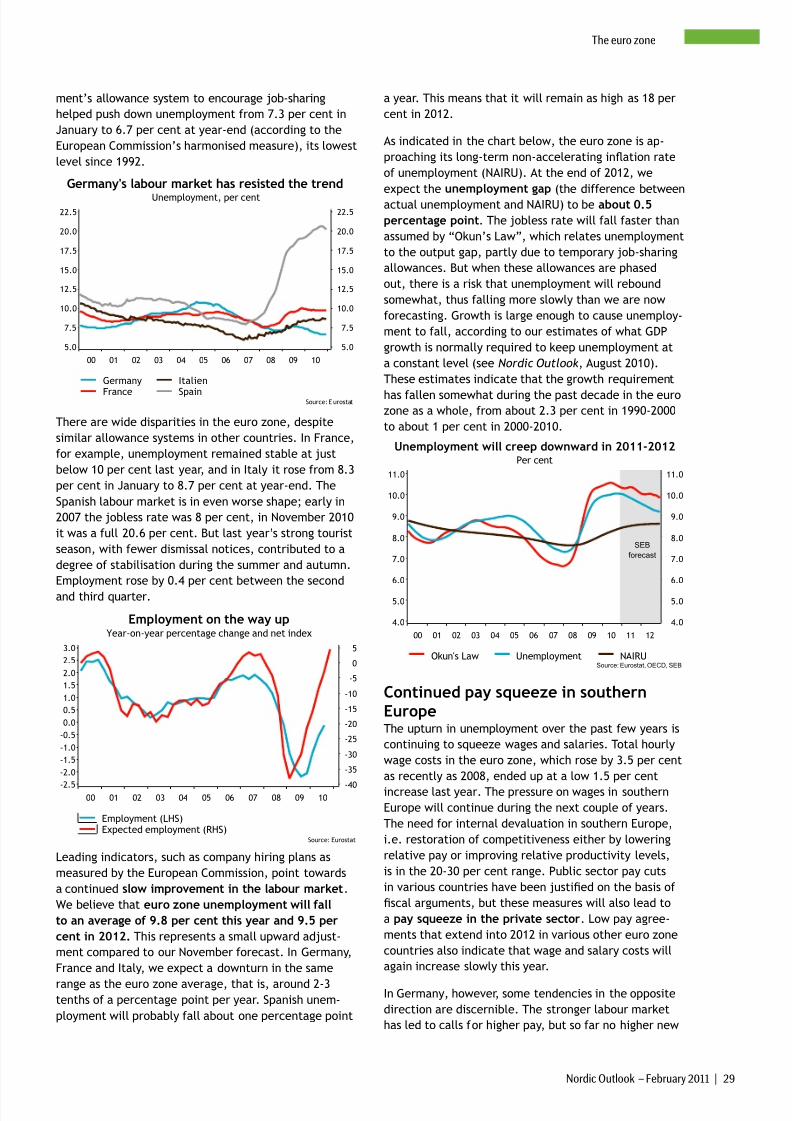
8/7/2019 SEB report: Giddy euphoria about the Swedish economy
http://slidepdf.com/reader/full/seb-report-giddy-euphoria-about-the-swedish-economy 28/55
Nordic Outlook – February 2011 | 29
The euro zone
ment’s allowance system to encourage job-sharing
helped push down unemployment from 7.3 per cent in
January to 6.7 per cent at year-end (according to the
European Commission’s harmonised measure), its lowest
level since 1992.
Unemployment, per cent
Germany's labour market has resisted the trend
Germany
France
Italien
Spain Source: E urostat
00 01 02 03 04 05 06 07 08 09 10
5.0
7.5
10.0
12.5
15.0
17.5
20.0
22.5
5.0
7.5
10.0
12.5
15.0
17.5
20.0
22.5
There are wide disparities in the euro zone, despite
similar allowance systems in other countries. In France,
for example, unemployment remained stable at just
below 10 per cent last year, and in Italy it rose from 8.3
per cent in January to 8.7 per cent at year-end. The
Spanish labour market is in even worse shape; early in
2007 the jobless rate was 8 per cent, in November 2010
it was a full 20.6 per cent. But last year’s strong tourist
season, with fewer dismissal notices, contributed to a
degree of stabilisation during the summer and autumn.
Employment rose by 0.4 per cent between the second
and third quarter.
Year-on-year percentage change and net index
Employment on the way up
Employment (LHS)Expected employment (RHS)
Source: Eurostat
00 01 02 03 04 05 06 07 08 09 10-40
-35
-30
-25
-20
-15
-10
-5
0
5
-2.5
-2.0
-1.5
-1.0
-0.5
0.0
0.5
1.0
1.5
2.0
2.5
3.0
Leading indicators, such as company hiring plans as
measured by the European Commission, point towards
a continued slow improvement in the labour market.
We believe that euro zone unemployment will fall
to an average of 9.8 per cent this year and 9.5 per
cent in 2012. This represents a small upward adjust-
ment compared to our November forecast. In Germany,
France and Italy, we expect a downturn in the same
range as the euro zone average, that is, around 2-3tenths of a percentage point per year. Spanish unem-
ployment will probably fall about one percentage point
a year. This means that it will remain as high as 18 per
cent in 2012.
As indicated in the chart below, the euro zone is ap-
proaching its long-term non-accelerating ination rate
of unemployment (NAIRU). At the end of 2012, we
expect the unemployment gap (the difference between
actual unemployment and NAIRU) to be about 0.5
percentage point. The jobless rate will fall faster than
assumed by “Okun’s Law”, which relates unemployment
to the output gap, partly due to temporary job-sharing
allowances. But when these allowances are phased
out, there is a risk that unemployment will rebound
somewhat, thus falling more slowly than we are now
forecasting. Growth is large enough to cause unemploy-
ment to fall, according to our estimates of what GDP
growth is normally required to keep unemployment at
a constant level (see Nordic Outlook, August 2010).
These estimates indicate that the growth requirement
has fallen somewhat during the past decade in the eurozone as a whole, from about 2.3 per cent in 1990-2000
to about 1 per cent in 2000-2010.
Per cent
Unemployment will creep downward in 2011-2012
Okun's Law Unemployment NAIRUSource: Eurostat, OECD, SEB
00 01 02 03 04 05 06 07 08 09 10 11 12
4.0
5.0
6.0
7.0
8.0
9.0
10.0
11.0
4.0
5.0
6.0
7.0
8.0
9.0
10.0
11.0
SEB
forecast
Continued pay squeeze in southernEuropeThe upturn in unemployment over the past few years is
continuing to squeeze wages and salaries. Total hourly
wage costs in the euro zone, which rose by 3.5 per cent
as recently as 2008, ended up at a low 1.5 per cent
increase last year. The pressure on wages in southern
Europe will continue during the next couple of years.
The need for internal devaluation in southern Europe,
i.e. restoration of competitiveness either by lowering
relative pay or improving relative productivity levels,
is in the 20-30 per cent range. Public sector pay cuts
in various countries have been justied on the basis of
scal arguments, but these measures will also lead to
a pay squeeze in the private sector. Low pay agree-
ments that extend into 2012 in various other euro zone
countries also indicate that wage and salary costs will
again increase slowly this year.
In Germany, however, some tendencies in the opposite
direction are discernible. The stronger labour market
has led to calls for higher pay, but so far no higher new
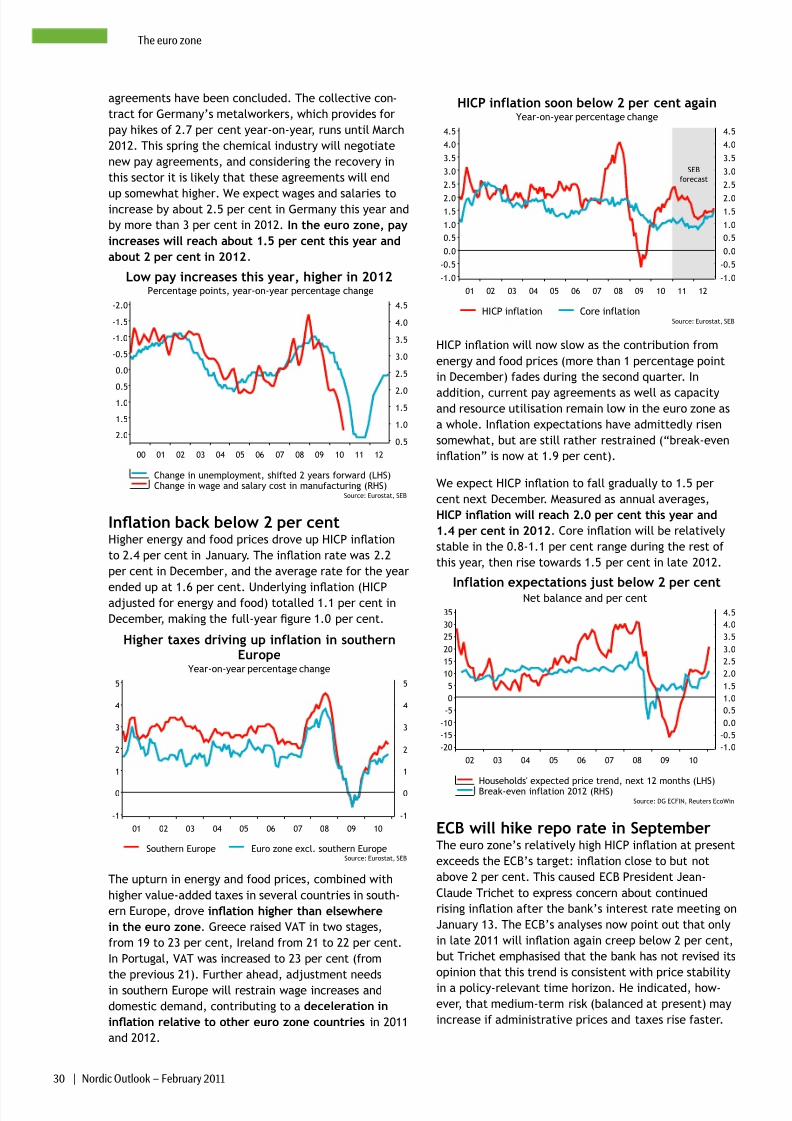
8/7/2019 SEB report: Giddy euphoria about the Swedish economy
http://slidepdf.com/reader/full/seb-report-giddy-euphoria-about-the-swedish-economy 29/55
30 | Nordic Outlook – February 2011
The euro zone
agreements have been concluded. The collective con-
tract for Germany’s metalworkers, which provides for
pay hikes of 2.7 per cent year-on-year, runs until March
2012. This spring the chemical industry will negotiate
new pay agreements, and considering the recovery in
this sector it is likely that these agreements will end
up somewhat higher. We expect wages and salaries toincrease by about 2.5 per cent in Germany this year and
by more than 3 per cent in 2012. In the euro zone, pay
increases will reach about 1.5 per cent this year and
about 2 per cent in 2012.
Percentage points, year-on-year percentage change
Low pay increases this year, higher in 2012
Change in unemployment, shifted 2 years forward (LHS)Change in wage and salary cost in manufacturing (RHS)
Source: Eurostat, SEB
00 01 02 03 04 05 06 07 08 09 10 11 12
0.5
1.0
1.5
2.0
2.5
3.0
3.5
4.0
4.5-2.0
-1.5
-1.0
-0.5
0.0
0.5
1.0
1.5
2.0
Ination back below 2 per centHigher energy and food prices drove up HICP ination
to 2.4 per cent in January. The ination rate was 2.2
per cent in December, and the average rate for the year
ended up at 1.6 per cent. Underlying ination (HICPadjusted for energy and food) totalled 1.1 per cent in
December, making the full-year gure 1.0 per cent.
Year-on-year percentage change
Higher taxes driving up inflation in southernEurope
Southern Europe Euro zone excl. southern EuropeSource: Eurostat, SEB
01 02 03 04 05 06 07 08 09 10
-1
0
1
2
3
4
5
-1
0
1
2
3
4
5
The upturn in energy and food prices, combined with
higher value-added taxes in several countries in south-
ern Europe, drove ination higher than elsewhere
in the euro zone. Greece raised VAT in two stages,
from 19 to 23 per cent, Ireland from 21 to 22 per cent.
In Portugal, VAT was increased to 23 per cent (from
the previous 21). Further ahead, adjustment needs
in southern Europe will restrain wage increases and
domestic demand, contributing to a deceleration in
ination relative to other euro zone countries in 2011
and 2012.
Year-on-year percentage change
HICP inflation soon below 2 per cent again
HICP inflation Core inflationSource: Eurostat, SEB
01 02 03 04 05 06 07 08 09 10 11 12
-1.0
-0.5
0.0
0.5
1.0
1.5
2.0
2.5
3.0
3.5
4.0
4.5
-1.0
-0.5
0.0
0.5
1.0
1.5
2.0
2.5
3.0
3.5
4.0
4.5
forecastSEB
HICP ination will now slow as the contribution from
energy and food prices (more than 1 percentage point
in December) fades during the second quarter. In
addition, current pay agreements as well as capacityand resource utilisation remain low in the euro zone as
a whole. Ination expectations have admittedly risen
somewhat, but are still rather restrained (“break-even
ination” is now at 1.9 per cent).
We expect HICP ination to fall gradually to 1.5 per
cent next December. Measured as annual averages,
HICP ination will reach 2.0 per cent this year and
1.4 per cent in 2012. Core ination will be relatively
stable in the 0.8-1.1 per cent range during the rest of
this year, then rise towards 1.5 per cent in late 2012.
Net balance and per centInflation expectations just below 2 per cent
Households' expected price trend, next 12 months (LHS)Break-even inflation 2012 (RHS)Source: DG ECFIN, Reuters EcoWin
02 03 04 05 06 07 08 09 10
-1.0
-0.5
0.0
0.5
1.0
1.5
2.0
2.5
3.0
3.5
4.0
4.5
-20
-15
-10
-5
0
5
10
15
20
25
30
35
ECB will hike repo rate in SeptemberThe euro zone’s relatively high HICP ination at present
exceeds the ECB’s target: ination close to but not
above 2 per cent. This caused ECB President Jean-
Claude Trichet to express concern about continued
rising ination after the bank’s interest rate meeting on
January 13. The ECB’s analyses now point out that only
in late 2011 will ination again creep below 2 per cent,
but Trichet emphasised that the bank has not revised its
opinion that this trend is consistent with price stability
in a policy-relevant time horizon. He indicated, how-ever, that medium-term risk (balanced at present) may
increase if administrative prices and taxes rise faster.
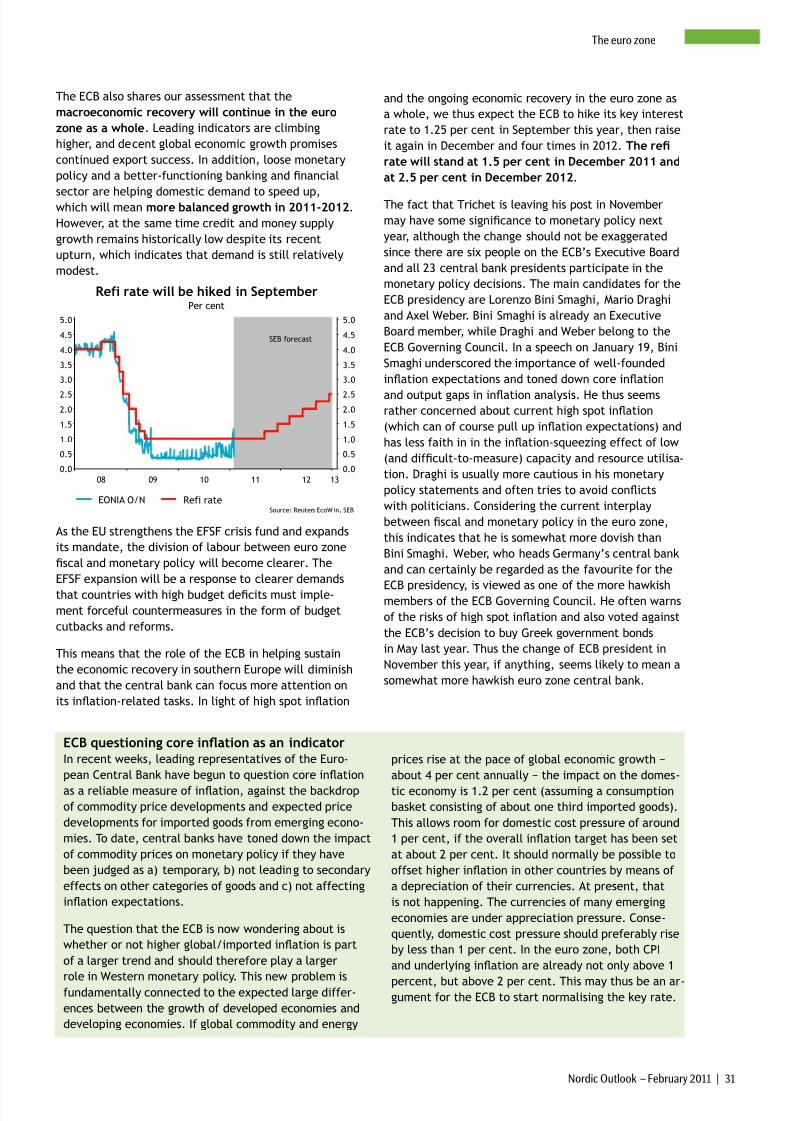
8/7/2019 SEB report: Giddy euphoria about the Swedish economy
http://slidepdf.com/reader/full/seb-report-giddy-euphoria-about-the-swedish-economy 30/55
Nordic Outlook – February 2011 | 31
The euro zone
The ECB also shares our assessment that the
macroeconomic recovery will continue in the euro
zone as a whole. Leading indicators are climbing
higher, and decent global economic growth promises
continued export success. In addition, loose monetary
policy and a better-functioning banking and nancial
sector are helping domestic demand to speed up,which will mean more balanced growth in 2011-2012.
However, at the same time credit and money supply
growth remains historically low despite its recent
upturn, which indicates that demand is still relatively
modest.
Per cent
Refi rate will be hiked in September
EONIA O/N Refi rateSource: Reuters EcoW in, SEB
08 09 10 11 12 130.0
0.5
1.0
1.5
2.0
2.5
3.0
3.5
4.0
4.5
5.0
0.0
0.5
1.0
1.5
2.0
2.5
3.0
3.5
4.0
4.5
5.0
SEB forecast
As the EU strengthens the EFSF crisis fund and expands
its mandate, the division of labour between euro zone
scal and monetary policy will become clearer. The
EFSF expansion will be a response to clearer demands
that countries with high budget decits must imple-ment forceful countermeasures in the form of budget
cutbacks and reforms.
This means that the role of the ECB in helping sustain
the economic recovery in southern Europe will diminish
and that the central bank can focus more attention on
its ination-related tasks. In light of high spot ination
and the ongoing economic recovery in the euro zone as
a whole, we thus expect the ECB to hike its key interest
rate to 1.25 per cent in September this year, then raise
it again in December and four times in 2012. The re
rate will stand at 1.5 per cent in December 2011 and
at 2.5 per cent in December 2012.
The fact that Trichet is leaving his post in November
may have some signicance to monetary policy next
year, although the change should not be exaggerated
since there are six people on the ECB’s Executive Board
and all 23 central bank presidents participate in the
monetary policy decisions. The main candidates for the
ECB presidency are Lorenzo Bini Smaghi, Mario Draghi
and Axel Weber. Bini Smaghi is already an Executive
Board member, while Draghi and Weber belong to the
ECB Governing Council. In a speech on January 19, Bini
Smaghi underscored the importance of well-founded
ination expectations and toned down core ination
and output gaps in ination analysis. He thus seemsrather concerned about current high spot ination
(which can of course pull up ination expectations) and
has less faith in in the ination-squeezing effect of low
(and difcult-to-measure) capacity and resource utilisa-
tion. Draghi is usually more cautious in his monetary
policy statements and often tries to avoid conicts
with politicians. Considering the current interplay
between scal and monetary policy in the euro zone,
this indicates that he is somewhat more dovish than
Bini Smaghi. Weber, who heads Germany’s central bank
and can certainly be regarded as the favourite for the
ECB presidency, is viewed as one of the more hawkishmembers of the ECB Governing Council. He often warns
of the risks of high spot ination and also voted against
the ECB’s decision to buy Greek government bonds
in May last year. Thus the change of ECB president in
November this year, if anything, seems likely to mean a
somewhat more hawkish euro zone central bank.
ECB questioning core ination as an indicatorIn recent weeks, leading representatives of the Euro-
pean Central Bank have begun to question core ination
as a reliable measure of ination, against the backdrop
of commodity price developments and expected price
developments for imported goods from emerging econo-
mies. To date, central banks have toned down the impact
of commodity prices on monetary policy if they have
been judged as a) temporary, b) not leading to secondary
effects on other categories of goods and c) not affecting
ination expectations.
The question that the ECB is now wondering about is
whether or not higher global/imported ination is part
of a larger trend and should therefore play a larger
role in Western monetary policy. This new problem isfundamentally connected to the expected large differ-
ences between the growth of developed economies and
developing economies. If global commodity and energy
prices rise at the pace of global economic growth −
about 4 per cent annually − the impact on the domes-
tic economy is 1.2 per cent (assuming a consumption
basket consisting of about one third imported goods).
This allows room for domestic cost pressure of around
1 per cent, if the overall ination target has been set
at about 2 per cent. It should normally be possible to
offset higher ination in other countries by means of
a depreciation of their currencies. At present, that
is not happening. The currencies of many emerging
economies are under appreciation pressure. Conse-
quently, domestic cost pressure should preferably rise
by less than 1 per cent. In the euro zone, both CPI
and underlying ination are already not only above 1
percent, but above 2 per cent. This may thus be an ar-gument for the ECB to start normalising the key rate.
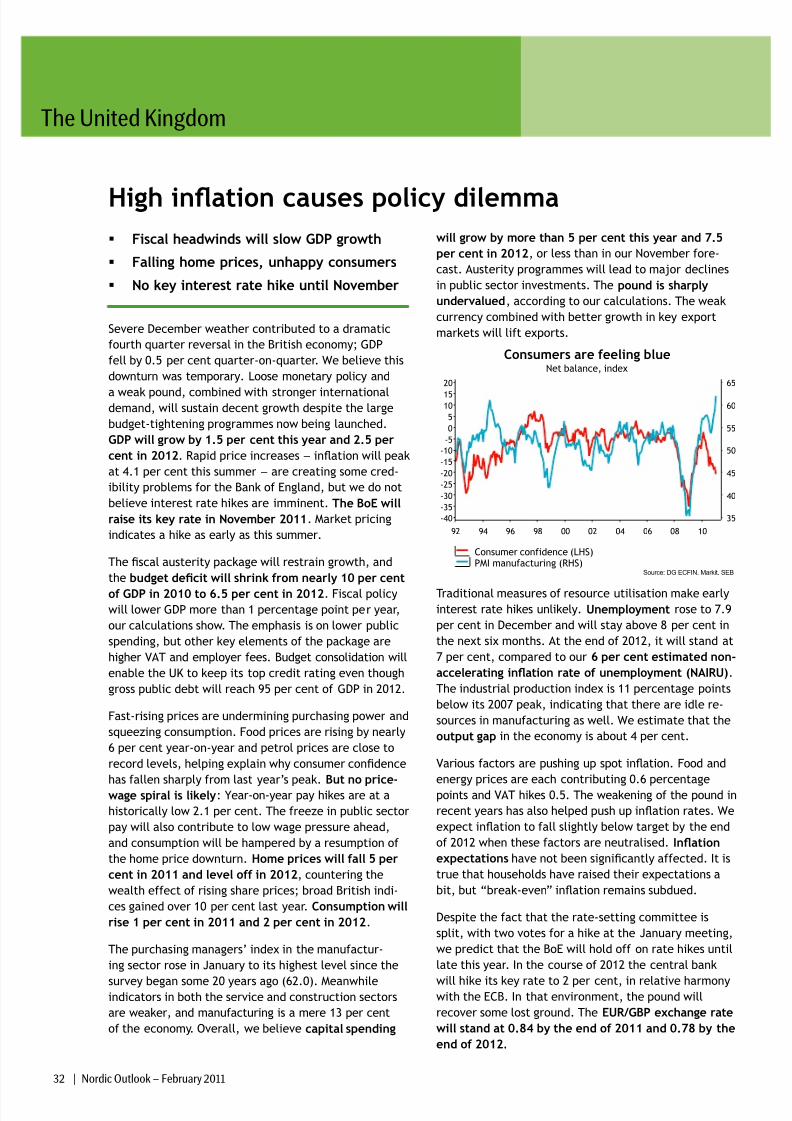
8/7/2019 SEB report: Giddy euphoria about the Swedish economy
http://slidepdf.com/reader/full/seb-report-giddy-euphoria-about-the-swedish-economy 31/55
The United Kingdom
32 | Nordic Outlook – February 2011
High ination causes policy dilemma Fiscal headwinds will slow GDP growth
Falling home prices, unhappy consumers
No key interest rate hike until November
Severe December weather contributed to a dramatic
fourth quarter reversal in the British economy; GDP
fell by 0.5 per cent quarter-on-quarter. We believe this
downturn was temporary. Loose monetary policy and
a weak pound, combined with stronger internationaldemand, will sustain decent growth despite the large
budget-tightening programmes now being launched.
GDP will grow by 1.5 per cent this year and 2.5 per
cent in 2012. Rapid price increases − ination will peak
at 4.1 per cent this summer − are creating some cred-
ibility problems for the Bank of England, but we do not
believe interest rate hikes are imminent. The BoE will
raise its key rate in November 2011. Market pricing
indicates a hike as early as this summer.
The scal austerity package will restrain growth, and
the budget decit will shrink from nearly 10 per cent
of GDP in 2010 to 6.5 per cent in 2012. Fiscal policy
will lower GDP more than 1 percentage point per year,
our calculations show. The emphasis is on lower public
spending, but other key elements of the package are
higher VAT and employer fees. Budget consolidation will
enable the UK to keep its top credit rating even though
gross public debt will reach 95 per cent of GDP in 2012.
Fast-rising prices are undermining purchasing power and
squeezing consumption. Food prices are rising by nearly
6 per cent year-on-year and petrol prices are close to
record levels, helping explain why consumer condence
has fallen sharply from last year’s peak. But no price-wage spiral is likely: Year-on-year pay hikes are at a
historically low 2.1 per cent. The freeze in public sector
pay will also contribute to low wage pressure ahead,
and consumption will be hampered by a resumption of
the home price downturn. Home prices will fall 5 per
cent in 2011 and level off in 2012, countering the
wealth effect of rising share prices; broad British indi-
ces gained over 10 per cent last year. Consumption will
rise 1 per cent in 2011 and 2 per cent in 2012. The purchasing managers’ index in the manufactur-
ing sector rose in January to its highest level since the
survey began some 20 years ago (62.0). Meanwhileindicators in both the service and construction sectors
are weaker, and manufacturing is a mere 13 per cent
of the economy. Overall, we believe capital spending
will grow by more than 5 per cent this year and 7.5
per cent in 2012, or less than in our November fore-
cast. Austerity programmes will lead to major declines
in public sector investments. The pound is sharply
undervalued, according to our calculations. The weak
currency combined with better growth in key export
markets will lift exports.
Net balance, index
Consumers are feeling blue
Consumer confidence (LHS)PMI manufacturing (RHS)
Source: DG ECFIN, Markit, SEB
92 94 96 98 00 02 04 06 08 10
35
40
45
50
55
60
65
-40
-35
-30
-25
-20
-15
-10
-5
0
5
1015
20
Traditional measures of resource utilisation make early
interest rate hikes unlikely. Unemployment rose to 7.9
per cent in December and will stay above 8 per cent in
the next six months. At the end of 2012, it will stand at
7 per cent, compared to our 6 per cent estimated non-
accelerating ination rate of unemployment (NAIRU).
The industrial production index is 11 percentage points
below its 2007 peak, indicating that there are idle re-
sources in manufacturing as well. We estimate that the
output gap in the economy is about 4 per cent.
Various factors are pushing up spot ination. Food and
energy prices are each contributing 0.6 percentage
points and VAT hikes 0.5. The weakening of the pound in
recent years has also helped push up ination rates. We
expect ination to fall slightly below target by the end
of 2012 when these factors are neutralised. Ination
expectations have not been signicantly affected. It is
true that households have raised their expectations a
bit, but “break-even” ination remains subdued.
Despite the fact that the rate-setting committee is
split, with two votes for a hike at the January meeting,
we predict that the BoE will hold off on rate hikes until
late this year. In the course of 2012 the central bank
will hike its key rate to 2 per cent, in relative harmonywith the ECB. In that environment, the pound will
recover some lost ground. The EUR/GBP exchange rate
will stand at 0.84 by the end of 2011 and 0.78 by the
end of 2012.
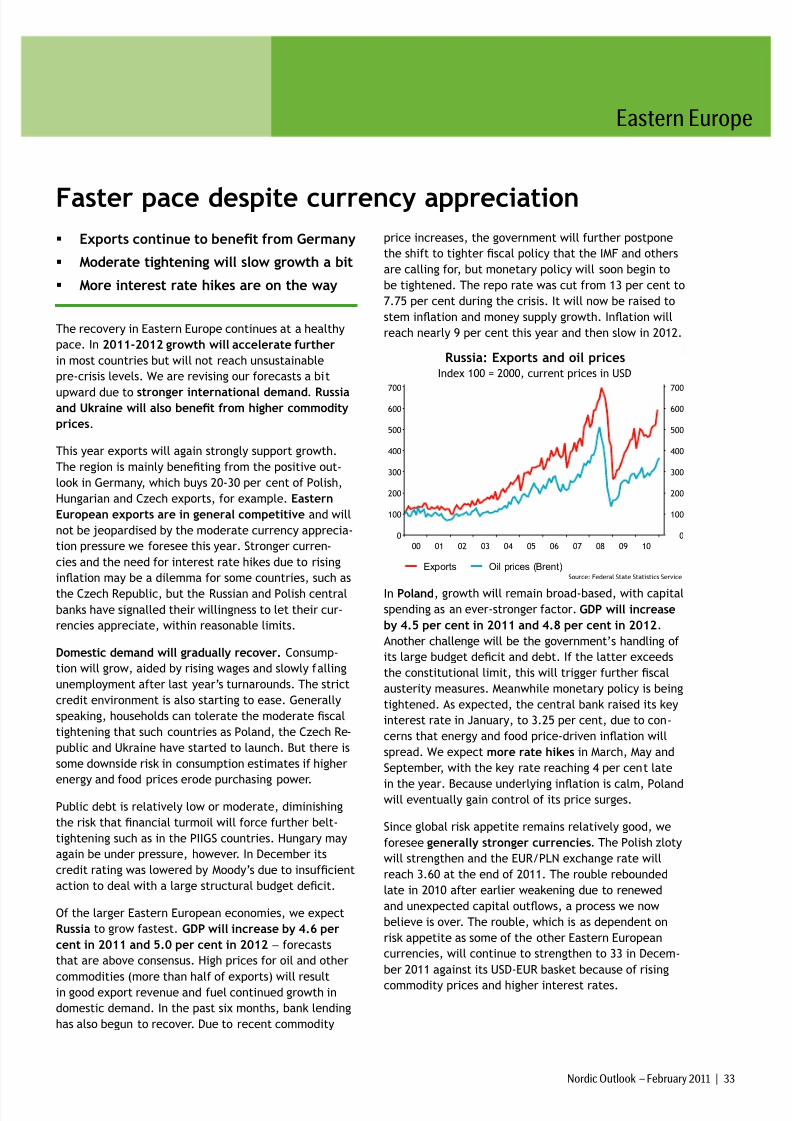
8/7/2019 SEB report: Giddy euphoria about the Swedish economy
http://slidepdf.com/reader/full/seb-report-giddy-euphoria-about-the-swedish-economy 32/55
Eastern Europe
Nordic Outlook – February 2011 | 33
Faster pace despite currency appreciation Exports continue to benet from Germany
Moderate tightening will slow growth a bit
More interest rate hikes are on the way
The recovery in Eastern Europe continues at a healthy
pace. In 2011-2012 growth will accelerate further
in most countries but will not reach unsustainable
pre-crisis levels. We are revising our forecasts a bit
upward due to stronger international demand. Russiaand Ukraine will also benet from higher commodity
prices.
This year exports will again strongly support growth.
The region is mainly beneting from the positive out-
look in Germany, which buys 20-30 per cent of Polish,
Hungarian and Czech exports, for example. Eastern
European exports are in general competitive and will
not be jeopardised by the moderate currency apprecia-
tion pressure we foresee this year. Stronger curren-
cies and the need for interest rate hikes due to rising
ination may be a dilemma for some countries, such as
the Czech Republic, but the Russian and Polish central
banks have signalled their willingness to let their cur-
rencies appreciate, within reasonable limits.
Domestic demand will gradually recover. Consump-
tion will grow, aided by rising wages and slowly falling
unemployment after last year’s turnarounds. The strict
credit environment is also starting to ease. Generally
speaking, households can tolerate the moderate scal
tightening that such countries as Poland, the Czech Re-
public and Ukraine have started to launch. But there is
some downside risk in consumption estimates if higher
energy and food prices erode purchasing power.
Public debt is relatively low or moderate, diminishing
the risk that nancial turmoil will force further belt-
tightening such as in the PIIGS countries. Hungary may
again be under pressure, however. In December its
credit rating was lowered by Moody’s due to insufcient
action to deal with a large structural budget decit.
Of the larger Eastern European economies, we expect
Russia to grow fastest. GDP will increase by 4.6 per
cent in 2011 and 5.0 per cent in 2012 − forecasts
that are above consensus. High prices for oil and other
commodities (more than half of exports) will resultin good export revenue and fuel continued growth in
domestic demand. In the past six months, bank lending
has also begun to recover. Due to recent commodity
price increases, the government will further postpone
the shift to tighter scal policy that the IMF and others
are calling for, but monetary policy will soon begin to
be tightened. The repo rate was cut from 13 per cent to
7.75 per cent during the crisis. It will now be raised to
stem ination and money supply growth. Ination will
reach nearly 9 per cent this year and then slow in 2012.
Index 100 = 2000, current prices in USD
Russia: Exports and oil prices
Exports Oil prices (Brent)Source: Federal State Statistics Service
00 01 02 03 04 05 06 07 08 09 100
100
200
300
400
500
600
700
0
100
200
300
400
500
600
700
In Poland, growth will remain broad-based, with capital
spending as an ever-stronger factor. GDP will increase
by 4.5 per cent in 2011 and 4.8 per cent in 2012.
Another challenge will be the government’s handling of
its large budget decit and debt. If the latter exceeds
the constitutional limit, this will trigger further scal
austerity measures. Meanwhile monetary policy is being
tightened. As expected, the central bank raised its key
interest rate in January, to 3.25 per cent, due to con-
cerns that energy and food price-driven ination will
spread. We expect more rate hikes in March, May and
September, with the key rate reaching 4 per cent late
in the year. Because underlying ination is calm, Polandwill eventually gain control of its price surges.
Since global risk appetite remains relatively good, we
foresee generally stronger currencies. The Polish zloty
will strengthen and the EUR/PLN exchange rate will
reach 3.60 at the end of 2011. The rouble rebounded
late in 2010 after earlier weakening due to renewed
and unexpected capital outows, a process we now
believe is over. The rouble, which is as dependent on
risk appetite as some of the other Eastern European
currencies, will continue to strengthen to 33 in Decem-
ber 2011 against its USD-EUR basket because of rising
commodity prices and higher interest rates.
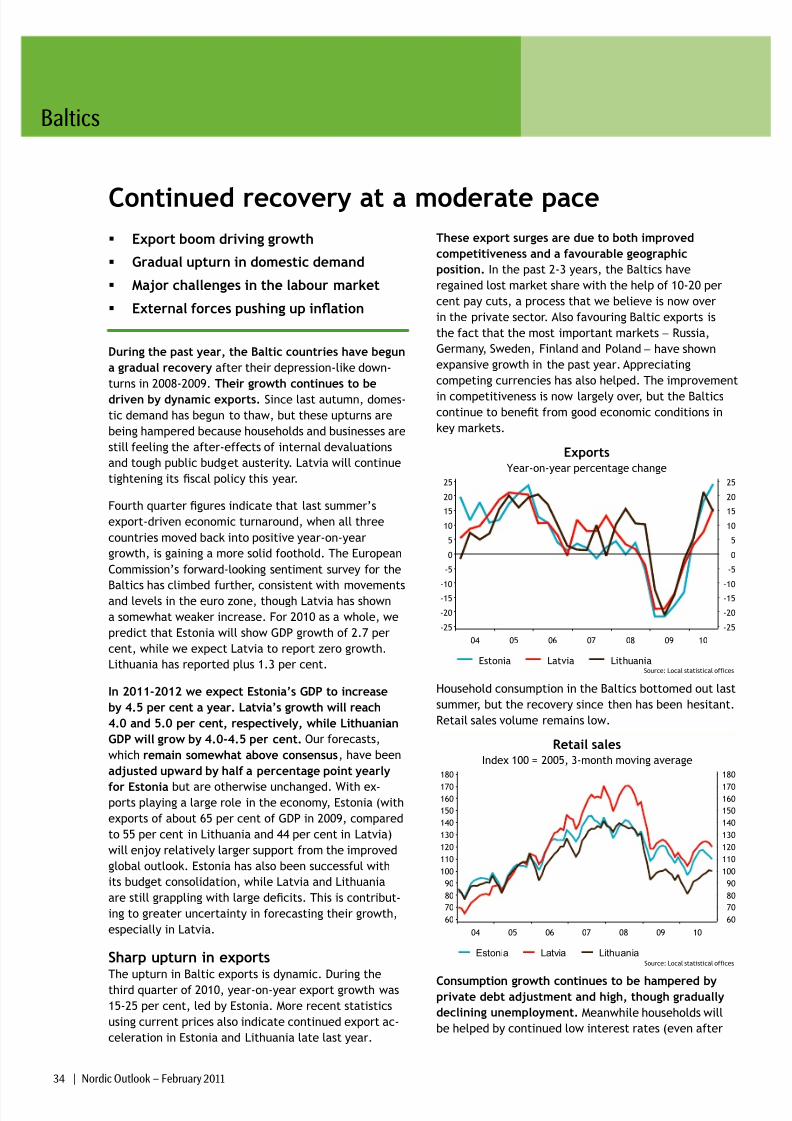
8/7/2019 SEB report: Giddy euphoria about the Swedish economy
http://slidepdf.com/reader/full/seb-report-giddy-euphoria-about-the-swedish-economy 33/55
Baltics
34 | Nordic Outlook – February 2011
Continued recovery at a moderate pace Export boom driving growth
Gradual upturn in domestic demand
Major challenges in the labour market
External forces pushing up ination
During the past year, the Baltic countries have begun
a gradual recovery after their depression-like down-
turns in 2008-2009. Their growth continues to be
driven by dynamic exports. Since last autumn, domes-
tic demand has begun to thaw, but these upturns are
being hampered because households and businesses are
still feeling the after-effects of internal devaluations
and tough public budget austerity. Latvia will continue
tightening its scal policy this year.
Fourth quarter gures indicate that last summer’s
export-driven economic turnaround, when all three
countries moved back into positive year-on-year
growth, is gaining a more solid foothold. The European
Commission’s forward-looking sentiment survey for the
Baltics has climbed further, consistent with movementsand levels in the euro zone, though Latvia has shown
a somewhat weaker increase. For 2010 as a whole, we
predict that Estonia will show GDP growth of 2.7 per
cent, while we expect Latvia to report zero growth.
Lithuania has reported plus 1.3 per cent.
In 2011-2012 we expect Estonia’s GDP to increase
by 4.5 per cent a year. Latvia’s growth will reach
4.0 and 5.0 per cent, respectively, while Lithuanian
GDP will grow by 4.0-4.5 per cent. Our forecasts,
which remain somewhat above consensus, have been
adjusted upward by half a percentage point yearly
for Estonia but are otherwise unchanged. With ex-ports playing a large role in the economy, Estonia (with
exports of about 65 per cent of GDP in 2009, compared
to 55 per cent in Lithuania and 44 per cent in Latvia)
will enjoy relatively larger support from the improved
global outlook. Estonia has also been successful with
its budget consolidation, while Latvia and Lithuania
are still grappling with large decits. This is contribut-
ing to greater uncertainty in forecasting their growth,
especially in Latvia.
Sharp upturn in exportsThe upturn in Baltic exports is dynamic. During the
third quarter of 2010, year-on-year export growth was
15-25 per cent, led by Estonia. More recent statistics
using current prices also indicate continued export ac-
celeration in Estonia and Lithuania late last year.
These export surges are due to both improved
competitiveness and a favourable geographic
position. In the past 2-3 years, the Baltics have
regained lost market share with the help of 10-20 per
cent pay cuts, a process that we believe is now over
in the private sector. Also favouring Baltic exports is
the fact that the most important markets − Russia,
Germany, Sweden, Finland and Poland − have shown
expansive growth in the past year. Appreciating
competing currencies has also helped. The improvement
in competitiveness is now largely over, but the Baltics
continue to benet from good economic conditions in
key markets.
Year-on-year percentage change
Exports
Estonia Latvia LithuaniaSource: Local statistical offices
04 05 06 07 08 09 10
-25
-20
-15
-10
-5
0
5
10
15
20
25
-25
-20
-15
-10
-5
0
5
10
15
20
25
Household consumption in the Baltics bottomed out last
summer, but the recovery since then has been hesitant.
Retail sales volume remains low.
Index 100 = 2005, 3-month moving average
Retail sales
Estonia Latvia LithuaniaSource: Local statistical offices
04 05 06 07 08 09 10
60
70
80
90
100
110
120
130
140
150
160170
180
60
70
80
90
100
110
120
130
140
150
160170
180
Consumption growth continues to be hampered byprivate debt adjustment and high, though gradually
declining unemployment. Meanwhile households will
be helped by continued low interest rates (even after
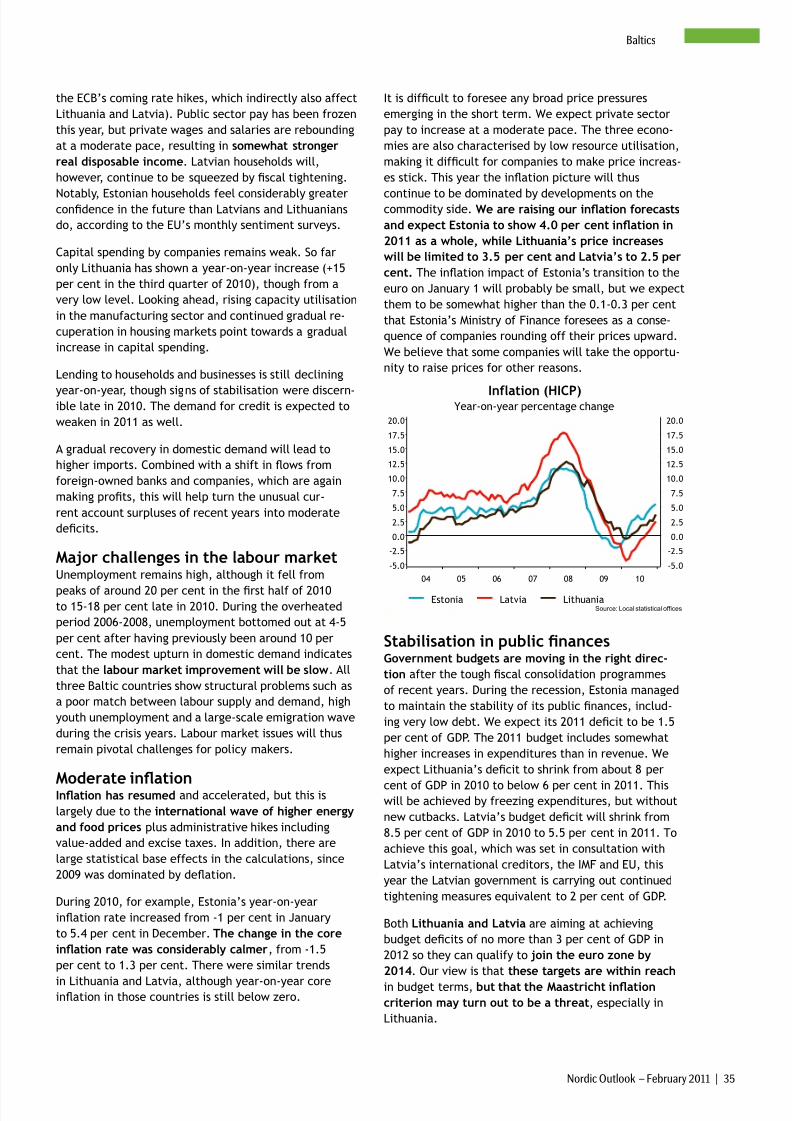
8/7/2019 SEB report: Giddy euphoria about the Swedish economy
http://slidepdf.com/reader/full/seb-report-giddy-euphoria-about-the-swedish-economy 34/55
Nordic Outlook – February 2011 | 35
Baltics
the ECB’s coming rate hikes, which indirectly also affect
Lithuania and Latvia). Public sector pay has been frozen
this year, but private wages and salaries are rebounding
at a moderate pace, resulting in somewhat stronger
real disposable income. Latvian households will,
however, continue to be squeezed by scal tightening.
Notably, Estonian households feel considerably greatercondence in the future than Latvians and Lithuanians
do, according to the EU’s monthly sentiment surveys.
Capital spending by companies remains weak. So far
only Lithuania has shown a year-on-year increase (+15
per cent in the third quarter of 2010), though from a
very low level. Looking ahead, rising capacity utilisation
in the manufacturing sector and continued gradual re-
cuperation in housing markets point towards a gradual
increase in capital spending.
Lending to households and businesses is still declining
year-on-year, though signs of stabilisation were discern-ible late in 2010. The demand for credit is expected to
weaken in 2011 as well.
A gradual recovery in domestic demand will lead to
higher imports. Combined with a shift in ows from
foreign-owned banks and companies, which are again
making prots, this will help turn the unusual cur-
rent account surpluses of recent years into moderate
decits.
Major challenges in the labour marketUnemployment remains high, although it fell from
peaks of around 20 per cent in the rst half of 2010to 15-18 per cent late in 2010. During the overheated
period 2006-2008, unemployment bottomed out at 4-5
per cent after having previously been around 10 per
cent. The modest upturn in domestic demand indicates
that the labour market improvement will be slow. All
three Baltic countries show structural problems such as
a poor match between labour supply and demand, high
youth unemployment and a large-scale emigration wave
during the crisis years. Labour market issues will thus
remain pivotal challenges for policy makers.
Moderate inationInation has resumed and accelerated, but this is
largely due to the international wave of higher energy
and food prices plus administrative hikes including
value-added and excise taxes. In addition, there are
large statistical base effects in the calculations, since
2009 was dominated by deation.
During 2010, for example, Estonia’s year-on-year
ination rate increased from -1 per cent in January
to 5.4 per cent in December. The change in the core
ination rate was considerably calmer, from -1.5
per cent to 1.3 per cent. There were similar trends
in Lithuania and Latvia, although year-on-year coreination in those countries is still below zero.
It is difcult to foresee any broad price pressures
emerging in the short term. We expect private sector
pay to increase at a moderate pace. The three econo-
mies are also characterised by low resource utilisation,
making it difcult for companies to make price increas-
es stick. This year the ination picture will thus
continue to be dominated by developments on thecommodity side. We are raising our ination forecasts
and expect Estonia to show 4.0 per cent ination in
2011 as a whole, while Lithuania’s price increases
will be limited to 3.5 per cent and Latvia’s to 2.5 per
cent. The ination impact of Estonia’s transition to the
euro on January 1 will probably be small, but we expect
them to be somewhat higher than the 0.1-0.3 per cent
that Estonia’s Ministry of Finance foresees as a conse-
quence of companies rounding off their prices upward.
We believe that some companies will take the opportu-
nity to raise prices for other reasons.
Year-on-year percentage changeInflation (HICP)
Estonia Latvia LithuaniaSource: Local statistical offices
04 05 06 07 08 09 10
-5.0
-2.5
0.0
2.5
5.0
7.5
10.0
12.5
15.0
17.5
20.0
-5.0
-2.5
0.0
2.5
5.0
7.5
10.0
12.5
15.0
17.5
20.0
Stabilisation in public nancesGovernment budgets are moving in the right direc-
tion after the tough scal consolidation programmes
of recent years. During the recession, Estonia managed
to maintain the stability of its public nances, includ-
ing very low debt. We expect its 2011 decit to be 1.5
per cent of GDP. The 2011 budget includes somewhat
higher increases in expenditures than in revenue. We
expect Lithuania’s decit to shrink from about 8 per
cent of GDP in 2010 to below 6 per cent in 2011. Thiswill be achieved by freezing expenditures, but without
new cutbacks. Latvia’s budget decit will shrink from
8.5 per cent of GDP in 2010 to 5.5 per cent in 2011. To
achieve this goal, which was set in consultation with
Latvia’s international creditors, the IMF and EU, this
year the Latvian government is carrying out continued
tightening measures equivalent to 2 per cent of GDP.
Both Lithuania and Latvia are aiming at achieving
budget decits of no more than 3 per cent of GDP in
2012 so they can qualify to join the euro zone by
2014. Our view is that these targets are within reach
in budget terms, but that the Maastricht ination
criterion may turn out to be a threat, especially in
Lithuania.
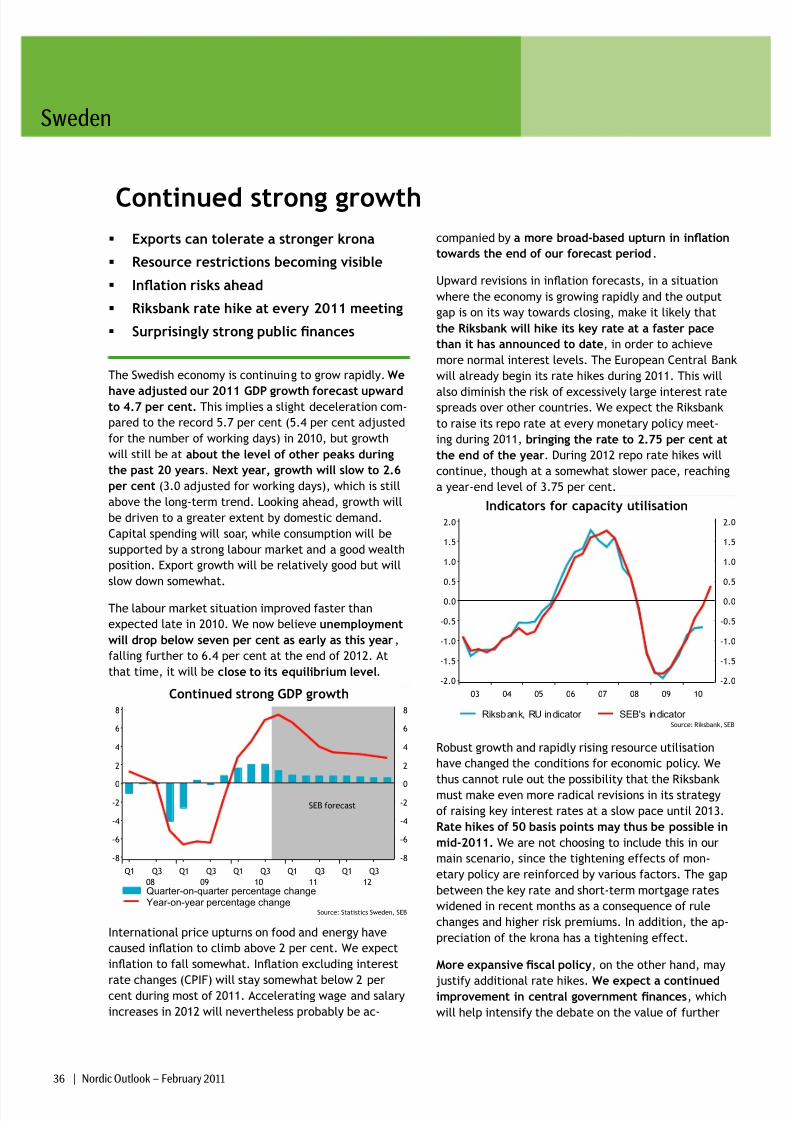
8/7/2019 SEB report: Giddy euphoria about the Swedish economy
http://slidepdf.com/reader/full/seb-report-giddy-euphoria-about-the-swedish-economy 35/55
Sweden
36 | Nordic Outlook – February 2011
Continued strong growth Exports can tolerate a stronger krona
Resource restrictions becoming visible
Ination risks ahead
Riksbank rate hike at every 2011 meeting
Surprisingly strong public nances
The Swedish economy is continuing to grow rapidly. We
have adjusted our 2011 GDP growth forecast upwardto 4.7 per cent. This implies a slight deceleration com-
pared to the record 5.7 per cent (5.4 per cent adjusted
for the number of working days) in 2010, but growth
will still be at about the level of other peaks during
the past 20 years. Next year, growth will slow to 2.6
per cent (3.0 adjusted for working days), which is still
above the long-term trend. Looking ahead, growth will
be driven to a greater extent by domestic demand.
Capital spending will soar, while consumption will be
supported by a strong labour market and a good wealth
position. Export growth will be relatively good but will
slow down somewhat.
The labour market situation improved faster than
expected late in 2010. We now believe unemployment
will drop below seven per cent as early as this year,
falling further to 6.4 per cent at the end of 2012. At
that time, it will be close to its equilibrium level.
Continued strong GDP growth
Quarter-on-quarter percentage changeYear-on-year percentage change
Source: Statistics Sweden, SEB
Q1 Q3 Q1 Q3 Q1 Q3 Q1 Q3 Q1 Q308 09 10 11 12
-8
-6
-4
-2
0
2
4
6
8
-8
-6
-4
-2
0
2
4
6
8
SEB forecast
International price upturns on food and energy have
caused ination to climb above 2 per cent. We expect
ination to fall somewhat. Ination excluding interest
rate changes (CPIF) will stay somewhat below 2 percent during most of 2011. Accelerating wage and salary
increases in 2012 will nevertheless probably be ac-
companied by a more broad-based upturn in ination
towards the end of our forecast period.
Upward revisions in ination forecasts, in a situation
where the economy is growing rapidly and the output
gap is on its way towards closing, make it likely that
the Riksbank will hike its key rate at a faster pace
than it has announced to date, in order to achieve
more normal interest levels. The European Central Bank
will already begin its rate hikes during 2011. This will
also diminish the risk of excessively large interest ratespreads over other countries. We expect the Riksbank
to raise its repo rate at every monetary policy meet-
ing during 2011, bringing the rate to 2.75 per cent at
the end of the year. During 2012 repo rate hikes will
continue, though at a somewhat slower pace, reaching
a year-end level of 3.75 per cent.
Indicators for capacity utilisation
Riksbank, RU indicator SEB's indicator Source: Riksbank, SEB
03 04 05 06 07 08 09 10
-2.0
-1.5
-1.0
-0.5
0.0
0.5
1.0
1.5
2.0
-2.0
-1.5
-1.0
-0.5
0.0
0.5
1.0
1.5
2.0
Robust growth and rapidly rising resource utilisation
have changed the conditions for economic policy. We
thus cannot rule out the possibility that the Riksbank
must make even more radical revisions in its strategy
of raising key interest rates at a slow pace until 2013.
Rate hikes of 50 basis points may thus be possible in
mid-2011. We are not choosing to include this in our
main scenario, since the tightening effects of mon-
etary policy are reinforced by various factors. The gap
between the key rate and short-term mortgage rates
widened in recent months as a consequence of rule
changes and higher risk premiums. In addition, the ap-
preciation of the krona has a tightening effect.
More expansive scal policy, on the other hand, may
justify additional rate hikes. We expect a continuedimprovement in central government nances, which
will help intensify the debate on the value of further
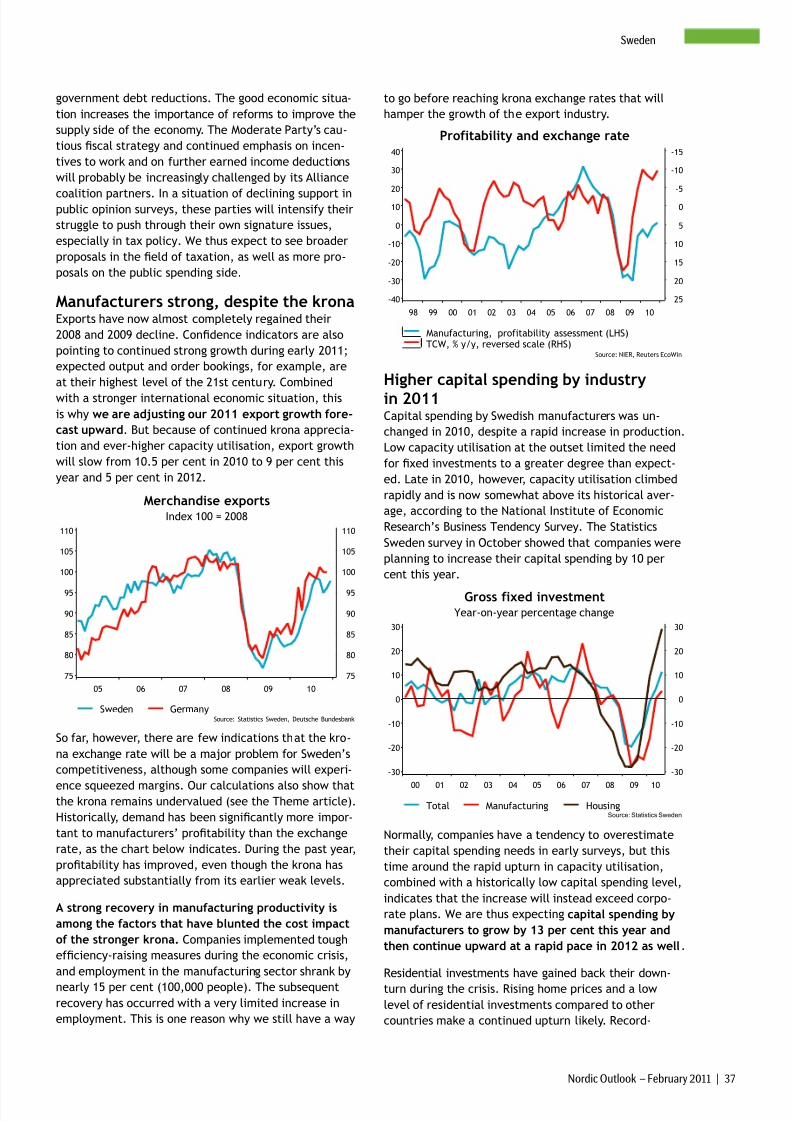
8/7/2019 SEB report: Giddy euphoria about the Swedish economy
http://slidepdf.com/reader/full/seb-report-giddy-euphoria-about-the-swedish-economy 36/55
Nordic Outlook – February 2011 | 37
Sweden
government debt reductions. The good economic situa-
tion increases the importance of reforms to improve the
supply side of the economy. The Moderate Party’s cau-
tious scal strategy and continued emphasis on incen-
tives to work and on further earned income deductions
will probably be increasingly challenged by its Alliance
coalition partners. In a situation of declining support inpublic opinion surveys, these parties will intensify their
struggle to push through their own signature issues,
especially in tax policy. We thus expect to see broader
proposals in the eld of taxation, as well as more pro-
posals on the public spending side.
Manufacturers strong, despite the kronaExports have now almost completely regained their
2008 and 2009 decline. Condence indicators are also
pointing to continued strong growth during early 2011;
expected output and order bookings, for example, are
at their highest level of the 21st century. Combined
with a stronger international economic situation, this
is why we are adjusting our 2011 export growth fore-
cast upward. But because of continued krona apprecia-
tion and ever-higher capacity utilisation, export growth
will slow from 10.5 per cent in 2010 to 9 per cent this
year and 5 per cent in 2012.
Index 100 = 2008
Merchandise exports
Sweden GermanySource: Statistics Sweden, Deutsche Bundesbank
05 06 07 08 09 10
75
80
85
90
95
100
105
110
75
80
85
90
95
100
105
110
So far, however, there are few indications that the kro-
na exchange rate will be a major problem for Sweden’s
competitiveness, although some companies will experi-
ence squeezed margins. Our calculations also show thatthe krona remains undervalued (see the Theme article).
Historically, demand has been signicantly more impor-
tant to manufacturers’ protability than the exchange
rate, as the chart below indicates. During the past year,
protability has improved, even though the krona has
appreciated substantially from its earlier weak levels.
A strong recovery in manufacturing productivity is
among the factors that have blunted the cost impact
of the stronger krona. Companies implemented tough
efciency-raising measures during the economic crisis,
and employment in the manufacturing sector shrank by
nearly 15 per cent (100,000 people). The subsequent
recovery has occurred with a very limited increase in
employment. This is one reason why we still have a way
to go before reaching krona exchange rates that will
hamper the growth of the export industry.
Profitability and exchange rate
Manufacturing, profitability assessment (LHS)TCW, % y/y, reversed scale (RHS)
Source: NIER, Reuters EcoWin
98 99 00 01 02 03 04 05 06 07 08 09 10
-15
-10
-5
0
5
10
15
20
25-40
-30
-20
-10
0
10
20
30
40
Higher capital spending by industry
in 2011Capital spending by Swedish manufacturers was un-
changed in 2010, despite a rapid increase in production.
Low capacity utilisation at the outset limited the need
for xed investments to a greater degree than expect-
ed. Late in 2010, however, capacity utilisation climbed
rapidly and is now somewhat above its historical aver-
age, according to the National Institute of Economic
Research’s Business Tendency Survey. The Statistics
Sweden survey in October showed that companies were
planning to increase their capital spending by 10 per
cent this year.
Year-on-year percentage change
Gross fixed investment
Total Manufacturing HousingSource: Statistics Sweden
00 01 02 03 04 05 06 07 08 09 10
-30
-20
-10
0
10
20
30
-30
-20
-10
0
10
20
30
Normally, companies have a tendency to overestimate
their capital spending needs in early surveys, but this
time around the rapid upturn in capacity utilisation,
combined with a historically low capital spending level,
indicates that the increase will instead exceed corpo-
rate plans. We are thus expecting capital spending by
manufacturers to grow by 13 per cent this year and
then continue upward at a rapid pace in 2012 as well.
Residential investments have gained back their down-
turn during the crisis. Rising home prices and a low
level of residential investments compared to other
countries make a continued upturn likely. Record-
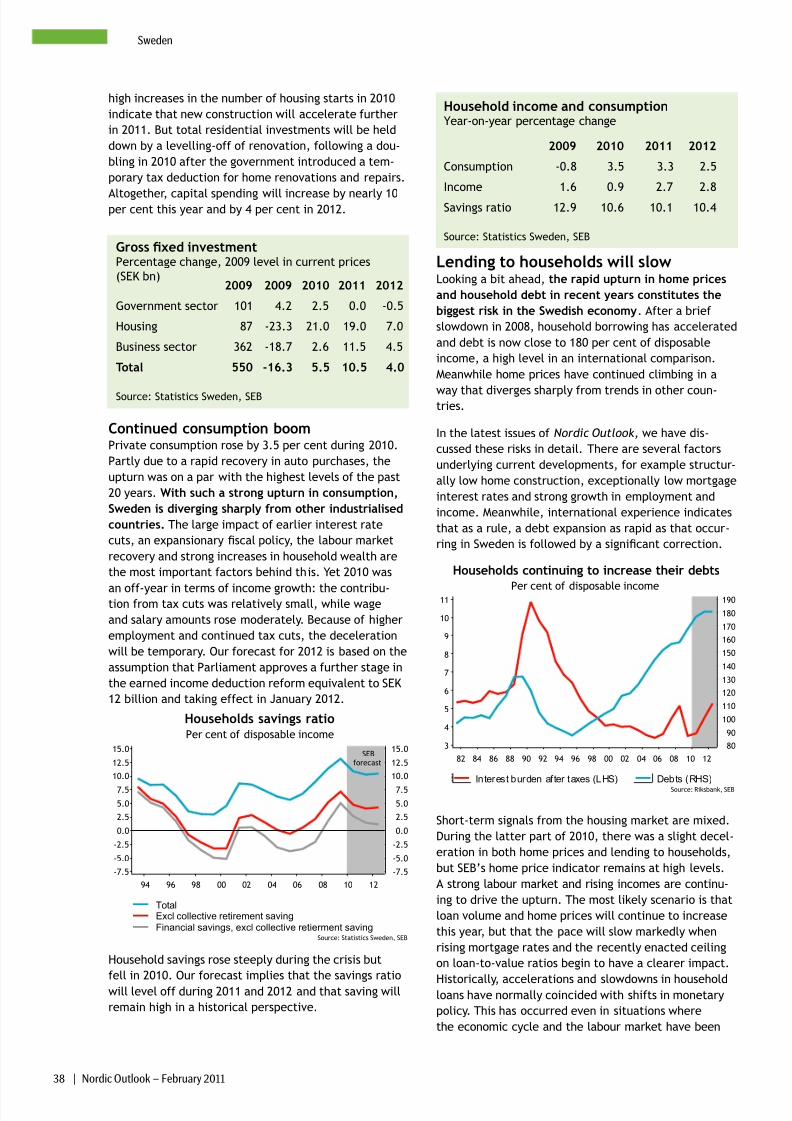
8/7/2019 SEB report: Giddy euphoria about the Swedish economy
http://slidepdf.com/reader/full/seb-report-giddy-euphoria-about-the-swedish-economy 37/55
38 | Nordic Outlook – February 2011
Sweden
high increases in the number of housing starts in 2010
indicate that new construction will accelerate further
in 2011. But total residential investments will be held
down by a levelling-off of renovation, following a dou-
bling in 2010 after the government introduced a tem-
porary tax deduction for home renovations and repairs.
Altogether, capital spending will increase by nearly 10per cent this year and by 4 per cent in 2012.
Gross xed investment Percentage change, 2009 level in current prices
(SEK bn) 2009 2009 2010 2011 2012
Government sector 101 4.2 2.5 0.0 -0.5
Housing 87 -23.3 21.0 19.0 7.0
Business sector 362 -18.7 2.6 11.5 4.5
Total 550 -16.3 5.5 10.5 4.0
Source: Statistics Sweden, SEB
Continued consumption boomPrivate consumption rose by 3.5 per cent during 2010.
Partly due to a rapid recovery in auto purchases, the
upturn was on a par with the highest levels of the past
20 years. With such a strong upturn in consumption,
Sweden is diverging sharply from other industrialised
countries. The large impact of earlier interest rate
cuts, an expansionary scal policy, the labour market
recovery and strong increases in household wealth are
the most important factors behind this. Yet 2010 was
an off-year in terms of income growth: the contribu-tion from tax cuts was relatively small, while wage
and salary amounts rose moderately. Because of higher
employment and continued tax cuts, the deceleration
will be temporary. Our forecast for 2012 is based on the
assumption that Parliament approves a further stage in
the earned income deduction reform equivalent to SEK
12 billion and taking effect in January 2012.
Per cent of disposable income
Households savings ratio
TotalExcl collective retirement saving
Financial savings, excl collective retierment savingSource: Statistics Sweden, SEB
94 96 98 00 02 04 06 08 10 12
-7.5
-5.0
-2.5
0.0
2.5
5.0
7.5
10.0
12.5
15.0
-7.5
-5.0
-2.5
0.0
2.5
5.0
7.5
10.0
12.5
15.0
forecastSEB
Household savings rose steeply during the crisis but
fell in 2010. Our forecast implies that the savings ratio
will level off during 2011 and 2012 and that saving will
remain high in a historical perspective.
Household income and consumptionYear-on-year percentage change
2009 2010 2011 2012
Consumption -0.8 3.5 3.3 2.5
Income 1.6 0.9 2.7 2.8
Savings ratio 12.9 10.6 10.1 10.4
Source: Statistics Sweden, SEB
Lending to households will slowLooking a bit ahead, the rapid upturn in home prices
and household debt in recent years constitutes the
biggest risk in the Swedish economy. After a brief
slowdown in 2008, household borrowing has accelerated
and debt is now close to 180 per cent of disposable
income, a high level in an international comparison.
Meanwhile home prices have continued climbing in a
way that diverges sharply from trends in other coun-tries.
In the latest issues of Nordic Outlook, we have dis-
cussed these risks in detail. There are several factors
underlying current developments, for example structur-
ally low home construction, exceptionally low mortgage
interest rates and strong growth in employment and
income. Meanwhile, international experience indicates
that as a rule, a debt expansion as rapid as that occur-
ring in Sweden is followed by a signicant correction.
Per cent of disposable income
Households continuing to increase their debts
Interest burden after taxes (LHS) Debts (RHS)Source: Riksbank, SEB
82 84 86 88 90 92 94 96 98 00 02 04 06 08 10 12
80
90
100
110
120
130
140
150
160
170
180
190
3
4
5
6
7
8
9
10
11
Short-term signals from the housing market are mixed.
During the latter part of 2010, there was a slight decel-
eration in both home prices and lending to households,
but SEB’s home price indicator remains at high levels.
A strong labour market and rising incomes are continu-
ing to drive the upturn. The most likely scenario is that
loan volume and home prices will continue to increase
this year, but that the pace will slow markedly when
rising mortgage rates and the recently enacted ceiling
on loan-to-value ratios begin to have a clearer impact.
Historically, accelerations and slowdowns in householdloans have normally coincided with shifts in monetary
policy. This has occurred even in situations where
the economic cycle and the labour market have been
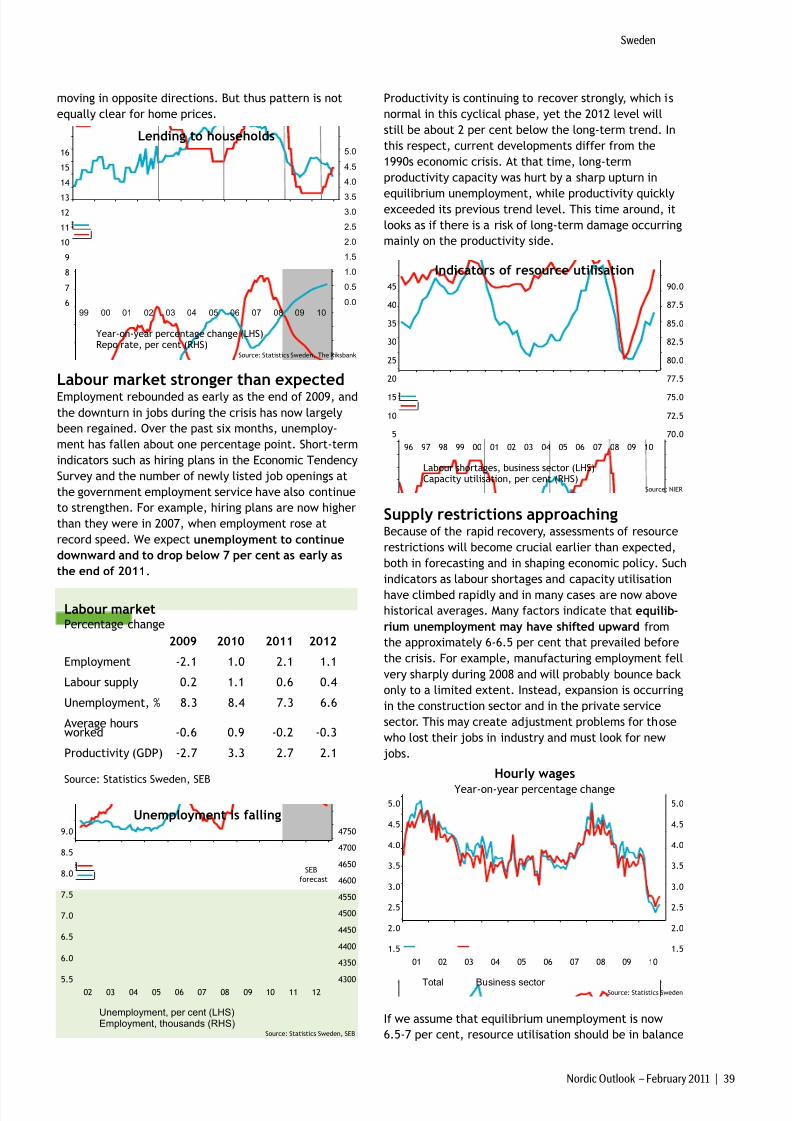
8/7/2019 SEB report: Giddy euphoria about the Swedish economy
http://slidepdf.com/reader/full/seb-report-giddy-euphoria-about-the-swedish-economy 38/55
Nordic Outlook – February 2011 | 39
Sweden
moving in opposite directions. But thus pattern is not
equally clear for home prices.
Lending to households
Year-on-year percentage change (LHS)Repo rate, per cent (RHS)
Source: Statistics Sweden, The Riksbank
99 00 01 02 03 04 05 06 07 08 09 10
0.0
0.5
1.0
1.5
2.0
2.5
3.0
3.5
4.0
4.5
5.0
6
7
8
9
10
11
12
13
14
15
16
Labour market stronger than expectedEmployment rebounded as early as the end of 2009, and
the downturn in jobs during the crisis has now largely
been regained. Over the past six months, unemploy-
ment has fallen about one percentage point. Short-term
indicators such as hiring plans in the Economic Tendency
Survey and the number of newly listed job openings at
the government employment service have also continue
to strengthen. For example, hiring plans are now higher
than they were in 2007, when employment rose at
record speed. We expect unemployment to continue
downward and to drop below 7 per cent as early as
the end of 2011.
Labour marketPercentage change
2009 2010 2011 2012
Employment -2.1 1.0 2.1 1.1
Labour supply 0.2 1.1 0.6 0.4
Unemployment, % 8.3 8.4 7.3 6.6
Average hoursworked -0.6 0.9 -0.2 -0.3
Productivity (GDP) -2.7 3.3 2.7 2.1
Source: Statistics Sweden, SEB
Unemployment is falling
Unemployment, per cent (LHS)Employment, thousands (RHS)
Source: Statistics Sweden, SEB
02 03 04 05 06 07 08 09 10 11 124300
4350
4400
4450
4500
4550
4600
4650
4700
4750
5.5
6.0
6.5
7.0
7.5
8.0
8.5
9.0
forecastSEB
Productivity is continuing to recover strongly, which is
normal in this cyclical phase, yet the 2012 level will
still be about 2 per cent below the long-term trend. In
this respect, current developments differ from the
1990s economic crisis. At that time, long-term
productivity capacity was hurt by a sharp upturn in
equilibrium unemployment, while productivity quicklyexceeded its previous trend level. This time around, it
looks as if there is a risk of long-term damage occurring
mainly on the productivity side.
Indicators of resource utilisation
Labour shortages, business sector (LHS)Capacity utilisation, per cent (RHS)
Source: NIER
96 97 98 99 00 01 02 03 04 05 06 07 08 09 10
70.0
72.5
75.0
77.5
80.0
82.5
85.0
87.5
90.0
5
10
15
20
25
30
35
40
45
Supply restrictions approachingBecause of the rapid recovery, assessments of resource
restrictions will become crucial earlier than expected,
both in forecasting and in shaping economic policy. Such
indicators as labour shortages and capacity utilisation
have climbed rapidly and in many cases are now abovehistorical averages. Many factors indicate that equilib-
rium unemployment may have shifted upward from
the approximately 6-6.5 per cent that prevailed before
the crisis. For example, manufacturing employment fell
very sharply during 2008 and will probably bounce back
only to a limited extent. Instead, expansion is occurring
in the construction sector and in the private service
sector. This may create adjustment problems for those
who lost their jobs in industry and must look for new
jobs.
Year-on-year percentage change
Hourly wages
Total Business sector Source: Statistics Sweden
01 02 03 04 05 06 07 08 09 10
1.5
2.0
2.5
3.0
3.5
4.0
4.5
5.0
1.5
2.0
2.5
3.0
3.5
4.0
4.5
5.0
If we assume that equilibrium unemployment is now
6.5-7 per cent, resource utilisation should be in balance
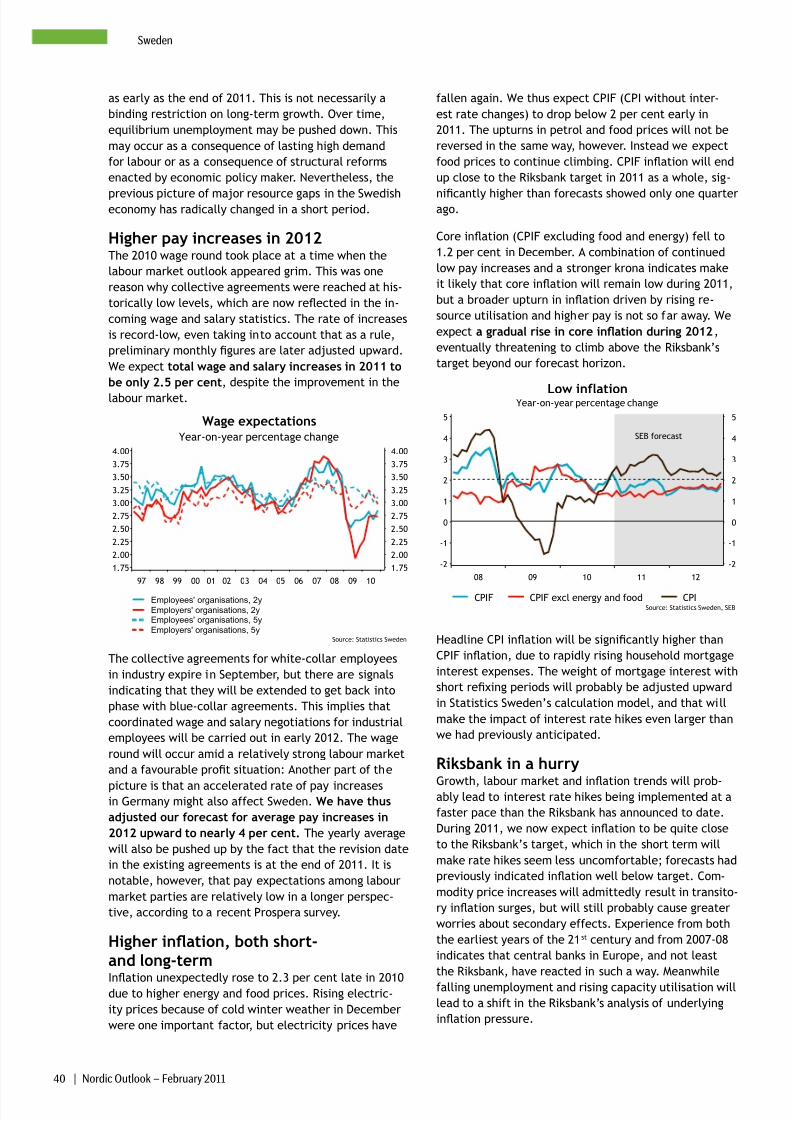
8/7/2019 SEB report: Giddy euphoria about the Swedish economy
http://slidepdf.com/reader/full/seb-report-giddy-euphoria-about-the-swedish-economy 39/55
40 | Nordic Outlook – February 2011
Sweden
as early as the end of 2011. This is not necessarily a
binding restriction on long-term growth. Over time,
equilibrium unemployment may be pushed down. This
may occur as a consequence of lasting high demand
for labour or as a consequence of structural reforms
enacted by economic policy maker. Nevertheless, the
previous picture of major resource gaps in the Swedisheconomy has radically changed in a short period.
Higher pay increases in 2012The 2010 wage round took place at a time when the
labour market outlook appeared grim. This was one
reason why collective agreements were reached at his-
torically low levels, which are now reected in the in-
coming wage and salary statistics. The rate of increases
is record-low, even taking into account that as a rule,
preliminary monthly gures are later adjusted upward.
We expect total wage and salary increases in 2011 to
be only 2.5 per cent, despite the improvement in the
labour market.
Year-on-year percentage change
Wage expectations
Employees' organisations, 2y
Employers' organisations, 2yEmployees' organisations, 5y
Employers' organisations, 5ySource: Statistics Sweden
97 98 99 00 01 02 03 04 05 06 07 08 09 10
1.75
2.00
2.25
2.50
2.75
3.00
3.25
3.50
3.75
4.00
1.75
2.00
2.25
2.50
2.75
3.00
3.25
3.50
3.75
4.00
The collective agreements for white-collar employees
in industry expire in September, but there are signals
indicating that they will be extended to get back into
phase with blue-collar agreements. This implies that
coordinated wage and salary negotiations for industrial
employees will be carried out in early 2012. The wage
round will occur amid a relatively strong labour market
and a favourable prot situation: Another part of the
picture is that an accelerated rate of pay increasesin Germany might also affect Sweden. We have thus
adjusted our forecast for average pay increases in
2012 upward to nearly 4 per cent. The yearly average
will also be pushed up by the fact that the revision date
in the existing agreements is at the end of 2011. It is
notable, however, that pay expectations among labour
market parties are relatively low in a longer perspec-
tive, according to a recent Prospera survey.
Higher ination, both short-and long-term
Ination unexpectedly rose to 2.3 per cent late in 2010due to higher energy and food prices. Rising electric-
ity prices because of cold winter weather in December
were one important factor, but electricity prices have
fallen again. We thus expect CPIF (CPI without inter-
est rate changes) to drop below 2 per cent early in
2011. The upturns in petrol and food prices will not be
reversed in the same way, however. Instead we expect
food prices to continue climbing. CPIF ination will end
up close to the Riksbank target in 2011 as a whole, sig-
nicantly higher than forecasts showed only one quarterago.
Core ination (CPIF excluding food and energy) fell to
1.2 per cent in December. A combination of continued
low pay increases and a stronger krona indicates make
it likely that core ination will remain low during 2011,
but a broader upturn in ination driven by rising re-
source utilisation and higher pay is not so far away. We
expect a gradual rise in core ination during 2012,
eventually threatening to climb above the Riksbank’s
target beyond our forecast horizon.
Year-on-year percentage changeLow inflation
CPIF CPIF excl energy and food CPISource: Statistics Sweden, SEB
08 09 10 11 12
-2
-1
0
1
2
3
4
5
-2
-1
0
1
2
3
4
5
SEB forecast
Headline CPI ination will be signicantly higher than
CPIF ination, due to rapidly rising household mortgage
interest expenses. The weight of mortgage interest with
short rexing periods will probably be adjusted upward
in Statistics Sweden’s calculation model, and that will
make the impact of interest rate hikes even larger than
we had previously anticipated.
Riksbank in a hurry
Growth, labour market and ination trends will prob-ably lead to interest rate hikes being implemented at a
faster pace than the Riksbank has announced to date.
During 2011, we now expect ination to be quite close
to the Riksbank’s target, which in the short term will
make rate hikes seem less uncomfortable; forecasts had
previously indicated ination well below target. Com-
modity price increases will admittedly result in transito-
ry ination surges, but will still probably cause greater
worries about secondary effects. Experience from both
the earliest years of the 21st century and from 2007-08
indicates that central banks in Europe, and not least
the Riksbank, have reacted in such a way. Meanwhile
falling unemployment and rising capacity utilisation willlead to a shift in the Riksbank’s analysis of underlying
ination pressure.
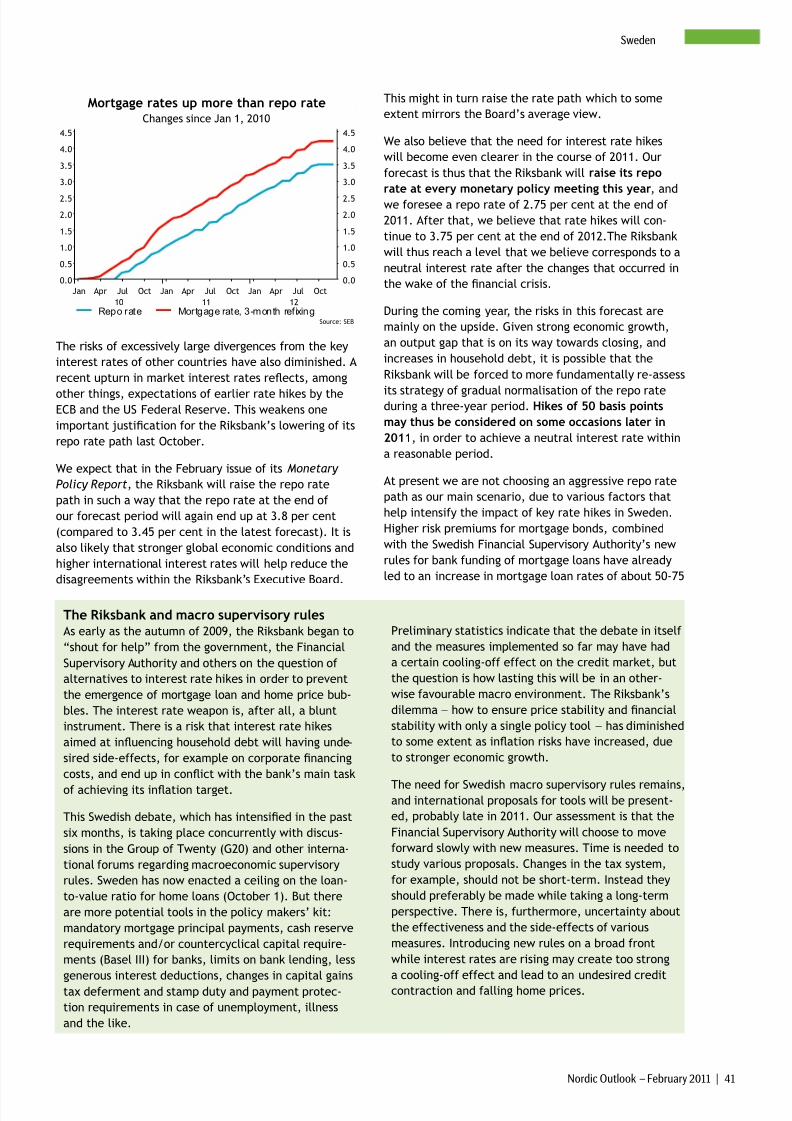
8/7/2019 SEB report: Giddy euphoria about the Swedish economy
http://slidepdf.com/reader/full/seb-report-giddy-euphoria-about-the-swedish-economy 40/55
Nordic Outlook – February 2011 | 41
Sweden
Changes since Jan 1, 2010
Mortgage rates up more than repo rate
Repo rate Mortgage rate, 3-month ref ixingSource: SEB
Jan Apr Jul Oct Jan Apr Jul Oct Jan Apr Jul Oct
10 11 12
0.0
0.5
1.0
1.5
2.0
2.5
3.0
3.5
4.0
4.5
0.0
0.5
1.0
1.5
2.0
2.5
3.0
3.5
4.0
4.5
The risks of excessively large divergences from the key
interest rates of other countries have also diminished. A
recent upturn in market interest rates reects, among
other things, expectations of earlier rate hikes by theECB and the US Federal Reserve. This weakens one
important justication for the Riksbank’s lowering of its
repo rate path last October.
We expect that in the February issue of its Monetary
Policy Report, the Riksbank will raise the repo rate
path in such a way that the repo rate at the end of
our forecast period will again end up at 3.8 per cent
(compared to 3.45 per cent in the latest forecast). It is
also likely that stronger global economic conditions and
higher international interest rates will help reduce the
disagreements within the Riksbank’s Executive Board.
This might in turn raise the rate path which to some
extent mirrors the Board’s average view.
We also believe that the need for interest rate hikes
will become even clearer in the course of 2011. Our
forecast is thus that the Riksbank will raise its repo
rate at every monetary policy meeting this year, and
we foresee a repo rate of 2.75 per cent at the end of
2011. After that, we believe that rate hikes will con-
tinue to 3.75 per cent at the end of 2012.The Riksbank
will thus reach a level that we believe corresponds to a
neutral interest rate after the changes that occurred in
the wake of the nancial crisis.
During the coming year, the risks in this forecast are
mainly on the upside. Given strong economic growth,
an output gap that is on its way towards closing, and
increases in household debt, it is possible that the
Riksbank will be forced to more fundamentally re-assess
its strategy of gradual normalisation of the repo rateduring a three-year period. Hikes of 50 basis points
may thus be considered on some occasions later in
2011, in order to achieve a neutral interest rate within
a reasonable period.
At present we are not choosing an aggressive repo rate
path as our main scenario, due to various factors that
help intensify the impact of key rate hikes in Sweden.
Higher risk premiums for mortgage bonds, combined
with the Swedish Financial Supervisory Authority’s new
rules for bank funding of mortgage loans have already
led to an increase in mortgage loan rates of about 50-75
The Riksbank and macro supervisory rulesAs early as the autumn of 2009, the Riksbank began to
“shout for help” from the government, the Financial
Supervisory Authority and others on the question of
alternatives to interest rate hikes in order to prevent
the emergence of mortgage loan and home price bub-
bles. The interest rate weapon is, after all, a blunt
instrument. There is a risk that interest rate hikes
aimed at inuencing household debt will having unde-
sired side-effects, for example on corporate nancing
costs, and end up in conict with the bank’s main task
of achieving its ination target.
This Swedish debate, which has intensied in the past
six months, is taking place concurrently with discus-
sions in the Group of Twenty (G20) and other interna-
tional forums regarding macroeconomic supervisory
rules. Sweden has now enacted a ceiling on the loan-
to-value ratio for home loans (October 1). But there
are more potential tools in the policy makers’ kit:
mandatory mortgage principal payments, cash reserve
requirements and/or countercyclical capital require-
ments (Basel III) for banks, limits on bank lending, less
generous interest deductions, changes in capital gains
tax deferment and stamp duty and payment protec-
tion requirements in case of unemployment, illness
and the like.
Preliminary statistics indicate that the debate in itself
and the measures implemented so far may have had
a certain cooling-off effect on the credit market, but
the question is how lasting this will be in an other-
wise favourable macro environment. The Riksbank’s
dilemma − how to ensure price stability and nancial
stability with only a single policy tool − has diminished
to some extent as ination risks have increased, due
to stronger economic growth.
The need for Swedish macro supervisory rules remains,and international proposals for tools will be present-
ed, probably late in 2011. Our assessment is that the
Financial Supervisory Authority will choose to move
forward slowly with new measures. Time is needed to
study various proposals. Changes in the tax system,
for example, should not be short-term. Instead they
should preferably be made while taking a long-term
perspective. There is, furthermore, uncertainty about
the effectiveness and the side-effects of various
measures. Introducing new rules on a broad front
while interest rates are rising may create too strong
a cooling-off effect and lead to an undesired credit
contraction and falling home prices.
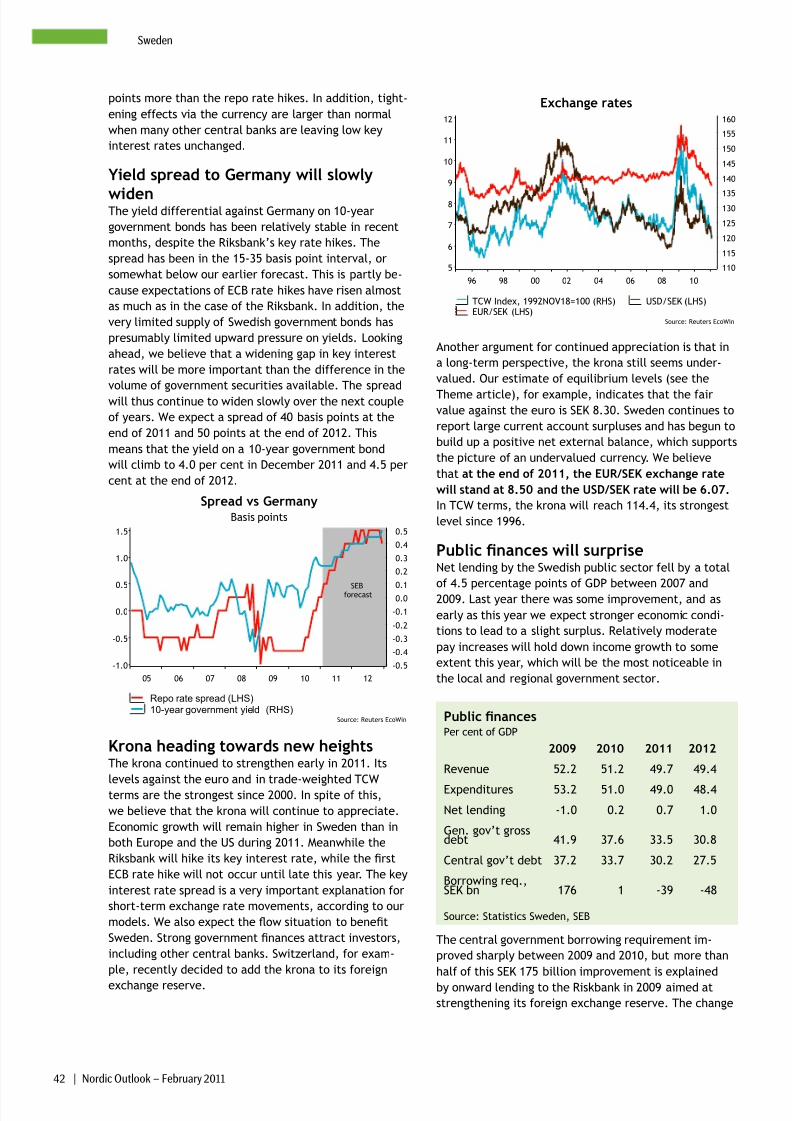
8/7/2019 SEB report: Giddy euphoria about the Swedish economy
http://slidepdf.com/reader/full/seb-report-giddy-euphoria-about-the-swedish-economy 41/55
42 | Nordic Outlook – February 2011
Sweden
points more than the repo rate hikes. In addition, tight-
ening effects via the currency are larger than normal
when many other central banks are leaving low key
interest rates unchanged.
Yield spread to Germany will slowly
widenThe yield differential against Germany on 10-year
government bonds has been relatively stable in recent
months, despite the Riksbank’s key rate hikes. The
spread has been in the 15-35 basis point interval, or
somewhat below our earlier forecast. This is partly be-
cause expectations of ECB rate hikes have risen almost
as much as in the case of the Riksbank. In addition, the
very limited supply of Swedish government bonds has
presumably limited upward pressure on yields. Looking
ahead, we believe that a widening gap in key interest
rates will be more important than the difference in the
volume of government securities available. The spread
will thus continue to widen slowly over the next couple
of years. We expect a spread of 40 basis points at the
end of 2011 and 50 points at the end of 2012. This
means that the yield on a 10-year government bond
will climb to 4.0 per cent in December 2011 and 4.5 per
cent at the end of 2012.
Basis points
Spread vs Germany
Repo rate spread (LHS)10-year government yield (RHS)
Source: Reuters EcoWin
05 06 07 08 09 10 11 12
-0.5
-0.4
-0.3
-0.2
-0.1
0.00.1
0.2
0.3
0.4
0.5
-1.0
-0.5
0.0
0.5
1.0
1.5
SEBforecast
Krona heading towards new heightsThe krona continued to strengthen early in 2011. Its
levels against the euro and in trade-weighted TCW
terms are the strongest since 2000. In spite of this,
we believe that the krona will continue to appreciate.
Economic growth will remain higher in Sweden than in
both Europe and the US during 2011. Meanwhile the
Riksbank will hike its key interest rate, while the rst
ECB rate hike will not occur until late this year. The key
interest rate spread is a very important explanation for
short-term exchange rate movements, according to our
models. We also expect the ow situation to benet
Sweden. Strong government nances attract investors,
including other central banks. Switzerland, for exam-
ple, recently decided to add the krona to its foreign
exchange reserve.
Exchange rates
TCW Index, 1992NOV18=100 (RHS)EUR/SEK (LHS)
USD/SEK (LHS)
Source: Reuters EcoWin
96 98 00 02 04 06 08 10
110
115
120
125
130135
140
145
150
155
160
5
6
7
8
9
10
11
12
Another argument for continued appreciation is that in
a long-term perspective, the krona still seems under-
valued. Our estimate of equilibrium levels (see the
Theme article), for example, indicates that the fairvalue against the euro is SEK 8.30. Sweden continues to
report large current account surpluses and has begun to
build up a positive net external balance, which supports
the picture of an undervalued currency. We believe
that at the end of 2011, the EUR/SEK exchange rate
will stand at 8.50 and the USD/SEK rate will be 6.07.
In TCW terms, the krona will reach 114.4, its strongest
level since 1996.
Public nances will surpriseNet lending by the Swedish public sector fell by a total
of 4.5 percentage points of GDP between 2007 and2009. Last year there was some improvement, and as
early as this year we expect stronger economic condi-
tions to lead to a slight surplus. Relatively moderate
pay increases will hold down income growth to some
extent this year, which will be the most noticeable in
the local and regional government sector.
Public nancesPer cent of GDP
2009 2010 2011 2012
Revenue 52.2 51.2 49.7 49.4
Expenditures 53.2 51.0 49.0 48.4
Net lending -1.0 0.2 0.7 1.0
Gen. gov’t grossdebt 41.9 37.6 33.5 30.8
Central gov’t debt 37.2 33.7 30.2 27.5
Borrowing req.,SEK bn 176 1 -39 -48
Source: Statistics Sweden, SEB
The central government borrowing requirement im-
proved sharply between 2009 and 2010, but more than
half of this SEK 175 billion improvement is explained
by onward lending to the Riskbank in 2009 aimed atstrengthening its foreign exchange reserve. The change
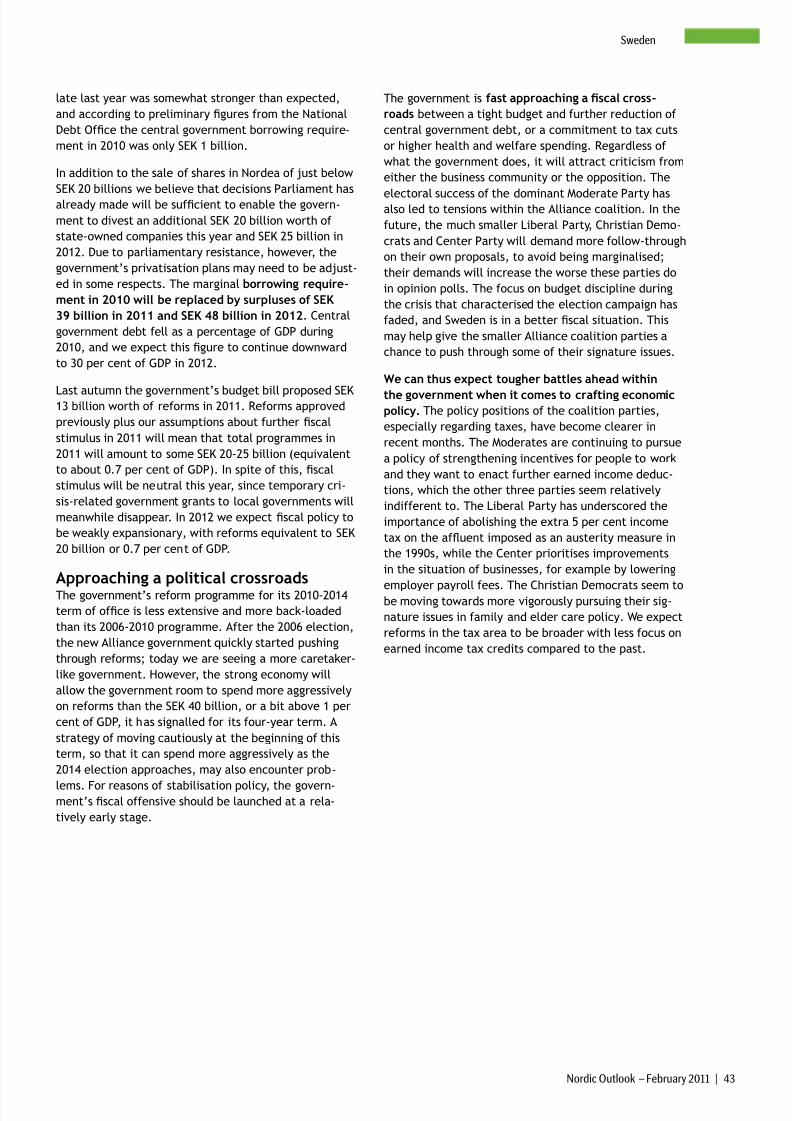
8/7/2019 SEB report: Giddy euphoria about the Swedish economy
http://slidepdf.com/reader/full/seb-report-giddy-euphoria-about-the-swedish-economy 42/55
Nordic Outlook – February 2011 | 43
Sweden
late last year was somewhat stronger than expected,
and according to preliminary gures from the National
Debt Ofce the central government borrowing require-
ment in 2010 was only SEK 1 billion.
In addition to the sale of shares in Nordea of just below
SEK 20 billions we believe that decisions Parliament has
already made will be sufcient to enable the govern-
ment to divest an additional SEK 20 billion worth of
state-owned companies this year and SEK 25 billion in
2012. Due to parliamentary resistance, however, the
government’s privatisation plans may need to be adjust-
ed in some respects. The marginal borrowing require-
ment in 2010 will be replaced by surpluses of SEK
39 billion in 2011 and SEK 48 billion in 2012. Central
government debt fell as a percentage of GDP during
2010, and we expect this gure to continue downward
to 30 per cent of GDP in 2012.
Last autumn the government’s budget bill proposed SEK13 billion worth of reforms in 2011. Reforms approved
previously plus our assumptions about further scal
stimulus in 2011 will mean that total programmes in
2011 will amount to some SEK 20-25 billion (equivalent
to about 0.7 per cent of GDP). In spite of this, scal
stimulus will be neutral this year, since temporary cri-
sis-related government grants to local governments will
meanwhile disappear. In 2012 we expect scal policy to
be weakly expansionary, with reforms equivalent to SEK
20 billion or 0.7 per cent of GDP.
Approaching a political crossroadsThe government’s reform programme for its 2010-2014
term of ofce is less extensive and more back-loaded
than its 2006-2010 programme. After the 2006 election,
the new Alliance government quickly started pushing
through reforms; today we are seeing a more caretaker-
like government. However, the strong economy will
allow the government room to spend more aggressively
on reforms than the SEK 40 billion, or a bit above 1 per
cent of GDP, it has signalled for its four-year term. A
strategy of moving cautiously at the beginning of this
term, so that it can spend more aggressively as the
2014 election approaches, may also encounter prob-
lems. For reasons of stabilisation policy, the govern-ment’s scal offensive should be launched at a rela-
tively early stage.
The government is fast approaching a scal cross-
roads between a tight budget and further reduction of
central government debt, or a commitment to tax cuts
or higher health and welfare spending. Regardless of
what the government does, it will attract criticism from
either the business community or the opposition. The
electoral success of the dominant Moderate Party hasalso led to tensions within the Alliance coalition. In the
future, the much smaller Liberal Party, Christian Demo-
crats and Center Party will demand more follow-through
on their own proposals, to avoid being marginalised;
their demands will increase the worse these parties do
in opinion polls. The focus on budget discipline during
the crisis that characterised the election campaign has
faded, and Sweden is in a better scal situation. This
may help give the smaller Alliance coalition parties a
chance to push through some of their signature issues.
We can thus expect tougher battles ahead within
the government when it comes to crafting economicpolicy. The policy positions of the coalition parties,
especially regarding taxes, have become clearer in
recent months. The Moderates are continuing to pursue
a policy of strengthening incentives for people to work
and they want to enact further earned income deduc-
tions, which the other three parties seem relatively
indifferent to. The Liberal Party has underscored the
importance of abolishing the extra 5 per cent income
tax on the afuent imposed as an austerity measure in
the 1990s, while the Center prioritises improvements
in the situation of businesses, for example by lowering
employer payroll fees. The Christian Democrats seem tobe moving towards more vigorously pursuing their sig-
nature issues in family and elder care policy. We expect
reforms in the tax area to be broader with less focus on
earned income tax credits compared to the past.
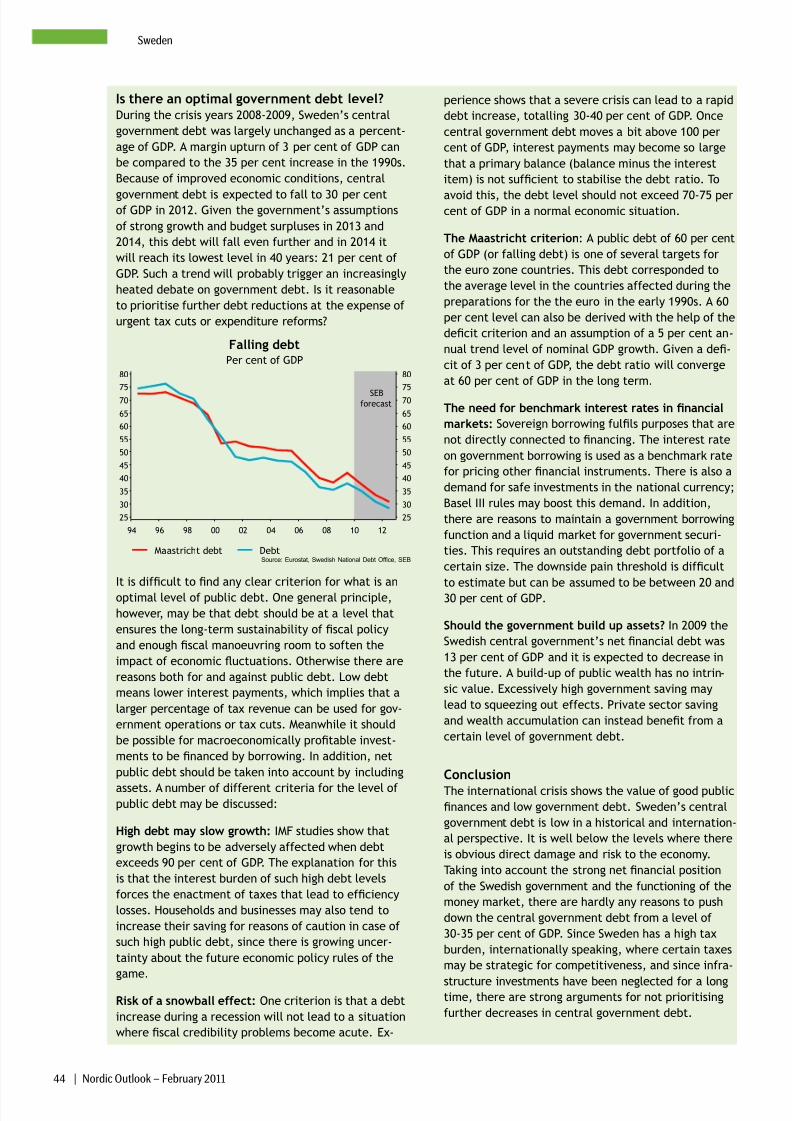
8/7/2019 SEB report: Giddy euphoria about the Swedish economy
http://slidepdf.com/reader/full/seb-report-giddy-euphoria-about-the-swedish-economy 43/55
44 | Nordic Outlook – February 2011
Sweden
Is there an optimal government debt level?During the crisis years 2008-2009, Sweden’s central
government debt was largely unchanged as a percent-
age of GDP. A margin upturn of 3 per cent of GDP can
be compared to the 35 per cent increase in the 1990s.
Because of improved economic conditions, central
government debt is expected to fall to 30 per centof GDP in 2012. Given the government’s assumptions
of strong growth and budget surpluses in 2013 and
2014, this debt will fall even further and in 2014 it
will reach its lowest level in 40 years: 21 per cent of
GDP. Such a trend will probably trigger an increasingly
heated debate on government debt. Is it reasonable
to prioritise further debt reductions at the expense of
urgent tax cuts or expenditure reforms?
Per cent of GDP
Falling debt
Maastricht debt DebtSource: Eurostat, Swedish National Debt Office, SEB
94 96 98 00 02 04 06 08 10 12
25
30
35
40
45
50
55
60
65
70
75
80
25
30
35
40
45
50
55
60
65
70
75
80
forecastSEB
It is difcult to nd any clear criterion for what is an
optimal level of public debt. One general principle,
however, may be that debt should be at a level that
ensures the long-term sustainability of scal policy
and enough scal manoeuvring room to soften the
impact of economic uctuations. Otherwise there are
reasons both for and against public debt. Low debt
means lower interest payments, which implies that a
larger percentage of tax revenue can be used for gov-
ernment operations or tax cuts. Meanwhile it should
be possible for macroeconomically protable invest-
ments to be nanced by borrowing. In addition, net
public debt should be taken into account by including
assets. A number of different criteria for the level of public debt may be discussed:
High debt may slow growth: IMF studies show that
growth begins to be adversely affected when debt
exceeds 90 per cent of GDP. The explanation for this
is that the interest burden of such high debt levels
forces the enactment of taxes that lead to efciency
losses. Households and businesses may also tend to
increase their saving for reasons of caution in case of
such high public debt, since there is growing uncer-
tainty about the future economic policy rules of the
game.
Risk of a snowball effect: One criterion is that a debt
increase during a recession will not lead to a situation
where scal credibility problems become acute. Ex-
perience shows that a severe crisis can lead to a rapid
debt increase, totalling 30-40 per cent of GDP. Once
central government debt moves a bit above 100 per
cent of GDP, interest payments may become so large
that a primary balance (balance minus the interest
item) is not sufcient to stabilise the debt ratio. To
avoid this, the debt level should not exceed 70-75 percent of GDP in a normal economic situation.
The Maastricht criterion: A public debt of 60 per cent
of GDP (or falling debt) is one of several targets for
the euro zone countries. This debt corresponded to
the average level in the countries affected during the
preparations for the the euro in the early 1990s. A 60
per cent level can also be derived with the help of the
decit criterion and an assumption of a 5 per cent an-
nual trend level of nominal GDP growth. Given a de-
cit of 3 per cent of GDP, the debt ratio will converge
at 60 per cent of GDP in the long term.
The need for benchmark interest rates in nancial
markets: Sovereign borrowing fulls purposes that are
not directly connected to nancing. The interest rate
on government borrowing is used as a benchmark rate
for pricing other nancial instruments. There is also a
demand for safe investments in the national currency;
Basel III rules may boost this demand. In addition,
there are reasons to maintain a government borrowing
function and a liquid market for government securi-
ties. This requires an outstanding debt portfolio of a
certain size. The downside pain threshold is difcult
to estimate but can be assumed to be between 20 and
30 per cent of GDP.
Should the government build up assets? In 2009 the
Swedish central government’s net nancial debt was
13 per cent of GDP and it is expected to decrease in
the future. A build-up of public wealth has no intrin-
sic value. Excessively high government saving may
lead to squeezing out effects. Private sector saving
and wealth accumulation can instead benet from a
certain level of government debt.
Conclusion
The international crisis shows the value of good publicnances and low government debt. Sweden’s central
government debt is low in a historical and internation-
al perspective. It is well below the levels where there
is obvious direct damage and risk to the economy.
Taking into account the strong net nancial position
of the Swedish government and the functioning of the
money market, there are hardly any reasons to push
down the central government debt from a level of
30-35 per cent of GDP. Since Sweden has a high tax
burden, internationally speaking, where certain taxes
may be strategic for competitiveness, and since infra-
structure investments have been neglected for a longtime, there are strong arguments for not prioritising
further decreases in central government debt.
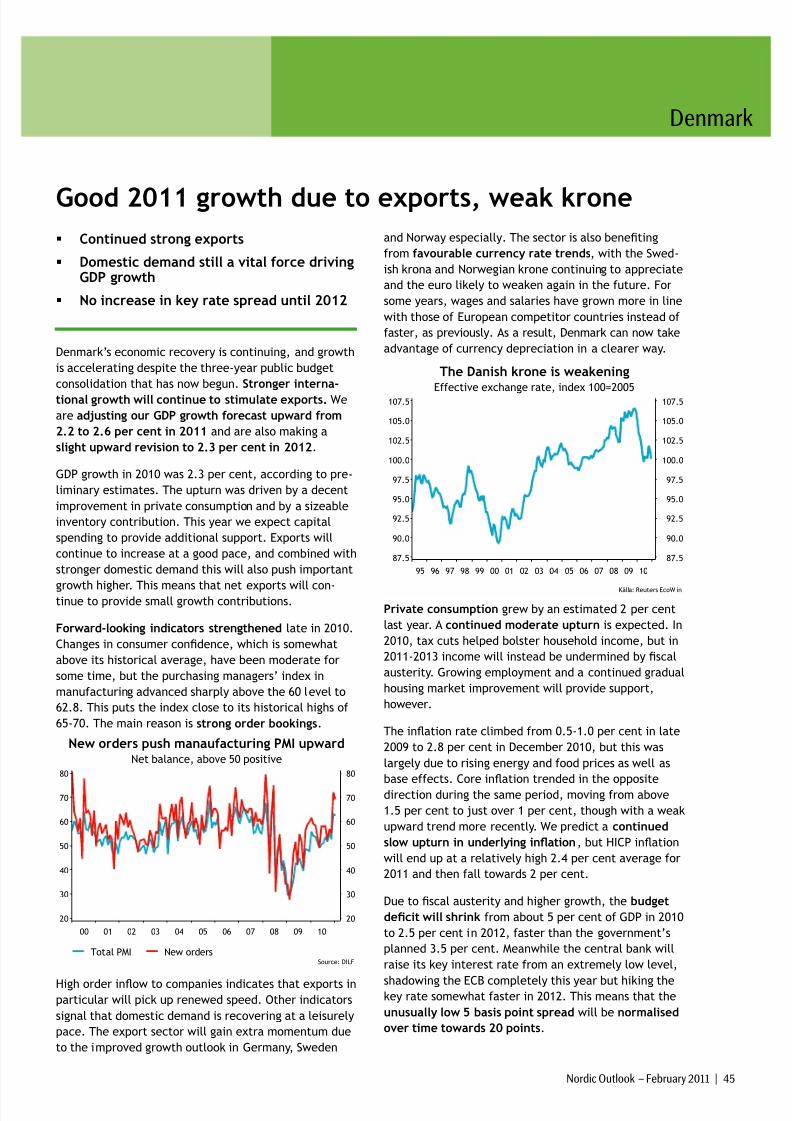
8/7/2019 SEB report: Giddy euphoria about the Swedish economy
http://slidepdf.com/reader/full/seb-report-giddy-euphoria-about-the-swedish-economy 44/55
Denmark
Nordic Outlook – February 2011 | 45
Good 2011 growth due to exports, weak krone Continued strong exports
Domestic demand still a vital force drivingGDP growth
No increase in key rate spread until 2012
Denmark’s economic recovery is continuing, and growth
is accelerating despite the three-year public budget
consolidation that has now begun. Stronger interna-
tional growth will continue to stimulate exports. We
are adjusting our GDP growth forecast upward from
2.2 to 2.6 per cent in 2011 and are also making a
slight upward revision to 2.3 per cent in 2012.
GDP growth in 2010 was 2.3 per cent, according to pre-
liminary estimates. The upturn was driven by a decent
improvement in private consumption and by a sizeable
inventory contribution. This year we expect capital
spending to provide additional support. Exports will
continue to increase at a good pace, and combined with
stronger domestic demand this will also push important
growth higher. This means that net exports will con-tinue to provide small growth contributions.
Forward-looking indicators strengthened late in 2010.
Changes in consumer condence, which is somewhat
above its historical average, have been moderate for
some time, but the purchasing managers’ index in
manufacturing advanced sharply above the 60 level to
62.8. This puts the index close to its historical highs of
65-70. The main reason is strong order bookings.
Net balance, above 50 positive
New orders push manaufacturing PMI upward
Total PMI New ordersSource: DILF
00 01 02 03 04 05 06 07 08 09 10
20
30
40
50
60
70
80
20
30
40
50
60
70
80
High order inow to companies indicates that exports inparticular will pick up renewed speed. Other indicators
signal that domestic demand is recovering at a leisurely
pace. The export sector will gain extra momentum due
to the improved growth outlook in Germany, Sweden
and Norway especially. The sector is also beneting
from favourable currency rate trends, with the Swed-
ish krona and Norwegian krone continuing to appreciate
and the euro likely to weaken again in the future. For
some years, wages and salaries have grown more in line
with those of European competitor countries instead of
faster, as previously. As a result, Denmark can now take
advantage of currency depreciation in a clearer way.
Effective exchange rate, index 100=2005
The Danish krone is weakening
Källa: Reuters EcoW in
95 96 97 98 99 00 01 02 03 04 05 06 07 08 09 10
87.5
90.0
92.5
95.0
97.5
100.0
102.5
105.0
107.5
87.5
90.0
92.5
95.0
97.5
100.0
102.5
105.0
107.5
Private consumption grew by an estimated 2 per cent
last year. A continued moderate upturn is expected. In
2010, tax cuts helped bolster household income, but in
2011-2013 income will instead be undermined by scal
austerity. Growing employment and a continued gradual
housing market improvement will provide support,
however.
The ination rate climbed from 0.5-1.0 per cent in late
2009 to 2.8 per cent in December 2010, but this was
largely due to rising energy and food prices as well as
base effects. Core ination trended in the opposite
direction during the same period, moving from above
1.5 per cent to just over 1 per cent, though with a weak
upward trend more recently. We predict a continued
slow upturn in underlying ination, but HICP ination
will end up at a relatively high 2.4 per cent average for
2011 and then fall towards 2 per cent.
Due to scal austerity and higher growth, the budget
decit will shrink from about 5 per cent of GDP in 2010
to 2.5 per cent in 2012, faster than the government’s
planned 3.5 per cent. Meanwhile the central bank will
raise its key interest rate from an extremely low level,
shadowing the ECB completely this year but hiking thekey rate somewhat faster in 2012. This means that the
unusually low 5 basis point spread will be normalised
over time towards 20 points.
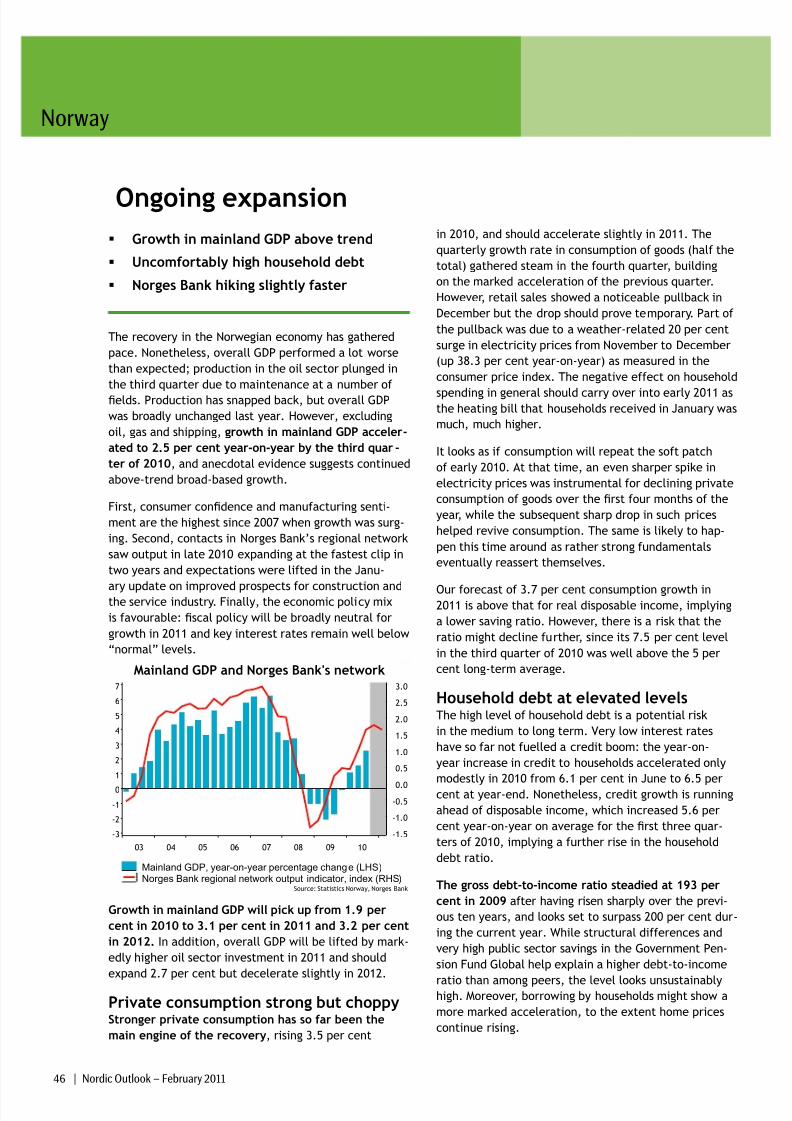
8/7/2019 SEB report: Giddy euphoria about the Swedish economy
http://slidepdf.com/reader/full/seb-report-giddy-euphoria-about-the-swedish-economy 45/55
Norway
46 | Nordic Outlook – February 2011
Ongoing expansion Growth in mainland GDP above trend
Uncomfortably high household debt
Norges Bank hiking slightly faster
The recovery in the Norwegian economy has gathered
pace. Nonetheless, overall GDP performed a lot worse
than expected; production in the oil sector plunged in
the third quarter due to maintenance at a number of
elds. Production has snapped back, but overall GDP
was broadly unchanged last year. However, excluding
oil, gas and shipping, growth in mainland GDP acceler-
ated to 2.5 per cent year-on-year by the third quar -
ter of 2010, and anecdotal evidence suggests continued
above-trend broad-based growth.
First, consumer condence and manufacturing senti-
ment are the highest since 2007 when growth was surg-
ing. Second, contacts in Norges Bank’s regional network
saw output in late 2010 expanding at the fastest clip in
two years and expectations were lifted in the Janu-
ary update on improved prospects for construction andthe service industry. Finally, the economic policy mix
is favourable: scal policy will be broadly neutral for
growth in 2011 and key interest rates remain well below
“normal” levels.
Mainland GDP and Norges Bank's network
Mainland GDP, year-on-year percentage change (LHS)Norges Bank regional network output indicator, index (RHS)
Source: Statistics Norway, Norges Bank
03 04 05 06 07 08 09 10
-1.5
-1.0
-0.5
0.0
0.5
1.0
1.5
2.0
2.5
3.0
-3
-2
-1
0
1
2
3
4
5
6
7
Growth in mainland GDP will pick up from 1.9 per
cent in 2010 to 3.1 per cent in 2011 and 3.2 per cent
in 2012. In addition, overall GDP will be lifted by mark-
edly higher oil sector investment in 2011 and should
expand 2.7 per cent but decelerate slightly in 2012.
Private consumption strong but choppyStronger private consumption has so far been the
main engine of the recovery, rising 3.5 per cent
in 2010, and should accelerate slightly in 2011. The
quarterly growth rate in consumption of goods (half the
total) gathered steam in the fourth quarter, building
on the marked acceleration of the previous quarter.
However, retail sales showed a noticeable pullback in
December but the drop should prove temporary. Part of
the pullback was due to a weather-related 20 per cent
surge in electricity prices from November to December
(up 38.3 per cent year-on-year) as measured in the
consumer price index. The negative effect on household
spending in general should carry over into early 2011 asthe heating bill that households received in January was
much, much higher.
It looks as if consumption will repeat the soft patch
of early 2010. At that time, an even sharper spike in
electricity prices was instrumental for declining private
consumption of goods over the rst four months of the
year, while the subsequent sharp drop in such prices
helped revive consumption. The same is likely to hap-
pen this time around as rather strong fundamentals
eventually reassert themselves.
Our forecast of 3.7 per cent consumption growth in2011 is above that for real disposable income, implying
a lower saving ratio. However, there is a risk that the
ratio might decline further, since its 7.5 per cent level
in the third quarter of 2010 was well above the 5 per
cent long-term average.
Household debt at elevated levelsThe high level of household debt is a potential risk
in the medium to long term. Very low interest rates
have so far not fuelled a credit boom: the year-on-
year increase in credit to households accelerated only
modestly in 2010 from 6.1 per cent in June to 6.5 per
cent at year-end. Nonetheless, credit growth is running
ahead of disposable income, which increased 5.6 per
cent year-on-year on average for the rst three quar-
ters of 2010, implying a further rise in the household
debt ratio.
The gross debt-to-income ratio steadied at 193 per
cent in 2009 after having risen sharply over the previ-
ous ten years, and looks set to surpass 200 per cent dur-
ing the current year. While structural differences and
very high public sector savings in the Government Pen-
sion Fund Global help explain a higher debt-to-income
ratio than among peers, the level looks unsustainablyhigh. Moreover, borrowing by households might show a
more marked acceleration, to the extent home prices
continue rising.
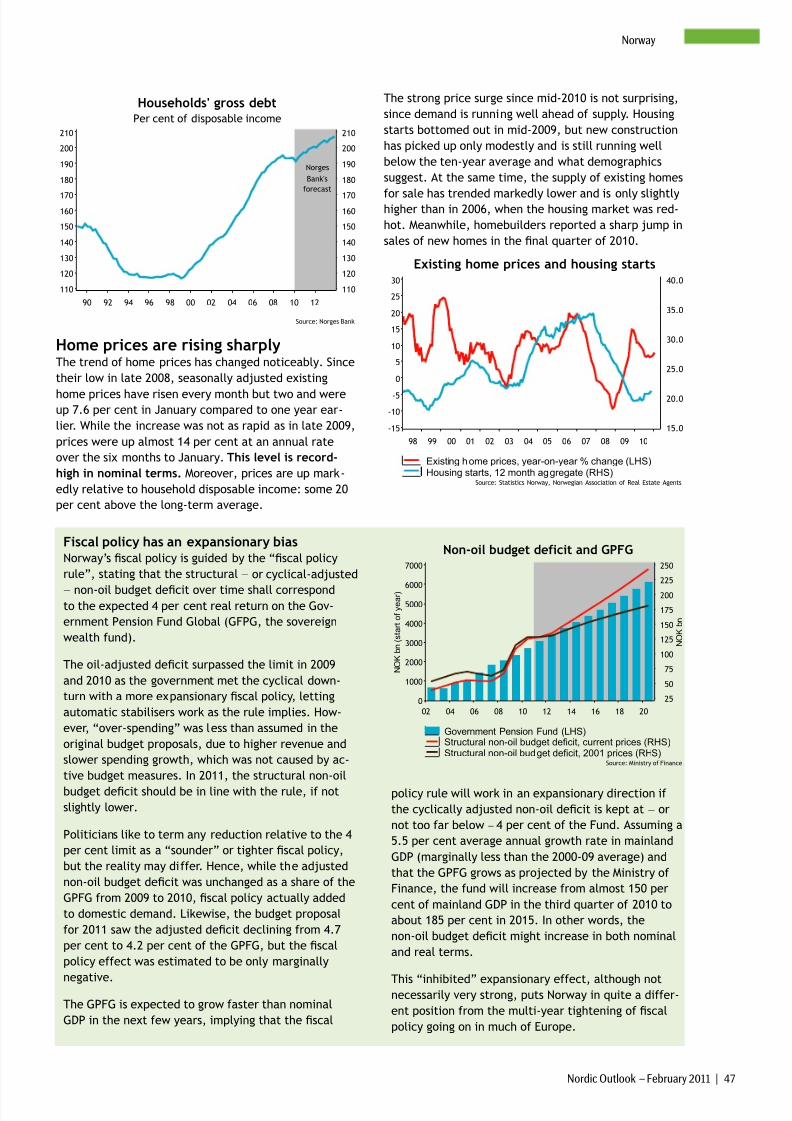
8/7/2019 SEB report: Giddy euphoria about the Swedish economy
http://slidepdf.com/reader/full/seb-report-giddy-euphoria-about-the-swedish-economy 46/55
Nordic Outlook – February 2011 | 47
Norway
Per cent of disposable income
Households' gross debt
Source: Norges Bank
90 92 94 96 98 00 02 04 06 08 10 12
110
120
130
140
150
160170
180
190
200
210
110
120
130
140
150
160170
180
190
200
210
forecast
Norges
Bank's
Home prices are rising sharplyThe trend of home prices has changed noticeably. Since
their low in late 2008, seasonally adjusted existing
home prices have risen every month but two and wereup 7.6 per cent in January compared to one year ear-
lier. While the increase was not as rapid as in late 2009,
prices were up almost 14 per cent at an annual rate
over the six months to January. This level is record-
high in nominal terms. Moreover, prices are up mark-
edly relative to household disposable income: some 20
per cent above the long-term average.
The strong price surge since mid-2010 is not surprising,
since demand is running well ahead of supply. Housing
starts bottomed out in mid-2009, but new construction
has picked up only modestly and is still running well
below the ten-year average and what demographics
suggest. At the same time, the supply of existing homes
for sale has trended markedly lower and is only slightlyhigher than in 2006, when the housing market was red-
hot. Meanwhile, homebuilders reported a sharp jump in
sales of new homes in the nal quarter of 2010.
Existing home prices and housing starts
Existing home prices, year-on-year % change (LHS)Housing starts, 12 month aggregate (RHS)
Source: Statistics Norway, Norwegian Association of Real Estate Agents
98 99 00 01 02 03 04 05 06 07 08 09 10
15.0
20.0
25.0
30.0
35.0
40.0
-15
-10
-5
0
5
10
15
20
25
30
Fiscal policy has an expansionary biasNorway’s scal policy is guided by the “scal policy
rule”, stating that the structural − or cyclical-adjusted
−non-oil budget decit over time shall correspond
to the expected 4 per cent real return on the Gov-
ernment Pension Fund Global (GFPG, the sovereign
wealth fund).
The oil-adjusted decit surpassed the limit in 2009
and 2010 as the government met the cyclical down-
turn with a more expansionary scal policy, letting
automatic stabilisers work as the rule implies. How-
ever, “over-spending” was less than assumed in the
original budget proposals, due to higher revenue and
slower spending growth, which was not caused by ac-
tive budget measures. In 2011, the structural non-oil
budget decit should be in line with the rule, if not
slightly lower.
Politicians like to term any reduction relative to the 4
per cent limit as a “sounder” or tighter scal policy,
but the reality may differ. Hence, while the adjusted
non-oil budget decit was unchanged as a share of the
GPFG from 2009 to 2010, scal policy actually added
to domestic demand. Likewise, the budget proposal
for 2011 saw the adjusted decit declining from 4.7
per cent to 4.2 per cent of the GPFG, but the scal
policy effect was estimated to be only marginally
negative.
The GPFG is expected to grow faster than nominal
GDP in the next few years, implying that the scal
Non-oil budget deficit and GPFG
Government Pension Fund (LHS)Structural non-oil budget deficit, current prices (RHS)Structural non-oil budget deficit, 2001 prices (RHS)
Source: Ministry of Finance
02 04 06 08 10 12 14 16 18 20
N O K
b n
25
50
75
100
125
150
175
200
225
250
N O K
b n ( s t a r t o f y e a r )
0
1000
2000
3000
4000
5000
6000
7000
policy rule will work in an expansionary direction if
the cyclically adjusted non-oil decit is kept at − or
not too far below – 4 per cent of the Fund. Assuming a
5.5 per cent average annual growth rate in mainland
GDP (marginally less than the 2000-09 average) and
that the GPFG grows as projected by the Ministry of
Finance, the fund will increase from almost 150 per
cent of mainland GDP in the third quarter of 2010 to
about 185 per cent in 2015. In other words, the
non-oil budget decit might increase in both nominal
and real terms.
This “inhibited” expansionary effect, although notnecessarily very strong, puts Norway in quite a differ-
ent position from the multi-year tightening of scal
policy going on in much of Europe.
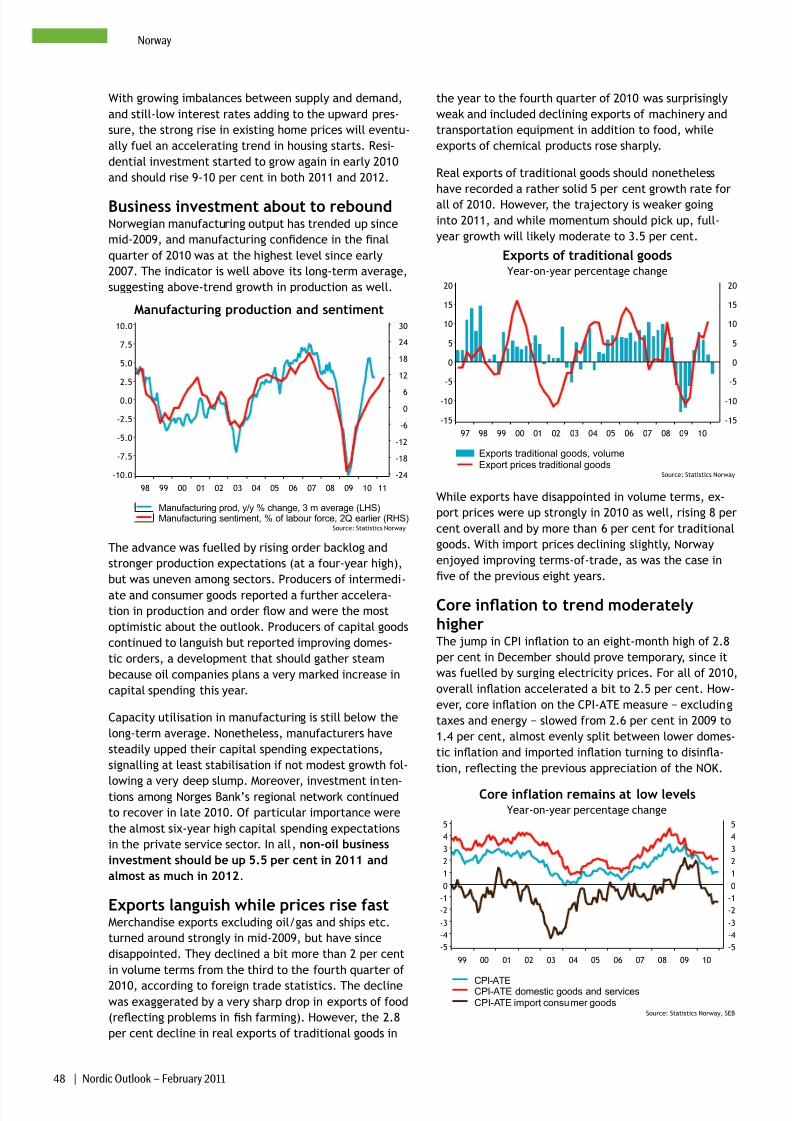
8/7/2019 SEB report: Giddy euphoria about the Swedish economy
http://slidepdf.com/reader/full/seb-report-giddy-euphoria-about-the-swedish-economy 47/55
48 | Nordic Outlook – February 2011
Norway
With growing imbalances between supply and demand,
and still-low interest rates adding to the upward pres-
sure, the strong rise in existing home prices will eventu-
ally fuel an accelerating trend in housing starts. Resi-
dential investment started to grow again in early 2010
and should rise 9-10 per cent in both 2011 and 2012.
Business investment about to reboundNorwegian manufacturing output has trended up since
mid-2009, and manufacturing condence in the nal
quarter of 2010 was at the highest level since early
2007. The indicator is well above its long-term average,
suggesting above-trend growth in production as well.
Manufacturing production and sentiment
Manufacturing prod, y/y % change, 3 m average (LHS)Manufacturing sentiment, % of labour force, 2Q earlier (RHS)
Source: Statistics Norway
98 99 00 01 02 03 04 05 06 07 08 09 10 11
-24
-18
-12
-6
0
6
12
18
24
30
-10.0
-7.5
-5.0
-2.5
0.0
2.5
5.0
7.5
10.0
The advance was fuelled by rising order backlog and
stronger production expectations (at a four-year high),
but was uneven among sectors. Producers of intermedi-
ate and consumer goods reported a further accelera-
tion in production and order ow and were the most
optimistic about the outlook. Producers of capital goods
continued to languish but reported improving domes-
tic orders, a development that should gather steam
because oil companies plans a very marked increase in
capital spending this year.
Capacity utilisation in manufacturing is still below the
long-term average. Nonetheless, manufacturers have
steadily upped their capital spending expectations,
signalling at least stabilisation if not modest growth fol-
lowing a very deep slump. Moreover, investment inten-tions among Norges Bank’s regional network continued
to recover in late 2010. Of particular importance were
the almost six-year high capital spending expectations
in the private service sector. In all, non-oil business
investment should be up 5.5 per cent in 2011 and
almost as much in 2012.
Exports languish while prices rise fastMerchandise exports excluding oil/gas and ships etc.
turned around strongly in mid-2009, but have since
disappointed. They declined a bit more than 2 per cent
in volume terms from the third to the fourth quarter of
2010, according to foreign trade statistics. The decline
was exaggerated by a very sharp drop in exports of food
(reecting problems in sh farming). However, the 2.8
per cent decline in real exports of traditional goods in
the year to the fourth quarter of 2010 was surprisingly
weak and included declining exports of machinery and
transportation equipment in addition to food, while
exports of chemical products rose sharply.
Real exports of traditional goods should nonetheless
have recorded a rather solid 5 per cent growth rate for
all of 2010. However, the trajectory is weaker going
into 2011, and while momentum should pick up, full-
year growth will likely moderate to 3.5 per cent.
Year-on-year percentage change
Exports of traditional goods
Exports traditional goods, volumeExport prices traditional goods
Source: Statistics Norway
97 98 99 00 01 02 03 04 05 06 07 08 09 10
-15
-10
-5
0
5
10
15
20
-15
-10
-5
0
5
10
15
20
While exports have disappointed in volume terms, ex-
port prices were up strongly in 2010 as well, rising 8 per
cent overall and by more than 6 per cent for traditional
goods. With import prices declining slightly, Norway
enjoyed improving terms-of-trade, as was the case in
ve of the previous eight years.
Core ination to trend moderatelyhigherThe jump in CPI ination to an eight-month high of 2.8
per cent in December should prove temporary, since it
was fuelled by surging electricity prices. For all of 2010,
overall ination accelerated a bit to 2.5 per cent. How-
ever, core ination on the CPI-ATE measure − excluding
taxes and energy − slowed from 2.6 per cent in 2009 to
1.4 per cent, almost evenly split between lower domes-
tic ination and imported ination turning to disina-
tion, reecting the previous appreciation of the NOK.
Year-on-year percentage change
Core inflation remains at low levels
CPI-ATECPI-ATE domestic goods and servicesCPI-ATE import consumer goods
Source: Statistics Norway, SEB
99 00 01 02 03 04 05 06 07 08 09 10
-5
-4
-3
-2
-1
0
1
2
3
4
5
-5
-4
-3
-2
-1
0
1
2
3
4
5
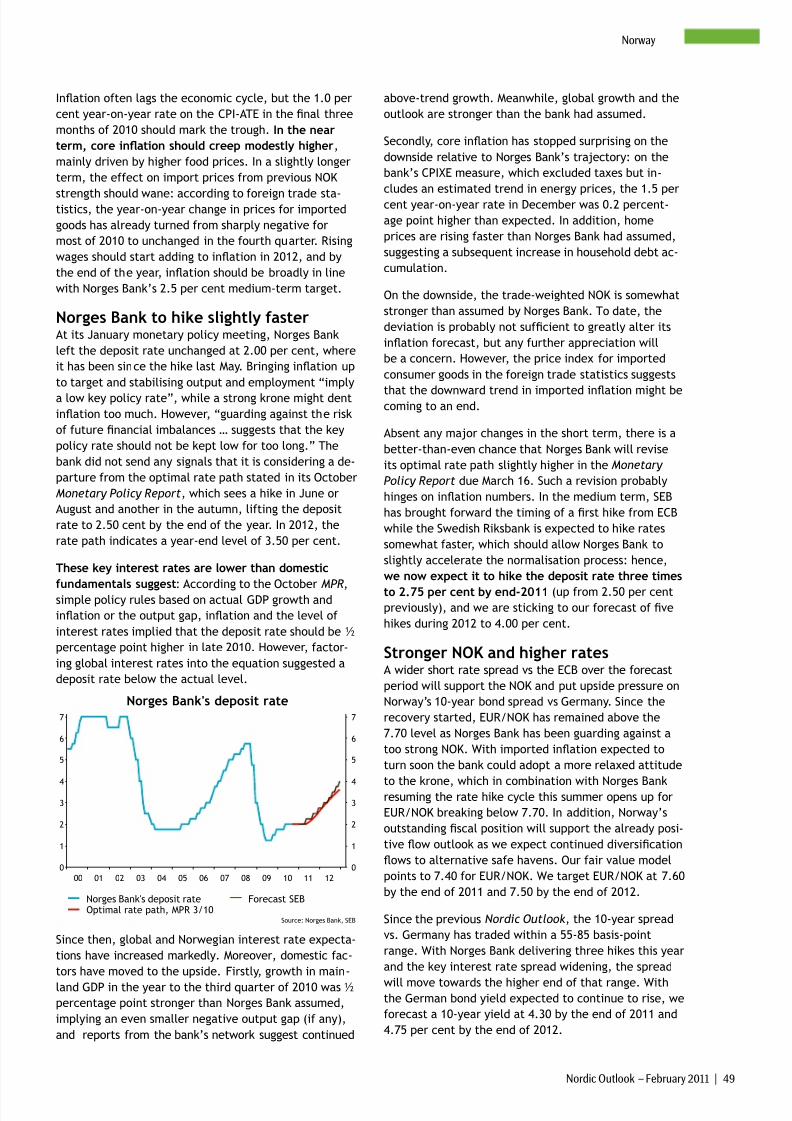
8/7/2019 SEB report: Giddy euphoria about the Swedish economy
http://slidepdf.com/reader/full/seb-report-giddy-euphoria-about-the-swedish-economy 48/55
Nordic Outlook – February 2011 | 49
Norway
Ination often lags the economic cycle, but the 1.0 per
cent year-on-year rate on the CPI-ATE in the nal three
months of 2010 should mark the trough. In the near
term, core ination should creep modestly higher,
mainly driven by higher food prices. In a slightly longer
term, the effect on import prices from previous NOK
strength should wane: according to foreign trade sta-tistics, the year-on-year change in prices for imported
goods has already turned from sharply negative for
most of 2010 to unchanged in the fourth quarter. Rising
wages should start adding to ination in 2012, and by
the end of the year, ination should be broadly in line
with Norges Bank’s 2.5 per cent medium-term target.
Norges Bank to hike slightly fasterAt its January monetary policy meeting, Norges Bank
left the deposit rate unchanged at 2.00 per cent, where
it has been since the hike last May. Bringing ination up
to target and stabilising output and employment “imply
a low key policy rate”, while a strong krone might dent
ination too much. However, “guarding against the risk
of future nancial imbalances … suggests that the key
policy rate should not be kept low for too long.” The
bank did not send any signals that it is considering a de-
parture from the optimal rate path stated in its October
Monetary Policy Report, which sees a hike in June or
August and another in the autumn, lifting the deposit
rate to 2.50 cent by the end of the year. In 2012, the
rate path indicates a year-end level of 3.50 per cent.
These key interest rates are lower than domestic
fundamentals suggest: According to the October MPR,simple policy rules based on actual GDP growth and
ination or the output gap, ination and the level of
interest rates implied that the deposit rate should be ½
percentage point higher in late 2010. However, factor-
ing global interest rates into the equation suggested a
deposit rate below the actual level.
Norges Bank's deposit rate
Norges Bank's deposit rateOptimal rate path, MPR 3/10
Forecast SEB
Source: Norges Bank, SEB
00 01 02 03 04 05 06 07 08 09 10 11 120
1
2
3
4
5
6
7
0
1
2
3
4
5
6
7
Since then, global and Norwegian interest rate expecta-
tions have increased markedly. Moreover, domestic fac-
tors have moved to the upside. Firstly, growth in main-
land GDP in the year to the third quarter of 2010 was ½percentage point stronger than Norges Bank assumed,
implying an even smaller negative output gap (if any),
and reports from the bank’s network suggest continued
above-trend growth. Meanwhile, global growth and the
outlook are stronger than the bank had assumed.
Secondly, core ination has stopped surprising on the
downside relative to Norges Bank’s trajectory: on the
bank’s CPIXE measure, which excluded taxes but in-
cludes an estimated trend in energy prices, the 1.5 per
cent year-on-year rate in December was 0.2 percent-
age point higher than expected. In addition, home
prices are rising faster than Norges Bank had assumed,
suggesting a subsequent increase in household debt ac-
cumulation.
On the downside, the trade-weighted NOK is somewhat
stronger than assumed by Norges Bank. To date, the
deviation is probably not sufcient to greatly alter its
ination forecast, but any further appreciation will
be a concern. However, the price index for imported
consumer goods in the foreign trade statistics suggests
that the downward trend in imported ination might becoming to an end.
Absent any major changes in the short term, there is a
better-than-even chance that Norges Bank will revise
its optimal rate path slightly higher in the Monetary
Policy Report due March 16. Such a revision probably
hinges on ination numbers. In the medium term, SEB
has brought forward the timing of a rst hike from ECB
while the Swedish Riksbank is expected to hike rates
somewhat faster, which should allow Norges Bank to
slightly accelerate the normalisation process: hence,
we now expect it to hike the deposit rate three times
to 2.75 per cent by end-2011 (up from 2.50 per centpreviously), and we are sticking to our forecast of ve
hikes during 2012 to 4.00 per cent.
Stronger NOK and higher ratesA wider short rate spread vs the ECB over the forecast
period will support the NOK and put upside pressure on
Norway’s 10-year bond spread vs Germany. Since the
recovery started, EUR/NOK has remained above the
7.70 level as Norges Bank has been guarding against a
too strong NOK. With imported ination expected to
turn soon the bank could adopt a more relaxed attitude
to the krone, which in combination with Norges Bankresuming the rate hike cycle this summer opens up for
EUR/NOK breaking below 7.70. In addition, Norway’s
outstanding scal position will support the already posi-
tive ow outlook as we expect continued diversication
ows to alternative safe havens. Our fair value model
points to 7.40 for EUR/NOK. We target EUR/NOK at 7.60
by the end of 2011 and 7.50 by the end of 2012.
Since the previous Nordic Outlook, the 10-year spread
vs. Germany has traded within a 55-85 basis-point
range. With Norges Bank delivering three hikes this year
and the key interest rate spread widening, the spread
will move towards the higher end of that range. Withthe German bond yield expected to continue to rise, we
forecast a 10-year yield at 4.30 by the end of 2011 and
4.75 per cent by the end of 2012.
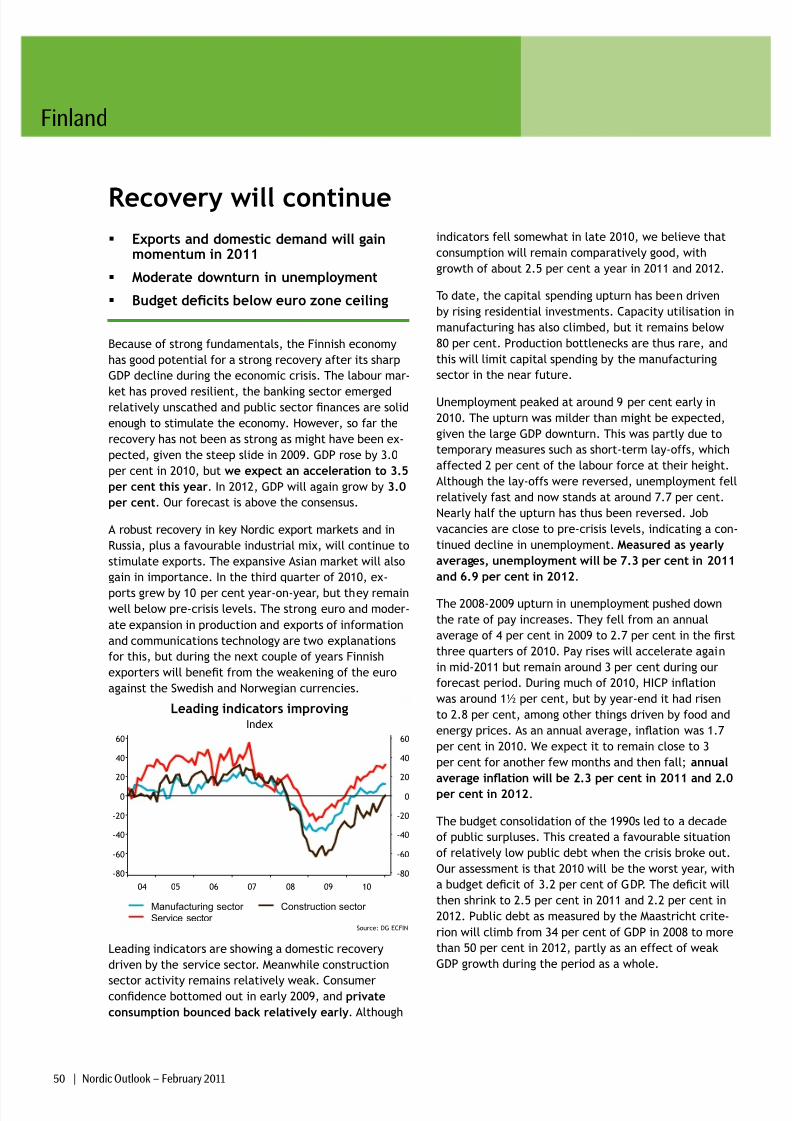
8/7/2019 SEB report: Giddy euphoria about the Swedish economy
http://slidepdf.com/reader/full/seb-report-giddy-euphoria-about-the-swedish-economy 49/55
Finland
50 | Nordic Outlook – February 2011
Recovery will continue Exports and domestic demand will gain
momentum in 2011
Moderate downturn in unemployment
Budget decits below euro zone ceiling
Because of strong fundamentals, the Finnish economy
has good potential for a strong recovery after its sharp
GDP decline during the economic crisis. The labour mar-
ket has proved resilient, the banking sector emergedrelatively unscathed and public sector nances are solid
enough to stimulate the economy. However, so far the
recovery has not been as strong as might have been ex-
pected, given the steep slide in 2009. GDP rose by 3.0
per cent in 2010, but we expect an acceleration to 3.5
per cent this year. In 2012, GDP will again grow by 3.0
per cent. Our forecast is above the consensus.
A robust recovery in key Nordic export markets and in
Russia, plus a favourable industrial mix, will continue to
stimulate exports. The expansive Asian market will also
gain in importance. In the third quarter of 2010, ex-
ports grew by 10 per cent year-on-year, but they remain
well below pre-crisis levels. The strong euro and moder-
ate expansion in production and exports of information
and communications technology are two explanations
for this, but during the next couple of years Finnish
exporters will benet from the weakening of the euro
against the Swedish and Norwegian currencies.
Index
Leading indicators improving
Manufacturing sector Service sector
Construction sector
Source: DG ECFIN
04 05 06 07 08 09 10
-80
-60
-40
-20
0
20
40
60
-80
-60
-40
-20
0
20
40
60
Leading indicators are showing a domestic recovery
driven by the service sector. Meanwhile construction
sector activity remains relatively weak. Consumercondence bottomed out in early 2009, and private
consumption bounced back relatively early. Although
indicators fell somewhat in late 2010, we believe that
consumption will remain comparatively good, with
growth of about 2.5 per cent a year in 2011 and 2012.
To date, the capital spending upturn has been driven
by rising residential investments. Capacity utilisation in
manufacturing has also climbed, but it remains below
80 per cent. Production bottlenecks are thus rare, and
this will limit capital spending by the manufacturing
sector in the near future.
Unemployment peaked at around 9 per cent early in
2010. The upturn was milder than might be expected,
given the large GDP downturn. This was partly due to
temporary measures such as short-term lay-offs, which
affected 2 per cent of the labour force at their height.
Although the lay-offs were reversed, unemployment fell
relatively fast and now stands at around 7.7 per cent.
Nearly half the upturn has thus been reversed. Job
vacancies are close to pre-crisis levels, indicating a con-
tinued decline in unemployment. Measured as yearly
averages, unemployment will be 7.3 per cent in 2011
and 6.9 per cent in 2012.
The 2008-2009 upturn in unemployment pushed down
the rate of pay increases. They fell from an annual
average of 4 per cent in 2009 to 2.7 per cent in the rst
three quarters of 2010. Pay rises will accelerate again
in mid-2011 but remain around 3 per cent during our
forecast period. During much of 2010, HICP ination
was around 1½ per cent, but by year-end it had risen
to 2.8 per cent, among other things driven by food and
energy prices. As an annual average, ination was 1.7
per cent in 2010. We expect it to remain close to 3
per cent for another few months and then fall; annual
average ination will be 2.3 per cent in 2011 and 2.0
per cent in 2012.
The budget consolidation of the 1990s led to a decade
of public surpluses. This created a favourable situation
of relatively low public debt when the crisis broke out.
Our assessment is that 2010 will be the worst year, with
a budget decit of 3.2 per cent of GDP. The decit will
then shrink to 2.5 per cent in 2011 and 2.2 per cent in
2012. Public debt as measured by the Maastricht crite-
rion will climb from 34 per cent of GDP in 2008 to more
than 50 per cent in 2012, partly as an effect of weak
GDP growth during the period as a whole.
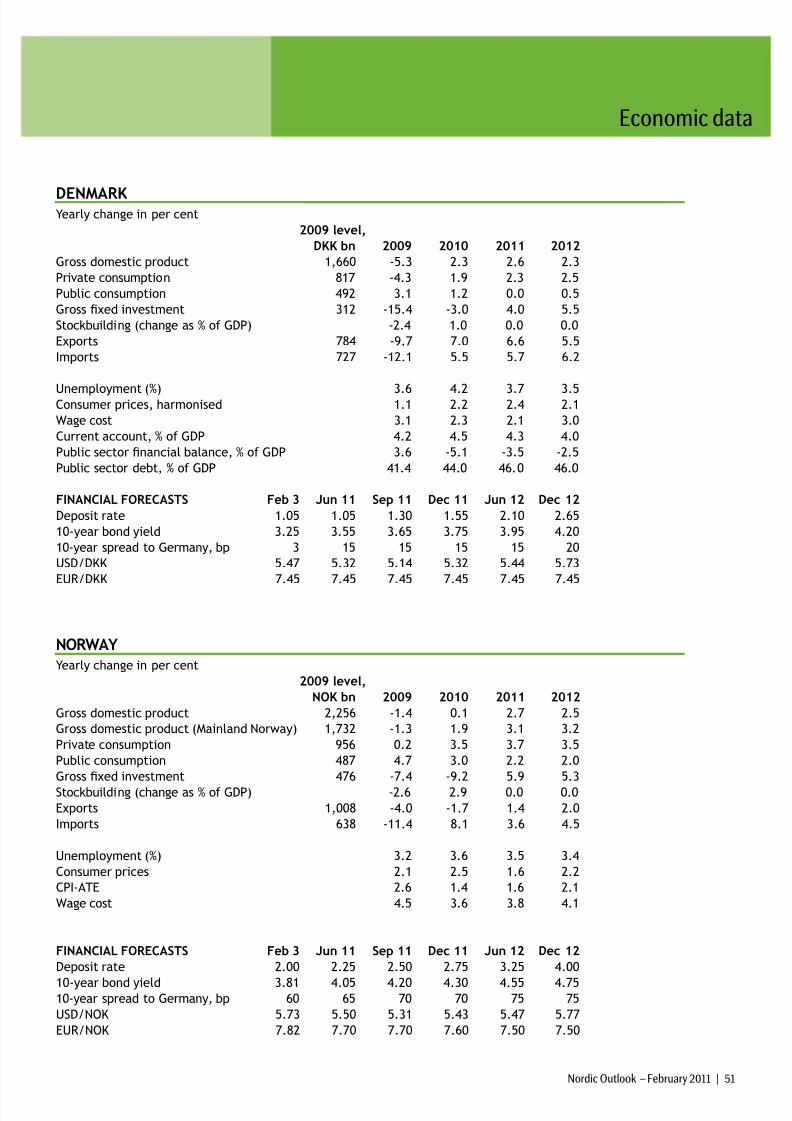
8/7/2019 SEB report: Giddy euphoria about the Swedish economy
http://slidepdf.com/reader/full/seb-report-giddy-euphoria-about-the-swedish-economy 50/55
Economic data
Nordic Outlook – February 2011 | 51
DENMARK Yearly change in per cent 2009 level,
DKK bn 2009 2010 2011 2012
Gross domestic product 1,660 -5.3 2.3 2.6 2.3
Private consumption 817 -4.3 1.9 2.3 2.5
Public consumption 492 3.1 1.2 0.0 0.5
Gross xed investment 312 -15.4 -3.0 4.0 5.5
Stockbuilding (change as % of GDP) -2.4 1.0 0.0 0.0 Exports 784 -9.7 7.0 6.6 5.5
Imports 727 -12.1 5.5 5.7 6.2
Unemployment (%) 3.6 4.2 3.7 3.5Consumer prices, harmonised 1.1 2.2 2.4 2.1
Wage cost 3.1 2.3 2.1 3.0
Current account, % of GDP 4.2 4.5 4.3 4.0
Public sector nancial balance, % of GDP 3.6 -5.1 -3.5 -2.5
Public sector debt, % of GDP 41.4 44.0 46.0 46.0
FINANCIAL FORECASTS Feb 3 Jun 11 Sep 11 Dec 11 Jun 12 Dec 12
Deposit rate 1.05 1.05 1.30 1.55 2.10 2.65
10-year bond yield 3.25 3.55 3.65 3.75 3.95 4.20
10-year spread to Germany, bp 3 15 15 15 15 20
USD/DKK 5.47 5.32 5.14 5.32 5.44 5.73
EUR/DKK 7.45 7.45 7.45 7.45 7.45 7.45
NORWAY
Yearly change in per cent 2009 level,
NOK bn 2009 2010 2011 2012
Gross domestic product 2,256 -1.4 0.1 2.7 2.5
Gross domestic product (Mainland Norway) 1,732 -1.3 1.9 3.1 3.2
Private consumption 956 0.2 3.5 3.7 3.5
Public consumption 487 4.7 3.0 2.2 2.0
Gross xed investment 476 -7.4 -9.2 5.9 5.3
Stockbuilding (change as % of GDP) -2.6 2.9 0.0 0.0 Exports 1,008 -4.0 -1.7 1.4 2.0
Imports 638 -11.4 8.1 3.6 4.5
Unemployment (%) 3.2 3.6 3.5 3.4
Consumer prices 2.1 2.5 1.6 2.2
CPI-ATE 2.6 1.4 1.6 2.1
Wage cost 4.5 3.6 3.8 4.1
FINANCIAL FORECASTS Feb 3 Jun 11 Sep 11 Dec 11 Jun 12 Dec 12
Deposit rate 2.00 2.25 2.50 2.75 3.25 4.00
10-year bond yield 3.81 4.05 4.20 4.30 4.55 4.7510-year spread to Germany, bp 60 65 70 70 75 75
USD/NOK 5.73 5.50 5.31 5.43 5.47 5.77
EUR/NOK 7.82 7.70 7.70 7.60 7.50 7.50
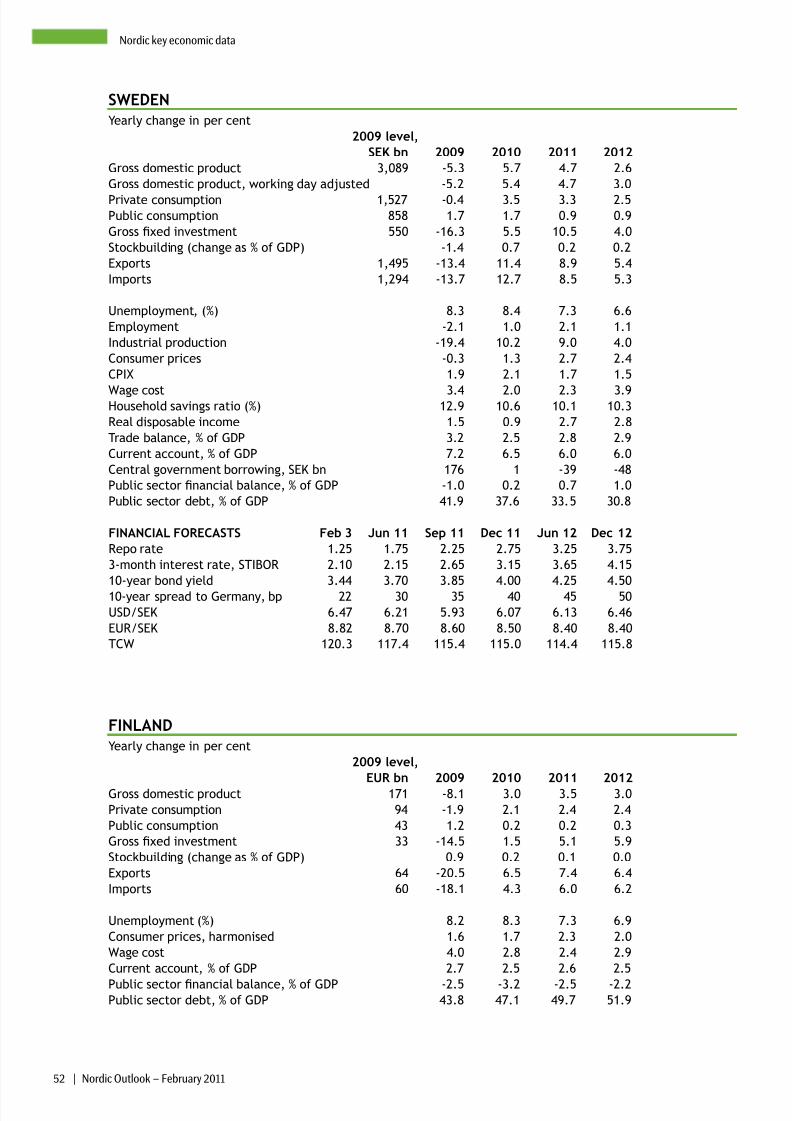
8/7/2019 SEB report: Giddy euphoria about the Swedish economy
http://slidepdf.com/reader/full/seb-report-giddy-euphoria-about-the-swedish-economy 51/55
52 | Nordic Outlook – February 2011
Nordic key economic data
SWEDEN
Yearly change in per cent 2009 level,
SEK bn 2009 2010 2011 2012
Gross domestic product 3,089 -5.3 5.7 4.7 2.6
Gross domestic product, working day adjusted -5.2 5.4 4.7 3.0
Private consumption 1,527 -0.4 3.5 3.3 2.5Public consumption 858 1.7 1.7 0.9 0.9
Gross xed investment 550 -16.3 5.5 10.5 4.0
Stockbuilding (change as % of GDP) -1.4 0.7 0.2 0.2 Exports 1,495 -13.4 11.4 8.9 5.4
Imports 1,294 -13.7 12.7 8.5 5.3
Unemployment, (%) 8.3 8.4 7.3 6.6
Employment -2.1 1.0 2.1 1.1
Industrial production -19.4 10.2 9.0 4.0
Consumer prices -0.3 1.3 2.7 2.4
CPIX 1.9 2.1 1.7 1.5
Wage cost 3.4 2.0 2.3 3.9Household savings ratio (%) 12.9 10.6 10.1 10.3
Real disposable income 1.5 0.9 2.7 2.8
Trade balance, % of GDP 3.2 2.5 2.8 2.9
Current account, % of GDP 7.2 6.5 6.0 6.0
Central government borrowing, SEK bn 176 1 -39 -48
Public sector nancial balance, % of GDP -1.0 0.2 0.7 1.0
Public sector debt, % of GDP 41.9 37.6 33.5 30.8
FINANCIAL FORECASTS Feb 3 Jun 11 Sep 11 Dec 11 Jun 12 Dec 12
Repo rate 1.25 1.75 2.25 2.75 3.25 3.75
3-month interest rate, STIBOR 2.10 2.15 2.65 3.15 3.65 4.15
10-year bond yield 3.44 3.70 3.85 4.00 4.25 4.50
10-year spread to Germany, bp 22 30 35 40 45 50
USD/SEK 6.47 6.21 5.93 6.07 6.13 6.46
EUR/SEK 8.82 8.70 8.60 8.50 8.40 8.40
TCW 120.3 117.4 115.4 115.0 114.4 115.8
FINLAND
Yearly change in per cent 2009 level,
EUR bn 2009 2010 2011 2012
Gross domestic product 171 -8.1 3.0 3.5 3.0
Private consumption 94 -1.9 2.1 2.4 2.4
Public consumption 43 1.2 0.2 0.2 0.3
Gross xed investment 33 -14.5 1.5 5.1 5.9
Stockbuilding (change as % of GDP) 0.9 0.2 0.1 0.0 Exports 64 -20.5 6.5 7.4 6.4
Imports 60 -18.1 4.3 6.0 6.2
Unemployment (%) 8.2 8.3 7.3 6.9
Consumer prices, harmonised 1.6 1.7 2.3 2.0
Wage cost 4.0 2.8 2.4 2.9
Current account, % of GDP 2.7 2.5 2.6 2.5
Public sector nancial balance, % of GDP -2.5 -3.2 -2.5 -2.2Public sector debt, % of GDP 43.8 47.1 49.7 51.9
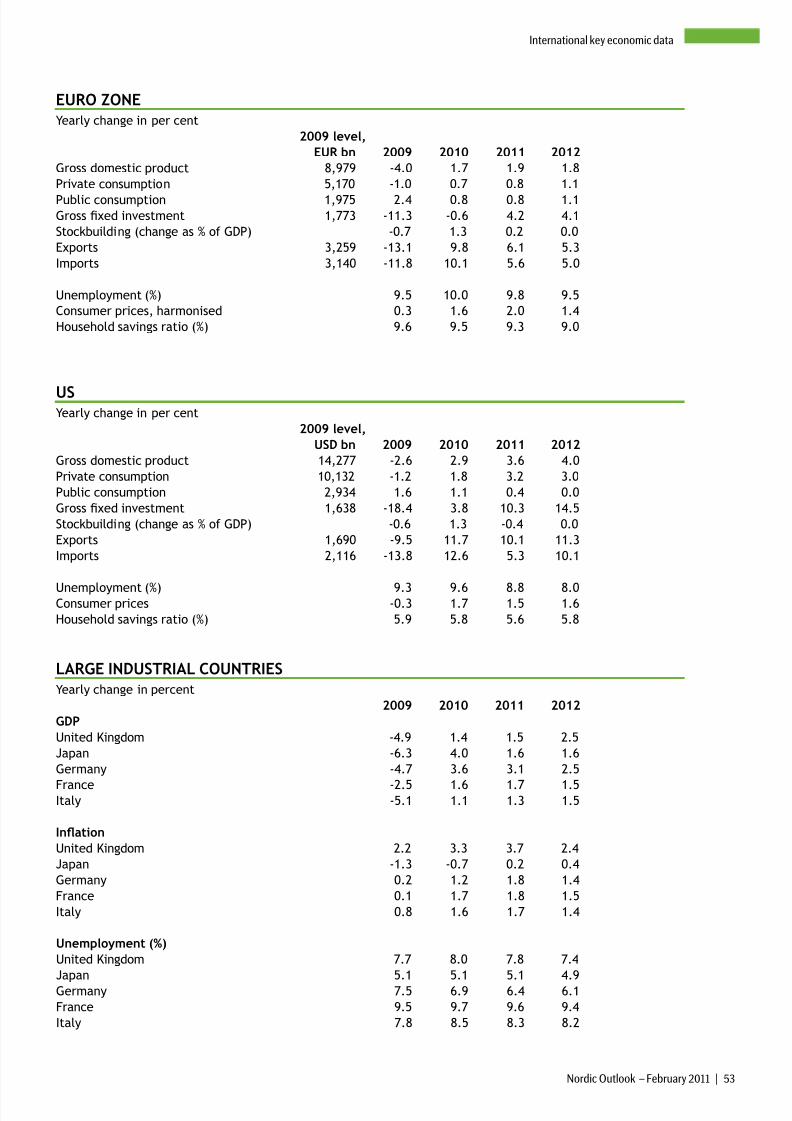
8/7/2019 SEB report: Giddy euphoria about the Swedish economy
http://slidepdf.com/reader/full/seb-report-giddy-euphoria-about-the-swedish-economy 52/55
Nordic Outlook – February 2011 | 53
International key economic data
EURO ZONE
Yearly change in per cent 2009 level,
EUR bn 2009 2010 2011 2012
Gross domestic product 8,979 -4.0 1.7 1.9 1.8
Private consumption 5,170 -1.0 0.7 0.8 1.1
Public consumption 1,975 2.4 0.8 0.8 1.1Gross xed investment 1,773 -11.3 -0.6 4.2 4.1
Stockbuilding (change as % of GDP) -0.7 1.3 0.2 0.0 Exports 3,259 -13.1 9.8 6.1 5.3
Imports 3,140 -11.8 10.1 5.6 5.0
Unemployment (%) 9.5 10.0 9.8 9.5
Consumer prices, harmonised 0.3 1.6 2.0 1.4
Household savings ratio (%) 9.6 9.5 9.3 9.0
USYearly change in per cent 2009 level,
USD bn 2009 2010 2011 2012
Gross domestic product 14,277 -2.6 2.9 3.6 4.0
Private consumption 10,132 -1.2 1.8 3.2 3.0
Public consumption 2,934 1.6 1.1 0.4 0.0
Gross xed investment 1,638 -18.4 3.8 10.3 14.5
Stockbuilding (change as % of GDP) -0.6 1.3 -0.4 0.0 Exports 1,690 -9.5 11.7 10.1 11.3
Imports 2,116 -13.8 12.6 5.3 10.1
Unemployment (%) 9.3 9.6 8.8 8.0Consumer prices -0.3 1.7 1.5 1.6
Household savings ratio (%) 5.9 5.8 5.6 5.8
LARGE INDUSTRIAL COUNTRIES
Yearly change in percent 2009 2010 2011 2012
GDP
United Kingdom -4.9 1.4 1.5 2.5
Japan -6.3 4.0 1.6 1.6
Germany -4.7 3.6 3.1 2.5
France -2.5 1.6 1.7 1.5Italy -5.1 1.1 1.3 1.5
Ination
United Kingdom 2.2 3.3 3.7 2.4
Japan -1.3 -0.7 0.2 0.4
Germany 0.2 1.2 1.8 1.4
France 0.1 1.7 1.8 1.5
Italy 0.8 1.6 1.7 1.4
Unemployment (%)
United Kingdom 7.7 8.0 7.8 7.4
Japan 5.1 5.1 5.1 4.9
Germany 7.5 6.9 6.4 6.1
France 9.5 9.7 9.6 9.4
Italy 7.8 8.5 8.3 8.2
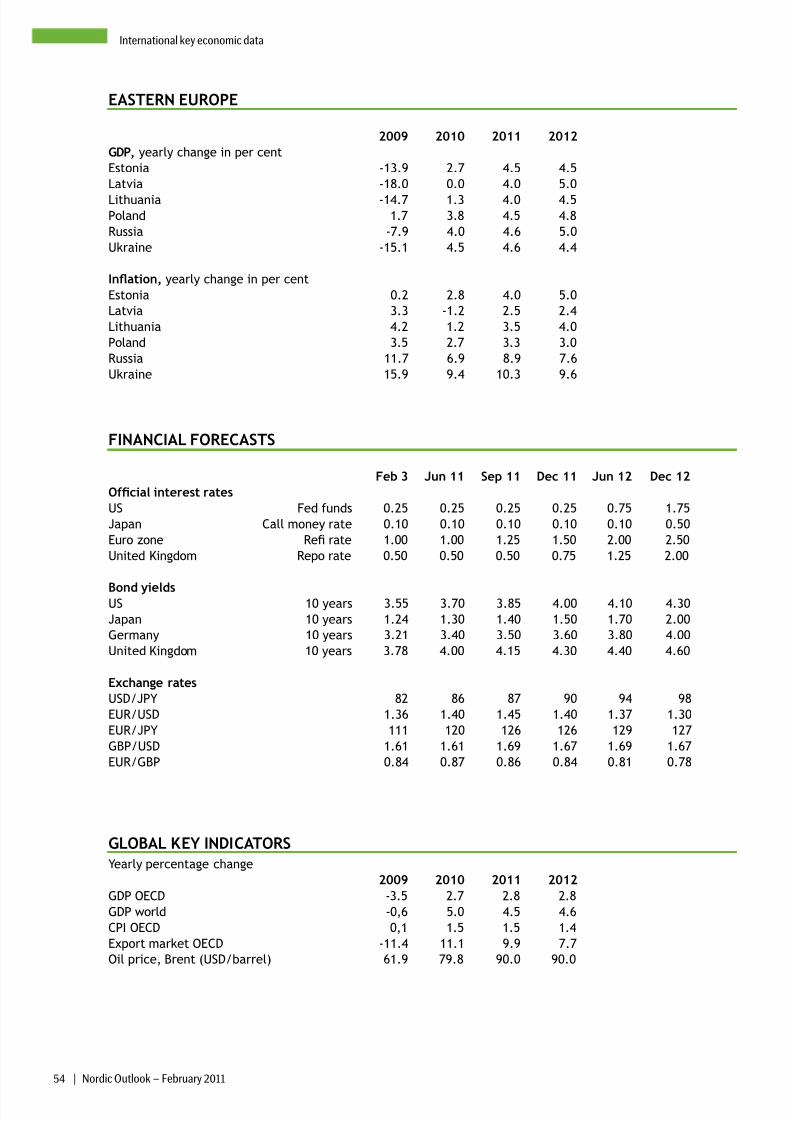
8/7/2019 SEB report: Giddy euphoria about the Swedish economy
http://slidepdf.com/reader/full/seb-report-giddy-euphoria-about-the-swedish-economy 53/55
54 | Nordic Outlook – February 2011
International key economic data
EASTERN EUROPE
2009 2010 2011 2012
GDP, yearly change in per centEstonia -13.9 2.7 4.5 4.5
Latvia -18.0 0.0 4.0 5.0
Lithuania -14.7 1.3 4.0 4.5Poland 1.7 3.8 4.5 4.8
Russia -7.9 4.0 4.6 5.0
Ukraine -15.1 4.5 4.6 4.4
Ination, yearly change in per centEstonia 0.2 2.8 4.0 5.0
Latvia 3.3 -1.2 2.5 2.4
Lithuania 4.2 1.2 3.5 4.0
Poland 3.5 2.7 3.3 3.0
Russia 11.7 6.9 8.9 7.6
Ukraine 15.9 9.4 10.3 9.6
FINANCIAL FORECASTS
Feb 3 Jun 11 Sep 11 Dec 11 Jun 12 Dec 12
Ofcial interest rates
US Fed funds 0.25 0.25 0.25 0.25 0.75 1.75
Japan Call money rate 0.10 0.10 0.10 0.10 0.10 0.50
Euro zone Re rate 1.00 1.00 1.25 1.50 2.00 2.50
United Kingdom Repo rate 0.50 0.50 0.50 0.75 1.25 2.00
Bond yieldsUS 10 years 3.55 3.70 3.85 4.00 4.10 4.30
Japan 10 years 1.24 1.30 1.40 1.50 1.70 2.00
Germany 10 years 3.21 3.40 3.50 3.60 3.80 4.00
United Kingdom 10 years 3.78 4.00 4.15 4.30 4.40 4.60
Exchange rates
USD/JPY 82 86 87 90 94 98
EUR/USD 1.36 1.40 1.45 1.40 1.37 1.30
EUR/JPY 111 120 126 126 129 127
GBP/USD 1.61 1.61 1.69 1.67 1.69 1.67
EUR/GBP 0.84 0.87 0.86 0.84 0.81 0.78
GLOBAL KEY INDICATORS
Yearly percentage change 2009 2010 2011 2012 GDP OECD -3.5 2.7 2.8 2.8
GDP world -0,6 5.0 4.5 4.6
CPI OECD 0,1 1.5 1.5 1.4
Export market OECD -11.4 11.1 9.9 7.7
Oil price, Brent (USD/barrel) 61.9 79.8 90.0 90.0

8/7/2019 SEB report: Giddy euphoria about the Swedish economy
http://slidepdf.com/reader/full/seb-report-giddy-euphoria-about-the-swedish-economy 54/55
Economic Research available on Internet.Nordic Outlook published by SEB Economic Research is available on the Internet at: www.seb.se. This page is open to
all.
To get access to all other research and trading recommendations for Merchant Banking’s customers on the Internet at
www.mb.se, a password is needed that is exclusive to these clients. If you wish to get access to this web site, please
contact Merchant Banking to receive the password.
.
This report is directed only at persons who (i) are outside the United Kingdom, (ii) have professional experience in matters rela-
ting to investments falling within article 19(5) of the Financial Services and Markets Act 2000 (Financial Promotion) Order 2005 (as
amended) (the “Order”), (iii) are persons falling within articles 49(2)(a) to (d) (“high net worth companies, unincorporated associa-
tions etc.”) of the Order or (iv) persons who are intermediate customers under chapter 4 of the FSA conduct of business rules (all
such persons being referred to as “relevant persons”).
This document does not constitute an offer or invitation to subscribe for or purchase any securities and neither this document nor
anything contained herein shall form the basis of any contract or commitment whatsoever. Recipients are urged to base their deci-
sions upon such investigations as they deem necessary.
All information contained in this report has been compiled in good faith from sources believed to be reliable. However, no repre-
sentation or warranty, express or implied, is made as to the accuracy, completeness or fairness of the information and opinions
contained in this document. In addition SEB accepts no liability whatsoever for any loss howsoever arising from any use of this do-cument or its contents or otherwise arising in connection therewith.
Your attention is drawn to the fact that a member of, or any entity associated with SEB or its afliates, ofcers, directors, employ-
ees or sharheolders of such members may from time to time have a long or short position in, or otherwise participate in the mar-
kets for, the securities and the currencies of countries mentioned herein.
Skandinaviska Enskilda Banken AB (publ) is incorporated in Stockholm, Sweden with limited liability and is a member of the Stock-
holm Stock Exchange; it is regulated by the Financial Services Authority for the conduct of designated investment business in the
UK; and is a member of the London Stock Exchange.
Transactions involving debt securities will be executed by or with the Bank unless you are informed otherwise at the time of deal-
ing.
Condentiality Notice
This report is condential and may not be reproduced or redistributed to any person other than its recipient from the Bank.
Skandinaviska Enskilda Banken AB (publ), 2011. All rights reserved.
8/7/2019 SEB report: Giddy euphoria about the Swedish economy
http://slidepdf.com/reader/full/seb-report-giddy-euphoria-about-the-swedish-economy 55/55
Beijing
Shanghai
New York
São Paulo
Singapore
Moskva
St: Petersburg
Geneve
Nice
London
Luxembourg
Warsaw
Kiev
New Delhi
Germany
Estonia
Russia
Latvia
Lithuania
Sweden
Norway
Denmark
Finland
Poland
Ukraine
Dublin
SEB is a leading Nordic nancial services group. As a relationship bank, SEB
in Sweden and the Baltic countries oers nancial advice and a wide range
o nancial services. In Denmark, Finland, Norway and Germany the bank’s
operations have a strong ocus on corporate and investment banking based on
a ull-service oering to corporate and institutional clients. The internationalnature o SEB’s business is reected in its presence in 20 countries worldwide.
On 31 December 2010, the Group’s total assets amounted to SEK 2,180bn while
its assets under management totalled SEK 1,399bn. The Group has about 17,000
employees, excluding the German retail operations. Read more about SEB at
www.sebgroup.com.
With capital, knowledge and experience, we generate value or our customers −
a task in which our research activities are highly benecial.
Macroeconomic assessments are provided by our Economic Research unit.
Based on current conditions, ofcial policies and the long-term perormance othe nancial market, the Bank presents its views on the economic situation −
locally, regionally and globally.
One o the key publications rom the Economic Research unit is the quarterly
Nordic Outlook, which presents analyses covering the economic situation in the
world as well as Europe and Sweden. Another publication is Eastern European
Outlook, which deals with the Baltics, Poland, Russia and Ukraine and appears