Embed Size (px)
Citation preview

AS SEB Pank
Annual Report (translation of the Estonian original)
2010
AS SEB Pank, Annual Report 2010
- 1 -
Contents P. P.
Statement of the Management Board______________________ 2 2. Risk policy and management_________________________________ 39
I. Introduction - general information________________________ 3 2.1. Risk policy and structure______________________________ 39
1. Credit institution_____________________________________ 3 2.2. Credit risk__________________________________________ 39
2. Auditor____________________________________________ 3 2.3. Market risk_________________________________________ 52
2.3.1. Foreign exchange risk_________________________________ 53
II. Management Report___________________________________ 4 2.3.2. Interest rate risk_____________________________________ 55
1. Credit institution's group as defined in Credit Institutions Law___ 4 2.3.3. Equity price risk_____________________________________ 57
1.1. Consolidated group_____________________________ 4 2.4. Concentration of risks________________________________ 58
1.2. Members of Management and Supervisory Board 2.5. Liquidity risk_______________________________________ 60
and shares held by them__________________________ 5 2.6. Operational risk_____________________________________ 62
1.3. Strategy and organisation_________________________ 5 2.7. Fair value of financial assets and liabilities_________________ 63
2. Highlights__________________________________________ 6 2.8. Capital management__________________________________ 65
3. Key Figures_________________________________________ 10 2.9. Internal control system________________________________ 67
2.10. Control functions____________________________________ 68
III. Consolidated Financial Statements_______________________ 12 3. Interest and similar income__________________________________ 69
1. Consolidated income statement__________________________ 12 4. Interest expenses and similar charges__________________________ 69
2. Consolidated statement of comprehensive income____________ 12 5. Fee and commission income_________________________________ 69
3. Consolidated statement of financial position_________________ 13 6. Fee and commission expense_________________________________ 70
4. Consolidated statement of cash flows______________________ 14 7. Net income from foreign exchange_____________________________ 70
5. Consolidated statement of changes in shareholders' equity______ 15 8. Gains less losses from financial assets
at fair value through profit or loss_____________________________ 70
Notes to Consolidated Financial Statements____________________ 16 9. Other income____________________________________________ 71
1. Accounting principles_________________________________ 16 10. Personnel expenses________________________________________ 71
1.1. Basis of preparation_____________________________ 16 11. Other expenses___________________________________________ 71
1.2. Critical accounting estimates and judgements__________ 16 12. Impairment losses on loans and advances_______________________ 72
1.3. Consolidation__________________________________ 18 13. Balances with central bank__________________________________ 73
1.4. Foreign currency transactions and assets and 14. Loans and advances to credit institutions_______________________ 73
liabilities denominated in a foreign currency___________ 19 15. Loans and advances to customers_____________________________ 74
1.5. Cash and cash equivalents________________________ 20 16. Financial investments______________________________________ 75
1.6. Financial assets________________________________ 21 17. Other assets_____________________________________________ 76
1.6.1. Loans and receivables___________________________ 21 18. Investments in associates___________________________________ 77
1.6.2. Financial assets at fair value through profit or loss______ 24 19. Intangible assets__________________________________________ 78
1.6.3. Available-for-sale financial assets___________________ 26 20. Property, plant and equipment________________________________ 80
1.7. Offsetting financial instruments____________________ 27 21. Investment properties______________________________________ 81
1.8. Tangible and intangible assets other than goodwill______ 27 22. Discontinued operations____________________________________ 82
1.9. Investment properties____________________________ 28 23. Due to credit institutions____________________________________ 83
1.10. Goodwill______________________________________ 29 24. Due to customers_________________________________________ 83
1.11. Discontinued operations_________________________ 29 25. Loan funds______________________________________________ 84
1.12. Impairment of non-financial assets__________________ 29 26. Other liabilities___________________________________________ 84
1.13. Leases - the group is the lessee____________________ 30 27. Financial liabilities at fair value through profit____________________ 84
1.14. Financial liabilities______________________________ 30 28. Provisions______________________________________________ 85
1.15. Embedded derivatives___________________________ 31 29. Subordinated loans________________________________________ 85
1.16. Financial guarantee contracts______________________ 32 30. Shareholders_____________________________________________ 86
1.17. Provisions____________________________________ 32 31. Dividend policy__________________________________________ 86
1.18. Revenue recognition____________________________ 32 32. Other reserves___________________________________________ 87
1.19. Dividend income_______________________________ 33 33. Contingent assets and liabilities and commitments_________________ 88
1.20. Recognition of day one profit and loss_______________ 33 34. Subsequent events________________________________________ 89
1.21. Share-based payments___________________________ 33 35. Related parties___________________________________________ 90
1.22. Taxation______________________________________ 33 36. Primary statements of parent company as a separate entity__________ 92
1.23. Fiduciary activities______________________________ 341.24. New International Financial Reporting Standards, IV. Independent Auditor's Report________________________________ 96
amendments to published standards and interpretations V. Proposal of the Management Board regarding the
by the International Financial Reporting Interpretations profit distribution_________________________________________ 98
Committee____________________________________ 34 VI. Signatures of Supervisory Board to annual report________________ 99

AS SEB Pank, Annual Report 2010
- 2 -
Statement of the Management Board Annual Report 2010 consists of the following parts and reports: Introduction – general information (page 3) Management Report (pages 4-11) Consolidated Financial Statements (pages 12-95) Independent Auditor's Report (pages 96-97) Proposal of the Management Board regarding the profit distribution (page 98). The financial and other additional information published in the Annual Report 2010 is true and complete. There is no financial or other information, missing from the Annual Report 2010, which could affect the meaning or contents of the report. Consolidated financial statements give a true and fair view of the actual financial position, results of operations and cash flows of the Group. Consolidated financial statements have been compiled in accordance with the International Financial Reporting Standards, as adopted by the European Union and as stipulated in § 17 of the Estonian Accounting Law. The Annual Report 2010 has been compiled in accordance with the requirements of Estonian laws. AS SEB Pank and subsidiaries of the consolidated group are assumed to be going concern. The audit of consolidated financial statements for the year 2010 was conducted in accordance with International Standards of Auditing. The Annual Report 2010 will be submitted for the approval to the ultimate shareholder Skandinaviska Enskilda Banken AB (publ). Previous Annual Report 2009 was approved on 22.03.2010. Members of Management Board: “_____”________________2011 ______________________ Riho Unt “_____”________________2011 ______________________ Paulius Tarbūnas “_____”________________2011 ______________________ Allan Parik “_____”________________2011 ______________________ Erki Pugal “_____”________________2011 ______________________ Eerika Vaikmäe-Koit
AS SEB Pank, Annual Report 2010
- 3 -
I. Introduction - general information
1. Credit institutionCompany name AS SEB PankAddress Tornimäe Str. 2, Tallinn 15010, EstoniaRegistered in Republic of EstoniaRegistry date 08.12.1995Registry code 10004252 (Estonian Commercial Register)Phone +372 6 655 100 Fax +372 6 655 102SWIFT EEUHEE2Xe-mail [email protected] Internet homepage http://www.seb.ee
2. AuditorAudit company AS PricewaterhouseCoopers Registry code 10142876Address Pärnu Str. 15, 10141 Tallinn, Estonia
Reporting date 31.12.2010Reporting period 01.01.2010 - 31.12.2010Reporting currency Estonian kroon (EEK), millions

AS SEB Pank, Annual Report 2010
- 4 -
II. Management Report
1. Credit institution's group as defined in Credit Institutions Law
1.1. Consolidated group
All enterprises are registered in Estonian Commercial Register. * Consolidated subsidiaries of AS SEB Liising ** Associates *** For all investments the percentage of holding equals to both, the holding from the number of shares as well as from the number of votes. Investments which were disposed in 2010 (Note 22). Parent company of the Group is AS SEB Pank, its activity is banking (information on page 3). The “consolidated group” in the meaning of Credit Institutions Law in Estonia and the “Group” for IFRS consolidation purposes are identical. Non-profit association SEB Heategevusfond is an association, not belonging to the consolidation group, registered on 06.01.2006. The founders of the association are AS SEB Pank and AS SEB Elu- ja Pensionikindlustus. The association is aimed at raising and distributing funds for charitable cause to organisations, dealing with children, who have been deprived of parental care. Upon dissolution of the association, the assets remaining after satisfaction of the claims of creditors shall be transferred to a non-profit association or foundation with similar objectives, entered to the list of associations subject to income tax incentive of the Government of the Republic, or a legal person in public law, state or local government. Non-profit association Spordiklubi United is an association, not belonging to the consolidation group, which started activity from September 2008. The association is founded by AS SEB Pank. The association is aimed at organising on hobby and competition level sport events and organising promotions for advertising of own and supporter´s activities. Upon dissolution of the association, the assets shall be transferred to a non-profit association, foundation or other persons filling the objectives by articles in public interests.
Company nameRegistry
codeReg.date Address Activity
Holding (% ) ***
At an acqui-
sition cost (EEK mio)
AS SEB Liising 10281767 03.10.97 Tallinn, Tornimäe 2 Leasing 100.0% 23.4AS SEB Kindlustusmaakler* 10723587 16.01.01 Tallinn, Tornimäe 2 Insurance brokerage 100.0% -AS Rentacar* 10303546 20.10.97 Haapsalu, Karja 27 Leasing 100.0% -
AS SEB Varahaldus 10035169 22.05.96 Tallinn, Tornimäe 2 Asset management 100.0% 42.5AS Bangalo 10088272 18.10.96 Tallinn, Tornimäe 2 Rental of computers 100.0% 5.0AS SEB Enskilda 11354037 16.02.07 Tallinn, Tornimäe 2 Financial consulting 100.0% 11.5AS Sertifitseerimiskeskus** 10747013 27.03.01 Tallinn, Pärnu mnt 12 Data communication services 25.0% 15.1OÜ TietoEnator Support ** 11065244 30.08.04 Tallinn, Roosikrantsi 11 IT consulting, programming 20.0% 0.6
98.1

AS SEB Pank, Annual Report 2010
- 5 -
Changes in the consolidated group during the accounting period and plans for year 2011 On January 28, 2010 AS SEB Pank sold 100% shares in AS SEB Elu- ja Pensionikindlustus according to the Management Board resolution from December 2009. Purchaser was SEB Trygg Liv Holding AB, a company, which belongs to the Skandinaviska Enskilda Banken AB (publ) Group (SEB Group). On February 26, 2010 AS SEB Pank sold 100% ownership in OÜ Estectus according to the Management Board resolution from December 2009. Purchaser was Warehold B.V., a company, which is located in Holland (later renamed to Baltectus B.V.) and belongs to the SEB Group. On June 17, 2010 an associate company SEB IT Partner Estonia OÜ was liquidated (35% of the shares held by AS SEB Pank). Developments in financial markets as a result of the bounce back of world economy as well the impact of even stronger regional recovery for Estonian economy in 2010 and of related expectations for 2011 are described in Note 1.2 on page 16-18. No such events or trends have occurred by the time of publishing the report, which would affect the strategy of the group in 2011. 1.2. Members of Management and Supervisory Board and shares held by them Members of the Management Board: Riho Unt, Paulius Tarbūnas, Allan Parik, Erki Pugal, Eerika Vaikmäe-Koit. Members of the Supervisory Board: Martin Johansson, Stefan Stignas, Mark Payne, Stefan Davill, Tony Kylberg. The members of AS SEB Pank Management and Supervisory Board and their confidants, as well as the commercial undertakings controlled jointly or severally by the mentioned persons did not hold any shares of AS SEB Pank as of 31.12.2010. 1.3. Strategy and organisation SEB Pank Group, a member of SEB Group, is an Estonian financial group that serves private individuals, companies and the public sector. The bank is a universal bank that offers its customers a wide range of financial services. SEB was founded in 1856 and is now one of Northern Europe’s leading financial Groups for corporate customers, institutions and private individuals with 600 branch offices in Sweden, Germany, the Baltic States, Poland, Russia and Ukraine. SEB Group customers include around 2,500 large companies and institutions, 400,000 small and medium-sized companies as well as 5 million private individuals. SEB Pank Group brings the vision of the SEB Group, which is to be the leading bank in Northern Europe based on entrepreneurship, an international presence and long-term relationships, to life in Estonia. We promise our customers a rewarding relationship and keep this promise by always taking an innovative approach.

AS SEB Pank, Annual Report 2010
- 6 -
AS SEB Pank is a leading universal bank in Estonia. We are leading within a number of areas including cash management, asset management and life insurance. AS SEB Pank acts as a Centre of Excellence within the SEB Group for Asset Management activities concerning Eastern Europe. More than 813,500 customers of SEB Pank Group are served by 1,322 employees. The customers are served through many different channels such as 47 branch offices, 284 on-line post offices, 348 ATMs, 6,133 POS-terminals. There are more than 504,700 debit and credit cards in use. In addition, over 74% of our customers use our SEB Internet Bank and SEB Internet Bank for Business services. Customer surveys during 2010 showed that SEB Pank Group is a leading bank when it comes to client satisfaction. This is a key strength of our group, a strength that we are determined to maintain. AS SEB Pank is 100% owned by ultimate shareholder Skandinaviska Enskilda Banken AB (publ) – parent company, which belongs to a financial group with a remarkable history of business. We receive a lot of support from our parent company and SEB group companies in providing our customers with even better services. In many product/service areas our owner is the strongest bank in the Nordic arena – expertise that we can draw on to serve our customers. In addition, we receive strong support in controlling and managing our risks – something that is especially important given changed economic environment in Estonia but also in our region. 2. Highlights Efficiency and development Adaption of the euro was the biggest project in the history of Estonian banking and SEB played leading role in the banking sector in order to ensure shift to euro. Conversion of the SEB’s banking system to the euro was completed successfully. All processes in SEB were transferred to the new currency and our customers were well kept. Prior the euro adoption SEB opened next-generation internet bank and homepage. In new internet Bank SEB clients have a personal chief financial officer –Financial Planner that helps keep an eye on everyday money matters. The upgrade of the e-channels will continue in the euro era as well – a new mobile bank is expected in early 2011, and a new Internet bank for business customers in early 2012. Baltic units of Swedbank, SEB, Nordea Bank and Danske Bank (Sampo Bank) commenced a cooperation project in 2010 with the aim of analysing the possibility and expediency of the creation of a common ATM network covering the entire Baltic region. The first stage of the project involves preparatory work and analysis project with the aim of investigating the commercial and technological possibility of the common ATM network. The four banks have a total of 936 ATMs in Estonia, 604 in Latvia, and 868 in Lithuania. Nord Pool Spot, the largest physical power market in the world, selected SEB as its settlement bank in Estonia. All companies trading in power market will do it through SEB.

AS SEB Pank, Annual Report 2010
- 7 -
SEB and Eesti Post have extended their partnership agreement for the operation of Post Banks in post offices all over Estonia until 31 January 2013. There are more than 350 post offices in the country providing the SEB bank services under the Post Bank trademark, the majority of which are located in rural areas. With the Post Banks, SEB's services are offered in almost 400 branches and offices around Estonia. SEB Enskilda, the leading investment bank in the Nordic countries, expanded its Baltic equity product competence in 2010 by building up special stocks team. Organisation Riho Unt was named the chairman of the Management Board of AS SEB Pank on 31 May 2010. Unt has been working with the SEB organisation for almost ten years. He joined the company in 2001 when he took up a position in the e-Technology and Operations Division. In 2004 he was promoted to deputy manager of the bank’s Tallinn office, and then in 2006 to the position of director of the Retail Banking Division. He has been a member of the Management Board of the bank since the end of 2007, responsible for the retail banking area. Since January 2010 he has been fulfilling the duties of the board’s chairman. Riho Unt was named the chairman of the Estonian Banking Association. Unt will lead Estonian Banking Association until 2012. Eerika Vaikmäe-Koit was named the member of the Management Board responsible for the retail banking area in September. The Retail Banking and Technology area is the biggest business unit within SEB, employing more than half of the bank’s staff and accounting for almost half of the bank’s volume of business. It serves around 500,000 active private clients and 34,000 small and medium-sized companies and is responsible for the development of the bank’s product portfolio as a whole. Eerika Vaikmäe-Koit has served in a variety of positions in both business and support functions in SEB since 1996. Between 2001 and 2005 she was the Deputy Manager of the Retail Banking Division, and from 2005 to 2008 she led a number of cross-border projects within the SEB Group. In 2008 she took up the post of Head of Support Units, overseeing personnel, legal, marketing and communication functions. AS SEB Pank sold all owneship of its subsidiary company OÜ Estectus to SEB Group real estate company Baltectus B.V. in 2010. AS SEB Pank sold all shares of its subsidiary company AS SEB Elu- ja Pensionikindlustus to the SEB Group’s life insurance company SEB Trygg Liv Holding AB in 2010. Customer relations and customer satisfaction The brand survey conducted by TNS Emor at the beginning of 2010 showed that SEB is the most likeable brand in the financial sector in Estonia. This is an important change as the popularity rating has always been closely tied to the size of the market share in the past.

AS SEB Pank, Annual Report 2010
- 8 -
AS SEB Pank was recognized to be the Most Attractive Employer in the financial sector in 2010 in Estonia. Also students recognized SEB as the Most Attractive Employer among financial sector in 2010 in Estonia. AS SEB Pank improved its position in companies’ awareness and image survey. In 2009 SEB was in position nr 11-13, in 2010 nr 7. A survey conducted by TNS Emor entitled “Estonia’s most customer-friendly large companies” has seen SEB voted the most customer-friendly company in the Estonian financial sector. In the overall ranking of the 29 companies included in the survey, SEB was placed second. The international market research company EPSI Baltic study on the banking sector showed that SEB customers are at the top of the overall customer satisfaction index in Estonia. SEB's result – over 80 points – is significantly higher than the average for Estonia and Europe. From private customers, SEB garnered the highest score in the product and service quality category (84-85 points), but SEB’s results in other fields also outstripped the bank’s competitors. SEB was the highest ranked company overall in the TNS Emor service quality study covering service companies from all sectors in Estonia, with a clear lead. Social responsibility and sponsorship SEB became the first bank and the first major corporation in Estonia to cover its energy needs using green energy. SEB is now purchasing over 75 per cent of its power from renewable sources of energy. A number of the bank’s buildings, such as the Tornimäe headquarters, have made a complete transition to green energy. The green energy SEB purchases are produced from 100 per cent renewable sources, primarily wind and water. We are proud to be the biggest supporter of sports in Estonia. More than 40,000 people participate in the recreational sports events sponsored by SEB and this number is growing constantly. There are more than ten big scale sport events that we are supporting. Biggest events are:
Tartu Marathon, the biggest cross-country ski marathon in Estonia. More than 6,500 skiers took part in the top skiing event of the winter in February 2010 and more than 6 million people watched the marathon on TV internationally.
SEB Tallinn Marathon, the biggest running event in Baltics. More than 10,500 runners
took part in the event in September 2010. The SEB Charity Fund helps to create better and equal opportunities for children who have lost their parents. In 2010 the MTÜ SEB Heategevusfond (Charity Fund) conducted several campaigns to raise money to support children without parental care. Since the foundation of the fund in 2006 almost 1 million euro has been raised in support of children’s shelters and safe houses all over Estonia. Our aim is to provide children who have no parental care with more equal opportunities, allowing them to feel that they are on the same level as peers raised in conventional families, to be active and to broaden their horizons. AS SEB Pank provides

AS SEB Pank, Annual Report 2010
- 9 -
the fund with 128 thousand euros in support every year. To date over 6,400 bank customers have joined us in our efforts and are making donations on a regular basis. SEB supports Estonia’s leading business plan competition ‘Ajujaht’, which is designed to contribute to the creation of new knowledge-based companies and to boost the business skills of students and young scientists. SEB is a gold sponsor of the Estonian National Opera. The cooperation between SEB and the Estonian National Opera began in 2003 when SEB became the theatre’s gold sponsor. The Estonia Theatre and SEB regularly offer people the chance to enjoy the performances of the Estonia Theatre at discounted prices and use of a special theatre bus to travel to Tallinn and back home. SEB has several co-operation projects with major Estonian universities: Tartu University and Tallinn University of Technology. In September the 46-metre brigantine Tre Kronor was visiting Tallinn. The SEB-sponsored voyage of the Tre Kronor was used to raise environmental awareness, and in particular the SEB Group’s commitment to a cleaner Baltic Sea and the good of future generations. The Tre Kronor embarked on its trip in Stockholm on 1 September and visited five ports in all three Baltic States: Klaipeda, Liepaja, Riga, Pärnu and Tallinn.

AS SEB Pank, Annual Report 2010
- 10 -
3. Key Figures(millions of EEK)
31.12.10 31.12.09Net profit/loss 853.4 -1,381.9
Average equity 7,892.2 8,147.7Return on equity (ROE), % 10.81 -16.96
Average assets 71,040.3 79,746.8Return on assets (ROA), % 1.20 -1.73
Net interest income 1,176.5 1,328.4Average interest earning assets 68,467.2 76,362.3Net interest margin (NIM), % 1.72 1.74
Credit losses adjusted net interest income/expense 1,034.1 -651.2Average interest earning assets 68,467.2 76,362.3Credit losses adjusted net interest margin, % 1.51 -0.85
Interest income 1,948.2 3,093.4Average interest earning assets 68,467.2 76,362.3Yield on interest earning assets, % 2.85 4.05
Interest expenses 771.7 1,765.0Interest bearing liabilities, average 60,966.9 68,641.8Cost of interest bearing liabilities, % 1.27 2.57
Spread, % 1.58 1.48
Cost/Income Ratio, % 49.1 72.5
Ratio of individually impaired loans, % 3.51 4.41
Explanations
Return on equity (ROE) = Net profit/Average equity * 100
Average equity = (Equity of current year end + Equity of previous year end)/2
Return on assets (ROA) = Net profit/Average assets * 100
Average assets = (Assets of current year end + Assets of previous year end)/2
Spread = Yield on interest earning assets - Cost of interest bearing liabilities
Cost/Income Ratio = Total Operating Expenses/Total Income * 100
Cost of interest bearing liabilities = Interest expenses/Average interest bearing liabilities *100
Ratio of individually impaired loans = Individually impaired loans/Loans to customers * 100
Net interest margin (NIM) = Net interest income/Average interest earning assets * 100
Yield on interest earning assets = Interest income/Average interest earning assets *100

AS SEB Pank, Annual Report 2010
- 11 -
Interest earning assets:
Balances with central bank
Loans and advances to credit institutions
(all without accrued interests)
Interest bearing liabilities:Due to credit institutionsDue to customersLoan fundsIssued debt securitiesSubordinated loans(all without accrued interests)
Total Operating Expenses:Personnel expensesOther expensesDepreciation, amortisation and impairment of tangible and intangible assets
Total Income:Net interest incomeNet fee and commission incomeNet income from foreign exchangeGains less losses from financial assets at fair value through profit or lossIncome from insurance activitiesIncome from dividendsGains less losses from investment securitiesShare of profit of associatesOther income
Assets quality(millions of EEK) 31.12.10 31.12.09
Total assets 67,683.4 74,397.1Overdue loans and receivables* 3,211.8 3,253.6Overdue/Total assets, % 4.75 4.37Allowances for losses on amounts due from customers and credit institutions 2,808.0 3,056.5
* this part of the loan principal that has become overdue
Loans and advances to customers

AS SEB Pank, Annual Report 2010
- 12 -
The notes on pages 16 - 95 are integral part of these consolidated financial statements.
III. Consolidated Financial Statements
1. Consolidated income statement(millions of EEK) Note 2010 2009
Interest and similar income 3 1,948.2 3,093.4
Interest expenses and similar charges 4 -771.7 -1,765.0
Net Interest Income 1,176.5 1,328.4
Fee and commission income 5 827.5 855.8
Fee and commission expense 6 -224.3 -253.3
Net fee and commission income 603.2 602.5
Net income from foreign exchange 7 120.5 116.5
8 -34.0 65.4
Income from dividends 0.1 1.9
16 1.4 25.3
18 0.1 0.9
Other income 9 36.3 18.5
Personnel expenses 10 -533.7 -594.5
Other expenses 11 -371.1 -545.6
19, 20 -55.3 -450.9
944.0 568.4Impairment losses on loans and advances 12 -142.4 -1,996.7
Profit/loss before income tax 801.6 -1,428.3Income tax 0.0 0.0
Net profit/loss from continued operations 801.6 -1,428.3Net profit from discontinued operations 22 51.8 46.4
Net profit/loss 853.4 -1,381.9
Profit/loss attributable to:
Sole equity holder of the parent entity (total) 853.4 -1,381.9
-Net profit/loss from continued operations 801.6 -1,428.3
-Net profit from discontinued operations 51.8 46.4
853.4 -1,381.9
2. Consolidated statement of comprehensive income2010 2009
Net profit/loss 853.4 -1,381.9
Other comprehensive income/expenseRevaluation of available-for-sale financial assets -0.6 12.0
Total other comprehensive income/expense -0.6 12.0
Total comprehensive income/expense 852.8 -1,369.9
Sole equity holder of the parent entity (total) 852.8 -1,369.9-Total comprehensive income/expense from continued operations 801.0 -1,416.3-Total comprehensive income from discontinued operations 51.8 46.4
852.8 -1,369.9
Depreciation, amortisation and impairment of tangible and intangible assets
Profit before impairment losses on loans and advances
Gains less losses from financial assets at fair value through profit or loss
Gains less losses from investment securities
Share of profit of associates

AS SEB Pank, Annual Report 2010
- 13 -
3. Consolidated statement of financial position(millions of EEK) Note 31.12.10 31.12.09
ASSETS
Cash 608.4 638.9
Balances with central bank 13 4,946.9 4,827.1
Loans and advances to credit institutions 14 4,373.7 4,633.4
Loans and advances to customers 15 56,432.0 61,846.3
Financial assets held for trading 16 342.3 366.2
Available-for-sale financial assets 16 78.8 99.6
Other assets 17 747.2 662.8
Investments in associates 18 6.7 10.1
Intangible assets 19 8.0 9.6
Property, plant and equipment 20 114.7 116.8
Investment properties 21 24.7 25.4
67,683.4 73,236.2
Assets classified as discontinued operations 22 0.0 1,160.9
TOTAL ASSETS 67,683.4 74,397.1
LIABILITIES AND SHAREHOLDERS' EQUITY
Due to credit institutions 23 22,209.0 29,786.0
Due to customers 24 33,630.0 31,824.2
Loan funds 25 208.7 188.5
Other liabilities 26 1,127.6 851.1
Financial liabilities at fair value through profit or loss 27 349.4 358.5
Provisions 28 4.1 2.6
Subordinated loans 29 1,833.7 2,615.9
59,362.5 65,626.8
Liabilities included in assets classified as discontinued operations 22 0.0 1,306.8
Total Liabilities 59,362.5 66,933.6
Share capital 30 665.6 665.6
Share premium 1,346.6 1,346.6
Other reserves 32 311.9 332.0
Retained earnings 5,996.8 5,119.3
Total shareholders' equity 8,320.9 7,463.5
TOTAL LIABILITIES AND SHAREHOLDERS' EQUITY 67,683.4 74,397.1
The notes on pages 16 - 95 are integral part of these consolidated financial statements.

AS SEB Pank, Annual Report 2010
- 14 -
The notes on pages 16 - 95 are integral part of these consolidated financial statements.
4. Consolidated statement of cash flows(millions of EEK)
Note 2010 2009
I. Cash flows from operating activities
Interest received 1,977.5 3,234.7Interest paid -834.5 -2,124.7Dividends received 0.1 1.9Fee and commission received 5 827.5 855.8Fee and commission paid 6 -224.3 -253.4Net trading income and other operating income 1,238.2 627.8Personnel expenses and other operating expenses -834.5 -899.4Revaluation adjustments -1.0 1.2
2,149.0 1,443.9
0.0 46.9
Changes in operating assets:Loans and advances to credit institutions and mandatory reserve 2,587.2 -3,683.3Loans and advances to customers 4,065.4 4,973.5Other assets 44.8 201.1
Changes of operating liabilities: 0.0 0.0Due to credit institutions -7,952.2 -5,684.0Due to customers 1,858.7 -3,129.7Loan funds 20.0 58.6Other liabilities -643.4 -183.6Cash flow from (used in) operating activities, continued operations 2,129.5 -6,003.5Cash flow from (used in) operating activities, discontinued operations 0.0 48.0
II. Cash flows from investing activities
1,085.0 348.3Proceeds from sale and liquidation of associates 18 3.4 4.9Purchase of investment properties, tangible and intangible assets 19, 20 -52.3 -68.7Proceeds from sale of investment properties, tangible and intangible assets 19, 20 30.4 2.1Cash flow from (used in) investing activities, continued operations 1,066.5 286.6Cash flow from (used in) investing activities, discontinued operations 51.8 -35.4
III. Cash flows from financing activitiesRepurchasing of debt securities -8.1 -103.4Repayments of subordinated loans -782.3 0.0Cash used in financing activities, continued operations -790.4 -103.4Cash used in financing activities, discontinued operations 0.0 0.0
Net decrease/increase in cash and cash equivalents 2,457.4 -5,807.7
Cash and cash equivalents at the beginning of period 6,342.9 12,153.1Effect of exchange rate changes on cash and cash equivalents -8.3 -2.5
Cash and cash equivalents at the end of period 8,792.0 6,342.9
Cash and cash equivalents includes: 31.12.10 31.12.09
Cash on hand 608.4 638.9Balances with the central bank without mandatory reserve 4,267.9 1,075.0Liquid deposits in other credit institutions, continued 3,894.5 4,614.4Liquid deposits in other credit institutions, discontinued 0.0 0.1Trading portfolio 21.2 14.5
8,792.0 6,342.9All cash equivalents are freely available for use by the Group with maturity of less than 3 months.
Cash flows from operating activities before changes in the operating assets and liabilities, continued operations
Cash flows from operating activities before changes in the operating assets and liabilities, discontinued operations
Net increase-/decrease+ of investment portfolio securities

AS SEB Pank, Annual Report 2010
- 15 -
The notes on pages 16 - 95 are integral part of these consolidated financial statements.
5. Consolidated statement of changes in shareholders' equity(millions of EEK)
Share capital
(Note 30)Share
premium
Other reserves (Note 32)
Translation reserve
Retained earnings
Total share-holders' equity
Year beginning 01.01.2009 665.6 1,346.6 318.9 0.0 6,500.8 8,831.9
Statutory reserve 0.0 0.0 1.1 0.0 -1.1 0.0
Net profit/loss 0.0 0.0 0.0 0.0 -1,381.9 -1,381.9
Other 0.0 0.0 0.0 0.0 1.5 1.5
Other comprehensive income:Net change in available-for-sale financial assets 0.0 0.0 12.0 0.0 0.0 12.0
Total other comprehensive income 0.0 0.0 12.0 0.0 0.0 12.0Final balance 31.12.2009 665.6 1,346.6 332.0 0.0 5,119.3 7,463.5
Year beginning 01.01.2010 665.6 1,346.6 332.0 0.0 5,119.3 7,463.5Statutory reserve 0.0 0.0 -19.5 0.0 19.5 0.0Net profit/loss 0.0 0.0 0.0 0.0 853.4 853.4Other 0.0 0.0 0.0 0.0 4.6 4.6Other comprehensive income:
Net change in available-for-sale financial assets 0.0 0.0 -0.6 0.0 0.0 -0.6
Total other comprehensive expense 0.0 0.0 -0.6 0.0 0.0 -0.6Final balance 31.12.2010 665.6 1,346.6 311.9 0.0 5,996.8 8,320.9

AS SEB Pank, Annual Report 2010
- 16 -
Note 1 ACCOUNTING PRINCIPLES AS SEB Pank (Reg. No. 10004252) is a credit institution registered in Tallinn (Estonia), Tornimäe Street 2, the sole shareholder of which is Skandinaviska Enskilda Banken AB (publ), who is also the ultimate controlling party, registered in Sweden (Note 30). As at the end of year 2010 SEB Pank Group employed 1,322 people (2009 1,444). These consolidated financial statements for the year ended 31 December 2010 have been approved for issue by the Management Board and are subject to approval by the ultimate shareholder. 1.1. Basis of preparation These consolidated financial statements of SEB Pank Group (the Group) are prepared in accordance with International Financial Reporting Standards (IFRS) as adopted by the EU. The principal accounting policies applied in the preparation of these consolidated financial statements are set out below. These policies have been consistently applied to all the years presented, unless otherwise stated. These financial statements have been prepared under the historical cost convention, except as disclosed in some of the accounting policies below (i.e. financial assets at fair value). Financial statements have been prepared according to accrual principle of accounting. The group classifies its expenses by nature of expense method. These consolidated financial statements have been prepared in millions of Estonian kroons. When the presentation or classification of items in the consolidated financial statements is amended, comparative amounts for the previous period are also reclassified, if not referred differently in specific accounting principle. Certain new standards, amendments and interpretations to existing standards have been published by the time of compiling these financial statements that are mandatory for the company’s accounting periods beginning after 1 January 2010 or later periods. The overview of these standards and the Group management estimate of the potential impact of applying the new standards and interpretations is given at the end of this section (Note 1.24). Note 1.24 gives also overview of the new IFRS standards, amendments and interpretations that became effective for the first time for these financial statements and their effect to them. 1.2. Critical accounting estimates and judgments The preparation of the consolidated financial statements in accordance with the International Financial Reporting Standards as adopted by the EU requires the use of certain critical accounting estimates and assumptions that affect the reported amounts of assets and liabilities and disclosure of contingent assets and liabilities at the date of the financial statements and the reported amounts of revenues and expenses for the reporting period. Although these estimates are based on management’s best knowledge and judgement of current events and actions, the actual outcome and the results ultimately may significantly differ from those
AS SEB Pank, Annual Report 2010
- 17 -
estimates. More detailed overview of the estimates made is provided under accounting principles or disclosures set out below. Critical estimates and judgement are specifically used in the following areas:
a) Impairment losses on loans and advances, including assessment of fair value of collateral (Note 2.2)
b) Fair value of financial assets and liabilities (Note 2.8)
Estimates and judgments are continually evaluated based on historical experience and other factors, including expectations of future events that are believed to be reasonable under these circumstances. Changes in assumptions may have a significant impact on the financial statements in the period assumptions change. Management believes that the underlying assumptions are appropriate and the Group´s financial statements therefore present the financial position and results fairly. Developments in global financial markets The world economy bounced back stronger than expected in 2010. Economic growth resumed in leading industrial countries, USA GDP expanded by 2.7% on the heels of the drop of approximately similar magnitude in 2009. From the perspective of Estonian economy it is important that regional recovery was even stronger: German economy grew by 3.6% (it dwindled by 4.7% in 2009) and Swedish by 5.0% (-5.1% in 2009.) The import growth rates of our three main export markets expanded by 20-40%, with Russian imports growing 70% in the summer. That reinvigorated in turn Estonian exports, whose growth rates beat one record after another. November's export growth rate was already close to 50% with the volume coming back to its precrisis level. Looking forward it was the decision of the Federal Reserve to buy US government long-term bonds for 600 billion dollars within the next 8 months, that would probably set the stage for future developments. The inflationary expectations related to this policy step have already lifted the US government 10-year bond yield by 100 basis points and the broad based CRB commodity price index has shot up by 25% since the summer. The return of Estonian inflation and the associated cost pressures have to be probably seen from that perspective. Impact on customers / borrowers More stable financial markets, slowdown of recession and emerging general optimism has positive impact on borrowers ability to repay the amounts owed. Management’s cash flow forecasts and assessment of the impairment of financial and non-financial assets confirm general stable outlook. To the extent that information is available, management has identified main risk position in several industries and is performing special regular observation. Management has properly reflected revised estimates of expected future cash flows in its impairment assessments. Impact on collateral (especially real estate) The amount of provision for impaired loans is based on management’s appraisals of these assets at the reporting date after taking into consideration the cash flows that may result from foreclosure less costs for obtaining and selling the collateral. The market in Estonia for many types of collateral, especially real estate, has been affected by the macroeconomic decline in Estonia and other markets resulting there being a low level of liquidity for certain types of assets. Assets experiencing temporary low market liquidity or assets potentially under

AS SEB Pank, Annual Report 2010
- 18 -
realisation have been evaluated case by case in accordance to the cash flow model approved on the Group level based on long-term discounted potential cash flow generating capability of the asset. 1.3. Consolidation These consolidated financial statements of the SEB Pank Group comprise of the financial statements of the parent company AS SEB Pank and its subsidiaries as of 31 December 2010. The subsidiaries being consolidated are listed on page 4 (see Table 1.1). In the group’s consolidated financial statements, the financial statements of the parent bank and its subsidiaries have been combined on a line-by-line basis. AS SEB Elu- ja Pensionikindlustus and OÜ Estectus are presented in the comparative period as discontinued operations (Note 1.11). Intra-group balances and intra-group transactions and unrealised gains on transactions between group companies have been eliminated in full. Unrealised losses are also eliminated unless the transaction provides evidence of impairment of the asset transferred. All the subsidiaries that are controlled by AS SEB Pank have been consolidated (AS SEB Elu- ja Pensionikindlustus and OÜ Estectus on two lines in assets and liabilities). The accounts of the subsidiaries used for consolidation have been prepared in conformity with the accounting principles of the parent company. Subsidiaries Subsidiary is an entity controlled by the parent company. Control is presumed to exist when the parent owns, directly or indirectly, more than 50% of the voting power of an enterprise or otherwise has power to govern the financial and operating policies and is able to exercise control over them in order to benefit from their activities. Subsidiaries are consolidated from the date on which control is transferred to the Group and are no longer consolidated from the date that control ceases to exist. The group uses the acquisition method of accounting to account for business combinations. The consideration transferred for the acquisition of a subsidiary is the fair values of the assets transferred, the liabilities incurred and the equity interests issued by the group. The consideration transferred includes the fair value of any asset or liability resulting from a contingent consideration arrangement. Acquisition-related costs are expensed as incurred. Identifiable assets acquired and liabilities and contingent liabilities assumed in a business combination are measured initially at their fair values at the acquisition date. On an acquisition-by-acquisition basis, the group recognises any non-controlling interest in the acquiree either at fair value or at the non-controlling interest’s proportionate share of the acquiree’s net assets. The excess of the consideration transferred, the amount of any non-controlling interest in the acquiree and the acquisition-date fair value of any previous equity interest in the acquiree over the fair value of the group’s share of the identifiable net assets acquired is recorded as goodwill (Note 1.10). If this is less than the fair value of the net assets of the subsidiary acquired in the case of a bargain purchase, the difference is recognised directly in the statement of comprehensive income. Revenues and expenses of the subsidiaries acquired within the financial year are consolidated into the Group income statement starting from the date of acquisition to the end of the

AS SEB Pank, Annual Report 2010
- 19 -
financial year. Result of operations of subsidiaries disposed of during the year is consolidated into Group income statement from the beginning of the financial year until the date of disposal. Associates Associate is an entity over which the Group has significant influence, but which it does not control. Generally, significant influence is presumed to exist when the Group holds between 20% and 50% of the voting rights. Investments in associates are initially recognised at cost. The Group’s investment in associates includes goodwill (net of any accumulated impairment loss) identified on acquisition (Note 1.10). Investments in associates are accounted for under the equity method of accounting. Under this method, the investment in Group financial statements is increased by the share of post-acquisition profit and reduced by the share of loss or distribution of profit received from the associated company and attributable to the Group and any goodwill impairment. The Group’s share of post-acquisition movements in reserves is recognised in reserves. When the Group’s share of losses in an associate equals or exceeds its interest in the associate, including any other unsecured receivables, the Group does not recognise further losses, unless it has incurred obligations or made payments on behalf of the associate. Unrealised gains on transactions between the Group and its associates are eliminated to the extent of the Group’s interest in the associates. Unrealised losses are also eliminated unless the transaction provides evidence of an impairment of the asset transferred. Accounting policies have been changed where necessary to ensure consistency with the policies adopted by the Group. Parent company separate financial statements – primary statements In the parent separate primary financial statements, disclosed to these consolidated financial statements (see Note 36), the investments into the shares of subsidiaries and associated companies are accounted for at cost less any impairment recognised. 1.4. Foreign currency transactions and assets and liabilities denominated in a foreign currency Functional currency The financial statements of the Group companies have been prepared using the currency (functional currency) which best reflects the company’s economic environment. The consolidated financial statements have been presented in Estonian kroons, which is also the functional currency of the parent company. Foreign currency transactions Foreign currency transactions have been recorded based on foreign currency exchange rates of the Bank of Estonia (Central Bank) prevailing on the transaction dates. In the case of differences in the transfer of cash (i.e. settlement) and exchange rates prevailing on the transaction date, the exchange rate differences are recorded in the income statement on the line “Net income from foreign exchange”. Assets and liabilities denominated in foreign currencies Monetary assets and liabilities and non-monetary assets and liabilities valued at fair value and denominated in foreign currencies have been translated into Estonian kroons based on the

AS SEB Pank, Annual Report 2010
- 20 -
foreign currency exchange rates of the Bank of Estonia prevailing on the reporting date. Gains and losses on translation form monetary assets and liabilities are recorded in the income statement on the line “Net income from foreign exchange”. Changes in the fair value of monetary securities denominated in foreign currency classified as available- for-sale are analysed between translation differences resulting from changes in the amortised cost of the security and other changes in the carrying amount of the security. Translation differences related to changes in the amortised cost are recognised in profit or loss as “Net income from foreign exchange”, and other changes in the carrying amount are recognised in fair value reserve in equity. Translation differences on non-monetary items, such as equities held at fair value through profit or loss, are reported as part of the fair value gain or loss on line “Gains less losses from financial assets at fair value through profit or loss”. Translation differences on non-monetary items, such as equities classified as available-for-sale financial assets, are included in the fair value reserve in equity. Group companies The results and financial position of all the Group entities (none of which has the currency of a hyperinflationary economy) that have a functional currency different from the presentation currency are translated into the presentation currency. Income statements and cash flows of foreign entities are translated into Estonian kroons at average exchange rates (unless this average is not a reasonable approximation of the cumulative effect of the rates prevailing on the transaction dates, in which case income and expenses are translated at the dates of the transactions) for the year and their statements of financial position are translated at the exchange rates ruling on 31 December 2010, the reporting date. Unrealised exchange differences arising from the translation are taken to a separate account in shareholders’ equity. 1.5. Cash and cash equivalents For the purposes of the cash flow statement, cash and cash equivalents are cash at hand, available for use deposits due from Central Bank and readily available deposits in other credit institutions and also less than 3-month maturity liquid securities acquired for trading purpose or decided to be recognised at fair value through profit or loss at inception.

AS SEB Pank, Annual Report 2010
- 21 -
1.6. Financial assets The SEB Pank Group classifies the financial instruments into classes that reflect the nature of information and take into account the characteristics of those financial instruments. The classification made can be seen in the table below: Category (as defined by IAS 39) Class (as determined by the Group)
Loans and advances to credit institutions
Housing loans Loans to individuals Other loans to Private
individuals
Loans to Corporates
Leases to Corporates
Loans and receivables Loans and advances to
customers Loans to corporate entities Loans to Public sector
Debt securities
Equity securities Financial assets held for trading
Derivatives – non-hedging
Debt securities
Financial assets at fair value through profit or loss Financial assets designated at
fair value through profit and loss Equity securities
Listed Investment securities – debt securities Unlisted
Listed
Financial assets
Available-for-sale financial assets Investment securities – equity
securities Unlisted
Financial assets are any assets that are cash, a contractual right to receive cash or another financial asset from another party, a contractual right to exchange financial instruments with another party under conditions that are potentially favourable or an equity instrument of another party. Management determines the classification of its investments at initial recognition. The SEB Pank Group has not classified any financial assets to the category “held to maturity”. 1.6.1. Loans and receivables Loans and receivables Loans and receivables are non-derivative financial assets with fixed or determinable payments that are not quoted in an active market. They arise when the SEB Pank Group provides money, goods or services directly to a debtor with no intention of trading the resulting receivable. Loans and receivables are initially recognised in the consolidated statement of financial position at fair value including any transaction costs, when the cash is paid to the borrower or right to demand payment has arisen and are derecognised only when they are repaid or written-off, regardless of the fact that part of them may be recognised as costs through providing allowances for loans. The loan allowances are presented on the respective line of

AS SEB Pank, Annual Report 2010
- 22 -
statement of financial position at negative value. Loans have been recognised in the statement of financial position at amortised cost using the effective interest rate method. Accrued interest on the loans is recorded in the respective line of statement of financial position. For overdrafts and credit cards, the actual use of the limit by the borrower is stated in the statement of financial position. The unused credit limit is recognised as loan commitment. Repurchase agreements Securities purchased under agreements to resell (“reverse repos”) are recorded as loans and advances to other banks or customers, as appropriate. The difference between sale and repurchase price is treated as interest and accrued over the life of the agreements using the effective interest method. Securities lent to counterparties are also retained in the financial statements. Leasing receivables Financial lease claims include receivables from financial lease, consumer factoring and instalment sale and agreements of payments. A financial lease is a lease transaction where all major risks and rights deriving from the use of the leased assets are transferred from the leasing firm to the lessee. Legal ownership to the property may be transferred to the lessee at the end of the lease period. The receivables from the financial lease agreements are recognised in net present value of the minimum lease payments, from which the payments of principal received have been deducted, plus unguaranteed residual value at the end of contract. Lease payments collected are allocated between repayment of principal and financial income. Financial income is recognised over the rental period based on the pattern reflecting a constant periodic rate of return on the lessor’s net investment in the financial lease. Initial service fees collected at issuance are included into the calculation of effective interest rate and lessor’s net investment. Lessor’s direct expenses, related to the contract, are part of effective interest rate and are booked as decrease of leasing income over the period of leasing contract. Allowances for lease receivables are presented on the respective line of statement of financial position at negative value. The lease receivable to the client is recognised in the statement of financial position as of the moment of delivering the assets being the object of the agreement to the client. In case of transactions, in which the assets being the object of the agreement having a long delivery term have not yet been delivered to the client, the payments received from the lessees under these agreements are recognised in the statement of financial position as prepayments of buyers in on line “Accrued expenses and deferred income”. The amounts paid by the leasing firm for the assets under lease agreements not yet delivered are recognise in the statement of financial position as prepayments to suppliers on line “Accrued income and prepaid expenses”. Factoring and warehouse receipt financing receivables Factoring transactions are considered to be financing transactions where the leasing firm provides the financial resources to its selling partners through transfer of the rights to the receivables from these sales transactions. The leasing firm acquires the right for the receivables payable by the buyer subject to the sales contract. Factoring is the transfer of receivables. Depending on the terms of the factoring contract the buyer either accepts the transfer of substantially all the risks and rewards of the ownership of

AS SEB Pank, Annual Report 2010
- 23 -
the receivable (non-recourse factoring) or retains the right to transfer the risks and rewards back to the seller during a pre-specified term (recourse factoring). Transaction is booked as financing in case the leasing company does not own all the rights related to claim. The claim is booked in statement of financial position until payment is received or recourse is expired. If contract does not include seller’s guarantee and leasing company acquires control of all rights at the moment of selling the claim, the transactions is booked as acquisition of claim in fair value. Subsequently on it is booked in acquisition cost. Derecognition of factoring assets and liabilities follows the regulation in IAS 39 and the assessment is made based on each specific agreement type and status. Warehouse receipt financing transactions are financing transactions, where the lease firm finances its partners, by granting them a loan against pledged stock reserves. Factoring and warehouse receipt financing receivables are recorded in the statement of financial position at amortised cost, from which the payments of principal claim collected have been deducted. Allowances for factoring receivables are presented on the respective line of statement of financial position at negative value. The receivable to the client is recognised as of the moment of factoring the purchase-sale agreement, i.e. as of assuming the receivable. Valuation of loans and receivables The Group assesses consistently whether there is objective evidence that a financial asset or group of financial assets is impaired. A financial asset or a group of financial assets is impaired and impairment losses are incurred only if there is objective evidence of impairment as a result of one or more events that occurred after the initial recognition of the asset (a “loss event”) and that loss event (or events) has an impact on the estimated future cash flows of the financial asset or group of financial assets that can be reliably estimated. For valuation of loans and receivables several risks are prudently considered. AS SEB Pank introduced a customer rating system for evaluating corporate loans, corresponding to the principles used in Skandinaviska Enskilda Banken AB (publ), the parent bank of AS SEB Pank. Valuation of the customer receivables is based on the legal entities financial position, situation of the industry, trustworthiness of the borrower, competence of the management of the client, timely fulfilment of contractual obligations and other factors, all of which together help to assess the value of the receivable and the amount of incurred loss in the portfolio of loans. Valuation of loans to private individuals is based on timely fulfilment of contractual obligations, solvency and collateral, age, educational status, length of employment, saving practices and other factors, affecting the credit risk. The Group first assesses whether objective evidence of impairment exists individually for financial assets that are individually significant, and individually or collectively for financial assets that are not individually significant. If the Group determines that no objective evidence of impairment exists for an individually assessed financial asset, whether significant or not, it includes the asset in a group of financial assets with similar credit risk characteristics and collectively assesses them for impairment. Assets that are individually assessed for impairment and for which an impairment loss is or continues to be recognised are not included in a collective assessment of impairment. For the purposes of a collective evaluation of impairment, financial assets are grouped on the basis of similar credit risk characteristics (i.e. on the basis of the Group’s grading process that considers asset type, industry, collateral

AS SEB Pank, Annual Report 2010
- 24 -
type, past-due status and other relevant factors). Those characteristics are relevant to the estimation of future cash flows for groups of such assets. Future cash flows in a group of financial assets that are collectively evaluated for impairment are estimated on the basis of the contractual cash flows of the assets in the Group and historical loss experience for assets with credit risk characteristics similar to those in the Group. Historical loss experience is adjusted on the basis of current observable data to reflect the effects of current conditions that did not affect the period on which the historical loss experience is based and to remove the effects of conditions in the historical period that do not currently exist. The methodology and assumptions used for estimating future cash flows are reviewed regularly by the Group to reduce any differences between loss estimates and actual loss experience. For assessment of loan losses, the expected collections from the loan and interest payments over the coming periods are considered, as well as expected collections and anticipated proceeds from the realisation of collateral, discounted at the financial asset’s original effective interest rate (excluding future credit losses that have not been incurred), which together form a recoverable amount of the loan and help to assess the amount of loss incurred of the loan. The amount of the loss is measured as the difference between the asset’s carrying amount and the present value of estimated future cash flows (recoverable amount). For these assessed incurred loan losses, the relevant allowance has been established. The carrying amount of the asset is reduced through the use of an allowance account and the amount of the loss is recognised in the income statement. Specific and collective (based on incurred loss estimation on the group basis) allowances are provided for individually assessed loans, and group based allowances for homogenous loan groups. In a subsequent period, if the amount of the impairment loss decreases and the decrease can be related objectively to an event occurring after the impairment was recognised (such as an improvement in the debtor’s credit rating), the previously recognised impairment loss is reversed by adjusting the allowance account. The amount of the reversal is recognised in the income statement in “Impairment losses on loans and advances”. When a loan is uncollectible, it is written off against the related allowance for loan impairment. Such loans are written off after all the necessary procedures have been completed and the amount of the loss has been determined. Loans that are either subject to collective impairment assessment or individually significant and whose terms have been renegotiated are no longer considered to be past due and are treated as normal loans. More detailed overview of the credit risk management principles is given in Note 2 “Risk policy and management” (see page 39). Interest income on loans is presented on the income statement on line “Interest and similar income”. 1.6.2. Financial assets at fair value through profit or loss Financial assets at fair value through profit or loss include: • financial assets held for trading • financial assets designated at fair value through profit or loss at inception

AS SEB Pank, Annual Report 2010
- 25 -
Financial assets held for trading This group of financial assets includes securities acquired or incurred principally for the purpose of selling or repurchasing in the near term or if it is part of a portfolio of identified financial instruments that are managed together and for which there is evidence of a recent actual pattern of short-term profit-taking, and derivatives. Securities acquired or incurred principally for the purpose of selling or repurchasing in the near term This group includes shares and bonds acquired for trading purpose. Trading securities are initially recognised at fair value excluding transaction costs on the trade date and are subsequently presented in fair value. The fair value of held for trading securities quoted on an active market are based on current mid-prices, because trading portfolio is maintained to enable client trading and assets and liabilities to have an offsetting market risk. The shares and debt securities not actively traded on an active market are valued in fair value according to the last quotation from an acknowledged provider with a presumption that there have been regular quotations available for the shares / debt securities and the price volatility has been in normal range for similar instruments. If the price is not available from quotations or there is no sufficient regularity of the quotations or the volatility of the instrument price quotations is outside the normal range, the shares / debt securities are revaluated into fair value based on all available information regarding the issuer to benchmark the financial instrument price against similar instruments available on active market to determine the fair value. For held for trading debt securities, for which the quoted prices from an active market are not available, cash flows are discounted at market interest rates, issuer’s risk added. For fund participations (units) NAV bid quotation is used for fair value assessment. In any case, if the market for a financial asset is not active, the Group establishes fair value by using valuation techniques. These include the use of recent arm’s length transactions, discounted cash flow analysis, and other valuation techniques commonly used by market participants. The unrealised and realised result of the trading securities is recorded in income statement under “Gains less losses from financial assets at fair value through profit or loss”. Dividend income from financial assets that are classified as held for trading, is recognised in income statement on line “Gains less losses from financial assets at fair value through profit or loss” when the entity’s right to receive payment is established. Derivatives Derivatives (forward-, swap- and option transactions) are initially recognised at fair value excluding transaction costs on the trade date and are subsequently presented at fair value. If derivatives are quoted on an active market, market value is used as a fair value. If not, the valuation techniques are used to find the fair value. These transactions are booked in the statement of financial position as assets, if their fair value is positive and as liabilities, if the fair value is negative. The fair values of derivative assets and liabilities recorded in the statement of financial position are not netted. The Group

AS SEB Pank, Annual Report 2010
- 26 -
does not apply hedge accounting principles for the accounting of derivative financial instruments. Currency forward and swap transactions are valued by discounting future cash flows using market interest rate. Respective interest income and the realised profit and unrealised gain / loss from the revaluation of derivatives is recorded in the income statement under “Gains less losses from financial assets at fair value through profit or loss”. Currency and equity options are revalued to market value, if active market exists. If a reliable market value can not be obtained, the fair value of options is calculated by using the Black-Scholes model. Financial assets designated at fair value through profit or loss at inception In this class of securities are classified securities where the company has upon initial recognition designated the securities to be recorded as at fair value through profit or loss and as a result the changes in the fair value of these securities are consistently recognised in the profit or loss of the reporting period. In the comparative reporting period this class of securities included the portfolio of investments acquired and held to cover the insurance and investment contracts concluded by the life insurance company belonging to the group, which is presented as discontinued operation in these financial statements. The realised and unrealised result from the revaluation of these securities and interest income on these instruments are recorded in the consolidated income statement on line “Profit for the year from discontinued operations”. 1.6.3. Available-for-sale financial assets Securities are classified as available-for-sale financial assets, if they do not belong to one of the aforementioned categories: financial assets held for trading or other financial assets designated at fair value through profit or loss. Available-for-sale investments are intended to be held for an indefinite period of time, which may be sold in response to needs for liquidity or changes in interest rates, exchange rates or equity prices; or investments with strategic purpose for long-term holding. Available-for-sale financial assets are recorded at fair value plus transaction costs on their settlement date. Subsequently they are carried at fair value. If the assessment of fair value is not reliable, the securities will be presented at amortised cost (i.e. original acquisition cost less possible write-downs for impairment). The gains and losses arising from changes in the fair value of available for sale financial assets are recognised in the consolidated statement of comprehensive income on line “revaluation of available-for-sale financial assets”. The Group assesses consistently whether there is objective evidence that a financial asset available-for-sale is impaired. In the case of equity investments classified as available-for- sale, a significant or prolonged decline in the fair value of the security below its cost is considered in determining whether the assets are impaired. Debt instrument is considered to be impaired when there is a change in expected cash flows to be collected from the instrument. If any such evidence exists for available-for-sale financial assets, the cumulative loss – measured as the difference between the acquisition cost and the current fair value, less any impairment loss on that financial asset previously recognised in profit or loss – is

AS SEB Pank, Annual Report 2010
- 27 -
removed from statement of comprehensive income and recognised in the income statement. Impairment losses recognised in the income statement on equity instruments are not reversed through the income statement. In a subsequent period, if the fair value of a debt instrument classified as available-for-sale increases and the increase can be objectively related to an event occurring after the impairment loss was recognised in profit or loss, the impairment loss is reversed through the income statement. When the financial asset is derecognised the cumulative gain previously recognised in statement of comprehensive income on that specific instrument is to the extent reversed from the statement of comprehensive income and the remaining portion is recognised in income statement. Interest calculated using the effective interest method and foreign currency gains and losses on monetary assets classified as available for sale are recognised in the income statement. Dividends on available-for-sale equity instruments are recognised in the income statement when the entity’s right to receive payment is established. 1.7. Offsetting financial instruments Financial assets and liabilities are offset and the net amount reported in the statement of financial position only, when there is a legally enforceable right to offset and there is an intention to settle on net basis or realise the asset and settle the liability simultaneously. 1.8. Tangible and intangible assets other than goodwill Land, buildings, IT equipment, office equipment and other assets of long-term use are recognised in the statement of financial position as tangible non-current assets. Intangible assets are identifiable, non-monetary assets without physical substance and currently comprise of acquired software. Tangible non-current assets and intangible assets are initially recognised at acquisition cost, consisting of the purchase price, non-refundable taxes and other direct costs related to taking the asset into use. The subsequent expenditure of an item of property, plant and equipment shall be recognised as an asset if these are in accordance with definition of fixed assets and if it is probable that future economic benefits associated with the item will flow to the entity. All other repairs and maintenance are charged to other operating expenses during the financial period in which they are incurred. Tangible non-current assets and intangible assets with finite useful lives are subsequently stated at historical cost less depreciation / amortisation and any impairment losses. Depreciation / amortisation is calculated starting from the month of acquisition until the carrying value reaches the residual value of the asset or if that is considered being insignificant the asset is fully depreciated. For assets having a substantial residual value, only the difference between the acquisition cost and the residual value is depreciated to expense over the useful lifetime of the asset. Assets are depreciated / amortised on straight-line basis.

AS SEB Pank, Annual Report 2010
- 28 -
Depreciation / amortisation calculation is based on useful life of the asset, which serves as basis for forming the depreciation / amortisation rates. Buildings are depreciated over 20-50 years, intangible assets with limited lifetime are amortised over 3-5 years, and other non-current tangible assets are depreciated over 3-7 years. Land is not depreciated and intangible assets with indefinite useful life are not amortised. The appropriateness of depreciation / amortisation rates, methods and residual values are each reporting date assessed. Depreciation, amortisation and impairment is recorded in the income statement on line “Depreciation, amortisation and impairment losses of tangible and intangible assets”. Gains and losses on disposals are determined by comparing proceeds with carrying amount. These are included in other operating income / expenses in the income statement. Capitalisation of expenses Reconstruction expenditures of bank offices are capitalised as tangible assets and are subsequently charged to the income statement on a straight-line basis over five or more years or over the period of the lease. Development costs Costs associated with developing or maintaining computer software programmes are recognised as an expense as incurred. Advertising expenses and the expenses for launching of new products, services and processes are recognised as an expense as incurred. Expenditures related to trademarks etc., developed by the company itself, are also recorded as expense as incurred. 1.9. Investment properties Investment properties comprise property (land, buildings, inc. subsequent costs), which is held for the purposes to earn rental income or gain from the growth in its market value (capital appreciation), and which is not occupied by the Group for its own business activities. Investment properties are initially recorded at acquisition cost, consisting of the purchase price and other direct costs related to its acquisition. Subsequently investment property is carried at cost less any accumulated depreciation and any accumulated impairment losses. Depreciation is allocated over the useful life of the asset which normally for a building is considered to be maximum 50 years. Land is considered to have an unlimited useful life and is therefore not depreciated. The appropriateness of depreciation / amortisation rates, methods and residual values are each reporting date assessed. Subsequent costs to be capitalized include improvements and costs of replacing parts of the property. Subsequent costs of day-to-day servicing are expensed as incurred. Depreciation and impairment is recorded in the income statement on line “Depreciation, amortisation and impairment losses of tangible and intangible assets”. Gains and losses on disposals are determined by comparing proceeds with carrying amount. These are included in other income / expenses in the income statement.

AS SEB Pank, Annual Report 2010
- 29 -
1.10. Goodwill Goodwill represents the excess of the cost of an acquisition over the fair value of the company’s share of the net assets acquired at the date of acquisition, reflecting the part of the acquisition cost that was paid for the assets that are not separately identifiable for the statement of financial position purposes. Goodwill acquired from acquisition of a subsidiary is recorded in statement of financial position as an intangible asset on a separate line. Goodwill acquired from acquisition of an associate is included in the cost of an associate in the statement of financial position (Note 1.3). Goodwill is recorded in the statement of financial position at the date of acquisition. Subsequently goodwill is recorded in its historical cost less any impairment losses recognised. Goodwill arising from business combinations is not depreciated. Goodwill is instead tested annually (or more frequently if events or changes in circumstances indicate that the impairment may have incurred) for impairment by comparing the carrying amount of the goodwill to its recoverable amount. Goodwill is allocated to cash-generating units for the purpose of impairment testing and the recoverable amount is determined by discounting the expected cash flows of the relevant cash generating unit. An impairment loss is recognised for the amount by which the carrying amount of the goodwill exceeds its recoverable amount. Gains and losses on the disposal of an entity include the carrying amount of goodwill relating to the entity sold. 1.11. Discontinued operations The Group presents result from discontinued operations in a separate line in the consolidated income statement if an entity or a component of an entity has been disposed of or is classified as held for sale. The single line items of assets and liabilities of the discontinued operations have been presented in the consolidated statement of financial position after elimination of inter-company balances. Net profit from discontinued operations disposed of includes the net total of operating profit and loss before tax from operations, including net gain or loss on sale before tax or measurement to fair value less costs to sell and discontinued operations tax expense. A component of an entity comprises operations and cash flows that can be clearly distinguished, operationally and for financial reporting purposes, from the rest of the Group’s operations and cash flows. Prior periods are restated in the consolidated statements for the operations (entities) classified as discontinued operations. Assets and liabilities related to discontinued operations and analysis of result of discontinued operations have been presented in a separate section (Note 22). 1.12. Impairment of non-financial assets Assets with an indefinite useful life are not subject to amortisation and are tested annually for impairment, comparing the carrying value of the asset to its recoverable value. Assets that are subject to amortisation / depreciation are reviewed for impairment whenever events or changes in circumstances indicate that the carrying amount may not be recoverable. In such circumstances the recoverable value of the asset is assessed and compared to its carrying

AS SEB Pank, Annual Report 2010
- 30 -
value. An impairment loss is recognised for the amount by which the asset’s carrying amount exceeds its recoverable amount. The recoverable amount is the higher of an asset’s fair value less costs to sell and value in use. For the purposes of assessing impairment, assets are grouped at the lowest levels for which there are separately identifiable cash flows (cash-generating units). Non-financial assets other than goodwill that suffered impairment are reviewed for possible reversal of the impairment at each reporting date. 1.13. Leases – the group is the lessee Leases of assets where the lessee acquires substantially all the risks and rewards of ownership are classified as finance leases. Other leases are classified as operating leases. Finance leases are capitalised at the inception of the lease at the lower of the fair value of the leased property or the present value of the minimum lease payments. Each lease payment is allocated between the repayment of a liability and finance charges (interest expense). The interest element of the finance cost is charged to the income statement over the lease period so as to produce a constant periodic rate of interest on the remaining balance of the liability for each period (effective interest rate method). Tangible non-current assets acquired under finance leases are depreciated similarly to acquired assets over the shorter of the useful life of the asset or the lease term. Operating lease payments are recognised in income statement as expense over the rental period on straight line basis. The Group uses operating lease mainly for renting the buildings / premises. Rental expense is recognised in income statement as “Other expenses”. 1.14. Financial liabilities The classification made can be seen in the table below:
Deposits from credit institutions and customers Deposits are recognised in the statement of financial position on their settlement date at fair value net of transaction costs and subsequently measured at amortised cost using effective interest rate method and recorded on lines “Due to credit institutions” and “Due to customers”, accrued interests is presented on a respective lines in liabilities. Interest expenses are recorded in the income statement on line “Interest expenses and similar charges”.
Corporate customers
Public sector
Private individuals
Financial liabilities held for trading (Derivatives – Non Hedging only)
Designated at fair value through profit and loss – Debt securities in issue
Off-balance sheet financial instruments
Loan commitments
Guarantees and other financial facilities
Category (as defined by IAS 39) Class (as determined by the Group)
Financial liabilities
Financial liabilities at amortised cost
Deposits from credit institutions
Deposits from customers
Debt securities in issue
Subordinated debt
Financial liabilities at fair value through profit or loss

AS SEB Pank, Annual Report 2010
- 31 -
Borrowings and issued securities Borrowings and issued securities are recognised initially at fair value net of transaction costs (the proceeds received, net of transaction costs incurred). Borrowings and issued securities are subsequently stated at amortised cost using the effective interest rate method; any difference between proceeds (net of transaction costs) and the redemption value is recognised in the income statement over the period of the instrument using effective interest rate. The effective interest rate is the rate that exactly discounts the expected stream of future cash payments through maturity. The amortisation of the transaction costs is presented in the income statement together with the interest expenses. The respective interest expenses are recorded in the income statement on line “Interest expenses and similar charges”. In case there is an unused limit for any borrowings, this is presented as contingent asset. Short-term and termination benefits to employees Short-term employee benefits are employee benefits (other than termination benefits) which fall due within twelve months after the end of the period in which the employees render the related services. Short-term employee benefits include items such as wages, salaries and social security contributions; benefits related to temporary suspension of the employment contract (such as vacation pay). Termination benefits are payable when employment is terminated by the Group before the normal retirement date, or whenever an employee accepts voluntary redundancy in exchange for these benefits. The Group recognises termination benefits when it is demonstrably committed to either: terminating the employment of current employees according to a detailed formal plan without possibility of withdrawal; or providing termination benefits as a result of another offer made to encourage voluntary redundancy. Benefits due more than 12 months after the reporting date are discounted to present value. 1.15. Embedded derivatives Embedded derivatives are usually separated from the host contract and accounted for in the same way as other derivatives (Note 1.6.2.). Embedded derivatives are not separated, if their economic characteristics and risks are closely related to the economic characteristics and risks of the host contract. However, in some circumstances also not closely related embedded derivatives may be not separated. Some combined instruments (for example structured bonds), i.e. contracts that contain one or more embedded derivatives, are classified as a financial asset or financial liability at fair value through profit or loss. This choice means that the whole combined instrument is valued at fair value and that changes in fair value are recognised in profit or loss. Other type of combined instruments (for example index-linked deposits) are separated, so that host contract is recognised as deposit and measured at amortised cost using effective interest rate method, and embedded derivatives are recognised and measured at fair value.

AS SEB Pank, Annual Report 2010
- 32 -
1.16. Financial guarantee contracts Financial guarantee contracts are contracts that require the issuer to make specified payments to reimburse the holder for a loss it incurs because a specified debtor fails to make payments when due, in accordance with the terms of a debt instrument. Such financial guarantees are given to banks, financial institutions, companies and other bodies on behalf of customers to secure loans, other banking facilities and liabilities to other parties. Financial guarantees are initially recognised in the financial statements at fair value (contract value) on the date the guarantee was given. Subsequent to initial recognition, the bank’s liabilities under such guarantees are recognised at the outstanding value of guarantee. In the income statement the fee income earned on a guarantee is recognised straight-line basis over the life of the guarantee. The amounts disbursed to settle the guarantee obligation are recognised in the statement of financial position on the date it becomes evident that the guarantee is to be disbursed. 1.17. Provisions Provisions are recognised when the company has a present legal or constructive obligation as a result of past events, it is probable that an outflow of resources will be required to settle the obligation, and a reliable estimate of the amount can be made. The provisions are recognised based on the management’s estimates regarding the amount and timing of the expected outflows. When it is probable that the provision is expected to realise later than 12 months after the reporting date it is recorded at discounted value (present value of expected outflows), unless the discounting effect is immaterial. Expense from provisions and from change in carrying value of provisions is recorded in the income statement for the period. 1.18. Revenue recognition Interest income and expense Interest income and expense is recognised in income statement for all interest-bearing financial instruments carried at amortised cost using the effective interest rate method. Interest income includes also similar income on interest bearing financial instruments classified at fair value through profit or loss (i.e. traded bonds etc). The effective interest method is a method of calculating the amortised cost of a financial asset or a financial liability and of allocating the interest income or interest expense over the relevant period. The effective interest rate is the rate that exactly discounts estimated future cash payments or receipts through the expected life of the financial instrument to the net carrying amount of the financial asset or financial liability. When calculating the effective interest rate, the Group estimates cash flows considering all contractual terms of the financial instrument, but does not consider future credit losses. The calculation includes all significant fees paid or received between parties to the contract that are an integral part of the effective interest rate, transaction costs and all other premiums or discounts.

AS SEB Pank, Annual Report 2010
- 33 -
Once a financial asset or a group of similar financial assets has been written down as a result of an impairment loss, interest income is recognised using the rate of interest used to discount the future cash flows for the purpose of measuring the impairment loss. Fee and commission income Revenue is recognised in the fair value of the consideration received or receivable for the services provided in the ordinary course of the Group’s activities. Fees and commissions are generally recognised on an accrual basis when the service has been provided. Credit issuance fees for loans / leases that, are deferred and recognised as an adjustment to the effective interest rate on the credit. Portfolio management and other advisory service fees, as well as wealth management and custody service fees are recognised based on the applicable service contracts, usually on an accrual basis. Asset management fees related to management of investment funds are recognised over the period the service is provided. Performance linked fees or fee components are recognised when the performance criteria are fulfilled. Other transaction fee income and other income are recognised on accrual basis at the moment of executing the respective transactions. 1.19. Dividend income Dividends are recognised in the income statement when the entity’s right to receive payment is established. 1.20. Recognition of day one profit and loss The best evidence of fair value at initial recognition is the transaction price (i.e. the fair value of the consideration given or received), unless the fair value of that instrument is evidenced by comparison with other observable current market transactions in the same instrument (i.e. without modification or repackaging) or based on a valuation technique whose variables include only data from observable markets. Profits on day one can be recognised when a valuation technique is used whose variables include data from observable markets. In other circumstances the day one profit is deferred over the life of transaction. The timing of recognition of deferred day one profit and loss is determined individually. It is either amortised over the life of the transaction, deferred until the instrument’s fair value can be determined using market observable inputs, or realised through settlement. The financial instrument (separated embedded derivative) is subsequently measured at fair value, adjusted for the deferred day one profit and loss. Subsequent changes in fair value are recognised immediately in the income statement without reversal of deferred day one profits and losses. 1.21. Share-based payments Group employees receive compensation through share-based incentive programmes, based on Skandinaviska Enskilda Banken AB (publ) shares. The programmes, now referred to, are the Performance Share Programme, Employee Stock Option and the Share Savings Programmes. The bookings for expenses related to these programmes and accrued social charges, if

AS SEB Pank, Annual Report 2010
- 34 -
applicable, are made accordingly. The allocation of this amount implies that profit and loss are impacted at the same time as the corresponding increase in equity is recognised. The Group engages in equity settled share-based payment transactions in respect of services received from certain of its employees. The fair value of the services received is measured by reference to the fair value of the shares or share options granted on the date of the grant. The cost of the employee services received in respect of the shares or share options granted is recognised in the consolidated income statement over the period that the services are received, which is the vesting period. 1.22. Taxation Corporate income tax According to the Income Tax Act, the annual profit earned by enterprises is not taxed in Estonia and thus there are no temporary differences between the tax bases and carrying values of assets and liabilities and no deferred tax assets or liabilities arise. Instead of taxing the net profit, the distribution of retained earnings is subject to the taxation at the rate of 21/79 on the amount paid out as net dividends. The corporate income tax arising from the payment of dividends is accounted for as an expense in the period when dividends are declared, regardless of the actual payment date or the period for which the dividends are paid. In Estonia income tax (that is accounted for as income tax cost in P&L) is accounted for only in cases when the taxable event occurs (like payment of dividends and payments decreasing the equity). Because of the specifics of the Estonian tax system permanent and temporary differences are not accounted for and thus effective income tax is not currently accounted for as well. 1.23. Fiduciary activities The Group provides asset management services and offers fund management services. The assets owned by third parties, but managed by the Group, and income arising thereon, are excluded from these financial statements, as they are not assets of the Group. 1.24. New International Financial Reporting Standards, amendments to published standards and interpretations by the International Financial Reporting Interpretations Committee Certain new or revised standards and interpretations became effective for the Group from 1 January 2010 IFRS 3, Business Combinations, revised in January 2008 The revised IFRS 3 allows entities to choose to measure non-controlling interests using the existing IFRS 3 method (proportionate share of the acquiree’s identifiable net assets) or at fair value. The revised IFRS 3 is more detailed in providing guidance on the application of the purchase method to business combinations. The requirement to measure at fair value every asset and liability at each step in a step acquisition for the purposes of calculating a portion of goodwill has been removed. Instead, in a business combination achieved in stages, the acquirer has to remeasure its previously held equity interest in the acquiree at its acquisition-date fair value and recognise the resulting gain or loss, if any, in profit or loss for the year. Acquisition-related costs are accounted for separately from the business combination and therefore recognised as

AS SEB Pank, Annual Report 2010
- 35 -
expenses rather than included in goodwill. An acquirer has to recognise at the acquisition date a liability for any contingent purchase consideration. Changes in the value of that liability after the acquisition date are recognised in accordance with other applicable IFRSs, as appropriate, rather than by adjusting goodwill. The revised IFRS 3 brings into its scope business combinations involving only mutual entities and business combinations achieved by contract alone. The revised IFRS 3 did not have a material impact on these financial statements.
Amendment to IFRS 5, Non-current Assets Held for Sale and Discontinued Operations (and consequential amendments to IFRS 1 This amendment to IFRS 5 is part of the IASB’s annual improvements project published in May 2008. The amendment clarifies that an entity committed to a sale plan involving loss of control of a subsidiary would classify the subsidiary’s assets and liabilities as held for sale. The revised guidance should be applied prospectively from the date at which the entity first applied IFRS 5. The amendment did not have a material impact on these financial statements.
Group Cash-settled Share-based Payment Transactions - Amendments to IFRS 2 The amendments provide a clear basis to determine the classification of share-based payment awards in both consolidated and separate financial statements. The amendments incorporate into the standard the guidance in IFRIC 8 and IFRIC 11, which are withdrawn. The amendments expand on the guidance given in IFRIC 11 to address plans that were previously not considered in the interpretation. The amendments also clarify the defined terms in the Appendix to the standard. The amendments did not have a material impact on these financial statements.
Certain new or revised standards and interpretations became effective for the Group from 1 January 2010 , but are not relevant to the Group IFRIC 12, Service Concession Arrangements The interpretation contains guidance on applying the existing standards by service providers in public-to-private service concession arrangements.
IFRIC 15, Agreements for the Construction of Real Estate The interpretation applies to the accounting for revenue and associated expenses by entities that undertake the construction of real estate directly or through subcontractors, and provides guidance for determining whether agreements for the construction of real estate are within the scope of IAS 11 or IAS 18. It also provides criteria for determining when entities should recognise revenue on such transactions.
Embedded Derivatives - Amendments to IFRIC 9 and IAS 39, issued in March 2009 The amendments clarify that on reclassification of a financial asset out of the ‘at fair value through profit or loss’ category, all embedded derivatives have to be assessed and, if necessary, separately accounted for.
IFRIC 16, Hedges of a Net Investment in a Foreign Operation The interpretation explains which currency risk exposures are eligible for hedge accounting and states that translation from the functional currency to the presentation currency does not create an exposure to which hedge accounting could be applied.
IFRIC 17, Distributions of Non-Cash Assets to Owners The interpretation clarifies when and how distribution of non-cash assets as dividends to the owners should be recognised. An

AS SEB Pank, Annual Report 2010
- 36 -
entity should measure a liability to distribute non-cash assets as a dividend to its owners at the fair value of the assets to be distributed. A gain or loss on disposal of the distributed non-cash assets is recognised in profit or loss for the year when the entity settles the dividend payable.
IFRIC 18, Transfers of Assets from Customers The interpretation clarifies the accounting for transfers of assets from customers, namely, the circumstances in which the definition of an asset is met; the recognition of the asset and the measurement of its cost on initial recognition; the identification of the separately identifiable services (one or more services in exchange for the transferred asset); the recognition of revenue, and the accounting for transfers of cash from customers.
Classification of Rights Issues - Amendment to IAS 32, issued in October 2009 The amendment exempts certain rights issues of shares with proceeds denominated in foreign currencies from classification as financial derivatives.
IAS 27, Consolidated and Separate Financial Statements, revised in January 2008 The revised IAS 27 requires an entity to attribute total comprehensive income to the owners of the parent and to the non-controlling interests (previously “minority interests”) even if this results in the non-controlling interests having a deficit balance (the previous standard required the excess losses to be allocated to the owners of the parent in most cases).
Eligible Hedged Items - Amendment to IAS 39 The amendment clarifies how the principles that determine whether a hedged risk or portion of cash flows is eligible for designation should be applied in particular situations.
IFRS 1, First-time Adoption of International Financial Reporting Standards, revised in December 2008 The revised IFRS 1 retains the substance of its previous version but within a changed structure in order to make it easier for the reader to understand and to better accommodate future changes.
Additional Exemptions for First-time Adopters - Amendments to IFRS 1 The amendments provide an additional exemption for measurement of oil and gas assets and also exempt entities with existing leasing contracts from reassessing the classification of those contracts in accordance with IFRIC 4, 'Determining Whether an Arrangement Contains a Lease' when the application of their national accounting requirements produced the same result.
Improvements to International Financial Reporting Standards, issued in April 2009 The improvements consist of a mixture of substantive changes and clarifications in the following standards and interpretations: IFRS 2; IAS 38; IFRIC 9; IFRIC 16; IFRS 5; IFRS 8; IAS 1; IAS 7; IAS 17; IAS 36; IAS 39.
Certain new or revised standards and interpretations have been published that are mandatory for the Group’s accounting periods beginning on or after 1 January 2011 or later periods and which the Group has not early adopted
IFRS 9, Financial Instruments Part 1: Classification and Measurement (effective for annual periods beginning on or after 1 January 2013; not yet adopted by the EU). IFRS 9 issued in November 2009 replaces those parts of IAS 39 relating to the classification and measurement of financial assets. IFRS 9 was further amended in October 2010 to address the classification and measurement of financial liabilities. Key features are as follows:

AS SEB Pank, Annual Report 2010
- 37 -
Financial assets are required to be classified into two measurement categories: those to be measured subsequently at fair value, and those to be measured subsequently at amortised cost. The decision is to be made at initial recognition. The classification depends on the entity’s business model for managing its financial instruments and the contractual cash flow characteristics of the instrument.
An instrument is subsequently measured at amortised cost only if it is a debt instrument and both (i) the objective of the entity’s business model is to hold the asset to collect the contractual cash flows, and (ii) the asset’s contractual cash flows represent only payments of principal and interest (that is, it has only “basic loan features”). All other debt instruments are to be measured at fair value through profit or loss.
All equity instruments are to be measured subsequently at fair value. Equity instruments that are held for trading will be measured at fair value through profit or loss. For all other equity investments, an irrevocable election can be made at initial recognition, to recognise unrealised and realised fair value gains and losses through other comprehensive income rather than profit or loss. There is to be no recycling of fair value gains and losses to profit or loss. This election may be made on an instrument-by-instrument basis. Dividends are to be presented in profit or loss, as long as they represent a return on investment.
Most of the requirements in IAS 39 for classification and measurement of financial liabilities were carried forward unchanged to IFRS 9. The key change is that an entity will be required to present the effects of changes in own credit risk of financial liabilities designated as at fair value through profit or loss in other comprehensive income.
The Group is considering the implications of the standard, the impact on the Group and the timing of its adoption by the Group.
New or revised standards and interpretations that are not yet effective and not early adopted by the Group, and not expected to have a significant effect on the Group’s financial statements
Amendment to IAS 24, Related Party Disclosures, issued in November 2009 (effective for annual periods beginning on or after 1 January 2011). The amended standard simplifies the disclosure requirements for.
IFRIC 19, Extinguishing Financial Liabilities with Equity Instruments (effective for annual periods beginning on or after 1 July 2010). This IFRIC clarifies the accounting when an entity renegotiates the terms of its debt with the result that the liability is extinguished through the debtor issuing its own equity instruments to the creditor. A gain or loss is recognised in the profit and loss account based on the fair value of the equity instruments compared to the carrying amount of the debt.
Prepayments of a Minimum Funding Requirement – Amendment to IFRIC 14 (effective for annual periods beginning on or after 1 January 2011). This amendment will have a limited impact as it applies only to companies that are required to make minimum funding contributions to a defined benefit pension plan. It removes an unintended consequence of IFRIC 14 related to voluntary pension prepayments when there is a minimum funding requirement.

AS SEB Pank, Annual Report 2010
- 38 -
Limited exemption from comparative IFRS 7 disclosures for first-time adopters - Amendment to IFRS 1 (effective for annual periods beginning on or after 1 July 2010). Existing IFRS preparers were granted relief from presenting comparative information for the new disclosures required by the March 2009 amendments to IFRS 7 'Financial Instruments: Disclosures'. This amendment to IFRS 1 provides first-time adopters with the same transition provisions as included in the amendment to IFRS 7.
Improvements to International Financial Reporting Standards, issued in May 2010 (effective dates vary standard by standard, most improvements are effective for annual periods beginning on or after 1 January 2011; the improvements have not yet been adopted by the EU). The improvements consist of a mixture of substantive changes and clarifications in the following standards and interpretations: IFRS 1; IFRS 3; IFRS 7; IAS 1; IAS 27; IAS 21; IAS 28; IAS 31; IAS 34; IFRIC 13.
Disclosures-Transfers of Financial Assets - Amendments to IFRS 7 (effective for annual periods beginning on or after 1 July 2011; not yet adopted by the EU). The amendment requires additional disclosures in respect of risk exposures arising from transferred financial assets. The amendment includes a requirement to disclose by class of asset the nature, carrying amount and a description of the risks and rewards of financial assets that have been transferred to another party yet remain on the entity's balance sheet. Disclosures are also required to enable a user to understand the amount of any associated liabilities, and the relationship between the financial assets and associated liabilities. Where financial assets have been derecognised but the entity is still exposed to certain risks and rewards associated with the transferred asset, additional disclosure is required to enable the effects of those risks to be understood.
Deferred Tax: Recovery of Underlying Assets - Amendment to IAS 12 (effective for annual periods beginning on or after 1 January 2012; not yet adopted by the EU). The amendment introduces an exception to the existing principle for the measurement of deferred tax assets or liabilities arising on investment property measured at fair value.
Severe hyperinflation and removal of fixed dates for first-time adopters – Amendment to IFRS 1 (effective for annual periods beginning on or after 1 July 2011; not yet adopted by the EU). The amendments will provide relief for first-time adopters of IFRSs from having to reconstruct transactions that occurred before their date of transition to IFRSs, and guidance for entities emerging from severe hyperinflation either to resume presenting IFRS financial statements or to present IFRS financial statements for the first time.
The Group has not early adopted any of the new or amended standards in 2010.

AS SEB Pank, Annual Report 2010
- 39 -
2. Risk policy and management 2.1. Risk policy and structure Managing risk is a core activity in a bank and therefore fundamental to long-term profitability and stability. Risk is closely related to business activities and business development and, therefore, to customer needs. Of the various risks that SEB assumes in providing its customers with financial solutions and products, credit risk is the most significant. SEB’s profitability is directly dependent upon its ability to evaluate, manage and price the risks encountered, while maintaining an adequate capitalization to meet unforeseen events. To secure the Group’s financial stability, risk and capital-related issues are identified, monitored and managed at an early stage. They also form an integral part of the long-term strategic planning and operational business planning processes performed throughout the Group. AS SEB Pank defines risk as the possibility of a negative deviation from an expected financial outcome. Risk management includes all activities relating to risk-taking, risk mitigation, risk analysis, risk control and follow-up. Independent risk control comprises the identification, measurement, monitoring, stress testing, analysis, reporting and follow-up of risks, separate from the risk-taking functions. The risks arising from financial instruments to which the Group is exposed are financial risks, which include credit risk, liquidity risk, market risk and operational risk (which are discussed below). The Management Board is responsible for establishing the main principles for management, control and co-ordination of all risks of AS SEB Pank and to decide on the limits for the various risks. Subordinated to the Management Board are established different committees with mandates to make decisions depending upon the type of risk. Board supervision, an explicit decision-making structure, a high level of risk awareness among staff, common definitions and principles and controlled risk-taking within established limits are the cornerstones of SEB’s risk and capital management. Risk management and control is a prioritised area for the Group, continuously under development. Since 2008 AS SEB Pank holds supervisory approvals to use its internal models for calculating regulatory capital: Internal Rating Based (IRB) approach for credit risk and Advanced Measurement Approach (AMA) for operational risk. During last years, the main development focus of risk management has been continuous improvement of implemented Basel II models and starting preparations for the new regulatory regime – Basel III. In 2010 one of the most important development projects started was remodelling of retail credit risk scoring models to replace current expert judgment based models with regression models. In the market risk control area preparations were made to change over to the new enhanced SEB Group’s VaR model (ARMS). 2.2. Credit risk Assets exposed to credit risk are receivables from customers, receivables from credit institutions and debt securities and derivatives. Credit risk is a potential loss that may occur in

AS SEB Pank, Annual Report 2010
- 40 -
case of improper fulfilment or non-compliance of the client with the contractual obligations as a result of failure of the client’s business operations or other factors. Credit risk is the single largest risk for the Group’s business; management therefore carefully manages its exposure to credit risk. The principles for measuring and taking credit risk are established with the SEB Pank Group credit policy. The principles of credit policy are the following: a) lending should be in line with credit policy; b) lending should be based upon analysis; c) the basis of all lending activity is credibility; d) the purpose of the credit should be fully understood; e) lending must be in proportion to the capacity to repay; f) borrower should have an identified source of repayment and also a secondary source for
repaying the loan; g) the own (equity) investment of the borrower must be significant in relationship to the loan; h) lending activity shall take into account any potential adverse effects in the business cycle; i) lending shall be in line with the bank’s profit goals. Credit risk analysis related to a certain client involves several different activities, like evaluation of the risk of the borrower’s background, structure, management and owner, industry and position of the borrower in that industry, economic environment and position of the borrower, analysis and evaluation of the business plan and submitted cash flow prognosis; evaluation of the reputation, reliability and credit history of the client. Deciding on the risk taking is performed collegially by credit committees and by the authorised persons in accordance with the decision-making limits established by the bank’s management. Deciding on the risk taking in debt securities is part of general credit decision making process. Limit for investing into certain issuer’s debt securities has to be approved by relevant credit committee or by the authorised persons. Normally AS SEB Pank is not taking investment positions, including credit risk bearing positions in debt securities, excluding limited volume of trading portfolio, which is regulated by trading portfolio total limit established by the Assets and Liabilities Committee (ALCO). Credit risk related to debt securities is considered low in volume and has therefore not been discussed in detail below. AS SEB Pank enters into derivatives contracts primarily to offer clients products for management of their financial exposures, and then manages the resulting positions by entering offsetting contracts with the parent company. Positive market values in derivatives contracts imply a credit exposure on the counterparty; to reflect also future uncertainty in market conditions, a credit risk equivalent is calculated. Credit risk related to derivatives has not been assessed significant and not discussed in further detail below. So we concentrate on credit risk arising from loans and receivables from customers and credit institutions (other banks). Credit risk measurement The prime credit risk measure of AS SEB Pank is defined as the maximum potential loss over a certain time horizon at a certain level of confidence. Credit risk is being quantified monthly using the following components: Probability of Default (PD), Exposure At Default (EAD) and Loss Given Default (LGD) or the aggregate measure Risk Weighted Assets (RWA).

AS SEB Pank, Annual Report 2010
- 41 -
Having estimated PD, EAD and LGD it is possible to calculate expected loss and unexpected loss. Expected loss (EL) can be interpreted as the “normal level” of credit losses and shall be considered as a cost of doing business from a risk point of view. Thus it shall be covered through transaction pricing and risk reserves. Appropriate efforts shall be made to minimise expected losses through ensuring sound internal practices and good internal controls. Unexpected losses (UL) are commonly referred to as the unusual and large credit losses and are not foreseen to be completely absorbed by day to day transaction profits. The primary protections against such losses are sound internal practices, good internal controls, insurance policies and earnings. The last loss-absorbing resource for unexpected losses is the capital of AS SEB Pank. PD is a measure of probability of default of a given counterparty risk class during the next year, through it’s risk classification, pooling or rating. LGD is an estimate, expressed as a fraction of EAD, of the expected amount of loss in case of counterparty default. The LGD estimates used depend among other things on if it is a secured or unsecured exposure, type of collateral and seniority of the exposure. Conceptually EAD consists of two parts, the current exposure and an estimate of potential future exposure at the time of default. Estimation of potential future drawdowns of available but unused credit commitments are known as credit conversion factors (CCFs). Since the CCF is the only random or uncertain portion of EAD, estimating EAD amounts to estimating these CCFs. Credit risks are mainly measured on two levels – on portfolio and exposure level. For verifying the loan portfolio’s exposure to credit risk, AS SEB Pank uses a portfolio diversification method. The division of financial obligations is monitored by different client segments, products, clients and industries. The Credit Area performs monthly analysis on the credit risk of loan portfolio and informs the bank’s managing bodies of the results. These results are discussed as well as any need for specific attention to or specific analysis for any identified issues. In respect to individual clients the bank prepares regular (annual, quarterly or if needed more often) analyses on the borrowers’ situation as well as their risk level. The analyses are based on annual and quarterly reports and on cash flow prognosis, on basis of which the financial situation is evaluated, as well as on credit history and information originating from other sources. Evaluation of the borrowers’ reliability is of critical importance. AS SEB Pank divides loan portfolio into two broad segments: A) corporate portfolio including loans to legal entities belonging to counterparty group’s with credit risk assumed by SEB Pank Group exceeding 7,500,000 EEK (2009: 4,500,000 EEK) or with consolidated sales or assets of more than 150,000,000 EEK and B) retail portfolio consisting of small corporates’ and private individuals’ sub-segments.
AS SEB Pank, Annual Report 2010
- 42 -
Based on the results of the analysis, the corporate clients are divided into sixteen risk classes in accordance with the AS SEB Pank risk classification system. Sixteen risk classes belong to 5 quality classes of businesses. As of end of 2010 the corporate portfolio amounted to 41% of total loan portfolio (2009: 44%). According to the risk classification system the risk class assignment is not required for companies or a group of companies with credit risk assumed by the SEB Pank Group less than 7,500,000 EEK (2009: 4,500,000 EEK) and with consolidated sales or assets of less than 150,000,000 EEK, i.e. small corporates belonging to retail portfolio. Scoring model is used for evaluation of these borrowers. The scoring model for small corporates considers financial condition based on last two annual reports, last interim report and next year prognosis, credit history with the bank and based on external credit history register, experience of the customer. The analyst evaluates correctness and quality of the information. The risk level of particular industry has a certain level of impact as well. The outcome of the scoring model is credit score, expressing risk level and determining decision-making level. Depending on the score clients are divided into quality classes A, B, C and D, where A is the best and D is the worst quality class. Small corporates amounted to 7% of the total portfolio as of end of 2010 (2009: 6%). Starting from 01.01.2011 the portfolio classification has been changed to some extent and now small corporate companies or a group of companies are considered with credit risk assumed by the SEB Pank Group less than 7,500,000 EEK irrespective of consolidated sales or assets. This resulted in 258 million corporate portfolio will be reclassified to retail portfolio during 2011. In analysing loans to private individuals the credit scoring and left-to-live model (this measures the customer’s ability to service the loan taking into account net income and cost of living) is used. The model considers among other matters credit history, income, age, employment conditions and the value of real estate owned. The output of the model is credit score and lending recommendation derived the score. Based on the score the clients are divided into quality classes A, B, C and D similarly to small corporates. Private individuals amounted to 46% of the total portfolio as of end of 2010 (2009: 43%). The remaining 7% of portfolio amounted advances to credit institutions (2009: 7%). Credit risk monitoring and mitigation Review of the situation and risk level of legal entities is performed on regular basis, depending on the client segment, the risk class assigned previously and any additional information available to the bank at least once a year. During the review the bank assesses the client’s financial condition, risk level, regularity of fulfilling existing financial obligations and need for financing. As an important outcome, a risk class is updated for all the corporate portfolio clients and groups which shall be valid for one year (risk classes 1-10) or half a year (risk classes 11-16). Risk classes 13-16 are regarded as Watch-list and separately reviewed at least on quarterly bases. Monthly High Risk meetings are held by Special Credits Management (SCM) in order to monitor exposures and developments identified as high risk customers.

AS SEB Pank, Annual Report 2010
- 43 -
The distribution of non-retail portfolio by the quality classes is given in the next table.
For regular monitoring of private individuals and small corporates - retail portfolio - the behavioural scoring models are in use. The models are based on the application scoring models used in loans analysis process. In behavioural scoring there is used a separate quality class E for defaulted clients’ exposures and an additional class N for small corporates’ exposures to whom according to the bank’s assessment there is not enough information to assign any other class. Part of the information (payment behaviour, financial situation of the small corporate) is updated regularly (monthly, quarterly), partly is used older available information. Client executives have an obligation to update financials of small corporates at least once a year. Behavioural score is calculated monthly for all private individuals and small corporates loans. The distribution of retail portfolio by quality classes is given in the table below.
Risk class Business quality class12 31.12.10 31.12.093 Ordinary Business 50.1% 42.4%4 Restricted Business 11.0% 10.7%5 Special Observation 11.4% 13.4%6 Watch-list 17.6% 22.8%7 Default 9.9% 10.7%8 Total 100.0% 100.0%91011 Restricted Business12 Special Observation13141516 Default
Watch-list
Ordinary Business
% of rated portfolioCorporate Portfolio by risk classes
Score Business quality class % of scored portfolioA 31.12.10 31.12.09B Ordinary Business 74.5% 75.4%C Special Observation 18.8% 18.1%D Default 6.3% 5.6%E Default Insufficient information 0.4% 0.9%N Insufficient information Total 100.0% 100.0%
Special Observation
Ordinary Business
Retail portfolio by behavioral scores

AS SEB Pank, Annual Report 2010
- 44 -
Primary responsibility for monitoring the quality of specific client and its loans lies with client executives, who should inform immediately their department head and if necessary the credit area management of occurred problems and accordingly take necessary measures for identification and minimisation of potential credit losses. Review of the situation and risk level of small corporates is performed by client executives on regular basis and at least once a year. During the review the client’s financial condition, risk level and regularity of fulfilling existing financial obligations is assessed. The review of small corporates with behavioural score C or D and with exposure exceeding 4,5 EEKmio is confirmed collegially by credit committees or by the authorised persons in accordance with the decision-making limits established by the bank’s management. Collateral In order to diminish credit risk the bank has established a requirement for the borrowers to provide the bank with collateral in the form of registered immovable property, registered movable property and/or personal sureties as security. The group has implemented guidelines on the acceptability of specific classes of collateral on credit risk mitigation. The principles for granting an unsecured loan are stated in the credit policy and this kind of lending is clearly limited and restricted. The pledged assets have to be insured throughout the loan period in an insurance company accepted by the bank at least for the restoration value. In case of a housing loan also life insurance is required, if the borrower is contributing majority to the family’s income. The aforementioned measures help to control and manage the credit risk as they serve as an
Loans and advances to customers by quality classes (gross)(millions of EEK)
31.12.10 Credit insti- tutions
Loans to Corporates
Leases to Corporates
Public sector
Housing loans
Other loans to Private
individuals TOTALOrdinary Business 4,372.9 9,186.2 2,432.5 2,716.3 19,314.0 4,135.0 42,156.9Restricted Business 0.0 2,549.7 292.1 1.1 0.0 0.0 2,842.9Special Observation 0.5 4,095.9 1,127.0 1.2 3,148.2 1,001.1 9,373.9Watch-list 0.0 4,140.9 406.5 0.0 0.0 0.0 4,547.4Default 0.0 2,568.1 459.8 0.0 1,153.1 457.8 4,638.8Not Classified 0.0 0.0 0.0 3.3 0.0 0.0 3.3Accrued Interests 0.3 36.2 7.3 4.7 34.7 25.9 109.1Deferred Origination Fees 0.0 -21.4 -8.5 -1.6 -16.8 -10.3 -58.6
4,373.7 22,555.6 4,716.7 2,725.0 23,633.2 5,609.5 63,613.7
31.12.09 Credit insti- tutions
Loans to Corporates
Leases to Corporates
Public sector
Housing loans
Other loans to Private
individuals TOTALOrdinary Business 4,629.8 9,082.3 2,552.1 2,836.8 19,570.0 4,511.1 43,182.1Restricted Business 0.6 2,768.4 543.2 8.9 0.0 0.0 3,321.1Special Observation 0.0 5,048.7 1,511.4 0.1 3,355.6 1,067.9 10,983.7Watch-list 0.1 5,704.6 1,370.7 0.0 0.0 0.0 7,075.4Default 0.0 2,950.3 365.1 0.0 1,106.3 448.8 4,870.5Not Classified 0.1 0.0 0.0 6.7 0.0 0.0 6.8Accrued Interests 2.8 47.1 12.8 4.6 34.3 33.1 134.7Deferred Origination Fees 0.0 -11.4 -4.5 -1.2 -12.6 -8.4 -38.1
4,633.4 25,590.0 6,350.8 2,855.9 24,053.6 6,052.5 69,536.2

AS SEB Pank, Annual Report 2010
- 45 -
alternative source for collecting the loan, in case the borrower is not able to repay the loan from primary cash flow. The balance of unsecured credits is disclosed below.
Client executives have an obligation to review collateral values at least once a year and update if necessary. Collateral values of living spaces and land are being adjusted with indexes calculated in-house based on transaction statistics of Estonian Land Board. Impairment and allowance policies The internal rating system is primarily used to measure one of the major sources of risk that drives the occurrence of lending losses - the risk that the counterparty will default on its payment obligations, being probability of default. This is distinct from the risk of loss finally arising after all attempts to recover payments from defaulted counterparties. The internal rating systems described in “Credit risk monitoring and mitigation” focus on expected credit losses - that is, taking into account the risk of future events giving rise to losses. In contrast, impairment allowances are recognised for financial reporting purposes only for losses that have been incurred at the date of the consolidated statement of financial position based on objective evidence of impairment. Due to the different methodologies applied, the amount of incurred credit losses provided for in the financial statements is usually lower than the amount determined from the expected loss model that is used for internal operational management and banking regulation purposes. The internal rating tool assists management to determine whether objective evidence of impairment exists under IAS 39, based on the following criteria set out by the Group:
delinquency in contractual payments of principal or interest; cash flow difficulties experienced by the borrower (e.g. equity ratio, operating income
or EBITDA margin, debt service coverage etc); breach of loan covenants or conditions; initiation of bankruptcy proceedings;
Loans against collateral(millions of EEK)
31.12.10 31.12.09Mortgage, real estate 42,509.9 45,318.7Securities and deposits 342.3 584.2Guarantee by state, central bank or municipality 3,658.5 3,735.5Guarantee by credit institutions 4,373.4 4,632.2Unsecured loans* 2,939.7 2,890.8Repos with customers (securities as collateral) 1.7 5.0Factoring (receivables as collateral) 441.8 693.8Leasing (leased assets as collateral) 6,318.6 8,197.2Other (floating charges, vehicles, warranties, other) 2,918.8 3,345.7Accrued interest receivable 109.0 133.1Allowances -2,808.0 -3,056.5TOTAL** 60,805.7 66,479.7
* Includes credit cards and other unsecured loans.
** Includes loans and advances to customers and credit institutions (Notes 14, 15) by type of the main collateral.
AS SEB Pank, Annual Report 2010
- 46 -
deterioration of the borrower’s competitive position.
The SEB Pank Group’s policy requires that all exposures above 7.5 EEKmio (2009: 4,5 EEKmio) are reviewed individually at least annually (see above). Impairment allowances on individually assessed accounts are determined by an evaluation of the incurred loss at reporting date on a case-by-case basis, and are applied to all individually significant accounts. The assessment also encompasses collateral held (including re-confirmation of its enforceability) and the anticipated receipts for that individual account. Collectively assessed impairment allowances are provided for: (i) portfolios of homogenous assets that are individually below materiality thresholds; and (ii) losses that have been incurred but have not yet been identified, by using the available historical experience, experienced judgement and statistical techniques. Credit risk managers in head office and branch credit risk management department perform regular in-depth monitoring of the quality of the loan portfolio. Also the banks’ internal audit carries out reviews on valuation of the loan portfolio. During the control for adherence to procedures, availability of required information and documents, regularity of loan servicing (repayments), adequacy of collateral and other factors influencing the risks is verified. Impaired loans A loan should be classified as impaired if it is probable that the contractual payments will not be fulfilled and the expected proceeds available from the realisation of the collateral do not cover both principal and accrued interest including penalty fees, i.e. the recoverable amount from expected future cash flows (including from realisation of collateral) discounted using original effective interest rate (if the loan has floating interest rate then the rate used for the current interest period adjusted by origination fees) is less than the carrying amount. In these cases all the borrower’s loans in the SEB Pank Group shall be considered for impairment, unless there are specific reasons calling for a different evaluation. Impaired loans are classified to the following two groups: • Impaired non-performing loans: The loan is past due and the expected cash flow from the collateral does not cover both principal and accrued interest and penalty fees; • Impaired performing loans: AS SEB Pank has determined that the expected cash flow from the collateral does not cover both principal and accrued interest and penalty fee and there has been identified an incurred loss event, but no payments are yet past due more than 60 days. Provided, during the valuation of the loan it becomes evident that the collection of the loan or part of it is doubtful and the collateral is insufficient for covering the loan amount together with accrued interest and penalties, an impairment loss is to be recognised and allowance will be established for the loan. Specific and collective allowances are established for individually appraised loans and separate collective allowances used for homogeneous groups of loans appraised on a homogenous group level. The purpose is to calculate and present the value of the loan portfolio as fairly and objectively as possible based on the future discounted cash flow expectation. Problem loans and recovering written-off loans are handled by Special Credit Management Division by using several methods: negotiations with clients, rehabilitation, execution, bankruptcy proceedings. Special Credit Management Division specialists are involved with

AS SEB Pank, Annual Report 2010
- 47 -
problem loans (or potential problem loans) at the early stage to ensure most valuable outcome for both the client and the bank. Allowances for credit losses related to on-balance sheet items are provided either specific, collective or on homogenous group basis. The total impairment allowance for loans and advances as at 31.12.2010 is 2,808.0 EEKmio (2009: 3,056.5) of which 1,411.9 (2009: 1,607.0) represents the allowance for individually impaired loans and the remaining amount of 1,396.1 (2009: 1,449.5) represents collective and homogenous groups allowances.
At the end of 2010 collective allowances included also additional collective allowance in amount of 72 EEKmio (2009: 215). The amount of additional collective allowance is calculated based on SEB Group model for credit losses for exposures to customers in risk class 1-12 (IBNI model, which estimates Incurred But Not Identified loss events) and in consideration of improving macro environment and credit portfolio quality. SEB Group Retail Provisioning Model’s principles were used to determine homogenous groups’ allowances. The calculated incurred loss levels were adjusted by expert opinion taking into account non-performing loans (NPL) levels for different product groups which additionally reflect portfolio quality. At the end of 2010 the homogenous groups’ allowances were established at around 60% of NPL level (2009: 45%).
Individually impaired loans and allowances(millions of EEK) 31.12.10 31.12.09
Impaired, non-performing loans 1,947.3 2,071.2Impaired, performing loans 188.3 862.7
Total individually impaired loans 2,135.6 2,933.9Specific allowances -1,411.9 -1,607.0Collective allowances on individually assessed loans -357.5 -525.3Collective allowances for homogeneous groups -966.6 -709.2Other collective allowances for incurred but not identified losses -72.0 -215.0
Total allowances -2,808.0 -3,056.5
Specific allowance ratio (Specific allowances / Individually impaired loans) 66% 55%
Ratio of impaired loans (Individually impaired loans / Loans to customers) 3.51% 4.41%

AS SEB Pank, Annual Report 2010
- 48 -
Loans and advances to customers and credit institutions by classes (millions of EEK)
31.12.10 Credit insti- tutions
Loans to Corporates
Leases to Corporates
Public sector
Housing loans
Other loans to Private
individuals TOTAL
1) Neither past due nor impaired 4,373.4 19,919.2 4,150.7 2,713.0 21,911.8 4,951.6 58,019.7
2) Past due, but not impaired 0.0 774.4 287.6 8.9 1,703.5 633.5 3,407.9
fair value of collateral 0.0 597.8 236.8 4.6 1,563.1 337.8 2,740.1
3) Individually impaired 0.0 1,847.2 279.6 0.0 0.0 8.8 2,135.6
fair value of collateral 0.0 933.7 223.2 0.0 0.0 0.0 1,156.9
4) Accrued interests 0.3 36.2 7.3 4.7 34.7 25.9 109.1
5) Deferred origination fees 0.0 -21.4 -8.5 -1.6 -16.8 -10.3 -58.6
Total gross 4,373.7 22,555.6 4,716.7 2,725.0 23,633.2 5,609.5 63,613.7
Specific allowances 0.0 -1,163.7 -239.4 0.0 0.0 -8.8 -1,411.9
Collective allowances 0.0 -416.8 -12.7 0.0 0.0 0.0 -429.5
Group allowances (homogeneous) 0.0 -217.1 -113.1 0.0 -419.6 -216.8 -966.6
Total net of allowances 4,373.7 20,758.0 4,351.5 2,725.0 23,213.6 5,383.9 60,805.7
31.12.09 Credit insti- tutions
Loans to Corporates
Leases to Corporates
Public sector
Housing loans
Other loans to Private
individuals TOTAL
1) Neither past due nor impaired 4,630.6 21,771.7 5,583.2 2,852.4 22,178.8 5,313.3 62,330.0
2) Past due, but not impaired 0.0 1,182.0 439.7 0.1 1,852.5 701.3 4,175.6
fair value of collateral 0.0 1,300.9 444.1 0.1 1,841.8 396.0 3,982.9
3) Individually impaired 0.0 2,600.6 319.6 0.0 0.6 13.2 2,934.0
fair value of collateral 0.0 1,373.4 143.8 0.0 0.2 2.7 1,520.1
4) Accrued interests 2.8 47.1 12.8 4.6 34.3 33.1 134.7
5) Deferred origination fees 0.0 -11.4 -4.5 -1.2 -12.6 -8.4 -38.1
Total gross 4,633.4 25,590.0 6,350.8 2,855.9 24,053.6 6,052.5 69,536.2
Specific allowances 0.0 -1,386.8 -210.4 0.0 -0.3 -9.5 -1,607.0
Collective allowances 0.0 -682.6 -57.7 0.0 0.0 0.0 -740.3
Group allowances (homogeneous) 0.0 -123.6 -106.5 0.0 -276.9 -202.2 -709.2
Total net of allowances 4,633.4 23,397.0 5,976.2 2,855.9 23,776.4 5,840.8 66,479.7
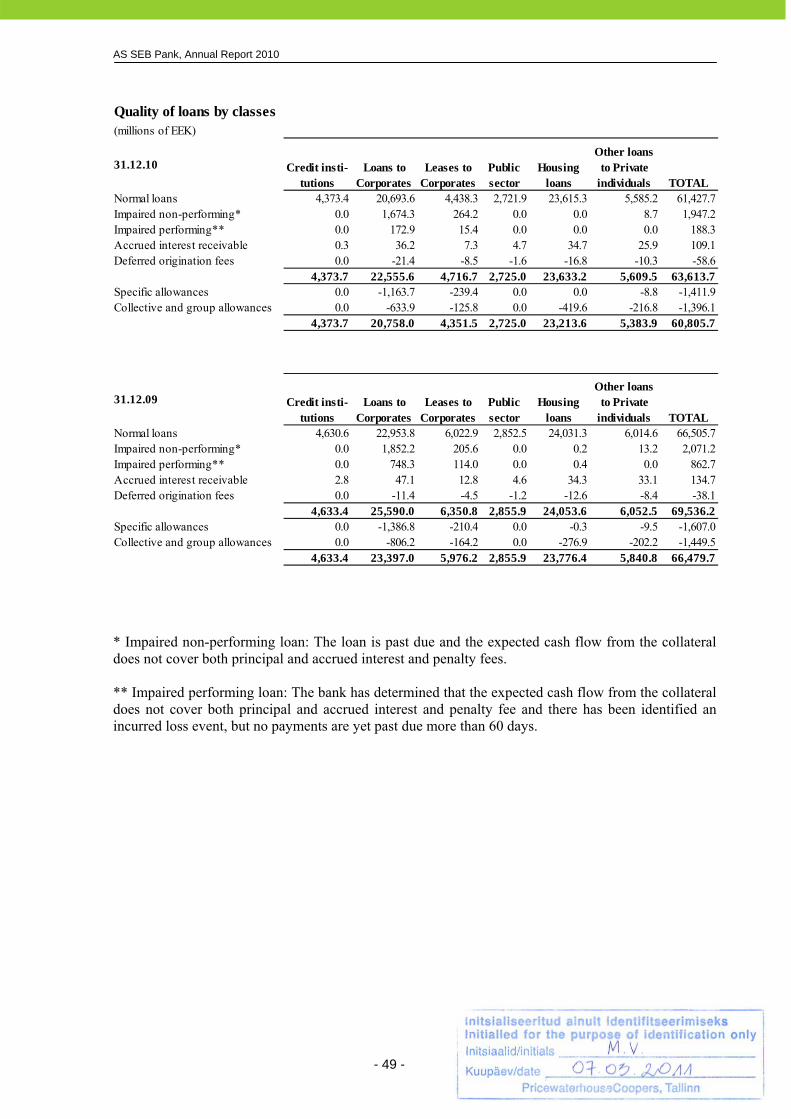
AS SEB Pank, Annual Report 2010
- 49 -
* Impaired non-performing loan: The loan is past due and the expected cash flow from the collateral does not cover both principal and accrued interest and penalty fees. ** Impaired performing loan: The bank has determined that the expected cash flow from the collateral does not cover both principal and accrued interest and penalty fee and there has been identified an incurred loss event, but no payments are yet past due more than 60 days.
Quality of loans by classes(millions of EEK)
31.12.10 Credit insti- tutions
Loans to Corporates
Leases to Corporates
Public sector
Housing loans
Other loans to Private
individuals TOTALNormal loans 4,373.4 20,693.6 4,438.3 2,721.9 23,615.3 5,585.2 61,427.7Impaired non-performing* 0.0 1,674.3 264.2 0.0 0.0 8.7 1,947.2Impaired performing** 0.0 172.9 15.4 0.0 0.0 0.0 188.3Accrued interest receivable 0.3 36.2 7.3 4.7 34.7 25.9 109.1Deferred origination fees 0.0 -21.4 -8.5 -1.6 -16.8 -10.3 -58.6
4,373.7 22,555.6 4,716.7 2,725.0 23,633.2 5,609.5 63,613.7Specific allowances 0.0 -1,163.7 -239.4 0.0 0.0 -8.8 -1,411.9Collective and group allowances 0.0 -633.9 -125.8 0.0 -419.6 -216.8 -1,396.1
4,373.7 20,758.0 4,351.5 2,725.0 23,213.6 5,383.9 60,805.7
31.12.09 Credit insti- tutions
Loans to Corporates
Leases to Corporates
Public sector
Housing loans
Other loans to Private
individuals TOTALNormal loans 4,630.6 22,953.8 6,022.9 2,852.5 24,031.3 6,014.6 66,505.7Impaired non-performing* 0.0 1,852.2 205.6 0.0 0.2 13.2 2,071.2Impaired performing** 0.0 748.3 114.0 0.0 0.4 0.0 862.7Accrued interest receivable 2.8 47.1 12.8 4.6 34.3 33.1 134.7Deferred origination fees 0.0 -11.4 -4.5 -1.2 -12.6 -8.4 -38.1
4,633.4 25,590.0 6,350.8 2,855.9 24,053.6 6,052.5 69,536.2Specific allowances 0.0 -1,386.8 -210.4 0.0 -0.3 -9.5 -1,607.0Collective and group allowances 0.0 -806.2 -164.2 0.0 -276.9 -202.2 -1,449.5
4,633.4 23,397.0 5,976.2 2,855.9 23,776.4 5,840.8 66,479.7

AS SEB Pank, Annual Report 2010
- 50 -
Late processing and other administrative delays on the side of the borrower can lead to a financial asset being past due put not impaired. Therefore loans and advances less than 60 days past due are not usually considered impaired, unless other information is available to indicate the contrary. Also not all impaired loans and advances are past due. Past due by maturity period of overdue by classes (millions of EEK)
The table indicates the total exposure of the credit where part is overdue as of 31.12.10. Group is calculating interest income from loans with 60 days or more overdue based on cash received. Until 60 days overdue limit has not been breached interest income is recognized continuously based on contractual rate. The difference comparing to full effective interest income recognition was estimated for 2010 and 2009 to result in immaterial misstatement. Information about loans and advances, restructured during the 2010 A loan is restructured if the bank – due to the borrower’s financial problems or deteriorated financial standing – has agreed to some type of concession in terms of the loan amount or the interest payments or the repayment schedule that the bank would otherwise not consider. Restructured loans in the context of IFRS 7 are the loans that would otherwise be past due or impaired unless they had not been renegotiated.
31.12.10 Credit insti- tutions
Loans to Corporates
Leases to Corporates
Public sector
Housing loans
Other loans to Private
individuals
Accrued interest
receivable TOTAL< 30 days 0.0 321.6 141.9 8.9 764.3 191.5 3.2 1,431.4 incl. impaired 0.0 28.7 9.5 0.0 0.0 0.0 38.230 < 60 days 0.0 94.5 39.8 0.0 139.5 58.8 1.6 334.2 incl. impaired 0.0 33.0 6.6 0.0 0.0 0.0 39.6over 60 days 0.0 2,156.5 376.4 0.0 799.7 391.9 112.6 3,837.1 incl. impaired 0.0 1,641.6 245.7 0.0 0.0 8.8 1,896.1
0.0 2,572.6 558.1 8.9 1,703.5 642.2 117.4 5,602.7
31.12.09 Credit insti- tutions
Loans to Corporates
Leases to Corporates
Public sector
Housing loans
Other loans to Private
individuals
Accrued interest
receivable TOTAL< 30 days 0.0 634.8 210.3 0.1 829.5 267.8 6.3 1,948.8 incl. impaired 0.0 57.9 29.3 0.0 0.0 0.0 87.230 < 60 days 0.0 212.7 114.6 0.0 170.1 57.4 4.4 559.2 incl. impaired 0.0 78.2 17.8 0.0 0.0 0.0 96.0over 60 days 0.0 2,481.4 404.2 0.0 853.1 389.3 109.7 4,237.7 incl. impaired 0.0 2,010.9 242.3 0.0 0.2 13.2 2,266.6
0.0 3,328.9 729.1 0.1 1,852.7 714.5 120.4 6,745.7

AS SEB Pank, Annual Report 2010
- 51 -
Large exposures contain due from central bank, credit institutions or customers (loans, interests, securities) and off-balance sheet commitments to central bank, credit institutions or customers, which may turn into claims. The following is deducted from large exposures: - claims and off-balance sheet commitments to credit institutions with a term less than one year; - central bank, central government and state guaranteed study loans and claims secured with deposits and securities (credit risk 0%); - due from central bank, central government and government authorities, which belong to a group with credit risk considered at 0%; - loans to private non-residents, secured with I rank mortgage (credit risk considered at 50%).
Restructured loans and advances by classes(millions of EEK)
Credit insti-
tutionsLoans to
CorporatesLeases to
CorporatesPublic sector
Housing loans
Other loans to Private
individuals TOTAL
31.12.10 0.0 1,030.0 283.6 0.0 450.6 136.3 1,900.5
31.12.09 0.0 2,307.7 406.7 0.0 133.0 90.6 2,938.0
Maximum exposure to credit risk before collateral held or other enhancements(millions of EEK)
2010 2009Loans and advances to credit institutions 9,460.5 9,320.6Loans and advances to customers 64,902.7 59,240.0Financial assets held for trading
Debt securities 14.5 21.2Derivative financial instruments 351.7 321.1
Debt securities investment 24.0 2.8
Other assets 699.7 785.375,453.1 69,691.0
Exposures related to off-balance sheet items and guarantees 8,056.7 7,453.4Maximum exposure 83,509.8 77,144.3
Large exposures 31.12.10 31.12.09
Number/ Amount
% from net own funds
Number/ Amount
% from net own funds
Number of customers with large exposures 3 - 2 -
Due from customers with large exposures 2,617.5 25.36 2,191.7 21.65
Due from management board members and related persons 16.6 0.16 24.9 0.252,634.1 25.52 2,216.6 21.90
Own funds included in calculation of capital adequacy 10,321.6 10,124.7(see page 66)

AS SEB Pank, Annual Report 2010
- 52 -
Large credit risk exposure is defined by the Credit Institutions Law and is the total exposure of one party or related parties to the group which exceeds 10% of the group's net own funds, 1,032.2 EEKmio as at 31.12.2010 (1,012.5 EEKmio as at 31.12.2009), see Note 2.8 on page 66. All instruments where credit risk may arise to the group are taken into consideration. The limit of the total exposure of one party or related parties is 25%. As of 31.12.2010 the SEB Pank Group had 3 large risk exposures (2 large risk exposures in 31.12.2009). Total exposure of any group of related parties did not exceed the limit of 25%. Repossessed collateral During 2010 and 2009, the Group obtained assets by taking possession of collateral held as security as follows:
(millions of EEK)
Repossessed properties are sold as soon as practicable, with the proceeds used to reduce the outstanding indebtedness. Repossessed property is classified in the consolidated statement of financial position within investment property. 2.3. Market risk Market risk is the risk of loss or reduction of future net income following changes in interest rates, foreign exchange rates, equity prices and commodity prices, including price risk in connection with the sale of assets or closing of positions. Market risk may arise from the bank’s activity at the financial markets and it has an impact on the majority of bank products: loans, deposits, securities, credit lines. AS SEB Pank measures the risks using different methods of risk valuation and management pursuant to the type of risk. Important role in risk prevention is diversification of risk assets and limitation for trading positions. Maximum limits approved by the committees, which are in compliance with the limits set by the Bank of Estonia, form the basis for controlling and monitoring the risk of various instrument portfolios. For positions related to market risk nominal limits are applied, which are monitored by trading portfolios on daily basis by Risk Control. Any limit breach shall be reported in accordance with the regulations of Market Risk Policy. In addition to the aforementioned, also scenario analysis is applied in market risk management, which is used for valuing the performance of trading positions in case of more extreme fluctuations in market variables. Stress tests can also be a tool in the limit setting process. The overall market risks are measured by the Value at Risk (VaR) approach based on historical simulation and market risk type specific measures. Group wide measures should cover the following risk factors: interest rates, currencies, equities, commodities, credit spread, inflation and volatilities.
Nature of assets Carrying amount2010 2009
Property 24.1 24.7

AS SEB Pank, Annual Report 2010
- 53 -
VaR is defined as a maximum potential loss that can arise with a certain degree of probability during a certain period of time. The Group has chosen a probability level of 99% and a ten-day holding period for monitoring and reporting VaR in the trading book and the banking book. In the day-to-day risk management of trading positions, AS SEB Pank follows up limits with a 1-day time horizon. VaR model enables to effectively measure market risks associated with different instruments and the results are homogeneously comparable. Banking book ten-day average VaR in 2010 was 13.2 EEKmio (2009: 30.0 EEKmio). AS SEB Pank’s trading risk is relatively small, mainly arising from FX trading. Average trading risk 1 day VaR in 2010 was 0.5 EEKmio (2009: 2.0 EEKmio). Actual outcomes are monitored regularly to test the validity of assumptions and factors used in VaR calculation. The use of this approach does not prevent losses outside of these limits in the event of more significant market movements. Value at Risk (10 day) (millions of EEK)
Min Max 31.12.10Average
2010 Average
2009
Trading book 0.1 4.6 2.4 1.7 6.4
Banking book 5.0 18.8 5.0 13.2 30.0 VaR by risk type (millions of EEK)
31.12.10 31.12.09
Trading
book Banking
book Trading
book Banking
book
Interest rate risk 0.047 5.179 -0.016 14.490
Currency risk 2.381 -0.002 6.501 -0.007
Equity risk 0.000 -0.138 0.001 4.443
TOTAL 2.428 5.039 6.486 18.926 2.3.1. Foreign exchange risk Foreign exchange risk arises both through the Bank’s foreign exchange trading and because the Group’s activities are carried out in various currencies. The Group’s main objective for taking foreign exchange risk is to facilitate smooth foreign exchange trading for its customers and to manage the flows from customers’ deals effectively. Together with the customers’ deals related flows the Group manages the structural foreign exchange risk inherent in the structure of the balance sheet and earnings. Foreign exchange positions are measured within the overall VaR framework. As a complement ALCO has set limits for open foreign currency positions by individual currencies and also on an aggregated level as a sum of long or short positions, depending of which one is higher on absolute terms. Management of open foreign currency positions is the responsibility of the Foreign Exchange department, and analysing and limit follow-up that of the Risk Control department.

AS SEB Pank, Annual Report 2010
- 54 -
The table below summarises the Group’s exposure to foreign currency exchange rate risk at the reporting date.
FX options are weighted with delta. Other FX derivative assets and liabilities include currency-related derivatives and are shown here in their contractual nominal value. Net position of every currency was under 1% level of net own funds, 1,032.2 EEKmio as at 31.12.2010 (1,012.5 EEKmio as at 31.12.2009). Net position is calculated without EEK and EUR in Estonia because EEK is pegged to EUR at 15.6466 EEK : 1 EUR).
Currency position(millions of EEK)
31.12.10EEK EUR USD SEK
Other currencies TOTAL
ASSETSCash and balances with central bank 4,212.9 1,295.3 8.3 10.5 28.3 5,555.3Loans and advances to credit institutions 23.4 3,857.4 25.0 188.0 279.9 4,373.7Loans and advances to customers 9,142.6 47,161.3 126.9 1.2 0.0 56,432.0Securities 20.6 330.2 6.3 1.4 69.3 427.8Other assets 278.3 331.6 58.0 60.5 166.2 894.6TOTAL ASSETS 13,677.8 52,975.8 224.5 261.6 543.7 67,683.4
LIABILITIESDue to credit institutions 712.5 21,440.0 34.4 6.5 15.6 22,209.0Deposits 21,738.5 9,302.0 2,318.2 166.4 313.6 33,838.7Other liabilities 184.0 2,732.2 98.7 112.4 187.5 3,314.8TOTAL LIABILITIES 22,635.0 33,474.2 2,451.3 285.3 516.7 59,362.5
Net on-balance sheet position -8,957.2 19,501.6 -2,226.8 -23.7 27.0 8,320.9
FX derivative assets 0.2 988.9 2,672.1 49.1 836.6 4,546.9FX derivative liabilities 0.6 3,348.9 446.5 23.5 732.7 4,552.2Currency position(millions of EEK)
31.12.09EEK EUR USD SEK
Other currencies TOTAL
ASSETSCash and balances with central bank 5,233.5 186.6 12.3 5.6 28.0 5,466.0Loans and advances to credit institutions 21.5 4,364.0 168.1 0.3 79.5 4,633.4Loans and advances to customers 11,123.1 50,576.5 145.1 1.0 0.6 61,846.3Securities 27.3 374.1 13.1 0.2 61.2 475.9Other assets 370.3 130.7 124.5 28.5 160.6 814.6TOTAL ASSETS 16,775.7 55,631.9 463.1 35.6 329.9 73,236.2
LIABILITIESDue to credit institutions 468.8 29,181.0 95.3 2.5 38.4 29,786.0Deposits 22,261.9 7,946.6 1,478.2 154.4 171.6 32,012.7Other liabilities 263.6 3,183.7 158.5 48.6 173.7 3,828.1TOTAL LIABILITIES 22,994.3 40,311.3 1,732.0 205.5 383.7 65,626.8
Net on-balance sheet position -6,218.6 15,320.6 -1,268.9 -169.9 -53.8 7,609.4
FX derivative assets 2,429.1 1,067.4 1,580.3 294.1 363.0 5,733.9FX derivative liabilities 736.4 4,260.4 304.5 122.9 259.9 5,684.1

AS SEB Pank, Annual Report 2010
- 55 -
2.3.2. Interest rate risk Interest rate risk is the risk of loss or reduction of future net income following changes in interest rates, including price risk in connection with the sale of assets or closing of positions. To measure and limit interest rate risk the Group uses the VaR method, supplemented with Delta1% method. The Group uses Delta1% methodology for measuring the ALM (assets-liability mismatch) risk, arising from the structure of interest earning assets and interest bearing liabilities. Delta1% is defined as the change in market value arising from an adverse one percentage unit parallel shift in all interest rates in each currency. Delta1% method enables to effectively measure the impact of interest rate changes to interest bearing assets and liabilities. Delta1% limit is monitored as a negative or positive net position respectively, depending of which one is higher. Delta1% should be kept within the limit set by ALCO. Daily management of interest rate risk is the responsibility of the Treasury, and analysing that of the Risk Control department. As per year end, Delta1% was -44 EEKmio (2009: -51 EEKmio). 2010 average Delta1% was -40 EEKmio (2009: -48 EEKmio). The Group Delta1% has been negative which means that the average duration of interest bearing assets is higher than average duration of interest bearing liabilities and the Group is more exposed to interest rate increase. The biggest contributors to the Delta1% figure are loans from the asset side and deposits and funding from the parent company from the liabilities side which balance the mismatch from loans. Further information on interest rate sensitivity can be found through table below “Interest earning assets and interest bearing liabilities by interest repricing period”. AS SEB Pank has been keeping assets-liabilities mismatch at relatively low level. Flexibility to assets-liabilities mismatch management is assured by the possibility to adjust funding from parent company. The next table summarises the Group exposure to interest rate risk. It includes the Group’s financial assets and liabilities at carrying amounts, categorised by the earlier of contractual repricing or maturity date.

AS SEB Pank, Annual Report 2010
- 56 -
Interest earning assets and interest bearing liabilities by interest fixation period (millions of EEK)
Table includes only interest earning assets and interest bearing liabilities. Also the table does not include the liabilities from factoring (Note 26), commissions for loans and discounting of deposits.
31.12.10
ASSETS< 1
month1-3
months3-12
months1-2
years2-5
yearsover 5 years Total
Statement of
financial position
Due from central bank 4,946.1 0.0 0.0 0.0 0.0 0.0 4,946.1 4,946.9
Due from credit institutions 4,107.4 0.0 266.0 0.0 0.0 0.0 4,373.4 4,373.7
Due from customers 18,013.1 17,223.2 15,417.6 1,229.2 2,261.8 2,237.0 56,381.9 56,432.0
Securities 21.7 0.0 0.0 42.6 0.0 0.0 64.3 24.0
TOTAL ASSETS 27,088.3 17,223.2 15,683.6 1,271.8 2,261.8 2,237.0 65,765.7 65,776.6
27,088.3 17,223.2 15,683.6 1,271.7 2,261.8 2,237.0 65,765.7 65,776.6
LIABILITIESDue to credit institutions 6,794.3 4,327.0 9,501.5 742.7 712.0 28.3 22,105.8 22,209.0
Due to customers 28,006.1 1,635.7 2,798.1 573.5 553.2 68.2 33,634.8 33,630.0
Lending funds 2.2 4.5 15.8 9.0 61.4 115.3 208.2 208.7
Subordinated liabilities 0.0 0.0 1,830.7 0.0 0.0 0.0 1,830.7 1,833.7
TOTAL LIABILITIES 34,802.6 5,967.2 14,146.1 1,325.2 1,326.6 211.8 57,779.5 57,881.4
34,802.7 5,967.1 14,146.0 1,325.2 1,326.6 211.8 57,779.5 57,881.4
Total interest repricing gap of on-balance sheet position -7,714.3 11,256.0 1,537.5 -53.4 935.2 2,025.2 7,986.2 7,895.2
Derivative assets 4,660.1 699.4 784.7 247.1 177.4 25.1 6,593.8 321.1
Irrevocable and revocable interest related assets 0.0 0.0 0.0 0.0 195.6 0.0 195.6 0.0
Derivative liabilities 4,664.1 701.0 784.4 247.1 177.4 25.1 6,599.1 349.4
Irrevocable and revocable interest related liabilities 854.8 538.4 2,492.7 236.7 186.8 54.4 4,363.8 0.0
Total interest repricing gap -8,573.1 10,716.0 -954.9 -290.1 944.0 1,970.8 3,812.7 7,866.9

AS SEB Pank, Annual Report 2010
- 57 -
2.3.3. Equity price risk Equity price risk arises within market making and trading in equities and related instruments. In 2010 AS SEB Pank did not have any risks open in equity trading portfolio.
31.12.09
ASSETS< 1
month1-3
months3-12
months1-2
years2-5
yearsover 5 years Total
Statement of
financial position
Due from central bank 4,826.1 0.0 0.0 0.0 0.0 0.0 4,826.1 4,827.1
Due from credit institutions 1,881.7 2,750.5 0.0 0.0 0.0 0.0 4,632.2 4,633.4
Due from customers 18,323.4 19,158.4 16,442.6 1,162.7 3,612.8 3,052.7 61,752.6 61,846.3
Securities 0.0 3.6 25.2 0.0 16.7 15.6 61.1 38.5
TOTAL ASSETS 25,031.2 21,912.5 16,467.8 1,162.7 3,629.5 3,068.3 71,272.0 71,345.3
25,031.2 21,912.5 16,467.8 1,162.7 3,629.5 3,068.3 71,272.0 71,345.2
LIABILITIESDue to credit institutions 6,488.0 8,112.5 10,674.9 3,230.2 1,133.6 36.4 29,675.6 29,786.0
Due to customers 22,305.8 4,975.5 3,437.9 533.6 482.9 50.4 31,786.1 31,824.2
Lending funds 2.4 28.1 37.1 19.4 34.7 66.4 188.1 188.4
Issued debt securities 0.0 0.0 17.4 0.0 0.0 0.0 17.4 9.1
Subordinated liabilities 0.0 782.3 1,830.7 0.0 0.0 0.0 2,613.0 2,615.9
TOTAL LIABILITIES 28,796.2 13,898.4 15,998.0 3,783.2 1,651.2 153.2 64,280.2 64,423.6
28,796.2 13,898.4 15,998.0 3,783.2 1,651.2 153.2 64,280.2 64,423.7
Total interest repricing gap of on-balance sheet position -3,765.0 8,014.1 469.8 -2,620.5 1,978.3 2,915.1 6,991.8 6,921.7
Derivative assets 4,392.4 1,532.5 463.2 145.1 258.0 43.4 6,834.6 351.7
Irrevocable and revocable interest related assets 0.0 0.0 0.0 0.0 0.0 391.2 391.2 0.0
Derivative liabilities 4,384.1 1,508.6 463.2 145.1 258.1 43.4 6,802.5 349.4
Irrevocable and revocable interest related liabilities 758.1 1,564.1 2,219.9 18.7 156.2 53.9 4,770.9 0.0
Total interest repricing gap -4,514.8 6,473.9 -1,750.1 -2,639.2 1,822.0 3,252.4 2,644.2 6,924.0

AS SEB Pank, Annual Report 2010
- 58 -
2.4. Concentration of risks Geographic concentration of assets and liabilities (millions of EEK)
Contingent liabilities include here guarantees and pledges, loan commitments, forwards, swaps, options, spots, interest rate based derivatives, revocable transactions, stand-by loans, other revocable transactions, options of structured products and are presented in contract amount of contingent liabilities, detailed view in Note 33. Securities include here financial assets held for trading, financial assets designated at fair value through profit or loss, available-for-sale financial assets, investments in associates.
31.12.10
Cash, balances with central bank,
loans and advances to credit
institutions
Loans and advances to custo-
mersSecuri-
tiesOther assets
Total assets
Due to credit
institu- tions
Due to custo- mers
Other liabilities
Total liabilities
Contingent liabilities
Sweden 4,044.0 33.7 87.5 5.9 4,171.1 20,716.6 149.9 2,067.8 22,934.3 18.0Estonia 5,556.4 55,841.0 331.8 750.3 62,479.5 229.1 29,587.3 1,380.9 31,197.3 7,283.2United Kingdom 9.9 30.0 2.9 0.0 42.8 22.4 443.0 0.4 465.8 5.5Russia 13.0 8.2 0.0 0.0 21.2 14.1 245.7 0.7 260.5 0.8Germany 5.6 33.9 0.0 0.0 39.5 1,093.1 55.4 0.0 1,148.5 85.6United States 8.2 14.8 5.6 0.2 28.8 1.4 390.2 0.0 391.6 1.0Canada 0.0 0.0 0.0 0.0 0.0 0.8 11.2 0.0 12.0 0.0Japan 0.0 0.0 0.0 0.0 0.0 0.0 2.7 0.0 2.7 0.0Finland 2.9 290.5 0.0 0.4 293.8 0.1 132.7 0.1 132.9 32.3Latvia 108.9 1.7 0.0 0.0 110.6 37.0 38.3 0.0 75.3 0.0Lithuania 52.3 0.3 0.0 0.0 52.6 32.2 25.9 0.4 58.5 0.0Luxembourg 28.4 0.0 0.0 7.7 36.1 0.4 0.1 0.0 0.5 0.0Netherlands 0.1 9.4 0.0 0.0 9.5 0.0 2.7 0.0 2.7 0.1Other Western Europe 82.4 160.1 0.0 0.1 242.6 61.4 372.3 0.1 433.8 25.8Other Eastern Europe 16.8 0.6 0.0 0.0 17.4 0.1 24.8 0.0 24.9 0.0Other countries 0.1 7.8 0.0 130.0 137.9 0.3 2,147.8 73.1 2,221.2 1.1
9,929.0 56,432.0 427.8 894.6 67,683.4 22,209.0 33,630.0 3,523.5 59,362.5 7,453.4
31.12.09
Cash, balances with central bank,
loans and advances to credit
institutions
Loans and advances to custo-
mersSecuri-
tiesOther assets
Total assets
Due to credit
institu- tions
Due to custo- mers
Other liabilities
Total liabilities
Contingent liabilities
Sweden 9.2 28.3 111.0 10.1 158.6 28,849.4 100.8 2,860.9 31,811.1 26.9Estonia 5,575.4 61,380.7 347.3 713.0 68,016.4 191.5 28,206.8 1,103.1 29,501.4 7,876.0United Kingdom 21.2 39.8 1.2 0.0 62.2 80.5 1,472.5 0.3 1,553.3 5.6Russia 41.0 13.5 0.0 0.0 54.5 10.4 214.8 1.6 226.8 0.0Germany 4,352.6 5.2 0.0 0.0 4,357.8 568.2 50.5 0.0 618.7 115.3United States 45.1 17.8 12.9 0.2 76.0 2.5 241.5 0.1 244.1 0.2Canada 0.1 0.0 0.0 0.0 0.1 3.7 10.6 0.0 14.3 0.0Japan 0.0 0.0 0.0 0.0 0.0 0.0 1.1 0.0 1.1 0.0Finland 0.7 290.3 3.4 0.5 294.9 2.6 120.9 0.2 123.7 17.5Latvia 3.6 0.2 0.0 0.0 3.8 25.4 34.4 3.0 62.8 0.0Lithuania 6.1 0.5 0.1 0.0 6.7 13.6 46.9 0.2 60.7 0.0Luxembourg 15.9 0.0 0.0 0.0 15.9 1.9 0.0 0.0 1.9 0.0Netherlands 0.1 9.7 0.0 0.1 9.9 0.0 3.2 0.1 3.3 0.0Other Western Europe 16.4 43.2 0.0 0.3 59.9 35.4 628.9 0.2 664.5 12.6Other Eastern Europe 7.4 0.6 0.0 0.2 8.2 0.6 30.0 0.4 31.0 1.6Other countries 4.6 16.5 0.0 90.2 111.3 0.3 661.3 46.5 708.1 1.0
10,099.4 61,846.3 475.9 814.6 73,236.2 29,786.0 31,824.2 4,016.6 65,626.8 8,056.7

AS SEB Pank, Annual Report 2010
- 59 -
Concentration of financial assets and liabilities by industry sectormillions of EEK)________________________________________________
In the statement of financial position
31.12.10Cash and loans to central bank, credit institutions
and customers Securities
Contingent liabilities
Real estate 10,511.5 1.2 104.5Finance 10,009.7 61.9 259.5Industry 4,449.5 21.2 1,705.0Trading 2,674.0 0.0 1,066.6Energy, gas and steam plants 2,310.3 0.0 426.5Transport 1,759.5 0.0 673.8Government and state defence 1,670.1 0.4 317.5Agriculture, fishing, forestry 1,423.5 0.0 114.8Hotels, restaurants 848.4 0.0 5.0Construction 791.7 0.0 852.9Health services, social work 748.2 0.0 119.1Administration and assistance 578.2 0.0 93.4Information and telecommunication 443.0 7.0 390.8Art, show business, leisure 440.0 0.0 27.1Education 414.0 0.0 77.8Water supply, canalisation, waste management 248.2 0.0 31.2Professional, science and technical work 205.3 0.0 87.4Mining 41.0 0.0 5.6Exterritorial organisations 0.1 0.0 0.5Other government and social services 360.1 15.0 57.8Individuals 29,242.7 0.0 1,036.6Derivatives 0.0 321.1 0.0Allowances -2,808.0 - -
66,361.0 427.8 7,453.4
In the statement of financial position
31.12.09Cash and loans to central bank, credit institutions
and customers Securities
Contingent liabilities
Real estate 11,212.3 1.2 129.4Finance 10,184.8 52.0 316.3Industry 4,481.3 16.9 1,467.3Trading 3,900.4 20.6 868.8Transport 3,013.1 0.0 301.3Energy, gas and steam plants 2,545.0 0.0 1,842.2Government and state defence 1,784.4 0.7 335.5Agriculture, fishing, forestry 1,605.4 0.0 75.5Construction 1,094.6 0.0 1,027.4Hotels, restaurants 1,039.3 0.0 5.6Health services, social work 822.0 0.0 105.6Administration and assistance 595.2 0.0 96.3Art, show business, leisure 539.2 0.0 32.3Water supply, canalisation, waste management 335.6 0.0 50.7Education 329.0 0.0 95.8Professional, science and technical work 261.0 0.0 63.8Information and telecommunication 244.3 15.1 88.8Mining 135.8 0.0 5.5Exterritorial organisations 0.1 0.0 0.5Other government and social services 774.9 17.7 32.8Individuals 30,104.5 0.0 1,115.3Derivatives 0.0 351.7 0.0Allowances -3,056.5 - -
71,945.7 475.9 8,056.7

AS SEB Pank, Annual Report 2010
- 60 -
Contingent liabilities include here guarantees and pledges, loan commitments, forwards, swaps, options, spots, interest rate based derivatives, revocable transactions, stand-by loans, other revocable transactions, options of structured products and are presented in contract amount of contingent liabilities, detailed view see in Note 33. Securities include here financial assets held for trading, financial assets designated at fair value through profit or loss, available-for-sale financial assets, investments in associates. 2.5. Liquidity risk Liquidity risk is the risk that the Group, over a specific time horizon, is unable to meet the demand for additional liquidity. Liquidity risk also entails the risk that the Group is forced to borrow at unfavourable rates or is forced to sell assets at a loss in order to meet its payment commitments. The banks’ liquidity risk is regulated and managed on basis of the mandatory reserve of the Bank of Estonia and internal liquidity limits determined by ALCO. Liquidity risk is measured as cumulative cash flows arising from the assets and liabilities of the bank in various time bands. Liquidity management is based on special models reflecting cash flow behaviour in the case of different scenarios including crisis scenario. The Group’s liquidity management process, as carried out within the group and monitored by Treasury, includes:
Day-to-day funding, managed by monitoring future cash flows to ensure that requirements can be met. This includes replenishment of funds as they mature or are borrowed by customers;
Maintaining a portfolio of highly marketable assets to fulfil mandatory reserve requirement;
Monitoring liquidity gaps against internal limits; and Managing the concentration and profile of debt maturities.
Long-term liquidity of the bank is planned and control over liquidity risk management is executed by ALCO. Central and daily management of the bank’s liquidity is the responsibility of the Treasury, and analysing that of the Risk Control department. Additional assurance for AS SEB Pank to manage long-term liquidity gives belonging to the international banking group. Liquidity is managed in co-operation with SEB Group Treasury. Through the parent company AS SEB Pank has better access to the international money markets than on individual basis. Next table presents the cash flows payable by the Group under financial liabilities by remaining contractual maturity at the reporting date. The amounts disclosed in the table are the contractual undiscounted cash flows.

AS SEB Pank, Annual Report 2010
- 61 -
Liquidity risk (by remaining maturity) (millions of EEK)
* credit-related off-balance sheet commitments are unused credit limits on reporting day Assets available to meet these liabilities include cash, central bank balances, highly liquid bonds held for reserve purposes, loans and advances to banks and loans and advances to customers. In the normal course of business, a proportion of customer loans contractually repayable within one year will be extended. The Group would also be able to meet unexpected net cash outflows by selling securities. Reporting date spot rate of Eesti Pank is used for assets / liabilities in foreign currencies.
31.12.10On demand
and less than 1 month
1-3 months
3-12 months 1-2 years
2-5 years
over 5 years Total
Carrying value in
statement of financial position
Due to credit institutions 887.7 237.9 9,913.7 9,443.9 2,192.2 144.8 22,820.2 22,209.0Due to customers 28,064.6 1,650.9 2,859.8 591.2 634.7 150.9 33,952.1 33,630.0Issued debt securities 0.0 0.0 0.0 0.0 0.0 0.0 0.0 0.0Subordinated loans 0.0 0.0 34.6 46.4 259.1 1,959.2 2,299.3 1,833.7Other liabilities 1,106.6 0.0 21.0 0.0 0.0 0.0 1,127.6 1,127.6
Loans related to off-balance sheet commitments* 878.3 621.0 2,517.5 314.9 186.8 54.3 4,572.8 0.0
Gross settledDerivatives inflow -4,660.1 -699.4 -784.7 -247.1 -177.4 -25.1 -6,593.8 -263.7Derivatives outflow 4,664.1 701.0 784.4 247.1 177.4 25.1 6,599.1 268.9Net settledDerivatives 0.4 3.7 18.2 20.3 14.1 0.0 56.7 56.7
30,941.6 2,515.1 15,364.5 10,416.7 3,286.9 2,309.2 64,834.0 58,862.2
31.12.09On demand
and less than 1 month
1-3 months
3-12 months 1-2 years
2-5 years
over 5 years Total
Carrying value in
statement of financial position
Due to credit institutions 1,039.8 99.0 3,095.7 10,855.9 15,641.1 562.5 31,294.0 29,675.6Due to customers 22,594.2 5,050.4 3,732.2 458.0 519.5 141.6 32,495.9 31,910.3Issued debt securities 0.0 0.0 17.0 0.0 0.0 0.0 17.0 9.1Subordinated loans 0.0 2.9 38.2 57.0 323.0 2,890.0 3,311.1 2,613.0Other liabilities 847.3 0.6 3.2 0.0 0.0 0.0 851.1 851.1Loans related to off-balance sheet commitments* 612.0 1,524.6 2,272.1 18.7 156.2 53.9 4,637.5 0.0
Gross settledDerivatives inflow -4,392.4 -1,532.5 -463.2 -145.1 -258.0 -43.4 -6,834.6 -291.1Derivatives outflow 4,384.1 1,508.6 463.2 145.1 258.1 43.4 6,802.5 266.2
Net settledDerivatives 1.3 0.0 24.5 15.1 19.2 0.0 60.1 60.1
25,086.3 6,653.6 9,182.9 11,404.7 16,659.1 3,648.0 72,634.6 65,094.3

AS SEB Pank, Annual Report 2010
- 62 -
2.6. Operational risk Operational risk is the risk of loss due to external events (natural disasters, external crime, etc.) or internal factors (e.g. breakdown of IT systems, mistakes, fraud, non-compliance with external and internal rules, other deficiencies in internal controls). Minimum standards for operational risk management of AS SEB Pank are established with Operational Risk Policy. Requirements for business continuity planning, operational risk self-assessment, etc., are established with relevant instructions. Several techniques have been developed to manage operational risk:
Handling-registering of operational risk events (losses, near misses and extraordinary gains), risk assessment and preparation of action plans. The Bank has implemented a risk management system used all over the Group;
Regular monitoring of Key Risk Indicators. Key indicators serve as early warning signals about changes in risk level and business efficiency;
Regular process of operational risk self-assessment (ORSA); Regular quality assessment of business units based on implementation of operational
risk requirements; Compliance with New Product Approval Process in product development, main focus
being on identification and mitigation of operational risk; Business continuity planning - establishing business continuity plans for most critical
business processes, recovery plans for IT and ensuring physical security in crisis situations.
Starting from 2008, AS SEB Pank uses the Advanced Measurement Approach (AMA) for measuring the operational risk and calculating the capital requirement. Capital for operational risk is quantified using internal data and external statistics about actual operational losses in the global financial sector. When calculating the Expected Losses (EL), data on Group’s internal operational risk losses is used; for Unexpected Losses (UL), data from external databases is used.
AS SEB Pank has established Operational Risk Committee (ORC) – for guiding and co-ordinating the operational risk management. The main tasks of the committee are to carry out supervision over operational risk management and control handling of operational risks. In 2009, New Product Approval Committee was founded, the purpose of which being to ensure the high quality of the Group’s products and services – the Group shall not initiate activities, which involve undefined risks or such risks, which the Group is not able to immediately manage or control. AS SEB Pank has concluded insurance contracts for mitigating material risks. Total amount of operational risk events, occurred in 2010 remained on historical average loss level.

AS SEB Pank, Annual Report 2010
- 63 -
2.7. Fair value of financial assets and liabilities (millions of EEK) A) Financial instruments not measured at fair value
AS SEB Pank assesses fair value of those financial assets and liabilities which are not presented in the Group’s statement of financial position at their fair value. When calculating fair value for floating interest rate loans and for fixed-interest rate lending, future cash flows are discounted based on the market interest curve, which has been adjusted for applicable margins of new lending. Similarly have been calculated also fixed-interest rate deposits, floating interest rate and fixed-interest rate balances due to credit institutions. As of reporting date fair value of loans and advances to customers was 8.10% lower than the carrying value. As of 31.12.2009 fair value of loans and advances to customers was 11.70% lower than the carrying value. Balances due to credit institutions (22,209.0 EEKmio as of 31.12.2010) include credit lines borrowed from the parent bank Skandinaviska Enskilda Banken AB (publ) (20,831.3 EEKmio as of 31.12.2010). As of reporting date fair value of balances due to credit institutions was 0.21% (2009: 0.54%) lower than the carrying value. As of reporting date fair value of balances due to customers was 0.26% higher (2009: 0.11% lower) than the carrying value. As of reporting date fair value of lending funds was 2.76% (2009: 3.34%) lower than the carrying value. Fair value of subordinated loans was 7.25% (2009: 11.82%) lower than the carrying value.
31.12.10 31.12.09
Carrying value
Fair value
Carrying value Fair value
ASSETS
Cash 608.4 608.4 638.9 638.9
Balances with central bank 4,946.9 4,946.9 4,827.1 4,827.1
Loans and advances to credit institutions 4,373.7 4,373.7 4,633.4 4,632.2
Loans and advances to customers 56,432.0 51,861.2 61,846.3 54,608.6
Other assets 747.2 747.2 662.8 662.8
TOTAL ASSETS 67,108.2 62,537.4 72,608.5 65,369.6
LIABILITIES
Due to credit institutions 22,209.0 22,162.2 29,786.0 29,625.4
Due to customers 33,630.0 33,716.7 31,824.2 31,788.2
Loan funds 208.7 202.9 188.5 182.2
Other financial liabilities 1,127.6 1,127.6 851.1 851.1
Subordinated loans 1,833.7 1,700.7 2,615.9 2,306.8
TOTAL LIABILITIES 59,009.0 58,910.1 65,265.7 64,753.7

AS SEB Pank, Annual Report 2010
- 64 -
B) Financial instruments measured at fair value
IFRS 7 specifies a hierarchy of valuation techniques based on whether the inputs to those valuation techniques are observable or unobservable. Observable inputs reflect market data obtained from independent sources; unobservable inputs reflect the Group’s market assumptions. These two types of inputs have created the following fair value hierarchy: Level 1 - Quoted prices (unadjusted) in active markets for identical assets or liabilities. This level includes listed equity securities and debt instruments on exchanges but also instruments quoted by market participants. Level 2 - Inputs other than quoted prices included within Level 1 that are observable for the asset or liability, either directly (that is, as prices) or indirectly (that is, derived from prices). The sources of input parameters like Euro yield curve or counterparty credit risk are Bloomberg and Thomson Reuters. Level 3 - Inputs for the asset or liability that are not based on observable market data (unobservable inputs). This level includes equity investments and debt instruments with significant unobservable components.
31.12.10 31.12.09
Level 1 Level 2 Level 3 Total Level 1 Level 2 Level 3 Total
Financial assets at fair value through profit and loss
Financial assets held for trading 323.9 18.4 0.0 342.3 352.7 13.5 0.0 366.2
Debt securities 2.8 18.4 0.0 21.2 1.0 13.5 0.0 14.5
Derivatives 321.1 0.0 0.0 321.1 351.7 0.0 0.0 351.7
Available for sale financial assets 71.6 2.8 4.4 78.8 60.7 3.3 35.6 99.6
Investment securities - debt 0.0 2.8 0.0 2.8 0.0 3.3 20.6 23.9
Investment securities - equity 71.6 0.0 4.4 76.0 60.7 0.0 15.0 75.7
TOTAL ASSETS 395.5 21.2 4.4 421.1 413.4 16.8 35.6 465.8
Financial liabilities at fair value through profit and loss
Financial liabilities held for trading 349.4 0.0 0.0 349.4 349.4 0.0 0.0 349.4
Financial liabilities designated at fair value 0.0 0.0 0.0 0.0 9.1 0.0 0.0 9.1
TOTAL LIABILITIES 349.4 0.0 0.0 349.4 358.5 0.0 0.0 358.5

AS SEB Pank, Annual Report 2010
- 65 -
2.8. Capital management The Group’s Capital Policy defines how capital management should support the business goals. Shareholders’ return requirement shall be balanced against the capital requirements of the regulators and the equity necessary to conduct the business of the Group. ALCO and the Chief Financial Officer are responsible for the process linked to overall business planning, to assess capital requirements in relation to the Group’s risk profile, and for proposing a strategy for maintaining the desired capital levels. The Group’s capitalisation shall be risk-based and built on an assessment of all risks incurred in the Group’s business. It shall be forward-looking and aligned with short- and long-term business plans as well as with expected macroeconomic developments. This process, the Internal Capital Adequacy Assessment Process (ICAAP), is managed by Risk Control. Together with continuous monitoring, and reporting of the capital adequacy to the Management Board, this ensures that the relationships between shareholders’ equity, ICAAP and regulatory based requirements are managed in such a way that the Group does not jeopardise the profitability of the business and the financial strength of the Group. Capital ratios are the main communication vehicle for capital strength. Good risk management notwithstanding, the Group must keep capital buffers against unexpected losses. In the SEB Group capital is managed centrally, meeting also local requirements as regards statutory and internal capital. Following the SEB Group Capital Policy the parent company shall promptly arrange for additional capital if SEB Pank requires capital injections to meet the decided level.
Reconciliation of Level 3 Items
TotalAt 1 January 2009 0.0 18.1 18.1Profit or loss 0.0 -3.7 -3.7Other comprehensive income -6.6 5.4 -1.2Settlements 0.0 -4.8 -4.8Transfers into or out of Level 3 27.2 0.0 27.2At 31 December 2009 20.6 15.0 35.6
0.0 0.1 0.1
At 1 January 2010 20.6 15.0 35.6Profit or loss 6.5 0.1 6.6Other comprehensive income 0.0 -0.4 -0.4Purchases 0.0 3.1 3.1Settlements -27.1 -0.3 -27.4Transfers into or out of Level 3 0.0 -13.0 -13.0At 31 December 2010 0.0 4.5 4.5
0.0 -0.3 -0.3Total losses for the period included in profit or loss for assets/liabilities held at 31.12.10
Investment securities - equity
Investment securities - debt
Total losses for the period included in profit or loss for assets/liabilities held at 31.12.09
Available-for-sale financial assets

AS SEB Pank, Annual Report 2010
- 66 -
As a matter of practice, the Bank may prepay outstanding subordinated debt to optimise the capital structure. The Authority requires each bank or banking group to: (a) hold the minimum level of the regulatory capital: net-owners’ equity must be over 5 EURmio (78.2 EEKmio), and (b) maintain a ratio of total regulatory capital to the risk-weighted asset at or above minimum of 10%. According to Investment Funds Act, the share capital of a management company shall be equivalent to at least 3 EURmio (46.9 EEKmio), if the management company manages a mandatory pension fund (AS SEB Varahaldus). According to Securities Market Act, the share capital of an investment firm shall be equivalent to at least 125 EURthousand (1.96 EEKmio), if the firm is providing services of securities portfolio management and is organising the issuance of securities or public offers (AS SEB Enskilda).
Capital adequacy(millions of EEK)
CAPITAL BASE 31.12.10 31.12.09Paid-in share capital 665.6 665.6Premium 1,346.6 1,346.6General banking reserves 306.0 306.0Retained earnings 5,143.4 6,428.2
-0.8 -3.8Intangibles -8.0 -9.6Loss for the period (group without life insurance) 0.0 -1,427.1Audited profit for the period (group without life insurance) 853.4 0.0Total primary own funds 8,306.2 7,305.9Subordinated debt 1,830.7 2,613.0Available for sale financial instruments 2.6 2.9Unrealised part of profit on shares of subsidiaries and associated companies 0.4 1.7Allowances and adjustments exceeding expected loss 181.7 231.2Total supplementary own funds 2,015.4 2,848.8Majority holding in insurers 0.0 30.0Total deductions 0.0 30.0Primary own funds after deductions 8,306.2 7,290.9Supplementary own funds included in calculation of capital adequacy 2,015.4 2,833.8Own funds included in calculation of capital adequacy 10,321.6 10,124.7
Unrealised profit for previous periods on shares of subsidiaries and associated companies (negative)

AS SEB Pank, Annual Report 2010
- 67 -
Basel II calculations 2009 are made for the Group without AS SEB Elu- ja Pensionikindlustus (life insurance), holding in insurer is deducted from assets and own funds.
2.9. Internal control system Internal control system is a management tool that covers the activities of the entire banking Group and forms an integral part of the internal processes in the bank and in the Group. The responsibility for the establishment and operation of internal control system lies with the Management Board; the need for and the scope of controls is determined by the extent and nature of the risks involved. The bank’s Supervisory Board carries out supervision of the activities of the bank and the entire Group by establishing the general risk management principles.
CAPITAL REQUIREMENTS 31.12.10 31.12.09Municipalities and regions with standardised approach 85.1 92.0
1.8 2.1Retail claims with standardised approach 220.5 223.7Overdue claims with standardised approach 20.5 19.7Shares of investment funds with standardised approach 6.9 6.1Other assets with standardised approach 49.8 52.6
76.4 35.5Other companies with IRB 2,209.9 3,058.1Retail claims with IRB 742.2 760.3
Total capital requirements for covering the credit risk and counterparty credit risk 3,413.1 4,250.1Capital requirement for covering interest position risk 19.5 28.9Capital requirement for covering equity position risk 0.4 0.5Capital requirement for covering AMA of operational risk 131.4 95.5Capital requirements total 3,564.4 4,375.0
4,694.7 5,036.1Capital requirements for calculating capital adequacy 4,694.7 5,036.1Transition period floor of own funds if using IRB
State agencies, non-profit institutions and associations with standardised approach
Credit institutions, investment firms and municipalities with IRB
CAPITAL RATIOS31.12.10 31.12.09
Capital adequacy, % 21.99 20.10Tier 1 Capital Ratio, % 17.69 14.48Tier 2 Capital Ratio, % 4.30 5.62
AS SEB PankAS SEB Liising GroupAS SEB VarahaldusAS BangaloAS SEB EnskildaOÜ Estectus (no more in consolidation group from February 2010)
MEMBERS OF CONSOLIDATION GROUP, INCLUDED TO CAPITAL ADEQUACY CALCULATION
MEMBERS OF CONSOLIDATION GROUP, NOT INCLUDED TO CAPITAL ADEQUACY CALCULATIONAS SEB Elu- ja Pensionikindlustus (no more in consolidation group from January 2010)

AS SEB Pank, Annual Report 2010
- 68 -
To achieve the approved business goals, the Management Board of the bank establishes in accordance with the statutory requirements the necessary sub-plans, incl. competence and scope of liability as well as the internal rules that regulate activities, the accounting rules and the procedure for preparing and submitting operating reports. 2.10. Control functions The Group has three control functions which are independent from the business operations: Risk Control, Compliance and Internal Audit. The Group’s risk control function (Risk Control Department) responsibilities are to ensure that risks are identified and analysed and to measure, follow-up and report risks taken by units within the Group (see further on p. 2.1-2.8). Risk Control is subordinated to the Head of Credits, Member of the Management Board. Risk Control is also regularly reporting directly to the Management Board and ALCO.. The Compliance function in SEB Pank Group is global and independent from the business organisation. Its tasks are to mitigate compliance risks, ensure compliance quality, drive and promote compliance issues. Compliance Department, directly subordinated to the Chairman of the Management Board, supports the business and management by securing that the business in SEB Pank Group is carried out in compliance with regulatory requirements. In matters of common interest, Compliance co-operates with the Legal, Internal Audit, Risk Control and Security functions. The areas of responsibility for the Compliance function relate to areas of customer protection, market conduct, prevention of money laundering and terrorist financing, regulatory systems and controls. The SEB Pank Group’s instruction for the handling of conflicts of interests, ethics policy, market abuse instruction, instruction on measures to prevent money laundering, Code of Business Conduct are of special importance. The Internal Audit Department is directly subordinated to the Supervisory Board. Internal Audit Department and SEB Audit and Compliance Committee are responsible for monitoring of the existence and functioning of efficient internal control system, to provide objective and independent assurance over effectiveness of governance, risk management and controls, recommend actions in order to improve internal control. The SEB Audit and Compliance Committee co-ordinates the Internal Audit and Compliance work in accordance with the group’s business objectives and overall risk assessment.

AS SEB Pank, Annual Report 2010
- 69 -
Notes 3 - 36 to Financial Statements of AS SEB Pank Group
(millions of EEK)
3. Interest and similar income2010 2009
Loans 1,771.9 2,600.7Leasing 146.4 446.9Deposits with other banks 27.5 29.4Fixed income securities 2.4 16.4
1,948.2 3,093.4
4. Interest expenses and similar charges2010 2009
Credit institutions -460.1 -885.0Time and other saving deposits -217.2 -555.3Demand deposits -47.5 -237.9Subordinated debts -41.4 -77.7Loan funds -5.4 -6.2Issued bonds 0.0 -2.5Other -0.1 -0.4
-771.7 -1,765.0
5. Fee and commission income2010 2009
Credit and payment cards 301.6 303.4Securities market services 191.2 181.4Transaction fees 115.9 119.0Credit contracts* 61.5 65.0Non-life insurance brokerage fees 37.9 38.7Other settlement fees 29.2 23.3Income from leasing agreements (full service) 24.7 35.3Income from electronic channels 17.6 16.8Cash handling fees 16.9 13.2Corporate Finance fees 6.2 32.4Commodity futures fees 1.7 0.0Other 23.1 27.3
827.5 855.8
* Credit contracts include loan, leasing, letter of credit and guarantee contracts, which are short-term and do not constitute interest income, but are of administrative nature for arrangement or reorganisation ofcredits.
Group is calculating interest income from loans with 60 days or more overdue based on cash received.Until 60 days overdue limit has not been breached interest income is recognized continuously based oncontractual rate. The difference comparing to full effective interest income recognition was estimated for2010 and 2009 to result in immaterial misstatement.

AS SEB Pank, Annual Report 2010
- 70 -
6. Fee and commission expense2010 2009
Credit and payment cards -115.3 -124.1Cash collecting fees -30.7 -27.6Expenses to leasing agreements (full service) -19.5 -26.7Securities market -19.5 -20.7Transaction fees -12.9 -16.6Expenses of electronic channels -10.5 -13.9Corporate Finance fees -0.1 -8.3Other -15.8 -15.4
-224.3 -253.3
7. Net income from foreign exchange2010 2009
Gain(loss) from transactions 192.4 25.4
Currency translation differences -71.9 91.1
120.5 116.5
8.
2010 2009
Gain(loss) from trading securities -47.8 -5.6Gain(loss) from shares -53.0 -0.1Gain(loss) from fixed income securities 5.2 -5.5
Gain(loss) from financial assets at fair value 6.3 7.0Gained from fixed income securities 6.3 7.0
Derivatives 7.5 64.0Equity derivatives 16.2 11.5Currency derivatives 10.6 40.5Interest derivatives -19.3 12.0
-34.0 65.4
Gains less losses from financial assets at fair value through profit or loss
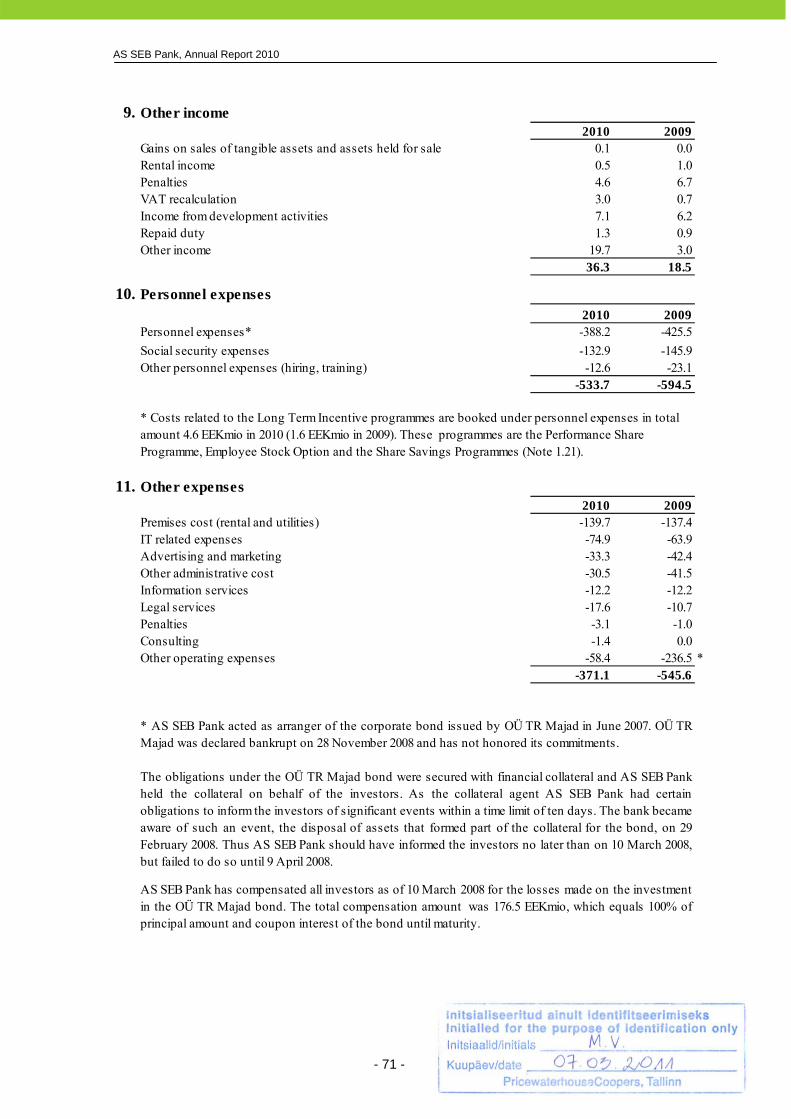
AS SEB Pank, Annual Report 2010
- 71 -
9. Other income2010 2009
Gains on sales of tangible assets and assets held for sale 0.1 0.0Rental income 0.5 1.0Penalties 4.6 6.7VAT recalculation 3.0 0.7Income from development activities 7.1 6.2Repaid duty 1.3 0.9Other income 19.7 3.0
36.3 18.5
10. Personnel expenses2010 2009
Personnel expenses* -388.2 -425.5
Social security expenses -132.9 -145.9Other personnel expenses (hiring, training) -12.6 -23.1
-533.7 -594.5
11. Other expenses2010 2009
Premises cost (rental and utilities) -139.7 -137.4IT related expenses -74.9 -63.9Advertising and marketing -33.3 -42.4Other administrative cost -30.5 -41.5Information services -12.2 -12.2Legal services -17.6 -10.7Penalties -3.1 -1.0Consulting -1.4 0.0Other operating expenses -58.4 -236.5 *
-371.1 -545.6
* AS SEB Pank acted as arranger of the corporate bond issued by OÜ TR Majad in June 2007. OÜ TRMajad was declared bankrupt on 28 November 2008 and has not honored its commitments.
* Costs related to the Long Term Incentive programmes are booked under personnel expenses in total amount 4.6 EEKmio in 2010 (1.6 EEKmio in 2009). These programmes are the Performance Share Programme, Employee Stock Option and the Share Savings Programmes (Note 1.21).
The obligations under the OÜ TR Majad bond were secured with financial collateral and AS SEB Pankheld the collateral on behalf of the investors. As the collateral agent AS SEB Pank had certainobligations to inform the investors of significant events within a time limit of ten days. The bank became aware of such an event, the disposal of assets that formed part of the collateral for the bond, on 29February 2008. Thus AS SEB Pank should have informed the investors no later than on 10 March 2008,but failed to do so until 9 April 2008.
AS SEB Pank has compensated all investors as of 10 March 2008 for the losses made on the investmentin the OÜ TR Majad bond. The total compensation amount was 176.5 EEKmio, which equals 100% ofprincipal amount and coupon interest of the bond until maturity.

AS SEB Pank, Annual Report 2010
- 72 -
Development costs Costs associated with developing or maintaining computer software programmes are recognised as an expense as incurred. Advertising expenses and the launch of new products, services and processes are expensed as incurred. Expenditures related to trademarks, etc., to be developed inside the company are also expensed at the moment of their occurrence. In 2010 AS SEB Pank had expenses for the developing IT systems and electronic products in total amount of 51,5 EEKmio (42,1 EEKmio in 2009). 12. Impairment losses on loans and advances
* includes allowance for receivables from bond issuer in amount of 6.6 EEKmio.
2010 Credit insti-
tutionsLoans to
CorporatesLeases to
CorporatesHousing
loans
Other loans to Private
individualsSeized assets TOTAL
0.0 51.3 -33.3 -143.8 -13.2 0.0 -139.0 impairment losses of reporting period (Note 15) 0.0 -485.5 -111.4 -190.9 -91.4 0.0 -879.2 recoveries from write-offs (Note 15) 0.0 2.1 0.0 0.0 1.5 0.0 3.6 decreasing of impairment losses of previous period (Note 15) 0.0 534.7 78.1 47.1 76.7 0.0 736.6
0.0 -3.4 0.0 0.0 0.0 0.0 -3.4Assets held for sale 0.0 0.0 0.0 0.0 0.0 0.0 0.0 reappraisal 0.0 0.0 0.0 0.0 0.0 0.0 0.0 realised gains / losses 0.0 0.0 0.0 0.0 0.0 0.0 0.0
0.0 47.9 -33.3 -143.8 -13.2 0.0 -142.4
2009 Credit insti-
tutionsLoans to
CorporatesLeases to
CorporatesHousing
loans
Other loans to Private
individualsSeized assets TOTAL
0.0 -1,611.9 -215.6 -66.0 -85.9 0.0 -1,979.4 impairment losses of reporting period (Note 15) 0.0 -1,694.5 * -260.0 -235.2 -151.0 0.0 -2,340.7 recoveries from write-offs (Note 15) 0.0 0.9 0.0 0.0 1.1 0.0 2.0 decreasing of impairment losses of previous period (Note 15) 0.0 81.7 44.4 169.2 64.0 0.0 359.3
0.0 -0.2 0.0 0.0 0.0 0.0 -0.2Assets held for sale 0.0 0.0 0.0 0.0 0.0 -17.1 -17.1 reappraisal 0.0 0.0 0.0 0.0 0.0 10.1 10.1 realised gains / losses 0.0 0.0 0.0 0.0 0.0 -27.2 -27.2
0.0 -1,612.1 -215.6 -66.0 -85.9 -17.1 -1,996.7
Impairment losses
Impairment losses
Impairment losses for contingent liabilities
Impairment losses for contingent liabilities

AS SEB Pank, Annual Report 2010
- 73 -
13. Balances with central bank31.12.10 31.12.09
Demand deposits 4,946.1 4,826.1incl. -mandatory reserve requirement 678.2 3,751.1
-demand deposits, cash equivalents 4,267.9 1,075.0Accrued interest receivable 0.8 1.0
4,946.9 4,827.1
Mandatory reserve requirement, monitored on basis of December average 3,811.9 8,814.5Mandatory reserve fulfilment, monitored on basis of December average 4,147.7 8,849.2Mandatory reserve overbalance, monitored on basis of December average 335.8 34.7
14. Loans and advances to credit institutions31.12.10 31.12.09
Reverse repos* 0.0 4,345.8Demand deposits* 3,894.5 268.6Time deposits 478.9 17.8Accrued interest receivable 0.3 1.2
4,373.7 4,633.4
* Cash equivalents in continuing operations 3,894.5 4,614.4
Due from credit institutions, registered in EU (except Estonia) 4,285.7 4,431.5Due from credit institutions, registered in Estonia 1.1 109.4Due from credit institutions, registered in other countries 86.9 92.5
4,373.7 4,633.4
Mandatory reserve deposits are available for use by the Group's day-to-day business. Mandatory reserve earnsinterest at 0,25%. In 2010 the Group earned interest in amount of 11.8 EEKmio (2009 18.9 EEKmio).
Until 31.08.2010, Estonian commecial banks were obliged to keep 15% of the compulsory reserve base on theaccount with Eesti Pank. From 01.09.2010 to 31.10.2010 respective amoount was 11% of the base and from01.11.2010 to 31.12.2010 7% of the base. Starting from 01.01.2011, reserve requirement is 2% of the base,consisting obligations only up to 2 years.
Mandatory reserve on the correspondent account of the Eesti Pank is monitored on basis of monthly average.Since 01.07.2001 the reserve may be filled with external financial assets in the amount of 50% from the monthlyaverage mandatory reserve requirement. As at December 2010 the reserve requirement was filled by balanceswith central bank.

AS SEB Pank, Annual Report 2010
- 74 -
15. Loans and advances to customers31.12.10 31.12.09
Loans to Corporates 20,758.0 23,397.0Leases to Corporates 4,351.5 5,976.2Public sector 2,725.0 2,855.9Housing loans 23,213.6 23,776.4Other loans to Private individuals 5,383.9 5,840.8
56,432.0 61,846.3
Due from customers, registered in EU (except Estonia) 547.2 403.4Due from customers, registered in Estonia 55,841.0 61,380.7Due from customers, registered in other countries 43.8 62.2
56,432.0 61,846.3
Due from customers by currency is presented in Note 2, on page 54.
Past due is presented in Note 2, on page 50.Geographic concentration of assets and liabilities is presented in Note 2, on page 58.
Loans and advances to customers by remaining maturity
Less than 3 months
3-12 months 1-5 years 5-10 years
Over 10 years Total
31.12.10 3,248.1 6,064.1 22,930.6 8,492.1 15,697.1 56,432.0
31.12.09 4,450.5 7,048.4 24,068.2 9,638.3 16,640.9 61,846.3
Gross and net investments on finance leases31.12.10 31.12.09
Gross investment 6,758.3 8,793.7up to 1 year 2,845.2 3,255.91 - 5 years 3,641.5 5,116.0over 5 years 271.6 421.8
Unearned future finance income on finance leases (-) -420.8 -585.6
Net investment in finance leases* 6,337.5 8,208.1up to 1 year 2,661.1 3,019.31 - 5 years 3,429.3 4,805.3over 5 years 247.1 383.5
31.12.10 31.12.09Net investment in finance leases by interest rates 6,337.5 8,208.1<= 5% 4,357.0 5,389.65-10% 1,975.0 2,810.110-15% 5.2 7.9>15% 0.3 0.5
31.12.10 31.12.09Net investment in finance leases by base currencies 6,337.5 8,208.1EEK 46.1 69.7EEK related to EUR 1,356.2 2,572.2USD 37.4 63.5
EUR 4,897.8 5,502.7
* Net investment in finance leases are presented above on lines: Public sector, Housing loans, Other loans toPrivate individuals.
Loan portfolio by economic sector presented in Note 2 "Risk policy and management", on page 59.
Due from customers by maturity is presented in Note 2, on page 61 and interest restatement by maturity on pages 56-57.

AS SEB Pank, Annual Report 2010
- 75 -
Allowances for impaired debt
2010
Credit insti-
tutionsLoans to
CorporatesLeases to
CorporatesHousing
loans
Other loans to Private
individuals TOTALAt the beginning of period (January, 1) 0.0 2,193.0 374.7 277.1 211.7 3,056.5Allowances of reporting period (Note 12) 0.0 485.6 102.5 190.9 91.4 870.4Decreasing of allowances of previous period (Note 12) 0.0 -534.7 -78.1 -47.1 -76.7 -736.6Loans and advances written off 0.0 -349.4 -33.9 -1.3 -0.9 -385.5Exchange rate adjustments 0.0 3.2 0.0 0.0 0.0 3.2At the end of period (December, 31) 0.0 1,797.7 365.2 419.6 225.5 2,808.0
Recoveries from write-offs (Note 12) 0.0 -2.1 0.0 0.0 -1.5 -3.6
2009
Credit insti-
tutionsLoans to
CorporatesLeases to
CorporatesHousing
loans
Other loans to Private
individuals TOTALAt the beginning of period (January, 1) 0.0 593.6 163.7 211.1 125.5 1,093.9Allowances of reporting period (Note 12) 0.0 1,687.9 * 260.0 235.2 151.0 2,334.1Decreasing of allowances of previous period (Note 12) 0.0 -81.7 -44.4 -169.2 -64.0 -359.3Loans and advances written off 0.0 -6.3 -4.6 0.0 -0.8 -11.7Exchange rate adjustments 0.0 -0.5 0.0 0.0 0.0 -0.5At the end of period (December, 31) 0.0 2,193.0 374.7 277.1 211.7 3,056.5
Recoveries from write-offs (Note 12) 0.0 -0.9 0.0 0.0 -1.1 -2.0
* allowance for receivables from bond issuer in amount of 6.6 EEKmio is not included.
16. Financial investments31.12.10 31.12.09
Financial assets held for trading 21.2 14.5Debt securities and other fixed income securities 21.2 14.5incl. valued with discounted cash flow method * 0.0 0.0incl. listed 21.2 14.1
Derivatives (Note 33) 321.1 351.7
Available for sale financial assets 78.8 99.6Shares and fund participations** 76.1 75.7incl. listed 0.0 0.0Debt securities and other fixed income securities 2.7 23.9incl. valued with discounted cash flow method * 2.7 3.3incl. listed 0.0 0.2
Total 421.1 465.8
Securities of entities, registered in EU (except Estonia) 90.4 115.7Securities of entities, registered in Estonia 325.1 337.2Securities of entities, registered in other countries 5.6 12.9
421.1 465.8
* Yield curves for discounted cash flow method were determined based on market interest rates for respective currency and creditspreads for respective issuer. To capture issuer credit risk, SEB internal credit rating (risk class) was used as based for credit spread.
** Includes participations in pension funds managed by AS SEB Varahaldus in the total value of 64.1 EEKmio (2009 58.8 EEKmio),ownership of which is required (1-2% of the specific managed fund) according to the Investment Fund's Act.
Generally financial investments are revalued in fair value based on active market quotations.

AS SEB Pank, Annual Report 2010
- 76 -
Movements of financial investments
Financial assets held for
tradingDerivatives (Note 33)
Financial assets at fair value
through profit or loss at inception
Available-for-sale financial
assets TOTAL
At the beginning of period (01.01.09) 15.8 383.4 1,043.3 412.4 1,854.9Acquisitions 20,172.7 0.0 0.0 9.5 20,182.2Disposals and redemptions -20,175.8 0.0 0.0 -320.4 -20,496.2Changes of value 1.8 20.3 0.0 -1.4 20.7Changes of currency rate 0.0 -52.0 0.0 -0.5 -52.5
Moved to the Discontinued operations 0.0 0.0 -1,043.3 0.0 -1,043.3At the end of period (31.12.09) 14.5 351.7 0.0 99.6 465.8
At the beginning of period (01.01.10) 14.5 351.7 0.0 99.6 465.8Acquisitions 7,945.0 0.0 0.0 3.1 7,948.1Disposals and redemptions -7,938.3 0.0 0.0 -32.7 -7,971.0Changes of value 0.0 -3.1 0.0 0.5 -2.6Changes of currency rate 0.0 -27.5 0.0 8.3 -19.2At the end of period (31.12.10) 21.2 321.1 0.0 78.8 421.1
17. Other assets31.12.10 31.12.09
Payments in transit 581.9 503.8Accrued revenue and prepaid expenses 156.0 151.8Accrued interest receivable 0.0 4.5Prepaid taxes 8.3 2.1Assets held for sale 1.0 0.6
747.2 662.8
Financial investments available for sale with ownership in shares over 10%, presented in the statement of financialposition on line "Available-for-sale financial assets" as of 31.12.2010 is Silverlaw OÜ, total value of shares was 0.05EEKmio. The aforementioned company is located in Estonia.
As of 31.12.2009 were Silverlaw OÜ, Kaarsar OÜ, OÜ Munga Maja, total value of shares was 0.1 EEKmio.
On June 25, 2010 all 29% ownership of shares in non-consolidated enterprise OÜ Munga Maja was sold.
On August 31, 2010 non-consolidated enterprise Kaarsar OÜ was liquidated (100% of the shares held by AS SEBPank).

AS SEB Pank, Annual Report 2010
- 77 -
18. Investments in associates
Movements of investments in associates
At the beginning of period
Disposals and
redemp- tions
Paid dividends
At the end of period
2010 10.1 -2.6 0.0 -0.8 6.7
2009 9.2 0.0 0.9 0.0 10.1
Associated companies
Nominal value(EEK) Assets
Liabili- ties
Total revenues
AS SEB Pank in
calculatedprofit/-loss
Balance value
Owner- ship, %
2010AS Sertifitseerimiskeskus 100,000 26.4 5.2 28.6 -0.1 1.4 25.00%OÜ TietoEnator Support 20,000 7.9 3.0 19.9 0.1 5.3 20.00%Total 34.3 8.2 48.5 0.0 6.7
2009SEB IT Partner Estonia OÜ 17,500 9.1 1.7 0.2 -0.4 2.6 35.00%AS Sertifitseerimiskeskus 100,000 30.7 9.3 40.1 0.8 5.4 25.00%OÜ TietoEnator Support 20,000 11.3 2.6 20.8 0.5 2.1 20.00%Total 51.1 13.6 61.1 0.9 10.1
Acquisitions and disposals of associated companies and subsidiaries
Acquisitions
Disposals
Profit from equity method
On June 17, 2010 an associate SEB IT Partner Estonia OÜ was liquidated (35% of the shares held by AS SEB Pank).
No disposals occurred in 2009.
No acquisitions occurred in 2010 and 2009.

AS SEB Pank, Annual Report 2010
- 78 -
Goodwill The gross carrying amount of goodwill was 379 EEKmio as of 31.12.2008. The goodwill originated from the acquisition of the Tallinna Pank group in 1998. The goodwill generated cash flows in Retail Banking and Merchant Banking segments. The carrying amount of goodwill in Retail Banking segment was 379 EEKmio. The goodwill is to be revised for impairment annually, or more frequently when there are indications that impairment may have occurred. In line with that principle, the goodwill impairment test was performed as of 30.06.2009. The reason for that was substantial worsening of economic outlook and revised forecasted budgets of the AS SEB Pank Group (compared to the perspectives presumed for the goodwill impairment test conducted as of 31.12.2008). The most significant changes since 31.12.2008 affecting expected cash flows used in the impairment test as of 30.06.2009 were as follows: 1) Significantly increased loan impairment loss levels which were based on the actual results from first half of the 2009 and expected further developments; 2) Significantly more pessimistic views taken towards to the recovery of the economy after the crisis would be lived through and duration of the expected recovery time.
19. Intangible assetsGoodwill Other Total
At the beginning of period (01.01.09)Cost 379.1 83.2 462.3Accumulated amortisation 0.0 -71.9 -71.9Carrying value 379.1 11.3 390.4
Opening carrying value 379.1 11.3 390.4Additions 0.0 4.4 4.4Amortisation charge 0.0 -6.1 -6.1
Impairment loss recognised -379.1 0.0 -379.1Closing carrying value 0.0 9.6 9.6
At end of period (31.12.09)Cost 0.0 87.2 87.2Accumulated amortisation 0.0 -77.6 -77.6Carrying value 0.0 9.6 9.6
Opening carrying value 0.0 9.6 9.6Additions 0.0 4.2 4.2Amortisation charge 0.0 -5.8 -5.8Closing carrying value 0.0 8.0 8.0
At end of period (31.12.10)Cost 0.0 88.7 88.7Accumulated amortisation 0.0 -80.7 -80.7Carrying value 0.0 8.0 8.0

AS SEB Pank, Annual Report 2010
- 79 -
The goodwill had been allocated to the Retail Banking and Merchant Banking segments for impairment testing. The impairment test was based on the asset’s value in use with forecasted cash flows for a period of five years plus residual value. The cash flows were determined based on short- and long-term trends in income and expense (including loan allowances) growth. The annual growth rate used after five years was 3% which embodied the expected long-term inflation rate adjusted for industry-specific expectations. The discount rate used was 13% which exhibited required rate of return of owners’ equity at that point in time. The assumptions specified here were for impairment test purposes only. The goodwill impairment test performed as of 30.06.2009 indicated that the impairment had occurred and the value in use of the goodwill is zero, therefore the management decided to recognise the goodwill impairment loss in full amount equal to its carrying amount. Had the impairment loss not been identified as of 30.06.2009 and the test were performed as of 31.12.2009, the results may have been different. There was no impairment identified in 2008, nor had been there any accumulated impairment losses from previous periods. No additions to the carrying amount of goodwill took place in 2009. As of 31.12.2010 and 31.12.2009 the carrying amount of goodwill was nil (379 EEKmio as of 31.12.2008).

AS SEB Pank, Annual Report 2010
- 80 -
20. Property, plant and equipment
Land BuildingsOther tangible
assets TotalAt the beginning of period (01.01.09)Cost 0.5 62.3 458.3 521.1Accumulated depreciation 0.0 -24.1 -350.4 -374.5Carrying value 0.5 38.2 107.9 146.6
Opening carrying value 0.5 38.2 107.9 146.6Additions 0.0 3.7 35.3 39.0Disposals (carrying value)* 0.0 -2.4 -7.9 -10.3Depreciation charge 0.0 -7.0 -49.5 -56.5Discontinued operations 0.0 -0.6 -1.4 -2.0Closing carrying value 0.5 31.9 84.4 116.8
At end of period (31.12.09)Cost 0.5 55.9 441.2 497.6Accumulated depreciation 0.0 -23.4 -355.4 -378.8Discontinued operations 0.0 -0.6 -1.4 -2.0Carrying value 0.5 31.9 84.4 116.8
Opening carrying value 0.5 31.9 84.4 116.8Additions 0.0 2.6 45.6 48.2Disposals (carrying value)** 0.0 0.0 -5.2 -5.2Depreciation charge 0.0 -6.5 -38.6 -45.1
Closing carrying value 0.5 28.0 86.2 114.7
At end of period (31.12.10)Cost 0.5 55.0 383.9 439.4Accumulated depreciation 0.0 -27.0 -297.7 -324.7Carrying value 0.5 28.0 86.2 114.7
* Sales revenue in 2009 7.1 EEKmio, sales profit 0,0 EEKmio, writing off 3.1 EEKmio.** Sales revenue in 2010 0.0 EEKmio, sales profit 0.0 EEKmio, writing off 3.6 EEKmio.

AS SEB Pank, Annual Report 2010
- 81 -
21. Investment properties
At the beginning of the period (01.01.09)Cost 0.0Accumulated depreciation 0.0Carrying value (31.12.09) 0.0
Opening carrying value (01.01.09) 0.0Additions 27.1Depreciation charge -2.0Reclassification* 27.4Discontinued operations -27.1At the end of the period (31.12.09) 25.4
At end of period (31.12.09)Cost 54.5Accumulated depreciation -2.0Discontinued operations -27.1Carrying value (31.12.09) 25.4
Opening carrying value (01.01.10) 25.4Depreciation charge -0.7At the end of the period (31.12.10) 24.7
At end of period (31.12.10)Cost 27.4Accumulated depreciation -2.7Carrying value (31.12.10) 24.7
* Includes repossessed property from loan portfolio (at cost 25.0 EEKmio and carring value 24.7 EEKmio) see also Note 2.2 on page 52.

AS SEB Pank, Annual Report 2010
- 82 -
22. Discontinued operations On January 28, 2010 AS SEB Pank sold 100% shares in AS SEB Elu- ja Pensionikindlustus according to the Management Board resolution from December 2009. Purchaser was SEB Trygg Liv Holding AB, a company, which belongs to the Skandinaviska Enskilda Banken AB (Publ.) Group. Sale price of shares of AS SEB Elu- ja Pensionikindlustus was 219 EEKmio and profit from the transaction in consolidated accounts was 51.3 EEKmio. On February 26, 2010 AS SEB Pank sold 100% ownership in OÜ Estectus according to the Management Board resolution from December 2009. Purchaser was Warehold B.V., a company, which located in Holland (later renamed to Baltectus B.V.) and belongs to the Skandinaviska Enskilda Banken AB (Publ.) Group. Sale price of ownership in OÜ Estectus was 50.6 EEKmio and profit from the transaction in consolidated accounts was 0.5 EEKmio.
A) Assets classified as discontinued operations31.12.10 31.12.09
Loans and advances to credit institutions 0.0 54.8Loans and advances to customers 0.0 2.3Financial assets held for trading 0.0 9.7Financial assets at fair value through profit or loss 0.0 1,050.3Other assets 0.0 14.7Property, plant and equipment 0.0 2.0Investment properties 0.0 27.1
0.0 1,160.9
31.12.10 31.12.09Financial liabilities 0.0 626.4Provisions 0.0 680.4
0.0 1,306.8
C) Net profit from discontinued operations2010 2009
Net insurance premium revenue 0.0 182.5Income from investments 0.0 34.0Fee income from investment contracts 0.0 13.4Other operating income 0.0 -1.0
Net insurance claims and disbursements 0.0 -153.0
Total net income from insurance activities 0.0 75.951.8 0.0
Personnel expenses 0.0 -19.3
Other expenses 0.0 -9.7
0.0 -0.5
Net profit from discontinued operations 51.8 46.4
B) Liabilities included in assets classified as discontinued operations
Net gain from sales of discontinued operations
Depreciation, amortisation and impairment of tangible and intangible assets
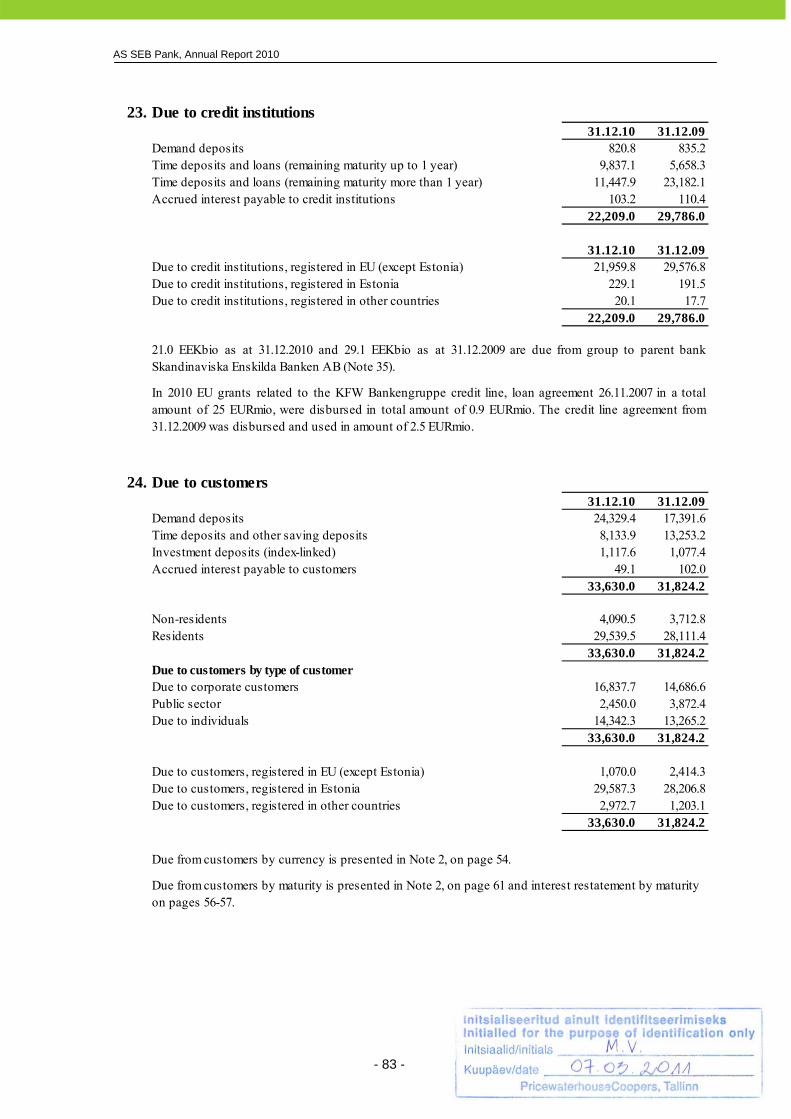
AS SEB Pank, Annual Report 2010
- 83 -
23. Due to credit institutions31.12.10 31.12.09
Demand deposits 820.8 835.2Time deposits and loans (remaining maturity up to 1 year) 9,837.1 5,658.3Time deposits and loans (remaining maturity more than 1 year) 11,447.9 23,182.1Accrued interest payable to credit institutions 103.2 110.4
22,209.0 29,786.0
31.12.10 31.12.09Due to credit institutions, registered in EU (except Estonia) 21,959.8 29,576.8Due to credit institutions, registered in Estonia 229.1 191.5Due to credit institutions, registered in other countries 20.1 17.7
22,209.0 29,786.0
24. Due to customers31.12.10 31.12.09
Demand deposits 24,329.4 17,391.6Time deposits and other saving deposits 8,133.9 13,253.2Investment deposits (index-linked) 1,117.6 1,077.4Accrued interest payable to customers 49.1 102.0
33,630.0 31,824.2
Non-residents 4,090.5 3,712.8Residents 29,539.5 28,111.4
33,630.0 31,824.2Due to customers by type of customerDue to corporate customers 16,837.7 14,686.6Public sector 2,450.0 3,872.4Due to individuals 14,342.3 13,265.2
33,630.0 31,824.2
Due to customers, registered in EU (except Estonia) 1,070.0 2,414.3Due to customers, registered in Estonia 29,587.3 28,206.8Due to customers, registered in other countries 2,972.7 1,203.1
33,630.0 31,824.2
Due from customers by currency is presented in Note 2, on page 54.
21.0 EEKbio as at 31.12.2010 and 29.1 EEKbio as at 31.12.2009 are due from group to parent bankSkandinaviska Enskilda Banken AB (Note 35).
In 2010 EU grants related to the KFW Bankengruppe credit line, loan agreement 26.11.2007 in a totalamount of 25 EURmio, were disbursed in total amount of 0.9 EURmio. The credit line agreement from31.12.2009 was disbursed and used in amount of 2.5 EURmio.
Due from customers by maturity is presented in Note 2, on page 61 and interest restatement by maturity on pages 56-57.
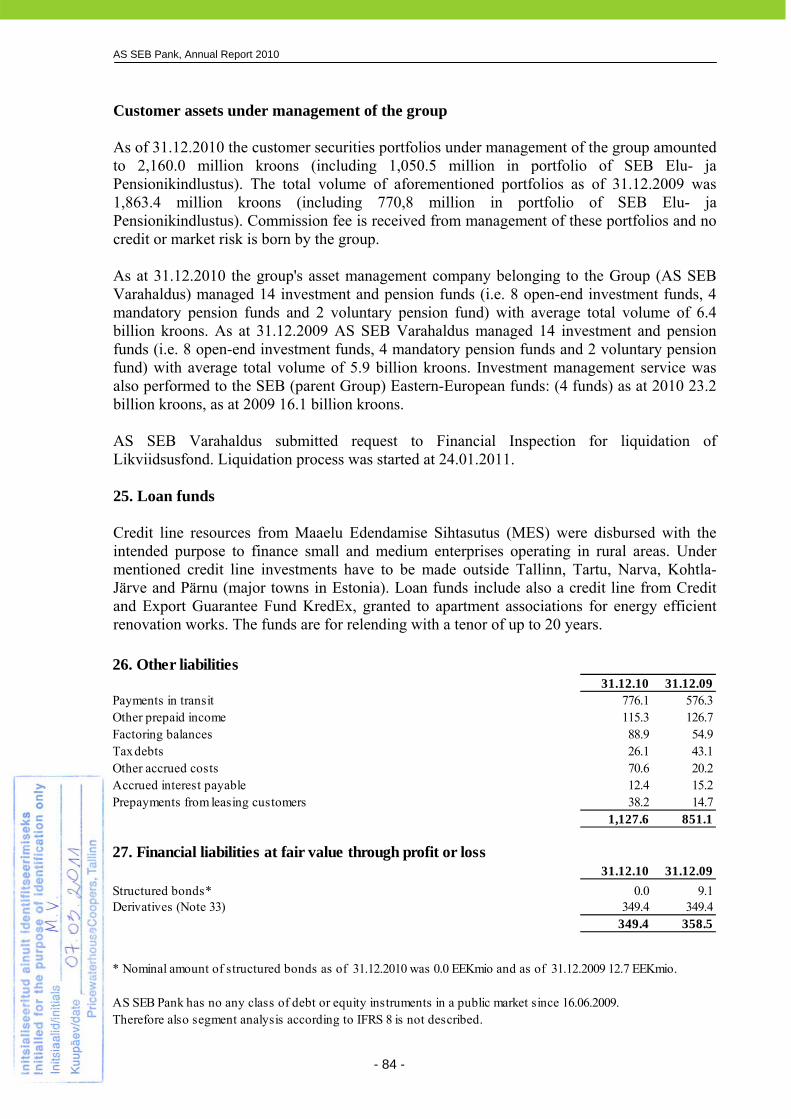
AS SEB Pank, Annual Report 2010
- 84 -
Customer assets under management of the group As of 31.12.2010 the customer securities portfolios under management of the group amounted to 2,160.0 million kroons (including 1,050.5 million in portfolio of SEB Elu- ja Pensionikindlustus). The total volume of aforementioned portfolios as of 31.12.2009 was 1,863.4 million kroons (including 770,8 million in portfolio of SEB Elu- ja Pensionikindlustus). Commission fee is received from management of these portfolios and no credit or market risk is born by the group. As at 31.12.2010 the group's asset management company belonging to the Group (AS SEB Varahaldus) managed 14 investment and pension funds (i.e. 8 open-end investment funds, 4 mandatory pension funds and 2 voluntary pension fund) with average total volume of 6.4 billion kroons. As at 31.12.2009 AS SEB Varahaldus managed 14 investment and pension funds (i.e. 8 open-end investment funds, 4 mandatory pension funds and 2 voluntary pension fund) with average total volume of 5.9 billion kroons. Investment management service was also performed to the SEB (parent Group) Eastern-European funds: (4 funds) as at 2010 23.2 billion kroons, as at 2009 16.1 billion kroons. AS SEB Varahaldus submitted request to Financial Inspection for liquidation of Likviidsusfond. Liquidation process was started at 24.01.2011. 25. Loan funds Credit line resources from Maaelu Edendamise Sihtasutus (MES) were disbursed with the intended purpose to finance small and medium enterprises operating in rural areas. Under mentioned credit line investments have to be made outside Tallinn, Tartu, Narva, Kohtla-Järve and Pärnu (major towns in Estonia). Loan funds include also a credit line from Credit and Export Guarantee Fund KredEx, granted to apartment associations for energy efficient renovation works. The funds are for relending with a tenor of up to 20 years. 26. Other liabilities
31.12.10 31.12.09Payments in transit 776.1 576.3Other prepaid income 115.3 126.7Factoring balances 88.9 54.9Tax debts 26.1 43.1Other accrued costs 70.6 20.2Accrued interest payable 12.4 15.2Prepayments from leasing customers 38.2 14.7
1,127.6 851.1
27. Financial liabilities at fair value through profit or loss31.12.10 31.12.09
Structured bonds* 0.0 9.1Derivatives (Note 33) 349.4 349.4
349.4 358.5
AS SEB Pank has no any class of debt or equity instruments in a public market since 16.06.2009.Therefore also segment analysis according to IFRS 8 is not described.
* Nominal amount of structured bonds as of 31.12.2010 was 0.0 EEKmio and as of 31.12.2009 12.7 EEKmio.

AS SEB Pank, Annual Report 2010
- 85 -
28. Provisions
Life insurance provision
Life insurance
provision of unsettled
claimsProvisions
in bankProvisions
total
Provisions as at 01.01.09 607.3 3.9 0.0 611.2
Calculated during the period under review 0.0 0.0 2.6 2.6
Discontinued operations (Note 22). -607.3 -3.9 0.0 -611.2
Total provisions as at 31.12.09 0.0 0.0 2.6 2.6
Provisions as at 01.01.10 0.0 0.0 2.6 2.6
Calculated during the period under review 0.0 0.0 1.5 1.5
Total provisions as at 31.12.10 0.0 0.0 4.1 4.1
Carrying
31.12.09 amount 0-5 years
Provisions 2.6 2.6
Carrying
31.12.10 amount 0-5 years
Provisions 4.1 4.1
29. Subordinated loans31.12.10
Issuer Amount in issued currency (mio)
Amountin EEKmio
Interest rate at reporting
dateMaturity
dateSkandinaviska Enskilda Banken AB (publ) 17.0 EUR 266.0 2.00 21.12.16
Skandinaviska Enskilda Banken AB (publ) 50.0 EUR 782.3 2.01 26.05.16
Skandinaviska Enskilda Banken AB (publ) 50.0 EUR 782.3 2.01 29.05.17
Accrued interest payable 3.1
1,833.7
31.12.09
Issuer Amount in issued currency (mio)
Amountin EEKmio
Interest rate at reporting
dateMaturity
date
Skandinaviska Enskilda Banken AB (publ) 17.0 EUR 266.0 1.75 21.12.16
Skandinaviska Enskilda Banken AB (publ) 50.0 EUR 782.3 1.51 23.09.15
Skandinaviska Enskilda Banken AB (publ) 50.0 EUR 782.3 1.74 26.05.16
Skandinaviska Enskilda Banken AB (publ) 50.0 EUR 782.3 1.74 29.05.17
Accrued interest payable 3.0
2,615.9
Future expected undiscounted cash flows by years
Future expected undiscounted cash flows by years

AS SEB Pank, Annual Report 2010
- 86 -
Subordinated debt may be considered as hybrid instrument, which means that due to their partial capital nature may be included under the bank’s own funds in case certain requirements are met. In calculation of capital adequacy, loans with the remaining maturity over 5 years meeting certain requirements are included in own funds. Regarding loans with maturity less than 5 years, a 20% straight-line depreciation is applied in each following year. The loan is not considered own funds when the remaining maturity period is less than one year. Subordinated debt is issued at a variable interest rate and the interest restatement is scheduled in 12 month from the reporting date (see Note 2 page 56-57). Interest is restated for 6 months period in advance. Subordinated debt is repayable at the option of the borrower if the remaining maturity is less than 5 years. 30. Shareholders
31. Dividend policy AS SEB Pank is 100%-owned by Skandinaviska Enskilda Banken AB (publ). In working out the strategy for equity management, profit distribution and formation of reserves the bank is following the common approach of future risks and performance strategy of the SEB Group. The Group has not paid any dividend since acquisition by Skandinaviska Enskilda Banken AB (publ).
Country
Number of shares
% from total number
Shareholders of AS SEB Pank at 31.12.2010:Skandinaviska Enskilda Banken AB (publ) Sweden 66,562,381 100.00
Shareholders of AS SEB Pank at 31.12.2009:Skandinaviska Enskilda Banken AB (publ) Sweden 66,562,381 100.00
Nominal value of shares: 10 EEK
Maximum number of shares in articles of association: 240,000,000
All issued shares are paid for.
See capital adequacy calculation on page 66.
Share information 31.12.10 31.12.09
Number of shares of AS SEB Pank at end of period 66,562,381 66,562,381
Average number of shares, adjusted with issues 66,562,381 66,562,381
Net profit/loss, EEKmio 853.4 -1,381.9
Skandinaviska Enskilda Banken AB (publ) is the ultimate parent of AS SEB Pank. Skandinaviska EnskildaBanken AB (publ) (incorporated in Sweden) does not have a controlling parent company.

AS SEB Pank, Annual Report 2010
- 87 -
32. Other reserves
According to the Income Tax Act valid until 2000 the credit institutions were able to form a tax exempt general banking reserve up to 5% of the loan portfolio to cover potential losses. Allocations to this reserve could be deducted from the taxable income. According to the Commercial Code at least 5% of the net income has to be transferred into the statutory reserve capital every year, until the reserve capital comprises 10% of the share capital. The statutory reserve capital may be used for covering losses. AS SEB Pank profit for the year 1994-1997 has been allocated to that general banking reserve (except for 6.2 EEKmio from the 1995-year profit). The reserve amounts to 298.5 EEKmio, including also the bank's statutory reserve capital according to the Commercial Code. In 1998-2009 the bank made no allocations to the reserves. In 2001-2009 the subsidiaries of AS SEB Pank made allocations to the statutory reserves from their undistributed profits in the amount of 7.5 EEKmio.
31.12.10 31.12.09General banking reserve 298.5 298.5Statutory reserve 7.5 27.0Revaluation reserve of Available-for-sale financial assets 5.9 6.5
311.9 332.0
Movements of other reserves
General banking reserve
Revaluation reserve of
Available-for-sale financial
assetsStatutory reserve
Total other reserves
Balance at the beginning of the period (01.01.09) 298.5 -5.4 25.8 318.9Transfer from the retained profits 0.0 0.0 1.2 1.2Net gain/loss from the change in fair value 0.0 11.9 0.0 11.9Balance at the end of the period (31.12.09) 298.5 6.5 27.0 332.0
Transfer from the retained profits 0.0 0.0 -19.5 -19.5Net gain/loss from the change in fair value 0.0 -0.6 0.0 -0.6Balance at the end of the period (31.12.10) 298.5 5.9 7.5 311.9

AS SEB Pank, Annual Report 2010
- 88 -
* Derivative transactions are executed to cover the client’s position and the derivative risks are not taken to own portfolio. All risks arising from these transactions are fully mitigated with parent company. The equity option prices are calculated using for all input data (e.g. underlying prices or volumes) either independently sourced input (e.g. the underlying prices) or an independent price verification is performed on the next day to compare the values to independently sourced market data (e.g. for volumes), see Note 16. Pursuant to the Law of Obligations Act, the operating lease agreements, concluded by AS SEB Liising are partially related to a contingent liability, the likelihood and the amount of which can not be definitely determined. According to the management of the company, based on the previous practice, realisation of the obligation is unlikely.
33. Contingent assets and liabilities and commitments
31.12.10 Contract amount Balance value
Assets Liabilities Assets Liabilities
1. Irrevocable transactions 233.9 7,453.4 0.0 0.0
1.1. Guarantees and pledges 38.3 3,089.7 0.0 0.0
incl. financial guarantees 0.0 1,293.0 0.0 0.0
1.2. Loan commitments 195.6 4,363.7 0.0 0.0
2. Derivatives 12,267.0 12,248.6 321.1 349.4
2.1. Currency related derivatives 6,083.7 6,089.0 26.5 31.8
2.2. Interest related derivatives 5,407.8 5,406.7 237.2 237.1
2.3. Equity related derivatives* 775.5 752.9 57.4 80.5
12,500.9 19,702.0 321.1 349.4
31.12.09 Contract amount Balance value
Assets Liabilities Assets Liabilities
1. Irrevocable transactions 423.8 8,056.7 0.0 0.0
1.1. Guarantees and pledges 32.6 3,285.8 0.0 0.0
incl. financial guarantees 0.0 1,288.5 0.0 0.0
1.2. Loan commitments 391.2 4,770.9 0.0 0.0
2. Derivatives 12,843.7 12,775.8 351.7 349.4
2.1. Currency related derivatives 6,196.5 6,164.3 45.2 15.7
2.2. Interest related derivatives 5,627.5 5,627.4 246.0 245.9
2.3. Equity related derivatives* 1,019.7 984.1 60.5 87.8
13,267.5 20,832.5 351.7 349.4

AS SEB Pank, Annual Report 2010
- 89 -
Potential income tax on distribution of dividends The retained earnings of the Group as at 31 December 2010 were 5,996.9 (31 December 2009: 5,119.3) EEKmio. Distribution of retained earnings as dividends to the owners is subject to the income tax at the rate of 21/79 on the amount paid out as net dividends. Therefore, from the retained earnings available at the reporting date it is possible to pay out to the shareholders as dividends 4,737.5 EEKmio and the corresponding income tax would amount to 1,259.3 EEKmio. As of 31 December 2009 it would have been possible to pay out dividends the amount of 4,044.2 EEKmio, and the corresponding income tax would have amounted to 1,075.1 EEKmio. As at 31 December 2010 (and 31 December 2009) 100% shares of AS SEB Pank are owned by Skandinaviska Enskilda Banken AB (publ), who makes the decisions about profit distribution. Skandinaviska Enskilda Banken AB (publ) has decided not to pay out dividends from the retained profit of AS SEB Pank. Potential liabilities arising from tax inspection In 2010 the tax authority did not conduct tax audit in the AS SEB Pank and subsidiaries. The tax authorities may at any time inspect the books and records of the company within 6 years subsequent to the reported tax year, and may as a result of their inspection impose additional tax assessments and penalties. The management of AS SEB Pank is not aware of any circumstances which may give rise to a potential material liability in this respect. Legal disputes There are no outstanding legal disputes from which AS SEB Pank Group could suffer major losses. 34. Subsequent events No such material events have occurred after the end of the financial year in AS SEB Pank, that would affect the conditions of the assets and liabilities as at the reporting date 31.12.2010. On 1 January 2011, the Republic of Estonia joined the Euro area and adopted the Euro as its national currency, replacing the Estonian kroon. Consequently, starting from 2011, AS SEB Pank’s functional currency is Euro and the statutory financial statements of 2011 and later periods will be presented in Euros. Comparative figures will be recalculated to euros using the conversion rate of 15.6466 EEK/EUR. The exchange rate has remained unchanged during previous periods. In March 2011 AS SEB Pank sold 100% shares in AS SEB Enskilda to Skandinaviska Enskilda Banken AB. The economic activities of AS SEB Enskilda do not have material effect on the financial results of AS SEB Pank Group. Consequently, the sale of shares is not presented as discontinued operations.
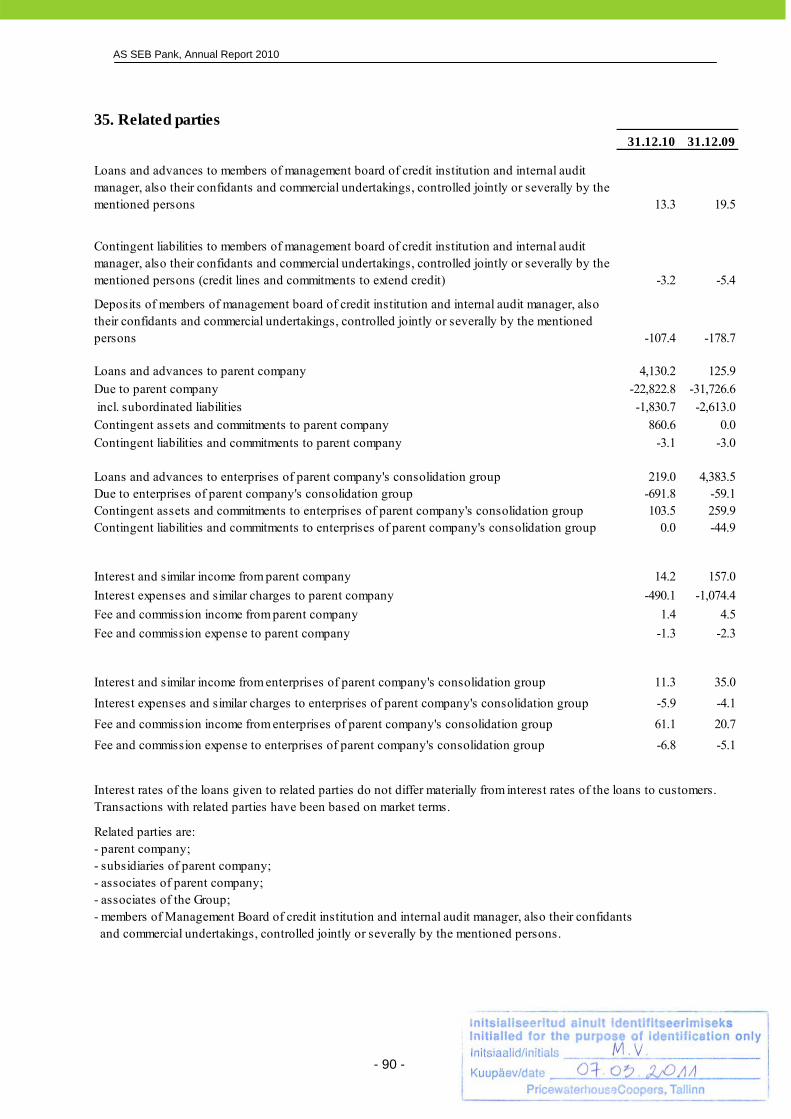
AS SEB Pank, Annual Report 2010
- 90 -
35. Related parties31.12.10 31.12.09
Loans and advances to members of management board of credit institution and internal audit manager, also their confidants and commercial undertakings, controlled jointly or severally by the mentioned persons 13.3 19.5
Contingent liabilities to members of management board of credit institution and internal audit manager, also their confidants and commercial undertakings, controlled jointly or severally by the mentioned persons (credit lines and commitments to extend credit) -3.2 -5.4
Deposits of members of management board of credit institution and internal audit manager, also their confidants and commercial undertakings, controlled jointly or severally by the mentioned persons -107.4 -178.7
Loans and advances to parent company 4,130.2 125.9
Due to parent company -22,822.8 -31,726.6
incl. subordinated liabilities -1,830.7 -2,613.0
Contingent assets and commitments to parent company 860.6 0.0
Contingent liabilities and commitments to parent company -3.1 -3.0
Loans and advances to enterprises of parent company's consolidation group 219.0 4,383.5Due to enterprises of parent company's consolidation group -691.8 -59.1Contingent assets and commitments to enterprises of parent company's consolidation group 103.5 259.9Contingent liabilities and commitments to enterprises of parent company's consolidation group 0.0 -44.9
Interest and similar income from parent company 14.2 157.0
Interest expenses and similar charges to parent company -490.1 -1,074.4
Fee and commission income from parent company 1.4 4.5
Fee and commission expense to parent company -1.3 -2.3
Interest and similar income from enterprises of parent company's consolidation group 11.3 35.0
Interest expenses and similar charges to enterprises of parent company's consolidation group -5.9 -4.1
Fee and commission income from enterprises of parent company's consolidation group 61.1 20.7
Fee and commission expense to enterprises of parent company's consolidation group -6.8 -5.1
Related parties are:- parent company;- subsidiaries of parent company;- associates of parent company;- associates of the Group;- members of Management Board of credit institution and internal audit manager, also their confidants and commercial undertakings, controlled jointly or severally by the mentioned persons.
Interest rates of the loans given to related parties do not differ materially from interest rates of the loans to customers. Transactions with related parties have been based on market terms.

AS SEB Pank, Annual Report 2010
- 91 -
Members of Supervisory Boards in AS SEB Pank and in it’s subsidiaries have no salaries or other benefits in 2010 and 2009. Compensations to key management personnel Management Board members of AS SEB Pank and its subsidiaries are paid compensation amounting up to 12 times average monthly pay, if they are not elected to the management board for a new term. Compensation is not be paid, if the person continues to work in a company belonging to the SEB group under contract of employment or is elected to the management board of another company belonging to the SEB group or the agreement is terminated due to violation of obligations by the member of the management board. The members of AS SEB Pank’s Management Board and members of the Management Team have an initial allotment of 163,590 perfomance shares and 7,422 matching shares of Skandinaviska Enskilda Banken AB (publ) as of 31.12.2010. The closing price of Skandinaviska Enskilda Banken AB (publ) A-share as of 30.12.2010 was 56.10 SEK.
2010 2009
Salaries and other benefits to the management in AS SEB Pank
Members of Management Board 7.4 15.4 - salaries 6.6 11.0 - other benefits to the key management 0.8 4.4
Salaries and other benefits to the management in subsidiaries of AS SEB Pank
Members of Management Board 8.1 11.7 - salaries 8.1 11.7

AS SEB Pank, Annual Report 2010
- 92 -
36. Primary statements of parent company as a separate entity
1. Income statement, Bank(millions of EEK)
2010 2009
Interest and similar income 1,647.2 2,611.6
Interest expenses and similar charges -626.6 -1,538.7
Net Interest Income 1,020.6 1,072.9
Fee and commission income 660.6 650.9
Fee and commission expense -191.8 -208.0
Net fee and commission income 468.8 442.9
Net income from foreign exchange 120.0 118.6
-33.9 64.2
Income from dividends 1.0 1.9
Gains less losses from investment securities 214.8 24.8
Share of profit of associates 2.3 0.0
Other income 81.0 187.3
Personnel expenses -491.4 -541.6
Other expenses -350.2 -638.9
Depreciation, amortisation and impairment of tangible and intangible assets -53.2 -434.3
Profit before impairment losses on loans and advances 979.8 297.8
Impairment losses on loans and advances -103.8 -1,745.8
Profit/loss before income tax 876.0 -1,448.0
Net profit/loss 876.0 -1,448.0
Attributable to the sole equity holder 876.0 -1,448.0
2. Statement of comprehensive income, Bank(millions of EEK) 2010 2009
Net profit/loss 876.0 -1,448.0Other comprehensive income/expense
Revaluation of available-for-sale financial assets -5.7 4.9Total other comprehensive income/expense -5.7 4.9
Total comprehensive income/expense 870.3 -1,443.1
Sole equity holder of the parent entity (total) 870.3 -1,443.1-Total comprehensive income/expense from continued operations 870.3 -1,443.1
870.3 -1,443.1
Gains less losses from financial assets at fair value through profit or loss
In accordance with the Estonian Accounting Act information on the separate primary financial statements of a consolidated entity shall be disclosed in the notes to the financial statements.

AS SEB Pank, Annual Report 2010
- 93 -
3. Statement of financial position, Bank(millions of EEK) 31.12.10 31.12.09
ASSETS
Cash 608.4 638.9
Balances with central bank 4,946.9 4,827.1
Loans and advances to credit institutions 4,373.7 4,633.4
Loans and advances to customers 50,356.8 53,397.3
Financial assets held for trading 342.3 366.2
Available-for-sale financial assets 10.0 39.0
Other assets 655.0 574.0
Investments in subsidiaries and associates 98.1 154.6
Intangible assets 8.0 9.6
Property, plant and equipment 110.5 99.5
Investment properties 0.6 0.6
TOTAL ASSETS 61,510.3 64,740.2
LIABILITIES AND SHAREHOLDERS' EQUITY
Due to credit institutions 17,675.8 22,739.0
Due to customers 34,119.8 32,646.4
Loan funds 180.2 141.6
Other liabilities 972.4 721.9
Financial liabilities at fair value through profit or loss 349.4 362.2
Provisions 6.4 14.8
Subordinated loans 1,833.7 2,615.9
Total Liabilities 55,137.7 59,241.8
Share capital 665.6 665.6
Share premium 1,346.6 1,346.6
Other reserves 299.6 305.3
Retained earnings 4,060.8 3,180.9
Total shareholders' equity 6,372.6 5,498.4
TOTAL LIABILITIES AND SHAREHOLDERS' EQUITY 61,510.3 64,740.2

AS SEB Pank, Annual Report 2010
- 94 -
4. Statement of cash flows, Bank(millions of EEK)
2010 2009I. Cash flows from operating activities
Interest received 1,669.1 2,735.0Interest paid -694.5 -1,813.2Dividends received 1.0 1.9Fee and commission received 660.6 650.9Fee and commission paid -191.8 -208.0Net trading income and other operating income 1,106.7 728.7Personnel expenses and other operating expenses -807.8 -972.3
Revaluation adjustments 0.3 2.7
1,743.6 1,125.7
Changes in operating assets:Loans and advances to credit institutions and mandatory reserve 2,533.7 -3,724.4Loans and advances to customers 1,949.3 2,143.1Other assets 23.1 55.1
Changes of operating liabilities:Due to credit institutions -4,857.2 -1,417.7
Due to customers 1,534.6 -4,161.3Loan funds 38.6 77.5Other liabilities 42.6 -155.8Cash flow from (used in) operating activities, continued operations 3,008.3 -6,057.8
II. Cash flows from investing activitiesNet increase-/decrease+ of investment portfolio securities 36.9 345.0Proceeds from sale and liquidation of subsidiaries 269.6 42.0Proceeds from sale and liquidation of associates 0.2 5.8Purchase of investment properties, tangible and intangible assets -68.4 -39.4Proceeds from sale of investment properties, tangible and intangible assets 5.9 0.1Cash flow from (used in) investing activities, continued operations 244.2 353.5
III. Cash flows from financing activitiesRepurchasing of debt securities -12.8 -106.5Repayments of subordinated loans -782.3 0.0Cash used in financing activities, continued operations -795.1 -106.5
Net decrease/increase in cash and cash equivalents 2,457.4 -5,810.8
Cash and cash equivalents at the beginning of period 6,342.8 12,153.1Effect of exchange rate changes on cash and cash equivalents -8.3 0.5
Cash and cash equivalents at the end of period 8,791.9 6,342.8
Cash and cash equivalents includes: 31.12.10 31.12.09Cash on hand 608.4 638.9Balances with the central bank without mandatory reserve 4,267.8 1,075.0Liquid deposits in other credit institutions, continued 3,894.5 4,614.4Trading portfolio 21.2 14.5
8,791.9 6,342.8
All cash equivalents are freely available for use by the Group with maturity of less than 3 months.
Cash flows from operating activities before changes in the operating assets and liabilities, continued operations
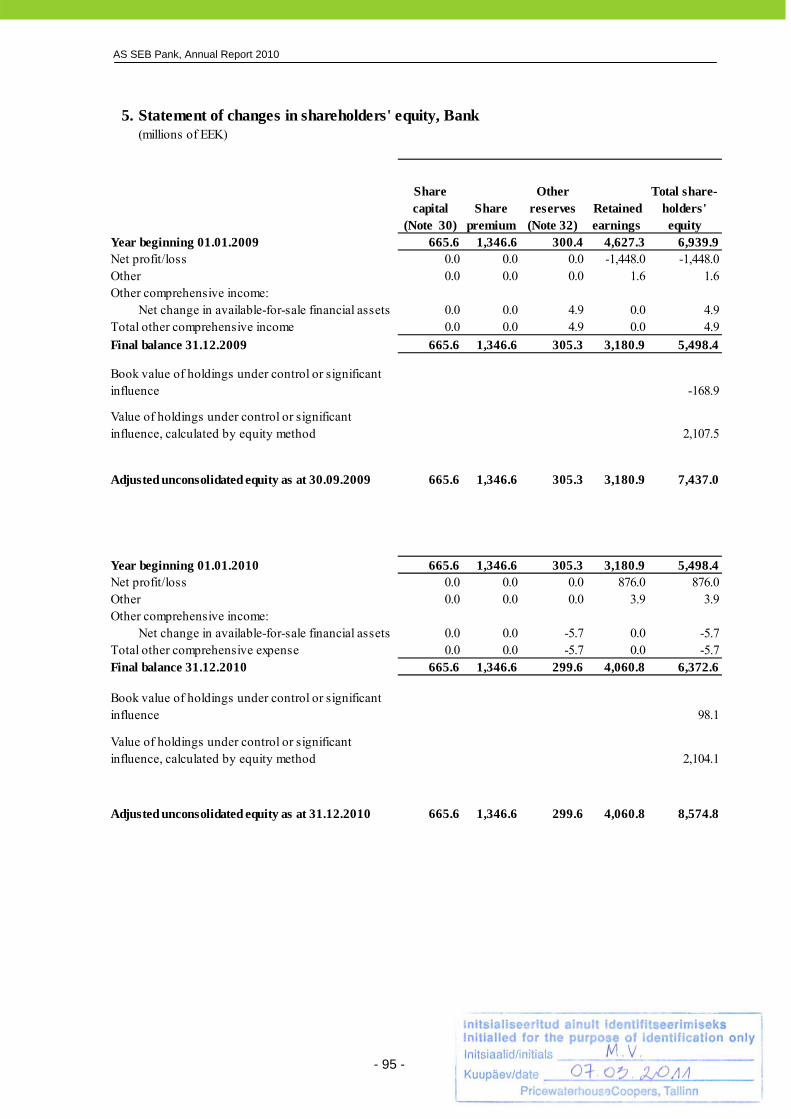
AS SEB Pank, Annual Report 2010
- 95 -
5. Statement of changes in shareholders' equity, Bank(millions of EEK)
Share capital
(Note 30)Share
premium
Other reserves (Note 32)
Retained earnings
Total share- holders' equity
Year beginning 01.01.2009 665.6 1,346.6 300.4 4,627.3 6,939.9Net profit/loss 0.0 0.0 0.0 -1,448.0 -1,448.0Other 0.0 0.0 0.0 1.6 1.6Other comprehensive income:
Net change in available-for-sale financial assets 0.0 0.0 4.9 0.0 4.9Total other comprehensive income 0.0 0.0 4.9 0.0 4.9
Final balance 31.12.2009 665.6 1,346.6 305.3 3,180.9 5,498.4
-168.9
2,107.5
665.6 1,346.6 305.3 3,180.9 7,437.0
Year beginning 01.01.2010 665.6 1,346.6 305.3 3,180.9 5,498.4Net profit/loss 0.0 0.0 0.0 876.0 876.0Other 0.0 0.0 0.0 3.9 3.9Other comprehensive income:
Net change in available-for-sale financial assets 0.0 0.0 -5.7 0.0 -5.7Total other comprehensive expense 0.0 0.0 -5.7 0.0 -5.7Final balance 31.12.2010 665.6 1,346.6 299.6 4,060.8 6,372.6
98.1
2,104.1
665.6 1,346.6 299.6 4,060.8 8,574.8
Book value of holdings under control or significant influence
Value of holdings under control or significant influence, calculated by equity method
Adjusted unconsolidated equity as at 31.12.2010
Book value of holdings under control or significant influence
Value of holdings under control or significant influence, calculated by equity method
Adjusted unconsolidated equity as at 30.09.2009

AS PricewaterhouseCoopers, Pärnu mnt 15, 10141 Tallinn, Estonia; Audit Company’s Registration No.6 T: +372 614 1800, F: +372 614 1900, www.pwc.ee
INDEPENDENT AUDITOR’S REPORT (Translation of the Estonian original)∗ To the Shareholder of AS SEB Pank We have audited the accompanying consolidated financial statements of AS SEB Pank and its subsidiaries, which comprise the consolidated statement of financial position as of 31 December 2010 and the consolidated income statement, statement of comprehensive income, statement of changes in equity and statement of cash flows for the year then ended, and a summary of significant accounting policies and other explanatory information. Management Board’s Responsibility for the Consolidated Financial Statements Management Board is responsible for the preparation, and true and fair presentation of these consolidated financial statements in accordance with International Financial Reporting Standards as adopted by the European Union, and for such internal control as the Management Board determines is necessary to enable the preparation of consolidated financial statements that are free from material misstatement, whether due to fraud or error. Auditor’s Responsibility Our responsibility is to express an opinion on these consolidated financial statements based on our audit. We conducted our audit in accordance with International Standards on Auditing. Those standards require that we comply with ethical requirements and plan and perform the audit to obtain reasonable assurance about whether the consolidated financial statements are free from material misstatement. An audit involves performing procedures to obtain audit evidence about the amounts and disclosures in the consolidated financial statements. The procedures selected depend on the auditor’s judgment, including the assessment of the risks of material misstatement of the consolidated financial statements, whether due to fraud or error. In making those risk assessments, the auditor considers internal control relevant to the entity’s preparation, and true and fair presentation of the consolidated financial statements in order to design audit procedures that are appropriate in the circumstances, but not for the purpose of expressing an opinion on the effectiveness of the entity’s internal control. An audit also includes evaluating the appropriateness of accounting policies used and the reasonableness of accounting estimates made by management, as well as evaluating the overall presentation of the consolidated financial statements. We believe that the audit evidence we have obtained is sufficient and appropriate to provide a basis for our audit opinion.

2 (2)
Opinion In our opinion, the consolidated financial statements give a true and fair view of the financial position of AS SEB Pank and its subsidiaries as of 31 December 2010, and of their financial performance and cash flows for the year then ended in accordance with International Financial Reporting Standards as adopted by the European Union. AS PricewaterhouseCoopers Ago Vilu Stan Nahkor Auditor’s Certificate No.325 Auditor’s Certificate No.508 7 March 2011 ∗ This version of our report is a translation from the original, which was prepared in Estonian. All possible care has been taken to ensure that the translation is an accurate representation of the original. However, in all matters of interpretation of information, views or opinions, the original language version of our report takes precedence over this translation.

AS SEB Pank, Annual Report 2010
- 98 -
AS SEB PANK Located at Tornimäe 2, Tallinn
MANAGEMENT BOARD RESOLUTION No 29 In Tallinn March 7th, 2011
1. To make a proposal to the sole shareholder not to distribute the profit of the
financial year 2010 in the amount of 875,988,274 EEK (eight hundred and seventy-five million, nine hundred and eighty-eight thousand, two hundred and seventy-four Estonian kroons).
2. To submit the present resolution to the Supervisory Board of AS SEB Pank for
review.
Riho Unt Chairman of the Management Board
AS SEB Pank, Annual Report 2010
- 99 -
Signatures of Supervisory Board to annual report The Management Board has prepared the management report and the annual accounts of AS SEB Pank for the financial year ended 31 December 2010. The Supervisory Board of AS SEB Pank has reviewed the Annual Report 2010, prepared by the Management Board, consisting of the management report, the annual accounts, the Management Board's proposal for profit distribution and the independent auditors' report, and has approved the annual report for presentation to the sole shareholder. The annual report has been signed by all members of the Supervisory Board : “_____”_______________2011 ________________________ Martin Johansson “_____”_______________2011 ________________________ Stefan Stignäs “_____”_______________2011 ________________________ Mark Payne “_____”_______________2011 ________________________ Stefan Davill “_____”_______________2011 ________________________ Tony Kylberg