Embed Size (px)
Citation preview

Investor PresentationSEB Nordic Seminar, Copenhagen January 9 2018
2018-01-09 Susanne Lithander, CFO

BILLERUDKORSNÄS IN BRIEF
2
NET SALES
21.7 SEKbn
EBITDA
3.6SEKbn
Full year 2016
Europe 73%
Asia 17%
Africa 4%
South America 3%
Middle East 2%
Other 1%
4,300NUMBER OF EMPLOYEES
38%
17%
37%
8%
SHARE OF SALES
8PRODUCTION UNITS
(SWE, FI, UK)
PACKAGING PAPER
Kraft paper
Sack paper
Market pulp
CORRUGATED SOLUTIONS
Fluting
Liner
Managed Packaging
CONSUMER BOARD
Liquid packaging board
Cartonboard
OTHER
3.0PRODUCTION CAPACITY
(MILLION TONNES)
17%
MARGIN
PURE PLAY PACKAGING COMPANY

THREE BUSINESS AREAS
3
PACKAGING PAPERKraft and sack paper for
customers with tough demands
CONSUMER BOARDLiquid packaging board and
cartonboard with uniqe properties
CORRUGATED SOLUTIONSFluting and liner add value
Packaging for flour, sugar, carrier
bags, medical packaging, building
materials, chemicals and more
Growth driven by population growth
in emerging markets, ageing
population, increasing
environmental awareness and more
Packaging for milk, juice, preserved
foods, beauty and healthcare
products, confectionary and more
Growth driven by high urbanization
rate, change in consumer behavior
and more
Packaging for fruit and vegetables,
white goods and electronics,
exclusive drinks and more
Supply chain solutions and packaging
optimisations for brand owners
Growth driven by increasing e-
commerce and fresh food
consumption, package differentiation
and changing supply chains
SELECTIVE GROWTH
Asset transformation for increased profitability
Development of new business models
Expansion to growing markets
2-4%
CAGR
VOLUME GROWTH
Attractive market providing growth opportunities
Investments for volume growth
Innovation with customers and brand owners
4-5%
CAGR
VALUE GROWTH
Strong product portfolio setting market standard
Integrating new business model
Increasing sales to brand owners
2-4%
CAGR
4
INVESTMENT HIGHLIGHTS
1.
Leading
position in
our
segments
2.
Growth
segments backed
up by global
megatrends
3.
Clear growth
strategy to
capture
market potential
4.
Clear innovation
focus for a
sustainable
future
5.
Stable earnings
and shareholder
returns

LEADING POSITION IN OUR SEGMENTS
Only primary fibrein portfolio targeting customers and applications requiring
light, strong and pure materials
5
packaging material in
product portfolio with a
growing share of services
and solutions
of sales towards
consumer segment with
stable long-term demand
growth
No 1 or 2 within niches
where we operate
KRAFT PAPER
#1GLOBALLY
SACK PAPER
#2GLOBALLY
LIQUID
PACKAGING BOARD
– AMBIENT PACKAGES
#1GLOBALLY
LIQUID
PACKAGING BOARD
– ALL PACKAGE TYPES
#2GLOBALLY
NSSC
FLUTING
#1EUROPE
PURE WHITE
LINER
#2EUROPE
COATED
WHITE TOP
LINER
#2EUROPE
95% 75%
Corrugated SolutionsConsumer
Board
Packaging
Paper
1. Leading position
in our segments

GROWTH SEGMENTS BACKED UP BY GLOBAL MEGATRENDS
Global megatrends driving long-term
demand for packaging materialUrbanisation
E-commerce
Sustainability awareness is increasing
demand for renewable packaging
material
6
2. Growth segments backed
by global megatrends

PP & Board market: Estimated demand CAGR 2013-2030, combined market for cartonboard, containerboard and sack paper. Source: Pöyry 2014
Global Packaging Market: Estimated CAGR 2016-2022, for all packaging materials. Source: Smithers Pira 2017
TARGETING THE GLOBAL PACKAGING MARKET
7
1.2%
2.2%
1.8%
4.1%
3.6% 4.4%
0.4%
0.3%
2.7%
1.5%
2.8%
3.3% 3.0%
0.4%
2. Growth segments backed
by global megatrends
Global market for packaging
paper & board has a growth
of 2.2%
We aim to expand sales in the
global packaging market…
…with a growth of 2.9%
Key to success is new
packaging solutions and
sustainable products

CLEAR GROWTH STRATEGY TO CAPTURE MARKET POTENTIAL
8
Increasing sales of
solutions to brand
owners and improve
market mix
Increasing
innovation efforts to
develop new
packaging solutions
expanding potential
market segments
Maximizing
customer value by
offering sustainable
products challenging
alternative materials
Continuously
improving
production efficiency
Aim to reach profitable growth of 3-4% per year
3. Clear growth strategy to
capture market potential
POSITIONExpand in the
value chains
INNOVATIONTurn good ideas into new
solutions and materials
SUSTAINABILITYIntegrate and improve
in everything we do
EFFECTIVENESSDrive a customer focused
approach

WE ARE INVESTING TO MOVE FURTHER UP THE VALUE CHAIN TOWARDS BRAND OWNERS
Brand image
Package solution
Sustainability
Shelf appearance
Price
Payment terms
Runability
Delivery terms
Packaging
material
50-85 % of
the cost
Packaging
material
2-5% of
the cost
9
3. Clear growth strategy to
capture market potential
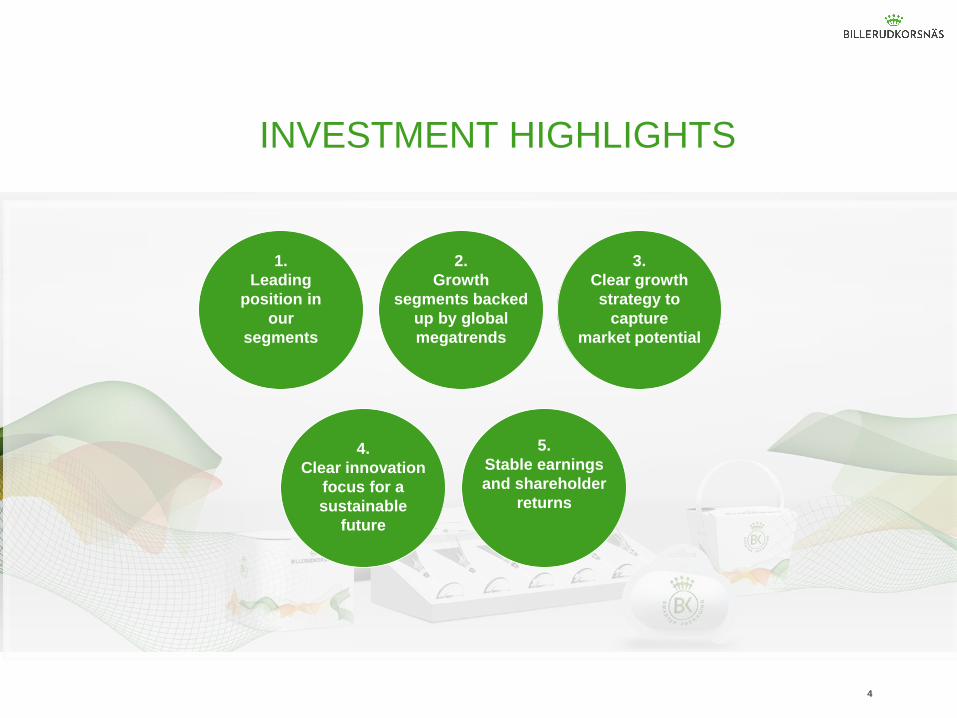
TWO MAJOR RESTRUCTURING PROJECTS IMPROVING EFFICIENCY AND SECURING GROWTH
10
Beetham
Karlsborg
Pietarsaari
Tervasaari
Gävle
Frövi
Rockhammar
Skärblacka
Gruvön
1
2
1
2
Production start on
MG machine in
Skärblacka
Production start on
board machine in
Gruvön
Q1
2019 2023
Machine in
Gruvön fully
utilised
Q4
2016
Q2
2016
Q1
2018
1
2
Moving unintegrated MG paper machine from
Tervasaari, Finland to Skärblacka, Sweden and
making it integrated to the pulp production.
SEK ~1.3 billion investment.
Building new board machine at the production
unit in Gruvön with capacity of approx. 550,000 t/a of liquid packaging board, cartonboard, food service
board and white kraftliner.
SEK ~7 billion investment.
3. Clear growth strategy to
capture market potential

11
CAPEX
0
500
1 000
1 500
2 000
2 500
3 000
3 500
4 000
4 500
5 000
2015 2016 2017 2018 2019
Base capex Tervasaari move + KM7
SEKm
4 300
4 700
1 800
PRODUCTION AND CAPEX IMPACT
ktonnes
~780
~910
0
100
200
300
400
500
600
700
800
900
1000
2019 2020 2021 2022 2023 2024 2025
Total Gruvön production Gruvön KM7
PRODUCTION
330
550
1 645
1 300
3. Clear growth strategy to
capture market potential

INVESTMENTS TO IMPROVE UNDERLYING PROFITABILITY AND SECURE ORGANIC GROWTH
Improved underlying EBITDA > +1 200 SEKm when fully implemented
Continued growth with 3-4% per year
12
Lower currency
exposure
- SEK 2 bn
Reduced price
volatility in
product portfolio
Limited
exposure
to pulp
market
ROI in line with
our return target
of 13%
3. Clear growth strategy to
capture market potential
PACKAGING PAPER
Selective growth
CONSUMER BOARD
Volume growth
CORRUGATED SOLUTIONS
Value growth
Focusing on growth segments
growing by 2-4% per year
Decreasing volumes on
oversupplied markets
Increasing volumes on growing
Liquid Packaging Board and
Cartonboard markets
Expanding solution based sales
to brand owners
Exiting oversupplied white liner
market

CLEAR INNOVATION FOCUS FOR A SUSTAINABLE FUTURE
Long history of award winning packaging
innovations
Challenging boundaries of fibre based packaging
in order to reduce usage of fossil materials
Innovation will strengthen top line and margins
13
2020 Target
Proportion of sales accounted
for by new products
20%
2016
13%
2016: QuickFill® Clean2015: FreeFormPack®2014: D-Sack2013: Axello® ZAP
4. Clear innovation focus
for a sustainable future
Towards fossil-free production
14
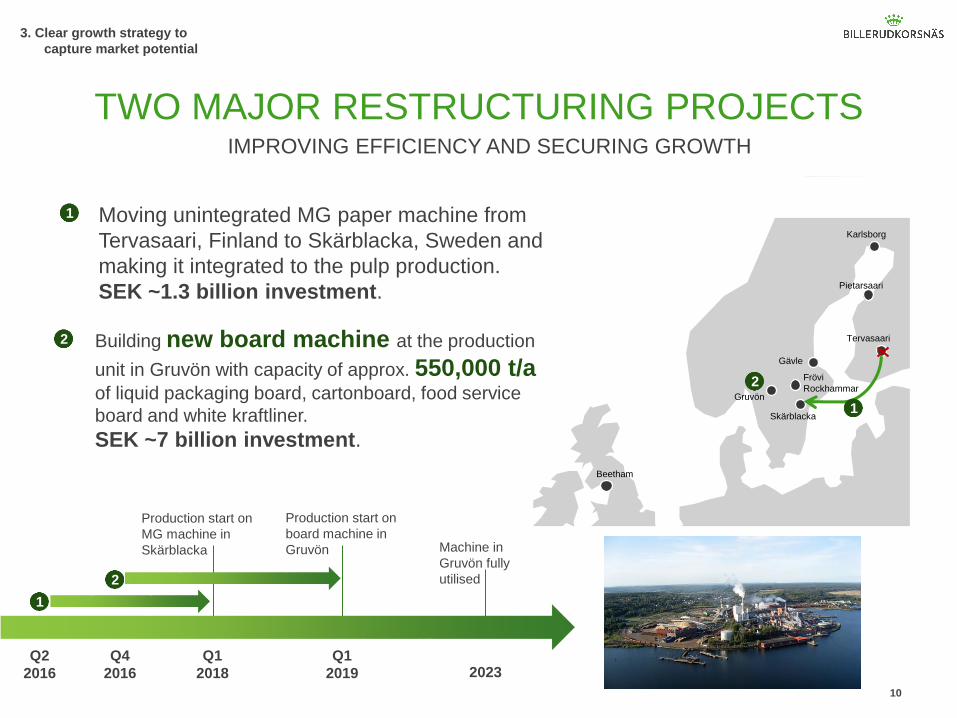
Paper bag* - Best choice for the climate
WE PROVIDE SUSTAINABLE SOLUTIONS
*BillerudKorsnäs paper bag from primary fibre, produced in Sweden
Biofuels used in 201697.5%
ADVANCED LEVEL
Walk the talk
MAXIMIZING
POSITIVE IMPACT
INCREASED
CUSTOMER VALUE
SUSTAINABLE
AND BIO-BASED
SOCIETY
RESPONSIBLE VALUE CHAIN
MINIMIZING NEGATIVE
IMPACT
4. Clear innovation focus
for a sustainable future
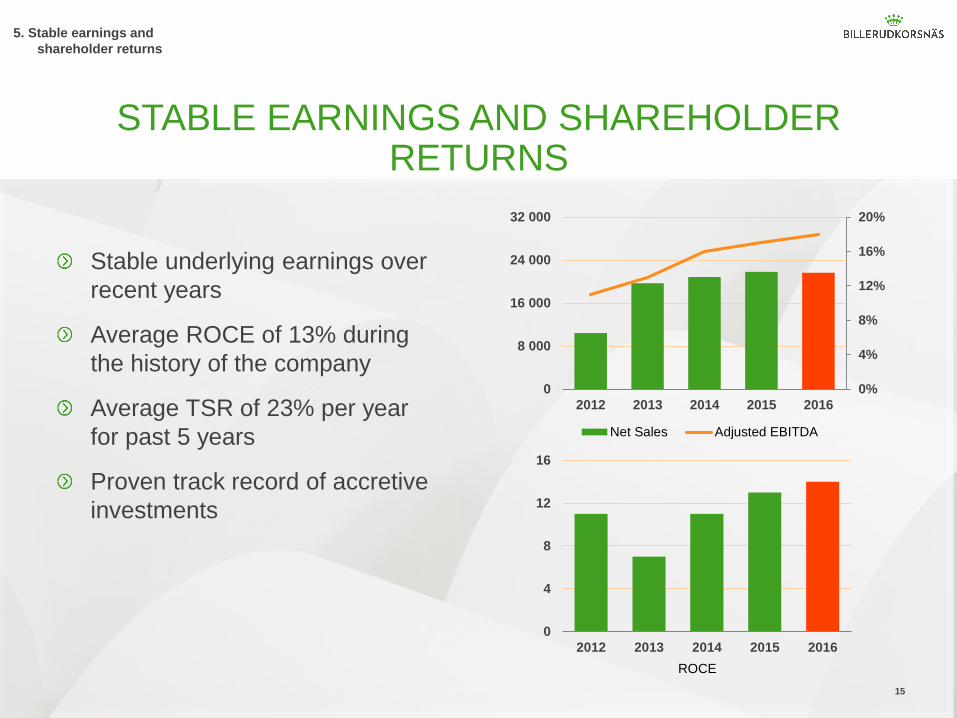
STABLE EARNINGS AND SHAREHOLDER RETURNS
Stable underlying earnings over
recent years
Average ROCE of 13% during
the history of the company
Average TSR of 23% per year
for past 5 years
Proven track record of accretive
investments
15
0%
4%
8%
12%
16%
20%
0
8 000
16 000
24 000
32 000
2012 2013 2014 2015 2016
Net Sales Adjusted EBITDA
0
4
8
12
16
2012 2013 2014 2015 2016
ROCE
5. Stable earnings and
shareholder returns

FINANCIAL TARGETS AND TARGET FULFILLMENT
16
FULL YEAR 2016
1. For comparable units (excluding divested and acquired operations)
2. Excluding non-recurring items
Area Target Outcome 2016
Growth
EBITDA
ROCE
Net debt/EBITDA
Dividend policy
3-4%
18%>17%
14%>13%
1.1<2.5
59%50%
✔
✔
✔
✔
0.3%
1
2
2
5. Stable earnings and
shareholder returns

summary
Focused product portfolio with leading global and regional positions
in growing markets
Global trends imply growth opportunitiesSustainability, demographic shifts, digitalization and changed consumer behavior
We invest in all of our four strategic pillars: Position expansion, Innovation, Sustainability and Efficiency
Two major restructuring projects to increase profitability and secure long-term
growth
Strong financial position with low leverage and a well-balanced leverage policy
17