Embed Size (px)
Citation preview
Atmos. Chem. Phys., 16, 13015–13034, 2016www.atmos-chem-phys.net/16/13015/2016/doi:10.5194/acp-16-13015-2016© Author(s) 2016. CC Attribution 3.0 License.
Seasonal variation of tropospheric bromine monoxide over the Rannof Kutch salt marsh seen from spaceChristoph Hörmann1, Holger Sihler1,2, Steffen Beirle1, Marloes Penning de Vries1, Ulrich Platt2, andThomas Wagner1
1Max Planck Institute for Chemistry (MPI-C), Mainz, Germany2Institute for Environmental Physics, University of Heidelberg, Heidelberg, Germany
Correspondence to: Christoph Hörmann ([email protected])
Received: 28 January 2016 – Published in Atmos. Chem. Phys. Discuss.: 15 February 2016Revised: 23 September 2016 – Accepted: 27 September 2016 – Published: 21 October 2016
Abstract. The Rann of Kutch (India and Pakistan) is one ofthe largest salt deserts in the world. Being a so-called “sea-sonal salt marsh”, it is regularly flooded during the Indiansummer monsoon. We present 10 years of bromine monoxide(BrO) satellite observations by the Ozone Monitoring Instru-ment (OMI) over the Great and Little Rann of Kutch. OMIspectra were analysed using Differential Optical AbsorptionSpectroscopy (DOAS) and revealed recurring high BrO verti-cal column densities (VCDs) of up to 1.4× 10¹⁴ moleccm−2
during April/May, but no significantly enhanced column den-sities during the monsoon season (June–September). In thefollowing winter months, the BrO VCDs are again slightlyenhanced while the salty surface dries up. We investigate apossible correlation of enhanced reactive bromine concen-trations with different meteorological parameters and finda strong relationship between incident UV radiation andthe total BrO abundance. In contrast, the second GlobalOzone Monitoring Instrument (GOME-2) shows about 4times lower BrO VCDs over the Rann of Kutch than foundby OMI and no clear seasonal cycle is observed. One reasonfor this finding might be the earlier local overpass time ofGOME-2 compared to OMI (around 09:30 vs. 13:30 LT), asthe ambient conditions significantly differ for both satelliteinstruments at the time of the measurements. Further possiblereasons are discussed and mainly attributed to instrumentalissues. OMI additionally confirms the presence of enhancedBrO concentrations over the Dead Sea valley (Israel/Jordan),as suggested by former ground-based observations. The mea-surements indicate that the Rann of Kutch salt marsh is prob-ably one of the strongest natural point sources of reactivebromine compounds outside the polar regions and is there-
fore supposed to have a significant impact on local and re-gional ozone chemistry.
1 Introduction
Reactive halogen species (RHS) are well known to play animportant role in atmospheric chemistry of both the tropo-sphere and stratosphere (e.g. Platt and Janssen, 1995; Saiz-Lopez and von Glasow, 2012, and references therein). Foralmost 30 years, ground-based observations in polar regions,at active volcanoes, within the midlatitude marine boundarylayer (MBL) and over salt lakes have indicated the potentialof these species to significantly influence the oxidation ca-pacity of the troposphere, possibly on a global scale, via thecatalysed depletion of ozone (O3). After the so-called ozonedepletion events (ODEs) were first observed in the 1980s bylocal measurements in the Arctic (Oltmans, 1981; Oltmansand Komhyr, 1986; Barrie et al., 1988), especially reactivebromine compounds were identified to be responsible forthe ozone destruction. In particular, a strong anti-correlationof the ozone concentration with filterable bromine (Barrieet al., 1988, 1989) was found. In later studies, the involve-ment of bromine chemistry was directly confirmed by addi-tional measurements of bromine monoxide (BrO) using theDifferential Optical Absorption Spectroscopy (DOAS) tech-nique (Platt and Stutz, 2008), with BrO mixing ratios of upto 17 ppt (Hausmann and Platt, 1994). Subsequent observa-tions showed even higher mixing ratios of up to 40 ppt (e.g.Avallone, 2003; Frieß, 2004; Hönninger et al., 2004b; Pöhleret al., 2010; Peterson et al., 2015, and references therein).In the meantime, an overall picture of the BrO horizontal
Published by Copernicus Publications on behalf of the European Geosciences Union.
13016 C. Hörmann et al.: Seasonal variation of BrO over the Rann of Kutch
distribution was obtained by observations from satellite in-struments in the late 1990s (Wagner and Platt, 1998; Richteret al., 1998; Chance, 1998). It became clear that the ODEscan be associated with huge BrO “clouds” of several thou-sands of square kilometres extent.
During the last 3 decades, BrO has also extensively beenmeasured in the MBL by ground-based DOAS observations,but the observations revealed relatively low BrO mixing ra-tios of 1–10 ppt (e.g. Leser et al., 2003; Saiz-Lopez, 2004;Read et al., 2008; Martin et al., 2009). Volcanic BrO hasnot only been observed by a large number of ground-basedDOAS observations at quiescent degassing volcanoes sincethe early 2000s (e.g. Bobrowski et al., 2003; Oppenheimeret al., 2006; Bobrowski and Platt, 2007; Boichu et al., 2011;Bobrowski and Giuffrida, 2012; Lübcke et al., 2014) butalso by satellite instruments during minor and major volcaniceruptions (Theys et al., 2009a; Rix et al., 2012; Hörmannet al., 2013).
1.1 BrO observations over salt lakes
In contrast to BrO observations in other regions, reportsabout reactive halogen species observations over salt lakeshave only been published infrequently. Following the firstground-based DOAS observations of BrO over the DeadSea with peak mixing ratios of 86 ppt by Hebestreit et al.(1999), later studies were able to confirm the results andfound even higher mixing ratios with a maximum of 220 ppt(e.g. Matveev et al., 2001; Tas et al., 2005), representingthe highest BrO mixing ratios ever observed in the atmo-sphere (outside volcanic plumes). The vertical distributionof BrO above the Dead Sea and the corresponding dynamicswere more recently discussed in Holla et al. (2015). Muchlower mixing ratios of up to 6 ppt were found over the GreatSalt Lake (United States) by Stutz et al. (2002) as well asmore than 20 ppt at Salar de Uyuni (Bolivia) by Hönningeret al. (2004a). Further field campaigns were conducted byHolla (2012) in Namibia (Walfish Bay), Botswana (Sua Pan),south Russia (El’Ton and Baskunchak), Mauretania (SebkhaN’Dramcha), southwest Australia (Lake Stubbs, Lake Orr,Lake King, Lake Tay and Lake Chlorine) and Cape Verde(including artificial solar salt ponds at Santa Maria and thePedra Lume caldera, which is filled with oceanic water).However, none of these measurements showed significantlyenhanced BrO or iodine oxide (typically less than 2 ppt formulti-axis (MAX) DOAS measurements). A model study byTas et al. (2006) focusing on the Dead Sea emphasized thepossibly important role of aerosols for the release of reactivebromine, while another study by Smoydzin and von Glasow(2009) suggested an additional direct bromine release fromsea water. The autocatalytic reaction cycle that is associatedwith the rapid production of BrO (the so-called “bromine ex-plosion”, Platt and Lehrer, 1997) could recently be observedunder laboratory conditions within a smog chamber (Bux-mann et al., 2012). In this study, environmental conditions
like salt composition, pH value, temperature and relative hu-midity (RH) were varied and a BrO build-up above a modelsalt pan could be studied in detail, indicating a strong depen-dency on RH – possibly controlled by the thickness of result-ing water microlayers on the salt crust. However, the detailedchemical mechanism still remains unclear as correspondingmodel calculations were not able to reproduce the findings.
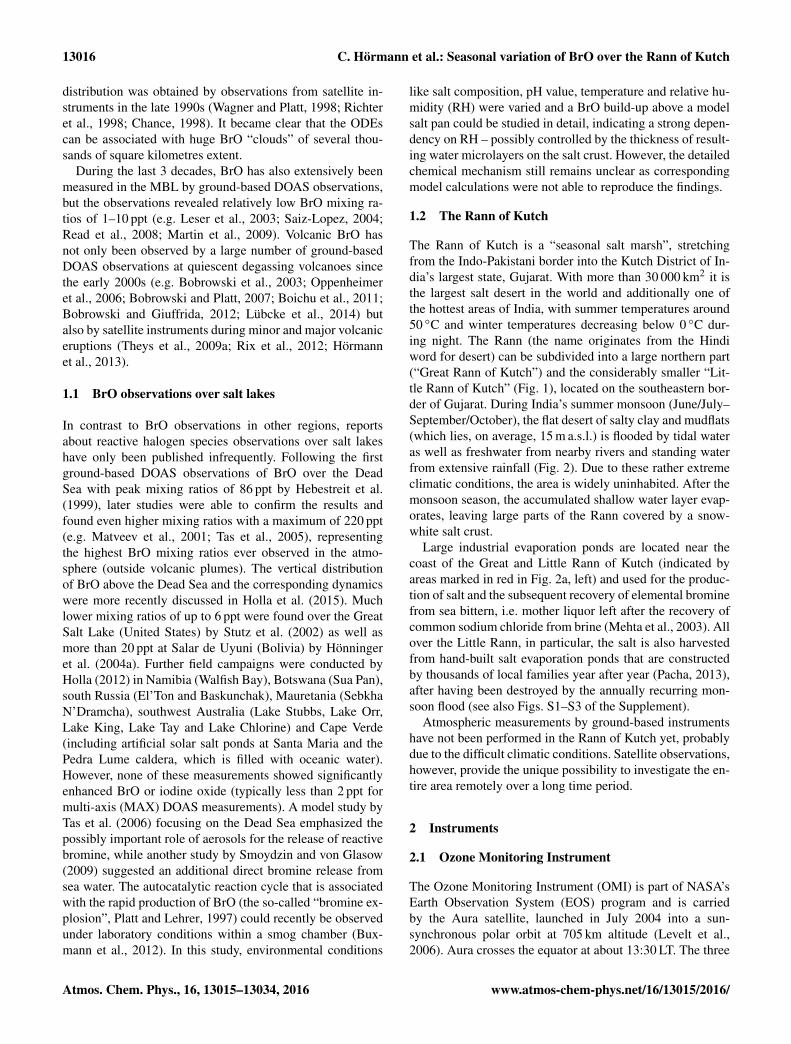
1.2 The Rann of Kutch
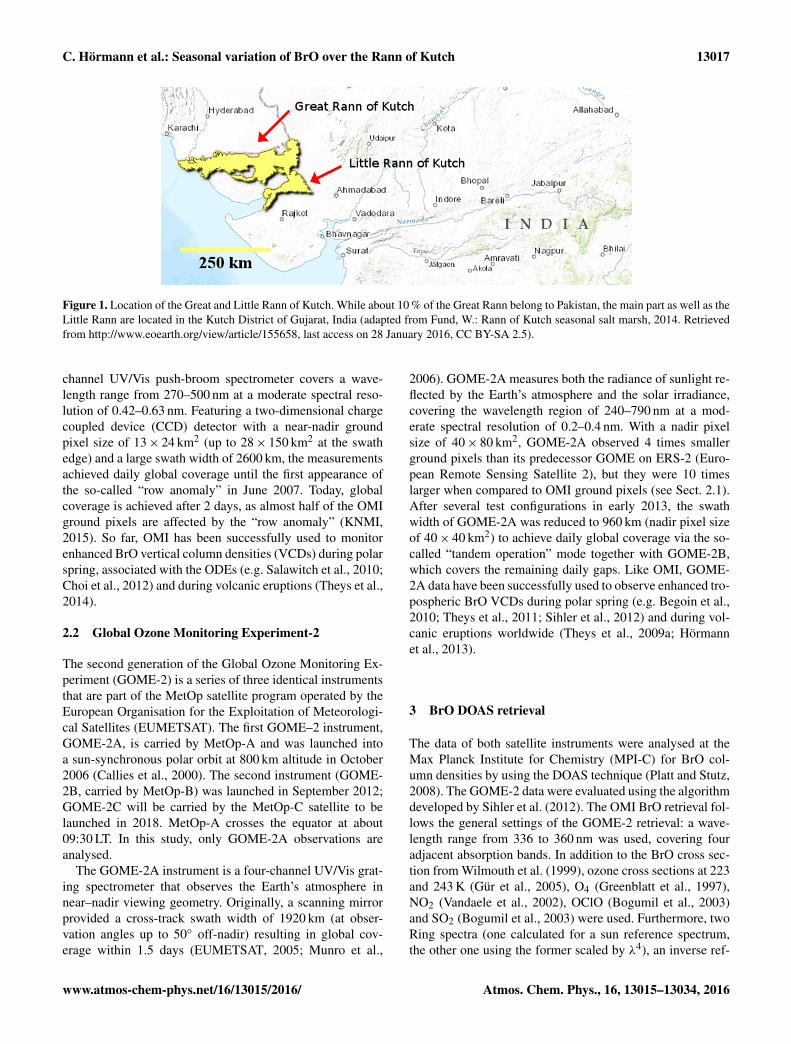
The Rann of Kutch is a “seasonal salt marsh”, stretchingfrom the Indo-Pakistani border into the Kutch District of In-dia’s largest state, Gujarat. With more than 30 000 km2 it isthe largest salt desert in the world and additionally one ofthe hottest areas of India, with summer temperatures around50 ◦C and winter temperatures decreasing below 0 ◦C dur-ing night. The Rann (the name originates from the Hindiword for desert) can be subdivided into a large northern part(“Great Rann of Kutch”) and the considerably smaller “Lit-tle Rann of Kutch” (Fig. 1), located on the southeastern bor-der of Gujarat. During India’s summer monsoon (June/July–September/October), the flat desert of salty clay and mudflats(which lies, on average, 15 m a.s.l.) is flooded by tidal wateras well as freshwater from nearby rivers and standing waterfrom extensive rainfall (Fig. 2). Due to these rather extremeclimatic conditions, the area is widely uninhabited. After themonsoon season, the accumulated shallow water layer evap-orates, leaving large parts of the Rann covered by a snow-white salt crust.
Large industrial evaporation ponds are located near thecoast of the Great and Little Rann of Kutch (indicated byareas marked in red in Fig. 2a, left) and used for the produc-tion of salt and the subsequent recovery of elemental brominefrom sea bittern, i.e. mother liquor left after the recovery ofcommon sodium chloride from brine (Mehta et al., 2003). Allover the Little Rann, in particular, the salt is also harvestedfrom hand-built salt evaporation ponds that are constructedby thousands of local families year after year (Pacha, 2013),after having been destroyed by the annually recurring mon-soon flood (see also Figs. S1–S3 of the Supplement).
Atmospheric measurements by ground-based instrumentshave not been performed in the Rann of Kutch yet, probablydue to the difficult climatic conditions. Satellite observations,however, provide the unique possibility to investigate the en-tire area remotely over a long time period.
2 Instruments
2.1 Ozone Monitoring Instrument
The Ozone Monitoring Instrument (OMI) is part of NASA’sEarth Observation System (EOS) program and is carriedby the Aura satellite, launched in July 2004 into a sun-synchronous polar orbit at 705 km altitude (Levelt et al.,2006). Aura crosses the equator at about 13:30 LT. The three
Atmos. Chem. Phys., 16, 13015–13034, 2016 www.atmos-chem-phys.net/16/13015/2016/
C. Hörmann et al.: Seasonal variation of BrO over the Rann of Kutch 13017
Figure 1. Location of the Great and Little Rann of Kutch. While about 10 % of the Great Rann belong to Pakistan, the main part as well as theLittle Rann are located in the Kutch District of Gujarat, India (adapted from Fund, W.: Rann of Kutch seasonal salt marsh, 2014. Retrievedfrom http://www.eoearth.org/view/article/155658, last access on 28 January 2016, CC BY-SA 2.5).
channel UV/Vis push-broom spectrometer covers a wave-length range from 270–500 nm at a moderate spectral reso-lution of 0.42–0.63 nm. Featuring a two-dimensional chargecoupled device (CCD) detector with a near-nadir groundpixel size of 13× 24 km2 (up to 28× 150 km2 at the swathedge) and a large swath width of 2600 km, the measurementsachieved daily global coverage until the first appearance ofthe so-called “row anomaly” in June 2007. Today, globalcoverage is achieved after 2 days, as almost half of the OMIground pixels are affected by the “row anomaly” (KNMI,2015). So far, OMI has been successfully used to monitorenhanced BrO vertical column densities (VCDs) during polarspring, associated with the ODEs (e.g. Salawitch et al., 2010;Choi et al., 2012) and during volcanic eruptions (Theys et al.,2014).
2.2 Global Ozone Monitoring Experiment-2
The second generation of the Global Ozone Monitoring Ex-periment (GOME-2) is a series of three identical instrumentsthat are part of the MetOp satellite program operated by theEuropean Organisation for the Exploitation of Meteorologi-cal Satellites (EUMETSAT). The first GOME–2 instrument,GOME-2A, is carried by MetOp-A and was launched intoa sun-synchronous polar orbit at 800 km altitude in October2006 (Callies et al., 2000). The second instrument (GOME-2B, carried by MetOp-B) was launched in September 2012;GOME-2C will be carried by the MetOp-C satellite to belaunched in 2018. MetOp-A crosses the equator at about09:30 LT. In this study, only GOME-2A observations areanalysed.
The GOME-2A instrument is a four-channel UV/Vis grat-ing spectrometer that observes the Earth’s atmosphere innear–nadir viewing geometry. Originally, a scanning mirrorprovided a cross-track swath width of 1920 km (at obser-vation angles up to 50◦ off-nadir) resulting in global cov-erage within 1.5 days (EUMETSAT, 2005; Munro et al.,
2006). GOME-2A measures both the radiance of sunlight re-flected by the Earth’s atmosphere and the solar irradiance,covering the wavelength region of 240–790 nm at a mod-erate spectral resolution of 0.2–0.4 nm. With a nadir pixelsize of 40× 80 km2, GOME-2A observed 4 times smallerground pixels than its predecessor GOME on ERS-2 (Euro-pean Remote Sensing Satellite 2), but they were 10 timeslarger when compared to OMI ground pixels (see Sect. 2.1).After several test configurations in early 2013, the swathwidth of GOME-2A was reduced to 960 km (nadir pixel sizeof 40× 40 km2) to achieve daily global coverage via the so-called “tandem operation” mode together with GOME-2B,which covers the remaining daily gaps. Like OMI, GOME-2A data have been successfully used to observe enhanced tro-pospheric BrO VCDs during polar spring (e.g. Begoin et al.,2010; Theys et al., 2011; Sihler et al., 2012) and during vol-canic eruptions worldwide (Theys et al., 2009a; Hörmannet al., 2013).
3 BrO DOAS retrieval
The data of both satellite instruments were analysed at theMax Planck Institute for Chemistry (MPI-C) for BrO col-umn densities by using the DOAS technique (Platt and Stutz,2008). The GOME-2 data were evaluated using the algorithmdeveloped by Sihler et al. (2012). The OMI BrO retrieval fol-lows the general settings of the GOME-2 retrieval: a wave-length range from 336 to 360 nm was used, covering fouradjacent absorption bands. In addition to the BrO cross sec-tion from Wilmouth et al. (1999), ozone cross sections at 223and 243 K (Gür et al., 2005), O4 (Greenblatt et al., 1997),NO2 (Vandaele et al., 2002), OClO (Bogumil et al., 2003)and SO2 (Bogumil et al., 2003) were used. Furthermore, twoRing spectra (one calculated for a sun reference spectrum,the other one using the former scaled by λ4), an inverse ref-
www.atmos-chem-phys.net/16/13015/2016/ Atmos. Chem. Phys., 16, 13015–13034, 2016
13018 C. Hörmann et al.: Seasonal variation of BrO over the Rann of Kutch
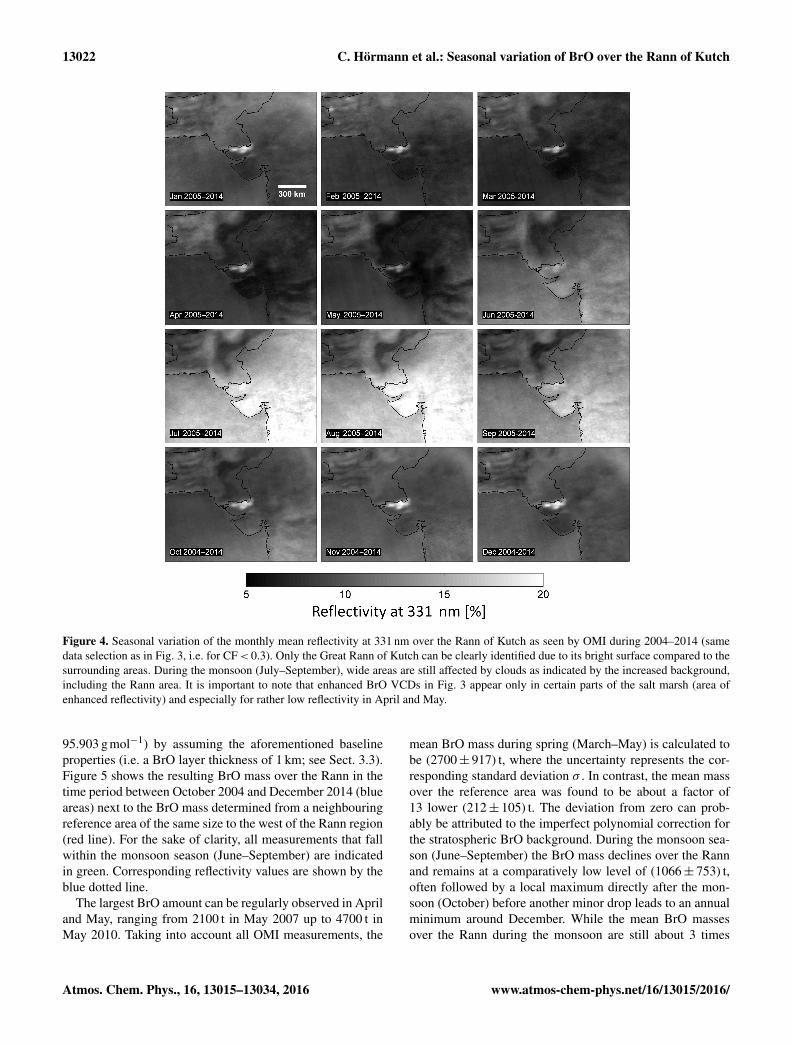
Figure 2. MODIS True Color (TC, left) and Band 7-2-1 images (right) over the Rann of Kutch for selected days in (a) February, (b) March,(c) June, (d) September and (e) November 2005 (13.2., 24.3. 12.6., 21.9. and 17.11.), illustrating the flood during the monsoon. Water can beidentified from the 7-2-1 images as dark blue/black, while clouds and bright surfaces appear light blue. The Rann appears as a bright surfaceearlier in the year, before it darkens due to inflowing water (indicated by yellow arrows in (b) and (c), right column; compare with the meanreflectivity shown in Fig. 4). During monsoon time, the entire Rann is often completely flooded and large areas are dominated by mud (TCimage in September). Locations of industrial evaporation ponds are indicated by areas marked in red in (a).
erence spectrum and a fifth-order polynomial were includedin the BrO retrieval.
OMI data affected by the row anomaly (first appearing af-ter 25 June 2007) were excluded from the retrieval (KNMI,2015). Due to differences in the measurement sensitivity ofsingle CCD detector pixels, OMI BrO column density mapssuffer from cross-track striping, which is especially apparentfor weak absorbers like BrO. To overcome the striping effect,
mean geometrical BrO VCDs (appropriate for a stratosphericabsorber) calculated for each pixel row individually over a re-mote area over the Pacific (±20◦ N, 105–175◦W) were sub-tracted from all daily measurements. Since the contributionof stratospheric BrO to the total column is hereby removed aswell, the median BrO column across the track was re-added.Please note that the BrO VCDs finally used in this study are
Atmos. Chem. Phys., 16, 13015–13034, 2016 www.atmos-chem-phys.net/16/13015/2016/
C. Hörmann et al.: Seasonal variation of BrO over the Rann of Kutch 13019
corrected for the stratospheric contribution to the total col-umn by a specifically local separation (see Sect. 3.2).
The measured spectra are additionally affected by perma-nent and transient hot pixels, leading to increased noise atcertain wavelengths for individual CCD detector rows. Sucherroneous measurements can be easily identified by abnor-mally large fitting residuals at affected wavelength positionsand again lead to strongly elevated BrO VCD stripes. Follow-ing the suggestions by Chance (2007), intensities measuredat pixels showing very strong residual discrepancies (> 4σ )from an initial fit were excluded for a final second fit. Thevast majority of former suspiciously anomalous BrO slantcolumn densities (SCDs) showed realistic columns similar tonearby measurements after the correction.
3.1 Clouds
The observation of tropospheric trace gases is significantlyaffected by radiative transfer due to cloud coverage in sev-eral ways. If the trace gas is located above a thick cloud layer,satellite measurements might show an increased sensitivity.On the other hand, clouds may completely shield trace gasesclose to the surface. To minimize the influence of clouds,only OMI measurements with an effective cloud fraction ofless than 30 % were considered. For this purpose two opera-tional Level 2 OMI cloud products are provided by NASA:
1. OMCLDO2, for cloud detection using the O2–O2 ab-sorption near 477 nm (e.g. Acarreta and de Haan, 2002;Vasilkov et al., 2008)
2. OMCLDRR, using information from the so-calledfilling-in of solar Fraunhofer lines caused by rotationalRaman (RR) scattering in the atmosphere (Ring effect)within the 346–354 nm spectral range (e.g. Joiner et al.,2002; Stammes et al., 2008).
Although the OMCLDO2 algorithm is most commonlyused, it turned out that the algorithm almost always mis-classifies the bright surface of the salt marsh as cloud andis thereby unsuitable for the BrO analysis presented here. Incontrast, the OMCLDRR algorithm seems to better distin-guish between the bright surface and clouds, probably be-cause of an increased contrast in the UV in comparison tothe visible wavelength range that is used in the OMCLDO2algorithm. It should, however, be noted that a reanalysisof the data applying a lower cloud filter threshold of only20 % showed that the OMCLDRR algorithm sometimes mis-interprets the bright surface of the salt marsh as cloudsas well. This is in particular the case during the first 3–4 months after the Rann is flooded (October/November–December/January). As the remaining water evaporates, avery clean and bright surface remains as indicated by in-creased reflectivity; this effect can be seen in MODIS TrueColor images as in Fig. 2. In order to provide statisticallyrelevant monthly averaged BrO VCDs, only grid pixels that
were covered at least 10 times by the daily measurementswere finally taken into account. It can, however, not be com-pletely ruled out that some of the actual cloud-free measure-ments are sorted out using the cloud filter.
For GOME-2, the only available cloud detection al-gorithms are the operational FRESCO (Koelemeijer andStammes, 2001; Koelemeijer et al., 2002) and ROCINN(Loyola R., 2004; Rozanov et al., 2006) products, whichboth use wide parts of the oxygen A-band spectrum to de-termine the effective cloud fraction. Similar to the OMI OM-CLDO2 algorithm, both FRESCO and ROCINN fail to dis-tinguish between the bright surface of the salt marsh andclouds. Therefore only a qualitative comparison of the un-filtered cloudy data will be presented in Sect. 4.5.
3.2 Local stratospheric background correction
Because all satellite measurements include the total atmo-spheric BrO column, the data have to be corrected for thestratospheric fraction to retrieve the tropospheric BrO col-umn over the salt marsh area. The stratospheric BrO distri-bution varies little with latitude and even less with longitude(Theys et al., 2009b) and on much larger spatial scales thanthe variations of the BrO enhancement observed over theRann of Kutch. Therefore, BrO VCDs determined assum-ing a geometrical air mass factor were corrected by subtract-ing the results of a two-dimensional spatial polynomial fit ofthird degree n applied to the daily measurements as describedin Hörmann et al. (2013):
V ∗trop,i ≈ V∗
tot,i −
3∑m,n=0
V ∗strat,i × xmi × y
ni , (1)
where V ∗strat,i is the fitted stratospheric BrO VCD at the centrecoordinates x and y (◦) of satellite pixel i within a large areaaround the Rann of Kutch (18–30◦ N, 62–78◦ E). To min-imize the influence of possibly enhanced BrO VCDs overthe salt marsh, the actual Rann area (22.5–25.5◦ N, 67.5–72.5◦W) was excluded from the polynomial fit of the strato-spheric correction approach. A qualitative comparison of ourstratospheric BrO estimation with the more sophisticated ap-proach presented by Theys et al. (2009b) shows similar re-sults and typical Vstrat of about 2.5× 10¹³moleccm−2. Theresulting corrected geometrical BrO VCDs (V ∗trop) were re-converted into “tropospheric” SCDs (S∗trop) by multiplicationwith the geometrical AMF.
3.3 Radiative transfer
As the radiative transfer for a tropospheric absorber is notadequately represented by the geometrical approximation,the “tropospheric” S∗trop were multiplied with box air massfactors (box-AMF) calculated by the Monte Carlo radiativetransfer model (RTM) McArtim (Deutschmann et al., 2011)to retrieve final BrO VCDs. The simulations were conductednear the strongest BrO absorption band (338.5 nm) assuming
www.atmos-chem-phys.net/16/13015/2016/ Atmos. Chem. Phys., 16, 13015–13034, 2016
13020 C. Hörmann et al.: Seasonal variation of BrO over the Rann of Kutch
cloud-free conditions. Two main model runs were performedfor different homogeneous BrO layer profiles (0–400 m, 0–1 km and 0–2 km):
1. no additional aerosols (varying surface albedo of 0.10,0.15 and 0.20)
2. additional homogeneous aerosol layer at 0–1 km(single-scattering albedo (SSA): 0.9; asymmetry pa-rameter (AP): 0.72; and varying aerosol optical depth(AOD) of 0.4, 0.7 and 1).
As baseline properties, a surface albedo of 0.15 (based ontypical OMI reflectivity values at 331 nm; available via theNASA OMSO2 Level 2 OMI SO2 product and briefly de-scribed in Carn et al., 2013), a homogeneous BrO layer at0–1 km and an AOD of 0.7 were chosen. All baseline aerosolproperty assumptions (AOD, SSA and AP) were based onmonthly mean OMI observations at 342.5 nm (via the NASAOMAEROG Level 2 aerosol product, described in Torreset al., 2007). As the OMAEROG product often shows un-realistically high parameter values exclusively over the Rannarea (e.g. monthly mean AODs of more than 4), the productseems to have some problems with the exceptionally brightsurface of the salty desert. Additionally, the associated pa-rameters seem to be affected by increased cloud coverageduring the monsoon season.
In order to estimate the actual aerosol parameters despitethese problems, mean values for AOD, SSA and AP close to(but outside of) the Rann area were chosen. An estimate ofthe uncertainties caused by the a priori assumptions will begiven in Sect. 4.2.
4 Results
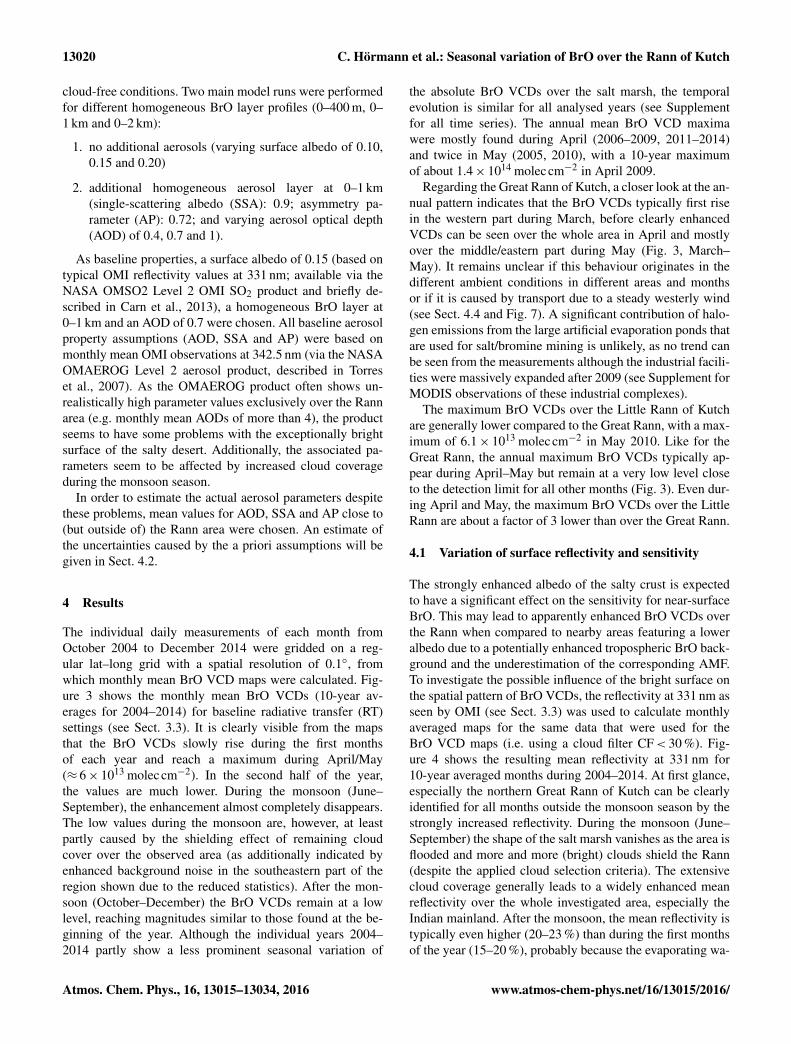
The individual daily measurements of each month fromOctober 2004 to December 2014 were gridded on a reg-ular lat–long grid with a spatial resolution of 0.1◦, fromwhich monthly mean BrO VCD maps were calculated. Fig-ure 3 shows the monthly mean BrO VCDs (10-year av-erages for 2004–2014) for baseline radiative transfer (RT)settings (see Sect. 3.3). It is clearly visible from the mapsthat the BrO VCDs slowly rise during the first monthsof each year and reach a maximum during April/May(≈ 6× 10¹³ molec cm−2). In the second half of the year,the values are much lower. During the monsoon (June–September), the enhancement almost completely disappears.The low values during the monsoon are, however, at leastpartly caused by the shielding effect of remaining cloudcover over the observed area (as additionally indicated byenhanced background noise in the southeastern part of theregion shown due to the reduced statistics). After the mon-soon (October–December) the BrO VCDs remain at a lowlevel, reaching magnitudes similar to those found at the be-ginning of the year. Although the individual years 2004–2014 partly show a less prominent seasonal variation of
the absolute BrO VCDs over the salt marsh, the temporalevolution is similar for all analysed years (see Supplementfor all time series). The annual mean BrO VCD maximawere mostly found during April (2006–2009, 2011–2014)and twice in May (2005, 2010), with a 10-year maximumof about 1.4× 10¹⁴ moleccm−2 in April 2009.
Regarding the Great Rann of Kutch, a closer look at the an-nual pattern indicates that the BrO VCDs typically first risein the western part during March, before clearly enhancedVCDs can be seen over the whole area in April and mostlyover the middle/eastern part during May (Fig. 3, March–May). It remains unclear if this behaviour originates in thedifferent ambient conditions in different areas and monthsor if it is caused by transport due to a steady westerly wind(see Sect. 4.4 and Fig. 7). A significant contribution of halo-gen emissions from the large artificial evaporation ponds thatare used for salt/bromine mining is unlikely, as no trend canbe seen from the measurements although the industrial facili-ties were massively expanded after 2009 (see Supplement forMODIS observations of these industrial complexes).
The maximum BrO VCDs over the Little Rann of Kutchare generally lower compared to the Great Rann, with a max-imum of 6.1× 10¹³ moleccm−2 in May 2010. Like for theGreat Rann, the annual maximum BrO VCDs typically ap-pear during April–May but remain at a very low level closeto the detection limit for all other months (Fig. 3). Even dur-ing April and May, the maximum BrO VCDs over the LittleRann are about a factor of 3 lower than over the Great Rann.
4.1 Variation of surface reflectivity and sensitivity
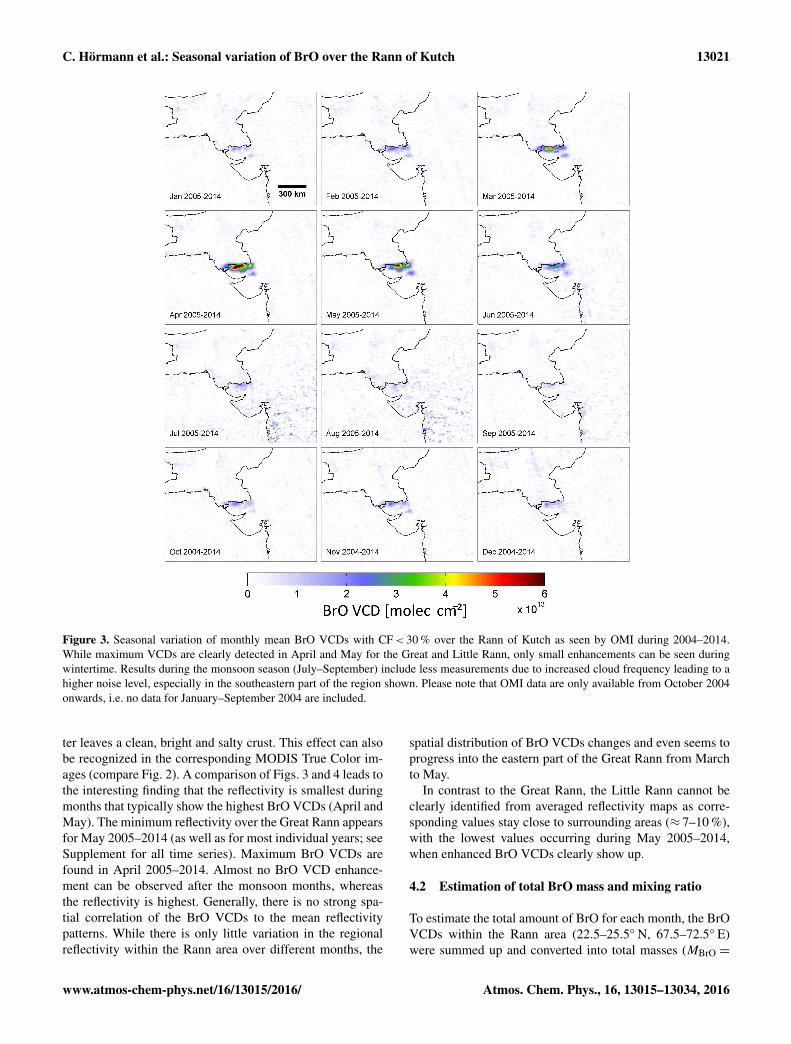
The strongly enhanced albedo of the salty crust is expectedto have a significant effect on the sensitivity for near-surfaceBrO. This may lead to apparently enhanced BrO VCDs overthe Rann when compared to nearby areas featuring a loweralbedo due to a potentially enhanced tropospheric BrO back-ground and the underestimation of the corresponding AMF.To investigate the possible influence of the bright surface onthe spatial pattern of BrO VCDs, the reflectivity at 331 nm asseen by OMI (see Sect. 3.3) was used to calculate monthlyaveraged maps for the same data that were used for theBrO VCD maps (i.e. using a cloud filter CF< 30 %). Fig-ure 4 shows the resulting mean reflectivity at 331 nm for10-year averaged months during 2004–2014. At first glance,especially the northern Great Rann of Kutch can be clearlyidentified for all months outside the monsoon season by thestrongly increased reflectivity. During the monsoon (June–September) the shape of the salt marsh vanishes as the area isflooded and more and more (bright) clouds shield the Rann(despite the applied cloud selection criteria). The extensivecloud coverage generally leads to a widely enhanced meanreflectivity over the whole investigated area, especially theIndian mainland. After the monsoon, the mean reflectivity istypically even higher (20–23 %) than during the first monthsof the year (15–20 %), probably because the evaporating wa-
Atmos. Chem. Phys., 16, 13015–13034, 2016 www.atmos-chem-phys.net/16/13015/2016/
C. Hörmann et al.: Seasonal variation of BrO over the Rann of Kutch 13021
Figure 3. Seasonal variation of monthly mean BrO VCDs with CF< 30 % over the Rann of Kutch as seen by OMI during 2004–2014.While maximum VCDs are clearly detected in April and May for the Great and Little Rann, only small enhancements can be seen duringwintertime. Results during the monsoon season (July–September) include less measurements due to increased cloud frequency leading to ahigher noise level, especially in the southeastern part of the region shown. Please note that OMI data are only available from October 2004onwards, i.e. no data for January–September 2004 are included.
ter leaves a clean, bright and salty crust. This effect can alsobe recognized in the corresponding MODIS True Color im-ages (compare Fig. 2). A comparison of Figs. 3 and 4 leads tothe interesting finding that the reflectivity is smallest duringmonths that typically show the highest BrO VCDs (April andMay). The minimum reflectivity over the Great Rann appearsfor May 2005–2014 (as well as for most individual years; seeSupplement for all time series). Maximum BrO VCDs arefound in April 2005–2014. Almost no BrO VCD enhance-ment can be observed after the monsoon months, whereasthe reflectivity is highest. Generally, there is no strong spa-tial correlation of the BrO VCDs to the mean reflectivitypatterns. While there is only little variation in the regionalreflectivity within the Rann area over different months, the
spatial distribution of BrO VCDs changes and even seems toprogress into the eastern part of the Great Rann from Marchto May.
In contrast to the Great Rann, the Little Rann cannot beclearly identified from averaged reflectivity maps as corre-sponding values stay close to surrounding areas (≈ 7–10 %),with the lowest values occurring during May 2005–2014,when enhanced BrO VCDs clearly show up.
4.2 Estimation of total BrO mass and mixing ratio
To estimate the total amount of BrO for each month, the BrOVCDs within the Rann area (22.5–25.5◦ N, 67.5–72.5◦ E)were summed up and converted into total masses (MBrO =
www.atmos-chem-phys.net/16/13015/2016/ Atmos. Chem. Phys., 16, 13015–13034, 2016
13022 C. Hörmann et al.: Seasonal variation of BrO over the Rann of Kutch
Figure 4. Seasonal variation of the monthly mean reflectivity at 331 nm over the Rann of Kutch as seen by OMI during 2004–2014 (samedata selection as in Fig. 3, i.e. for CF< 0.3). Only the Great Rann of Kutch can be clearly identified due to its bright surface compared to thesurrounding areas. During the monsoon (July–September), wide areas are still affected by clouds as indicated by the increased background,including the Rann area. It is important to note that enhanced BrO VCDs in Fig. 3 appear only in certain parts of the salt marsh (area ofenhanced reflectivity) and especially for rather low reflectivity in April and May.
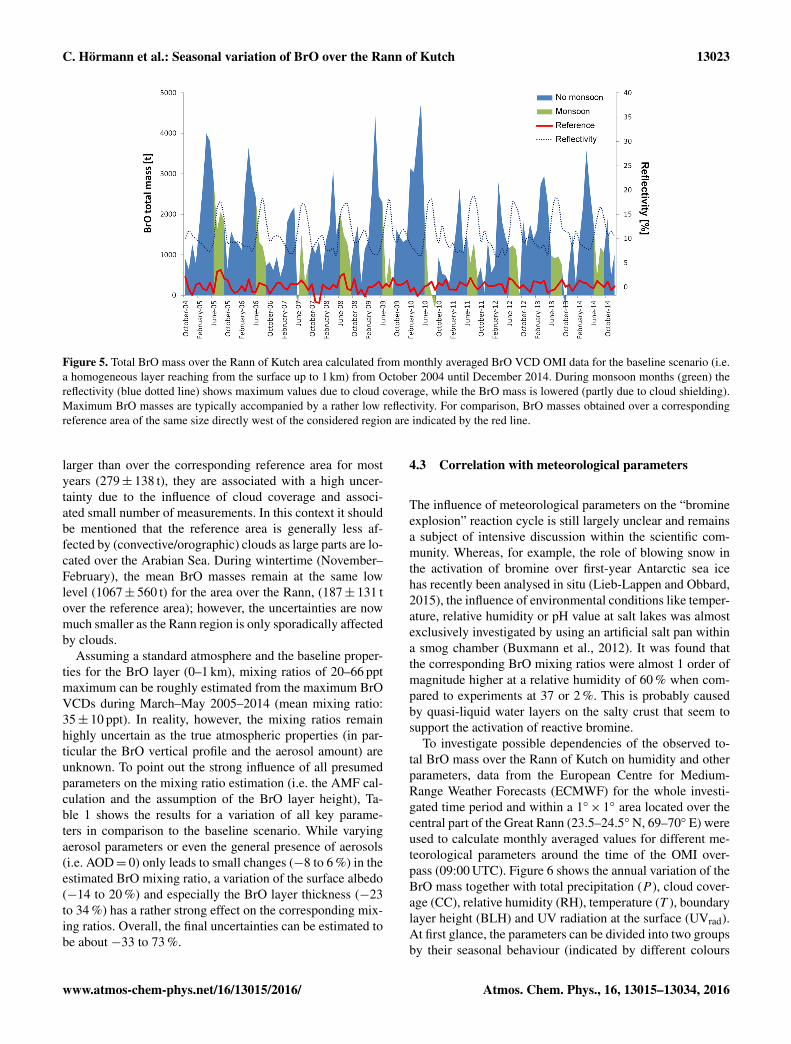
95.903 gmol−1) by assuming the aforementioned baselineproperties (i.e. a BrO layer thickness of 1 km; see Sect. 3.3).Figure 5 shows the resulting BrO mass over the Rann in thetime period between October 2004 and December 2014 (blueareas) next to the BrO mass determined from a neighbouringreference area of the same size to the west of the Rann region(red line). For the sake of clarity, all measurements that fallwithin the monsoon season (June–September) are indicatedin green. Corresponding reflectivity values are shown by theblue dotted line.
The largest BrO amount can be regularly observed in Apriland May, ranging from 2100 t in May 2007 up to 4700 t inMay 2010. Taking into account all OMI measurements, the
mean BrO mass during spring (March–May) is calculated tobe (2700± 917) t, where the uncertainty represents the cor-responding standard deviation σ . In contrast, the mean massover the reference area was found to be about a factor of13 lower (212± 105) t. The deviation from zero can prob-ably be attributed to the imperfect polynomial correction forthe stratospheric BrO background. During the monsoon sea-son (June–September) the BrO mass declines over the Rannand remains at a comparatively low level of (1066± 753) t,often followed by a local maximum directly after the mon-soon (October) before another minor drop leads to an annualminimum around December. While the mean BrO massesover the Rann during the monsoon are still about 3 times
Atmos. Chem. Phys., 16, 13015–13034, 2016 www.atmos-chem-phys.net/16/13015/2016/
C. Hörmann et al.: Seasonal variation of BrO over the Rann of Kutch 13023
Figure 5. Total BrO mass over the Rann of Kutch area calculated from monthly averaged BrO VCD OMI data for the baseline scenario (i.e.a homogeneous layer reaching from the surface up to 1 km) from October 2004 until December 2014. During monsoon months (green) thereflectivity (blue dotted line) shows maximum values due to cloud coverage, while the BrO mass is lowered (partly due to cloud shielding).Maximum BrO masses are typically accompanied by a rather low reflectivity. For comparison, BrO masses obtained over a correspondingreference area of the same size directly west of the considered region are indicated by the red line.
larger than over the corresponding reference area for mostyears (279± 138 t), they are associated with a high uncer-tainty due to the influence of cloud coverage and associ-ated small number of measurements. In this context it shouldbe mentioned that the reference area is generally less af-fected by (convective/orographic) clouds as large parts are lo-cated over the Arabian Sea. During wintertime (November–February), the mean BrO masses remain at the same lowlevel (1067± 560 t) for the area over the Rann, (187± 131 tover the reference area); however, the uncertainties are nowmuch smaller as the Rann region is only sporadically affectedby clouds.
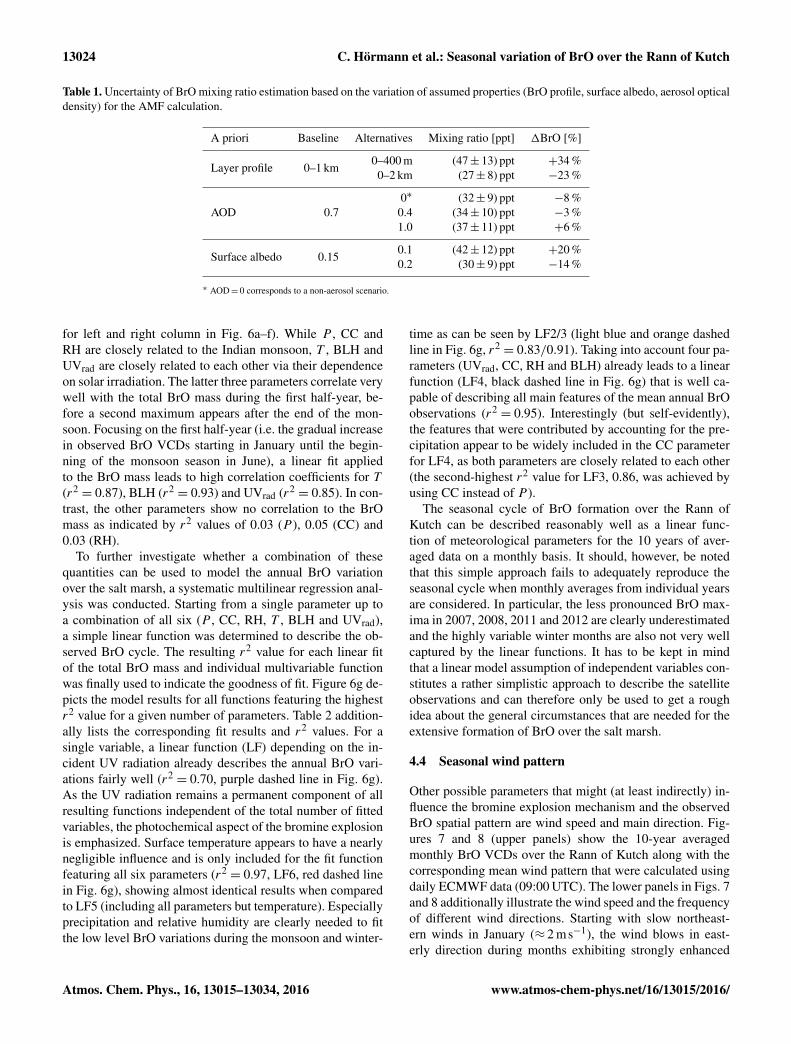
Assuming a standard atmosphere and the baseline proper-ties for the BrO layer (0–1 km), mixing ratios of 20–66 pptmaximum can be roughly estimated from the maximum BrOVCDs during March–May 2005–2014 (mean mixing ratio:35± 10 ppt). In reality, however, the mixing ratios remainhighly uncertain as the true atmospheric properties (in par-ticular the BrO vertical profile and the aerosol amount) areunknown. To point out the strong influence of all presumedparameters on the mixing ratio estimation (i.e. the AMF cal-culation and the assumption of the BrO layer height), Ta-ble 1 shows the results for a variation of all key parame-ters in comparison to the baseline scenario. While varyingaerosol parameters or even the general presence of aerosols(i.e. AOD= 0) only leads to small changes (−8 to 6 %) in theestimated BrO mixing ratio, a variation of the surface albedo(−14 to 20 %) and especially the BrO layer thickness (−23to 34 %) has a rather strong effect on the corresponding mix-ing ratios. Overall, the final uncertainties can be estimated tobe about −33 to 73 %.
4.3 Correlation with meteorological parameters
The influence of meteorological parameters on the “bromineexplosion” reaction cycle is still largely unclear and remainsa subject of intensive discussion within the scientific com-munity. Whereas, for example, the role of blowing snow inthe activation of bromine over first-year Antarctic sea icehas recently been analysed in situ (Lieb-Lappen and Obbard,2015), the influence of environmental conditions like temper-ature, relative humidity or pH value at salt lakes was almostexclusively investigated by using an artificial salt pan withina smog chamber (Buxmann et al., 2012). It was found thatthe corresponding BrO mixing ratios were almost 1 order ofmagnitude higher at a relative humidity of 60 % when com-pared to experiments at 37 or 2 %. This is probably causedby quasi-liquid water layers on the salty crust that seem tosupport the activation of reactive bromine.
To investigate possible dependencies of the observed to-tal BrO mass over the Rann of Kutch on humidity and otherparameters, data from the European Centre for Medium-Range Weather Forecasts (ECMWF) for the whole investi-gated time period and within a 1◦× 1◦ area located over thecentral part of the Great Rann (23.5–24.5◦ N, 69–70◦ E) wereused to calculate monthly averaged values for different me-teorological parameters around the time of the OMI over-pass (09:00 UTC). Figure 6 shows the annual variation of theBrO mass together with total precipitation (P ), cloud cover-age (CC), relative humidity (RH), temperature (T ), boundarylayer height (BLH) and UV radiation at the surface (UVrad).At first glance, the parameters can be divided into two groupsby their seasonal behaviour (indicated by different colours
www.atmos-chem-phys.net/16/13015/2016/ Atmos. Chem. Phys., 16, 13015–13034, 2016
13024 C. Hörmann et al.: Seasonal variation of BrO over the Rann of Kutch
Table 1. Uncertainty of BrO mixing ratio estimation based on the variation of assumed properties (BrO profile, surface albedo, aerosol opticaldensity) for the AMF calculation.
A priori Baseline Alternatives Mixing ratio [ppt] 1BrO [%]
Layer profile 0–1 km0–400 m (47± 13) ppt +34 %
0–2 km (27± 8) ppt −23 %
0∗ (32± 9) ppt −8 %AOD 0.7 0.4 (34± 10) ppt −3 %
1.0 (37± 11) ppt +6 %
Surface albedo 0.150.1 (42± 12) ppt +20 %0.2 (30± 9) ppt −14 %
∗ AOD= 0 corresponds to a non-aerosol scenario.
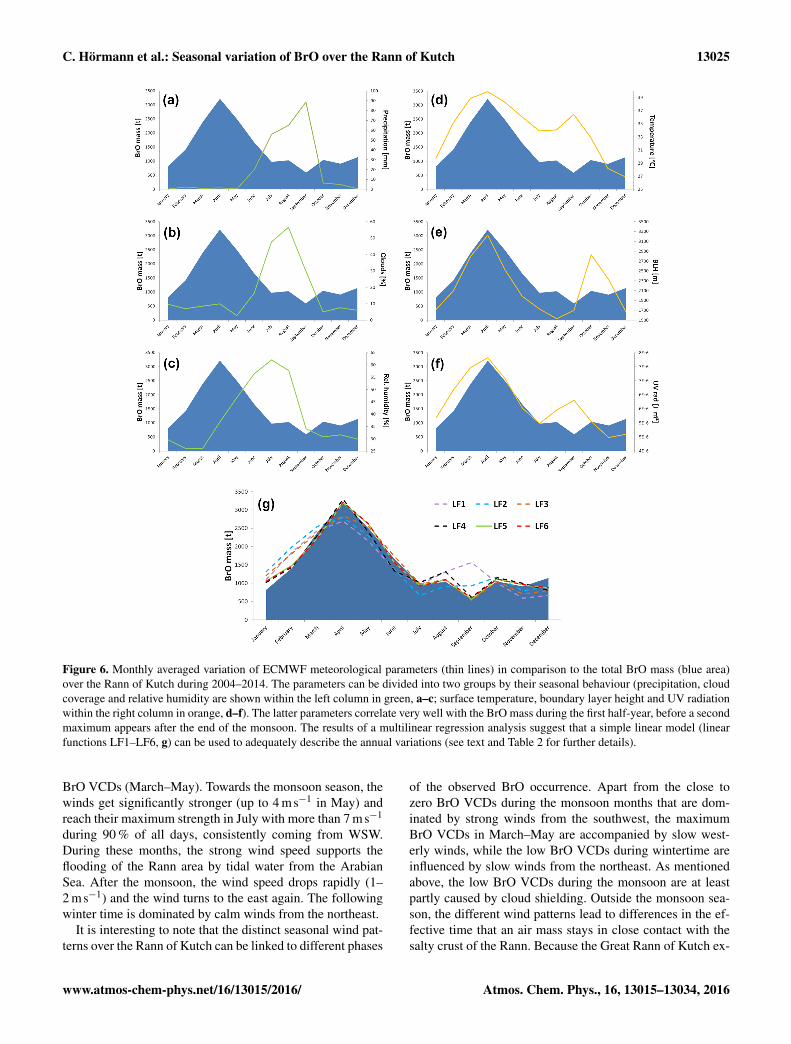
for left and right column in Fig. 6a–f). While P , CC andRH are closely related to the Indian monsoon, T , BLH andUVrad are closely related to each other via their dependenceon solar irradiation. The latter three parameters correlate verywell with the total BrO mass during the first half-year, be-fore a second maximum appears after the end of the mon-soon. Focusing on the first half-year (i.e. the gradual increasein observed BrO VCDs starting in January until the begin-ning of the monsoon season in June), a linear fit appliedto the BrO mass leads to high correlation coefficients for T(r2= 0.87), BLH (r2
= 0.93) and UVrad (r2= 0.85). In con-
trast, the other parameters show no correlation to the BrOmass as indicated by r2 values of 0.03 (P ), 0.05 (CC) and0.03 (RH).
To further investigate whether a combination of thesequantities can be used to model the annual BrO variationover the salt marsh, a systematic multilinear regression anal-ysis was conducted. Starting from a single parameter up toa combination of all six (P , CC, RH, T , BLH and UVrad),a simple linear function was determined to describe the ob-served BrO cycle. The resulting r2 value for each linear fitof the total BrO mass and individual multivariable functionwas finally used to indicate the goodness of fit. Figure 6g de-picts the model results for all functions featuring the highestr2 value for a given number of parameters. Table 2 addition-ally lists the corresponding fit results and r2 values. For asingle variable, a linear function (LF) depending on the in-cident UV radiation already describes the annual BrO vari-ations fairly well (r2
= 0.70, purple dashed line in Fig. 6g).As the UV radiation remains a permanent component of allresulting functions independent of the total number of fittedvariables, the photochemical aspect of the bromine explosionis emphasized. Surface temperature appears to have a nearlynegligible influence and is only included for the fit functionfeaturing all six parameters (r2
= 0.97, LF6, red dashed linein Fig. 6g), showing almost identical results when comparedto LF5 (including all parameters but temperature). Especiallyprecipitation and relative humidity are clearly needed to fitthe low level BrO variations during the monsoon and winter-
time as can be seen by LF2/3 (light blue and orange dashedline in Fig. 6g, r2
= 0.83/0.91). Taking into account four pa-rameters (UVrad, CC, RH and BLH) already leads to a linearfunction (LF4, black dashed line in Fig. 6g) that is well ca-pable of describing all main features of the mean annual BrOobservations (r2
= 0.95). Interestingly (but self-evidently),the features that were contributed by accounting for the pre-cipitation appear to be widely included in the CC parameterfor LF4, as both parameters are closely related to each other(the second-highest r2 value for LF3, 0.86, was achieved byusing CC instead of P ).
The seasonal cycle of BrO formation over the Rann ofKutch can be described reasonably well as a linear func-tion of meteorological parameters for the 10 years of aver-aged data on a monthly basis. It should, however, be notedthat this simple approach fails to adequately reproduce theseasonal cycle when monthly averages from individual yearsare considered. In particular, the less pronounced BrO max-ima in 2007, 2008, 2011 and 2012 are clearly underestimatedand the highly variable winter months are also not very wellcaptured by the linear functions. It has to be kept in mindthat a linear model assumption of independent variables con-stitutes a rather simplistic approach to describe the satelliteobservations and can therefore only be used to get a roughidea about the general circumstances that are needed for theextensive formation of BrO over the salt marsh.
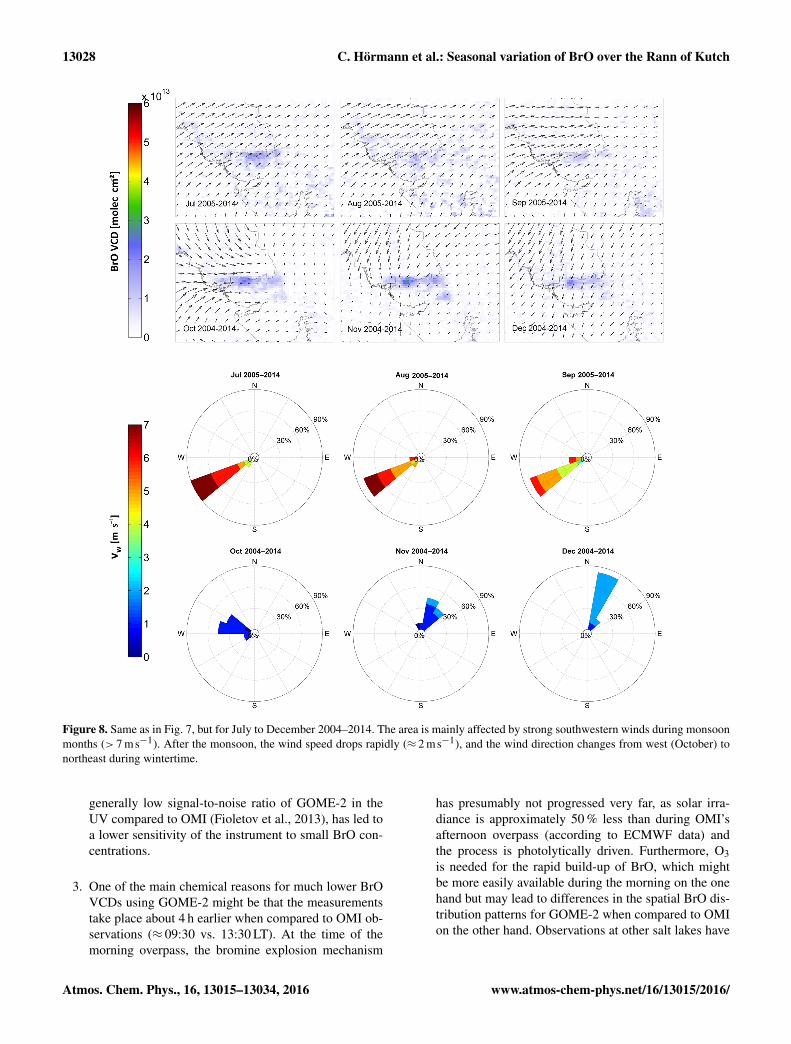
4.4 Seasonal wind pattern
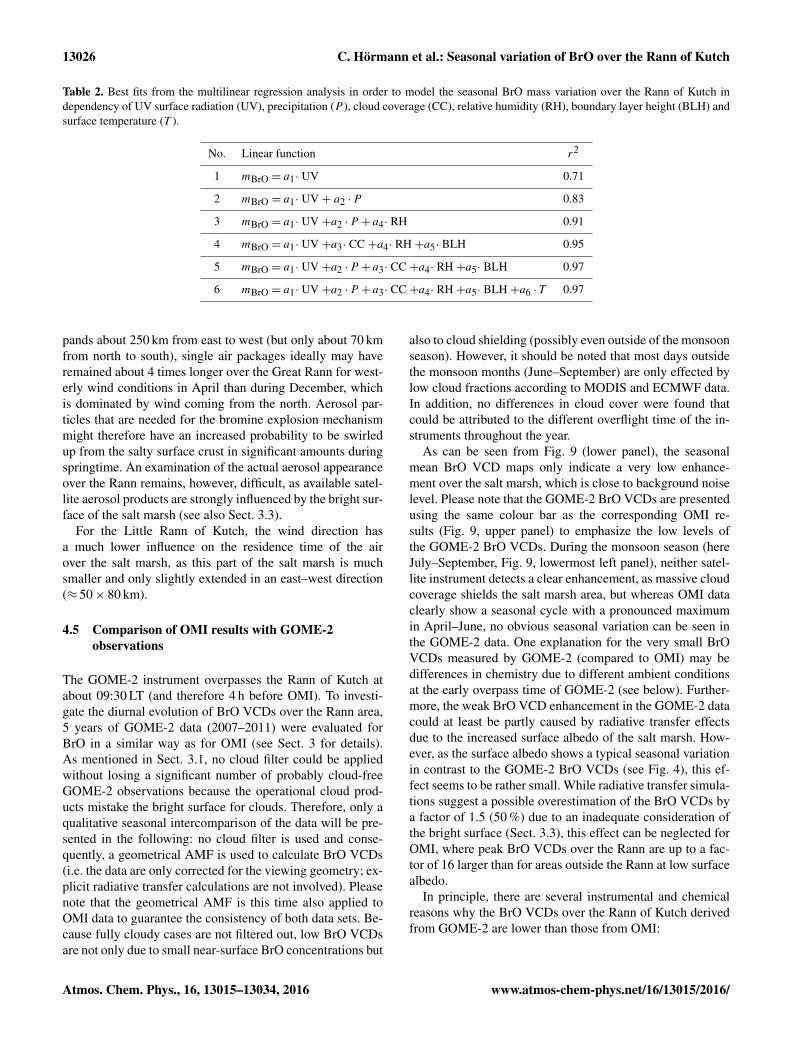
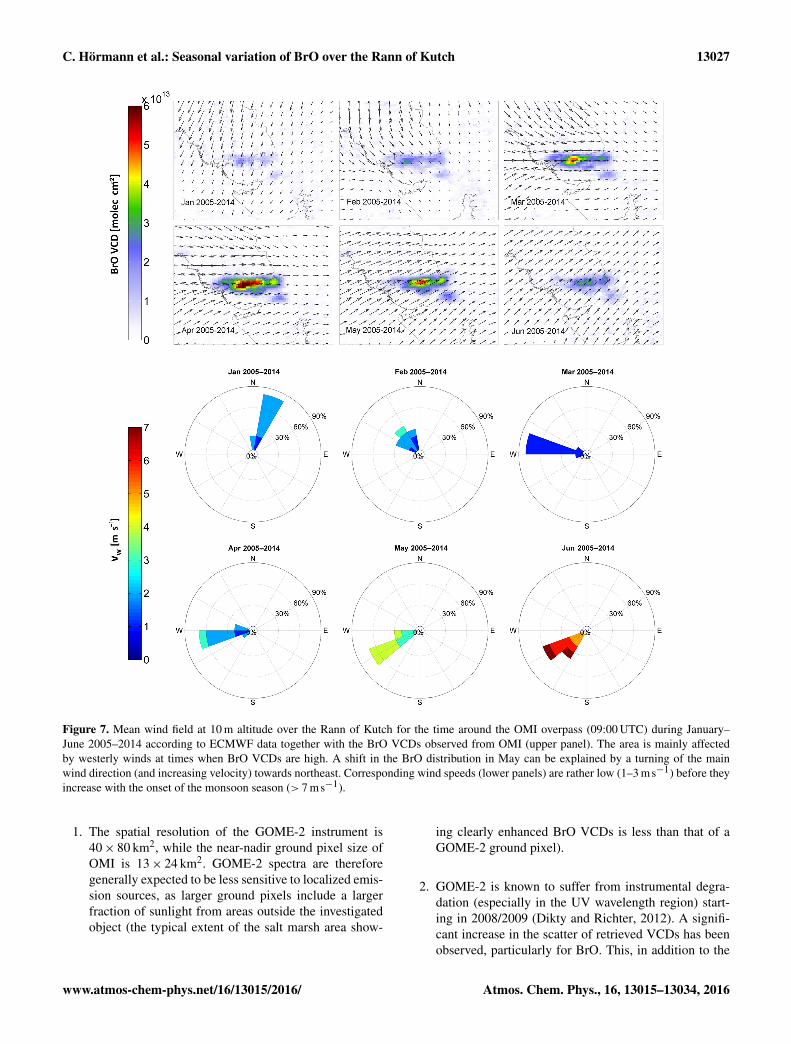
Other possible parameters that might (at least indirectly) in-fluence the bromine explosion mechanism and the observedBrO spatial pattern are wind speed and main direction. Fig-ures 7 and 8 (upper panels) show the 10-year averagedmonthly BrO VCDs over the Rann of Kutch along with thecorresponding mean wind pattern that were calculated usingdaily ECMWF data (09:00 UTC). The lower panels in Figs. 7and 8 additionally illustrate the wind speed and the frequencyof different wind directions. Starting with slow northeast-ern winds in January (≈ 2 ms−1), the wind blows in east-erly direction during months exhibiting strongly enhanced
Atmos. Chem. Phys., 16, 13015–13034, 2016 www.atmos-chem-phys.net/16/13015/2016/
C. Hörmann et al.: Seasonal variation of BrO over the Rann of Kutch 13025
Figure 6. Monthly averaged variation of ECMWF meteorological parameters (thin lines) in comparison to the total BrO mass (blue area)over the Rann of Kutch during 2004–2014. The parameters can be divided into two groups by their seasonal behaviour (precipitation, cloudcoverage and relative humidity are shown within the left column in green, a–c; surface temperature, boundary layer height and UV radiationwithin the right column in orange, d–f). The latter parameters correlate very well with the BrO mass during the first half-year, before a secondmaximum appears after the end of the monsoon. The results of a multilinear regression analysis suggest that a simple linear model (linearfunctions LF1–LF6, g) can be used to adequately describe the annual variations (see text and Table 2 for further details).
BrO VCDs (March–May). Towards the monsoon season, thewinds get significantly stronger (up to 4 ms−1 in May) andreach their maximum strength in July with more than 7 ms−1
during 90 % of all days, consistently coming from WSW.During these months, the strong wind speed supports theflooding of the Rann area by tidal water from the ArabianSea. After the monsoon, the wind speed drops rapidly (1–2 ms−1) and the wind turns to the east again. The followingwinter time is dominated by calm winds from the northeast.
It is interesting to note that the distinct seasonal wind pat-terns over the Rann of Kutch can be linked to different phases
of the observed BrO occurrence. Apart from the close tozero BrO VCDs during the monsoon months that are dom-inated by strong winds from the southwest, the maximumBrO VCDs in March–May are accompanied by slow west-erly winds, while the low BrO VCDs during wintertime areinfluenced by slow winds from the northeast. As mentionedabove, the low BrO VCDs during the monsoon are at leastpartly caused by cloud shielding. Outside the monsoon sea-son, the different wind patterns lead to differences in the ef-fective time that an air mass stays in close contact with thesalty crust of the Rann. Because the Great Rann of Kutch ex-
www.atmos-chem-phys.net/16/13015/2016/ Atmos. Chem. Phys., 16, 13015–13034, 2016
13026 C. Hörmann et al.: Seasonal variation of BrO over the Rann of Kutch
Table 2. Best fits from the multilinear regression analysis in order to model the seasonal BrO mass variation over the Rann of Kutch independency of UV surface radiation (UV), precipitation (P ), cloud coverage (CC), relative humidity (RH), boundary layer height (BLH) andsurface temperature (T ).
No. Linear function r2
1 mBrO = a1· UV 0.71
2 mBrO = a1· UV + a2 ·P 0.83
3 mBrO = a1· UV +a2 ·P + a4· RH 0.91
4 mBrO = a1· UV +a3· CC +a4· RH +a5· BLH 0.95
5 mBrO = a1· UV +a2 ·P + a3· CC +a4· RH +a5· BLH 0.97
6 mBrO = a1· UV +a2 ·P + a3· CC +a4· RH +a5· BLH +a6 · T 0.97
pands about 250 km from east to west (but only about 70 kmfrom north to south), single air packages ideally may haveremained about 4 times longer over the Great Rann for west-erly wind conditions in April than during December, whichis dominated by wind coming from the north. Aerosol par-ticles that are needed for the bromine explosion mechanismmight therefore have an increased probability to be swirledup from the salty surface crust in significant amounts duringspringtime. An examination of the actual aerosol appearanceover the Rann remains, however, difficult, as available satel-lite aerosol products are strongly influenced by the bright sur-face of the salt marsh (see also Sect. 3.3).
For the Little Rann of Kutch, the wind direction hasa much lower influence on the residence time of the airover the salt marsh, as this part of the salt marsh is muchsmaller and only slightly extended in an east–west direction(≈ 50× 80 km).
4.5 Comparison of OMI results with GOME-2observations
The GOME-2 instrument overpasses the Rann of Kutch atabout 09:30 LT (and therefore 4 h before OMI). To investi-gate the diurnal evolution of BrO VCDs over the Rann area,5 years of GOME-2 data (2007–2011) were evaluated forBrO in a similar way as for OMI (see Sect. 3 for details).As mentioned in Sect. 3.1, no cloud filter could be appliedwithout losing a significant number of probably cloud-freeGOME-2 observations because the operational cloud prod-ucts mistake the bright surface for clouds. Therefore, only aqualitative seasonal intercomparison of the data will be pre-sented in the following: no cloud filter is used and conse-quently, a geometrical AMF is used to calculate BrO VCDs(i.e. the data are only corrected for the viewing geometry; ex-plicit radiative transfer calculations are not involved). Pleasenote that the geometrical AMF is this time also applied toOMI data to guarantee the consistency of both data sets. Be-cause fully cloudy cases are not filtered out, low BrO VCDsare not only due to small near-surface BrO concentrations but
also to cloud shielding (possibly even outside of the monsoonseason). However, it should be noted that most days outsidethe monsoon months (June–September) are only effected bylow cloud fractions according to MODIS and ECMWF data.In addition, no differences in cloud cover were found thatcould be attributed to the different overflight time of the in-struments throughout the year.
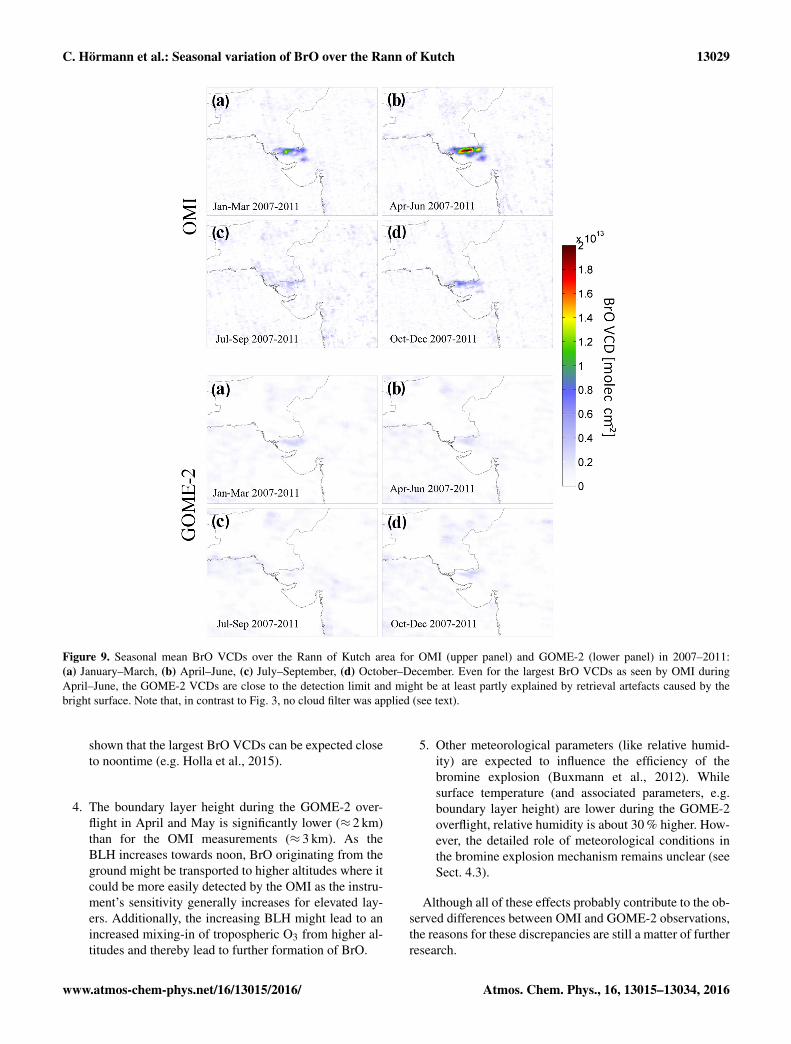
As can be seen from Fig. 9 (lower panel), the seasonalmean BrO VCD maps only indicate a very low enhance-ment over the salt marsh, which is close to background noiselevel. Please note that the GOME-2 BrO VCDs are presentedusing the same colour bar as the corresponding OMI re-sults (Fig. 9, upper panel) to emphasize the low levels ofthe GOME-2 BrO VCDs. During the monsoon season (hereJuly–September, Fig. 9, lowermost left panel), neither satel-lite instrument detects a clear enhancement, as massive cloudcoverage shields the salt marsh area, but whereas OMI dataclearly show a seasonal cycle with a pronounced maximumin April–June, no obvious seasonal variation can be seen inthe GOME-2 data. One explanation for the very small BrOVCDs measured by GOME-2 (compared to OMI) may bedifferences in chemistry due to different ambient conditionsat the early overpass time of GOME-2 (see below). Further-more, the weak BrO VCD enhancement in the GOME-2 datacould at least be partly caused by radiative transfer effectsdue to the increased surface albedo of the salt marsh. How-ever, as the surface albedo shows a typical seasonal variationin contrast to the GOME-2 BrO VCDs (see Fig. 4), this ef-fect seems to be rather small. While radiative transfer simula-tions suggest a possible overestimation of the BrO VCDs bya factor of 1.5 (50 %) due to an inadequate consideration ofthe bright surface (Sect. 3.3), this effect can be neglected forOMI, where peak BrO VCDs over the Rann are up to a fac-tor of 16 larger than for areas outside the Rann at low surfacealbedo.
In principle, there are several instrumental and chemicalreasons why the BrO VCDs over the Rann of Kutch derivedfrom GOME-2 are lower than those from OMI:
Atmos. Chem. Phys., 16, 13015–13034, 2016 www.atmos-chem-phys.net/16/13015/2016/
C. Hörmann et al.: Seasonal variation of BrO over the Rann of Kutch 13027
Figure 7. Mean wind field at 10 m altitude over the Rann of Kutch for the time around the OMI overpass (09:00 UTC) during January–June 2005–2014 according to ECMWF data together with the BrO VCDs observed from OMI (upper panel). The area is mainly affectedby westerly winds at times when BrO VCDs are high. A shift in the BrO distribution in May can be explained by a turning of the mainwind direction (and increasing velocity) towards northeast. Corresponding wind speeds (lower panels) are rather low (1–3 ms−1) before theyincrease with the onset of the monsoon season (> 7 ms−1).
1. The spatial resolution of the GOME-2 instrument is40× 80 km2, while the near-nadir ground pixel size ofOMI is 13× 24 km2. GOME-2 spectra are thereforegenerally expected to be less sensitive to localized emis-sion sources, as larger ground pixels include a largerfraction of sunlight from areas outside the investigatedobject (the typical extent of the salt marsh area show-
ing clearly enhanced BrO VCDs is less than that of aGOME-2 ground pixel).
2. GOME-2 is known to suffer from instrumental degra-dation (especially in the UV wavelength region) start-ing in 2008/2009 (Dikty and Richter, 2012). A signifi-cant increase in the scatter of retrieved VCDs has beenobserved, particularly for BrO. This, in addition to the
www.atmos-chem-phys.net/16/13015/2016/ Atmos. Chem. Phys., 16, 13015–13034, 2016
13028 C. Hörmann et al.: Seasonal variation of BrO over the Rann of Kutch
Figure 8. Same as in Fig. 7, but for July to December 2004–2014. The area is mainly affected by strong southwestern winds during monsoonmonths (> 7 ms−1). After the monsoon, the wind speed drops rapidly (≈ 2 ms−1), and the wind direction changes from west (October) tonortheast during wintertime.
generally low signal-to-noise ratio of GOME-2 in theUV compared to OMI (Fioletov et al., 2013), has led toa lower sensitivity of the instrument to small BrO con-centrations.
3. One of the main chemical reasons for much lower BrOVCDs using GOME-2 might be that the measurementstake place about 4 h earlier when compared to OMI ob-servations (≈ 09:30 vs. 13:30 LT). At the time of themorning overpass, the bromine explosion mechanism
has presumably not progressed very far, as solar irra-diance is approximately 50 % less than during OMI’safternoon overpass (according to ECMWF data) andthe process is photolytically driven. Furthermore, O3is needed for the rapid build-up of BrO, which mightbe more easily available during the morning on the onehand but may lead to differences in the spatial BrO dis-tribution patterns for GOME-2 when compared to OMIon the other hand. Observations at other salt lakes have
Atmos. Chem. Phys., 16, 13015–13034, 2016 www.atmos-chem-phys.net/16/13015/2016/
C. Hörmann et al.: Seasonal variation of BrO over the Rann of Kutch 13029
Figure 9. Seasonal mean BrO VCDs over the Rann of Kutch area for OMI (upper panel) and GOME-2 (lower panel) in 2007–2011:(a) January–March, (b) April–June, (c) July–September, (d) October–December. Even for the largest BrO VCDs as seen by OMI duringApril–June, the GOME-2 VCDs are close to the detection limit and might be at least partly explained by retrieval artefacts caused by thebright surface. Note that, in contrast to Fig. 3, no cloud filter was applied (see text).
shown that the largest BrO VCDs can be expected closeto noontime (e.g. Holla et al., 2015).
4. The boundary layer height during the GOME-2 over-flight in April and May is significantly lower (≈ 2 km)than for the OMI measurements (≈ 3 km). As theBLH increases towards noon, BrO originating from theground might be transported to higher altitudes where itcould be more easily detected by the OMI as the instru-ment’s sensitivity generally increases for elevated lay-ers. Additionally, the increasing BLH might lead to anincreased mixing-in of tropospheric O3 from higher al-titudes and thereby lead to further formation of BrO.
5. Other meteorological parameters (like relative humid-ity) are expected to influence the efficiency of thebromine explosion (Buxmann et al., 2012). Whilesurface temperature (and associated parameters, e.g.boundary layer height) are lower during the GOME-2overflight, relative humidity is about 30 % higher. How-ever, the detailed role of meteorological conditions inthe bromine explosion mechanism remains unclear (seeSect. 4.3).
Although all of these effects probably contribute to the ob-served differences between OMI and GOME-2 observations,the reasons for these discrepancies are still a matter of furtherresearch.
www.atmos-chem-phys.net/16/13015/2016/ Atmos. Chem. Phys., 16, 13015–13034, 2016
13030 C. Hörmann et al.: Seasonal variation of BrO over the Rann of Kutch
4.6 The Dead Sea (Israel/Jordan)
OMI data were additionally analysed over another salt lake,the Dead Sea, but the results will only be shortly discussedin the following. A more detailed analysis of the data (or forfurther locations) exceeds the scope of this paper.
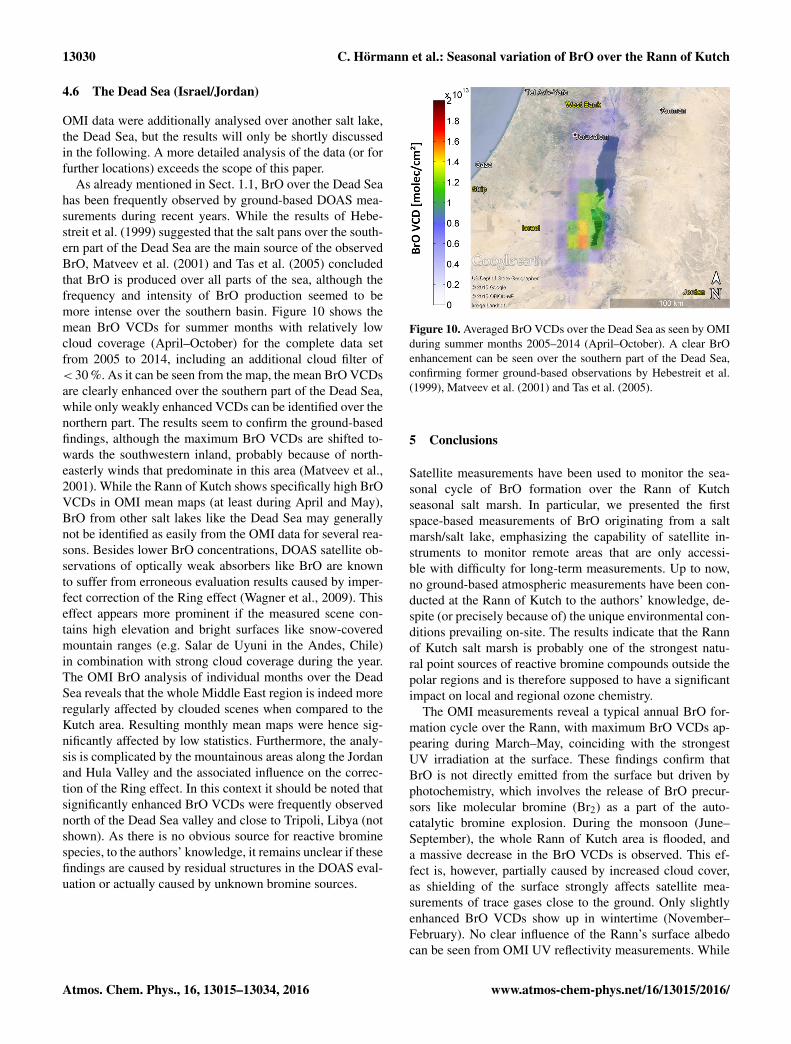
As already mentioned in Sect. 1.1, BrO over the Dead Seahas been frequently observed by ground-based DOAS mea-surements during recent years. While the results of Hebe-streit et al. (1999) suggested that the salt pans over the south-ern part of the Dead Sea are the main source of the observedBrO, Matveev et al. (2001) and Tas et al. (2005) concludedthat BrO is produced over all parts of the sea, although thefrequency and intensity of BrO production seemed to bemore intense over the southern basin. Figure 10 shows themean BrO VCDs for summer months with relatively lowcloud coverage (April–October) for the complete data setfrom 2005 to 2014, including an additional cloud filter of< 30 %. As it can be seen from the map, the mean BrO VCDsare clearly enhanced over the southern part of the Dead Sea,while only weakly enhanced VCDs can be identified over thenorthern part. The results seem to confirm the ground-basedfindings, although the maximum BrO VCDs are shifted to-wards the southwestern inland, probably because of north-easterly winds that predominate in this area (Matveev et al.,2001). While the Rann of Kutch shows specifically high BrOVCDs in OMI mean maps (at least during April and May),BrO from other salt lakes like the Dead Sea may generallynot be identified as easily from the OMI data for several rea-sons. Besides lower BrO concentrations, DOAS satellite ob-servations of optically weak absorbers like BrO are knownto suffer from erroneous evaluation results caused by imper-fect correction of the Ring effect (Wagner et al., 2009). Thiseffect appears more prominent if the measured scene con-tains high elevation and bright surfaces like snow-coveredmountain ranges (e.g. Salar de Uyuni in the Andes, Chile)in combination with strong cloud coverage during the year.The OMI BrO analysis of individual months over the DeadSea reveals that the whole Middle East region is indeed moreregularly affected by clouded scenes when compared to theKutch area. Resulting monthly mean maps were hence sig-nificantly affected by low statistics. Furthermore, the analy-sis is complicated by the mountainous areas along the Jordanand Hula Valley and the associated influence on the correc-tion of the Ring effect. In this context it should be noted thatsignificantly enhanced BrO VCDs were frequently observednorth of the Dead Sea valley and close to Tripoli, Libya (notshown). As there is no obvious source for reactive brominespecies, to the authors’ knowledge, it remains unclear if thesefindings are caused by residual structures in the DOAS eval-uation or actually caused by unknown bromine sources.
Figure 10. Averaged BrO VCDs over the Dead Sea as seen by OMIduring summer months 2005–2014 (April–October). A clear BrOenhancement can be seen over the southern part of the Dead Sea,confirming former ground-based observations by Hebestreit et al.(1999), Matveev et al. (2001) and Tas et al. (2005).
5 Conclusions
Satellite measurements have been used to monitor the sea-sonal cycle of BrO formation over the Rann of Kutchseasonal salt marsh. In particular, we presented the firstspace-based measurements of BrO originating from a saltmarsh/salt lake, emphasizing the capability of satellite in-struments to monitor remote areas that are only accessi-ble with difficulty for long-term measurements. Up to now,no ground-based atmospheric measurements have been con-ducted at the Rann of Kutch to the authors’ knowledge, de-spite (or precisely because of) the unique environmental con-ditions prevailing on-site. The results indicate that the Rannof Kutch salt marsh is probably one of the strongest natu-ral point sources of reactive bromine compounds outside thepolar regions and is therefore supposed to have a significantimpact on local and regional ozone chemistry.
The OMI measurements reveal a typical annual BrO for-mation cycle over the Rann, with maximum BrO VCDs ap-pearing during March–May, coinciding with the strongestUV irradiation at the surface. These findings confirm thatBrO is not directly emitted from the surface but driven byphotochemistry, which involves the release of BrO precur-sors like molecular bromine (Br2) as a part of the auto-catalytic bromine explosion. During the monsoon (June–September), the whole Rann of Kutch area is flooded, anda massive decrease in the BrO VCDs is observed. This ef-fect is, however, partially caused by increased cloud cover,as shielding of the surface strongly affects satellite mea-surements of trace gases close to the ground. Only slightlyenhanced BrO VCDs show up in wintertime (November–February). No clear influence of the Rann’s surface albedocan be seen from OMI UV reflectivity measurements. While
Atmos. Chem. Phys., 16, 13015–13034, 2016 www.atmos-chem-phys.net/16/13015/2016/
C. Hörmann et al.: Seasonal variation of BrO over the Rann of Kutch 13031
enhanced BrO VCDs may appear due to an unconsideredincrease in the surface albedo, the Rann’s surface appearsrelatively dark during the time of the maximum BrO VCDs(probably because of first moistening towards the monsoonseason), and BrO can hardly be detected during the wintermonths, when the surface appears brightest.
A first attempt to describe the annual BrO cycle based ona simple linear parameterization of different meteorologicalquantities indicates that, in addition to UV irradiation, thevariation of the boundary layer height is an essential param-eter needed to describe the annual BrO peak, which can be atleast partly explained by the higher sensitivity of the satellitefor elevated layers. For an adequate description of the near-surface BrO variations, relative humidity and precipitationalso play an important role. The seasonal wind conditionscan be additionally linked to the observed seasonal variationof the BrO VCDs: the maximum VCDs in March–May areaccompanied by westerly winds, which may lead to an in-creased swirling up of aerosol particles due to the east–westexpansion of the Rann and the thereby increased residencetime of air masses over the salt crust. In contrast, low VCDsduring wintertime are affected by slow winds from the north-east.
Corresponding GOME-2 measurements during the morn-ing (4 h earlier than OMI) show about 4 times lower BrOVCDs and no clear seasonal cycle, aside from minimum col-umn densities during the strongly cloud-affected monsoonmonths. Although instrumental reasons may contribute tothese findings, the results indicate the fundamental influenceof ambient meteorological conditions at the time of the satel-lite overflight (e.g. the UV radiation at the surface is about50 % lower) and that the bromine explosion still needs toevolve during the morning hours in order to allow BrO con-centrations to build up to values that may be detected fromspace.
Additional OMI measurements of enhanced BrO VCDsover the Dead Sea demonstrate the potential of satelliteinstruments for the global observation of reactive halogenspecies over salt lakes. By the improved temporal and in par-ticular spatial resolution of upcoming satellite instrumentslike the TROPOspheric Monitoring Instrument (TROPOMI,Veefkind et al., 2012, launch expected for early 2017), thenumber of daily salt lake observations will further increase.Furthermore, satellite instruments on geostationary orbitsfeaturing several measurements per day over the same lo-cation like Sentinel-4 (Ingmann et al., 2012, expected for2019) will allow us to investigate the diurnal evolution ofthe bromine explosion in more detail (not only over saltlakes). The significantly enhanced BrO VCDs over the Rannof Kutch in combination with the unique local conditions onthe other hand strongly suggest undertaking a ground-basedmeasurement field campaign in that area to better constrainthe general release mechanisms of reactive bromine com-pounds from salt marshes and lakes.
6 Data availability
The algorithm has been applied to L1 data from the OMI andGOME-2A satellite instrument. The data are publicly acces-sible; the respective links to the data sets are included in thereferences provided in Table 1.
The Supplement related to this article is available onlineat doi:10.5194/acp-16-13015-2016-supplement.
Acknowledgements. We would like to thank the agencies providingthe satellite data: the OMI OMSO2 (including reflectivity at331 nm), OMCLDO2 and OMCLDRR products as well as MODISAQUA/TERRA True Color and channel 7-2-1 images are archivedand distributed by the Goddard Earth Sciences Data & InformationServices Center (NASA). We acknowledge EUMETSAT forproviding GOME-2A Level 1 data and ECMWF for providingmeteorological parameters over India and Pakistan.
The article processing charges for this open-accesspublication were covered by the Max Planck Society.
Edited by: B. N. DuncanReviewed by: two anonymous referees
References
Acarreta, J. R. and de Haan, J. F.: Cloud Pressure Algorithm Basedon O2–O2 Absorption, chap. 2 in: OMI Algorithm TheoreticalBasis Document, Volume III – Clouds, Aerosols, and Surface UVIrradiance, Version 2.0, 17–30, available at: http://eospso.gsfc.nasa.gov/sites/default/files/atbd/ATBD-OMI-03.pdf (last access:28 January 2016), 2002.
Avallone, L. M.: In situ measurements of bromine oxide at twohigh-latitude boundary layer sites: Implications of variability, J.Geophys. Res., 108, 4089, doi:10.1029/2002JD002843, 2003.
Barrie, L. A., Bottenheim, J. W., Schnell, R. C., Crutzen, P. J., andRasmussen, R. A.: Ozone destruction and photochemical reac-tions at polar sunrise in the lower Arctic atmosphere, Nature,334, 138–141, doi:10.1038/334138a0, 1988.
Barrie, L. A., den Hartog, G., Bottenheim, J. W., and Landsberger,S.: Anthropogenic aerosols and gases in the lower troposphereat Alert, Canada, in April 1986, J. Atmos. Chem., 9, 101–127,doi:10.1007/BF00052827, 1989.
Begoin, M., Richter, A., Weber, M., Kaleschke, L., Tian-Kunze,X., Stohl, A., Theys, N., and Burrows, J. P.: Satellite observa-tions of long range transport of a large BrO plume in the Arctic,Atmos. Chem. Phys., 10, 6515–6526, doi:10.5194/acp-10-6515-2010, 2010.
Bobrowski, N. and Giuffrida, G.: Bromine monoxide / sulphur diox-ide ratios in relation to volcanological observations at Mt.Etna 2006–2009, Solid Earth, 3, 433–445, doi:10.5194/se-3-433-2012, 2012.
www.atmos-chem-phys.net/16/13015/2016/ Atmos. Chem. Phys., 16, 13015–13034, 2016
13032 C. Hörmann et al.: Seasonal variation of BrO over the Rann of Kutch
Bobrowski, N. and Platt, U.: SO2/BrO ratios studied in fivevolcanic plumes, J. Volcanol. Geoth. Res., 166, 147–160,doi:10.1016/j.jvolgeores.2007.07.003, 2007.
Bobrowski, N., Hönninger, G., Galle, B., and Platt, U.: Detection ofbromine monoxide in a volcanic plume, Nature, 423, 273–276,doi:10.1038/nature01625, 2003.
Bogumil, K., Orphal, J., Homann, T., Voigt, S., Spietz, P., Fleis-chmann, O., Vogel, A., Hartmann, M., Kromminga, H., Bovens-mann, H., Frerick, J., and Burrows, J.: Measurements of molec-ular absorption spectra with the SCIAMACHY pre-flight model:instrument characterization and reference data for atmosphericremote-sensing in the 230–2380 nm region, J. Photochem. Pho-tobio. A, 157, 167–184, doi:10.1016/S1010-6030(03)00062-5,2003.
Boichu, M., Oppenheimer, C., Roberts, T. J., Tsanev, V., and Kyle,P. R.: On bromine, nitrogen oxides and ozone depletion in thetropospheric plume of Erebus volcano (Antarctica), Atmos. Envi-ron., 45, 3856–3866, doi:10.1016/j.atmosenv.2011.03.027, 2011.
Buxmann, J., Balzer, N., Bleicher, S., Platt, U., and Zetzsch, C.:Observations of bromine explosions in smog chamber experi-ments above a model salt pan, Int. J. Chem. Kinet., 44, 312–326,doi:10.1002/kin.20714, 2012.
Callies, J., Corpaccioli, E., Eisinger, M., Hahne, A., and Lefevre,A.: GOME-2 – MetOp’s Second Generation Sensor for Opera-tional ozone Monitoring, ESA Bulletin, 102, 28–36, 2000.
Carn, S. A., Krotkov, N. A., Yang, K., and Krueger, A. J.: Measuringglobal volcanic degassing with the Ozone Monitoring Instrument(OMI), Geological Society, London, Special Publications, 380,SP380.12, doi:10.1144/SP380.12, 2013.
Chance, K.: Analysis of BrO measurements from the Global OzoneMonitoring Experiment, Geophys. Res. Lett., 25, 3335–3338,doi:10.1029/98GL52359, 1998.
Chance, K.: OMBRO–OMHCHO–OMOCLO De-StripingREADME FILE, available at: http://ozoneaq.gsfc.nasa.gov/media/docs/OMSAO_DeStriping_README.pdf (last access:28 January 2016), 2007.
Choi, S., Wang, Y., Salawitch, R. J., Canty, T., Joiner, J., Zeng, T.,Kurosu, T. P., Chance, K., Richter, A., Huey, L. G., Liao, J., Neu-man, J. A., Nowak, J. B., Dibb, J. E., Weinheimer, A. J., Diskin,G., Ryerson, T. B., da Silva, A., Curry, J., Kinnison, D., Tilmes,S., and Levelt, P. F.: Analysis of satellite-derived Arctic tropo-spheric BrO columns in conjunction with aircraft measurementsduring ARCTAS and ARCPAC, Atmos. Chem. Phys., 12, 1255–1285, doi:10.5194/acp-12-1255-2012, 2012.
Deutschmann, T., Beirle, S., Frieß, U., Grzegorski, M., Kern, C.,Kritten, L., Platt, U., Prados-Román, C., Pukite, J., Wagner, T.,Werner, B., and Pfeilsticker, K.: The Monte Carlo atmosphericradiative transfer model McArtim: Introduction and validation ofJacobians and 3D features, J. Quant. Spectrosc. Ra., 112, 1119–1137, doi:10.1016/j.jqsrt.2010.12.009, 2011.
Dikty, S. and Richter, A.: GOME-2 on MetOp-A Supportfor Analysis of GOME-2 In-Orbit Degradation and Im-pacts on Level 2 Data Products, final report, October 2011,available at: http://www.iup.uni-bremen.de/doas/reports/Final_Report_Level-2_Data_GOME-2_Degradation.pdf (last access:28 January 2016), 2012.
EUMETSAT: GOME-2 Product Guide, available at: http://www.eumetsat.int/website/home/Satellites/CurrentSatellites/
Metop/MetopDesign/GOME2/index.html (last access: 28January 2016), 2005.
Fioletov, V. E., McLinden, C. A., Krotkov, N., Yang, K., Loyola,D. G., Valks, P., Theys, N., Van Roozendael, M., Nowlan, C. R.,Chance, K., Liu, X., Lee, C., and Martin, R. V.: Application ofOMI, SCIAMACHY, and GOME-2 satellite SO 2 retrievals fordetection of large emission sources, J. Geophys. Res.-Atmos.,118, 11399–11418, doi:10.1002/jgrd.50826, 2013.
Frieß, U.: Dynamics and chemistry of tropospheric bromine explo-sion events in the Antarctic coastal region, J. Geophys. Res., 109,D06305, doi:10.1029/2003JD004133, 2004.
Greenblatt, G. D., Orlando, J. J., Burkholder, J. B., and Rav-ishankara, A. R.: Absorption Measurements of Oxygen Be-tween 330 and 1140 nm, J. Geophys. Res., 95, 18577–18582,doi:10.1029/JD095iD11p18577, 1997.
Gür, B., Spietz, P., Orphal, J., and Burrows, J. P.: Absorption SpectraMeasurements with the GOME-2 FMs using the IUP/IFE-UBsCalibration Apparatus for Trace Gas Absorption SpectroscopyVATGAS, Final Report, University of Bremen, October 2005.
Hausmann, M. and Platt, U.: Spectroscopic measurement ofbromine oxide and ozone in the high Arctic during Polar Sun-rise Experiment 1992, J. Geophys. Res., 99, 25399–25413,doi:10.1029/94JD01314, 1994.
Hebestreit, K., Stutz, J., Rosen, D., Matveiv, V., Peleg, M.,Luria, M., and Platt, U.: DOAS Measurements of Tropo-spheric Bromine Oxide in Mid-Latitudes, Science, 283, 55–57,doi:10.1126/science.283.5398.55, 1999.
Holla, R.: Reactive Halogen Species above Salt Lakes andSalt Pans, PhD thesis, University of Heidelberg, avail-able at: http://archiv.ub.uni-heidelberg.de/volltextserver/14636/1/Dissertation_Holla_Robert.pdf (last access: 13 October 2016),2012.
Holla, R., Schmitt, S., Frieß, U., Pöhler, D., Zingler, J.,Corsmeier, U., and Platt, U.: Vertical distribution of BrO inthe boundary layer at the Dead Sea, Environ. Chem., 12, 438,doi:10.1071/EN14224, 2015.
Hönninger, G., Bobrowski, N., Palenque, E. R., Torrez, R.,and Platt, U.: Reactive bromine and sulfur emissions atSalar de Uyuni, Bolivia, Geophys. Res. Lett., 31, L04101,doi:10.1029/2003GL018818, 2004a.
Hönninger, G., Leser, H., Sebastián, O., and Platt, U.: Ground-basedmeasurements of halogen oxides at the Hudson Bay by activelongpath DOAS and passive MAX-DOAS, Geophys. Res. Lett.,31, L04111, doi:10.1029/2003GL018982, 2004b.
Hörmann, C., Sihler, H., Bobrowski, N., Beirle, S., Penning deVries, M., Platt, U., and Wagner, T.: Systematic investigationof bromine monoxide in volcanic plumes from space by usingthe GOME-2 instrument, Atmos. Chem. Phys., 13, 4749–4781,doi:10.5194/acp-13-4749-2013, 2013.
Ingmann, P., Veihelmann, B., Straume, A., and Meijer, Y.: The sta-tus of implementation of the atmospheric composition relatedGMES missions Sentinel-4/Sentinel-5 and Sentinel-5p, Proceed-ings of the 2012 EUMETSAT Meteorological Satellite Confer-ence, Sopot, Poland, 3–7 September 2012.
Joiner, J., Vasilkov, A., Flittner, D., Buscela, E., and Gleason, J.:Retrieval of Cloud Pressure fromn Rotational Raman Scattering,chap. 3 in: OMI Algorithm Theoretical Basis Document, Vol-ume III - Clouds, Aerosols, and Surface UV Irradiance, Version2.0, 31–46, available at: http://eospso.gsfc.nasa.gov/sites/default/
Atmos. Chem. Phys., 16, 13015–13034, 2016 www.atmos-chem-phys.net/16/13015/2016/
C. Hörmann et al.: Seasonal variation of BrO over the Rann of Kutch 13033
files/atbd/ATBD-OMI-03.pdf (last access: 28 January 2016),2002.
KNMI: Background information about the Row Anomaly inOMI, available at: http://www.knmi.nl/omi/research/product/rowanomaly-background.php (last access on 28 January 2016),2015.
Koelemeijer, R. B. A. and Stammes, P.: A fast method for retrievalof cloud parameters using oxygen A band measurements fromthe Global Ozone Monitoring Experiment, J. Geophys. Res., 106,3475–3490, doi:10.1029/2000JD900657, 2001.
Koelemeijer, R. B. A., Stammes, P., Hovenier, J. W., and de Haan,J. F.: Global distributions of effective cloud fraction andcloud top pressure derived from oxygen A band spectra mea-sured by the Global Ozone Monitoring Experiment: Com-parison to ISCCP data, J. Geophys. Res., 107, AAC 5–1,doi:10.1029/2001JD000840, 2002.
Leser, H., Hönninger, G., and Platt, U.: MAX–DOAS measure-ments of BrO and NO2 in the marine boundary layer, Geophys.Res. Lett., 30, 1537, doi:10.1029/2002GL015811, 2003.
Levelt, P. F., van den Oord, G. H. J., Dobber, M. R., Mälkki, A.,Visser, H., de Vries, J., Stammes, P., Lundell, J. O. V., and Saari,H.: The Ozone Monitoring Instrument, IEEE Trans. Geosci. Re-mote Sens., 44, 1093–1101, 2006.
Lieb-Lappen, R. M. and Obbard, R. W.: The role of blowing snowin the activation of bromine over first-year Antarctic sea ice,Atmos. Chem. Phys., 15, 7537–7545, doi:10.5194/acp-15-7537-2015, 2015.
Loyola R., D. G.: Automatic cloud analysis from polar-orbiting satellites using neural network and data fu-sion techniques, IEEE Geosci. Remote S., 4, 2530–2533,doi:10.1109/IGARSS.2004.1369811, 2004.
Lübcke, P., Bobrowski, N., Arellano, S., Galle, B., Garzón, G., Vo-gel, L., and Platt, U.: BrO/SO2 molar ratios from scanning DOASmeasurements in the NOVAC network, Solid Earth, 5, 409–424,doi:10.5194/se-5-409-2014, 2014.
Martin, M., Pöhler, D., Seitz, K., Sinreich, R., and Platt, U.: BrOmeasurements over the Eastern North-Atlantic, Atmos. Chem.Phys., 9, 9545–9554, doi:10.5194/acp-9-9545-2009, 2009.
Matveev, V., Peleg, M., Rosen, D., Tov-Alper, D. S., Hebestreit,K., Stutz, J., Platt, U., Blake, D., and Luria, M.: Bromine oxide-ozone interaction over the Dead Sea, J. Geophys. Res.-Atmos.,106, 10375–10387, doi:10.1029/2000JD900611, 2001.
Mehta, A. S., Ghosh, P. K., Shah, H. N., and Sanghavi, R. J.: Ideasfor process improvement emanating from audit of a bromineplant in the Greater Rann of Kutch, Indian J. Chem. Techn., 10,644–653, 2003.
Munro, R., Eisinger, M., Anderson, C., Callies, J., Carpaccioli, E.,Lang, R., Lefevre, A., Livschitz, Y., and Albinana, A. P.: GOME-2 on MetOp, The 2006 EUMETSAT Meteorological SatelliteConference, Helsinki, Finland, 2006.
Oltmans, S. J.: Surface ozone measurements in clean air, J. Geo-phys. Res., 86, 1174, doi:10.1029/JC086iC02p01174, 1981.
Oltmans, S. J. and Komhyr, W. D.: Surface ozone distributions andvariations from 1973–1984: Measurements at the NOAA Geo-physical Monitoring for Climatic Change Baseline Observato-ries, J. Geophys. Res., 91, 5229, doi:10.1029/JD091iD04p05229,1986.
Oppenheimer, C., Tsanev, V., Braban, C., Cox, R., Adams, J.,Aiuppa, A., Bobrowski, N., Delmelle, P., Barclay, J., and Mc-
gonigle, A.: BrO formation in volcanic plumes, Geochim. Cos-mochim. Ac., 70, 2935–2941, doi:10.1016/j.gca.2006.04.001,2006.
Pacha, F.: My Name is Salt – a documentary film by FaridaPacha, trigon-film, Ennetbaden, Switzerland, available at: http://mynameissalt.com (last access: 13 October 2016), 2013.
Peterson, P. K., Simpson, W. R., Pratt, K. A., Shepson, P. B.,Frieß, U., Zielcke, J., Platt, U., Walsh, S. J., and Nghiem, S.V.: Dependence of the vertical distribution of bromine monox-ide in the lower troposphere on meteorological factors such aswind speed and stability, Atmos. Chem. Phys., 15, 2119-2137,doi:10.5194/acp-15-2119-2015, 2015.
Platt, U. and Janssen, C.: Observation and role of the free radicalsNO3, ClO, BrO and IO in the troposphere, Faraday Discuss., 100,175–198, doi:10.1039/fd9950000175, 1995.
Platt, U. and Lehrer, E.: Arctic Tropospheric Ozone Chem-istry (ARCTOC) – Results from field, laboratory andmodelling studies, Final Report of the EU-Project EV5V-CT93-0318, available at: http://bookshop.europa.eu/en/arctic-tropospheric-ozone-chemistry-pbCGNA17783/ (lastaccess: 28 January 2016), 1997.
Platt, U. and Stutz, J.: Differential Optical Absorption Spec-troscopy: Principles And Applications, Springer, 2008.
Pöhler, D., Vogel, L., Friess, U., and Platt, U.: Observation of halo-gen species in the Amundsen Gulf, Arctic, by active long-pathdifferential optical absorption spectroscopy, P. Natl. Acad. Sci.USA, 107, 6582–6587, doi:10.1073/pnas.0912231107, 2010.
Read, K. A., Mahajan, A. S., Carpenter, L. J., Evans, M. J., Faria, B.V. E., Heard, D. E., Hopkins, J. R., Lee, J. D., Moller, S. J., Lewis,A. C., Mendes, L., McQuaid, J. B., Oetjen, H., Saiz-Lopez, A.,Pilling, M. J., and Plane, J. M. C.: Extensive halogen-mediatedozone destruction over the tropical Atlantic Ocean, Nature, 453,1232–1235, doi:10.1038/nature07035, 2008.
Richter, A., Wittrock, F., Eisinger, M., and Burrows, J. P.:GOME observations of tropospheric BrO in northern hemi-spheric spring and summer 1997, Geophys. Res. Lett., 25, 2683–2686, doi:10.1029/98GL52016, 1998.
Rix, M., Valks, P., Hao, N., Loyola, D., Schlager, H., Huntrieser,H., Flemming, J., Koehler, U., Schumann, U., and Inness,A.: Volcanic SO2, BrO and plume height estimations usingGOME-2 satellite measurements during the eruption of Ey-jafjallajökull in May 2010, J. Geophys. Res., 117, D00U19,doi:10.1029/2011JD016718, 2012.
Rozanov, V. V., Kokhanovsky, A. A., Loyola, D., Siddans, R.,Latter, B., Stevens, A., and Burrows, J. P.: Intercomparison ofcloud top altitudes as derived using GOME and ATSR-2 instru-ments onboard ERS-2, Remote Sens. Environ., 102, 186–193,doi:10.1016/j.rse.2006.02.009, 2006.
Saiz-Lopez, A.: Bromine oxide in the mid-latitude ma-rine boundary layer, Geophys. Res. Lett., 31, L03111,doi:10.1029/2003GL018956, 2004.
Saiz-Lopez, A. and von Glasow, R.: Reactive halogen chem-istry in the troposphere, Chem. Soc. Rev., 41, 6448–6472,doi:10.1039/C2CS35208G, 2012.
Salawitch, R. J., Canty, T., Kurosu, T., Chance, K., Liang, Q.,da Silva, A., Pawson, S., Nielsen, J. E., Rodriguez, J. M., Bhar-tia, P. K., Liu, X., Huey, L. G., Liao, J., Stickel, R. E., Tanner,D. J., Dibb, J. E., Simpson, W. R., Donohoue, D., Weinheimer,A., Flocke, F., Knapp, D., Montzka, D., Neuman, J. A., Nowak,
www.atmos-chem-phys.net/16/13015/2016/ Atmos. Chem. Phys., 16, 13015–13034, 2016
13034 C. Hörmann et al.: Seasonal variation of BrO over the Rann of Kutch
J. B., Ryerson, T. B., Oltmans, S., Blake, D. R., Atlas, E. L.,Kinnison, D. E., Tilmes, S., Pan, L. L., Hendrick, F., Van Roozen-dael, M., Kreher, K., Johnston, P. V., Gao, R. S., Johnson, B., Bui,T. P., Chen, G., Pierce, R. B., Crawford, J. H., and Jacob, D. J.:A new interpretation of total column BrO during Arctic spring,Geophys. Res. Lett., 37, L21805, doi:10.1029/2010GL043798,2010.
Sihler, H., Platt, U., Beirle, S., Marbach, T., Kühl, S., Dörner,S., Verschaeve, J., Frieß, U., Pöhler, D., Vogel, L., Sander,R., and Wagner, T.: Tropospheric BrO column densities inthe Arctic derived from satellite: retrieval and comparison toground-based measurements, Atmos. Meas. Tech., 5, 2779–2807, doi:10.5194/amt-5-2779-2012, 2012.
Smoydzin, L. and von Glasow, R.: Modelling chemistry over theDead Sea: bromine and ozone chemistry, Atmos. Chem. Phys.,9, 5057–5072, doi:10.5194/acp-9-5057-2009, 2009.
Stammes, P., Sneep, M., de Haan, J. F., Veefkind, J. P., Wang, P.,and Levelt, P. F.: Effective cloud fractions from the Ozone Moni-toring Instrument: Theoretical framework and validation, J. Geo-phys. Res., 113, D16S38, doi:10.1029/2007JD008820, 2008.
Stutz, J., Ackermann, R., Fast, J. D., and Barrie, L.: Atmosphericreactive chlorine and bromine at the Great Salt Lake, Utah, Geo-phys. Res. Lett., 29, 18–1–18–4, doi:10.1029/2002GL014812,2002.
Tas, E., Peleg, M., Matveev, V., Zingler, J., and Luria, M.:Frequency and extent of bromine oxide formation overthe Dead Sea, J. Geophys. Res.-Atmos., 110, D11304,doi:10.1029/2004JD005665, 2005.
Tas, E., Peleg, M., Pedersen, D. U., Matveev, V., Pour Biazar, A.,and Luria, M.: Measurement-based modeling of bromine chem-istry in the boundary layer: 1. Bromine chemistry at the DeadSea, Atmos. Chem. Phys., 6, 5589–5604, doi:10.5194/acp-6-5589-2006, 2006.
Theys, N., Roozendael, M. V., Dils, B., Hendrick, F., Hao, N.,and Mazière, M. D.: First satellite detection of volcanic brominemonoxide emission after the Kasatochi eruption, Geophys. Res.Lett., 36, L03809, doi:10.1029/2008GL036552, 2009a.
Theys, N., Van Roozendael, M., Errera, Q., Hendrick, F., Daerden,F., Chabrillat, S., Dorf, M., Pfeilsticker, K., Rozanov, A., Lotz,W., Burrows, J. P., Lambert, J.-C., Goutail, F., Roscoe, H. K.,and De Mazière, M.: A global stratospheric bromine monoxideclimatology based on the BASCOE chemical transport model,Atmos. Chem. Phys., 9, 831–848, doi:10.5194/acp-9-831-2009,2009b.
Theys, N., Van Roozendael, M., Hendrick, F., Yang, X., De Smedt,I., Richter, A., Begoin, M., Errera, Q., Johnston, P. V., Kreher, K.,and De Mazière, M.: Global observations of tropospheric BrOcolumns using GOME-2 satellite data, Atmos. Chem. Phys., 11,1791–1811, doi:10.5194/acp-11-1791-2011, 2011.
Theys, N., De Smedt, I., Van Roozendael, M., Froidevaux, L.,Clarisse, L., and Hendrick, F.: First satellite detection of volcanicOClO after the eruption of Puyehue-Cordón Caulle, Geophys.Res. Lett., 41, 667–672, doi:10.1002/2013GL058416, 2014.
Torres, O., Tanskanen, A., Veihelmann, B., Ahn, C., Braak, R.,Bhartia, P. K., Veefkind, P., and Levelt, P.: Aerosols andsurface UV products from Ozone Monitoring Instrument ob-servations: An overview, J. Geophys. Res., 112, D24S47,doi:10.1029/2007JD008809, 2007.
Vandaele, A. C., Hermans, C., Fally, S., Carleer, M., Colin, R.,Mérienne, M., Jenouvrier, A., and Coquart, B.: High-resolutionFourier transform measurement of the NO2 visible and near-infrared absorption cross sections: Temperature and pressure ef-fects, J. Geophys. Res., 107, 4348, doi:10.1029/2001JD000971,2002.
Vasilkov, A., Joiner, J., Spurr, R., Bhartia, P. K., Levelt, P., andStephens, G.: Evaluation of the OMI cloud pressures derivedfrom rotational Raman scattering by comparisons with othersatellite data and radiative transfer simulations, J. Geophys. Res.,113, D15S19, doi:10.1029/2007JD008689, 2008.
Veefkind, J. P., Aben, I., McMullan, K., Förster, H., de Vries,J., Otter, G., Claas, J., Eskes, H. J., de Haan, J. F., Kleipool,Q., van Weele, M., Hasekamp, O., Hoogeveen, R., Landgraf,J., Snel, R., Tol, P., Ingmann, P., Voors, R., Kruizinga, B.,Vink, R., Visser, H., and Levelt, P. F.: TROPOMI on the ESASentinel-5 Precursor: A GMES mission for global observationsof the atmospheric composition for climate, air quality andozone layer applications, Remote Sens. Environ., 120, 70–83,doi:10.1016/j.rse.2011.09.027, 2012.
Wagner, T. and Platt, U.: Satellite mapping of enhanced BrOconcentrations in the troposphere, Nature, 395, 486–490,doi:10.1038/26723, 1998.
Wagner, T., Beirle, S., and Deutschmann, T.: Three-dimensionalsimulation of the Ring effect in observations of scattered sunlight using Monte Carlo radiative transfer models, Atmos. Meas.Tech., 2, 113–124, doi:10.5194/amt-2-113-2009, 2009.
Wilmouth, D. M., Hanisco, T. F., Donahue, N. M., and Anderson,J. G.: Fourier Transform Ultraviolet Spectroscopy of the A253/2← X253/2 Transition of BrO, J. Phys. Chem. A, 103, 8935–8945, doi:10.1021/jp991651o, 1999.
Atmos. Chem. Phys., 16, 13015–13034, 2016 www.atmos-chem-phys.net/16/13015/2016/