Embed Size (px)
Citation preview
JOURNAL OF GEOPHYSICAL RESEARCH, VOL. 89, NO. D7, PAGES 11,717-11,730, DECEMBER 20, 1984
Seasonal Variation of the Global Water Balance
Based on Aerological Data
FRANK BRYAN
Geophysical Fluid Dynamics Program, Princeton University, New Jersey
ABRAHAM OORT
Geophysical Fluid Dynamics Laboratory/NOAA, Princeton University, New Jersey
The distribution of evaporation minus precipitation over the globe and its seasonal variations are estimated from global atmospheric circulation statistics for the period May 1963 to April 1973. Meridio- nal profiles of evaporation minus precipitation over the Atlantic, Pacific, and Indian oceans, over all oceans combined, and over all continents combined, as well as the total evaporation minus precipitation over each oceanic and continental region, are shown. The Pacific Ocean is found to have an excess of precipitation and the Atlantic an excess of evaporation throughout the year. Over the Indian Ocean, precipitation exceeds evaporation during December-February, while evaporation exceeds precipitation during the rest of the year and in the annual mean. The results are generally in qualitative agreement with previous estimates of the annual mean world water balance based on surface observations. There are large quantitative discrepancies, however, particularly in the subtropics. A comparison with the analysis of 2 months of data from the FGGE period suggests that the primary source of error in our results is associated with spatial sampling deficiencies in the general circulation statistics. It appears that in many regions the current operational rawinsonde network is inadequate to give reliable quantitative estimates of differentiated quantities such as are required in computing the atmospheric water balance.
1. INTRODUCTION
The regional distributions of evaporation, precipitation, and runoff are of great interest to both climatologist and oceanog- raphers. Accurate estimates of evaporation and precipitation over the ocean will be required for the success of most studies of ocean-atmosphere interactions planned for this decade (e.g., the "Cage" [Dobson et al., 1982], and "TOGA" (Tropical Ocean-Global Atmosphere) [National Research Council, 1983] experiments). Another important factor is that the salinity dis- tribution in the ocean is forced by the input and removal of freshwater at the surface. Unfortunately, the surface water bal- ance is extremely difficult to monitor.
Heretofore, estimates of the world water balance have gen- erally relied on direct surface measurements for precipitation, on empirical formulae for evaporation, and on stream gauges in the major rivers for runoff. Various remote sensing tech- niques for estimating these parameters have been proposed (e.g., the GOES Precipitation Index lArkin, 1983]) but, as yet, have not been implemented operationally for sufficiently long periods to obtain climate means. Furthermore, these tech- niques are often only valid in certain climatic zones and hence do not provide global coverage. Existing precipitation measurements are very spotty. In fact, over the oceans it is necessary to use empirically derived correlations between pre- cipitation frequency and amount or to extrapolate from adja- cent coastal or island stations. Reed [1980] has shown that the topographic influence of even the lowest islands can cause significant errors in the extrapolated precipitation values. Evaporation estimates using empirically derived bulk formu- lae, especially when applied to climatological data, are also subject to large errors. Finally, although river gauges provide reliable "natural rain gauges," up to 35% of the total conti-
Copyright 1984 by the American Geophysical Union.
Paper number 4D 1192. 0148-0227/84/004D- 1192505.00
nental runoff seems to occur in small ungauged rivers or as diffuse runoff [Baurngartner and Reichel, 1975].
Due to the obvious incompatibility among the terms of the surface water balance, previous estimates have required rather subjective adjustments in the individual terms in order to obtain local and global balances [Baurnqartner and Reichel, 1975; Baum•tartner, 1981]. Baumgartner provides a compre- hensive account of the problems and the resulting uncer- tainties in estimating the world water balance from surface observations. In light of these difficulties it is desirable to obtain an independent estimate of the world water balance.
The aerological method, which utilizes the conservation equation for atmospheric water substance to obtain the sur- face water balance as a residual, provides such an independent estimate. In contrast to the traditional method the aero!ogical method is based on first principles and does not require em- pirically derived constants or formulae. In addition the aero- logical method lends itself to studies of the temporal varia- bility of atmospheric balances, such as the seasonal variation of the world water balance. The errors incurred by neglecting terms in the balance equation can generally be quantified through scale analysis. Successful use of the method does re- quire that the accumulated errors of the individual terms in the balance equation be small compared to the residual we are seeking. Significant errors in the estimates of the surface water balance then will be due solely to inadequate or inconsistent data. As discussed below, the data used in this study may not be adequate to provide reliable estimates of the surface water balance in some regions.
In this study we apply the aerological method to the global atmospheric circulation statistics for the period May 1963 to April 1973 that were compiled by Oort [1983]. While this method has been applied to the water balance of specific con- tinental [e.g., Rasmusson, 1968, for North America] and mari- time [e.g., Peixoto et al., 1982, for the Mediterranean Sea] regions, this is, to our knowledge, the first attempt to so obtain an estimate of the world water balance, treating oceans
11,717
11,718 BRYAN AND OORT: GLOBAL WATER BALANCE
and land separately. Maps of the global distribution of water vapor flux divergence (approximately equal to evaporation minus precipitation, see section 2) have previously been pre- sented by Peixoto ['1972] and Peixoto and Oor• [1983], but they did not explicitly consider regional budgets or land-ocean contrast. Rosen and•Omolayo [1981], on the other hand, con- sidered the transfer of water vapor across continental bound- aries for the northern hemisphere, but they did not compute the associated flux divergences. Our results will be presented as annual and seasonal mean meridional profiles of evapora- tion minus precipitation (E- P) for each ocean, all oceans combined, all continents combined, and as tabulations of total E - P for each oceanic and continental region.
In order to provide a preliminary estimate of the effects of data deficiencies on these results we have repeated some of the calculations for the months of January and July 1979 using the First GARP Global Experiment (FGGE) level 3b data set produced at the Geophysical Fluid Dynamics Laboratory (GFDL). This set of analyses is based on a somewhat better observational network than ours, so that differences between the water balance obtained from our general circulation statis- tics and the FGGE data may given an estimate of the spatial and temporal sampling errors in our results. The results sug- gest that there are large uncertainties in some of our regional water budget estimates, resulting primarily from spatial sam- pling deficiencies in the general circulation statistics.
Despite the uncertainties in our results, they can provide valuable information on the world water balance and on the
reliability of the aerological method when applied to regional budgets. The results are undoubtedly qualitatively correct and provide the only estimate of the seasonal variation of the water balance in some regions. In contrast to previous studies of the world water balance, the homogeneous nature of our data set and the objective, and relatively simple, analysis pro- cedure enable us to maintain internal consistency with no need for subjective adjustments.
In section 2 an outline is given of the aerological method and its application to regional water balance studies. In sec- tion 3 the data and analysis procedures are described. In sec- tion 4 our world water balance estimates are presented and compared with those of previous authors. In section 5, some possible sources of errors in our results are presented, and in section 6 the results are summarized and objectives for future work are suggested.
2. TIIE AEROLOGICAL METHOD
The balance requirements for atmospheric water vapor and the basis of the aerological method have been thoroughly dis- cussed by Peixoto [1973]. We will briefly review some of the relevant aspects here.
The balance equation for atmospheric water substance is
• + V. Q - E .... V. Q• - P (1) c•t •t
In this equation the quantities
= •oPSq dp w -- (2)
and
s dp Q = qv -- (3)
are the vertically integrated water vapor content and the verti-
cally integrated horizontal flux vector of water vapor, respec- tively. W• and Qc are the corresponding quantities for condensed-phase atmospheric water. Finally, E is the evapora- tion from the surface, P is the precipitation falling on the surface, ¾ is the horizontal divergence operator, Ps is the sur- face pressure, q is the specific humidity, v is the horizontal velocity vector of the air, and g is the gravitational acceler- ation.
As discussed by Peixoto ['1973], the condensed-phase water content Wc is typically two orders of magnitude smaller than the water vapor content W; its time tendency is similarly small. The divergence of the condensed-phase flux can be of the same order of magnitude as the divergence of the water vapor flux, but only in regions of persistent cloud formation or cloud destruction. This may be the case over coastal up- welling regions, for example. However, by averaging in space and time, the contributions of the condensed-phase terms should be much reduced and can therefore be neglected in the present study. Thus we may write (1) after averaging in time and integrating over space in the form
(c•-•-/+ (V. Q)= (E-P) (4) The spatial integral is given by
(())= ( )a 2 cos •p d). &p (5) I 1
and the time average by an overbar
-- 1 f,2( ) dt (6) ( ) -- t 2 -- t• at, where 2 is longitude and 4> latitude. The regional distributions of evaporation minus precipitation are evaluated by com- puting the terms on the left side of (4). This equation can be rewritten after applying Gauss' theorem to the second term in the form
• + Q.ndl=(E-P) (7) where F is the boundary of the region, n is the outward unit normal vector, and dl is the element of length along the boundary. We will use the form (4) in this study. Previous studies of regional water balances have tended to use the form (7) of the balance equation. We will briefly discuss the relative merits of these approaches in section 5.
3. DATA AND ANALYSIS
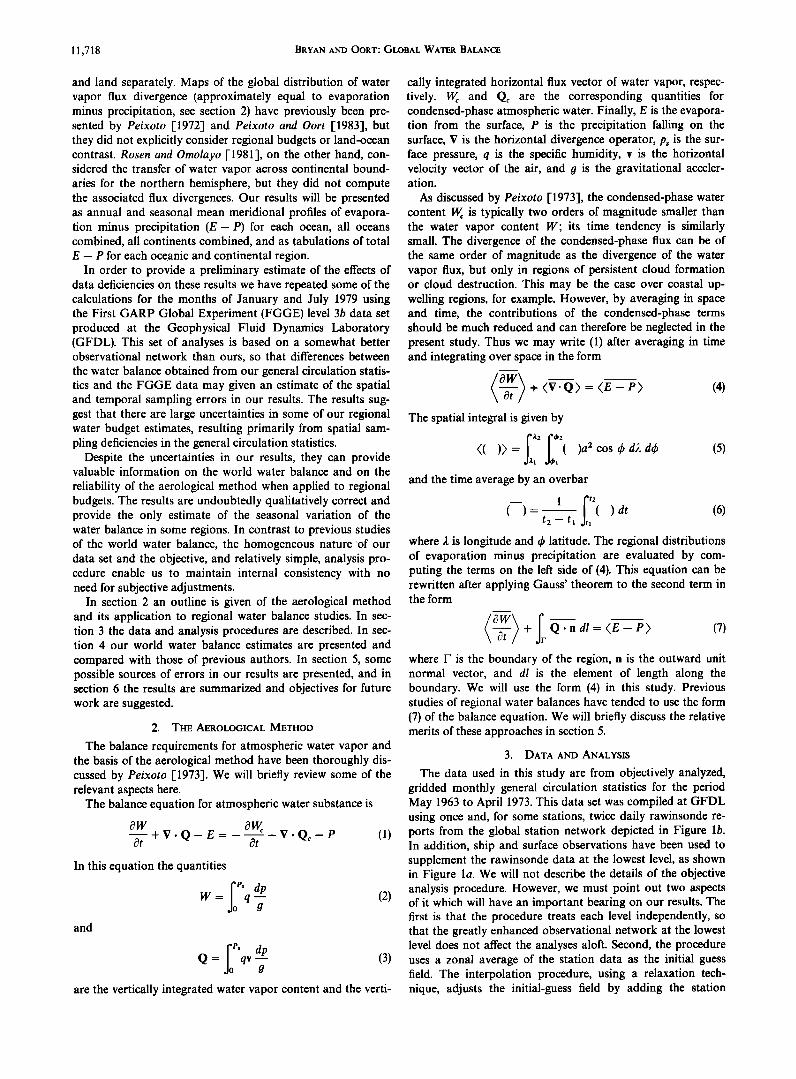
The data used in this study are from objectively analyzed, gridded monthly general circulation statistics for the period May 1963 to April 1973. This data set was compiled at GFDL using once and, for some stations, twice daily rawinsonde re- ports from the global station network depicted in Figure lb. In addition, ship and surface observations have been used to supplement the rawinsonde data at the lowest level, as shown in Figure la. We will not describe the details of the objective analysis procedure. However, we must point out two aspects of it which will have an important bearing on our results. The first is that the procedure treats each level independently, so that the greatly enhanced observational network at the lowest level does not affect the analyses aloft. Second, the procedure uses a zonal average of the station data as the initial guess field. The interpolation procedure, using a relaxation tech- nique, adjusts the initial-guess field by adding the station
BRYAN AND OORT' GLOBAL WATER BALANCE 11,719
90Nl ' ' ' ' ' I ' ' ' ' ' I ' ' ' ' ' I ' ' ' ' ' ' ' ' I
60N
30N
EQ
30S
60S
7 3 •
1
AAAAAAAA
7 6 7 3 6 5 7 6 8 • 5 1 7
180 120W 60W 0 60E 120E 180
90N
60N
30N
EQ
30S
60S
90S 180 120W 60W 0 60E 120E 180
Fig. 1. (a) Distribution of surface data used in the mean January analyses and number of years of observations available, ranging from 1 to 10 (- A). Data over land are from rawinsonde stations (1000 mbar), and data over ocean are from 2 ø x 2 ø averaged surface ship reports (only plotted for every 5 ø of longitude). (b) Distribution of rawinsonde data used in the mean January analyses of all levels above the earth's surface and the number of years of observations available, ranging from 1 to 10 (= A). The total number of stations over the globe for January was 1093.
anomalies. After several iterations a gridded final field is pro- duced which still contains some zonally symmetric features due to the choice of the initial guess. The data set and the analysis procedurees have been described extensively by Oort [1983]. Peixoto and Oort [1983] have given a thorough dis-
cussion of the subset of these data, which describes the atmo- spheric branch of the hydrologic cycle.
The monthly means, variances, and covariances of the spe- cific humidity and horizontal components of the velocity were available at the 1000, 950, 900, 850, 700, 500, 400, and 300
11,720 BRYAN AND OORT' GLOBAL WATER BALANCE
90N
60
30
0
30
60
90S 180W 120 60 0 60 120 180E
90N
•' . ::::i.",•:•ii!iii!iii::' ' ' 60 i!::•i+ .......... .:•::•::'::: . ......
3O
o
30
•o ::. ........................................................... •::::::iiiiiiiiiiiiiii:: .:•
180W 120 60 0 60 120 180E
90N
60
30
0
30
60
90S 180W 120 60 0 60 120 180E
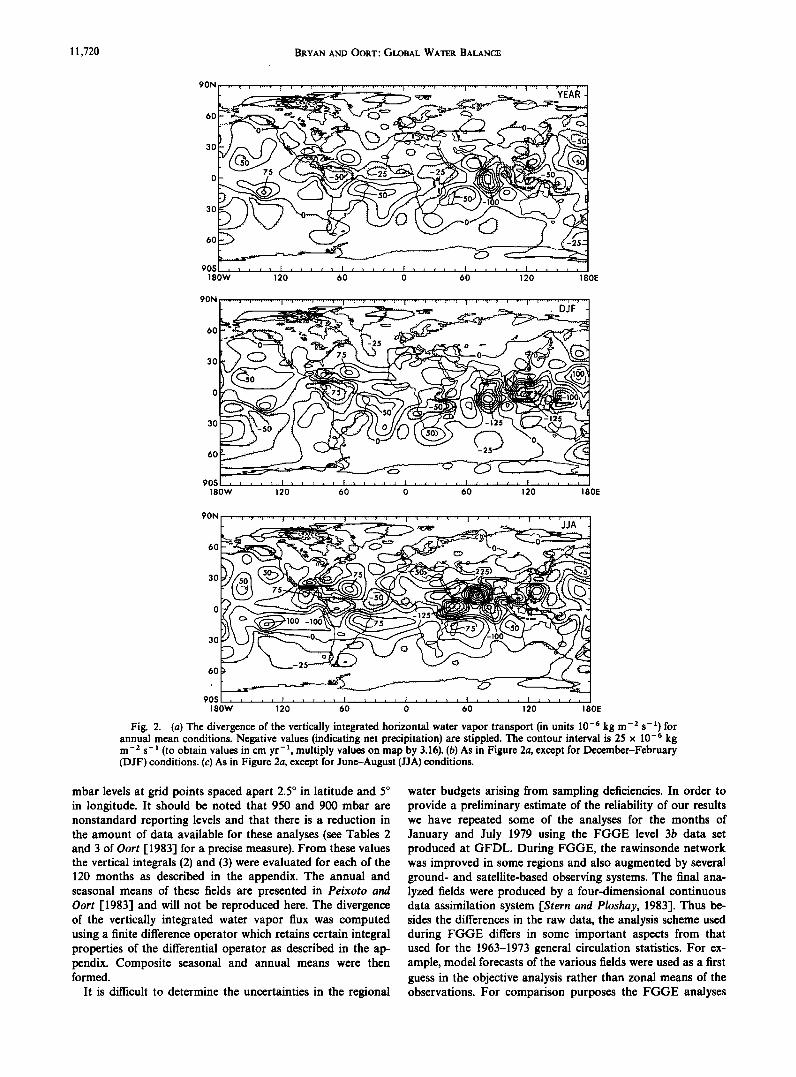
Fig. 2. (a) The divergence of the vertically integrated horizontal water vapor transport (in units 10 -6 kg m-: s -x) for annual mean conditions. Negative values (indicating net precipitation) are stippled. The contour interval is 25 x 10 -6 kg m -2 s-• (to obtain values in cm yr-2, multiply values on map by 3.16). (b) As in Figure 2a, except for December-February (DJF) conditions. (c) As in Figure 2a, except for June-August (JJA) conditions.
mbar levels at grid points spaced apart 2.5 ø in latitude and 5 ø in longitude. It should be noted that 950 and 900 mbar are nonstandard reporting levels and that there is a reduction in the amount of data available for these analyses (see Tables 2 and 3 of Oort [1983] for a precise measure). From these values the vertical integrals (2) and (3) were evaluated for each of the 120 months as described in the appendix. The annual and seasonal means of these fields are presented in Peixoto and Oort [1983] and will not be reproduced here. The divergence of the vertically integrated water vapor flux was computed using a finite difference operator which retains certain integral properties of the differential operator as described in the apo pendix. Composite seasonal and annual means were then formed.
It is difficult to determine the uncertainties in the regional
water budgets arising from sampling deficiencies. In order to provide a preliminary estimate of the reliability of our results we have repeated some of the analyses for the months of January and July 1979 using the FGGE level 3b data set produced at GFDL. During FGGE, the rawinsonde network was improved in some regions and also augmented by several ground- and satellite-based observing systems. The final ana- lyzed fields were produced by a four-dimensional continuous data assimilation system [Stern and Ploshay, 1983]. Thus be- sides the differences in the raw data, the analysis scheme used during FGGE differs in some important aspects from that used for the 1963-1973 general circulation statistics. For ex- ample, model forecasts of the various fields were used as a first guess in the objective analysis rather than zonal means of the observations. For comparison purposes the FGGE analyses
BRYAN AND OORT' GLOBAL WATER BALANCE 11,721
9øNI ' ' ' ' ' ' ' ' ' ' ' 60 ":!i• ...... :::::::::::::::::::::::::::::::::::::::::::::::: ..... ::i::11•::111::i!!i!::i::i::!::!i!i•::•i!::11•iiii:?:i•i' '111' 'i ............. ::::: :.
': i!E!i!•iH•H•!•H!•i!!ii!ii• ::!:i:i:i:i:i:i:i:!:i:i:i:i:i:i:!:!:i:!:i:!t::.. ::::: ::::: ::::: . ::::
•:•:::•:•:•• • ..... •:•:•:•:•:•:•:•:•:•:•:•:•:•:•:•:•:•' ................... i!J [•3 ß :.:::.:..: ............ :::::::::::::::::::::::::::::::::::::::::::::::::::::::::::::: ....................
ß "•iliHi!i !i ii•iill ::::::::::::::::::::: :i:!:i:i:i:i:i:i:i:} ................... 30 - ii•!:::::' •!•i!•!!:::::::::•::•::•i• i ................ ::•• .... ::•:• ••!•:•:•:•:,:: ....:
::: : ................... ::: ::: ' Anta'rctic• : :: 180 150W 120 90 60 30 0 30 60 90 120 150E 180
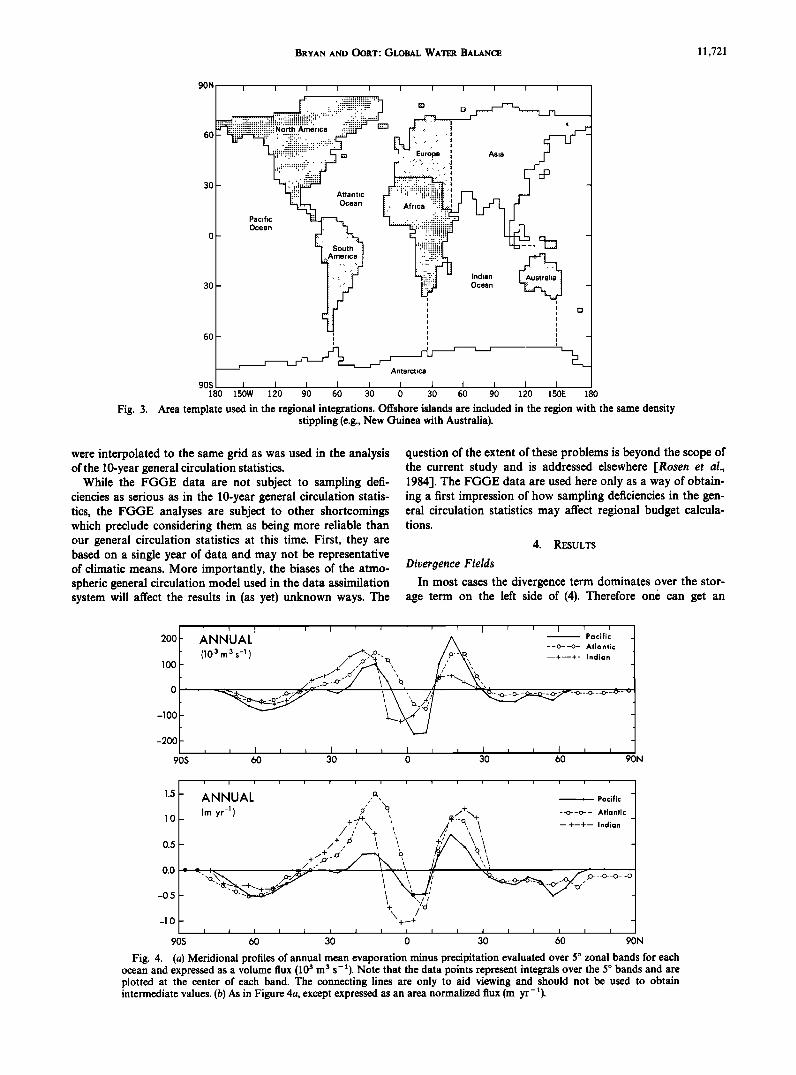
Fig. 3. Area template used in the regional integrations. Offshore islands are included in the region with the same density stippling (e.g., New Guinea with Australia).
were interpolated to the same grid as was used in the analysis of the 10-year general circulation statistics.
While the F66E data are not subject to sampling defi- ciencies as serious as in the 10-year general circulation statis- tics, the FGGE analyses are subject to other shortcomings which preclude considering them as being more reliable than our general circulation statistics at this time. First, they are based on a single year of data and may not be representative of climatic means. More importantly, the biases of the atmo- spheric general circulation model used in the data assimilation system will affect the results in (as yet) unknown ways. The
question of the extent of these problems is beyond the scope of the current study and is addressed elsewhere [Rosen et al., 1984]. The FGGE data are used here only as a way of obtain- ing a first impression of how sampling deficiencies in the gen- eral circulation statistics may affect regional budget calcula- tions.
4. RESULTS
Divergence Fields
In most cases the divergence term dominates over the stor- age term on the left side of (4). Therefore one can get an
2OO
lOO
-lOO
' ' ! ' ' I ' • I ' ' I ' ' I ' •
ANNUAL /• Pacific _ --o--o- Atlantic
(103 m3 s -' ) ,+./+•.'•.-..q /, '•
-2OO I , $ I • • I I I I I I I • I I I I
90S 60 30 0 30 60 90N
1.5
1.0
0.5
0.0
-0.5
-1.0
'i ' i i i i ' i i i ] i i i [ i i i [
- ANNUAL •' : : Pacific - ,,' x x
(m yr-') +'•'•-X • •'/'+•+ --o--o-- Atlantic - • • "ø' x • -- +--+-- Indian - / /" + ', +,//•\ +,6 • ,, x, •
.. ',, //
-'•,.•o•+• ', - • '•,' _
_
, I , , I ; I i I I I ;0 I I I I I 90S 60 3 0 60 90N
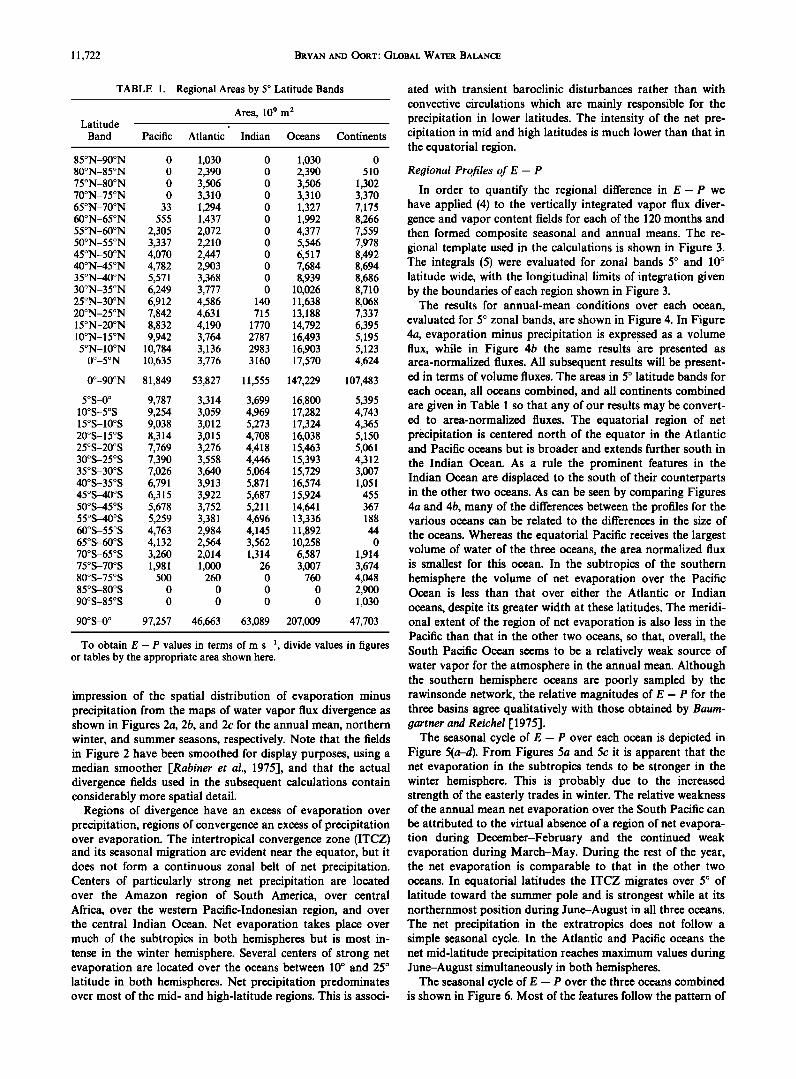
Fig. 4. (a) Meridional profiles of annual mean evaporation minus precipitation evaluated over 5 ø zonal bands for each ocean and expressed as a volume flux (10 a m a s-•). Note that the data points represent integrals over the 5 ø bands and are plotted at the center of each band. The connecting lines are only to aid viewing and should not be used to obtain intermediate values. (b) As in Figure 4a, except expressed as an area normalized flux (m yr-•).
11,722 BRYAN AND OORT: GLOBAL WATER BALANCE
TABLE 1. Regional Areas by 5 ø Latitude Bands
Latitude Area, 10 9 m 2
Band Pacific Atlantic Indian Oceans Continents
85øN-90øN 0 1,030 0 1,030 0 80øN-85øN 0 2,390 0 2,390 510 75øN-80øN 0 3,506 0 3,506 1,302 70øN-75øN 0 3,310 0 3,310 3,370 65øN-70øN 33 1,294 0 1,327 7,175 60øN-65øN 555 1,437 0 1,992 8,266 55øN-60øN 2,305 2,072 0 4,377 7,559 50øN-55øN 3,337 2,210 0 5,546 7,978 45øN-50øN 4,070 2,447 0 6,517 8,492 40øN-45øN 4,782 2,903 0 7,684 8,694 35øN-40øN 5,571 3,368 0 8,939 8,686 30øN-35øN 6,249 3,777 0 10,026 8,710 25øN-30øN 6,912 4,586 140 11,638 8,068 20øN-25øN 7,842 4,631 715 13,188 7,337 15øN-20øN 8,832 4,190 1770 14,792 6,395 10øN-15øN 9,942 3,764 2787 16,493 5,195 5øN-10øN 10,784 3,136 2983 16,903 5,123
0ø-5øN 10,635 3,776 3160 17,570 4,624
0ø-90øN 81,849 53,827 11,555 147,229 107,483
5øS-0 ø 9,787 3,314 3,699 16,800 5,395 10øS-5øS 9,254 3,059 4,969 17,282 4,743 15øS-10øS 9,038 3,012 5,273 17,324 4,365 20øS-15øS 8,314 3,015 4,708 16,038 5,150 25øS-20øS 7,769 3,276 4,418 15,463 5,061 30øS-25øS 7,390 3,558 4,446 15,393 4,312 35øS-30øS 7,026 3,640 5,064 15,729 3,007 40øS-35øS 6,791 3,913 5,871 16,574 1,051 45øS40øS 6,315 3,922 5,687 15,924 455 50øS-45øS 5,678 3,752 5,211 14,641 367 55øS-40øS 5,259 3,381 4,696 13,336 188 60øS-55øS 4,763 2,984 4,145 11,892 44 65øS-60øS 4,132 2,564 3,562 10,258 0 70øS-65øS 3,260 2,014 1,314 6,587 1,914 75øS-70øS 1,981 1,000 26 3,007 3,674 80øS-75øS 500 260 0 760 4,048 85øS-80øS 0 0 0 0 2,900 90øS-85øS 0 0 0 0 1,030
90øS-0 ø 97,257 46,663 63,089 207,009 47,703
To obtain E - P values in terms of m s-•, divide values in figures or tables by the appropriate area shown here.
impression of the spatial distribution of evaporation minus precipitation from the maps of water vapor flux divergence as shown in Figures 2a, 2b, and 2c for the annual mean, northern winter, and summer seasons, respectively. Note that the fields in Figure 2 have been smoothed for display purposes, using a median smoother [Rabiner et al., 1975-1, and that the actual divergence fields used in the subsequent calculations contain considerably more spatial detail.
Regions of divergence have an excess of evaporation over precipitation, regions of convergence an excess of precipitation over evaporation. The intertropical convergence zone (ITCZ) and its seasonal migration are evident near the equator, but it does not form a continuous zonal belt of net precipitation. Centers of particularly strong net precipitation are located over the Amazon region of South America, over central Africa, over the western Pacific-Indonesian region, and over the central Indian Ocean. Net evaporation takes place over much of the subtropics in both hemispheres but is most in- tense in the winter hemisphere. Several centers of strong net evaporation are located over the oceans between 10 ø and 25 ø latitude in both hemispheres. Net precipitation predominates over most of the mid- and high-latitude regions. This is associ-
ated with transient baroclinic disturbances rather than with
convective circulations which are mainly responsible for the precipitation in lower latitudes. The intensity of the net pre- cipitation in mid and high latitudes is much lower than that in the equatorial region.
Regional Profiles of E- P
In order to quantify the regional difference in E- P we have applied (4) to the vertically integrated vapor flux diver- gence and vapor content fields for each of the 120 months and then formed composite seasonal and annual means. The re- gional template used in the calculations is shown in Figure 3. The integrals (5) were evaluated for zonal bands 5 ø and 10 ø latitude wide, with the longitudinal limits of integration given by the boundaries of each region shown in Figure 3.
The results for annual-mean conditions over each ocean, evaluated for 5 ø zonal bands, are shown in Figure 4. In Figure 4a, evaporation minus precipitation is expressed as a volume flux, while in Figure 4b the same results are presented as area-normalized fluxes. All subsequent results will be present- ed in terms of volume fluxes. The areas in 5 ø latitude bands for
each ocean, all oceans combined, and all continents combined are given in Table 1 so that any of our results may be convert- ed to area-normalized fluxes. The equatorial region of net precipitation is centered north of the equator in the Atlantic and Pacific oceans but is broader and extends further south in
the Indian Ocean. As a rule the prominent features in the Indian Ocean are displaced to the south of their counterparts in the other two oceans. As can be seen by comparing Figures 4a and 4b, many of the differences between the profiles for the various oceans can be related to the differences in the size of
the oceans. Whereas the equatorial Pacific receives the largest volume of water of the three oceans, the area normalized flux is smallest for this ocean. In the subtropics of the southern hemisphere the volume of net evaporation over the Pacific Ocean is less than that over either the Atlantic or Indian
oceans, despite its greater width at these latitudes. The meridi- onal extent of the region of net evaporation is also less in the Pacific than that in the other two oceans, so that, overall, the South Pacific Ocean seems to be a relatively weak source of water vapor for the atmosphere in the annual mean. Although the southern hemisphere oceans are poorly sampled by the rawinsonde network, the relative magnitudes of E- P for the three basins agree qualitatively with those obtained by Baurn- gartner and Reichel [1975].
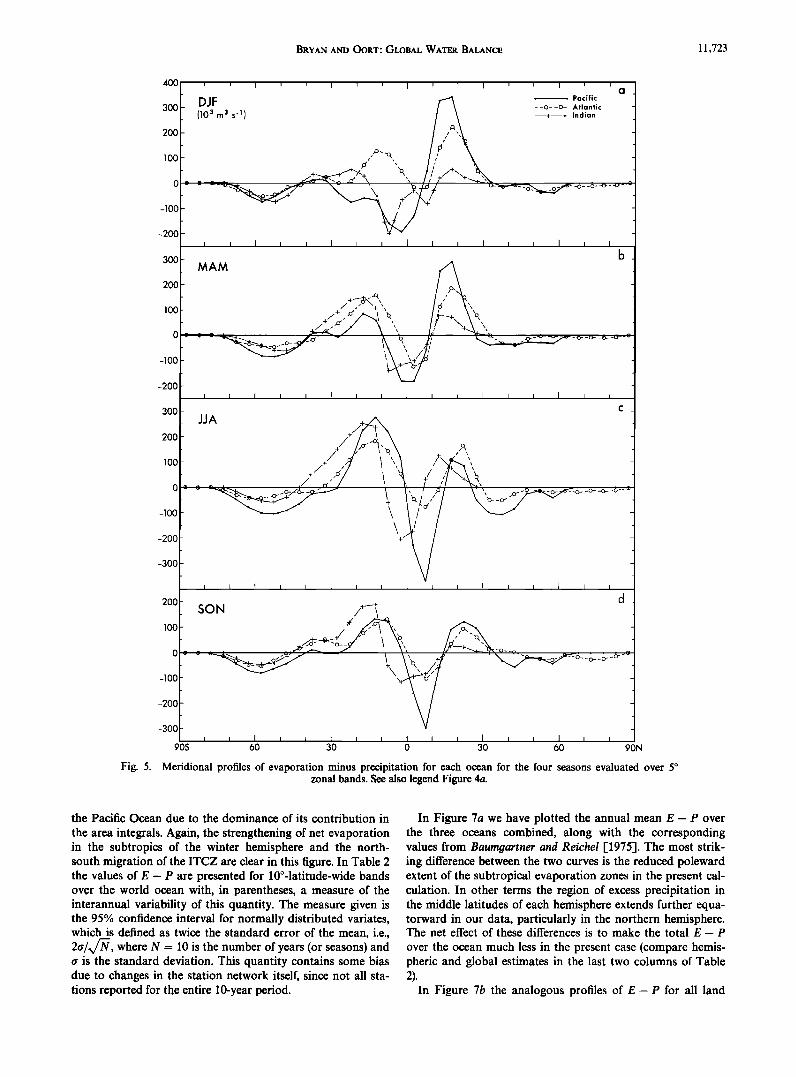
The seasonal cycle of E - P over each ocean is depicted in Figure 5(a-d). From Figures 5a and 5c it is apparent that the net evaporation in the subtropics tends to be stronger in the winter hemisphere. This is probably due to the increased strength of the easterly trades in winter. The relative weakness of the annual mean net evaporation over the South Pacific can be attributed to the virtual absence of a region of net evapora- tion during December-February and the continued weak evaporation during March-May. During the rest of the year, the net evaporation is comparable to that in the other two oceans. In equatorial latitudes the ITCZ migrates over 5 ø of latitude toward the summer pole and is strongest while at its northernmost position during June-August in all three oceans. The net precipitation in the extratropics does not follow a simple seasonal cycle. In the Atlantic and Pacific oceans the net mid-latitude precipitation reaches maximum values during June-August simultaneously in both hemispheres.
The seasonal cycle of E - P over the three oceans combined is shown in Figure 6. Most of the features follow the pattern of
BRYAN AND OORT: GLOBAL WATER BALANCE 11,723
400
300 DJF (10 3 m 3 s-1)
200
100 "ø"ø',,, / o©
-200 [ i i I I I I i i I 1 3OO
200
100
I I [ I I i a
,• ß , Pacific --o- -o- Atlantic ---+--+ Indian
+
- - -0• -0- -0- - -•'-•
-lOO
-200
b _
300
200
100
-100
-200
-300
/+' x x
d 200 SON lOO• b+z.4•z+/" '.o-• ,,• r / ....
-lOO
-200 -
-300
90S 60 30 0 30 60 90N
Fig. 5. Meridional profiles of evaporation minus precipitation for each ocean for the four seasons evaluated over 5 ø zonal bands. See also legend Figure 4a.
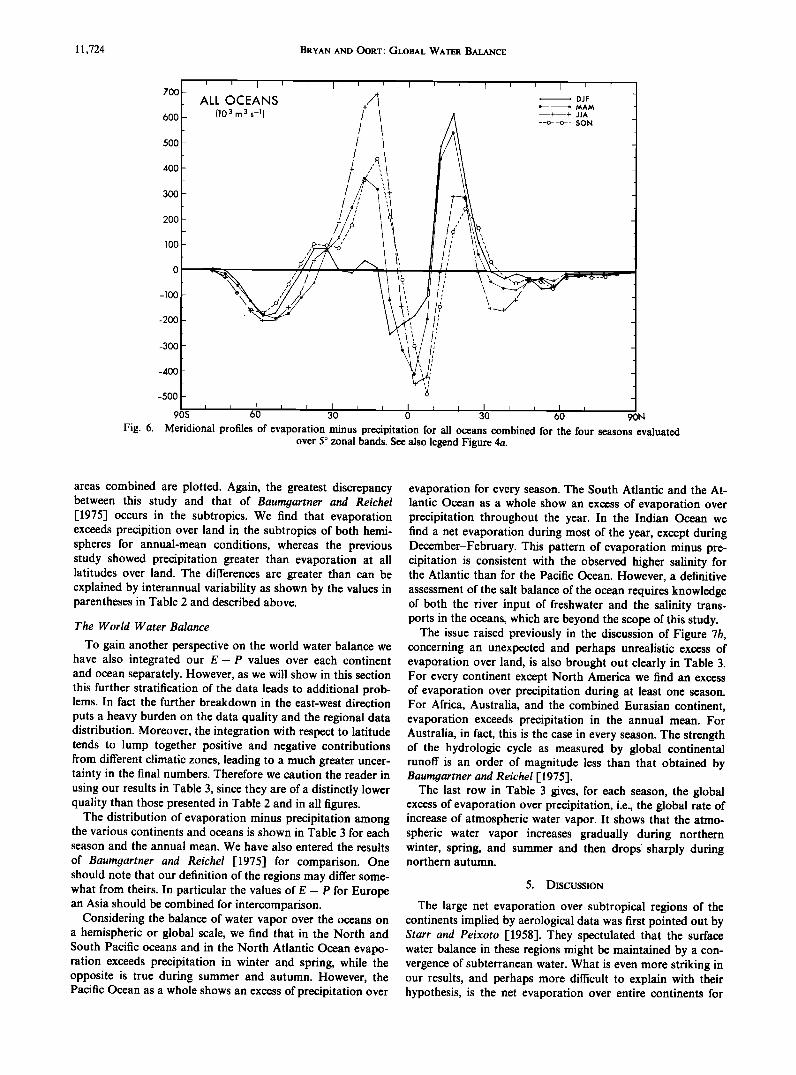
the Pacific Ocean due to the dominance of its contribution in
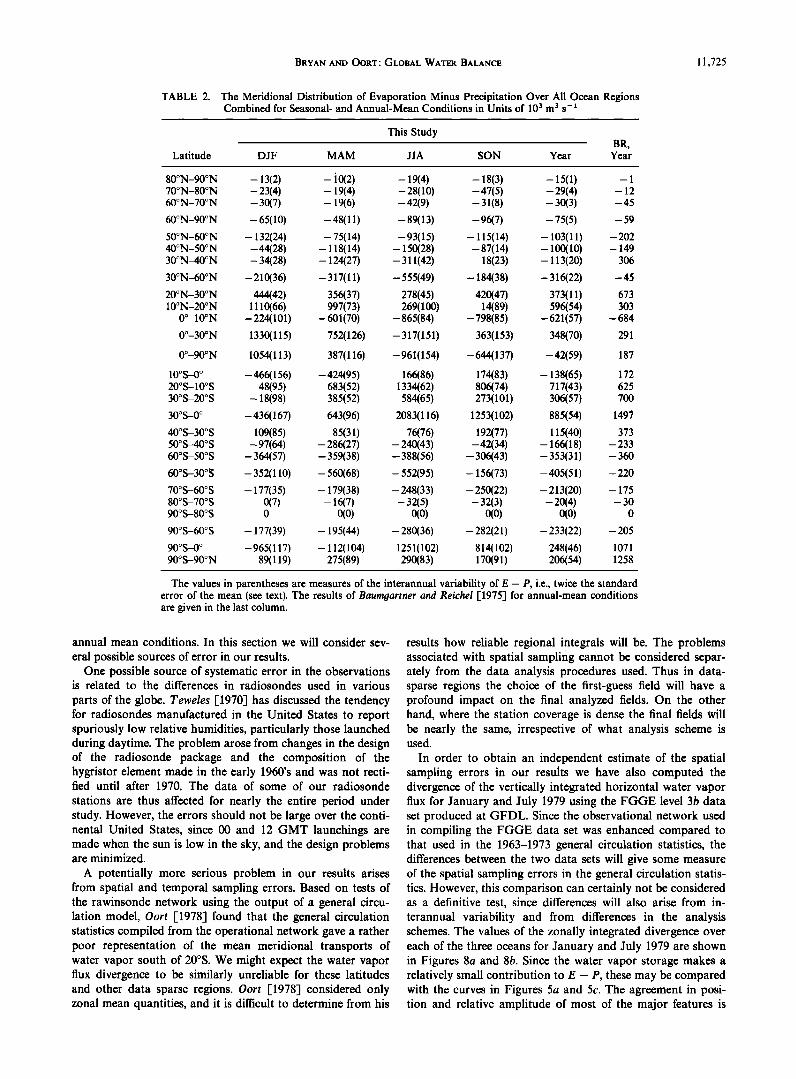
the area integrals. Again, the strengthening of net evaporation in the subtropics of the winter hemisphere and the north- south migration of the ITCZ are clear in this figure. In Table 2 the values of E- P are presented for 10ø-latitude-wide bands over the world ocean with, in parentheses, a measure of the interannual variability of this quantity. The measure given is the 95% confidence interval for normally distributed variates, which is defined as twice the standard error of the mean, i.e., 2a/x/•, where N = 10 is the number of years (or seasons) and a is the standard deviation. This quantity contains some bias due to changes in the station network itself, since not all sta- tions reported for the entire 10-year period.
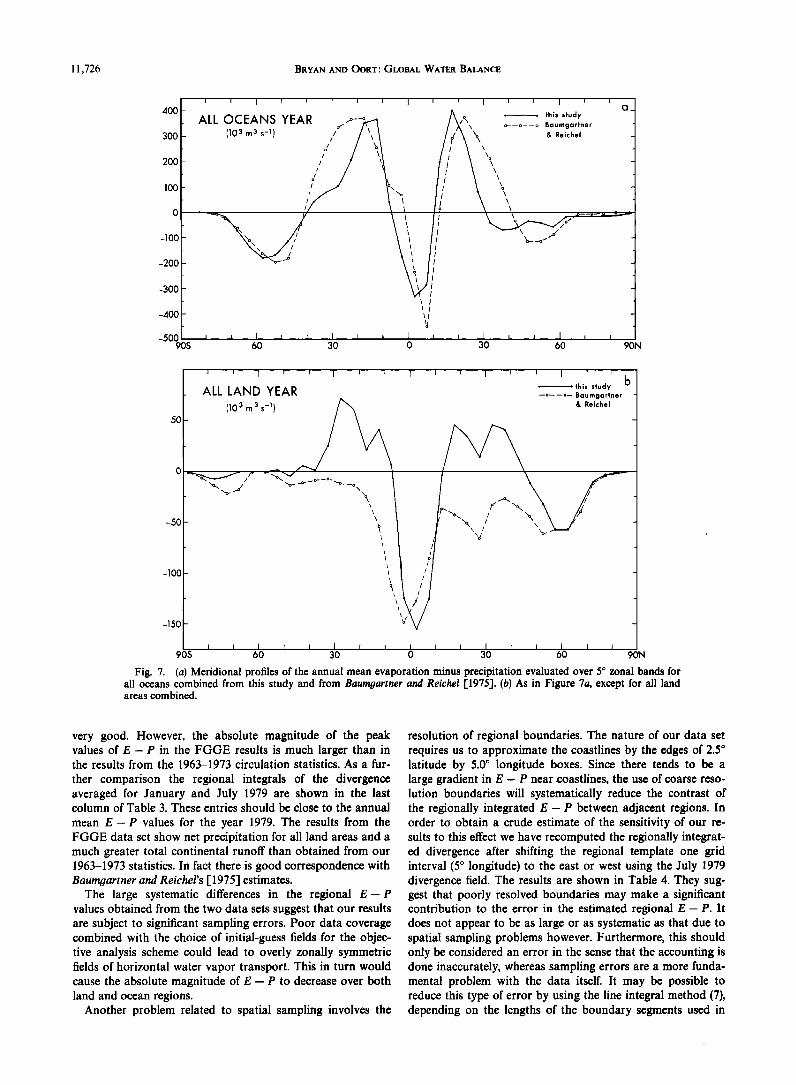
In Figure 7a we have plotted the annual mean E- P over the three oceans combined, along with the corresponding values from Baumgartner and Reichel [1975]. The most strik- ing difference between the two curves is the reduced poleward extent of the subtropical evaporation zones in the present cal- culation. In other terms the region of excess precipitation in the middle latitudes of each hemisphere extends further equa- torward in our data, particularly in the northern hemisphere. The net effect of these differences is to make the total E- P
over the ocean much less in the present case (compare hemis- pheric and global estimates in the last two columns of Table 2).
In Figure 7b the analogous profiles of E- P for all land
11,724 BRYAN AND OORT: GLOBAL WATER BALANCE
700
600
500
400
300
200
100
i I
ALL OCEANS (10 3 m 3 s-•)
ß , DJF • o MAM
+--+ JJA --o- -o-- SON
-Too * /: \
-200 ' /'
-300 -400
-500 6
90S 60 30 0 30 60 90N Fig. 6. Meridional profiles of evaporation minus precipitation for all oceans combined for the four seasons evaluated
over 5 ø zonal bands. See also legend Figure 4a.
areas combined are plotted. Again, the greatest discrepancy between this study and that of Baurngartner and Reichel [1975] occurs in the subtropics. We find that evaporation exceeds precipition over land in the subtropics of both hemi- spheres for annual-mean conditions, whereas the previous study showed precipitation greater than evaporation at all latitudes over land. The differences are greater than can be explained by interannual variability as shown by the values in parentheses in Table 2 and described above.
The World Water Balance
To gain another perspective on the world water balance we have also integrated our E- P values over each continent and ocean separately. However, as we will show in this section this further stratification of the data leads to additional prob- lems. In fact the further breakdown in the east-west direction puts a heavy burden on the data quality and the regional data distribution. Moreover, the integration with respect to latitude tends to lump together positive and negative contributions from different climatic zones, leading to a much greater uncer- tainty in the final numbers. Therefore we caution the reader in using our results in Table 3, since they are of a distinctly lower quality than those presented in Table 2 and in all figures.
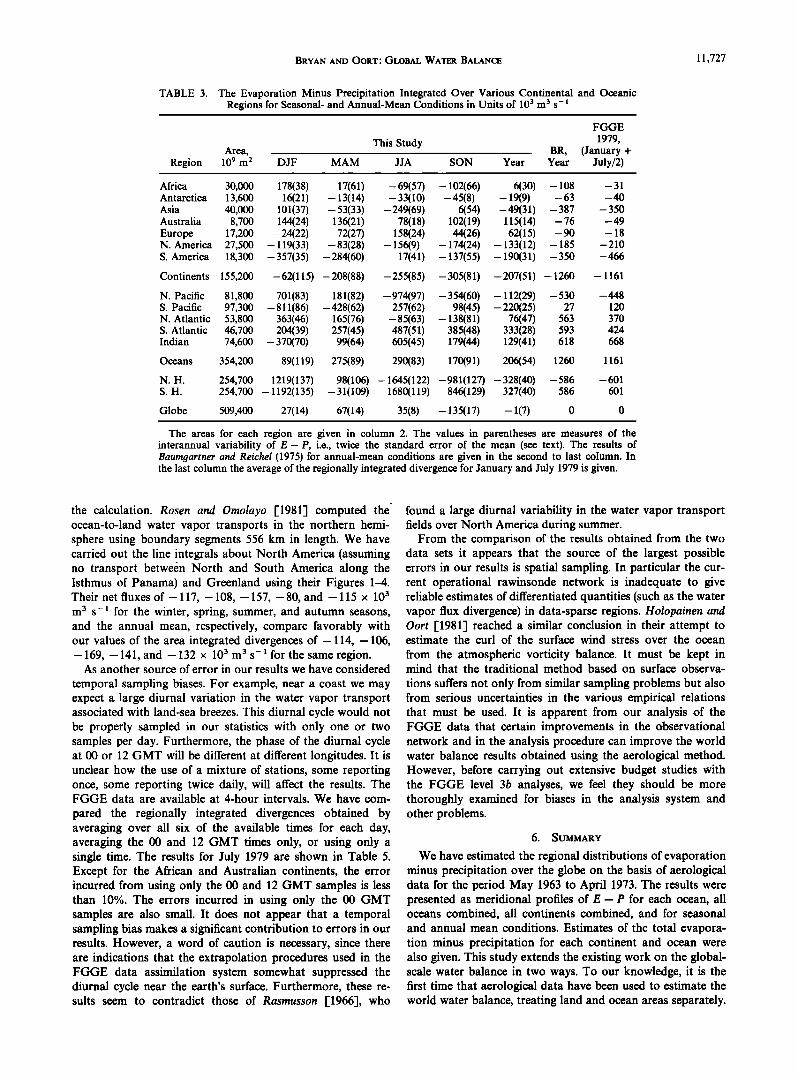
The distribution of evaporation minus precipitation among the various continents and oceans is shown in Table 3 for each season and the annual mean. We have also entered the results
of Baurngartner and Reichel [1975] for comparison. One should note that our definition of the regions may differ some- what from theirs. In particular the values of E - P for Europe an Asia should be combined for intercomparison.
Considering the balance of water vapor over the oceans on a hemispheric or global scale, we find that in the North and South Pacific oceans and in the North Atlantic Ocean evapo- ration exceeds precipitation in winter and spring, while the opposite is true during summer and autumn. However, the Pacific Ocean as a whole shows an excess of precipitation over
evaporation for every season. The South Atlantic and the At- lantic Ocean as a whole show an excess of evaporation over precipitation throughout the year. In the Indian Ocean we find a net evaporation during most of the year, except during December-February. This pattern of evaporation minus pre- cipitation is consistent with the observed higher salinity for the Atlantic than for the Pacific Ocean. However, a definitive assessment of the salt balance of the ocean requires knowledge of both the river input of freshwater and the salinity trans- ports in the oceans, which are beyond the scope of this study.
The issue raised previously in the discussion of Figure 7b, concerning an unexpected and perhaps unrealistic excess of evaporation over land, is also brought out clearly in Table 3. For every continent except North America we find an excess of evaporation over precipitation during at least one season. For Africa, Australia, and the combined Eurasian continent, evaporation exceeds precipitation in the annual mean. For Australia, in fact, this is the case in every season. The strength of the hydrologic cycle as measured by global continental runoff is an order of magnitude less than that obtained by Baurngartner and Reichel [1975].
The last row in Table 3 gives, for each season, the global excess of evaporation over precipitation, i.e., the global rate of increase of atmospheric water vapor. It shows that the atmo- spheric water vapor increases gradually during northern winter, spring, and summer and then drops' sharply during northern autumn.
5. DISCUSSION
The large net evaporation over subtropical regions of the continents implied by aerological data was first pointed out by Starr and Peixoto [1958]. They spectulated that the surface water balance in these regions might be maintained by a con- vergence of subterranean water. What is even more striking in our results, and perhaps more difficult to explain with their hypothesis, is the net evaporation over entire continents for
BRYAN AND OORT: GLOBAL WATER BALANCE 11,725
TABLE 2. The Meridional Distribution of Evaporation Minus Precipitation Over All Ocean Regions Combined for Seasonal- and Annual-Mean Conditions in Units of 10 3 m 3 s-l
This Study ' BR,
Latitude DJF MAM JJA SON Year Year
80øN-90øN - 13(2) - 10(2) - 19(4) - 18(3) - 15(1) - 1 70øN-80øN -23(4) - 19(4) -28(10) -47(5) -29(4) - 12 60øN-70øN - 30(7) - 19(6) -42(9) - 31(8) - 30(3) -45
60øN-90øN -65(10) -48(11) -89(13) -96(7) -75(5) -59
50øN-60øN - 132(24) -75(14) -93(15) - 115(14) - 103(11) -202 40øN-50øN -44(28) - 118(14) - 150(28) -87(14) - 100(10) - 149 30øN-40øN -34(28) - 124(27) -311(42) 18(23) - 113(20) 306
30øN-60øN -210(36) -317(11) -555(49) - 184(38) -316(22) -45
20øN-30øN 444(42) 356(37) 278(45) 420(47) 373(11) 673 10øN-20øN 1110(66) 997(73) 269(100) 14(89) 596(54) 303
0ø-10øN -224(101) -601(70) -865(84) -798(85) -621(57) -684
0ø-30øN 1330(115) 752(126) -317(151) 363(153) 348(70) 291
0ø-90øN 1054(113) 387(116) -961(154) -644(137) -42(59) 187
10øS-0 ø -466(156) -424(95) 166(86) 174(83) - 138(65) 172 20øS-10øS 48(95) 683(52) 1334(62) 806(74) 717(43) 625 30øS-20øS - 18(98) 385(52) 584(65) 273(101) 306(57) 700
30øS-0 ø -436(167) 643(96) 2083(116) 1253(102) 885(54) 1497
40øS-30øS 109(85) 85(31) 76(76) 192(77) 115(40) 373 50øS-40øS -97(64) -286(27) -240(43) -42(34) - 166(18) -233 60øS-50øS -364(57) -359(38) -388(56) -306(43) -353(31) -360
60øS-30øS -352(110) -560(68) -552(95) -156(73) -405(51) -220
70øS-60øS - 177(35) - 179(38) -248(33) -250(22) -213(20) - 175 80øS-70øS 0(7) - 16(7) -32(5) -32(3) -20(4) -30 90øS-80øS 0 0(0) 0(0) 0(0) 0(0) 0
90øS-60øS - 177(39) - 195(44) -280(36) -282(21) -233(22) -205
90øS-0 ø -965(117) - 112(104) 1251(102) 814(102) 248(46) 1071 90øS-90øN 89(119) 275(89) 290(83) 170(91) 206(54) 1258
The values in parentheses are measures of the interannual variability of E - P, i.e., twice the standard error of the mean (see text). The results of Baumgartner and Reichel [1975] for annual-mean conditions are given in the last column.
annual mean conditions. In this section we will consider sev-
eral possible sources of error in our results. One possible source of systematic error in the observations
is related to the differences in radiosondes used in various
parts of the globe. Teweles [1970] has discussed the tendency for radiosondes manufactured in the United States to report spuriously low relative humidities, particularly those launched during daytime. The problem arose from changes in the design of the radiosonde package and the composition of the hygristor element made in the early 1960's and was not recti- fied until after 1970. The data of some of our radiosonde
stations are thus affected for nearly the entire period under study. However, the errors should not be large over the conti- nental United States, since 00 and 12 GMT launchings are made when the sun is low in the sky, and the design problems are minimized.
A potentially more serious problem in our results arises from spatial and temporal sampling errors. Based on tests of the rawinsonde network using the output of a general circu- lation model, Oort [1978] found that the general circulation statistics compiled from the operational network gave a rather poor representation of the mean meridional transports of water vapor south of 20øS. We might expect the water vapor flux divergence to be similarly unreliable for these latitudes and other data sparse regions. Oort [1978] considered only zonal mean quantities, and it is difficult to determine from his
results how reliable regional integrals will be. The problems associated with spatial sampling cannot be considered separ- ately from the data analysis procedures used. Thus in data- sparse regions the choice of the first-guess field will have a profound impact on the final analyzed fields. On the other hand, where the station coverage is dense the final fields will be nearly the same, irrespective of what analysis scheme is used.
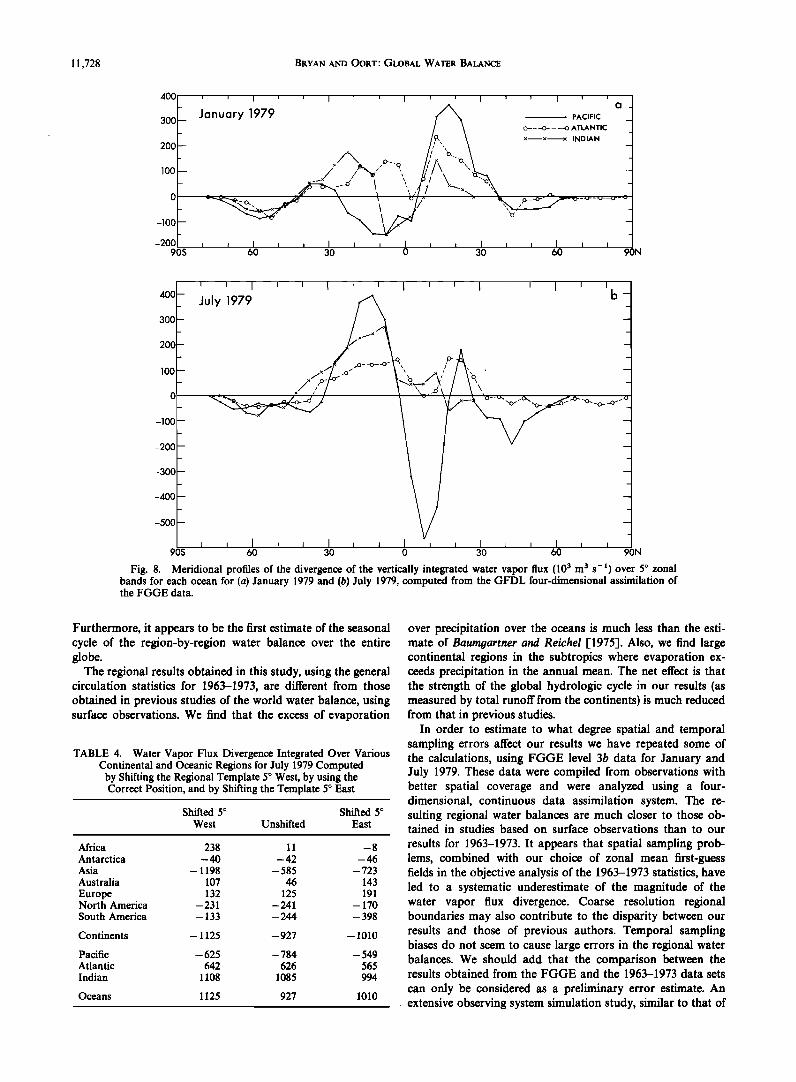
In order to obtain an independent estimate of the spatial sampling errors in our results we have also computed the divergence of the vertically integrated horizontal water vapor flux for January and July 1979 using the FGGE level 3b data set produced at GFDL. Since the observational network used in compiling the FGGE data set was enhanced compared to that used in the 1963-1973 general circulation statistics, the differences between the two data sets will give some measure of the spatial sampling errors in the general circulation statis- tics. However, this comparison can certainly not be considered as a definitive test, since differences will also arise from in- terannual variability and from differences in the analysis schemes. The values of the zonally integrated divergence over each of the three oceans for January and July 1979 are shown in Figures 8a and 8b. Since the water vapor storage makes a relatively small contribution to E - P, these may be compared with the curves in Figures 5a and 5c. The agreement in posi- tion and relative amplitude of most of the major features is
11,726 BRYAN AND OORT: GLOBAL WATER BALANCE
400
300
200
lOO
-lOO -
-200
-300
-400
-500 9os
ALL OCEANS YEAR (10 3 m 3 s -t) /ø" / \,
//ø/ / '•• __ ,,;/
• /
• /
I I I • ,• I L • I I
CI_ o , - this study \\ o---o---o Baumgartner
\\•\\ & Reichel
30 60 90N
ß ß this study ALL LAND YEAR ...... Boum9ortner
& Reichel
50
_
',, / 1/--o.. / -... \ / _ -50 'xy/
/
-150
90S 60 30 0 30 60 90N
Fig. 7. (a) Meridional profiles of the annual mean evaporation minus precipitation evaluated over 5 ø zonal bands for all oceans combined from this study and from Baurngartner and Reichel [1975]. (b) As in Figure 7a, except for all land areas combined.
very good. However, the absolute magnitude of the peak values of E- P in the FGGE results is much larger than in the results from the 1963-1973 circulation statistics. As a fur-
ther comparison the regional integrals of the divergence averaged for January and July 1979 are shown in the last column of Table 3. These entries should be close to the annual
mean E- P values for the year 1979. The results from the FGGE data set show net precipitation for all land areas and a much greater total continental runoff than obtained from our 1963-1973 statistics. In fact there is good correspondence with Baurngartner and Reichel's [1975] estimates.
The large systematic differences in the regional E- P values obtained from the two data sets suggest that our results are subject to significant sampling errors. Poor data coverage combined with the choice of initial-guess fields for the objec- tive analysis scheme could lead to overly zonally symmetric fields of horizontal water vapor transport. This in turn would cause the absolute magnitude of E - P to decrease over both land and ocean regions.
Another problem related to spatial sampling involves the
resolution of regional boundaries. The nature of our data set requires us to approximate the coastlines by the edges of 2.5 ø latitude by 5.0 ø longitude boxes. Since there tends to be a large gradient in E - P near coastlines, the use of coarse reso- lution boundaries will systematically reduce the contrast of the regionally integrated E- P between adjacent regions. In order to obtain a crude estimate of the sensitivity of our re- sults to this effect we have recomputed the regionally integrat- ed divergence after shifting the regional template one grid interval (5 ø longitude) to the east or west using the July 1979 divergence field. The results are shown in Table 4. They sug- gest that poorly resolved boundaries may make a significant contribution to the error in the estimated regional E- P. It does not appear to be as large or as systematic as that due to spatial sampling problems however. Furthermore, this should only be considered an error in the sense that the accounting is done inaccurately, whereas sampling errors are a more funda- mental problem with the data itself. It may be possible to reduce this type of error by using the line integral method (7), depending on the lengths of the boundary segments used in
BRYAN AND OORT: GLOBAL WATER BALANCE 11,727
TABLE 3. The Evaporation Minus Precipitation Integrated Over Various Continental and Oceanic Regions for Seasonal- and Annual-Mean Conditions in Units of 10 3 m 3 s-1
This Study Area, BR,
Region 10 9 m e DJF MAM JJA SON Year Year
FGGE
1979, (January +
July/2)
Africa 30,000 178(38) 17(61) -69(57) - 102(66) 6(30) - 108 -31 Antarctica 13,600 16(21) - 13(14) -33(10) -45(8) - 19(9) -63 -40 Asia 40,000 101(37) -53(33) -249(69) 6(54) -49(31) -387 -350 Australia 8,700 144(24) 136(21) 78(18) 102(19) 115(14) -76 -49 Europe 17,200 -24(22) 72(27) 158(24) 44(26) 62(15) -90 - 18 N. America 27,500 -119(33) -83(28) -156(9) -174(24) -133(12) -185 -210 S. America 18,300 -357(35) -284(60) 17(41) -137(55) -190(31) -350 -466
Continents 155,200 -62(115) -208(88) -255(85) -305(81) -207(51) -1260 -1161
N. Pacific 81,800 701(83) 181(82) -974(97) -354(60) -112(29) -530 -448 S. Pacific 97,300 -811(86) -428(62) 257(62) 98(45) -220(25) 27 120 N. Atlantic 53,800 363(46) 165(76) -85(63) -138(81) 76(47) 563 370 S. Atlantic 46,700 204(39) 257(45) 487(51) 385(48) 333(28) 593 424 Indian 74,600 - 370(70) 99(64) 605(45) 179(44) 129(41) 618 668
Oceans 354,200 89(119) 275(89) 290(83) 170(91) 206(54) 1260 1161
N.H. 254,700 1219(137) 98(106) -1645(122) -981(127) -328(40) -586 -601 S.H. 254,700 -1192(135) -31(109) 1680(119) 846(129) 327(40) 586 601
Globe 509,400 27(14) 67(14) 35(8) - 135(17) - 1(7) 0 0
The areas for each region are given in column 2. The values in parentheses are measures of the interannual variability of E- P, i.e., twice the standard error of the mean (see text). The results of Baumgartner and Reichel (1975) for annual-mean conditions are given in the second to last column. In the last column the average of the regionally integrated divergence for January and July 1979 is given.
the calculation. Rosen and Omolayo [1981] computed the' ocean-to-land water vapor transports in the northern hemi- sphere using boundary segments 556 km in length. We have carried out the line integrals about North America (assuming no transport between North and South America along the Isthmus of Panama) and Greenland using their Figures 1-4. Their net fluxes of - 117, - 108, - 157, -80, and - 115 x 103 m 3 s-• for the winter, spring, summer, and autumn seasons, and the annual mean, respectively, compare favorably with our values of the area integrated divergences of -114, -106, - 169, - !41, and - 132 x 103 m 3 s- • for the same region.
As another source of error in our results we have considered
temporal sampling biases. For example, near a coast we may expect a large diurnal variation in the water vapor transport associated with land-sea breezes. This diurnal cycle would not be properly sampled in our statistics with only one or two samples per day. Furthermore, the phase of the diurnal cycle at 00 or 12 GMT will be different at different longitudes. It is unclear how the use of a mixture of stations, some reporting once, some reporting twice daily, will affect the results. The FGGE data are available at 4-hour intervals. We have com-
pared the regionally integrated divergences obtained by averaging over all six of the available times for each day, averaging the 00 and 12 GMT times only, or using only a single time. The results for July 1979 are shown in Table 5. Except for the African and Australian continents, the error incurred from using only the 00 and 12 GMT samples is less than 10%. The errors incurred in using only the 00 GMT samples are also small. It does not appear that a temporal sampling bias makes a significant contribution to errors in our results. However, a word of caution is necessary, since there are indications that the extrapolation procedures used in the FGGE data assimilation system somewhat suppressed the diurnal cycle near the earth's surface. Furthermore, these re- sults seem to contradict those of Rasmusson [1966], who
found a large diurnal variability in the water vapor transport fields over North America during summer.
From the comparison of the results obtained from the two data sets it appears that the source of the largest possible errors in our results is spatial sampling. In particular the cur- rent operational rawinsonde network is inadequate to give reliable estimates of differentiated quantities (such as the water vapor flux divergence) in data-sparse regions. Holopainen and Oort [1981] reached a similar conclusion in their attempt to estimate the curl of the surface wind stress over the ocean
from the atmospheric vorticity balance. It must be kept in mind that the traditional method based on surface observa-
tions suffers not only from similar sampling problems but also from serious uncertainties in the various empirical relations that must be used. It is apparent from our analysis of the FGGE data that certain improvements in the observational network and in the analysis procedure can improve the world water balance results obtained using the aerological method. However, before carrying out extensive budget studies with the FGGE level 3b analyses, we feel they should be more thoroughly examined for biases in the analysis system and other problems.
6. SUMMARY
We have estimated the regional distributions of evaporation minus precipitation over the globe on the basis of aerological data for the period May 1963 to April 1973. The results were presented as meridional profiles of E- P for each ocean, all oceans combined, all continents combined, and for seasonal and annual mean conditions. Estimates of the total evapora- tion minus precipitation for each continent and ocean were also given. This study extends the existing work on the global- scale water balance in two ways. To our knowledge, it is the first time that aerological data have been used to estimate the world water balance, treating land and ocean areas separately.
11,728 BRYAN AND OORT: GLOBAL WATER BALANCE
400
300
200
100 - _
o _
-100 -- _
-200 90S
January 1979 /'• - - PACIFIC a_ /A \ O---O----O ATLANTIC _ /,?.,.,. \ .....
/x, /i \ - / /%/ ', L,"/x, -
/ ", ,h; "% ,,_ - •--o. _•/_•' \ \ b"// • 'X,. ;,._-o-- .-.---• ...... -•
60 30 0 30 60 90N
400 T July 1979 b • 3OO
2OO
- ./..o__o_q, - 0
-100
-200
-300
-400
-500
90S 60 30 0 30 60 90N
Fig. 8. Meridional profiles of the divergence of the vertically integrated water vapor flux (103 m 3 s -•) over 5 ø zonal bands for each ocean for (a) January 1979 and (b) July 1979, computed from the GFDL four-dimensional assimilation of the F6GE data.
Furthermore, it appears to be the first estimate of the seasonal cycle of the region-by-region water balance over the entire globe.
The regional results obtained in this study, using the general circulation statistics for 1963-1973, are different from those obtained in previous studies of the world water balance, using surface observations. We find that the excess of evaporation
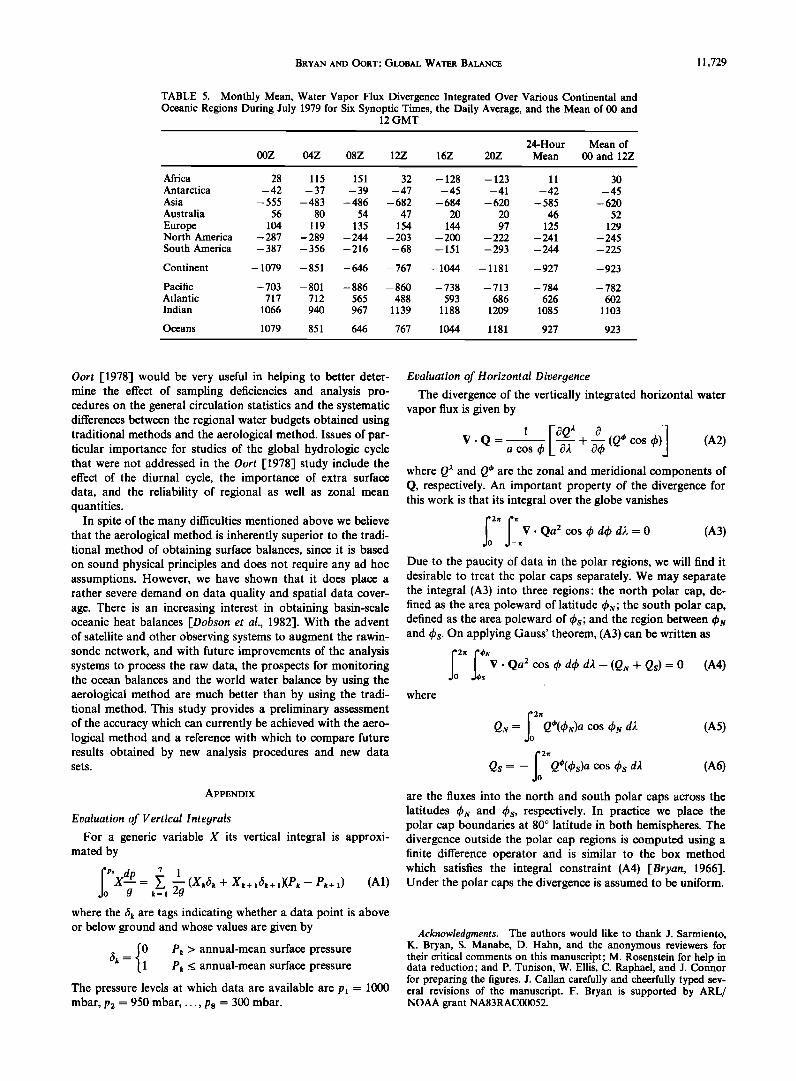
TABLE 4. Water Vapor Flux Divergence Integrated Over Various Continental and Oceanic Regions for July 1979 Computed by Shifting the Regional Template 5 ø West, by using the Correct Position, and by Shifting the Template 5 ø East
Shifted 5 ø Shifted 5 ø West Unshifted East
Africa 238 11 - 8 Antarctica - 40 - 42 - 46 Asia - 1198 - 585 - 723 Australia 107 46 143
Europe 132 125 191 North America - 231 - 241 - 170 South America - 133 - 244 - 398
Continents - 1125 -927 - 1010
Pacific -625 - 784 - 549 Atlantic 642 626 565 Indian 1108 1085 994
Oceans 1125 927 1010
over precipitation over the oceans is much less than the esti- mate of Baumgartner and Reichel [1975]. Also, we find large continental regions in the subtropics where evaporation ex- ceeds precipitation in the annual mean. The net effect is that the strength of the global hydrologic cycle in our results (as measured by total runoff from the continents) is much reduced from that in previous studies.
In order to estimate to what degree spatial and temporal sampling errors affect our results we have repeated some of the calculations, using F66E level 3b data for January and July 1979. These data were compiled from observations with better spatial coverage and were analyzed using a four- dimensional, continuous data assimilation system. The re- suiting regional water balances are much closer to those ob- tained in studies based on surface observations than to our
results for 1963-1973. It appears that spatial sampling prob- lems, combined with our choice of zonal mean first-guess fields in the objective analysis of the 1963-1973 statistics, have led to a systematic underestimate of the magnitude of the water vapor flux divergence. Coarse resolution regional boundaries may also contribute to the disparity between our results and those of previous authors. Temporal sampling biases do not seem to cause large errors in the regional water balances. We should add that the comparison between the results obtained from the FGGE and the 1963-1973 data sets
can only be considered as a preliminary error estimate. An extensive observing system simulation study, similar to that of
BRYAN AND OORT: GLOBAL WATER BALANCE 11,729
TABLE 5. Monthly Mean, Water Vapor Flux Divergence Integrated Over Various Continental and Oceanic Regions During July 1979 for Six Synoptic Times, the Daily Average, and the Mean of 00 and
12 GMT
24-Hour Mean of 00Z 04Z 08Z 12Z 16Z 20Z Mean 00 and 12Z
Africa 28 115 151 32 - 128 - 123 11 30 Antarctica -42 -37 -39 -47 -45 -41 -42 -45 Asia - 555 -483 -486 -682 -684 -620 - 585 -620 Australia 56 80 54 47 20 20 46 52 Europe 104 119 135 154 144 97 125 129 North America - 287 - 289 - 244 - 203 - 200 - 222 - 241 - 245 South America -387 -356 -216 -68 - 151 -293 -244 -225
Continent - 1079 -851 -646 -767 - 1044 - 1181 -927 -923
Pacific -703 -801 -886 -860 -738 -713 -784 -782 Atlantic 717 712 565 488 593 686 626 602 Indian 1066 940 967 1139 1188 1209 1085 1103
Oceans 1079 851 646 767 1044 1181 927 923
Oort [1978] would be very useful in helping to better deter- mine the effect of sampling deficiencies and analysis pro- cedures on the general circulation statistics and the systematic differences between the regional water budgets obtained using traditional methods and the aerological method. Issues of par- ticular importance for studies of the global hydrologic cycle that were not addressed in the Oort [1978] study include the effect of the diurnal cycle, the importance of extra surface data, and the reliability of regional as well as zonal mean quantities.
In spite of the many difficulties mentioned above we believe that the aerological method is inherently superior to the tradi- tional method of obtaining surface balances, since it is based on sound physical principles and does not require any ad hoc assumptions. However, we have shown that it does place a rather severe demand on data quality and spatial data cover- age. There is an increasing interest in obtaining basin-scale oceanic heat balances [Dobson et al., 1982]. With the advent of satellite and other observing systems to augment the rawin- sonde network, and with future improvements of the analysis systems to process the raw data, the prospects for monitoring the ocean balances and the world water balance by using the aerological method are much better than by using the tradi- tional method. This study provides a preliminary assessment of the accuracy which can currently be achieved with the aero- logical method and a reference with which to compare future results obtained by new analysis procedures and new data sets.
APPENDIX
Evaluation of Vertical Integrals
For a generic variable X its vertical integral is approxi- mated by
t'Sx dP • 1 '•- = k=, •g (Xk6• + X•+ ,6•+ ,)(P• - Pk+ ,) (A1) where the 6• are tags indicating whether a data point is above or below ground and whose values are given by
6•, = {• P•, > annual-mean surface pressure P• < annual-mean surface pressure
The pressure levels at which data are available are p• = 1000 mbar, P2 = 950 mbar ..... P8 = 300 mbar.
Evaluation of Horizontal Divergence
The divergence of the vertically integrated horizontal water vapor flux is given by
V. Q = • + (Q* cos •p) (A2) a cos (p k c•$t •-• where QX and Q* are the zonal and meridional components of Q, respectively. An important property of the divergence for this work is that its integral over the globe vanishes
fo2'•;;V.Qa2cosckdckd/l=O (A3) Due to the paucity of data in the polar regions, we will find it desirable to treat the polar caps separately. We may separate the integral (A3) into three regions: the north polar cap, de- fined as the area poleward of latitude (PN; the south polar cap, defined as the area poleward of (Ps; and the region between and (Ps. On applying Gauss' theorem, (A3) can be written as
fo2'•fq,•NV.Qa2cosckdckd•l-(QN+Qs)=O(A4) $
where
•0 2•t Qs = Q•'(•s)a cos •ps dJ. (A5)
Qs = - Q•'(qbs)a cos (Ps d,[ (A6)
are the fluxes into the north and south polar caps across the latitudes (Pn and (Ps, respectively. In practice we place the polar cap boundaries at 80 ø latitude in both hemispheres. The divergence outside the polar cap regions is computed using a finite difference operator and is similar to the box method which satisfies the integral constraint (A4) [Bryan, 1966]. Under the polar caps the divergence is assumed to be uniform.
Acknowledgments. The authors would like to thank J. Sarmiento, K. Bryan, S. Manabe, D. Hahn, and the anonymous reviewers for their critical comments on this manuscript; M. Rosenstein for help in data reduction; and P. Tunison, W. Ellis, C. Raphael, and J. Connor for preparing the figures. J. Callan carefully and cheerfully typed sev- eral revisions of the manuscript. F. Bryan is supported by ARL/ NOAA grant NA83RAC00052.
11,730 BRYAN AND OORT: GLOBAL WATER BALANCE ,
REFERENCES
Arkin, P. A., A diagnostic precipitation index from infrared satellite imagery, Trop. Ocean-Atmos. Newslett., 17, 5-7, 1983.
Baumgartner, A., Water balance, in Land Surface Processes in General Circulation Models, edited by P.S. Eagleson, World Meteorological Organization, Geneva, 1981.
Baumgartner, A., and E. Reichel, The World Water Balance, p. 27, Elsevier, New York, 1975.
Bryan, K., A scheme for numerical integration of the equations of motion on an irregular grid free of nonlinear instability, Mon. Wea- ther Rev., 94, 39-40, 1966.
Dobson, F. W., F. P. Bretherton, D. M. Burridge, J. Crease, E. B. Krause, and T. H. Vonder Haar, The "Cage" Experiment: A Feasi- bility Study, Publ. 22, World Climate Program, World Meteorol. Org., Geneva, 1982.
Holopainen, E. O., and A. H. Oort, Mean surface stress curl over the oceans as determined from the vorticity budget of the atmosphere, d. Atrnos. Sci., 38, 262-269, 1981.
National Research Council, El Ni•o and the Southern Oscillation: A Scientific Plan, National Academy Press, Washington, D.C., 1983.
Oort, A. H., Adequacy of the rawinsonde network for global circu- lation studies tested through numerical model output, Mon. Wea- ther Rev., 106, 174-195, 1978.
Oort, A. H., Global atmospheric circulation statistics, 1958-1973, NOAA Prof. Pap. 14, Washington, D.C., 1983.
Peixoto, J.P., Pole-to-pole water balance for the IGY from aero- logical data, Nord. Hydrol., 3, 22-43, 1972.
Peixoto, J.P., Atmospheric Water Vapor Flux Computations for Hy- drologic Purposes, WMO/IHD Rep. 20, WMO Publ. 357, World Meteorol. Org., Geneva, 1973.
Peixoto, J.P., and A. H. Oort, The atmospheric branch of the hydro- logic cycle and climate, in Variations in the Global Water Budget, edited by A. Street-Perrott et al., D. Reidel, Hingham, Mass., 1982.
Peixoto, J.P., M. deAlmeida, R. D. Rosen, and D. A. Salstein, Atmo- spheric moisture transport and the water balance of the Medi- terranean Sea, Water Resour. Res., 18, 83-90, 1982.
Rabiner, L. R., M. R. Sambur, and C. E. Schmidt, Applications of a non-linear smoothing algorithm to speech processing, IEEE Trans. Acoust., Speech, Signal Process, ASSP-23(6), 552-557, 1975.
Rasmusson, E. M., Diurnal variations in the summer water vapor transport over North America, Water Resources Res., 2, 469-477, 1966.
Rasmusson, E. M., Atmospheric water vapor transport and the water balance of North America, 2, Large scale water balance investi- gations, Mon. Weather Rev., 96, 720-734, 1968.
Reed, R. K., Comparison of ocean and island rainfall in the tropical North Pacific, J. Appl. Meteorol., 19, 877-880, 1980.
Rosen, R. D., and A. S. Omolayo, Exchange of water vapor between land and ocean in the northern hemisphere, J. Geophys. Res., 86, 12,147-12,152, 1981.
Rosen, R. D., D. A. Salstein, J.P. Peixoto, A. H. Oort, and N.-C. Lau, Circulation statistics derived from level III-b and station-based
analyses during FGGE, Mon. Weather Rev., in press, 1984. Starr, V. P., and J.P. Peixoto, On the global balance of water vapor
and the hydrology of deserts, Tellus, 10, 188-194, 1958. Stern, W. F., and J. J. Ploshay, An assessment of GFDL's continuous
dat assimilation system used for processing FGGE data, paper presented at Sixth Conference on Numerical Weather Prediction, Meteorol. Soc., Omaha, Nebr., June 6-9, 1983.
Teweles, S., A spurious diurnal variation in radiosonde humidity re- cords, Bull. Am. Meteorol. Soc., 51, 836-840, 1970.
F. Bryan, Geophysical Fluid Dynamics Program, P.O. Box 308, Princeton University, Princeton, NJ 08542.
A. Oort, Geophysical Fluid Dynamics Laboratory/NOAA, P.O. Box 308, Princeton, NJ 08542.
(Received April 30, 1984; revised August 20, 1984;
accepted August 23, 1984.)