Embed Size (px)
Citation preview
RESEARCH ARTICLE Open Access
Seasonal modulation of the Asian summermonsoon between the Medieval WarmPeriod and Little Ice Age: a multi modelstudyYouichi Kamae1,2* , Toshi Kawana3, Megumi Oshiro4 and Hiroaki Ueda1
Abstract
Instrumental and proxy records indicate remarkable global climate variability over the last millennium, influenced bysolar irradiance, Earth’s orbital parameters, volcanic eruptions and human activities. Numerical model simulations andproxy data suggest an enhanced Asian summer monsoon during the Medieval Warm Period (MWP) compared to theLittle Ice Age (LIA). Using multiple climate model simulations, we show that anomalous seasonal insolation over theNorthern Hemisphere due to a long cycle of orbital parameters results in a modulation of the Asian summer monsoontransition between the MWP and LIA. Ten climate model simulations prescribing historical radiative forcing thatincludes orbital parameters consistently reproduce an enhanced MWP Asian monsoon in late summer and a weakenedmonsoon in early summer. Weakened, then enhanced Northern Hemisphere insolation before and after June leads to aseasonally asymmetric temperature response over the Eurasian continent, resulting in a seasonal reversal of the signs ofMWP–LIA anomalies in land–sea thermal contrast, atmospheric circulation, and rainfall from early to late summer. Thisseasonal asymmetry in monsoon response is consistently found among the different climate models and is reproducedby an idealized model simulation forced solely by orbital parameters. The results of this study indicate that slowvariation in the Earth’s orbital parameters contributes to centennial variability in the Asian monsoon transition.
Keywords: Asian monsoon, Medieval Warm Period, Little Ice Age, Meridional thermal gradient, Orbital forcing
IntroductionThe last millennium, from 850 A.D. to the present, is akey period in understanding Earth’s climate responseto external forcing and its internal variability ondecadal-to-centennial timescales (e.g., Crowley 2000;Jones et al. 2009; PAGES 2k Consortium 2013;Smerdon and Pollack 2016). A variety of instrumentaland proxy records indicate that the global climate hasexperienced remarkable fluctuations during this perioddue to large volcanic eruptions (e.g., Miller et al. 2012;Schurer et al. 2014; Yang and Jiang 2015; Liu et al.
2016), variations in total solar irradiance (TSI) (Gray etal. 2010; Lean 2010), Earth’s orbital parameters (Bergerand Loutre 1991; Kaufman et al. 2009), greenhousegases (GHGs) (e.g., Schmidt et al. 2011), and internalclimate variability. On a centennial timescale, an-thropogenic global warming accompanying rapid GHGincreases since the 19th century is the most remark-able climate fluctuation (e.g., Bradley et al. 2003; Jonesand Mann 2004; Ammann et al. 2007; Phipps et al.2013; Masson-Delmotte et al. 2014). In addition, pre-dominant global climate perturbation from theMedieval Warm Period (MWP) of 950–1250 A.D. tothe Little Ice Age (LIA) of 1400–1700 A.D. (e.g., Mannet al. 2009) has also attracted much attention becauseit is the most recent example of long-term, naturally-generated global climate variability (e.g., Liu et al.2011; Man et al. 2012; Otto-Bliesner et al. 2016; Shi etal., 2016a, b).
* Correspondence: [email protected] of Life and Environmental Sciences, University of Tsukuba, 1-1-1Tennoudai, Tsukuba, Ibaraki 305-8506, Japan2Scripps Institution of Oceanography, University of California San Diego, 9500Gilman Drive, MC 206, La Jolla, CA 92093-0206, USAFull list of author information is available at the end of the article
Progress in Earth and Planetary Science
© The Author(s). 2017 Open Access This article is distributed under the terms of the Creative Commons Attribution 4.0International License (http://creativecommons.org/licenses/by/4.0/), which permits unrestricted use, distribution, andreproduction in any medium, provided you give appropriate credit to the original author(s) and the source, provide a link tothe Creative Commons license, and indicate if changes were made.
Kamae et al. Progress in Earth and Planetary Science (2017) 4:22 DOI 10.1186/s40645-017-0136-7
Historical variations in the Asian monsoon have im-portant links to environmental changes and the cul-tural development of human societies over South andEast Asia (Clift and Plumb 2008; Fu et al. 2008). Pastmonsoon variability has been addressed both frompaleoenvironmental reconstructions based on proxyrecords and from numerical climate simulations (e.g.,Kutzbach et al. 2008; Zhang et al. 2008; Battisti et al.2014; Masson-Delmotte et al. 2014; Fallah andCubasch 2015; Yan et al. 2015). Variations in sum-mertime temperature over the continents in theNorthern Hemisphere (NH) in response to seasonalinsolation anomalies brought on by changes in orbitalparameters (including the longitude of perihelionprecession) are an essential factor in past monsoonvariability (e.g., COHMAP members 1988; Mohtadi etal. 2016). The land–sea contrast in tropospherictemperature favored by summertime insolation is fur-ther amplified by latent heating of the monsoon rain-fall that establishes deep-tropospheric monsooncirculation (e.g., Li and Yanai 1996; Webster et al.1998; Dai et al. 2013; Wu et al. 2015; Zhang et al.2016). On a millennial timescale, past monsoon vari-ability has largely been controlled by precession vari-ability (e.g., Kutzbach et al. 2008; Merlis et al. 2013;Mohtadi et al. 2016) and amplified by obliquity vari-ability (Bosmans et al. 2015; Wu et al. 2016) as itchanged the large-scale thermal contrast between landand sea. Oxygen isotope-based reconstructions ofIndian and East Asian monsoon intensity show coher-ent variability on a millennial timescale (e.g., Battistiet al. 2014; Kathayat et al. 2016; Mohtadi et al. 2016),suggesting that orbital forcing has a strong effect oncontinental-scale monsoon variability.On a centennial timescale, orbital forcing also
played an important role in long-term differences ofthe intertropical convergence zone and associatedmonsoon activity between the MWP and LIA (e.g.,Sachs et al. 2009; Oppo et al. 2009; Schneider et al.2014; Yan et al. 2015). Major characteristics of themonsoon during these two periods have been recon-structed by proxy records that are broadly availableacross Asia, especially in China (e.g., Chen et al.2015). Historical documents and speleothem recordssuggest that precipitation over northern China associ-ated with the East Asian summer monsoon increasedsignificantly during the MWP and decreased duringthe LIA (Ren and Zhang 1996; Wang et al. 2001;Qian et al. 2003; Tan 2007). Oxygen isotope dataretrieved from Indian stalagmite records also suggestan enhanced Indian summer monsoon during theMWP (Sinha et al. 2011, 2015; Berkelhammer et al.2014). The coherent enhancement of the East Asianand Indian summer monsoon during the MWP, as
compared to the LIA suggests that orbitally forcedsummertime insolation variability is also a key factorfor centennial-scale monsoon variability during thelast millennium.Monsoon variability over the last millennium has also
been addressed by numerical simulations based on sin-gle (Fan et al., 2009b; Liu et al. 2009, 2011; Man et al.2012; Polanski et al. 2014) or multiple climate models(Fallah and Cubasch 2015; Rojas et al. 2016; Shi et al.,2016a, b; Yang and Jiang 2017) estimated as part of thePaleoclimate Modeling Intercomparison Project Phase3 (PMIP3) (Otto-Bliesner et al. 2009). The climatemodels reproduced, in large part, the enhanced Asiansummer monsoon and increased precipitation overnorthern China (35°N–42°N, 100°E–120°E) during theMWP (e.g., Man et al. 2012; Shi et al., 2016b), consist-ent with the proxy evidence. The enhanced Asian sum-mer monsoon during the MWP, as compared to theLIA, is associated with larger land–sea temperaturecontrasts (e.g., Man et al. 2012; Shi et al., 2016a, b) in-duced by strong summertime insolation (Fig. 1; detailedin the Methods section). These large-scale features ofthe Asian summer monsoon during the MWP areconsistent among multiple climate model simulations(Shi et al., 2016a) with nonnegligible inter-modelspread in regional rainfall patterns (Shi et al., 2016b).In addition to seasonal-mean features, seasonal transi-
tions (changes in onset and withdrawal timing) are alsoimportant aspects of paleo-monsoon variability (e.g.,
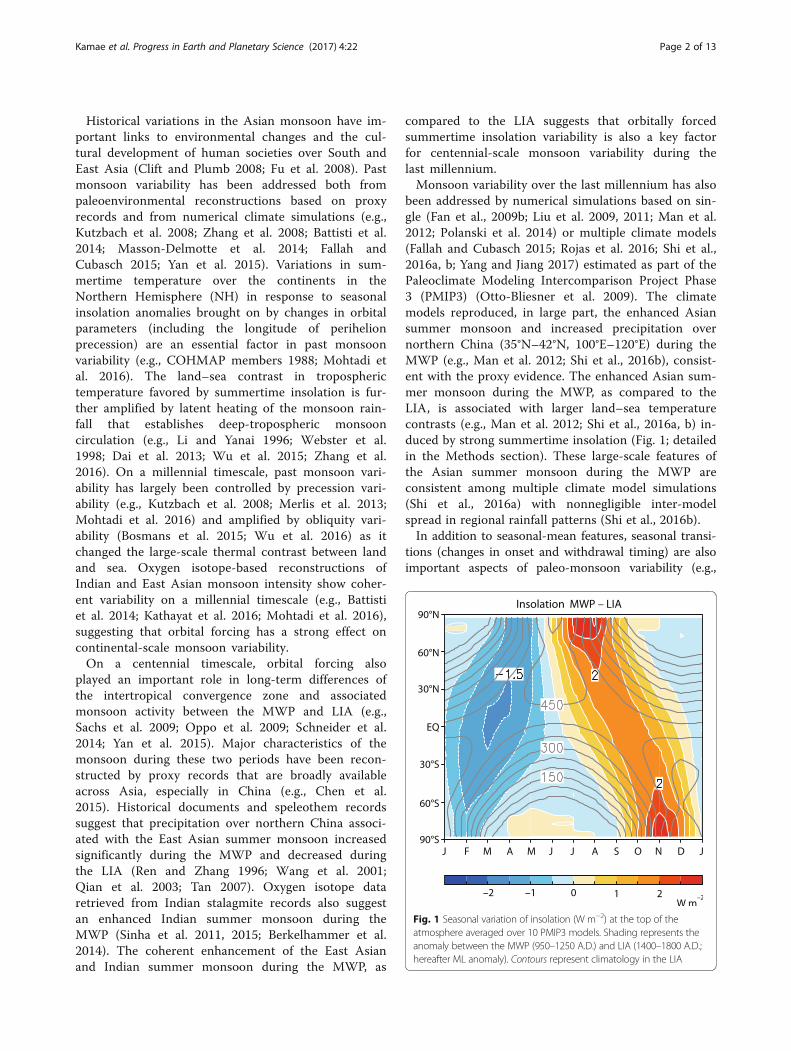
Fig. 1 Seasonal variation of insolation (W m−2) at the top of theatmosphere averaged over 10 PMIP3 models. Shading represents theanomaly between the MWP (950–1250 A.D.) and LIA (1400–1800 A.D.;hereafter ML anomaly). Contours represent climatology in the LIA
Kamae et al. Progress in Earth and Planetary Science (2017) 4:22 Page 2 of 13
Ueda et al. 2011; Shi 2016; Kong et al. 2017). The peakNH insolation anomaly due to the Earth’s orbit variabil-ity is not necessarily concurrent with the summer sol-stice. As for the difference between the MWP and LIA,time-varying precession (detailed in the Methodssection) leads to a positive NH insolation anomaly withits peak in August to September as shown in Fig. 1(Kaufman et al. 2009). In contrast, a negative insolationanomaly is found in May to June, around the timing ofthe monsoon onset, implying a seasonally asymmetricresponse of the Asian summer monsoon to orbitalforcing (e.g., Shi 2016; Kong et al. 2017) during the lastmillennium.This study reveals that the slow variation in orbital
parameters from the MWP to the LIA results in aninverse response of the Asian monsoon between earlyand late summer, as shown by simulations of the lastmillennium using multiple climate models and sensitiv-ity experiments by an atmosphere–ocean coupledgeneral circulation model (AOGCM). The results indi-cate that centennial Asian monsoon variability shown inprevious works is not seasonally uniform, but rathercharacterized by changes in the seasonal transition ofthe monsoon between the MWP and LIA, which is sug-gestive for past, present and future climate variability.
Methods/ExperimentalPMIP3 multiple model ensembleWe analyzed climate simulations of the last millennium(850–1850 A.D.) of 10 AOGCMs (hereafter denoted aspast1000) from PMIP3 (Otto-Bliesner et al. 2009) andthe Coupled Model Intercomparison Project phase 5(CMIP5) (Taylor et al. 2012). Table 1 summarizes themodels used in this study. Although simulation outputsfrom 11 models are available from the CMIP5 Earth
System Grid Federation data server as of 01 February2017, we excluded output from the MIROC-ESM due toclimate drift in its simulation (Sueyoshi et al. 2013).External forcing factors for the past1000 runs in-
clude time-varying TSI, volcanic eruptions, GHGs,land use, and orbital parameters. Details of the ex-perimental setup are found in Schmidt et al. (2011,2012). Note that the models employed different TSIand volcanic forcing data as listed in Table 1 (seeSchmidt et al. 2011, 2012 for details). This differencecontributes partly to inter-model spread among simu-lation outputs. Varying land uses over time such asgradually increasing cropland and pasture area(Schmidt et al. 2012) prescribed in these simulationscan affect regional climate variability, including sur-face temperature and monsoon systems (Takata et al.2009; He et al. 2014). Historical GHG concentrations(CO2, CH4 and N2O) are derived from ice cores inAntarctica (Schmidt et al. 2011). Orbital parametersthat vary over time, including eccentricity, obliquityand precession result in low-frequency variability inthe seasonal-latitudinal distribution of insolation asshown in Fig. 1 (Kaufman et al. 2009; Schmidt et al.2011). Table 2 summarizes the orbital parameters av-eraged during the MWP and LIA. The negative earlysummer insolation anomaly in the NH during theMWP relative to the LIA is largely due to a shift ofthe perihelion (Schmidt et al. 2011). In this study, wecompare long-term mean climates of the MWP andLIA. Note that we determined the MWP climatologyin FGOALS-gl by averaging the period from 1000 to1250 A.D. because only outputs after 1000 A.D. areprovided by this model.Figure 1 shows the 10-model mean insolation anomaly
(MWP minus LIA; hereafter ML) at the top of the at-mosphere. The seasonal NH insolation anomaly due toorbital forcing, especially precession, is remarkable(−1.5–3 W m−2) despite its slow variation on a centen-nial timescale (e.g., the difference in perihelion is 7.28°;Table 2). A large positive anomaly in August andSeptember (1.5–2.5 W m−2), in contrast to a smallanomaly in June (Fig. 1), enhances the land–sea thermalgradient and the Asian summer monsoon (Man et al.2012). In contrast, a broad negative insolation anomalyis found in the NH in the winter-to-spring period(peaking at −1.5–−0.5 W m−2 in March to April), result-ing in the strong seasonal reversal of the NH insolationanomaly. This seasonally asymmetric forcing potentially
Table 1 List of PMIP3 models used in this study. The TSI andvolcanic columns indicate forcing data sets prescribed in themodels. V11: Vieira et al. (2011), S09: Steinhilber et al. (2009), C00:Crowley (2000), JM04: Jones and Mann (2004), DB09: Delaygueand Bard (2009), G08: Gao et al. (2008), C08: Crowley et al. (2008)
Model Atmospheric resolution TSI Volcanic
BCC-CSM1–1 2.813° × 2.791°, L26 V11 G08
CCSM4 1.25° × 0.942°, L26 V11 G08
CSIRO-Mk3L-1-2 5.625° × 3.186°, L18 S09 C08
FGOALS-gl 5.0° × 4.103° C00, JM04 C00, JM04
FGOALS-s2 2.813° × 2.791°, L26 V11 G08
GISS-E2-R 2.5° × 2.0°, L40 V11 G08
HadCM3 3.75° × 2.5°, L19 S09 C08
IPSL-CM5A-LR 3.75° × 1.875°, L39 V11 G08
MPI-ESM-P 1.875° × 1.865°, L47 V11 C08
MRI-CGCM3 1.125° × 1.125°, L48 DB09 G08
Table 2 Orbital parameters for MRI-CGCM2.3 orbital forcing runs
Eccentricity Obliquity Precession
Medieval Warm Period 0.017059 23.556° 87.52°
Little Ice Age 0.016884 23.498° 95.20°
Kamae et al. Progress in Earth and Planetary Science (2017) 4:22 Page 3 of 13
affects the seasonal transition of the Asian summermonsoon (e.g., Kong et al. 2017).
Idealized orbital forcing experiments in an AOGCMThe Asian monsoon simulated in the past 1000 runs isinfluenced by the time-varying external forcing listedabove. The seasonally asymmetric orbital forcing (Fig. 1)may have an especially strong effect on the Asianmonsoon (Ueda et al. 2011; Man et al. 2012; Kong et al.2017). To evaluate the contribution of the orbital forcingto the ML anomaly in the Asian monsoon, weconducted idealized simulations using an AOGCM, theMeteorological Research Institute (MRI) Coupled Gen-eral Circulation Model version 2.3 (MRI-CGCM2.3)(Yukimoto et al. 2006a).MRI-CGCM2.3 has widely been used for future cli-
mate projections (Yukimoto et al. 2006b) and forpaleoclimate simulations including the mid-Holocene,6 ka (Kitoh et al. 2007; Braconnot et al. 2007), LastGlacial Maximum (LGM), 21 ka (Ueda et al. 2011), andPliocene, 3.3–3.0 Ma (Kamae and Ueda 2012; Kamae etal. 2016). Ueda et al. (2011) used this model to examinethe seasonal transition of the Asian monsoon duringthe LGM. This model is capable of reproducing generalfeatures of the Asian summer monsoon including itsseasonal transition (Inoue and Ueda 2009). Its atmos-pheric model is a spectral model with T42 spatial reso-lution (approximately 2.8°) that uses 30 vertical layers.The ocean component is a Bryan-Cox-type global oceanmodel with a horizontal resolution of 2.5° longitudeand 2.0°–0.5° latitude and 23 layers. We integrated themodel without any flux adjustments. The CO2 concen-tration and solar constant were set to 280 ppmv and1365 W m−2, respectively. We set the other boundaryconditions as presented in Table 1 of Kamae et al.
(2016) for their pre-industrial control simulations, andintegrated the model for 500 years to spin up the modelin the same way as Kamae et al. (2016) had done fortheir pre-industrial control run. Next, we changed theorbital parameters as shown in Table 2 and integratedthe model for another 55 years for the MWP and LIAcases. In this paper, we call these two simulations “or-bital forcing runs.” We performed an ensemble of fivemember simulations for each with slightly different ini-tial conditions derived from the pre-industrial run with5-year intervals. We determined the climatology as anaverage over the last 50 years for the individual runs(250 years in total). Note that this study only addressesthe transient response of the Asian monsoon to radia-tive forcing on a multi-decade timescale. Effects oflong-term deep-ocean temperature variations and over-turning circulations on the Asian monsoon during theMWP and LIA are not examined in this study.
Results and DiscussionSeasonally asymmetric response in PMIP3 model simulationsIn this section, we compare the seasonal evolutionsof the Asian monsoons during the MWP and LIAsimulated in multiple PMIP3 models. Figures 2 and 3show the ML rainfall and atmospheric circulationanomalies over the Asian monsoon region averagedfor April–May–June (AMJ) and August–September–October (ASO). For spatial patterns, we chose thesemonths to compare general features of late spring toearly summer (around the monsoon onset) period,with its negative insolation anomaly (Fig. 1) and latesummer to early fall (around monsoon withdrawal),with its positive insolation anomaly, and to emphasizethe seasonal asymmetry in the atmospheric circulationand rainfall responses. Note that the timing of sea-sonal monsoon transitions varies by region (e.g., onset
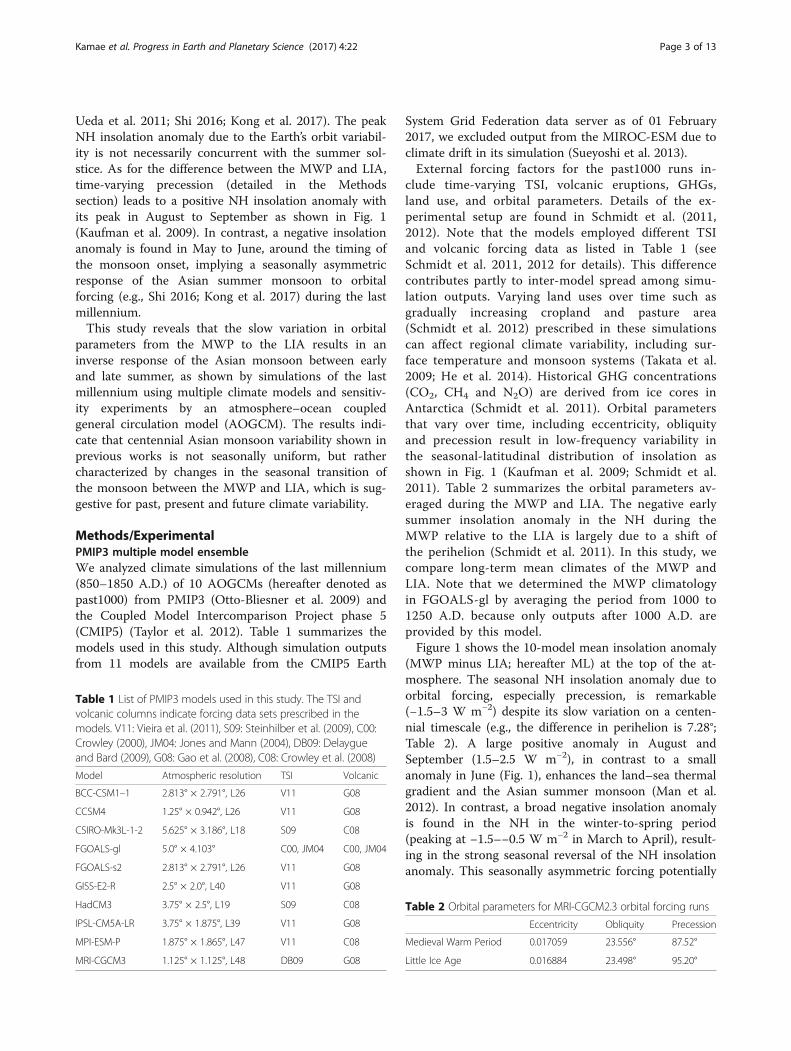
Fig. 2 ML anomaly in seasonal mean, 10-model ensemble mean precipitation (mm day−1). a AMJ and (b) ASO. Stipples indicate the areas with95% statistical confidence. Gray (1 and 4 mm day−1) and black (8 mm day−1) contours represent the climatology of precipitation during the LIA.The dashed purple rectangle indicates the area examined in Table 3
Kamae et al. Progress in Earth and Planetary Science (2017) 4:22 Page 4 of 13
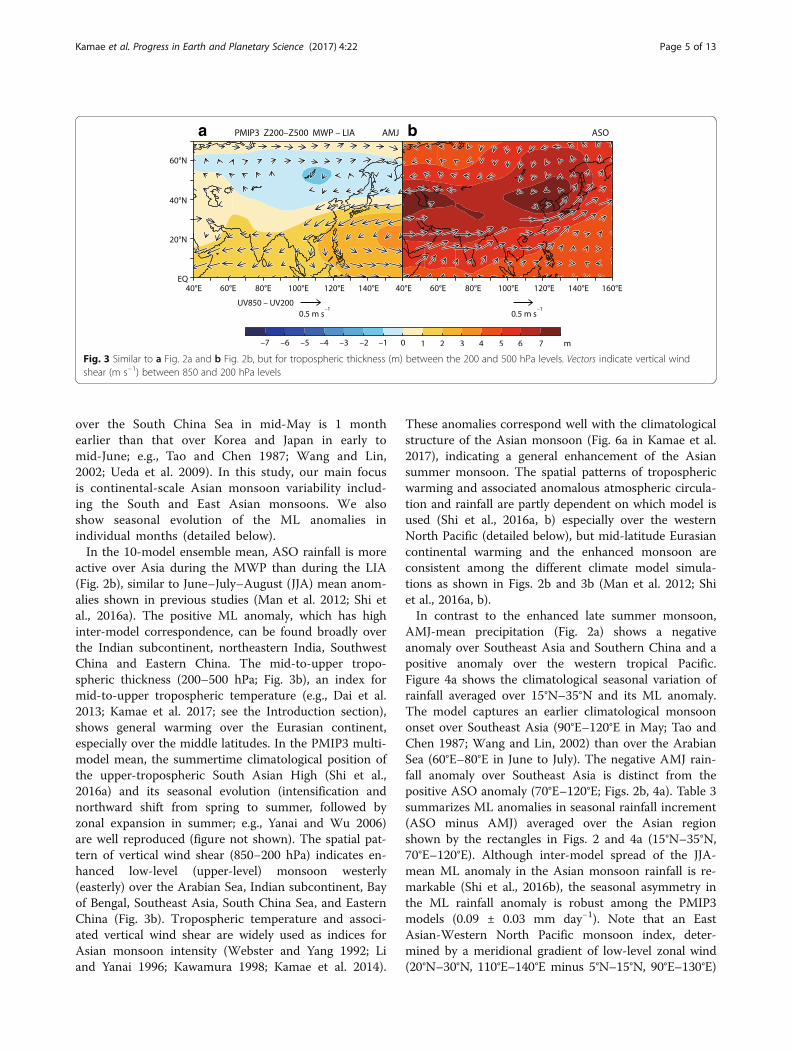
over the South China Sea in mid-May is 1 monthearlier than that over Korea and Japan in early tomid-June; e.g., Tao and Chen 1987; Wang and Lin,2002; Ueda et al. 2009). In this study, our main focusis continental-scale Asian monsoon variability includ-ing the South and East Asian monsoons. We alsoshow seasonal evolution of the ML anomalies inindividual months (detailed below).In the 10-model ensemble mean, ASO rainfall is more
active over Asia during the MWP than during the LIA(Fig. 2b), similar to June–July–August (JJA) mean anom-alies shown in previous studies (Man et al. 2012; Shi etal., 2016a). The positive ML anomaly, which has highinter-model correspondence, can be found broadly overthe Indian subcontinent, northeastern India, SouthwestChina and Eastern China. The mid-to-upper tropo-spheric thickness (200–500 hPa; Fig. 3b), an index formid-to-upper tropospheric temperature (e.g., Dai et al.2013; Kamae et al. 2017; see the Introduction section),shows general warming over the Eurasian continent,especially over the middle latitudes. In the PMIP3 multi-model mean, the summertime climatological position ofthe upper-tropospheric South Asian High (Shi et al.,2016a) and its seasonal evolution (intensification andnorthward shift from spring to summer, followed byzonal expansion in summer; e.g., Yanai and Wu 2006)are well reproduced (figure not shown). The spatial pat-tern of vertical wind shear (850−200 hPa) indicates en-hanced low-level (upper-level) monsoon westerly(easterly) over the Arabian Sea, Indian subcontinent, Bayof Bengal, Southeast Asia, South China Sea, and EasternChina (Fig. 3b). Tropospheric temperature and associ-ated vertical wind shear are widely used as indices forAsian monsoon intensity (Webster and Yang 1992; Liand Yanai 1996; Kawamura 1998; Kamae et al. 2014).
These anomalies correspond well with the climatologicalstructure of the Asian monsoon (Fig. 6a in Kamae et al.2017), indicating a general enhancement of the Asiansummer monsoon. The spatial patterns of troposphericwarming and associated anomalous atmospheric circula-tion and rainfall are partly dependent on which model isused (Shi et al., 2016a, b) especially over the westernNorth Pacific (detailed below), but mid-latitude Eurasiancontinental warming and the enhanced monsoon areconsistent among the different climate model simula-tions as shown in Figs. 2b and 3b (Man et al. 2012; Shiet al., 2016a, b).In contrast to the enhanced late summer monsoon,
AMJ-mean precipitation (Fig. 2a) shows a negativeanomaly over Southeast Asia and Southern China and apositive anomaly over the western tropical Pacific.Figure 4a shows the climatological seasonal variation ofrainfall averaged over 15°N–35°N and its ML anomaly.The model captures an earlier climatological monsoononset over Southeast Asia (90°E–120°E in May; Tao andChen 1987; Wang and Lin, 2002) than over the ArabianSea (60°E–80°E in June to July). The negative AMJ rain-fall anomaly over Southeast Asia is distinct from thepositive ASO anomaly (70°E–120°E; Figs. 2b, 4a). Table 3summarizes ML anomalies in seasonal rainfall increment(ASO minus AMJ) averaged over the Asian regionshown by the rectangles in Figs. 2 and 4a (15°N–35°N,70°E–120°E). Although inter-model spread of the JJA-mean ML anomaly in the Asian monsoon rainfall is re-markable (Shi et al., 2016b), the seasonal asymmetry inthe ML rainfall anomaly is robust among the PMIP3models (0.09 ± 0.03 mm day−1). Note that an EastAsian-Western North Pacific monsoon index, deter-mined by a meridional gradient of low-level zonal wind(20°N–30°N, 110°E–140°E minus 5°N–15°N, 90°E–130°E)
Fig. 3 Similar to a Fig. 2a and b Fig. 2b, but for tropospheric thickness (m) between the 200 and 500 hPa levels. Vectors indicate vertical windshear (m s−1) between 850 and 200 hPa levels
Kamae et al. Progress in Earth and Planetary Science (2017) 4:22 Page 5 of 13
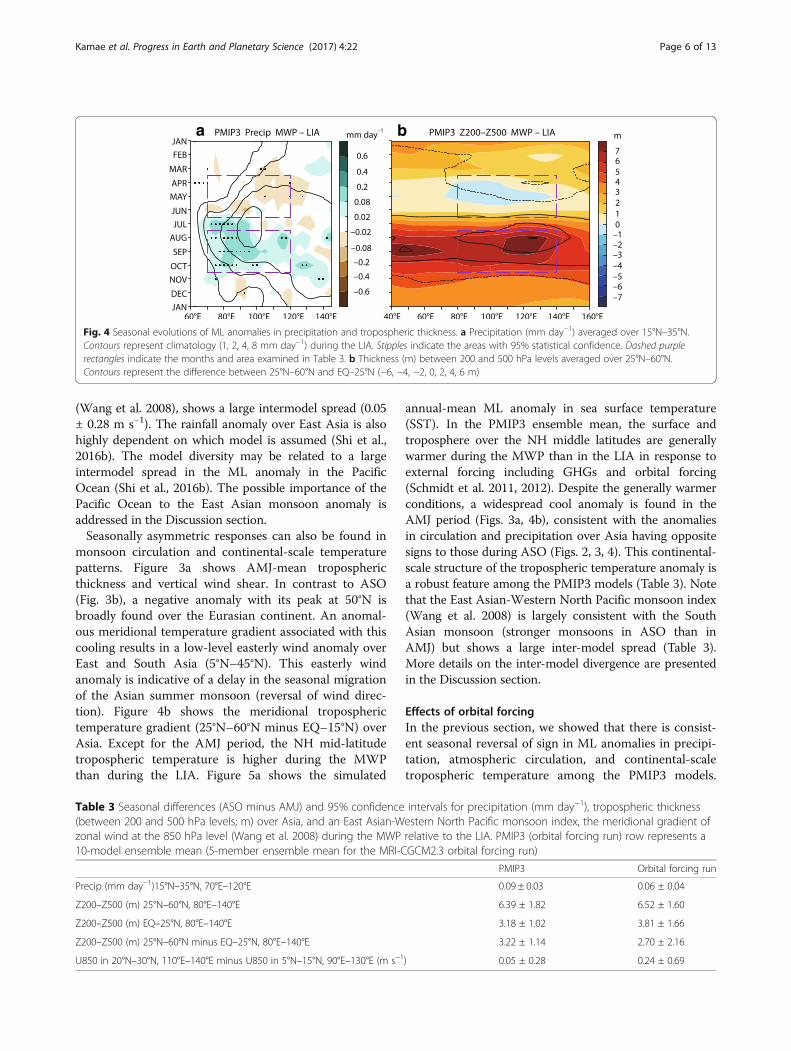
(Wang et al. 2008), shows a large intermodel spread (0.05± 0.28 m s−1). The rainfall anomaly over East Asia is alsohighly dependent on which model is assumed (Shi et al.,2016b). The model diversity may be related to a largeintermodel spread in the ML anomaly in the PacificOcean (Shi et al., 2016b). The possible importance of thePacific Ocean to the East Asian monsoon anomaly isaddressed in the Discussion section.Seasonally asymmetric responses can also be found in
monsoon circulation and continental-scale temperaturepatterns. Figure 3a shows AMJ-mean troposphericthickness and vertical wind shear. In contrast to ASO(Fig. 3b), a negative anomaly with its peak at 50°N isbroadly found over the Eurasian continent. An anomal-ous meridional temperature gradient associated with thiscooling results in a low-level easterly wind anomaly overEast and South Asia (5°N–45°N). This easterly windanomaly is indicative of a delay in the seasonal migrationof the Asian summer monsoon (reversal of wind direc-tion). Figure 4b shows the meridional tropospherictemperature gradient (25°N–60°N minus EQ–15°N) overAsia. Except for the AMJ period, the NH mid-latitudetropospheric temperature is higher during the MWPthan during the LIA. Figure 5a shows the simulated
annual-mean ML anomaly in sea surface temperature(SST). In the PMIP3 ensemble mean, the surface andtroposphere over the NH middle latitudes are generallywarmer during the MWP than in the LIA in response toexternal forcing including GHGs and orbital forcing(Schmidt et al. 2011, 2012). Despite the generally warmerconditions, a widespread cool anomaly is found in theAMJ period (Figs. 3a, 4b), consistent with the anomaliesin circulation and precipitation over Asia having oppositesigns to those during ASO (Figs. 2, 3, 4). This continental-scale structure of the tropospheric temperature anomaly isa robust feature among the PMIP3 models (Table 3). Notethat the East Asian-Western North Pacific monsoon index(Wang et al. 2008) is largely consistent with the SouthAsian monsoon (stronger monsoons in ASO than inAMJ) but shows a large inter-model spread (Table 3).More details on the inter-model divergence are presentedin the Discussion section.
Effects of orbital forcingIn the previous section, we showed that there is consist-ent seasonal reversal of sign in ML anomalies in precipi-tation, atmospheric circulation, and continental-scaletropospheric temperature among the PMIP3 models.
Table 3 Seasonal differences (ASO minus AMJ) and 95% confidence intervals for precipitation (mm day−1), tropospheric thickness(between 200 and 500 hPa levels; m) over Asia, and an East Asian-Western North Pacific monsoon index, the meridional gradient ofzonal wind at the 850 hPa level (Wang et al. 2008) during the MWP relative to the LIA. PMIP3 (orbital forcing run) row represents a10-model ensemble mean (5-member ensemble mean for the MRI-CGCM2.3 orbital forcing run)
PMIP3 Orbital forcing run
Precip (mm day−1)15°N–35°N, 70°E–120°E 0.09 ± 0.03 0.06 ± 0.04
Z200–Z500 (m) 25°N–60°N, 80°E–140°E 6.39 ± 1.82 6.52 ± 1.60
Z200–Z500 (m) EQ–25°N, 80°E–140°E 3.18 ± 1.02 3.81 ± 1.66
Z200–Z500 (m) 25°N–60°N minus EQ–25°N, 80°E–140°E 3.22 ± 1.14 2.70 ± 2.16
U850 in 20°N–30°N, 110°E–140°E minus U850 in 5°N–15°N, 90°E–130°E (m s−1) 0.05 ± 0.28 0.24 ± 0.69
Fig. 4 Seasonal evolutions of ML anomalies in precipitation and tropospheric thickness. a Precipitation (mm day−1) averaged over 15°N–35°N.Contours represent climatology (1, 2, 4, 8 mm day−1) during the LIA. Stipples indicate the areas with 95% statistical confidence. Dashed purplerectangles indicate the months and area examined in Table 3. b Thickness (m) between 200 and 500 hPa levels averaged over 25°N–60°N.Contours represent the difference between 25°N–60°N and EQ–25°N (−6, −4, −2, 0, 2, 4, 6 m)
Kamae et al. Progress in Earth and Planetary Science (2017) 4:22 Page 6 of 13
These seasonally asymmetric responses are difficult tounderstand as a forced response to seasonally uniformforcing that includes TSI and GHGs (e.g., Ueda et al.2006; Endo and Kitoh 2014). Here, the seasonal NH in-solation anomaly due to changes in orbital parameters(Table 2) has opposite signs in AMJ and ASO (Fig. 1),consistent with the Asian monsoon response. In this sec-tion, results of the orbital forcing runs conducted inMRI-CGCM2.3 are compared with the PMIP3 ensembleto examine the physical relationship between orbitalparameters and the Asian monsoon.Figure 6 shows the results of the five-member ensem-
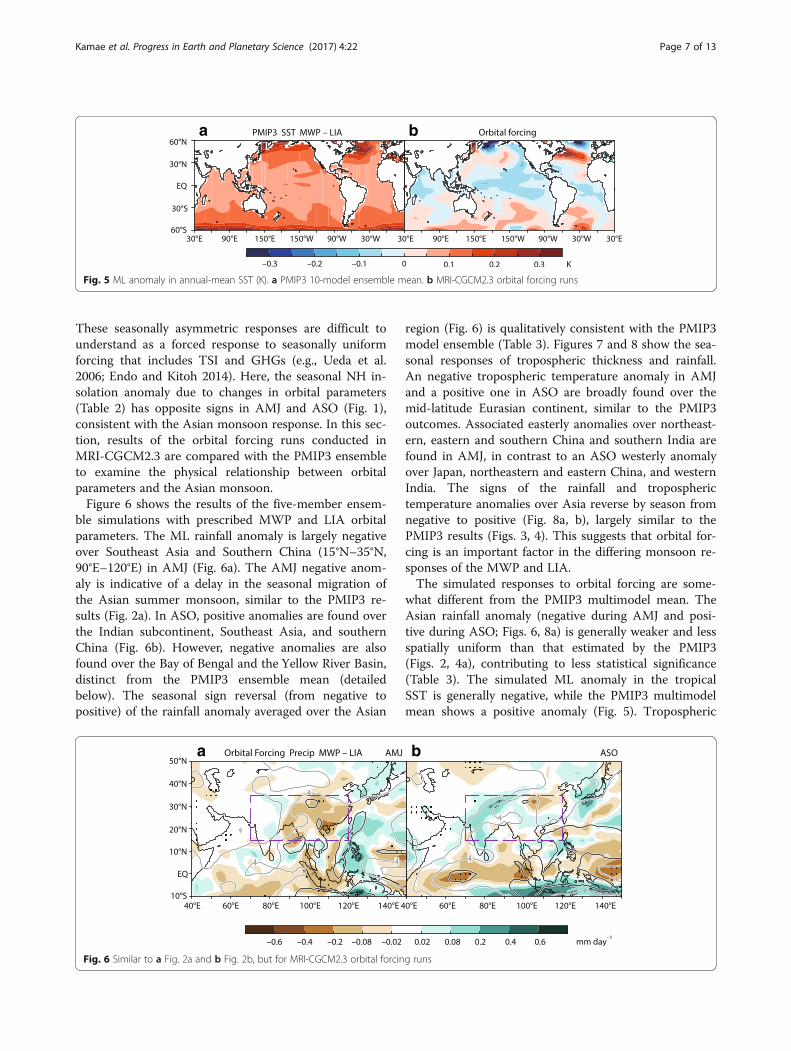
ble simulations with prescribed MWP and LIA orbitalparameters. The ML rainfall anomaly is largely negativeover Southeast Asia and Southern China (15°N–35°N,90°E–120°E) in AMJ (Fig. 6a). The AMJ negative anom-aly is indicative of a delay in the seasonal migration ofthe Asian summer monsoon, similar to the PMIP3 re-sults (Fig. 2a). In ASO, positive anomalies are found overthe Indian subcontinent, Southeast Asia, and southernChina (Fig. 6b). However, negative anomalies are alsofound over the Bay of Bengal and the Yellow River Basin,distinct from the PMIP3 ensemble mean (detailedbelow). The seasonal sign reversal (from negative topositive) of the rainfall anomaly averaged over the Asian
region (Fig. 6) is qualitatively consistent with the PMIP3model ensemble (Table 3). Figures 7 and 8 show the sea-sonal responses of tropospheric thickness and rainfall.An negative tropospheric temperature anomaly in AMJand a positive one in ASO are broadly found over themid-latitude Eurasian continent, similar to the PMIP3outcomes. Associated easterly anomalies over northeast-ern, eastern and southern China and southern India arefound in AMJ, in contrast to an ASO westerly anomalyover Japan, northeastern and eastern China, and westernIndia. The signs of the rainfall and tropospherictemperature anomalies over Asia reverse by season fromnegative to positive (Fig. 8a, b), largely similar to thePMIP3 results (Figs. 3, 4). This suggests that orbital for-cing is an important factor in the differing monsoon re-sponses of the MWP and LIA.The simulated responses to orbital forcing are some-
what different from the PMIP3 multimodel mean. TheAsian rainfall anomaly (negative during AMJ and posi-tive during ASO; Figs. 6, 8a) is generally weaker and lessspatially uniform than that estimated by the PMIP3(Figs. 2, 4a), contributing to less statistical significance(Table 3). The simulated ML anomaly in the tropicalSST is generally negative, while the PMIP3 multimodelmean shows a positive anomaly (Fig. 5). Tropospheric
Fig. 5 ML anomaly in annual-mean SST (K). a PMIP3 10-model ensemble mean. b MRI-CGCM2.3 orbital forcing runs
Fig. 6 Similar to a Fig. 2a and b Fig. 2b, but for MRI-CGCM2.3 orbital forcing runs
Kamae et al. Progress in Earth and Planetary Science (2017) 4:22 Page 7 of 13
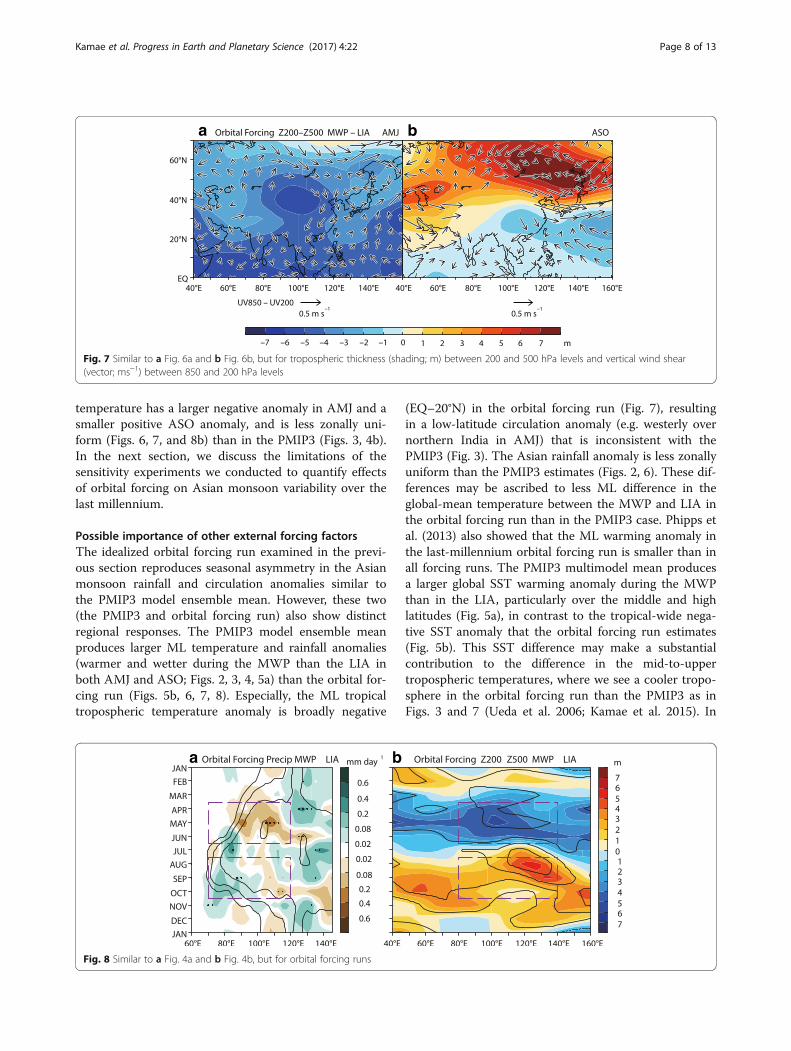
temperature has a larger negative anomaly in AMJ and asmaller positive ASO anomaly, and is less zonally uni-form (Figs. 6, 7, and 8b) than in the PMIP3 (Figs. 3, 4b).In the next section, we discuss the limitations of thesensitivity experiments we conducted to quantify effectsof orbital forcing on Asian monsoon variability over thelast millennium.
Possible importance of other external forcing factorsThe idealized orbital forcing run examined in the previ-ous section reproduces seasonal asymmetry in the Asianmonsoon rainfall and circulation anomalies similar tothe PMIP3 model ensemble mean. However, these two(the PMIP3 and orbital forcing run) also show distinctregional responses. The PMIP3 model ensemble meanproduces larger ML temperature and rainfall anomalies(warmer and wetter during the MWP than the LIA inboth AMJ and ASO; Figs. 2, 3, 4, 5a) than the orbital for-cing run (Figs. 5b, 6, 7, 8). Especially, the ML tropicaltropospheric temperature anomaly is broadly negative
(EQ–20°N) in the orbital forcing run (Fig. 7), resultingin a low-latitude circulation anomaly (e.g. westerly overnorthern India in AMJ) that is inconsistent with thePMIP3 (Fig. 3). The Asian rainfall anomaly is less zonallyuniform than the PMIP3 estimates (Figs. 2, 6). These dif-ferences may be ascribed to less ML difference in theglobal-mean temperature between the MWP and LIA inthe orbital forcing run than in the PMIP3 case. Phipps etal. (2013) also showed that the ML warming anomaly inthe last-millennium orbital forcing run is smaller than inall forcing runs. The PMIP3 multimodel mean producesa larger global SST warming anomaly during the MWPthan in the LIA, particularly over the middle and highlatitudes (Fig. 5a), in contrast to the tropical-wide nega-tive SST anomaly that the orbital forcing run estimates(Fig. 5b). This SST difference may make a substantialcontribution to the difference in the mid-to-uppertropospheric temperatures, where we see a cooler tropo-sphere in the orbital forcing run than the PMIP3 as inFigs. 3 and 7 (Ueda et al. 2006; Kamae et al. 2015). In
Fig. 7 Similar to a Fig. 6a and b Fig. 6b, but for tropospheric thickness (shading; m) between 200 and 500 hPa levels and vertical wind shear(vector; ms−1) between 850 and 200 hPa levels
Fig. 8 Similar to a Fig. 4a and b Fig. 4b, but for orbital forcing runs
Kamae et al. Progress in Earth and Planetary Science (2017) 4:22 Page 8 of 13
contrast to increased summer insolation (Fig. 1), winterinsolation inversely decreases over the NH and SH,resulting in limited global-mean annual-mean insolationanomalies. This limited global-mean forcing cannot sim-ply explain the globally-warmer climate during theMWP than in the LIA (Fig. 5a). Under the PMIP3framework, GHGs, volcanic aerosols, TSI, and landcover all varied over time in the climate model simula-tions in addition to the orbital forcing. For example, theCO2 concentration during the MWP is higher than inthe LIA, especially after 1600 A.D. (Schmidt et al. 2011),contributing partly to global warming and the largersummertime tropospheric warming over the Eurasiancontinent than over the surrounding oceans as shown inFig. 3b (Kamae et al. 2014). In addition, TSI and largevolcanic eruptions are also important factors in the MLclimate anomaly (e.g., Schurer et al. 2014; Otto-Bliesneret al. 2016). Phipps et al. (2013) showed that the last-millennium temperature variation, in response to orbitalforcing, is smaller than that in response to all forcingfactors. Orbital forcing is substantially important for theseasonally asymmetric Asian monsoon response (Fig. 8)although it is a minor factor in the global ML climateanomaly (Fig. 5). The effect of volcanic eruptions on theSST anomaly is also discussed in the next subsection.
Role of sea surface temperature patternThe PMIP3 multi-model mean reproduces general seasurface warming during the MWP than during the LIA(Fig. 5a). We should note that the spatial pattern of theML SST anomaly and associated regional anomalies inthe Asian and Western North Pacific monsoon (rainfalland atmospheric circulation) are highly dependent onthe models used, as can be seen in Table 3 as per Shi etal. (2016b), who compared ML SST anomalies simulatedin the individual PMIP3 models and found that (1) gen-erally, mid-to-high latitude warming is larger than in thetropics; and (2) inter-model spread in the regional SSTanomaly is substantially large over the equatorial Pacificand the mid-latitude North Pacific. A majority of thePMIP3 models simulate global ocean warming withlimited east-west gradients in the equatorial Pacific(Mann et al. 2009; Shi et al., 2016b). In contrast, onePMIP3 model, MRI-CGCM3, reproduces a La Niña-like SST anomaly, largely consistent with proxy evi-dence (Mann et al. 2009; Shi et al., 2016b). This equa-torial Pacific SST anomaly contributes to the simulatedEast Asian rainfall anomaly (Shi et al., 2016b). Theseresults indicate that the reproducibility of the SSTpattern over the tropical Pacific and the western NorthPacific is essential in simulations of the Asian monsoonfor the last millennium.It is also noteworthy that large uncertainties still exist
in the centennial variability of the equatorial Pacific SST
associated with ENSO activity and tropical volcaniceruptions during the last millennium (e.g., Adams et al.2003). Mann et al. (2009) revealed that positive tropicalradiative forcing due to high solar irradiance andinactive volcanism are responsible for the more LaNiña-like mean state during the MWP as compared tothe LIA, inconsistent with a more El Niño-like conditionsuggested in Yan et al. (2011). In the near future, weplan to conduct a set of atmospheric simulationsprescribing tropical SST patterns (i.e., La Niña-like andEl Niño-like patterns) to evaluate the relative importanceof the SST patterns to regional and seasonal Asianrainfall and the effect of orbital forcing-induced land–sea warming contrast.
Data–model and model–model comparisonsA variety of proxy records for the last millenniumAsian monsoon could improve our understanding ofthe long-term variation in the Asian monsoon’sseasonal transition. However, it is not easy to procuresuch records because temporally high-resolution (i.e.,sub-seasonal) information is needed to evaluate data–model consistency in the seasonal monsoon transition.One of promising data source for this purpose ismeteorological information in historical documentsincluding diaries. Adamson and Nash (2014) recon-structed regional monsoon behavior over western Indiafor the period 1781–1860 from diaries and other his-torical documents. They converted qualitative informa-tion in the historical documents into a quantitativemonthly rainfall index. Wang and Zhang (1992)reviewed several studies trying to reconstruct the his-torical variation of monthly rainfall and onset/with-drawal dates of the Meiyu rainy season in the LowerYangtze region in the 18th century. Daily meteoro-logical information recorded in historical documents isbeneficial for reconstructing the variability of theAsian summer monsoon. However, such meteoro-logical records were rarely continued for even severaldecades, let alone centuries, so they are not broadlyeffective in evaluating long-term monsoon variability.Further efforts to reconstruct past climate variabilityover Asia by combining a variety of proxy data includ-ing tree-ring records (e.g., Cook et al. 2013; Fan et al.,2009a; Fritts 2001; Takahashi et al. 2011), lake-freezingrecords (e.g., Arakawa 1954, Sharma et al. 2016), andphenological records (e.g. Aono and Omoto 1994;Mikami 2008) may improve our understanding of thelong-term variability of the Asian monsoon.In this study, the effect of orbital forcing is evaluated
using only a single climate model. The derived resultssuffer from model-dependency problems including theeffects of model biases. More systematic efforts areneeded to better evaluate each particular forcing effect
Kamae et al. Progress in Earth and Planetary Science (2017) 4:22 Page 9 of 13
and the results’ dependency on models. Previous stud-ies have only evaluated the effects of respective forcingon continental-scale, NH-mean, or global-meanclimate features (e.g., Phipps et al. 2013; Schurer et al.2013, 2014; Otto-Bliesner et al. 2016). Monsoonresponses to historical land use changes (e.g., Takata etal. 2009), aerosol forcing (e.g., Bollasina et al. 2011;Polson et al. 2014), and TSI (e.g., Shi et al. 2014)should be further evaluated in a multi-model frame-work. Further modeling work may contribute to betterunderstanding of the forced monsoon response and itsinternal variability on interannual, decadal, centennial,and millennial timescales.
ConclusionsWe examined long-term variation in the seasonal transi-tion of the Asian monsoon during the last millenniumusing ten climate model simulations. The models repro-duce an enhanced late summer MWP Asian monsoonbut weakened early summer Asian rainfall compared tothe LIA. The cooling-to-warming transition over theEurasian continent before and after June with limitedvariation over the oceans results in the seasonally asym-metric deep-tropospheric circulation and rainfallresponses over Asia. The robust seasonal asymmetry inthe Asian monsoon response among the climate modelsis qualitatively reproduced by an AOGCM simulationforced by orbital parameters, suggesting that theseasonal-latitudinal distribution of the insolationanomaly is important to the centennial variability of theseasonal transition of the Asian monsoon.Orbital forcing cannot explain the annual-mean
climate anomaly between the MWP and LIA, implyingthat other forcing factors, including GHGs, have largecontributions. Tropical SST response to orbital forcingin particular differs from the multiple model simulations.This inconsistency contributes to the tropospherictemperature and circulation anomaly over Asia. Theeast–west SST pattern in the Pacific shows remarkableinter-model variance, contributing substantially to themid-latitude terrestrial climate anomaly between theMWP and LIA (Shi et al., 2016b). The La Niña-like MLSST anomaly in the Pacific suggested by proxy recordswas not successfully reproduced in the majority ofclimate model simulations. Uncertainty in centennialtropical SST variability and its contribution to themonsoon during the last millennium still remains achallenge. Further efforts in data–model synthesisincluding comparisons of simulation outputs withpaleoenvironment reconstructions and paleoclimate dataassimilation (e.g., von Storch et al. 2000; Fang and Li2016) are needed to advance our understanding of thelast millennium’s monsoon variability.
AbbreviationsAMJ: April–May–June; AOGCM: Atmosphere–ocean coupled generalcirculation model; ASO: August–September–October; CMIP5: Coupled ModelIntercomparison Project phase 5; GHGs: Greenhouse gases; JJA: June–July–August; LGM: Last Glacial Maximum; LIA: Little Ice Age; ML: MWP minus LIA;MRI: Meteorological Research Institute; MRI-CGCM2.3: MRI Coupled GeneralCirculation Model version 2.3; MWP: Medieval Warm Period; NH: NorthernHemisphere; PMIP3: Paleoclimate Modelling Intercomparison Project Phase 3;SH: Southern Hemisphere; SST: Sea surface temperature; TSI: Total solarirradiance
AcknowledgementsWe thank two anonymous reviewers whose suggestions helped to greatlyimprove the manuscript. The MRI made the MRI-CGCM2.3 available under acooperative agreement. We acknowledge the World Climate ResearchProgramme’s Working Group on Coupled Modeling, which is responsible for theCMIP, and thank the climate modeling groups listed in Table 1 for producingand making their model output available. For CMIP5/PMIP3, the US Departmentof Energy’s Program for Climate Model Diagnosis and Intercomparison providedcoordinating support, and led the development of the software infrastructure inpartnership with the Global Organization for Earth System Science Portals.
FundingThis work was supported by JSPS KAKENHI Grant Numbers 17 K14388 and17 K01223.
Availability of data and materialsThe PMIP3 experimental data are available from the CMIP5 Earth System GridFederation data portal. The boundary forcing data for the PMIP3 experimentsare available as supplemental data of Schmidt et al. (2011, 2012). The modeloutputs from the orbital-forcing sensitivity experiments are accessible via theauthors.
Authors’ contributionsYK drafted the manuscript. YK, MO, and HU proposed the topic and conceivedand designed the study. TK and MO analyzed the multi-model data and helpedin interpretation. YK conducted the sensitivity experiments and analyzed thesimulated results. All authors read and approved the final manuscript.
Authors’ informationMO’s current affiliation is Weathernews Inc.
Competing interestsThe authors declare that they have no competing interest.
Publisher’s NoteSpringer Nature remains neutral with regard to jurisdictional claims inpublished maps and institutional affiliations.
Author details1Faculty of Life and Environmental Sciences, University of Tsukuba, 1-1-1Tennoudai, Tsukuba, Ibaraki 305-8506, Japan. 2Scripps Institution ofOceanography, University of California San Diego, 9500 Gilman Drive, MC206, La Jolla, CA 92093-0206, USA. 3College of Geoscience, School of Life andEnvironmental Sciences, University of Tsukuba, 1-1-1 Tennoudai, Tsukuba,Ibaraki 305-8506, Japan. 4Graduate School of Life and EnvironmentalSciences, University of Tsukuba, 1-1-1 Tennoudai, Tsukuba, Ibaraki 305-8506,Japan.
Received: 2 March 2017 Accepted: 10 July 2017
ReferencesAdams JB, Mann ME, Ammann CM (2003) Proxy evidence for an el Niño-like
response to volcanic forcing. Nature 426:274–278Adamson GCD, Nash DJ (2014) Documentary reconstruction of monsoon rainfall
variability over western India, 1781–1860. Clim Dyn 42:749–769Ammann CM, Joos F, Schimel DS, Otto-Bliesner BL, Tomas RA (2007) Solar
influence on climate during the past millennium: results from transientsimulations with the NCAR climate system model. Proc Natl Acad Sci U S A104:3713–3718
Kamae et al. Progress in Earth and Planetary Science (2017) 4:22 Page 10 of 13
Aono Y, Omoto Y (1994) Estimation of temperature at Kyoto since the 11thcentury using flowering data of cherry trees in old documents. J AgrMeteorol Jpn 49:263–272
Arakawa H (1954) Fujiwhara on five centuries of freezing dates of Lake Suwa inthe Central Japan. Arch Meteorol Geophys Bioklimatol Ser B 6:152–166
Battisti DS, Ding Q, Roe GH (2014) Coherent pan-Asian climatic and isotopicresponse to orbital forcing of tropical insolation. J Geophys Res Atmos 119:11997–12020
Berger A, Loutre MF (1991) Insolation values for the climate of the last 10 millionof years. Quat Sci Rev 10:297–317
Berkelhammer M, Sinha A, Mudelsee M, Cheng H, Yoshimura K, Biswas J (2014)On the low-frequency component of the ENSO–Indian monsoonrelationship: a paired proxy perspective. Clim Past 10:733–744
Bollasina MA, Ming Y, Ramaswamy V (2011) Anthropogenic aerosols and theweakening of the south Asian summer monsoon. Science 334:502–505
Bosmans JHC, Hilgen FJ, Tuenter E, Lourens LJ (2015) Obliquity forcing of low-latitude climate. Clim Past 11:1335–1346
Braconnot P, Otto-Bleisner B, Harrison S, Joussaume S, Peterschmitt J-Y, Abe-Ouchi A, Crucifix M, Driesschaert E, Fichefet T, Hewitt CD, Kagayama M, KitohA, La né A, Loutre M-F, Marti O, Merkel U, Ramstein G, Valdes P, Weber SL,Yu Y, Zhao Y (2007) Results of PMIP2 coupled simulations of the mid-Holocene and last glacial maximum, part 1: experiments and large-scalefeatures. Clim Past 3:261–277
Bradley RS, Briffa KR, Cole J, Osborn TJ (2003) The climate of the last millennium.In: Alverson KD, Bradley RS, Pedersen TS (eds) Paleoclimate, global changeand the future. Springer, Heidelberg, pp 105–141
Chen J, Chen F, Feng S, Huang W, Liu J, Zhou A (2015) Hydroclimatic changes inChina and surroundings during the medieval climate anomaly and little iceage: spatial patterns and possible mechanisms. Quat Sci Rev 107:98–111
Clift PD, Plumb RA (2008) The Asian monsoon: causes, history & effects.Cambridge University Press, Cambridge
COHMAP members (1988) Climatic changes of the last 18,000 years: observationsand model simulations. Science 241:1043–1052
Cook ER, Krusic PJ, Anchukaitis KJ, Buckley BM, Nakatsuka T, Sano M (2013) Tree-ringreconstructed summer temperature anomalies for temperate East Asia since800 CE. Clim Dyn 41:2957–2972
Crowley TJ (2000) Causes of climate change over the past 1000 years. Science289:270–277
Crowley TJ, Zielinski G, Vinther B, Udisti R, Kreutz K, Cole-Dai J, Castellano E (2008)Volcanism and the little ice age. PAGES News 16:22–23
Dai A, Li H, Sun Y, Hong L-C, Lin H, Chou C, Zhou T (2013) The relative roles ofupper and lower tropospheric thermal contrasts and tropical influences indriving Asian summer monsoons. J Geophys Res Atmos 118:7024–7045
Delaygue G, Bard E (2009) Solar forcing based on be-10 in Antarctica ice over thepast millennium and beyond. EGU Gen Assembly Conf Abstr 11:6943
Endo H, Kitoh A (2014) Thermodynamic and dynamic effects on regional monsoonrainfall changes in a warmer climate. Geophys Res Lett 41:1704–1710
Fallah B, Cubasch U (2015) A comparison of model simulations of Asian mega-droughts during the past millennium with proxy reconstructions. Clim Past11:253–263
Fan Z-X, Bräuning A, Yang B, Cao K-F (2009a) Tree ring density-based summertemperature reconstruction for the central Hengduan Mountains in southernChina. Glob Planet Change 65:1–11
Fan F, Mann ME, Amman CM (2009b) Understanding changes in the Asiansummer monsoon over the past millennium: insights from a long-termcoupled model simulation. J Clim 22:1736–1748
Fang M, Li X (2016) Paleoclimate data assimilation: its motivation, progress andprospects. Sci Chi Earth Sci 59:1817–1826
Fritts HC (2001) Tree rings and climate, 2nd edn. Blackburn Press, CaldwellFu C, Freney JR, Stewart JWB (eds) (2008) Changes in the human-monsoon
system of East Asia in the context of global change. World ScientificPublishing, Singapore
Gao C, Robock A, Ammann C (2008) Volcanic forcing of climate over the past1500 years: an improved ice core-based index for climate models. J GeophysRes Atmos 113:D23111. doi:10.1029/2008JD010239
Gray LJ, Beer J, Geller M, Haigh JD, Lockwood M, Matthes K, Cubasch U,Fleitmann D, Harrison G, Hood L, Luterbacher J, Meehl GA, Shindell D, vanGeel B, White W (2010) Solar influences on climate. Rev Geophys 48:RG4001
He F, Vavrus SJ, Kutzbach JE, Ruddiman WF, Kaplan JO, Krumhardt KM (2014)Simulating global and local surface temperature changes due to Holoceneanthropogenic land cover change. Geophys Res Lett 41:623–631
Inoue T, Ueda H (2009) Evaluation for the seasonal evolution of the summermonsoon over the Asian and western North Pacific sector in the WCRPCMIP3 multi-model experiments. J Meteorol Soc Jpn 87:539–560
Jones PD, Mann ME (2004) Climate over past millennia. Rev Geophys 42:RG2002.doi:10.1029/2003RG000143
Jones PD, Briffa KR, Osborn TJ, Lough JM, van Ommen TD, Vinther BM,Luterbacher J, Wahl ER, Zwiers FW, Mann ME, Schmidt GA, Ammann CM,Buckley BM, Cobb KM, Esper J, Goosse H, Graham N, Jansen E, Kiefer T, Kull C,Küttel M, Mosley-Thompson E, Overpeck JT, Riedwyl N, Schulz M, TudhopeAW, Villalba R, Wanner H, Wolff E, Xoplaki E (2009) High-resolutionpalaeoclimatology of the last millennium: a review of current status andfuture prospects. The Holocene 19:3–49
Kamae Y, Ueda H (2012) Mid-Pliocene global climate simulation with MRI-CGCM2.3: set-up and initial results of PlioMIP experiments 1 and 2. GeosciModel Dev 5:793–808
Kamae Y, Watanabe M, Kimoto M, Shiogama H (2014) Summertime land–seathermal contrast and atmospheric circulation over East Asia in a warmingclimate–part I: past changes and future projections. Clim Dyn 43:2553–2568
Kamae Y, Shiogama H, Watanabe M, Ishii M, Ueda H, Kimoto M (2015) Recentslowdown of tropical upper tropospheric warming associated with Pacificclimate variability. Geophys Res Lett 42:2995–3003
Kamae Y, Yoshida K, Ueda H (2016) Sensitivity of Pliocene climate simulations inMRI-CGCM2.3 to respective boundary conditions. Clim Past 12:1619–1634
Kamae Y, Li X, Xie S-P, Ueda H (2017) Atlantic effects on recent decadal trends inglobal monsoon. Clim Dyn. doi:10.1007/s00382-017-3522-3
Kathayat G, Cheng H, Sinha A, Spötl C, Edwards RL, Zhang H, Li X, Yi L, Ning Y,Cai Y, Lui WL, Breitenbach SFM (2016) Indian monsoon variability onmillennial-orbital timescales. Sci Rep 6:24374
Kaufman DS, Schneider DP, McKay NP, Ammann CM, Bradley RS, Briffa KR, MillerGH, Otto-Bliesner BL, Overpeck JT, Vinther BM, Abbott M, Axford Y, Bird B,Birks HJB, Bjune AE, Briner J, Cook T, Chipman M, Francus P, Gajewski K,Geirsdóttir Á, Hu FS, Kutchko B, Lamoureux S, Loso M, Mac Donald G, PerosM, Porinchu D, Schiff C, Seppä H, Thomas E (2009) Recent warming reverseslong-term Arctic cooling. Science 325:1236–1239
Kawamura R (1998) A possible mechanism of the Asian summer monsoon-ENSOcoupling. J Meteorol Soc Jpn 76:1009–1027
Kitoh A, Motoi T, Murakami S (2007) El Niño-southern oscillation simulation at6000 years before present with the MRI-CGCM2.3: effect of flux adjustment. JClim 20:2484–2499
Kong W, Swenson L, Chiang J (2017) Seasonal transitions and the westerly jet in theHolocene east Asian summer monsoon. J Clim. doi:10.1175/JCLI-D-16-0087.1
Kutzbach JE, Liu XD, Liu ZY, Chen GS (2008) Simulating the evolution response ofglobal monsoons to orbital forcing over the past 280,000 years. Clim Dyn 30:567–579
Lean JL (2010) Cycles and trends in solar irradiance and climate. WIREs ClimChange 1:111–122
Li CF, Yanai M (1996) The onset and interannual variability of the Asian summermonsoon in relation to land-sea thermal contrast. J Clim 9:358–375
Liu J, Wang B, Ding Q, Kuang X, Soon W, Zorita E (2009) Centennial variations ofthe global monsoon precipitation in the last millennium: results from ECHO-G model. J Clim 22:2356–2371
Liu J, Wang B, Wang H, Kuang Z, Ti R (2011) Forced response of the east Asiansummer rainfall over the past millennium: results from a coupled modelsimulation. Clim Dyn 36:323–336
Liu F, Chai J, Wang B, Liu J, Zhang X, Wang Z (2016) Global monsoonprecipitation responses to large volcanic eruptions. Sci Rep 6:24331
Man W, Zhou T, Jungclaus JH (2012) Simulation of the east Asian summermonsoon during the last millennium with the MPI earth system model. JClim 25:7852–7866
Mann ME, Zhang Z, Rutherford S, Bradley RS, Hughes MK, Shindell D, Ammann C,Faluvegi G, Ni F (2009) Global signatures and dynamical origins of the littleice age and medieval climate anomaly. Science 326:1256–1260
Masson-Delmotte V, Schulz M, Abe-Ouchi A, Beer J, Ganopolski A, GonzálezRouco JF, Jansen E, Lambeck K, Luterbacher J, Naish T, Osborn T, Otto-Bliesner B, Quinn T, Ramesh R, Rojas M, Shao X, Timmermann A (2014)Information from Paleoclimate archives. In: Stocker TF et al (eds) Climatechange 2013: the physical science basis. Contribution of working group I tothe fifth assessment report of the intergovernmental panel on climatechange. Cambridge University Press, Cambridge, pp 383–464
Merlis TM, Schneider T, Bordoni S, Eisenman I (2013) The tropical precipitationresponse to orbital precession. J Clim 26:2010–2021
Kamae et al. Progress in Earth and Planetary Science (2017) 4:22 Page 11 of 13
Mikami T (2008) Climatic variation in Japan reconstructed from historicaldocuments. Weather 63:190–193
Miller GH, Geirsdóttir Á, Zhong Y, Larsen DJ, Otto-Bliesner BL, Holland MM, BaileyDA, Refsnider KA, Lehman SJ, Southon JR, Anderson C, Björnsson H,Thordarson T (2012) Abrupt onset of the little ice age triggered by volcanismand sustained by sea-ice/ocean feedbacks. Geophys Res Lett 39:L02708
Mohtadi M, Prange M, Steinke S (2016) Palaeoclimatic insights into forcing andresponse of monsoon rainfall. Nature 533:191–199
Oppo DW, Rosenthal Y, Linsley BK (2009) 2,000-year-long temperature andhydrology reconstructions from the indo-Pacific warm pool. Nature 460:1113–1116
Otto-Bliesner BL, Joussaume S, Braconnot P, Harrison SP, Abe-Ouchi A (2009)Modeling and data syntheses of past climates. EOS Trans AGU. doi:10.1029/2009EO110013
Otto-Bliesner B, Brady E, Fasullo J, Jahn A, Landrum L, Stevenson S, RosenbloomN, Mai A, Strand G (2016) Climate variability and change since 850 C.E.: anensemble approach with the community earth system model (CESM). BullAm Meteorol Soc 97:735–754
PAGES 2k Consortium (2013) Continental-scale temperature variability during thelast two millennia. Nat Geosci 6:339–346
Phipps SJ, McGregor HV, Gergis J, Gallant AJE, Neukom R, Stevenson S, AckerleyD, Brown JR, Fischer MJ, van Ommen TD (2013) Paleoclimate data–modelcomparison and the role of climate forcings over the past 1500 years. J Clim26:6915–6936
Polanski S, Fallah B, Befort DJ, Prasad S, Cubasch U (2014) Regional moisture changeover India during the past millennium: a comparison of multi-proxyreconstructions and climate model simulations. Glob Planet Change 122:176–185
Polson D, Bollasina M, Hegerl GC, Wilcox LJ (2014) Decreased monsoonprecipitation in the northern hemisphere due to anthropogenic aerosols.Geophys Res Lett 41:6023–6029
Qian W, Hu Q, Zhu Y, Lee D-K (2003) Centennial-scale dry–wet variations in EastAsia. Clim Dyn 21:77–89
Ren G, Zhang L (1996) Climate of the medieval warm period in Maili region asinferred from fossil pollen record (in Chinese). Clim Env Res 1:81–86
Rojas M, Arias PA, Flores-Aqueveque V, Seth A, Vuille M (2016) The southAmerican monsoon variability over the last millennium in climate models.Clim Past 12:1681–1691
Sachs JP, Sachse D, Smittenberg RH, Zhang Z, Battisti DS, Golubic (2009)Southward movement of the Pacific intertropical convergence zone AD1400-1850. Nat Geosci 2:519–525
Schmidt GA, Jungclaus JH, Ammann CM, Bard E, Braconnot P, Crowley TJ,Delaygue G, Joos F, Krivova NA, Muscheler R, Otto-Bliesner BL, Pongratz J,Shindell DT, Solanki SK, Steinhilber F, Vieira LEA (2011) Climate forcingreconstructions for use in PMIP simulations of the last millennium (v1.0).Geosci Model Dev 4:33–45
Schmidt GA, Jungclaus JH, Ammann CM, Bard E, Braconnot P, Crowley TJ,Delaygue G, Joos F, Krivova NA, Muscheler R, Otto-Bliesner BL, Pongratz J,Shindell DT, Solanki SK, Steinhilber F, Vieira LEA (2012) Climate forcingreconstructions for use in PMIP simulations of the last millennium (v1.1).Geosci Model Dev 5:185–191
Schneider T, Bischo T, Haug GH (2014) Migrations and dynamics of theintertropical convergence zone. Nature 513:45–53
Schurer AP, Hegerl GC, Mann ME, Tett SFB, Phipps SJ (2013) Separating forced fromchaotic climate variability over the past millennium. J Clim 26:6954–6973
Schurer AP, Tett SFB, Hegerl GC (2014) Small influences of solar variability onclimate over the past millennium. Nat Geosci 7:104–108
Sharma S, Magnuson JJ, Batt RD, Winslow JK, Aono Y (2016) Direct observationsof ice seasonality reveal changes in climate over the past 320–570 years. SciRep 6:25061
Shi Z (2016) Response of Asian summer monsoon duration to orbital forcingunder glacial and interglacial conditions: implication for precipitationvariability in geological records. Quat Sci Rev 139:30–42
Shi F, Li JP, Wilson RJS (2014) A tree-ring reconstruction of the south Asiansummer monsoon index over the past millennium. Sci Rep 4:6739
Shi Z, Xu T, Wang H (2016a) Sensitivity of Asian climate change to radiativeforcing during the last millennium in a multi-model analysis. Glob PlanetChange 139:195–210
Shi J, Yan Q, Jiang D, Min J, Jiang Y (2016b) Precipitation variation over easternChina and arid central Asia during the past millennium and its possiblemechanism: perspectives from PMIP3 experiments. J Geophys Res Atmos121:11989–12004
Sinha A, Berkelhammer M, Stott L, Mudelsee M, Cheng H, Biswas J (2011) Theleading mode of Indian summer monsoon precipitation variability during thelast millennium. Geophys Res Lett 38:L15703. doi:10.1029/2011gl047713
Sinha A, Kathayat G, Cheng H, Breitenbach SFM, Berkelhammer M, Mudelsee M,Biswas J, Edwards RL (2015) Trends and oscillations in the Indian summermonsoon rainfall over the last two millennia. Nat Commun 6:6309
Smerdon JE, Pollack HN (2016) Reconstructing Earth’s surface temperature overthe past 2000 years: the science behind the headlines. WIREs Clim Change 7:746–771
Steinhilber F, Beer J, Fröhlich C (2009) Total solar irradiance during the Holocene.Geophys Res Lett 36:L19704. doi:10.1029/2009GL040142
von Storch H, Cubasch U, Gonzalez-Rouco JF, Jones JM, Voss R, Widmann M,Zorita E (2000) Combining paleoclimatic eviedence and GCMs by means ofdata assimilation though upscaling and nudging (DATUN). In: Proc 11thsymposium on global climate change studies. AMS Long Beach, CA
Sueyoshi T, Ohgaito R, Yamamoto A, Chikamoto MO, Hajima T, Okajima H,Yoshimori M, Abe M, O’ishi R, Saito F, Watanabe S, Kawamiya M, Abe-OuchiA (2013) Set-up of the PMIP3 paleoclimate experiments conducted using anearth system model, MIROC-ESM. Geosci Model Dev 6:819–836
Takahashi K, Okuhara I, Tokumitsu Y, Yasue K (2011) Responses to climate by tree-ring widths and maximum latewood densities of two Abies species at upperand lower altitudinal distribution limits in central Japan. Trees 25:745–753
Takata K, Saito K, Yasunari T (2009) Changes in the Asian monsoon climateduring 1700–1850 induced by preindustrial cultivation. Proc Natl Acad Sci US A 106:9586–9589
Tan M (2007) Climatic differences and similarities between Indian and east Asianmonsoon regions of China over the last millennium: a perspective basedmainly on stalagmite records. Int J Speleol 36:75–81
Tao S, Chen L (1987) A review of recent research on the east Asian summermonsoon in China. In: Chang C-P, Krishnamurti TN (eds) Monsoonmeteorology. Oxford University Press, Oxford, pp 60–92
Taylor KE, Stouffer RJ, Meehl GA (2012) An overview of CMIP5 and theexperiment design. Bull Am Meteorol Soc 90:485–498
Ueda H, Iwai A, Kuwako K, Hori ME (2006) Impact of anthropogenic forcing onthe Asian summer monsoon as simulated by 8 GCMs. Geophys Res Lett 33:L06703. doi:10.1029/2005GL025336
Ueda H, Ohba M, Xie S-P (2009) Important factors for the development of theAsian-Northwest Pacific summer monsoon. J Clim 22:649–669
Ueda H, Kuroki H, Ohba M, Kamae Y (2011) Seasonally asymmetric transition ofthe Asian monsoon in response to ice age boundary conditions. Clim Dyn37:2167–2179
Vieira LEA, Solanki SK, Krivova NA, Usoskin I (2011) Evolution of the solarirradiance during the Holocene. Astr Astrophys 531:A6. doi:10.1051/0004-6361/201015843
Wang B, Lin H (2002) Rainy season of the Asian-Pacific summer monsoon.J Clim 15:386–398
Wang PK, Zhang D (1992) Recent studies of the reconstruction of east Asianmonsoon climate in the past using historical literature of China. J MeteorolSoc Jpn 70:423–446
Wang S, Gong D, Zhu J (2001) Twentieth-century climatic warming in China inthe context of the Holocene. The Holocene 11:313–321
Wang B, Wu Z, Li J, Liu J, Chang C-P, Ding Y, Wu G (2008) How to measure thestrength of the east Asian summer monsoon. J Clim 21:4449–4463
Webster PJ, Yang S (1992) Monsoon and ENSO: selectively interactive systems.Quart J Roy Meteorol Soc 118:877–926
Webster PJ, Magaña VO, Palmer TN, Shukla J, Tomas RA, Yanai M, Yasunari T(1998) Monsoons: processes, predictability, and the prospects for prediction.J Geophys Res 103(C7):14451–14510
Wu G, He B, Liu Y, Bao Q, Ren R (2015) Location and variation of thesummertime upper-troposphere temperature maximum over South Asia.Clim Dyn 45:2757–2774
Wu C-H, Lee S-Y, Chiang JCH, Hsu H-H (2016) The influence of obliquity in theearly Holocene Asian summer monsoon. Geophys Res Lett 43:4524–4530
Yan H, Sun L, Wang Y, Huang W, Qiu S, Yang C (2011) A record of the southernoscillation index for the past 2,000 years from precipitation proxies. NatGeosci 4:611–614
Yan H, Wei W, Soon W, An Z, Zhou W, Liu Z, Wang Y, Carter RM (2015) Dynamicsof the intertropical convergence zone over the western Pacific during thelittle ice age. Nat Geosci 8:315–320
Yanai M, Wu G-X (2006) Effects of the Tibetan plateau. In: Wang B (ed) The Asianmonsoon. Springer, Heidelberg, pp 513–549
Kamae et al. Progress in Earth and Planetary Science (2017) 4:22 Page 12 of 13

Yang K, Jiang D (2015) Interannual climate variability of the past millennium fromsimulations. Atmos Ocean Sci Lett 8:160–165
Yang K, Jiang D (2017) Interannual climate variability change during the medievalclimate anomaly and little ice age in PMIP3 last millennium simulations.Adv Atmos Sci 34:497–508
Yukimoto S, Noda A, Kitoh A, Hosaka M, Yoshimura H, Uchiyama T, Shibata K,Arakawa O, Kusunoki S (2006a) Present-day and climate sensitivity in themeteorological research institute coupled GCM version 2.3 (MRI-CGCM2.3).J Meteorol Soc Jpn 84:333–363
Yukimoto S, Noda A, Uchiyama T, Kusunoki S, Kitoh A (2006b) Climate changes ofthe twentieth through twenty-first centuries simulated by the MRI-CGCM2.3.Pap Meteorol Geophys 56:9–24
Zhang R, Cheng H, Lawrence Edwards R, Chen F, Wang Y, Yang X, Liu J, Tan M,Wang X, Liu J, An C, Dai Z, Zhou J, Zhang D, Jia J, Jin L, Johnson KR (2008)A test of climate, sun, and culture relationships from an 1810-year Chinesecave record. Science 322:940–942
Zhang P, Liu Y, He B (2016) Impact of east Asian summer monsoon heating onthe interannual variation of the south Asian high. J Clim 29:159–173
Kamae et al. Progress in Earth and Planetary Science (2017) 4:22 Page 13 of 13


![SST-precipitation relationship over the tropical monsoon region, … · 2013. 12. 10. · changing climate [Fig.6] SST-precipitation relationship over the tropical monsoon region,](https://img.pdfslide.us/doc/110x75/5fe7e6f1bbe97b2138439388/sst-precipitation-relationship-over-the-tropical-monsoon-region-2013-12-10.jpg)

![MIXED-LAYER CHARACTERISTICS AS RELATED TO THE MONSOON CLIMATE …repository.ias.ac.in/26617/1/342.pdf · THE MONSOON CLIMATE OF NEw DELHI, ]INDIA 215 The potential temperature profile](https://img.pdfslide.us/doc/110x75/5f302b94597d2c40d330f6f9/mixed-layer-characteristics-as-related-to-the-monsoon-climate-the-monsoon-climate.jpg)


![[PPT]PowerPoint Presentation - Climate Prediction · Web viewWorldwide Monsoons in 2008-09 1. Global monsoon features • Australian monsoon • South American monsoon • North American](https://img.pdfslide.us/doc/110x75/5aba45597f8b9a441d8b6e25/pptpowerpoint-presentation-climate-prediction-viewworldwide-monsoons-in-2008-09.jpg)