Embed Size (px)
Citation preview

Seasonal Energy and Nutrient Flows Grade Band: 5-8 Green and Health School Focus Area(s): Energy, Health & Wellness, School Site Possible subject areas addressed by lesson: Mathematics, Science, Social Studies Emma Adams, Riley Gaines, Rachel Loomis

2
Content: 1. Aquatic Stratification: 30 minutes, p 3-7
a. Learning Outcomes:
i. Students will be able to model lake stratification
ii. Student will be able to identify the stratified layers of a lake
iii. Students will be able to define density
2. Terrestrial Season Energy and Nutrient Flow: 30 minutes p 8-15 a. Learning Outcomes
i. Students will be able to discuss the flow of energy and nutrients in an ecosystem by completing the assessment questions.
ii. Students will be able create a food web diagram, representing the energy and nutrient flow within an ecosystem.
iii. Students will be able to demonstrate through activity modifications on how seasons can affect the energy and nutrient flow, and show relationship between animals and humans.
3. Orchard Bioaccumulation p 16-21 a. Learning Outcomes
i. Students will be able to model bioaccumulation of toxins and heavy metals in the environment
ii. Students will be able to explain the history of bald eagles and their connection with DDT.
4. Appendices: p 22
3
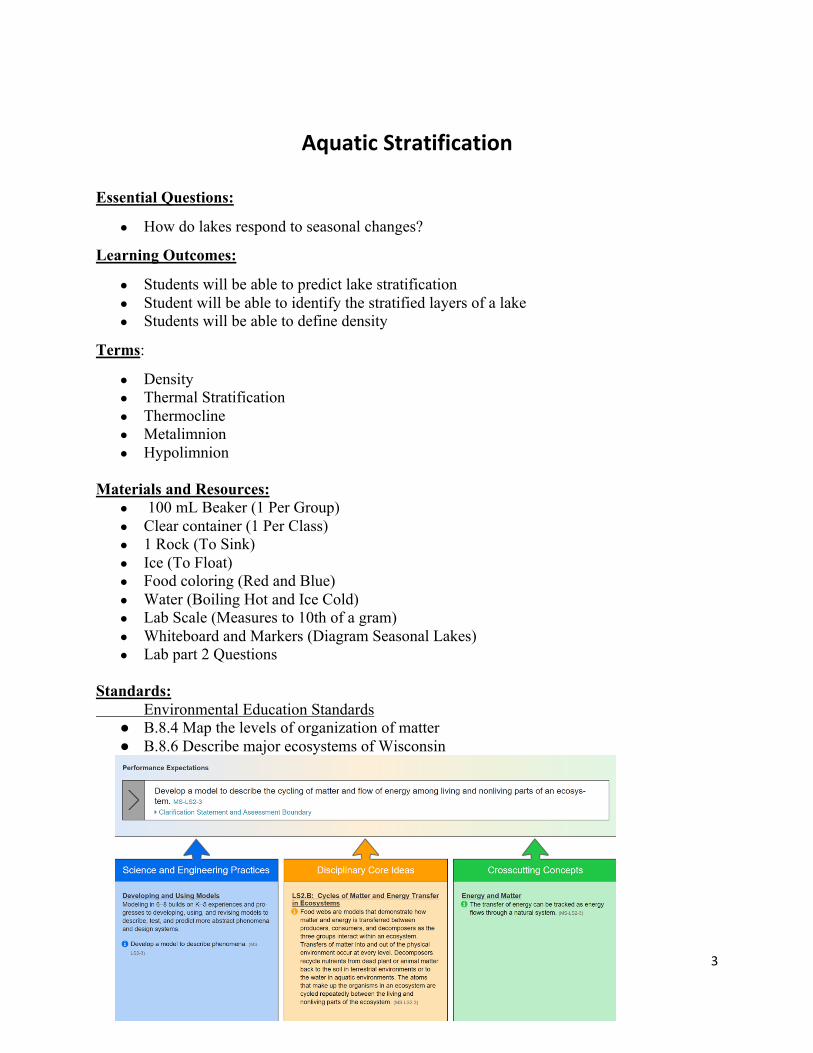
AquaticStratification Essential Questions:
● How do lakes respond to seasonal changes?
Learning Outcomes:
● Students will be able to predict lake stratification● Student will be able to identify the stratified layers of a lake● Students will be able to define density
Terms:
● Density● Thermal Stratification● Thermocline● Metalimnion● Hypolimnion
Materials and Resources:
● 100 mL Beaker (1 Per Group)● Clear container (1 Per Class)● 1 Rock (To Sink)● Ice (To Float)● Food coloring (Red and Blue)● Water (Boiling Hot and Ice Cold)● Lab Scale (Measures to 10th of a gram)● Whiteboard and Markers (Diagram Seasonal Lakes)● Lab part 2 Questions
Standards: Environmental Education Standards ● B.8.4 Map the levels of organization of matter● B.8.6 Describe major ecosystems of Wisconsin
4
Background:
Many lakes respond to seasonal changes underneath the water and out of sight. If you
were to measure the temperature of a lake during the summer, you would find that as you go
deeper the temperature will decrease. Swimming can experience this downward in a lake. At
some depth you would find a dramatic decrease in temperature, the depth at which this change
takes place is called the thermocline. Above the thermocline is the warmer temperature
epilimnion. Below the thermocline is the colder hypolimnion. This layering of the water based
on temperature differences is called thermal stratification. The reason temperature causes
thermal stratification is because water at different temperatures has different density. Density is a
measurement of mass within a volume (Gunther & Trotter, 2011). Cold water is more dense than
warm water. The densest water is found at 39.2°F (4°C). Notice that water doesn’t freeze until
32°F (0°C). Ice is less dense than the surrounding water which is why it floats on top of the
water in winter lakes.
During the summer, when lakes are free of ice, the warmest water is found at the surface
and cooler temperatures are found as you go deeper in depth. In the winter time, when ice is
present, the cold ice sits on top of the denser yet slightly warmer water beneath it. In-between
seasons, fall and spring, are when most lakes will turnover (Gunther & Trotter, 2011). In the fall
the water at the surface is cooled to a temperature that is denser than the water below it. This
change in density caused the surface water to mix with the water at the bottom of the lake. In the
spring warming water reaches its densest point (39.2°F) where it then mixes with the water at the
bottom. Water will mix in both seasons until the density is relatively even across the lake. The
cycle of lake turnover is important for a lake’s health to provide the bottom with dissolved
oxygen and the top with nutrients (Sisinyak, 2014).
Procedure:
Opening/POW:
Connect to student experience with swimming, fishing, diving, or other recreational activities in lakes. Ask them to share stories. (Social)
Has anyone ever challenged a friend to dive deepest in a lake? What was the feeling as you got deeper?

5
Why does ice float on top of water (drop ice in Tupperware) when objects like rocks or sand sink (drop rock in Tupperware)?
If you ever experienced either of these before, you know we will be talking about the reasons behind these phenomena, lake stratification. Point out that water, ice, and rock are all related to density.
Activity:
Part 1: Measuring Water Density at Different Temperatures
Provide students with water at two different temperatures. More extreme difference will make the math and difference of water density easier to calculate.
1. Record mass of an empty 100 mL beaker (Students take turns measuring and record data on whiteboard)
2. Fill beaker with cold water 3. Record mass of filled cold water beaker 4. Empty beaker and replace with hot water 5. Record mass of filled hot water beaker 6. Subtract filled mass of filled beakers to empty beaker
Have students regroup and prepare for group discussion. Discuss data on board, trends, and reasons for patterns.
● Which water was denser? Why?● What kind of error does this lab have?● How does this relate to the rock and the ice cube?
Part 2: Predict Pattern and Mix Water
Have students predict what would happen if the warm and cold water were to be combined.
● Will the waters mix together?● Which water will be on top? Why?
Then use food dye to color the hot water red and the cold water blue. Have students move to the front of the classroom and observe mixing of hot and cold water in the large clear Tupperware container.
First pour blue cold water into the large Tupperware container.
Then slowly pour red hot water into the large Tupperware container, this works best if the water is poured on side wall of the container or over a spoon.
● What happened? Why?

6
● How does this relate to your swimming experiences? (Connect to specific student experiences)
On whiteboard diagram a lake with the layers seen in the Tupperware container.
Draw on the whiteboard a quick sketch of a lake. Draw the summer layers, Epilimnion, Thermocline and Hypolimnion. Explain that in the summer lakes have different temperature layers.
● Due to density the warmer water would be at which layer? Top or Epilimnion ● Colder water would be on which layer. Bottom or Hypolimnion
Then draw another quick sketch of a winter lake. Ice layer on top and Thermocline below and rest of the water is the same temperature. Now is there a problem with ice being on top? Does that make sense? Ice, even though it is the coldest, floats on top of the water. This is because ice or solid water is less dense than liquid water.
Next explain that during the Spring and Fall these layers switch called turnover.
Assessment:
Hand out 5 questions to each group and have them discuss and answer together.
● Why in the summer do lakes stratify? Density● Why do they turn over in spring and fall? Densities become equal
7
● Which layer is densest? Hypolimnion● Which layer do you think you have reached diving into, or swam in?Which layer would
the fish like to live in the winter? Why? Right below the ice because it is the warmest.
Differentiation:
This lesson has many dimensions that make it useful for a variety of learners. Much of the lesson is tactile and can be adapted by using more physical senses. This could also be done through the incorporation of audio materials such as sound effects involving cracking ice and running water. These changes can make the lesson more accessible for more learners.
References: Gunther, T., & Trotter, M. (2011, November 16). Lake Turnover. Retrieved from National
Geographic: https://www.nationalgeographic.org/media/lake-turnover/
Sisinyak, N. (2014, May). Lake Turnover How Sinking Water Rejuvenates Alaska Lakes. Retrieved from Alaska Department of Fish and Game: http://www.adfg.alaska.gov/index.cfm?adfg=wildlifenews.view_article&articles_id=661

8
Terrestrial:SeasonEnergyandNutrientFlow
Essential Questions:
● What are Trophic levels and who or what are in each level?● What challenges do animals face to retain energy throughout different seasons?
Learning Outcomes: ● Students will be able to discuss the flow of energy and nutrients in an ecosystem.● Students will be able to create a food web diagram, representing the energy and nutrient
flow within an ecosystem.● Students will be able to demonstrate how seasons can affect the energy and nutrient flow,
and show relationship between animals and humans.
Materials & Resources:
Activity Materials:
● Water source (i.e. school hose) ● Buckets filled with water (1 bucket for each group)● Empty Buckets (1 bucket for each group. Recommend paint buckets)● Consistent length for distance from students to empty bucket (suggestion of 50 feet) ● Small/medium sized, reusable, non-breakable cup, or bowl (i.e. red solo cup or larger
cooking/mixing bowl for more of a challenge, as it is heavier to carry).
Assessment Materials:
● Assessment questions (provided) ● Food Web Assessment directions and outline (provided) ● Sturdy paper plate for each student ● String to represent web (1 piece of string for each student)● Trophic level examples (words or pictures – provided) ● Glue, scissors, hole punches

9
Standards:
B.8.8 Explain interactions among organisms or population of organisms
Background:
Ecosystems maintain themselves by cycling energy and nutrients obtained from external
sources. Can you think of animals and plants that it would take to complete a full nutrient and
energy cycle?
About 10% of energy production at a single trophic level is passed out to the next level.
Meaning, 90% of that energy production is lost. Growth and reproduction, respiration,
organisms that die BUT are not eaten by consumers are all ways that energy transferred
between those trophic levels are reduced. But, it’s not just about what’s taken out, it’s also
about what’s taken in. The quality of nutrition that is taken in, or consumed, is a large
influence on how energy is transferred, and how efficiently the energy is transferred, too.
10
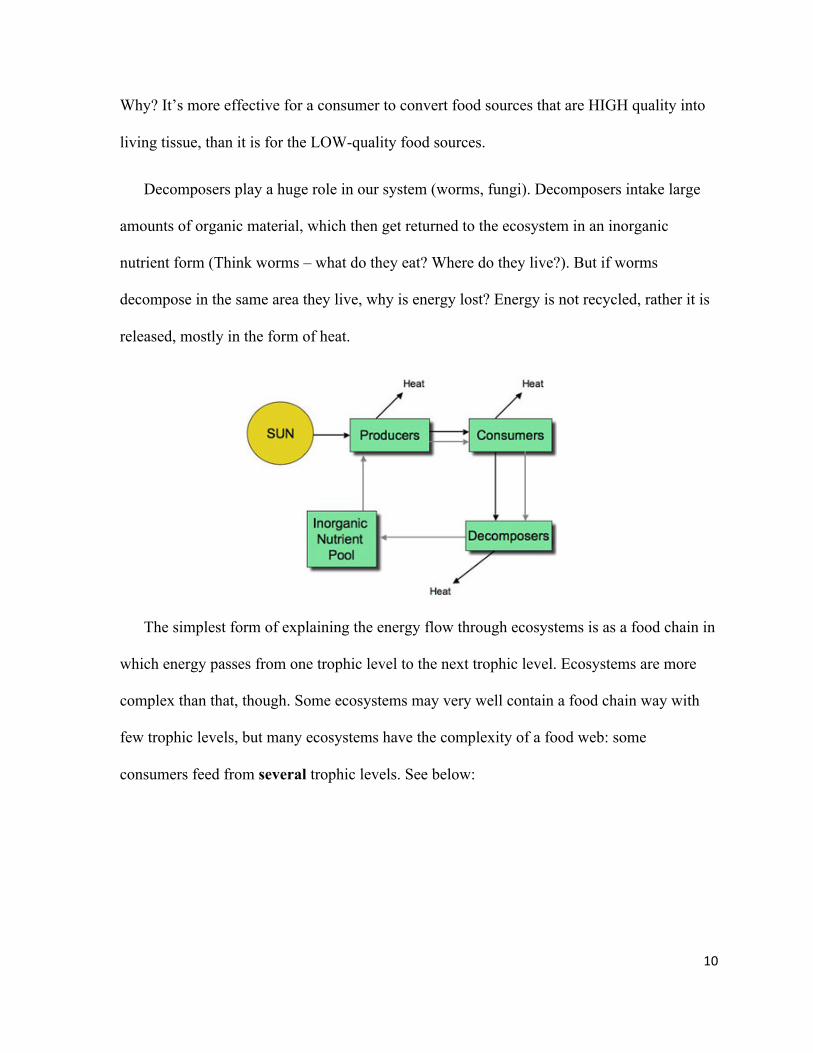
Why? It’s more effective for a consumer to convert food sources that are HIGH quality into
living tissue, than it is for the LOW-quality food sources.
Decomposers play a huge role in our system (worms, fungi). Decomposers intake large
amounts of organic material, which then get returned to the ecosystem in an inorganic
nutrient form (Think worms – what do they eat? Where do they live?). But if worms
decompose in the same area they live, why is energy lost? Energy is not recycled, rather it is
released, mostly in the form of heat.
The simplest form of explaining the energy flow through ecosystems is as a food chain in
which energy passes from one trophic level to the next trophic level. Ecosystems are more
complex than that, though. Some ecosystems may very well contain a food chain way with
few trophic levels, but many ecosystems have the complexity of a food web: some
consumers feed from several trophic levels. See below:

11
Procedure:
POW:
1. Explain to students we will be learning more about the energy flow and nutrient flow.
2. Relate lesson to students: Where do we, as humans, get our energy from? Food! So where does food come from?
a. Students may say the store, but dig deeper than that! Where we get energy from is related through and in each other.
b. Openly discuss with class:Where does the cow get their food? (Grass) Where does the grass get nutrients to grow? (Sun).
c. Continue open discussion: When we, as humans, or animals intake food, how does our body respond? (Relate to students: When we’re hungry, is it easy to focus on school work or is it harder to focus? It’s harder! Our body needs energy and we get some of our energy from food.)
*Teacher note: If you use the modification to activity #2 with markers, this will relate to activity later on.
d. Continue open discussion: What happens when an animal dies or a tree knocks down in the forest? (They decompose back into the ground, where the cycle begins again).
e. Once students feel comfortable with this concept, continue onto lesson.
3. Review with students, food webs and trophic levels (energy levels). Below are examples of a food web or trophic level.
Example: a. Sun b. Producer (ie: Plants) c. Primary Consumer: Herbivores & Carnivores (ie: Grasshopper) d. Secondary Consumer (ie: Mouse)

12
e. Tertiary Consumer: (ie: Snake) f. Quaternary Consumers (ie: Hawk) g. Decomposers (ie: fungi, insects)
Example:
4. Continue open discussion: Does it take more or less work for energy to transfer? More Why? Think about it – the more work you do, the more energy you use. *Teacher note: If you use modification to activity #4 with apparel, this will relate to activity later on.
5. Continue open discussion: What challenges do you think animals, and even humans, have in getting energy? For example, does getting energy and saving energy change from season to season? Why? (Allow students to think individually and/or discuss amongst peers what challenges we as humans (or animals) face from season to season - Spring vs. Summer vs. Fall vs. Winter)

13
Activity:
Prep your outdoor pace:
- 2 buckets per team - 1 bucket per team placed at starting point filled with water (all with same amount of water) - 1 bucket placed at ending point. Bucket is empty. - Each team must have their “energy cup”. This will be used for teams to transfer water from start to end points. This cup/bowl should be placed in the starting point bucket. - Any items needed for modifications - Line starting buckets up spaced apart, all at same starting line. Do the same for the end buckets.
Activity with Students:
1. Divide students into evenly numbered groups. Recommendation = 4 groups. 2. Let students know how much water is in the starting bucket (i.e.: 4 gallons) 3. Have all students line up behind the starting point bucket. *Note: Remember to include any modifications for subsequent rounds prior to beginning activity (see below). 4. Like a relay, one-by-one, students will scoop water from bucket in their “energy cup” and transfer water to empty bucket at their team’s ending point bucket. 5. As first team member completes, team member #1 must drop bowl back into starting bucket, where then team member #2 may begin to scoop water into their “energy cup” to continue activity. 5. At end of activity, have students measure how much water they were able to collect in their end bucket. Allow students to calculate how much water they lost, or did not even get to.
*Note: Always, if possible, first perform activity without any modifications to show students a comparison from activity vs. activity with modifications. It is suggested to allow students to perform activity the first time without providing them information that modifications will be made after the “first round”. If possible, allow students to complete activity with one (or more) modifications.
14
Modifications: Bandanas, Markers (i.e.: poker chips), Communication, and Apparel for adaptations (representing energy loss)
1. Bandanas: Group 1: no bandana Group 2: bandana around eyes – get verbal guidance from group Group 3: 1 arm behind back Group 4: Hop on 1 leg
2. Markers: Use markers to represent calorie intake. ● Option 1: Place the different colored markers spread out around area, but Team 1
can only collect their marker (aka calorie) to whatever color they are assigned. (i.e.: Team 1 can only collect green calories, Team 2 can only collect blue markers, so on and so forth). Teams are only allowed to collect 1 calorie/marker with each trip to and from buckets.
● Option 2: Groups can only collect certain markers to reach goal of 100 points*You may use poker chips, for example, for your markers. Colors = represent certain amount of points (i.e. Red = 50, Blue = 10, White = 5, Green = 1)
3. Communication: ● Let students know they are not allowed to talk/cheer/guide their teammates
throughout the first round. No communication.● After the first round, all students get their cup in the bucket. Let the teams re-
group and see what they can do better to improve. Continue to second round to observe any improvements.
● Can be done in reverse order as well.
4. Apparel: ● Have a group(s) dress up in winter clothes. This will create challenge to represent
seasonal energy flow. (i.e. Hat, gloves, snow pants, snow jacket, scarf)
5. Obstacle Course: ● Create an obstacle course that students must go through before getting water to
bucket (i.e. jumping in and out of a hula hoop 6 times, going back and forth 2 times from start 2 times vs. just 1, spinning in a circle 3 times, etc.).

15
Assessment: 1. Use Assessment Questions document (provided) to debrief this activity. You may can
complete the Assessment Questions as a class, as team groups, or for the students individually. The Assessment Question document can also be a take home assignment for your students.
Question 1: Water represented energy in activity Question 2: Challenges they found with getting water from beginning to end bucket. Question 3: Modifications (seasonal adaptations with the clothing or markers for competition with other species) Question 4: Challenges Question 5: What could have the team done better
2. Use Food Web Assessment to allow students (individually) to create food web out of provided materials by teacher (refer to assessment materials: paper plate, string, glue, scissors/hole puncher). Allow students to create own food web without much guidance, unless needed. Students may make mistakes or have questions which may lead to further class discussion. The Food Web Assessment can also be a take home assignment for your students.
Differentiation: ● Please keep in mind this activity, with modifications, might already be present in students
(i.e. students with disabilities and/or barriers). Please review modifications and select ones that will apply best to your classroom.
● Water is part of the lesson, so we recommend doing this activity outside, as you may have students spilling water on ground surface or themselves. You may also want to remind students to bring extra clothing to school the day completing this lesson.
● Groups of 4 are recommended. Depending on time and class size, each group should be between 5 (at minimum) to 10 (at maximum) people. If you need to adjust number of groups and/or number of people per group, please do so. Be cautious to how much more activity materials you would need.
References:
Annenberg Foundation. (2017). Unit 4: Ecosystems // Section 3: Energy Flow Through Ecosystems. The Habitable Planet. Retrieved from https://www.learner.org/courses/envsci/unit/text.php?unit=4&secNum=3
Association of Fish and Wildlife Agencies. (2017) Project Wild: K-12 Curriculum & Activity Guide. P 105-109.
Warren County Schools. Energy Flow Through Ecosystems. Energy Flow Through Ecosystems Lesson Plan. Retrieved from http://www.warrencountyschools.org/userfiles/3394/Classes/159806/water%20race%20teacher%20guide.pdf?id=572323
16
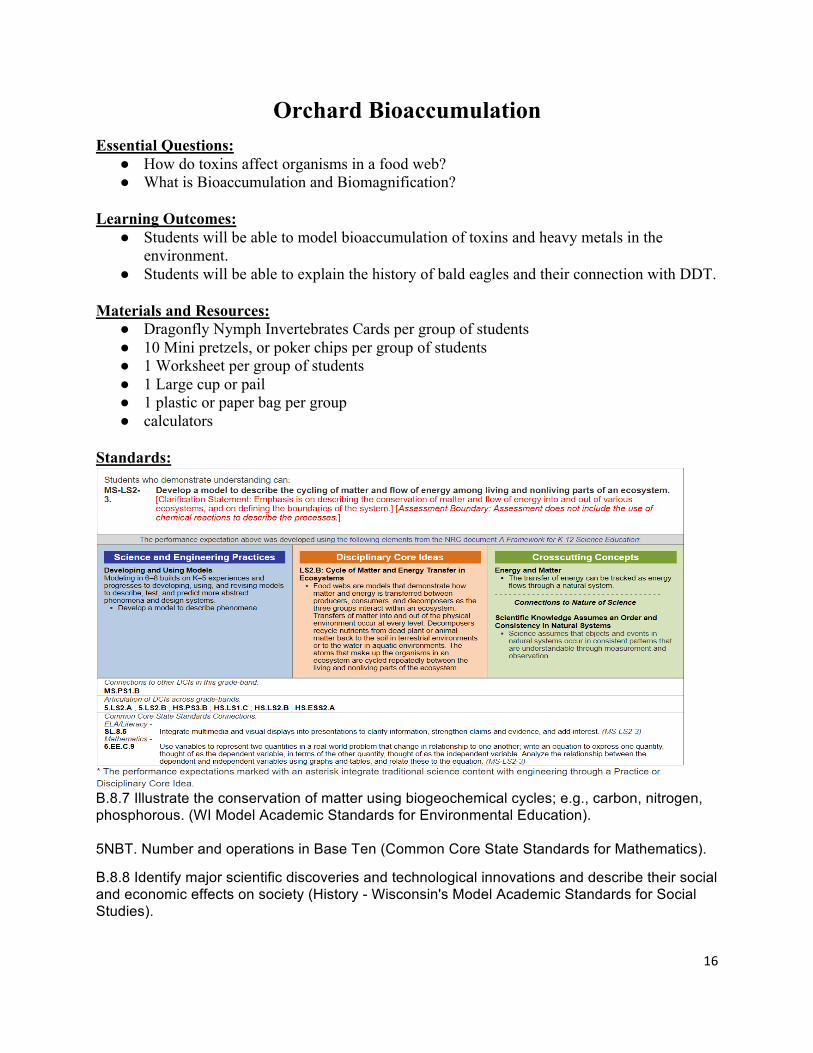
Orchard Bioaccumulation Essential Questions: ● How do toxins affect organisms in a food web?● What is Bioaccumulation and Biomagnification?
Learning Outcomes: ● Students will be able to model bioaccumulation of toxins and heavy metals in the
environment. ● Students will be able to explain the history of bald eagles and their connection with DDT.
Materials and Resources: ● Dragonfly Nymph Invertebrates Cards per group of students● 10 Mini pretzels, or poker chips per group of students● 1 Worksheet per group of students● 1 Large cup or pail● 1 plastic or paper bag per group● calculators
Standards:
B.8.7 Illustrate the conservation of matter using biogeochemical cycles; e.g., carbon, nitrogen, phosphorous. (WI Model Academic Standards for Environmental Education). 5NBT. Number and operations in Base Ten (Common Core State Standards for Mathematics).
B.8.8 Identify major scientific discoveries and technological innovations and describe their social and economic effects on society (History - Wisconsin's Model Academic Standards for Social Studies).

17
Background:
Bald eagle populations had started to dramatically decline due to loss of habitat and
killing of raptors to protect domestic livestock. In the 1940s, Congress passed the Bald Eagle
Protection Act. However, after WWII a new threat came into play DDT, or
Dichlorodiphenyltrichloroethane. This pesticide was a common household item. Parents sprayed
this into their children's hair. It was used in agriculture and home landscaping. Bald eagles ate
food contaminated by DDT and, as a result, their eggshells became thin and broke before a new
bird could hatch. This increasingly hurt their numbers.
By 1963, only 487 nesting pairs of bald eagles were left in the United States. In 1967, the
species were listed as an endangered species. In 1972, the EPA banned the use of DDT in
response to Rachel Carson’s book Silent Spring that revealed the misuse and devastation of DDT
and other pesticides. Soon bald eagle numbers rose and were removed from the threatened and
endangered list in 1999. For more information visit US Fish and Wildlife Service “Fact Sheet:
Natural History, Ecology, and History of Recovery”
(https://www.fws.gov/midwest/eagle/recovery/biologue.html)
Since the banning of DDT, other chemicals have taken its place as a health concern, for
humans and animals. One concern for many Americans is the mercury in the fish that we eat.
Mercury, in the past, was used for a variety of reasons from cosmetics to making hats. Mercury
can interfere with brain development and can be harmful to children and pregnant women. The
main cause of mercury exposure in America is from eating contaminated fish. Due to
biomagnification, predatory fish like tuna have a higher concentration. The EPA has
recommended amounts of certain fish and amounts that are healthy for consumption. For more
information visit NRDC mercury guide (https://www.nrdc.org/stories/mercury-guide).
For a guide of what fish to eat check out these resources:
● https://www.nrdc.org/sites/default/files/walletcard.pdf
● http://safinacenter.org/documents/2016/09/mercury-in-seafood-guide-health-care-
web.pdf
● https://www.sierrafund.org/fish-mercury-brochure/

18
Bioaccumulation-increase in concentration of a pollutant from the environment to the first
organism in a food chain.
Biomagnification- increase in concentration of a pollutant from one link in a food chain to
another.
These pollutants take a very long time to break down or have large half-lives. DDT, for example, has a 15-year half-life. Other examples include PCB (polychlorinated biphenyls), PAH polynuclear aromatic hydrocarbons), heavy metals like mercury copper and zinc, cyanide, and selenium. All of these have large half-lives and can live within organisms and the food web for years. As one moves up each trophic level, the concentration of pollutants increases. See below graphic, and for more information look at Mader (1997).
(https://environmentalpolltoday.wordpress.com/)

19
Procedure: Prep your classroom:
Split the room up into three sections 1. The Apple Orchard 2. The middle of the River and 3. The
lake. The River runs through the orchard into the lake.
● On the one side of the classroom, apple orchard, place a large bag of pretzels out or
around the floor
● In the middle, the river, place one plastic bag per group
● In the End, the lake, place one large cup or pail
With the students:
1. Explain the story of DDT, Bald Eagles, and Rachel Carson.
2. Explain Bioaccumulation that occurs in a food chain.
3. Share the simple food chain of Sediments, Invertebrates, Fish, to Eagle (See p 22). Be
sure to mention how this is a simplified version of the food web for the activity.
4. Split the students into groups of 3 or 4 and give each student or group of 3-4 students a
set of Invertebrate cards (p 27) and a “Studying Bald Eagles” worksheet (p 21-26).
5. Each group will then have 10 invertebrates and 10 pretzels to help answer question 1-2.
Encourage students to move around the classroom to collect the needed supplies. When
the students are making calculations, encourage them to not count the pretzels at first, and
then let them if they are not sure what math to use.
6. When the students make it downstream to the plastic fish bags, they will place all 10 of
their pretzels in the fish bag. They then will answer question 3. Gather the class' attention
while working on question 3. Students may remain where they are working. Either
Review or teach Scientific notation.
1. Scientific Notation is written as # X 10#
2. The first number must be larger than zero and smaller than 10.
3. The number that 10 is raised to, is how many places the decimal must move to
make the first number a single digit.
7. The last step is having each group put their fish stomach bag into the eagle’s cup. The
eagle on the handout must eat 10 fish bags, if your class does not have 10 student groups

20
prepare the needed extra bags to have on hand. Then answer questions 4-9, and the
conclusion.
8. Discuss some of the answers on the worksheet, have a student share some of their ideas
on the conclusion.
9. Discuss how there are other toxins, not just DDT, that can affect animals. One such is
Mercury and this one can be dangerous to Humans.
10. Share with the students resources to purchase the right fish and make healthy choices.
For a guide of what fish to eat check out these resources:
● https://www.nrdc.org/sites/default/files/walletcard.pdf
● http://safinacenter.org/documents/2016/09/mercury-in-seafood-guide-health-care-
web.pdf
● https://www.sierrafund.org/fish-mercury-brochure/
Assessment:
Collect the Studying Bald Eagles worksheet from the groups. Look for points about eagle’s life
cycle, DDT, bioaccumulation, and food webs or chains.
Differentiation:
This activity uses math to solve for concentration of toxins. It visually represents increasing
concentration by increasing the number of pretzels. This activity can also be done at a desk or
table for less mobile learners or adapted for a gymnasium, hallway, or outdoor setting, for a more
active group. If your school has a lake, pond, or other water system, it would be wonderful to use
that space to solidify understanding.

21
References:
Activity Idea from Polar TREC learning Resources, Bioaccumulation of Toxins Retrieved from
https://www.polartrec.com/files/resources/lesson/10856/docs/bioaccumulation_toxins_final_1.pd
f
Menon S. (2016). Mercury Guide. NRD. Retrieved from https://www.nrdc.org/stories/mercury-
guide.
U.S. Fish and Wildlife Service. (2007). Fact Sheet: Natural History, Ecology, and History of
Recovery. Bald Eagle. Retrieved from
https://www.fws.gov/midwest/eagle/recovery/biologue.html.
Mader, Sylvia S. 1996. Biology -5th Ed. WCB and Cox, G.W. 1997. Conservation Biology - 2nd
ed. WCB. Retrieved from (http://w3.marietta.edu/~biol/102/2bioma95.html)

22
Appendices
ContentsTerrestrialActivityAssessment p23-25
ChesapeakeBayWaterbirdFoodChain p26
AppleOrchardFoodchain p27
StudyingBaldEagles p28-31
DragonflyNymphInvertcards p32
23
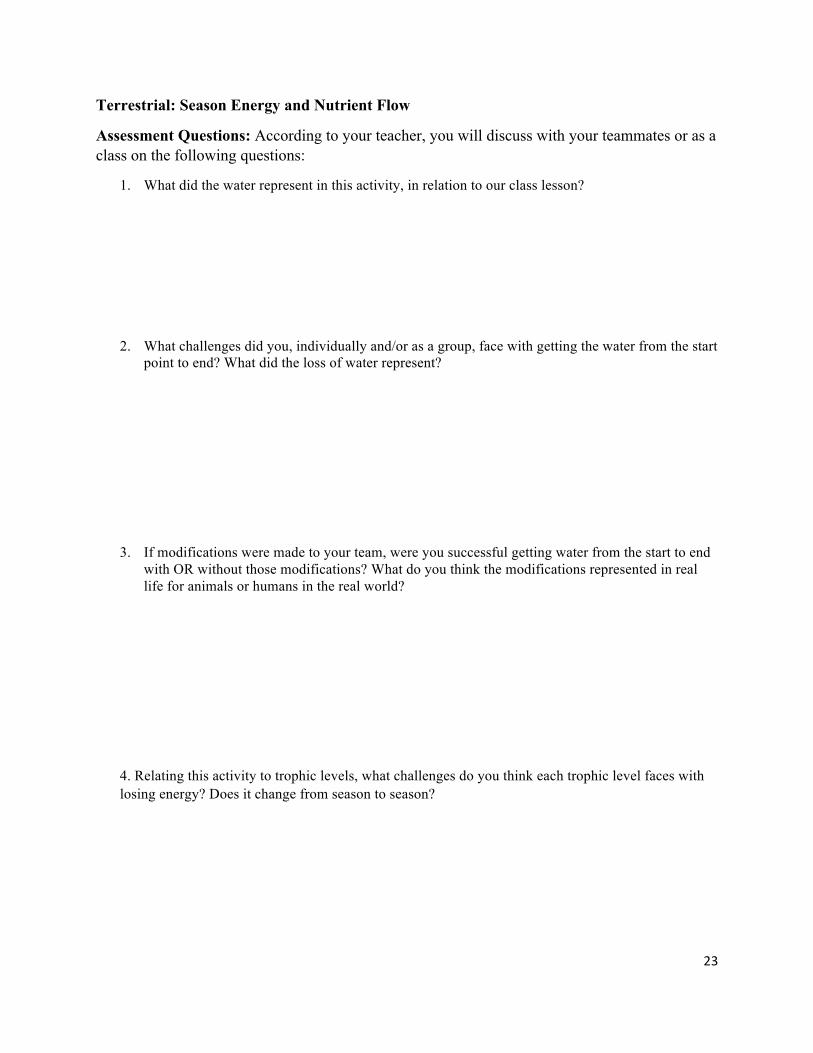
Terrestrial: Season Energy and Nutrient Flow
Assessment Questions: According to your teacher, you will discuss with your teammates or as a class on the following questions:
1. What did the water represent in this activity, in relation to our class lesson?
2. What challenges did you, individually and/or as a group, face with getting the water from the start point to end? What did the loss of water represent?
3. If modifications were made to your team, were you successful getting water from the start to end with OR without those modifications? What do you think the modifications represented in real life for animals or humans in the real world?
4. Relating this activity to trophic levels, what challenges do you think each trophic level faces with losing energy? Does it change from season to season?

24
5. What could your team have done to successfully to get more water to your end bucket?
6. Any other observations/comments:
25
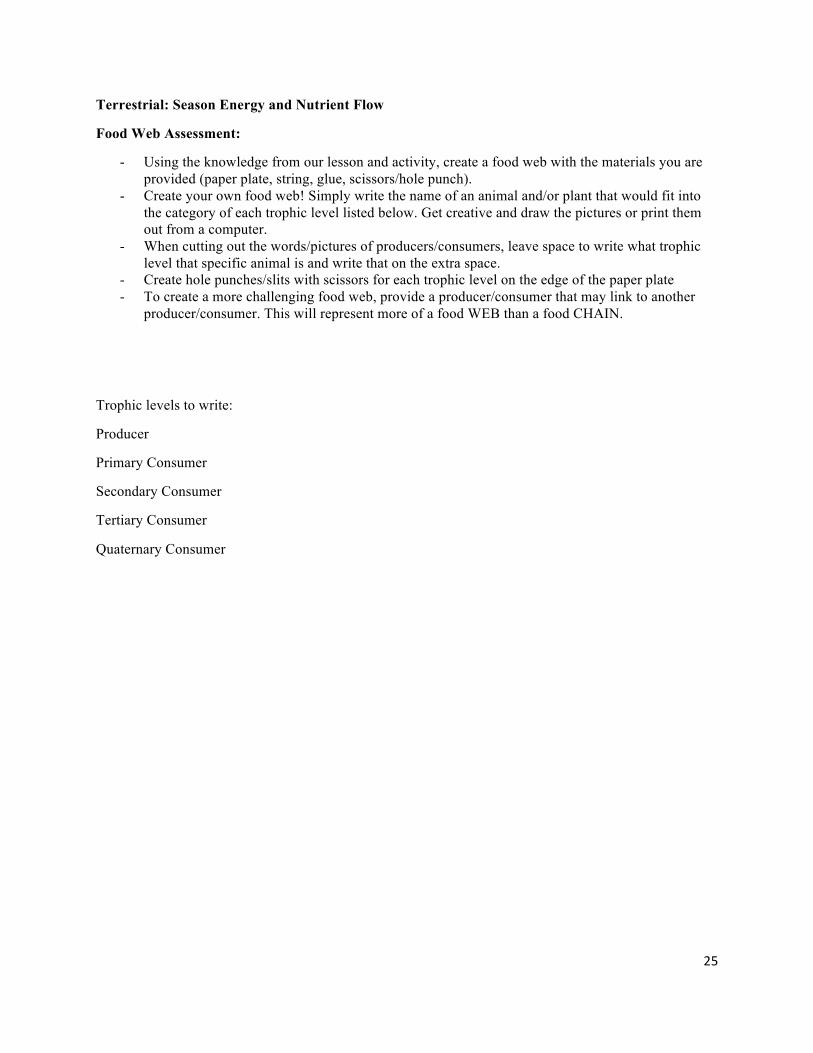
Terrestrial: Season Energy and Nutrient Flow
Food Web Assessment:
- Using the knowledge from our lesson and activity, create a food web with the materials you are provided (paper plate, string, glue, scissors/hole punch).
- Create your own food web! Simply write the name of an animal and/or plant that would fit into the category of each trophic level listed below. Get creative and draw the pictures or print them out from a computer.
- When cutting out the words/pictures of producers/consumers, leave space to write what trophic level that specific animal is and write that on the extra space.
- Create hole punches/slits with scissors for each trophic level on the edge of the paper plate- To create a more challenging food web, provide a producer/consumer that may link to another
producer/consumer. This will represent more of a food WEB than a food CHAIN.
Trophic levels to write:
Producer
Primary Consumer
Secondary Consumer
Tertiary Consumer
Quaternary Consumer

26

27

28
Studying Bald Eagles Name___________________
Group number____________ You are all scientists trying to figure out why bald eagle’s eggs are thinning. You decide to look at what they eat and trace the start of the chain to here at [You school’s Name] Apple orchard, this orchard has a beautiful river [your mascot] river running through it. Start your investigation at the river looking at the amount of toxins the invertebrates ingest. You know that the orchard sprays the apples and that the toxins get into the soil and water that the invertebrates ingest. One pretzel/ chip represents one concentration of DDT. Analysis: You are fortunate enough to collect 10 invertebrates along the river. When you take them back to the lab, you find that the invertebrates have ingested 10 pretzels. (Grab one pretzel for each Invertebrate)
1. What is the DDT concentration in the invertebrates?
2. How might have the invertebrates ingested the toxins?
Continue downstream to the mouth of the river and Lake. Here, fish eat the invertebrates. One of these fish eats 10 invertebrates. (Place all the pretzels into the bag or fish's stomach). 1. What is the DDT concentration in the Fish? Write in scientific notation.
The fish then swim around looking for some more invertebrates to eat when a Bald eagle swoops down and eats up your fish. The Eagle then swoops down and eats 9 more fish, a total of 10. Now place all your fish’s pretzels in the large eagle’s stomach, and wait for it to eat the other group’s fish as well. 1. What is the DDT concentration in the Eagle? Write in scientific notation.
29
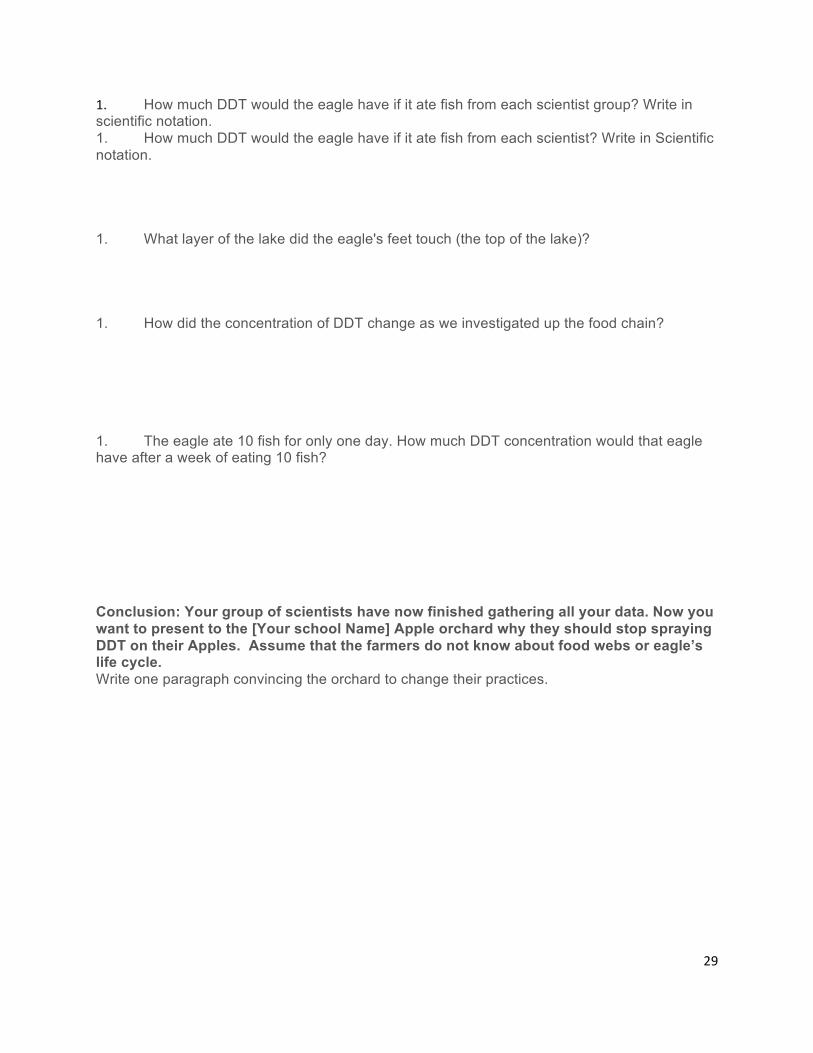
1. How much DDT would the eagle have if it ate fish from each scientist group? Write in scientific notation.1. How much DDT would the eagle have if it ate fish from each scientist? Write in Scientific notation. 1. What layer of the lake did the eagle's feet touch (the top of the lake)? 1. How did the concentration of DDT change as we investigated up the food chain? 1. The eagle ate 10 fish for only one day. How much DDT concentration would that eagle have after a week of eating 10 fish?
Conclusion: Your group of scientists have now finished gathering all your data. Now you want to present to the [Your school Name] Apple orchard why they should stop spraying DDT on their Apples. Assume that the farmers do not know about food webs or eagle’s life cycle. Write one paragraph convincing the orchard to change their practices.

30
Studying Bald Eagles
Name___________________ Group number____________
You are all scientists trying to figure out why bald eagle’s eggs are thinning. You decide to look at what they eat and trace the start of the chain to here at [You school’s Name] Apple orchard, this orchard has a beautiful river [your mascot] river running through it. Start your investigation at in the river looking at the amount of toxins the invertebrates ingest. You know that the orchard sprays the apples and that the toxins get into the soil and water that the invertebrates ingest. One Pretzel represents one concentration of DDT. Analysis: You are fortunate enough to collect 10 invertebrates along the river. When you take them back to the lab, you find that the invertebrates have ingested 10 pretzels.
1. What is the DDT concentration in the invertebrates? a. 10x10 = 100 or 10^2
2. How might of the invertebrates ingested the toxins?
a. The invertebrates ingest DDT through eating zooplankton or phytoplankton that have absorbed the toxin from sediment or soils.
Continue downstream to the mouth of the river and Lake. Here fist eat the invertebrates. One of these fish eats 10 invertebrates. Place all the pretzels into the bag or fish's stomach.
3. What is the DDT concentration in the Fish? Write in scientific notation. a. 100x10=1000 or 10^3 The fish then Swim around looking for some more invertebrates to eat when a Bald eagle swoop down and eats up your fish. The Eagle then swoops down and eats 9 more fish, a total of 10? Now Place all your fish’s pretzels in the large eagle’s stomach.
4. What is the DDT concentration in the Eagle? Write in scientific notation. a. 1000x10=10,000 or 10^4
5. How much DDT would the eagle have if it ate fish from each scientist group? Write in Scientific notation.
a. 1000x number of groups 6. How much DDT would the eagle have if it ate fish from each scientist? Write in Scientific
notation. a. 1000x number of students
7. What layer of the lake did the eagle's feet touch (the top of the lake)? a. Epilimnion

31
8. How did the concentration of DDT change as we investigated up the food chain? Does this show Bioaccumulation?
a. As we went up the food chain the DDT concentration increased by 10% at each trophic level. Yes, this shows Bioaccumulation. Bioaccumulation is the collection of a toxin in an organism or food chain.
9. The eagle ate 10 fish for only one day. DDT is not an easy toxin to process through the body. How much DDT concentration would that eagle have after a week of eating 10 fish a. 10^4 x 7 or 70,000
Conclusion: Your group of scientists have now finished gathering all your data. Now you want to present to the [Your school Name] Apple orchard why they should stop spraying DDT on their Apples. Assume that the farmers do not know about food webs or eagles’ life cycle. Write a one-paragraph letter convincing the orchard to change their practices. Paragraph should touch on:
● How DDT is thinning the local Bald eagles● Explain Bioaccumulation● Explain food web or share the chain of the eagle● Use persuasive language

32