Embed Size (px)
Citation preview
Seasonal Electrical Resistivity Surveys of a Coastal Bluff, Barter Island, North Slope Alaska
Peter W. Swarzenski1, Cordell D. Johnson1,2, Tom D. Lorenson1, Christopher H. Conaway3, Ann E. Gibbs1,Li H. Erikson1, Bruce M. Richmond1 and Mark P. Waldrop3
1U.S. Geological Survey, 400 Natural Bridges, Dr. Santa Cruz, CA 95060, USAEmail: [email protected]; [email protected]; [email protected]; [email protected]; [email protected]
2University of California Santa Cruz, 1156 High Street, Santa Cruz, CA 95064, USAEmail: [email protected]
3U.S. Geological Survey, 345 Middlefield Rd, Menlo Park, CA 94025, USAEmail: [email protected]; [email protected]
–
ABSTRACT
Select coastal regions of the North Slope of Alaska are experiencing high erosion rates thatcan be attributed in part to recent warming trends and associated increased storm intensity andfrequency. The upper sediment column of the coastal North Slope of Alaska can be describedas continuous permafrost underlying a thin (typically less than 1–2 m) active layer thatresponds variably to seasonal thaw cycles. Assessing the temporal and spatial variability of theactive layer and underlying permafrost is essential to better constrain how heightened erosionmay impact material fluxes to the atmosphere and the coastal ocean, and how enhanced thawcycles may impact the stability of the coastal bluffs. In this study, multi-channel electricalresistivity tomography (ERT) was used to image shallow subsurface features of a coastal bluffwest of Kaktovik, on Barter Island, northeast Alaska. A comparison of a suite of pairedresistivity surveys conducted in early and late summer 2014 provided detailed information onhow the active layer and permafrost are impacted during the short Arctic summer. Such resultsare useful in the development of coastal resilience models that tie together fluvial, terrestrial,climatic, geologic, and oceanographic forcings on shoreline stability.
Introduction
It is now well documented that some Arctic coast-lines are highly susceptible to erosion, and rates ofcoastal bluff retreat have increased at some sites duringrecent decades (Hinzman et al., 2005; Osterkamp, 2005;Jones et al., 2009; Wendler et al., 2010). Heightenederosion may be attributed in part to increases in the dura-tion of thaw cycles and the frequency/intensity of oceanicstorm events (Rachold et al., 2000; Jorgenson et al.,2006). Impacts of such erosion are now affecting NorthSlope infrastructure, including some Native villages andpetroleum exploration and production facilities (Gibbsand Richmond, 2015). As part of a combined geochem-ical and geophysical reconnaissance, multi-channel electri-cal resistivity tomography (ERT) was used to imageshallow subsurface features such as permafrost, the activelayer, and a coastal bluff face on Barter Island, northeastAlaska. This paper examines the utility of the ERT
method to assess fine-scale nuances in active layer andpermafrost dynamics over one summer thaw cycle onthe North Slope of Alaska. Preliminary results suggestthat ERT is a useful technique to discern subtle changein surface features, and can be used in models thataddress shoreline retreat, erosion, and bluff stability.
Study Site
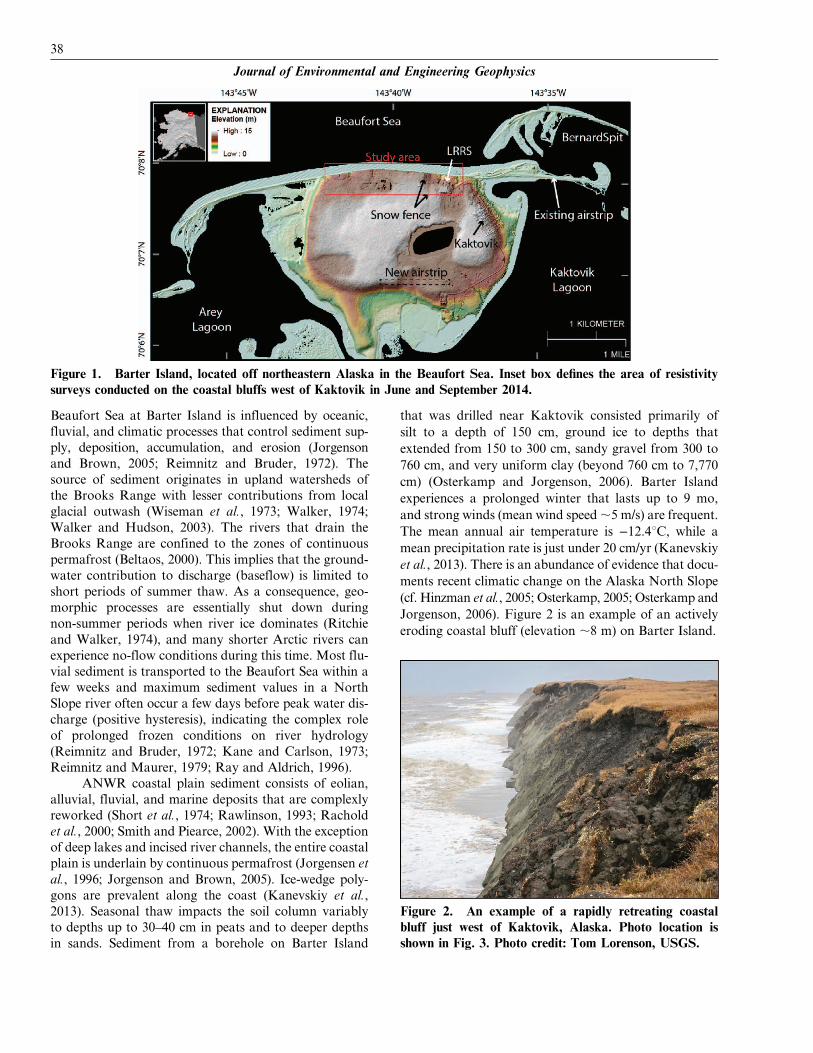
Barter Island is located along the Beaufort Seacoast of northern Alaska in the Arctic National WildlifeRefuge (ANWR) (Fig. 1). The island is bounded to theeast and west by the Jago and Hulahula Rivers, respec-tively. The Native Village of Kaktovik (population in2014 was ,300, http://www.alaska-demographics.com/kaktovik-demographics) is located on the northeasternshore of Barter Island. Parts of Kaktovik’s infrastructureare directly impacted by shifting and retreating shorelines(Gibbs and Richmond, 2015). The coastal margin of the
37
JEEG, March 2016, Volume 21, Issue 1, pp. 37–42 DOI: 10.2113/JEEG21.1.37
Beaufort Sea at Barter Island is influenced by oceanic,fluvial, and climatic processes that control sediment sup-ply, deposition, accumulation, and erosion (Jorgensonand Brown, 2005; Reimnitz and Bruder, 1972). Thesource of sediment originates in upland watersheds ofthe Brooks Range with lesser contributions from localglacial outwash (Wiseman et al., 1973; Walker, 1974;Walker and Hudson, 2003). The rivers that drain theBrooks Range are confined to the zones of continuouspermafrost (Beltaos, 2000). This implies that the ground-water contribution to discharge (baseflow) is limited toshort periods of summer thaw. As a consequence, geo-morphic processes are essentially shut down duringnon-summer periods when river ice dominates (Ritchieand Walker, 1974), and many shorter Arctic rivers canexperience no-flow conditions during this time. Most flu-vial sediment is transported to the Beaufort Sea within afew weeks and maximum sediment values in a NorthSlope river often occur a few days before peak water dis-charge (positive hysteresis), indicating the complex roleof prolonged frozen conditions on river hydrology(Reimnitz and Bruder, 1972; Kane and Carlson, 1973;Reimnitz and Maurer, 1979; Ray and Aldrich, 1996).
ANWR coastal plain sediment consists of eolian,alluvial, fluvial, and marine deposits that are complexlyreworked (Short et al., 1974; Rawlinson, 1993; Racholdet al., 2000; Smith and Piearce, 2002). With the exceptionof deep lakes and incised river channels, the entire coastalplain is underlain by continuous permafrost (Jorgensen etal., 1996; Jorgenson and Brown, 2005). Ice-wedge poly‐gons are prevalent along the coast (Kanevskiy et al.,2013). Seasonal thaw impacts the soil column variablyto depths up to 30–40 cm in peats and to deeper depthsin sands. Sediment from a borehole on Barter Island
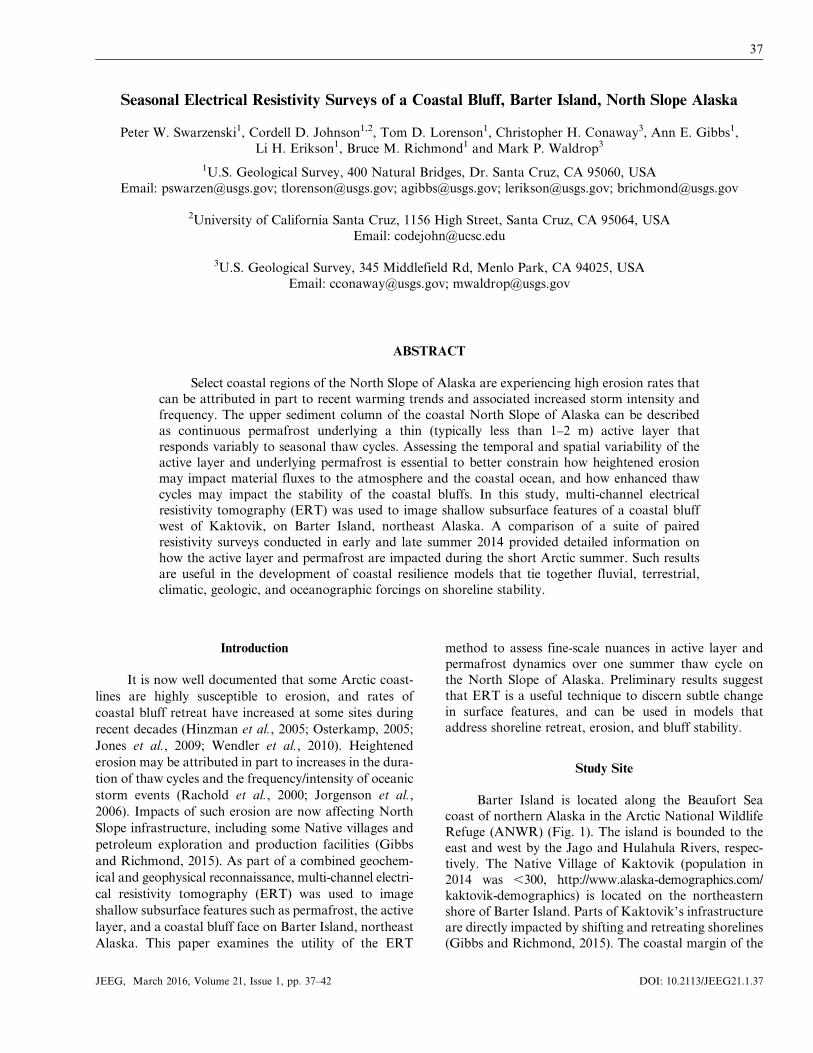
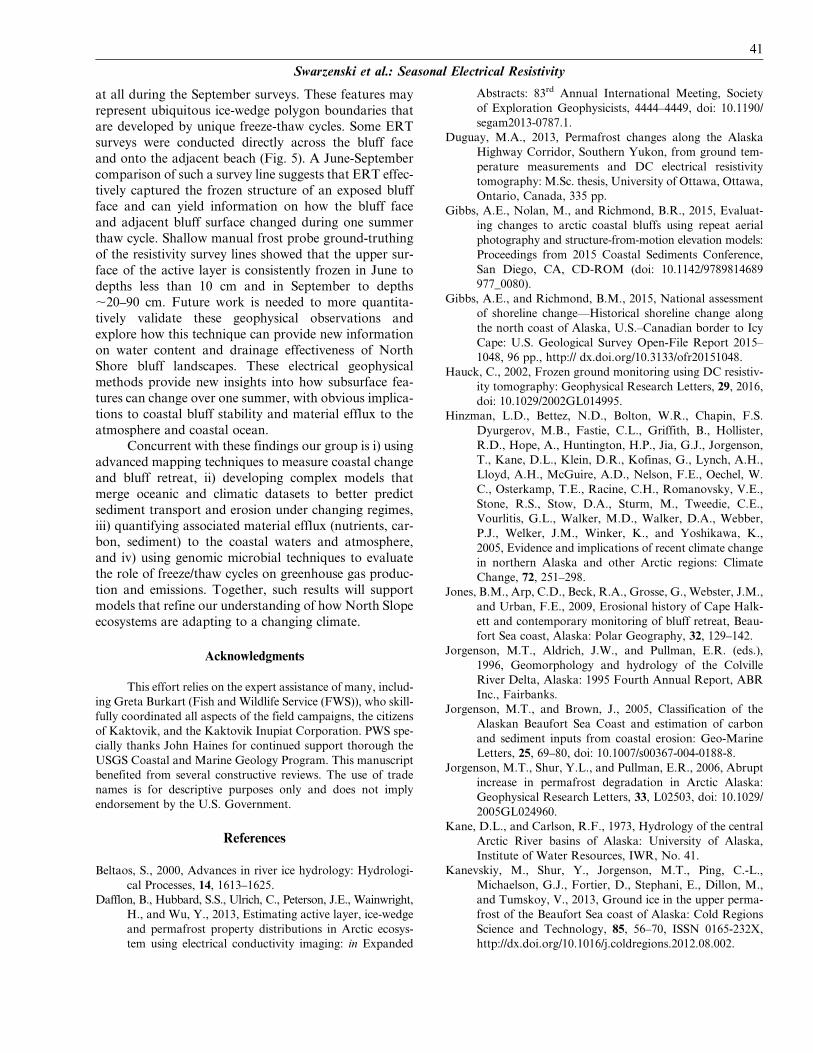
that was drilled near Kaktovik consisted primarily ofsilt to a depth of 150 cm, ground ice to depths thatextended from 150 to 300 cm, sandy gravel from 300 to760 cm, and very uniform clay (beyond 760 cm to 7,770cm) (Osterkamp and Jorgenson, 2006). Barter Islandexperiences a prolonged winter that lasts up to 9 mo,and strong winds (mean wind speed,5 m/s) are frequent.The mean annual air temperature is −12.4uC, while amean precipitation rate is just under 20 cm/yr (Kanevskiyet al., 2013). There is an abundance of evidence that docu‐ments recent climatic change on the Alaska North Slope(cf. Hinzman et al., 2005; Osterkamp, 2005; Osterkamp andJorgenson, 2006). Figure 2 is an example of an activelyeroding coastal bluff (elevation ,8 m) on Barter Island.
Figure 1. Barter Island, located off northeastern Alaska in the Beaufort Sea. Inset box defines the area of resistivitysurveys conducted on the coastal bluffs west of Kaktovik in June and September 2014.
Figure 2. An example of a rapidly retreating coastalbluff just west of Kaktovik, Alaska. Photo location isshown in Fig. 3. Photo credit: Tom Lorenson, USGS.
38
Journal of Environmental and Engineering Geophysics

Methods
Two identical sets of nine shore-parallel and shore-perpendicular ERT surveys were conducted on a coastalbluff west of Kaktovik on Barter Island in June and Sep-tember 2014 (Fig. 3). The timing of these surveys wasintended to capture winter (June) and end-of-summer(September) conditions so that the cumulative effects ofone summer thaw cycle could be examined in the pairedERT data. The paired ERT surveys were conductedusing an AGI R8 multi-channel SuperSting receiver pow-ered by two 12v DC marine batteries. Current was routedby an external switch box to a land-based cable that con-sists of 56 electrodes spaced 2 m apart. Electrical resistiv-ity measurements were conducted by injecting currentinto the ground through two electrodes and then measur-ing the resulting potential field at various positions usingadditional pairs of potential electrodes down cable. Up toeight simultaneous pairs of electrodes can be measuredfor each current injection point for the 56 electrodeson the line. Contact resistance was lowered to increasesignal levels versus noise by driving in 50-cm stainlesssteel electrode spikes into the ground. A contact resis-tance test was preformed prior to each ERT survey.A dipole-dipole array was used on all nine survey linesduring both June and September. Each ERT survey linepair was processed identically using AGI EarthImagersoftware. Inversion model goodness of fit was determinedusing the root mean square (RMS) error between themeasured apparent resistivity and the calculated appar-ent resistivity. In general, iterations less than six aredesired, with lower iterations preferred. Inversion modelRMS of less than 10% is typically acceptable for noisyenvironments. Inversions on this project typicallyrequired less than 5 iterations to attain an RMS error
of less than 5%. The shallow subsurface (0.5–2 m) wasalso manually ground-truthed along each survey lineusing either electrode spikes (June 2014) or a probingprobe (September 2014).
Results and Discussion
Multi-channel electrical resistivity has proven to bea useful geophysical technique to examine active layer/permafrost dynamics as it is highly sensitive to a changein the ionic strength of pore fluid, mineralogy, and thephase change between liquid water and ice (Hauck,2002; Overduin et al., 2012; Dafflon et al., 2013). Usinga land-based, multi-electrode resistivity cable, the under-lying lithology, pore space, and hydrologic parametersare all held constant, so a change in resistivity can beattributed solely to a change in ice content, temperature,or porosity (Kneisel et al., 2008; Lewkowiczet al., 2011). Another attribute that makes ERT particu-larly useful for permafrost studies is that the resistivityof frozen sediment, ground ice, or permafrost can reachvalues up to 16106 ohm-m, yielding a strong resistivitysignal relative to other earthen materials (e.g., clay 51–100 ohm-m, and organic matter 5 up to 300 ohm-m;Duguay, 2013). In all ERT model outputs, the upperrange of modeled resistivity values extended to 10,000ohm-m.
The processed ERT images show dramatic changesin both the shallow and deeper features from June to Sep-tember 2014. For example, a shore-perpendicular surveyline conducted in September on top of the bluff reveals athawed active layer that was still frozen in June (Figs. 4and 5). During June, when the upper active layer was stillcompletely frozen, many ERT images show pronouncedvertical features that are either subdued or not present
Figure 3. Electrical resistivity survey lines collected perpendicular and parallel to the coastal bluffs west of Kaktovik,Alaska in June and September 2014. Lines BI-1 and BI-4 are the thick gray lines.
39
Swarzenski et al.: Seasonal Electrical Resistivity

Figure 4. Paired multi-channel ERT for transect BI-4 that runs shore perpendicular and down the beach face. Thestructure of the active layer and underlying permafrost has clearly changed from June to September 2014. Photo shows aside view of the bluff face over which the end of the resistivity cable was draped. Photo credit: Tom Lorenson, USGS.
Figure 5. Paired ERT for transect BI-1, which is also a shore-perpendicular line on top of the coastal bluff. Remnants of asnow fence and the outskirts of Kaktovik are visible just east of BI-1. Photo credit: Tom Lorenson, USGS.
40
Journal of Environmental and Engineering Geophysics
at all during the September surveys. These features mayrepresent ubiquitous ice-wedge polygon boundaries thatare developed by unique freeze-thaw cycles. Some ERTsurveys were conducted directly across the bluff faceand onto the adjacent beach (Fig. 5). A June-Septembercomparison of such a survey line suggests that ERT effec-tively captured the frozen structure of an exposed bluffface and can yield information on how the bluff faceand adjacent bluff surface changed during one summerthaw cycle. Shallow manual frost probe ground-truthingof the resistivity survey lines showed that the upper sur-face of the active layer is consistently frozen in June todepths less than 10 cm and in September to depths,20–90 cm. Future work is needed to more quantita-tively validate these geophysical observations andexplore how this technique can provide new informationon water content and drainage effectiveness of NorthShore bluff landscapes. These electrical geophysicalmethods provide new insights into how subsurface fea-tures can change over one summer, with obvious implica-tions to coastal bluff stability and material efflux to theatmosphere and coastal ocean.
Concurrent with these findings our group is i) usingadvanced mapping techniques to measure coastal changeand bluff retreat, ii) developing complex models thatmerge oceanic and climatic datasets to better predictsediment transport and erosion under changing regimes,iii) quantifying associated material efflux (nutrients, car-bon, sediment) to the coastal waters and atmosphere,and iv) using genomic microbial techniques to evaluatethe role of freeze/thaw cycles on greenhouse gas produc-tion and emissions. Together, such results will supportmodels that refine our understanding of how North Slopeecosystems are adapting to a changing climate.
Acknowledgments
This effort relies on the expert assistance of many, includ-ing Greta Burkart (Fish and Wildlife Service (FWS)), who skill-fully coordinated all aspects of the field campaigns, the citizensof Kaktovik, and the Kaktovik Inupiat Corporation. PWS spe-cially thanks John Haines for continued support thorough theUSGS Coastal and Marine Geology Program. This manuscriptbenefited from several constructive reviews. The use of tradenames is for descriptive purposes only and does not implyendorsement by the U.S. Government.
References
Beltaos, S., 2000, Advances in river ice hydrology: Hydrologi-cal Processes, 14, 1613–1625.
Dafflon, B., Hubbard, S.S., Ulrich, C., Peterson, J.E., Wainwright,H., and Wu, Y., 2013, Estimating active layer, ice-wedgeand permafrost property distributions in Arctic ecosys-tem using electrical conductivity imaging: in Expanded
Abstracts: 83rd Annual International Meeting, Societyof Exploration Geophysicists, 4444–4449, doi: 10.1190/segam2013-0787.1.
Duguay, M.A., 2013, Permafrost changes along the AlaskaHighway Corridor, Southern Yukon, from ground tem-perature measurements and DC electrical resistivitytomography: M.Sc. thesis, University of Ottawa, Ottawa,Ontario, Canada, 335 pp.
Gibbs, A.E., Nolan, M., and Richmond, B.R., 2015, Evaluat-ing changes to arctic coastal bluffs using repeat aerialphotography and structure-from-motion elevation models:Proceedings from 2015 Coastal Sediments Conference,San Diego, CA, CD-ROM (doi: 10.1142/9789814689977_0080).
Gibbs, A.E., and Richmond, B.M., 2015, National assessmentof shoreline change—Historical shoreline change alongthe north coast of Alaska, U.S.–Canadian border to IcyCape: U.S. Geological Survey Open-File Report 2015–1048, 96 pp., http:// dx.doi.org/10.3133/ofr20151048.
Hauck, C., 2002, Frozen ground monitoring using DC resistiv-ity tomography: Geophysical Research Letters, 29, 2016,doi: 10.1029/2002GL014995.
Hinzman, L.D., Bettez, N.D., Bolton, W.R., Chapin, F.S.Dyurgerov, M.B., Fastie, C.L., Griffith, B., Hollister,R.D., Hope, A., Huntington, H.P., Jia, G.J., Jorgenson,T., Kane, D.L., Klein, D.R., Kofinas, G., Lynch, A.H.,Lloyd, A.H., McGuire, A.D., Nelson, F.E., Oechel, W.C., Osterkamp, T.E., Racine, C.H., Romanovsky, V.E.,Stone, R.S., Stow, D.A., Sturm, M., Tweedie, C.E.,Vourlitis, G.L., Walker, M.D., Walker, D.A., Webber,P.J., Welker, J.M., Winker, K., and Yoshikawa, K.,2005, Evidence and implications of recent climate changein northern Alaska and other Arctic regions: ClimateChange, 72, 251–298.
Jones, B.M., Arp, C.D., Beck, R.A., Grosse, G., Webster, J.M.,and Urban, F.E., 2009, Erosional history of Cape Halk-ett and contemporary monitoring of bluff retreat, Beau-fort Sea coast, Alaska: Polar Geography, 32, 129–142.
Jorgenson, M.T., Aldrich, J.W., and Pullman, E.R. (eds.),1996, Geomorphology and hydrology of the ColvilleRiver Delta, Alaska: 1995 Fourth Annual Report, ABRInc., Fairbanks.
Jorgenson, M.T., and Brown, J., 2005, Classification of theAlaskan Beaufort Sea Coast and estimation of carbonand sediment inputs from coastal erosion: Geo-MarineLetters, 25, 69–80, doi: 10.1007/s00367-004-0188-8.
Jorgenson, M.T., Shur, Y.L., and Pullman, E.R., 2006, Abruptincrease in permafrost degradation in Arctic Alaska:Geophysical Research Letters, 33, L02503, doi: 10.1029/2005GL024960.
Kane, D.L., and Carlson, R.F., 1973, Hydrology of the centralArctic River basins of Alaska: University of Alaska,Institute of Water Resources, IWR, No. 41.
Kanevskiy, M., Shur, Y., Jorgenson, M.T., Ping, C.-L.,Michaelson, G.J., Fortier, D., Stephani, E., Dillon, M.,and Tumskoy, V., 2013, Ground ice in the upper perma-frost of the Beaufort Sea coast of Alaska: Cold RegionsScience and Technology, 85, 56–70, ISSN 0165-232X,http://dx.doi.org/10.1016/j.coldregions.2012.08.002.
41
Swarzenski et al.: Seasonal Electrical Resistivity

Kneisel, C., Hauck, C., Fortier, R., and Moorman, B., 2008,Advances in geophysical methods for permafrost investi-gations: Permafrost and Periglacial Processes, 19,157–178.
Lewkowicz, A.G., Etzelmuller, B., and Smith, S.L., 2011, Char-acteristics of discontinuous permafrost based on groundtemperature measurements and electrical resistivitytomography, southern Yukon, Canada: Permafrost andPeriglacial Processes, 22, 320–342.
Osterkamp, T.E., 2005, The recent warming of permafrost inAlaska: Global and Planetary Change, 49, 187–202.
Osterkamp, T.E., and Jorgenson, J.C., 2006, Warming ofpermafrost in the Arctic National Wildlife Refuge,Alaska: Permafrost and Periglacial Processes, 17, 65–69,doi: 10.1002/ppp.538.
Overduin, P.P., Westermann, S., Yoshikawa, K., Haberlau, T.,Romanovsky, V., and Wetterich, S., 2012, Geoelectricobservations of the degradation of nearshore submarinepermafrost at Barrow (Alaskan Beaufort Sea): Journalof Geophysical Research, 117, F02004, doi: 10.1029/2011JF002088.
Rachold, V, Grigoriev M.N., Are, F.E., Solomon, S., Reimnitz,E., Kassens, H., and Antonow, M., 2000, Coastal erosionvs. riverine sediment discharge in the Arctic Shelf seas:International Journal Earth Science, 89, 450–460.
Rawlinson, S.E., 1993, Surficial geology and morphology of theAlaskan Central Arctic Coastal Plain: Alaska DivisionGeological and Geophysical Survey, Fairbanks, AK,Report of Investigations, 93–11, 72 pp.
Ray, S.R., and Aldrich, J.W., 1996, Flood magnitude andfrequency: in Geomorphology and Hydrology of theColville River Delta, Alaska, 1995, Jorgenson, M.T.,Aldrich, J.W., and Pullman, E.R. (eds.), ABR Inc., Fair-banks, 35–40, ABR, Fourth Annual Report.
Reimnitz, E., and Bruder, K.F., 1972, River discharge into anice-covered ocean and related sediment dispersal, Beau-fort Sea, coast of Alaska: Geological Society of AmericaBulletin, 83, 861–866.
Reimnitz, E., and Maurer, D.K., 1979, Effects of storm surgeson the Beaufort Sea coast: Arctic, 32, 329–344.
Ritchie, W., and Walker, H.J., 1974, Riverbank forms of theColville River delta: in The Coast and Shelf of the Beau-fort Sea, Reed, J.C., and Sater, J.E. (eds.), Arctic Insti-tute of North America, Washington, D.C., 545–562.
Short, A.D., Coleman, J.M., and Wright, L.D., 1974, Beachdynamics and nearshore morphology of the BeaufortSea coast: in The Coast and Shelf of the Beaufort Sea,Reed, J.C., and Sater, J.E. (eds.) Arctic Institute of NorthAmerica, Washington, D.C., 477–488.
Smith, D.G., Pearce, C.M., 2002, Ice jam-caused fluvial gulliesand scour holes on northern river flood plains: Geomor-phology, 42, 85–95.
Walker, H.J., 1974, The Colville River and the Beaufort Sea:Some interactions: in The Coast and Shelf of the BeaufortSea, Reed, J.C., and Sater, J.E. (eds.), Arctic Institute ofNorth America, Washington, DC, 513–540.
Walker, H.J., and Hudson, P.F., 2003, Hydrologic and geo-morphic processes in the Colville River delta: Geomor-phology, 56, 291–303.
Wendler, G., Shulski, M., and Moore, R., 2010, Changes in theclimate of the Alaskan North Slope and the ice concen-tration of the adjacent Beaufort Sea: Theoretical andApplied Climatology, 99, 67–74.
Wiseman, W.J., Coleman, J.M., Gregory, A., Hsu, S.A., Short,A.D., Suhayda, J.N., Walters, C.D., and Wright, L.D.,1973, Alaskan Arctic coastal processes and morphology:Louisiana State Univ., Coastal Studies Institute Techni-cal Report, 149, 171 pp.
42
Journal of Environmental and Engineering Geophysics