Embed Size (px)
Citation preview

Ecology, 95(10), 2014, pp. 2826–2839� 2014 by the Ecological Society of America
Seasonal changes in light availability modify the temperaturedependence of ecosystem metabolism in an arctic stream
ALEXANDER D. HURYN,1 JONATHAN P. BENSTEAD, AND STEPHANIE M. PARKER2
Department of Biological Sciences, University of Alabama, Tuscaloosa, Alabama 35487-0206 USA
Abstract. Light and temperature are key ecosystem drivers, but their synchronous annualcycles typically confound partitioning of their relative influence. Arctic spring-streams,subject to extreme annual fluctuations in light but stable water temperatures, provide a rarecontrast that allows the parsing of their independent effects. Over 30 months, we assessed theeffects of light and temperature on ecosystem metabolism and nutrient uptake in IvishakSpring, Alaska, USA. (latitude 698 N, water temperature range ;48–78C) using open-channelmethods and short-term NH4
þ-N, NO3�-N, and P additions, respectively. We predicted that
rates of ecosystem respiration (ER) would mirror seasonal patterns of gross primaryproduction (GPP), rather than temperature, due to relatively constant rates of metabolicdemand year-round, resulting in carbon limitation during winter (October–March) whenphotosynthesis effectively ceases. Because patterns of nutrient uptake and GPP are oftencoupled due to assimilatory demand, we also predicted that extreme annual cycles of lightwould result in equally extreme cycles of nutrient uptake, with demand being relaxed duringwinter.
In accordance with our prediction, we found that ER scaled linearly with GPP. Peaksummer rates of GPP (.4.0 g C�m�2�d�1) and ER (.5.0 g C�m�2�d�1) were surprisingly high,being comparable to those of productive streams at temperate latitudes. Winter rates (GPP;0.0, ER ,1.0 g C�m�2�d�1) were low, however, and Arrhenius plots showed clear deviationsfrom theoretical temperature dependence of GPP and ER during winter when other factorsassumed primacy. For GPP, this factor was undoubtedly light availability, but for ER,carbon limitation is implicated due to low GPP. Significant nutrient uptake occurred only forNH4
þ-N, indicating N limitation, and rates of uptake were also synchronous with cycles oflight availability. Consequently, light, rather than temperature, was the major driver ofannual patterns of ER and nutrient cycles in this arctic ecosystem. Synchronous light andtemperature cycles are pervasive among ecosystems. The winter onset and severity of energylimitation we document highlights the importance of this synchrony and how theconfounding of light and temperature obscures details of mechanisms by which thesefundamental drivers affect ecosystem processes.
Key words: Alaska; ammonium; ecosystem metabolism; ecosystem respiration; gross primaryproduction; light; nitrogen; nutrient uptake; phosphorus; seasonality; spring-streams; temperature.
INTRODUCTION
Light availability and temperature are key drivers of
most ecosystem processes (e.g., Roberts et al. 2007,
Heffernan and Cohen 2010, Trimmer et al. 2012).
Although their independent effects have been assessed
experimentally at small scales (Ylla et al. 2007, Dossena
et al. 2012, Matheson et al. 2012), understanding at the
large spatial scales traditionally used to define ecosystems
(e.g., catchment scale) is hindered by the fact that
temporal cycles of light and temperature are almost
invariably synchronized (Fig. 1a). Temperate ecosystems,
for example, experience short days (low light availability)
and cold temperatures during winter and long days (high
light availability) and warm temperatures during sum-
mer. At lower latitudes, the seasonal fluctuation in both
day length and temperature is reduced, while at higher
latitudes these fluctuations become more extreme.
Nevertheless, the synchrony between fluctuations in light
availability and temperature remains.
The recognition of the confounding effect of light
availability and temperature on ecosystem processes is
important because the synchrony of their annual cycles
has implications for understanding factors ranging from
the evolution of consumer life history strategies,
particularly the life histories of ectotherms, to those
driving temporal patterns of ecosystem processes such as
nutrient cycling and productivity. Consider that primary
productivity is maximized during periods of high light
availability, which coincidently are also periods when
Manuscript received 18 October 2013; revised 10 February2014; accepted 10 March 2014. Corresponding Editor: W. V.Sobczak.
1 E-mail: [email protected] Present address: National Ecological Observatory Net-
work, 1685 38th Street, Suite 100, Boulder, Colorado 80301USA.
2826

the metabolic demands of ectotherms are greatest due to
high temperatures, and minimized during dark, cold
periods when demands by ectotherms are minimized.
The seasonal synchrony of light and temperature cycles,
and the complementary energetic response by consumer
communities and ecosystems, are both profound and
pervasive but have received little explicit attention,
presumably due to a dearth of ecosystems providing
effective counterpoints. One such counterpoint, howev-
er, can be found in the form of arctic spring-stream
ecosystems.
Perennially flowing, spring-fed streams with relatively
constant temperatures (38 to �108C) are uncommon but
widespread on the arctic North Slope of Alaska
(Yoshikawa et al. 2007). Here they provide the only
open-water habitat during winter, when air temperatures
may be ,�408C for extended periods, and other
headwater streams freeze solid (Parker and Huryn
2011). Because of the combination of relatively constant
water temperature and extreme seasonal fluctuations in
day length (Fig. 1b), arctic spring-fed streams represent
a previously unexplored opportunity for advancing
understanding of the relationship between light and
ecosystem processes. The annual pattern of primary
productivity in these open-canopy ecosystems, for
example, is anticipated to show dramatic fluctuations
due to extreme seasonality in light availability (contin-
uous daylight during the summer solstice but only a few
hours of twilight during the winter solstice [Pielou
1994]), while near-constant water temperatures result in
stable rates of metabolism by organisms such as
ectothermic vertebrates and invertebrates, and microbes
(Fig. 1c), possibly leading to organic carbon limitation
during winter when primary production is effectively
halted (Fig. 1d). Under this scenario, the canonical
relationship between ecosystem respiration and temper-
ature (e.g., Enquist et al. 2003) is expected to break
down, because seasonal patterns of ecosystem respira-
tion are driven by annual cycles of light rather than
temperature, similar to findings of recent studies of
marine microbial communities showing that resource
limitation (e.g., C, N, P) is an important process
explaining anomalies in temperature–metabolism rela-
tionships (Lopez-Urrutia and Moran 2007, Degerman et
al. 2013).
Here we assess the effects of cycles of light availability
under conditions of relatively constant temperature on
annual patterns of primary production, ecosystem
respiration, and nutrient uptake in an arctic spring-fed
stream (Ivishak Spring, Alaska [Parker and Huryn
2006]). We assessed the potential effect of carbon
limitation on ecosystem respiration–temperature rela-
tionships by testing the prediction that rates of
ecosystem respiration would mirror seasonal patterns
of primary production, rather than temperature, due to
relatively constant and high rates of metabolic demand
that result in carbon limitation during the long, dark,
arctic winter (i.e., October–March) when photosynthe-
FIG. 1. Conceptual model summarizing anticipated annual patterns of ecosystem metabolism in arctic spring-streamecosystems. L is light, T is temperature, GPP is gross primary production, ER is ecosystem respiration. (a) Coupled pattern of lightavailability and temperature that normally occurs in high-latitude ecosystems. (b) Decoupling of light and temperature that occursin arctic springs. (c) Decoupled pattern of annual GPP (controlled by light availability) and ER (controlled by temperature)anticipated if organic carbon stores are not limiting due to donor-control. (d) Quasi-coupled pattern of annual GPP (controlled bylight availability) and ER (controlled by both organic carbon supply and temperature) anticipated if organic carbon stores arelimiting due to a dominance of autochthony.
October 2014 2827METABOLISM OF AN ARCTIC STREAM
sis is greatly reduced (Fig. 1d). Accordingly, we
anticipated that rates of primary production and
ecosystem respiration should be significantly related, a
pattern unusual for stream ecosystems, which, in many
cases, show little or no correlation between these
processes (Young et al. 2008, Townsend et al. 2011)
due to extreme donor control of their ecosystem
metabolism (i.e., majority of ecosystem respiration
sustained by imported organic matter). Because pat-
terns of nutrient uptake and primary production by
stream ecosystems are often closely coupled due to
assimilatory demand (Hall and Tank 2003, Fellows et
al. 2006, Heffernan and Cohen 2010), we also predicted
that extreme annual cycles of light availability and
related metabolic processes would result in equally
extreme annual cycles of nutrient availability, with rates
of uptake being relaxed during the long period of winter
darkness. The data used to test these predictions were
collected over a 30-month period of intensive sampling.
This relatively long period of study was chosen to
account for the notoriously high level of temporal and
spatial variability associated with stream ecosystem
structure and function, which can mask the often subtle
relationships between metabolism and nutrient dynam-
ics (Roberts and Mulholland 2007, von Shiller et al.
2008).
SITE DESCRIPTION
Ivishak Spring is a tributary of the Ivishak River, a
braided river that flows through the Arctic National
Wildlife Refuge (Appendix: Fig. A1) on the North Slope
of the Brooks Range of Alaska, USA (Parker and
Huryn 2006). The mean annual precipitation of this
region is 250þ mm/yr and the mean annual air
temperature is �128C (Huryn and Hobbie 2012). The
warmest month is July (mean monthly air temperature
of 128–138C) and the coldest is February (mean monthly
air temperature of �308C [Huryn and Hobbie 2012]).
The Ivishak Spring stream is formed by the coalescence
of a series of seeps arising in a wet-sedge/Sphagnum
meadow, whereupon it flows downslope for ;100 m and
receives further discharge from a major spring (‘‘Ivishak
Hot Spring,’’ 69801024.100 N, 147843021.100 W) associated
with an outcrop of the groundwater-rich Lisburne
Limestone (Huryn and Hobbie 2012). The stream then
flows for an additional ;300 m (69801 031.6000 N,
147843012.7600 W) before joining a tributary draining
an adjacent catchment (‘‘Ivishak Mountain Stream’’
[Parker and Huryn 2006, 2011]). The habitat structure of
the spring-stream (hereafter ‘‘Ivishak Spring’’) consists
of relatively long, uniform riffles paved with gravel and
cobble-size particles covered with the bryophyte Crato-
neuron filicinum (Parker and Huryn 2006). Pools are
infrequent. Stream discharge shows relatively little
variability (annual mean ¼ 136 L/s), resulting in high
substratum stability (Parker and Huryn 2006). Water
temperature ranges from a constant 7.38C at the main
spring source to a mean annual temperature of 5.88C
with an annual fluctuation of ;38–48C about 240 m
below the source (Benstead and Huryn 2011). Nutrient
concentrations during summer are similar to other
headwater streams of the eastern North Slope for which
information is available (i.e., soluble reactive phospho-
rus [SRP]¼0.10 lmol/L, NH4þ-N¼0.05 lmol/L, NO3
�-
N ¼ 5.3 lmol/L [Huryn et al. 2005, Parker and Huryn
2011]). Riparian vegetation consists of willow thickets
(primarily Salix alaxensis) �2 m in height and a small
grove of balsam poplars (Populus balsamifera) ;3–4 m
in height along one bank of Ivishak Spring near its
confluence with Ivishak Mountain Stream (see Plate 1).
METHODS
Ecosystem metabolism
General approach.—The two components of ecosys-
tem metabolism (EM), gross primary production (GPP),
and ecosystem respiration (ER), were estimated for a
200-m study reach on 26 dates between March 2007 and
August 2009 using the two-station open-channel method
(Owens 1969). This method is based upon a mass-
balance approach requiring estimates of dissolved
oxygen concentration (DO, measured as milligrams of
O2 per liter) at upstream and downstream locations of a
stream study reach for which metabolism is to be
estimated (Marzolf et al. 1994, Young and Huryn 1998,
1999). This method assumes that gains and apparent
losses of DO along the reach are due to gross primary
production, ecosystem respiration, re-aeration, and
dilution of DO due to groundwater infiltration (Owens
1969, Marzolf et al. 1994, Hall and Tank 2005). We
accounted for changes in DO due to re-aeration
following Marzolf et al. (1994) using the correction
provided by Young and Huryn (1998), and the effects of
groundwater dilution following Hall and Tank (2005;
details provided in the Appendix). Once the effects of re-
aeration and groundwater dilution on diel patterns of
DO are accounted for, ER can be estimated during
nighttime when changes in DO due to GPP are not
occurring. Nighttime ER can then be extrapolated to
daytime periods, allowing GPP to be estimated by
difference. This approach is problematic during the
arctic summer (June–August) when continuous daylight
occurs, although the light intensity near stream substra-
ta reaches low levels during the early morning hours. To
estimate ER under such conditions (July and August
sampling only; no data from June due to permit
restrictions), we followed the approach of Bowden et
al. (2014), which is based on a regression of EM vs.
photosynthetically active radiation (PAR) measured at
short intervals (3-minute intervals in this study) over the
entire diel light cycle, which allows ER in the absence of
light to be estimated by extrapolation (e.g., ER ; EM at
PAR ¼ 0 lmol�m�2�s�1). Values for ER and GPP given
in units of DO were converted to units of carbon (C)
using a photosynthetic quotient of 1.2 and a respiratory
quotient of 0.85 (Bott 2006).
ALEXANDER D. HURYN ET AL.2828 Ecology, Vol. 95, No. 10
Organic matter
Bryophytes and other forms of benthic organic matterwere sampled during most visits. Five samples were
taken at ;40-m intervals using a Surber sampler (0.09m2, 243-lm mesh). Periphyton was sampled using a
plastic 35-mm slide mount to partition an area of the topsurface of each of five rocks (8.05 cm2) lacking
bryophytes (Slavik et al. 2004). Dissolved organiccarbon (DOC) was sampled on each visit from January
2008 to May 2009 (13 semimonthly sampling dates) atthe same locations where ambient nutrient samples were
taken (n¼ 15 samples plus two samples from the springsource, see Nutrients: Ambient nutrient concentrations).
See Appendix for details of organic matter sampleprocessing.
Nutrients
Ambient nutrient concentrations.—Water samples foranalysis of SRP, NH4
þ-N, and NO3�-N concentrations
were taken from the stream’s thalweg at 10–20 m
intervals along the study reach (n ¼ 15) and from thespring source (n ¼ 2) during each visit. Samples (;40
mL) were collected using a 50-mL polyethylene syringe,filtered through ashed GF/F glass fiber filters, and
stored in new 50-mL polyethylene centrifuge tubes(Fisher Scientific, Pittsburgh, Pennsylvania, USA).
Separate samples were taken for each nutrient and wereimmediately frozen (winter) or stored on ice and then
frozen within 2–3 days (summer) before transport to thelaboratory for analysis. Ammonium concentrations
were measured using the orthophthalaldehyde fluoro-metric method (Holmes et al. 1999), as modified by
Taylor et al. (2007). Nitrate concentrations weremeasured using ion chromatography (Dionex ICS 2000
Ion Chromatograph, Dionex Corporation, Sunnyvale,California, USA [APHA 1998]) and SRP concentrationswere measured using the ascorbic acid method (Murphy
and Riley 1962).
Nutrient uptake.—We used standard nutrient-releasetechniques (Mulholland 2004, Webster and Valett 2006)to measure uptake rates of NH4
þ-N during every visit
(26 dates between March 2007 and August 2009) anduptake rates of either SRP or NO3
�-N on a subset of
visits. In summary, dissolved nutrient concentrationswere elevated above ambient by pumping a stock
nutrient solution (NH4Cl, NaNO3, or Na2HPO4) intothe stream at a constant rate using a metering pump
until a target plateau concentration throughout thestudy reach was achieved (a minimum of three hours
based on rhodamine releases; see Appendix). Oncetarget concentrations were achieved, stream water was
sampled for nutrient analysis at 10-m intervals (0–100m) or 20-m intervals (100–200 m) along the study reach
(n¼ 15 samples). The sampling method was identical tothat used to collect ambient nutrient samples (see theprevious paragraph). Releases of different nutrients were
conducted on different days (e.g., nitrate or phosphatereleased on day 1, ammonium released on day 2).
An important drawback to methods based on nutrient
additions is that they overestimate uptake rates that
occur at ambient (lower) concentrations (Mulholland et
al. 2002, Payn et al. 2005). We used the approach of
Payn et al. (2005) to estimate uptake rates at ambient
conditions. This approach is based on the regression of
uptake rates against different nutrient plateau concen-
trations, which allows the estimate of ambient uptake
rates via extrapolation. To obtain data required for this
approach we released nutrients at three different rates
(lowest to highest) to achieve three independent plateau
concentrations. Resulting data were combined with
other ancillary data (e.g., stream depth, water velocity,
ambient nutrient concentrations) to estimate metrics
describing nutrient uptake dynamics in streams: uptake
length¼ Sw (in meters), uptake velocity¼Vf (mm/min),
and areal uptake rate ¼ U (mg�m�2�h�1) following
Webster and Valett (2006).
RESULTS
Ecosystem metabolism
Ecosystem metabolism was measured on 22 dates (24-
hour periods) between 20 March 2007 and 2 August
2009. Attempts on four additional dates (1 August 2007,
8 October 2007, 18 December 2007, 25 May 2009) were
stymied by instrument failure. The approach of Bowden
et al. (2014) was used to estimate ER on five dates (4
July 2007, 3 July 2008, 2 August 2008, 2 July 2009, 2
August 2009) due to continuous daylight, which
precluded measurements of EM in darkness. It must
be noted, however, that there are marked diel changes in
light intensity during the arctic summer, with daily PAR
levels measured during our study declining to ;19.6–
24.1 lmol�m�2�s�1 for short periods during early July
and ;0.3 lmol�m�2�s�1 during early August. Rates of
EM estimated at the lowest PAR levels during these
periods were only 10% to 33% lower than extrapolated
rates of ER, indicating that our estimates based on the
approach of Bowden et al. (2014) were reasonable. A
summary of ancillary data required for estimating
metabolism is provided in the Appendix: Table A1.
Raw data describing diel patterns of DO, PAR, and
other variables are available from the Carleton Univer-
sity web site.3
Ecosystem GPP ranged from 0 g C�m�2�d�1 on 18
December 2008 to 4.4 g C�m�2�d�1 on 2 July 2008 (1.5 6
0.3 g C�m�2�d�1; mean 6 SE), while ER (corrected for
groundwater input) ranged from 0.4 g C�m�2�d�1 on 11
November 2007 to 8.7 g C�m�2�d�1 on 2 July 2007 (3.8 6
0.5 g C�m�2�d�1; mean 6 SE; Fig. 2). Maximum
estimates of GPP should be conservative due to the
formation of O2 bubbles during periods of high
photosynthetic activity (April–July; A. D. Huryn, J. P.
Benstead, and S. M. Parker, personal observation).
Estimates of annual ecosystem GPP were ;566 g C/m2
3 http://data.eol.ucar.edu/codiac/dss/id¼106.336
October 2014 2829METABOLISM OF AN ARCTIC STREAM

during 1 August 2007–1 August 2008 and ;387 g C/m2
during 1 August 2008–2 August 2009. Annual ER was
;1060 g C/m2 from 1 August 2007–1 August 2008 and
;748 g C/m2 from 1 August 2008–2 August 2009.
GPP followed strong annual cycles with peak rates
occurring during May or July (R2¼ 0.69, P , 0.0001, df
¼ 21, quadratic model, all years combined, no data from
June in any year; Appendix: Fig. A2). ER showed a
similar pattern (R2¼ 0.44, P , 0.005, df¼ 21, quadratic
model, all years combined; Appendix: Fig. A2). ER was
significantly related to GPP (R2¼ 0.53, P , 0.0002, df¼21, linear model, all years combined). The average rate
of ER predicted when GPP was zero (i.e., basal ER) was
1.3 6 0.8 g C�m�2�d�1 (y-intercept and 95% CI; Fig. 3).
Daily net ecosystem production (NEP) ranged from
�3.4 g C�m�2�d�1 on 2 September 2007 to 0.7 g
C�m�2�d�1 on 2 July 2008 (Fig. 2, annual mean 6 SE
¼�1.2 6 0.2 g C�m�2�d�1). NEP was negative on 18 of
22 dates. Dates when NEP was positive occurred during
spring (20 March 2007, 17 April 2009) and July (2 July
2008, 1 July 2009). Annual NEP was �494 g C/m2
(GPP : ER¼ 0.53) during 1 August 2007–1 August 2008
and �361 g C/m2 (GPP : ER ¼ 0.52) during 1 August
2008–2 August 2009. GPP : ER ratios of ;0.5 indicate a
co-dominance of autochthonous and allochthonous
support of ER. Despite clear annual cycles of GPP
and ER, patterns of NEP showed no apparent
seasonality (Fig. 2).
Light and temperature as drivers of ecosystem metabolism
Mean daily water temperature (Appendix: Fig. A3)
ranged from 4.68C (28 February 2008) to 7.38C (2
August 2009) among dates when GPP and ER were
estimated (range¼ 2.88C). Water temperature and PAR
were correlated (r ¼ 0.74, P , 0.0001, df ¼ 21). Mean
daily PAR (Appendix: Fig. A3) ranged from 0.2
lmol�m�2�s�1 (18 December 2008) to 488.5 lmol�m�2�s�1(2 July 2008). GPP was positively related to both PAR
(R2¼ 0.85, P , 0.0001, df¼ 21, linear model; Appendix:
Fig. A4) and water temperature (R2¼0.65, P , 0.0001),
as was ER (PAR, R2 ¼ 0.29, P , 0.01; water
temperature, R2 ¼ 0.47, P , 0.001; Appendix: Fig.
A4). NEP was not significantly related to either PAR
(R2¼ 0.00, P¼ 0.87) or water temperature (R2¼ 0.12, P
¼ 0.12; Appendix: Fig. A4). Plots of GPP vs. PAR over
3-min intervals were sub-linear and indicated incipient
light saturation of photosynthesis at ;600�700lmol�m�2�s�1 (data not shown). Photoinhibition of
GPP was not detected.
Dissolved organic carbon
Dissolved organic carbon concentrations ranged from
0.5 6 0.0 mg C/L (20 April 2009) to 1.4 6 0.2 mg C/L
(22 April 2008, Appendix: Fig. A5). The mean
semimonthly DOC concentration was 1.0 6 0.1 mg C/
L (n¼ 17). Although a number of significant differences
in DOC concentration were detected among months, no
seasonal patterns were evident. Nor were any significant
FIG. 2. Seasonal patterns of GPP (circles) and ER(triangles, top panel) and NEP (bottom panel) for IvishakSpring, Alaska, USA. GPP, ER, and NEP (see Fig. 1) wereestimated semimonthly from March 2007 to August 2009.
FIG. 3. ER vs. GPP (g C�m�2�d�1) for Ivishak Spring,Alaska, USA. GPP and ER were estimated semimonthly fromMarch 2007 to August 2009 (see Fig. 1). The mean ERpredicted when GPP ¼ 0 (basal ER) is 1.3 6 0.8 g C�m�2�d�1(intercept and 95% CI).
ALEXANDER D. HURYN ET AL.2830 Ecology, Vol. 95, No. 10
trends in longitudinal DOC concentration detected.
Rates of ER were positively related to DOC concentra-
tions (R2 ¼ 0.36, P ¼ 0.01, power relationship). This
relationship, however, was strongly affected by a single,
high-leverage point (20 April 2009, ER ¼ 0.68 g
C�m�2�d�1, DOC ¼ 0.47 mg C/L). When this point was
removed from the analysis, the resulting R2 was reduced
to 0.12 and the relationship was no longer significant (P
¼ 0.21).
Benthic organic matter
Autotrophs.—Mean biomass of bryophytes and asso-
ciated epiphytes (measured as ash-free dry mass) was
77.7 6 10.4 g AFDM/m2 (semimonthly mean 6 SE;
Appendix: Fig. A5). Semimonthly estimates of bryo-
phyte biomass ranged from 21.5 g AFDM/m2 (17
October 2008) to 262.7 g AFDM/m2 (26 March 2008).
Although differences (ANOVA, log transformation,
Tukey’s LSD, P , 0.05) in bryophyte biomass were
detected among the 24 sample dates, these were
restricted to biomass measured on 17 October 2008
(21.5 g AFDM/m2) being significantly lower than that
measured on 4 September 2007 (106.2 g AFDM/m2) and
26 March 2008 (262.7 g AFDM/m2).
The mass of biofilms on benthic substrata without
bryophyte cover ranged from 0.5 6 0.1 g AFDM/m2 (5
July 2007) to 2.2 6 0.3 g AFDM/m2 (24 April 2008).
The semimonthly mean biofilm mass was 1.2 6 0.1 g
AFDM/m2 (n¼ 21 months). Mean benthic chlorophyll a
biomass on substrata lacking bryophytes ranged from
5.0 6 2.3 mg/m2 (26 January 2008) to 209.3 6 50.0 mg/
m2 (24 April 2008). The semimonthly mean chlorophyll
a biomass was 24.2 6 9.6 mg/m2 (n ¼ 21 months).
Although significant differences in biofilm and chloro-
phyll a biomass among months were detected, no
seasonal patterns were apparent.
Detritus.—Storage of fine particulate organic matter
(FPOM) was 7.4 6 1.3 g AFDM/m2 (semimonthly
mean 6 SE). Semimonthly estimates ranged from 1.4 g
AFDM/m2 (26 March 2008) to 23.3 g AFDM/m2 (17
October 2008; Appendix: Fig. A5). Differences (AN-
OVA, log transformation, Tukey’s LSD, P , 0.05) in
FPOM storage were detected among the 23 sample
dates (no data for November 2008), but were relatively
trivial and restricted to storage measured on 22 April
2008 and 20 April 2009 (both 2.1 g AFDM/m2) being
significantly lower than FPOMmeasured on 4 July 2007
(11.6 g AFDM/m2), 29 February 2008 (22.5 g AFDM/
m2), and 17 October 2008 (23.3 g AFDM/m2). The only
other relatively abundant forms of detritus were leaves
(primarily S. alaxensis and P. balsamifera) and wood.
Leaf detritus occurred in measurable quantities from 14
November 2007 to 28 March 2008 (mean monthly mass¼ 0.2 6 0.1 g AFDM/m2, n¼ 4 months) and 28 May to
4 August 2009 (mean monthly mass ¼ 1.2 6 0.7 g
AFDM/m2, n¼ 3 months; Appendix: Fig. A5). Woody
debris occurred sporadically and was found in measur-
able quantities on 13 of 24 sample dates (mean monthly
mass ¼ 2.9 6 1.6 g AFDM/m2).
Nutrient concentrations and uptake
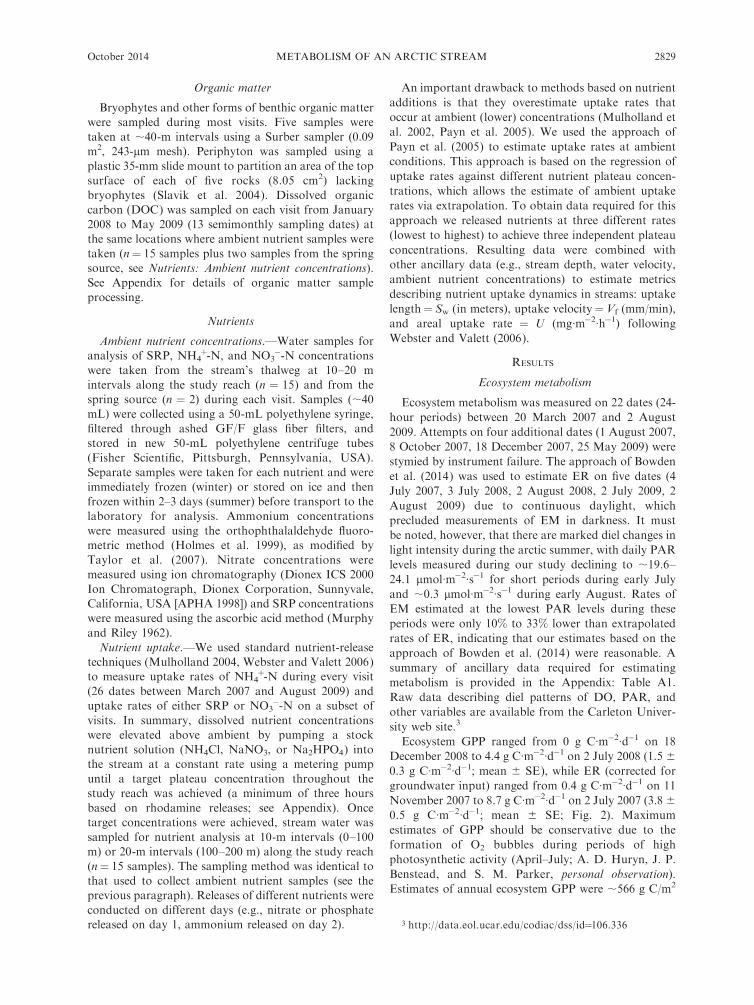
Ambient nutrient concentrations.—Ambient concen-
trations of SRP ranged from below detection (,0.1 lg/L; 2 August 2007, 28 May 2008, 19 November 2008, 22
January 2009) to 8.4 6 0.9 lg/L (18 February 2009). The
mean monthly concentration was 2.8 6 0.6 lg/L (n ¼21). No significant longitudinal or seasonal patterns of
concentration were detected (Fig. 4). Ambient concen-
trations of NO3�-N ranged from 51.8 6 2.8 lg/L (18
FIG. 4. Seasonal patterns of NH4þ-N (triangles), NO3
�-N (open circles), and soluble reactive phosphorus (SRP; solid circles)concentrations (lg/L) measured semimonthly in Ivishak Spring, Alaska, USA (March 2007–August 2009).
October 2014 2831METABOLISM OF AN ARCTIC STREAM

February 2009) to 133.1 6 4.2 lg/L (1 March 2008). The
mean monthly concentration was 77.0 6 4.2 lg/L (n ¼21). Significant decreasing gradients (upstream to
downstream) of concentration were detected on 4 of
21 dates (5 July 2007, 26 March 2007, 3 August 2008, 16
October 2008). No significant seasonal pattern in NO3�-
N concentration was apparent (Fig. 4). Ambient
concentrations of NH4þ-N ranged from 0.2 6 0.0 lg/L
(19 April 2009) to 2.9 6 0.1 lg/L (28 May 2008). The
mean monthly concentration was 1.5 6 0.1 lg/L (n ¼24). Significant gradients in concentration were detected
on 13 of 24 dates. Increasing concentration gradients
(upstream to downstream) were detected on eight dates,
while decreasing gradients were detected on five dates.
There was a significant trend for decreasing downstream
gradients in NH4þ-N concentration during January
through May and increasing gradients during the
remainder of the year. Otherwise no significant seasonal
patterns in ambient NH4þ-N concentration were appar-
ent (Fig. 4). The mean molar ratio of dissolved
inorganic nitrogen (DIN ¼ NH4þ-N þ NO3
�-N) to
SRP was ;74:1.
Nutrient uptake.—Twenty-seven releases of Na2HPO4
over nine dates (three releases of three concentrations
per date) occurred from March 2007 to February 2008
and May 2009–July 2009. The average increase in SRP
concentration was 33, 83, and 123 ambient. No
significant uptake was detected. Twenty-one releases of
NaNO3 over seven dates (three releases of three
concentrations per date) occurred from March 2008 to
October 2008. The average increase in NO3�-N concen-
tration was 1.23, 1.93, and 2.23 ambient. Five of the 21
releases (March 2008, two releases; April 2008, 1 release;
October 2008, two releases) showed a significant
downstream decrease in concentration along the study
reach, indicating uptake. The spiral length (Sw) for these
releases ranged from 139 to 763 m. Data were
insufficient to estimate uptake at ambient NO3�-N
concentrations using the Payn et al. (2005) method.
Sixty-nine releases of NH4Cl over 23 dates (three
concentrations per date) occurred from March 2007 to
August 2009. The average increase in NH4þ-N concen-
tration was 33, 83, and 153 ambient. A significant
downstream decrease in NH4þ-N, indicating uptake, was
detected for releases at all three concentrations on 18 of
23 dates (54 releases) and for releases at only two
concentrations on the five remaining dates. Of the latter,
it was the releases at the highest concentrations that
showed no significant uptake. Spiral lengths (Sw) for all
releases showing significant uptake ranged from 35 to 495
m. Sw at ambient NH4þ-N concentrations for the 18 dates
when all three releases revealed significant uptake ranged
from 13 m (24 March 2008) to 238 m (8 October 2007;
Fig. 5). Mean monthly Sw at ambient NH4þ-N concen-
trations was 81 6 14 m (n ¼ 18). Uptake velocity (Vf )
estimated among different dates ranged from 10.8 mm/
min (17 April 2009) to 146.4 mm/min (24 March 2008;
Fig. 5). Mean monthly uptake velocity estimated for
ambient concentrations was 55.2 6 9.0 mm/min (n¼ 18).
Areal rates of uptake (U) ranged from 0.04 mg NH4þ-
N�m�2�h�1 (27 April 2009) to 4.9 mg NH4þ-N�m�2�h�1
(25 May 2009; Fig. 5). The mean monthly areal uptake
rate was 1.8 6 0.3 mg NH4þ-N�m�2�h�1 (n¼ 18).
Areal rates of NH4þ-N uptake were related to GPP (P
, 0.005, R2 ¼ 0.48, n ¼ 15) and ER (P , 0.001, R2 ¼0.60, n ¼ 15; Fig. 6) and temporal changes in NH4
þ-N
uptake, GPP, and ER showed high synchrony. In
comparison, neither Sw at ambient NH4þ-N concentra-
tions or Vf was significantly related to GPP or ER.
Despite the lack of significance, however, some syn-
chrony is apparent when temporal patterns of Vf and
GPP and ER are compared (Figs. 2 and 5).
FIG. 5. (a) Seasonal patterns of spiraling length (Sw [m]),(b) uptake velocity (Vf, [mm/min]), and (c) areal uptake (U[mg�m�2�h�1]), all indicated by solid circles, estimated semi-monthly for ambient concentrations of NH4
þ-N in IvishakSpring, Alaska (March 2007–August 2009). PAR is indicatedby open circles.
ALEXANDER D. HURYN ET AL.2832 Ecology, Vol. 95, No. 10

DISCUSSION
How metabolically active is Ivishak Spring?
Two key factors controlling GPP are light availability
and autotroph biomass (Bernot et al. 2010). At Ivishak
Spring, the lack of canopy shading, continuous light,
and high bryophyte biomass (;78 g AFDM/m2)
conspire to support high rates of GPP during summer.
Although well above the Arctic Circle (698 N), peak
rates of daily GPP measured here (.4.0 g C�m�2�d�1)compare favorably with some of the highest rates
reported for relatively undisturbed, open-canopy head-
water streams at lower latitudes (;3.2–7.4 g C�m�2�d�1[Minshall 1978, Cushing and Wolf 1984, Mulholland et
al. 2001, Hall et al. 2003, Fisher 2006, Rasmussen et al.
2011, Davis et al. 2012]). Peak daily ER estimated for
Ivishak Spring (.5.0 g C�m�2�d�1) was also within the
high range of estimates for relatively undisturbed, open-
canopy streams (;3.8–7.2 g C�m�2�d�1 [Hall et al. 2003,
Bernot et al. 2010]). Rates of ER have been shown to be
positively related to factors such as the amount of stored
benthic organic matter (Bernot et al. 2010) and
hyporheic volume and metabolic activity (Jones et al.
1995, Fellows et al. 2001). The amount of stored organic
matter in the form of detritus was extremely low in
Ivishak Spring compared with other systems (Webster
and Meyer 1997), however, and the relatively high
summer rates of ER are attributed to respiration by
autotrophs themselves and/or heterotrophic microbes
on the stream bed and in the hyporheic zone.
Although Ivishak Spring supported daily rates of
GPP that were comparable with some of the highest
reported for streams, annual GPP was more moderate
due to low rates during the ‘‘dark months’’ of October–
March, when light availability was severely limited.
Comparisons with other highly productive, open-canopy
streams for which annual GPP estimates are available
(e.g., 944–2700 g C�m�2�yr�1 [Minshall 1978, Cushing
and Wolf 1984, Jones et al. 1997]), for example, indicate
that values for these systems are substantially greater
than those for Ivishak Spring (387–566 g C�m�2�yr�1).Unlike annual GPP, however, estimates of annual ER
for Ivishak Spring (748–1060 g C�m�2�yr�1) approachedthe low range reported for these same systems (1201–
2288 g C�m�2�yr�1 [Minshall 1978, Cushing and Wolf
1984, Jones et al. 1997]).
Annual GPP : ER ratios for Ivishak Spring were ;0.5
throughout our 2.5-yr study, indicating a co-dominance
of autochthonous and allochthonous support of annual
ecosystem organic carbon demand (Fellows et al. 2006).
Daily ecosystem GPP :ER ratios at peak metabolic
activity, however, approached ;1.0, indicating that the
severity of carbon limitation was greatest during the
dark months (October–March). We estimated that
ecosystem ER was 1.3 6 0.8 g C�m�2�d�1 (mean and
95% CI) when PAR was 0.0 lmol�m�2�s�1, which, whenextrapolated over an annual period, indicates a range of
annual NEP from �361 to �494 g C/m2.
Two possible sources of organic carbon are available
to balance the apparent C deficit for Ivishak Spring. The
first is imported particulate organic carbon. The stored
biomass of particulate organic carbon in the form of leaf
litter, wood, and FPOM, however, was relatively low
(;10 g AFDM/m2). Although rates of input were not
measured, it is unlikely that turnover rates would be
high enough to satisfy rates of ecosystem respiration.
The second, more likely source of imported organic
matter supporting ER is DOC. The mean annual
concentration of DOC in Ivishak Spring was 1.0 6 0.1
mg C/L (mean 6 SE). If this static value is converted to
a supply rate (i.e., milligrams of carbon per liter
weighted for channel dimensions and discharge to
estimate milligrams of carbon per square meter per
day), a rate of 14.6 g C�m2�d�1 is obtained, only ;9% of
FIG. 6. Areal uptake, U (mg�m�2�h�1) at ambient concentrations of NH4þ-N vs. GPP (g C�m�2�d�1) and ER (g C�m�2�d�1; see
Fig. 1) in Ivishak Spring, Alaska (March 2007–August 2009).
October 2014 2833METABOLISM OF AN ARCTIC STREAM
which would be required to support apparent demands
of heterotrophic ER at PAR ¼ 0.0 lmol�m�2�s�1.Although no spatial (i.e., along the study reach) or
seasonal patterns of DOC concentration were evident,
there was a weak, positive relationship between DOC
and ER (see Results: Dissolved organic carbon), suggest-
ing that ER may be controlled to some degree by DOC
availability. Potential sources of highly labile DOC are
present in the form of large populations of terrestrial,
semi-aquatic, and aquatic bryophytes. Although low
decomposition rates for bryophytes have been routinely
reported, DOC leachates from bryophytes of Alaskan
boreal forests have been shown to be surprisingly labile,
with losses of DOC as high as 90% reported for
Sphagnum leachate incubated with natural microbial
communities (Wickland et al. 2007). Although specula-
tive, the support of relatively low rates of year-round
heterotrophic respiration in Ivishak Spring by high-
quality DOC imported from upslope sources seems
plausible, as is the possibility that seasonal differences in
lability of the DOC pool (e.g., Holmes et al. 2008)
contributed to the seasonal cycle of ER.
Nutrient uptake and ecosystem metabolism
Lack of detectable uptake of SRP, combined with
relatively high uptake rates of NH4þ-N, indicates that
the metabolism of Ivishak Spring is limited by nitrogen,
which was unexpected due to the demonstration of
phosphorus limitation of ecosystem processes in other
streams within the region (e.g., Peterson et al. 1985).
Given the apparent level of nitrogen limitation, it was
also surprising that uptake of NO3�-N was so low (i.e.,
usually not detectable). The high rates of NH4þ-N
uptake relative to NO3�-N presumably reflect demands
by bryophytes, the dominant form of biomass in Ivishak
Spring. Although there is no available information
regarding the nutrient requirements of Cratoneuron
filicinum, the bryophyte species that carpets the stream
bottom there, studies of bryophytes elsewhere have
shown a marked preference for ammonium assimilation
compared to nitrate (Richey et al. 1985, Jauhiainen et al.
1998, Turetsky 2003). For example, Richey et al. (1985)
used a microcosm approach to assess N uptake by
bryophytes in Hubbard Brook, New Hampshire, USA,
and showed that bryophytes removed 59% of dissolved
NH4þ-N but only 4% of dissolved NO3
�-N during
controlled incubations. The fate of the NH4þ-N that was
lost from the water column during our solute releases is
unknown, but an earlier study at Ivishak Spring using
releases of 15NH4þ-N indicated that most uptake was
assimilatory, with only ;20% being lost via nitrification
during the summer months (B. J. Peterson, J. P.
Benstead, D. M. Sanzone, and A. D. Huryn, unpublished
data).
The high rates of GPP measured at Ivishak Spring
during periods of high light availability were reflected by
similarly high rates of ammonium uptake, both as
uptake velocity (Vf ) and areal uptake (U). Uptake
velocities measured for NH4þ-N ranged from 11 to 146
mm/min (annual mean ¼ 55 mm/min) and are compa-
rable with some of the highest estimates recorded (i.e.,
Webster et al. 2003: Table 3, Simon et al. 2005: Table 4).
Of the 20 streams for which ammonium Vf were
reported by these authors, only Pole Cat Creek, a
physically stable, Wyoming spring-stream, showed a
range of maximum Vf values (48–126 mm/min) compa-
rable to Ivishak Spring (Hall et al. 2003). The highest
rates of areal uptake of NH4þ-N by relatively undis-
turbed stream communities have been documented for
systems with dense beds of vascular macrophytes where
rates as high as 20þ mg NH4þ-N�m�2�h�1 have been
reported (Rasmussen et al. 2011, Riis et al. 2012).
Streams with dense carpets of bryophytes can also show
relatively high rates of ammonium uptake (e.g., 8–12 mg
NH4þ-N�m�2�h�1 [Kopacek and Blazka 1994]). Al-
though well below these estimates, maximum areal rates
of NH4þ-N uptake for Ivishak Spring are relatively high
(4.9 mg NH4þ-N�m�2�h�1) when compared with streams
studied by Webster et al. (2003) and Simon et al. (2005);
only 2 of 20 streams for which ammonium uptake rates
were reported by these authors showed higher maximum
uptake rates. Given the relatively high autotrophic
biomass of Ivishak Spring, high rates of GPP, and the
apparent efficacy of stream bryophytes in removing
ammonium from the water column (Richey et al. 1985),
the high rates of Vf and U we have documented seem
reasonable.
The strong synchrony between metrics describing
ammonium uptake (U) and both GPP and ER indicate
that annual patterns of light availability play a
significant role in determining annual patterns of
nutrient uptake at Ivishak Spring. The important effects
of GPP and ER on temporal patterns of nutrient supply
within stream ecosystems have been demonstrated only
relatively recently (Hall and Tank 2003, Roberts and
Mulholland 2007, Valett et al. 2008, Johnson and Tank
2009, Heffernan and Cohen 2010, Finlay et al. 2011). Of
these, Roberts and Mulholland (2007) is probably most
relevant here. These authors showed that seasonal
variations in light availability caused by a deciduous
tree canopy drove seasonal cycles of GPP in a spring-
stream (Walker Branch, Tennessee) that, in turn,
resulted in measurable changes in DIN uptake (DIN U
highest during April when the forest canopy was open
and lowest during July when canopy was closed). In a
sense, the extreme seasonal light regime of Ivishak
Spring paralleled the forest canopy effect used by
Roberts and Mulholland (2007) to assess the relation-
ship between stream ecosystem metabolism and DIN
uptake. Both studies used intensive, relatively long-term
sampling designs to show repeated annual patterns that
provide robust evidence for the importance of in-stream
biological processes as factors controlling the nutrient
dynamics of stream ecosystems. The study at Ivishak
Spring, however, is perhaps the first ecosystem-level
demonstration of the effect of light availability on
ALEXANDER D. HURYN ET AL.2834 Ecology, Vol. 95, No. 10
annual patterns of nutrient uptake by stream commu-
nities without the strongly confounding effects of
seasonal temperature variation.
Is light rather than temperature the primary driver
of ER at Ivishak Spring?
Our findings suggest that ER is limited primarily by
the supply of organic carbon during winter when rates of
GPP were at their lowest levels (Fig. 1d). Two lines of
evidence support this conclusion: (1) a strong relation-
ship between GPP and ER showing that these processes
were closely coupled (Fig. 3), and (2) an Arrhenius
relationship (White et al. 2012) between temperature
and ER that, rather than being linear, follows a step
function that is synchronous with seasonal patterns of
light availability (see Discussion: Is there evidence for
organic carbon limitation of ecosystem respiration?; Fig.
7).
Although examples are relatively uncommon, close
coupling of GPP and ER, as observed for Ivishak
Spring, has been documented for other stream ecosys-
tems. Townsend et al. (2011), for example, demonstrated
close coupling (R2 ¼ 0.79–0.99) of GPP and ER for
several tributaries of a tropical Australian river. On the
basis of a P/R ratio�1, these authors suggested that the
coupling of GPP and ER resulted from a ‘‘priming
effect’’ where the release of labile organic compounds
from active primary producers results in a parallel
increase in the activity of heterotrophic microbes (e.g.,
Guenet et al. 2010). Other examples include a phyto-
plankton-dominated river system in Australia (Oliver
and Merrick 2006) and lake-outlet streams in Switzer-
land (Uehlinger 1993) and Nevada (Davis et al. 2012). In
these cases GPP and ER were apparently coupled
because autotrophic biomass made up a large propor-
tion of the total organic matter pool, and thus the
respiration of the autotrophs themselves dominated ER.
At Ivishak Spring we attribute the close coupling of
GPP and ER to an ecosystem metabolism dominated by
autotrophs (87% of mean total particulate organic
matter mass), primarily bryophytes, and to the potential
control of ER by carbon limitation during winter when
photosynthesis is minimal.
Is there evidence for organic carbon limitation
of ecosystem respiration?
The rapid decline of ER from summer to winter
combined with minor changes in water temperature
(Fig. 7) suggests that seasonal carbon limitation of
ecosystem processes at Ivishak Spring is possible.
Assessing this using the data at hand, however, is
complicated because water temperature and light
availability are confounded (even though the range of
water temperature during the duration of our 30-month
study was only 2.88C). As a consequence, the control of
seasonal patterns of ER due to temperature (via direct
thermal-kinetic effects) or light availability (via indirect
factors such as nutrient limitation or a ‘‘priming effect’’;
Guenet et al. 2010), rather than carbon limitation per se
cannot be directly assessed. When patterns of semi-
monthly rates of GPP and ER are visualized using an
Arrhenius plot (Fig. 7), however, some insight into
potential controlling factors is gained. Arrhenius plots
of both GPP and ER are similar, showing relatively
constant rates as water temperatures decrease from
;78C to 58C, followed by a sudden decline to very low
rates below ;58C (Fig. 7). Our ability to estimate
apparent metabolic activation energies from the slope of
our Arrhenius plots of GPP and ER was problematical
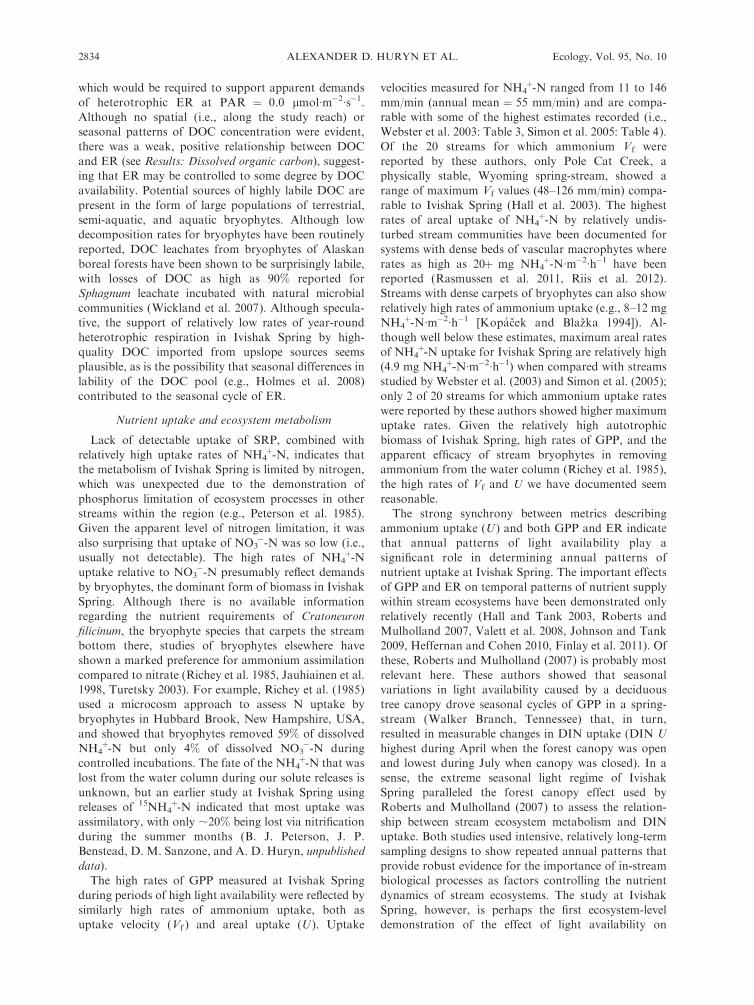
FIG. 7. Arrhenius plots of (a) ln GPP (original values inunits of g C�m�2�d�1) and (b) ln ER (original units, gC�m�2�d�1) measured semimonthly in Ivishak Spring, Alaska(March 2007–August 2009). PAR (original units, lmol�m�2�s�1)is plotted to provide information about the temperature–lightrelationship. Open circles are PAR, large solid circles are ER orGPP, lines are plots of least-square fit equations with slopesconstrained to the activation energies predicted for (a) GPP(i.e., activation energy of RuBisCO carboxylation ; 0.3 eV)and (b) ER (i.e., ;0.65eV).
October 2014 2835METABOLISM OF AN ARCTIC STREAM
due to the extremely small range of kT�1 (41.4–41.8
kT�1) encountered at the field site (where k is the
Boltzman constant, and T is temperature in degrees
kelvin). Nevertheless, the plots of GPP and ER within a
range of ;78C to 58C are consistent with plots of least-
square equations with slopes constrained by the
activation energies predicted for photosynthesis (i.e.,
;0.3 eV) and respiration (;0.6–0.7 eV [Allen et al.
2005]). At temperatures below ;58C, however, the
observed temperature dependence of both GPP and
ER breaks down, which indicates that factors other than
temperature are primary drivers of these processes (Fig.
7). In the case of GPP, this factor is undoubtedly light
availability. From October through March, when stream
temperatures are often ,58C, photosynthesis is con-
trolled primarily by light limitation, and so the
photosynthesis–temperature relationship during this
period is inconsequential. The similar nonlinearity in
the relationship between ER and kT�1 (Fig. 7),
however, is assumed to be due to carbon limitation
caused by the exhaustion of photosynthate required to
drive respiration, which similarly renders the ER–
temperature relationship during this period inconse-
quential. As was observed for GPP and ER, an
Arrhenius plot of ammonium U also showed apparent
temperature dependence only during high light avail-
ability (i.e., water temperatures greater than ;58C; data
not shown). During winter, uptake rates become
independent of temperature while declining precipitous-
ly. The fact that ER and ammonium U were estimated
using completely independent approaches, combined
with the close synchrony of their annual cycles with
those of light and their essentially identical Arrhenius
relationships, provides strong support for temporal
patterns of both ER and NH4þ-N uptake in Ivishak
Spring being controlled primarily by fluctuations in light
availability.
A similar ER–temperature anomaly has been reported
for other stream ecosystems by Valett et al. (2008).
These authors assessed ER–temperature relationships
for open-canopy and closed-canopy (forested) streams.
For open-canopied streams, they showed the expected
positive relationships between ER and temperature
(Enquist et al. 2003), but forested streams showed a
surprising negative relationship. Valett et al. (2008)
interpreted these findings in the context of ‘‘endoge-
nous’’ (e.g., light, heat, internal nutrient cycling) vs.
‘‘exogenous’’ (e.g., imported organic matter) control of
ecosystem metabolism. In open-canopied streams, ER
was hypothesized to be controlled primarily by internal
nutrient cycling and diel cycles of light and heat input,
and thus conformed to relationships predicted by
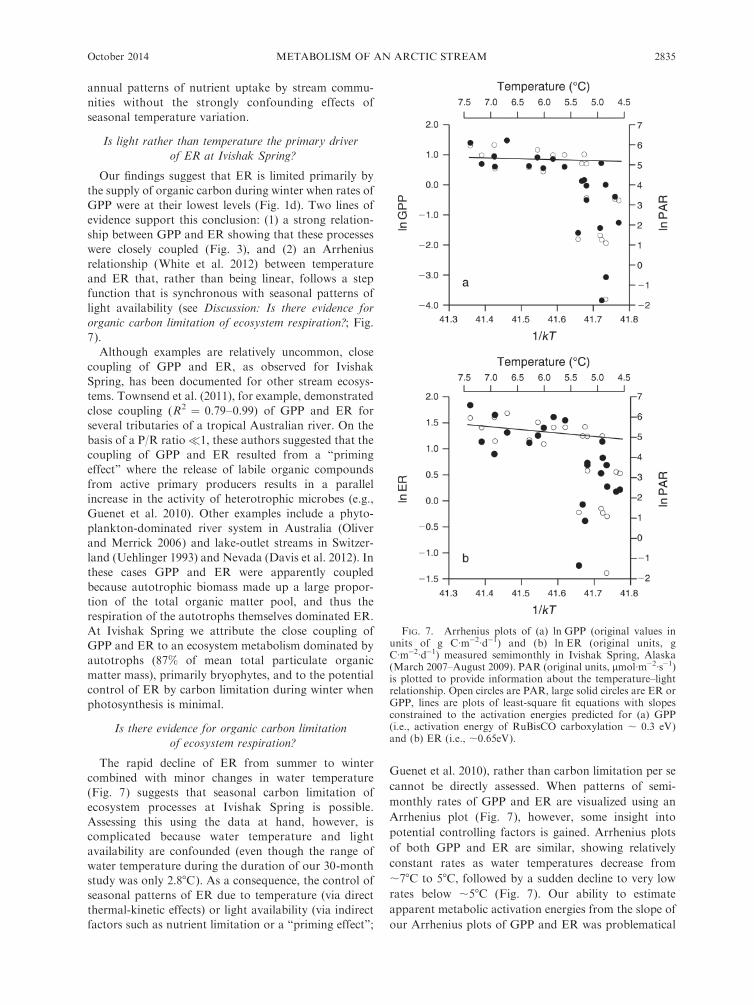
PLATE 1. Photo of the study reach of Ivishak Spring stream (69.0238148 N, 147.7213358 W, Alaska, USA) taken on 25 January2008. The air temperature at the time this photo was taken was�40.08C; the water temperature was ;58C.
ALEXANDER D. HURYN ET AL.2836 Ecology, Vol. 95, No. 10

metabolic theory (i.e., positive relationship between ER
and temperature [Enquist et al. 2003]). In the case of the
forest streams, the ER–temperature relationship was
controlled primarily by a pulsed, seasonal input of
allochthonous organic matter (terrestrial leaf litter)
resulting in high levels of ER during autumn and winter
when annual temperatures were at their lowest, and thus
conformed poorly to predictions based on metabolic
theory (i.e., negative relationship between ER and
temperature). Although the anomalous ER–temperature
relationships revealed by Valett et al. (2008) and the
present study appear to be due to markedly different
processes (i.e., periodic allochthonous carbon surplus vs.
autochthonous carbon deficit), such differences are more
apparent than real; the ER–temperature anomaly in
both cases was caused by a predictable, temporally
pulsed change in the availability of a limiting resource
(i.e., terrestrial leaf litter vs. light).
In summary, we found light availability, not temper-
ature, to be the major driver of annual cycles of GPP,
ER, ammonium uptake, and carbon limitation in the
highly productive Ivishak Spring ecosystem. The un-
usual annual light and temperature regimes of this arctic
spring allowed us to test predictions about the effect of
seasonal light availability on ecosystem processes (Fig.
1), with only minimally confounding effects of temper-
ature. Our results provide compelling evidence of carbon
limitation of ER during winter due to the cessation or
near-cessation of photosynthesis (Fig. 1d). The strongest
evidence, however, is the absence of temperature
dependence of the relatively low rates of ER detected
during the dark months (October–March; Fig. 7). Our
results and those of Valett et al. (2008) show the
importance of assessing the nonlinear effects of punctu-
ated shifts in resource abundance/limitation when
deriving ecosystem-level metabolism–temperature rela-
tionships. Our results are also relevant to predicting
future scenarios for arctic watersheds affected by global
climate change. General circulation models predict
significant winter warming for the Arctic during this
century (IPCC 2013). As this warming proceeds, the
number of headwater streams with perennial flow and
annual patterns of ecosystem metabolism driven by
periods of seasonal darkness will likely increase (e.g.,
Huryn et al. 2005). Finally, our results are relevant to
recent attempts to estimate stream ecosystem metabo-
lism using modeling approaches that are based on
expectations that water temperature is an accurate
predictor of ER and that resource limitation is absent
(e.g., Riley and Dodds 2013). Clearly, inaccurate
estimates of ER would result if such approaches were
applied either to the Ivishak Spring ecosystem (i.e., too
high) or the forested stream ecosystems studies by Valett
et al. (2008, i.e., too low) in the winter months. The
combination of extreme seasonal fluctuations in light
availability and relatively constant and moderate
temperatures is an anomaly provided by perennially
flowing arctic springs. Such ecosystems are uncommon
and relatively small. Consequently, it is difficult to
defend them as models for studying general ecosystem
processes. What extreme ecosystems such as these offer,however, is the opportunity to exploit ‘‘natural manip-
ulations’’ of ecosystem drivers that are otherwise
extremely difficult or impossible to alter experimentally
at the large spatial scales traditionally used to delimitecosystems. In the case of Ivishak Spring, we were able
to assess the ecosystem effects of annual light regime
without significant confounding effects of temperature
over a 30-month period. Perhaps as importantly, theIvishak Spring system allowed us to identify how
pervasive the annual synchrony between light and
temperature is in most ecosystems, and how theconfounding of these factors may obscure details of
the mechanisms by which these fundamental drivers
affect ecosystem processes.
ACKNOWLEDGMENTS
We thank Naomi Whitty and Matt Irinaga (CH2M HILLPolar Services) for excellent logistical support, and EdSerrano, Pele Tierney, Jonas Calvillo, Bryan Minnear, DonHerbert, Ryan Porhola, and Scott Nicholson (all helicopterpilots for Bristow, formerly Air Logistics) for safe, year-roundtransportation to and from Ivishak Spring. We also thankMichael Kendrick, James Ramsey, and Jenna Cook (Univer-sity of Alabama) for help in the field and laboratory, and AnneGiblin (Marine Biological Laboratory, Woods Hole, Massa-chusetts) for assisting the development of methods forsampling SF6 in the field. Wyatt Cross (Montana StateUniversity), Michael Kendrick, and two anonymous reviewersprovided helpful criticism of an earlier draft of the manuscript.Funding for this study was provided to A. D. Huryn and J. P.Benstead by the National Science Foundation (OPP-0611995).
LITERATURE CITED
Allen, A. P., J. F. Gillooly, and J. H. Brown. 2005. Linking theglobal climate cycles to individual metabolism. FunctionalEcology 19:202–213.
APHA. 1998. Standard methods for the examination of waterand wastewater. 20th edition. American Public HealthAssociation, Washington, D.C., USA.
Benstead, J. P., and A. D. Huryn. 2011. Extreme seasonality oflitter breakdown in an arctic spring-fed stream is driven byshredder phenology, not temperature. Freshwater Biology56:2034–2044.
Bernot, M. J., et al. 2010. Inter-regional comparison of land-useeffects on stream metabolism. Freshwater Biology 55:1874–1890.
Bott, T. L. 2006. Primary productivity and communityrespiration. Pages 663–690 in F. R. Hauer and G. A.Lamberti, editors. Methods in stream ecology. Secondedition. Academic Press, San Diego, California, USA.
Bowden, W. B., B. J. Peterson, L. A. Deegan, A. D. Huryn,J. P. Benstead, H. Golden, M. Kendrick, S. M. Parker, E.Schuett, and J. E. Hobbie. 2014. Ecology of streams of theToolik Region. Pages 173–237 in J. E. Hobbie and G. W.Kling, editors. A changing arctic: ecological consequences fortundra, streams and lakes. Oxford University Press, NewYork, New York, USA.
Cushing, C. E., and E. G. Wolf. 1984. Primary production inRattlesnake Springs, a cold desert spring-stream. Hydro-biologia 114:229–236.
Davis, C. J., C. H. Fritsen, E. D. Wirthlin, and J. C. Memmott.2012. High rates of primary productivity in a semi-aridtailwater: implications for self-regulated production. RiverResearch and Applications 28:1820–1829.
October 2014 2837METABOLISM OF AN ARCTIC STREAM

Degerman, R., J. Dinasquet, L. Rieman, S. Sjostedt de Luna,and A. Andersson. 2013. Effect of resource availability onbacterial community responses to increased temperature.Aquatic Microbial Ecology 68:131–142.
Dossena, M., G. Yvon-Durocher, J. Grey, J. M. Montoya,D. M. Perkins, M. Trimmer, and G. Woodward. 2012.Warming alters community size structure and ecosystemfunctioning. Proceedings of the Royal Society B 279:3011–3019.
Enquist, B. J., E. P. Economo, T. E. Huxman, A. P. Allen,D. D. Ignace, and J. F. Gillooly. 2003. Scaling metabolismfrom organisms to ecosystems. Nature 423:639–642.
Fellows, C. S., H. M. Valett, and C. N. Dahm. 2001. Whole-stream metabolism in two montane streams: contribution ofthe hyporheic zone. Limnology and Oceanography 46:523–531.
Fellows, C. S., H. M. Valett, C. N. Dahm, P. J. Mulholland,and S. A. Thomas. 2006. Coupling nutrient uptake andenergy flow in headwater streams. Ecosystems 9:788–804.
Finlay, J. C., J. M. Hood, M. P. Limm, M. E. Power, J. D.Schade, and J. R. Welter. 2011. Light-mediated thresholds instream-water nutrient composition in a river network.Ecology 92:140–150.
Fisher, S. G. 2006. Stream ecosystems of the western UnitedStates. Pages 61–88 in C. E. Cushing, K. W. Cummins, andG. W. Minshall, editors. Rivers and stream ecosystems of theworld, with a new introduction. University of CaliforniaPress, Berkeley, California, USA.
Guenet, B., M. Danger, L. Abbadie, and G. Lacroix. 2010.Priming effect: bridging the gap between terrestrial andaquatic ecology. Ecology 91:2850–2861.
Hall, R. O., Jr., and J. L. Tank. 2003. Ecosystem metabolismcontrols nitrogen uptake in streams in Grand Teton NationalPark, Wyoming. Limnology and Oceanography 48:1120–1128.
Hall, R. O., Jr., and J. L. Tank. 2005. Correcting whole-streamestimates of metabolism for groundwater input. Limnologyand Oceanography: Methods 3:222–229.
Hall, R. O., Jr., J. L. Tank, and M. F. Dybdahl. 2003. Exoticsnails dominate nitrogen and carbon cycling in a highlyproductive stream. Frontiers in Ecology and the Environ-ment 1:407–411.
Hall, R. O., Jr., et al. 2009. Nitrate removal in streamecosystems measured by 15N addition experiments: totaluptake. Limnology and Oceanography 54:653–665.
Heffernan, J. B., and M. J. Cohen. 2010. Direct and indirectcoupling of primary production and diel nitrate dynamics ina subtropical spring-fed river. Limnology and Oceanography55:677–688.
Holmes, R. M., A. Aminot, R. Kerouel, B. A. Hooker, andB. J. Peterson. 1999. A simple and precise method formeasuring ammonium in marine and freshwater ecosystems.Canadian Journal of Fisheries and Aquatic Sciences 56:1801–1808.
Holmes, R. M., J. W. McClelland, P. A. Raymond, B. B.Frazer, B. J. Peterson, and M. Stieglitz. 2008. Lability ofDOC transported by Alaskan rivers to the Arctic Ocean.Geophysical Research Letters 35:L03402.
Huryn, A. D., and J. E. Hobbie. 2012. Land of extremes: anatural history of the arctic North Slope of Alaska.University of Alaska Press, Fairbanks, Alaska, USA.
Huryn, A. D., K. A. Slavik, R. L. Lowe, S. M. Parker, D. S.Anderson, and B. J. Peterson. 2005. Landscape heterogeneityand the biodiversity of Arctic stream communities: a habitattemplate analysis. Canadian Journal of Fisheries and AquaticSciences 62:1905–1919.
IPCC. 2013. Working Group I contribution to the Intergov-ernmental Panel on Climate Change Fifth AssessmentReport. Climate change 2013: the physical sciences basissummary for policymakers. Cambridge University Press,Cambridge, UK.
Jauhiainen, J., B. Wallen, and N. Malmer. 1998. PotentialNH4
þ and NO3� uptake in seven Sphagnum species. New
Phytologist 138:287–293.Johnson, L. T., and J. L. Tank. 2009. Diurnal variation indissolved organic matter and ammonium uptake in six open-canopy streams. Journal of the North American Bentholog-ical Society 28:694–708.
Jones, J. B., Jr., S. G. Fisher, and N. B. Grimm. 1995. Verticalhydrologic exchange and ecosystem metabolism in a SonoranDesert stream. Ecology 76:942–952.
Jones, J. B., Jr., J. D. Schade, S. G. Fisher, and N. B. Grimm.1997. Organic matter dynamics in Sycamore Creek, a desertstream in Arizona, USA. Journal of the North AmericanBenthological Society 16:78–82.
Kopacek, J., and P. Blazka. 1994. Ammonium uptake in alpinestreams in the High Tatra Mountains (Slovakia). Hydro-biologia 294:157–165.
Lopez-Urrutia, A., and X. A. G. Moran. 2007. Resourcelimitation of bacterial production distorts the temperaturedependence of oceanic carbon cycling. Ecology 88:817–822.
Marzolf, E. R., P. J. Mulholland, and A. D. Steinman. 1994.Improvements to the diurnal upstream-downstream dis-solved oxygen change technique for determining whole-stream metabolism in small streams. Canadian Journal ofFisheries and Aquatic Sciences 51:1591–1599.
Matheson, F. E., J. M. Quinn, and M. L. Martin. 2012. Effectsof irradiance on diel and seasonal patterns of nutrient uptakeby stream periphyton. Freshwater Biology 57:1617–1630.
Minshall, G. W. 1978. Autotrophy in stream ecosystems.BioScience 28:767–771.
Mulholland, P. J. 2004. The importance of in-stream uptake forregulating stream concentrations and outputs of N and Pfrom a forested watershed: evidence from long-term chem-istry records for Walker Branch Watershed. Biogeochemistry70:403–426.
Mulholland, P. J., et al. 2001. Inter-biome comparison offactors controlling stream metabolism. Freshwater Biology46:1503–1517.
Mulholland, P. J., et al. 2002. Can uptake length in streams bedetermined by nutrient addition experiments? Results froman interbiome comparison study. Journal of the NorthAmerican Benthological Society 21:544–560.
Murphy, J., and J. P. Riley. 1962. A modified single solutionmethod for the determination of phosphate in natural waters.Analytica Chimica Acta 27:31–36.
Oliver, R. L., and C. J. Merrick. 2006. Partitioning of rivermetabolism identifies phytoplankton as a major contributorin the regulated Murray River (Australia). FreshwaterBiology 51:1131–1148.
Owens, M. 1969. In running waters. Pages 92–96 in R. A.Vollenweider, editor. A manual for measuring primaryproduction in aquatic environments. IPB Handbook No.12, International Biological Programme. F. A. Davis,Philadelphia, Pennsylvania, USA.
Parker, S. M., and A. D. Huryn. 2006. Food web structure andfunction in two Arctic streams with contrasting disturbanceregimes. Freshwater Biology 51:1249–1263.
Parker, S. M., and A. D. Huryn. 2011. Effects of naturaldisturbance on stream communities: a habitat templateanalysis of Arctic headwater streams. Freshwater Biology56:1342–1357.
Payn, R. A., J. R. Webster, P. J. Mulholland, H. M. Valett, andW. K. Dodds. 2005. Estimation of stream nutrient uptakefrom nutrient addition experiments. Limnology and Ocean-ography 3:174–182.
Peterson, B. J., et al. 1985. Transformation of a tundra riverfrom heterotrophy to autotrophy by addition of phosphorus.Science 229:1383–1386.
Pielou, E. C. 1994. A naturalist’s guide to the Arctic. Universityof Chicago Press, Chicago, Illinois, USA.
ALEXANDER D. HURYN ET AL.2838 Ecology, Vol. 95, No. 10

Rasmussen, J. J., A. Baattrup-Pedersen, T. Riis, and N.Friberg. 2011. Stream ecosystem properties and processesalong a temperature gradient. Aquatic Ecology 45:231–242.
Richey, J. S., W. H. McDowell, and G. E. Likens. 1985.Nitrogen transformations in a small mountain stream.Hydrobiologia 124:129–139.
Riis, T., W. K. Dodds, P. B. Kristensen, and A. J. Baisner.2012. Nitrogen cycling and dynamics in a macrophyte-richstream as determined by a 15N-NH4
þ release. FreshwaterBiology 57:1579–1591.
Riley, A. J., and W. K. Dodds. 2013. Whole streammetabolism: strategies for measuring and modeling dieltrends of dissolved oxygen. Freshwater Science 32:56–69.
Roberts, B. J., and P. J. Mulholland. 2007. In-stream bioticcontrol on nutrient biogeochemistry in a forested stream,West Fork of Walker Branch. Journal of GeophysicalResearch 112:G04002.
Roberts, B. J., P. J. Mulholland, and W. R. Hill. 2007. Multiplescales of temporal variability in ecosystem metabolism rates:results from 2 years of continuous monitoring in a forestedheadwater stream. Ecosystems 10:588–606.
Simon, K. S., C. R. Townsend, B. J. F. Biggs, and W. B.Bowden. 2005. Temporal variation of N and P uptake in 2New Zealand streams. Journal of the North AmericanBenthological Society 24:1–18.
Slavik, K. A., B. J. Peterson, L. A. Deegan, W. B. Bowden,A. E. Hershey, and J. E. Hobbie. 2004. Long-term responsesof the Kuparuk River ecosystem to phosphorus fertilization.Ecology 85:939–954.
Taylor, B. W., C. F. Keep, R. O. Hall, Jr., B. J. Koch, L. M.Tronstad, A. S. Flecker, and A. J. Ulseth. 2007. Improvingthe fluorometric ammonium method: matrix effects, back-ground fluorescence, and standard additions. Journal of theNorth American Benthological Society 26:167–177.
Townsend, S. A., I. T. Webster, and J. H. Schult. 2011.Metabolism in a groundwater-fed river system in theAustralian wet/dry tropics: tight coupling of photosynthesisand respiration. Journal of the North American Bentholog-ical Society 30:603–620.
Trimmer, M., J. Grey, C. M. Heppell, A. G. Hildrew, K.Lansdown, H. Stahl, and G. Yvon-Durocher. 2012. Riverbed carbon and nitrogen cycling: state of play and some newdirections. Science of the Total Environment 434:143–158.
Turetsky, M. R. 2003. The role of bryophytes in carbon andnitrogen cycling. Bryologist 106:395–409.
Uehlinger, U. 1993. Primary production and respiration in theoutlet of an eutrophic lake (River Glatt, Switzerland). Archivfur Hydrobiologie 128:39–55.
Valett, H. M., S. A. Thomas, P. J. Mulholland, J. R. Webster,C. N. Dahm, C. S. Fellows, C. L. Crenshaw, and C. G.Peterson. 2008. Endogenous and exogenous control ofecosystem function: N cycling in headwater streams. Ecology89:3515–3527.
von Shiller, D., E. Martı, J. L. Riera, M. Ribot, A. Argerichm,O. Fonolla, and F. Sabater. 2008. Inter-annual, annual, andseasonal variation of P and N retention in a perennial and anintermittent stream. Ecosystems 11:670–687.
Webster, J. R., and J. L. Meyer. 1997. Organic matter budgetsfor streams: a synthesis. Journal of the North AmericanBenthological Society 16:141–161.
Webster, J. R., et al. 2003. Factors affecting ammonium uptakein streams – an inter-biome perspective. Freshwater Biology48:1329–1352.
Webster, J. R., and H. M. Valett. 2006. Solute dynamics. Pages169–186 in F. R. Hauer and G. A. Lamberti, editors.Methods in stream ecology. Second edition. Academic Press,San Diego, California, USA.
White, E. P., X. Xiao, N. J. B. Isaac, and R. M. Sibly. 2012.Methodological tools. Pages 9–20 in J. H. Brown, R. M.Sibly, and A. Kodric-Brown, editors. Metabolic ecology: ascaling approach. Wiley-Blackwell, Chichester, UK.
Wickland, K. P., J. C. Neff, and G. R. Aiken. 2007. Dissolvedorganic carbon in Alaskan boreal forests: sources, chemicalcharacteristics, and biodegradability. Ecosystems 10:1323–1340.
Ylla, I., A. M. Romani, and S. Sabater. 2007. Differentialeffects of nutrients and light on the primary production ofstream algae and mosses. Fundamental and Applied Lim-nology 170/1:1–10.
Yoshikawa, K., L. D. Hinzman, and D. L. Kane. 2007. Springand aufeis (icing) hydrology in Brooks Range, Alaska.Journal of Geophysical Research 112:1–14.
Young, R. G., and A. D. Huryn. 1998. Comment: Improve-ments to the diurnal upstream-downstream dissolved oxygenchange technique for determining whole-stream metabolismin small streams. Canadian Journal of Fisheries and AquaticSciences 55:1784–1785.
Young, R. G., and A. D. Huryn. 1999. Effects of land-use onstream metabolism and organic matter turnover. EcologicalApplications 9:1359–1376.
Young, R. G., C. D. Matthaei, and C. R. Townsend. 2008.Organic matter breakdown and ecosystem metabolism:functional indicators for assessing river ecosystem health.Journal of the North American Benthological Society 27:605–625.
SUPPLEMENTAL MATERIAL
Appendix
Supporting material including a detailed description of methods; one table summarizing relevant variables used to calculatemetabolism and nutrient uptake; and five figures showing location of Ivishak Spring; ER and GPP vs. day of the year; summary ofdaily PAR, air temperature, and water temperature; GPP, ER, NEP vs. water temperature; and seasonal patterns of organic matterbiomass and DOC concentration (Ecological Archives E095-245-A1).
October 2014 2839METABOLISM OF AN ARCTIC STREAM


![Untitled-2 []...seasonal truffle, salmon heart Taxes and service are included Seasonal truffles according to availability: Black winter truffle, summer truffle or Bourgogne truffle](https://img.pdfslide.us/doc/110x75/6036e51bda7142400b28ccd9/untitled-2-seasonal-truffle-salmon-heart-taxes-and-service-are-included.jpg)