Embed Size (px)
Citation preview

1
Seasonal and secular trends of cardiovascular, nutritional, and inflammatory markers in hemodialysis
patients
Zachary Terner1, Andrew Long2, Marta Reviriego-Mendoza2, John W Larkin2, Len A Usvyat2, Peter
Kotanko3,4, Franklin W Maddux2, Yuedong Wang1
Affiliations:
1University of California Santa Barbara, Santa Barbara, CA, United States; 2Fresenius Medical Care,
Global Medical Office, MA, United States; 3Renal Research Institute, New York, NY, United States; 4Icahn
School of Medicine at Mount Sinai, New York, NY, United States
Corresponding Author:
Peter Kotanko, MD, FASN, Renal Research Institute, 315 East 62nd Street, 4th Floor, New York, NY
10065, E-mail: [email protected]
Kidney360 Publish Ahead of Print, published on January 23, 2020 as doi:10.34067/KID.0000352019
Copyright 2020 by American Society of Nephrology.

2
Abstract:
Background:
All life on earth has adapted to the effects of changing seasons. The general and end stage kidney
disease (ESKD) populations exhibit seasonal rhythms in physiology and outcomes. The ESKD population
also shows secular trends over calendar time that can convolute the influences of seasonal variations.
We conducted an analysis that simultaneously considered both seasonality and calendar time to isolate
these trends for cardiovascular, nutrition, and inflammation markers.
Methods:
We used data from adult hemodialysis (HD) patients in the United States from 2010 through 2014. An
additive model accounted for variations over both calendar time and time on dialysis. Calendar time
trends were decomposed into seasonal and secular trends. Bootstrap procedures and likelihood ratio
methods tested if seasonal and secular variations exist.
Results:
We analyzed data from 354,176 HD patients at 2,436 clinics. Patients were 59±15 years old, 57% male,
61% with diabetes. Isolated average secular trends showed decreases in pre-HD systolic blood pressure
(pre-SBP) of 2.6 mmHg (95%CI 2.4 to 2.8) and interdialytic weight gain (IDWG) of 0.35 kg (95%CI 0.33 to
0.36), yet increases in post-HD weight of 2.76 kg (95%CI 2.58 to 2.97). We found independent seasonal
variations of 3.3 mmHg (95%CI 3.1 to 3.5) for pre-SBP, 0.19 kg (95%CI 0.17 to 0.20) for IDWG, and 0.62
kg (95%CI 0.46 to 0.79) for post-HD weight, as well as, 0.12 L (95%CI 0.11 to 0.14) for ultrafiltration
volume, 0.41 mL/kg/hr (95%CI 0.37 to 0.45) for ultrafiltration rates, and 3.30 (95%CI 2.90 to 3.77)
hospital days per patient year, which were higher in winter versus summer.

3
Conclusions:
HD patients show marked seasonal variability of key indicators. Secular trends indicate decreasing blood
pressure and IDWG and increasing post-HD weight. These methods will be of importance for
independently determining seasonal and secular trends in future assessments of population health.
4
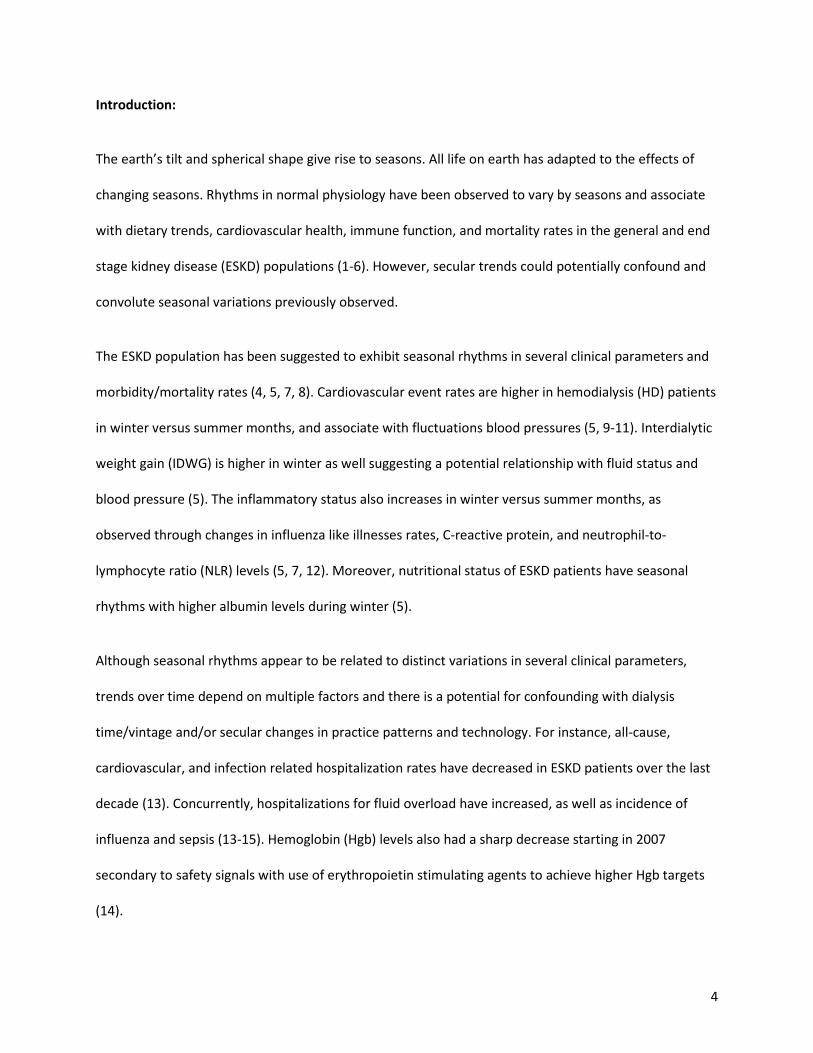
Introduction:
The earth’s tilt and spherical shape give rise to seasons. All life on earth has adapted to the effects of
changing seasons. Rhythms in normal physiology have been observed to vary by seasons and associate
with dietary trends, cardiovascular health, immune function, and mortality rates in the general and end
stage kidney disease (ESKD) populations (1-6). However, secular trends could potentially confound and
convolute seasonal variations previously observed.
The ESKD population has been suggested to exhibit seasonal rhythms in several clinical parameters and
morbidity/mortality rates (4, 5, 7, 8). Cardiovascular event rates are higher in hemodialysis (HD) patients
in winter versus summer months, and associate with fluctuations blood pressures (5, 9-11). Interdialytic
weight gain (IDWG) is higher in winter as well suggesting a potential relationship with fluid status and
blood pressure (5). The inflammatory status also increases in winter versus summer months, as
observed through changes in influenza like illnesses rates, C-reactive protein, and neutrophil-to-
lymphocyte ratio (NLR) levels (5, 7, 12). Moreover, nutritional status of ESKD patients have seasonal
rhythms with higher albumin levels during winter (5).
Although seasonal rhythms appear to be related to distinct variations in several clinical parameters,
trends over time depend on multiple factors and there is a potential for confounding with dialysis
time/vintage and/or secular changes in practice patterns and technology. For instance, all-cause,
cardiovascular, and infection related hospitalization rates have decreased in ESKD patients over the last
decade (13). Concurrently, hospitalizations for fluid overload have increased, as well as incidence of
influenza and sepsis (13-15). Hemoglobin (Hgb) levels also had a sharp decrease starting in 2007
secondary to safety signals with use of erythropoietin stimulating agents to achieve higher Hgb targets
(14).

5
Prior studies of seasonality have not accounted for longitudinal trends over calendar time (secular
trends) and dialysis vintage that could confound observations and incorrectly estimate or mask seasonal
trends. In this study, we evaluated whether seasonal variations exist in an array of clinical variables
accounting for calendar time and dialysis vintage. To reduce potential bias in estimation, we modeled
trends over both calendar time and dialysis vintage jointly using an additive model. We hypothesized
seasonal variations would be found in clinical markers of cardiovascular function, nutritional health, and
inflammation. We also characterized the profiles of secular trends over time accounting for seasonal
variations and dialysis vintage.
Materials and Methods:
Study Design:
We studied the impacts of seasonality and era on clinical and laboratory parameters over five-years in
HD patients. We simultaneously analyzed seasonal effects and secular changes using nonparametric
smoothing spline models to fit data and calculate the magnitude of both secular changes and concurrent
seasonal variations. The protocol was reviewed by New England Independent Review Board who
determined this analysis of anonymized data was exempt and did not require consent (Needham
Heights, MA; NEIRB# 5723). Analysis was performed in adherence with the Declaration of Helsinki.
Setting and Participants:
We used existing data previously captured during HD performed at Fresenius Kidney Care outpatient
clinics in the United States. The data were collected in an anonymized manner from the Fresenius
Medical Care North America Knowledge Center Data Warehouse, which is a private electronic health
record database.

6
We included data from all adult patients (age ≥18 years) treated with HD anytime during the study
period of 01 January 2010 to 31 December 2014. This included data from patients being actively treated
by HD before and after 01 January 2010, as well as patients who initiated HD anytime during the study
period. We only excluded data from pediatric patients (age <18 years), and patients with no HD
treatment data available in any month.
Patients who temporarily discontinued outpatient HD (e.g. switch to peritoneal dialysis, home HD,
hospitalization with inpatient HD) or permanently discontinued dialysis (e.g. recovery of renal function,
transplant, withdrawal from dialysis, death) had data included for every month there was one or more
treatment record available. The follow-up period started at 01 January 2010 for patients who were
actively treated by HD at the beginning of the study period, or at the first date of HD for patients who
initiated HD during the study period.
Variables:
We assessed variables related to cardiovascular function, nutrition, and inflammation. Cardiovascular
parameters included pre-HD systolic/diastolic blood pressures (pre-SBP and pre-DBP). Nutritional
parameters included albumin levels, creatinine levels, body-mass index (BMI), Hgb, pre-HD and post-HD
weights, IDWG, and IDWG as percent of the post-HD weight (IDWG percent). Parameters related to
inflammation included white blood cell (WBC) counts, NLR, pre-HD and post-HD body temperatures. We
also assessed exploratory variables for ultrafiltration volume (UFV), ultrafiltration rate (UFR), and
hospital admission/day rates. Variables with more than one value available per month were averaged
monthly.
The impacts of era were defined as secular changes in population average monthly values from January
2010 through the five-year follow-up period. Seasonal variations in average monthly values were

7
defined as winter (December through February), spring (March through May), summer (June through
August), and autumn (September through November).
Analysis of Descriptive Data:
We tabulated the baseline descriptive statistics on patient characteristics for categorical variables at the
start of the study period (01 January 2010), or the first date of HD for people who initiated HD during
the study period (01 January 2010 to 31 December 2014). We calculated the baseline descriptive
statistics for continuous variables using the mean value over the 5-year study period. Continuous
variables are reported as mean and standard deviation (SD). Categorical variables are reported as counts
and proportions.
Analysis of Secular and Seasonal Trends:
To account for variations over both calendar time and dialysis vintage, we consider an additive
smoothing spline model with two components: a function for era/secular trends over calendar time and
a function for trend over time on HD. Specifically, we consider the model y(s,t)=f(s)+g(t)+ε(s,t) where
y(s,t) is the observation of a variable at calendar time s and time on HD t, f(s) corresponds to the trend
over calendar time, g(t) corresponds to the trend over time on HD, and ε(s,t)’s are random errors which
are assumed to be independent and identically distributed. For identifiability we assume that the
integration of g(t) over its domain equals zero. For flexibility we model both functions f and g using
splines. Specifically, we model the function f using a linear-periodic spline which decomposes the trend
over calendar time into two components: seasonal rhythm and secular trend (16). We model the
function over time on HD g using a cubic spline (16). Even though the trend over time on HD is
interesting, we present the estimates and Bayesian confidence intervals (16) for seasonal variations and

8
secular trends (i.e. two components in the function f) to narrow the scope of this investigation. Analyses
were conducted with R version 3.4.4 (17) using package assist (18).
We tested the significance of seasonal variations using both F and likelihood ratio test statistics with p-
values calculated based on 500 bootstrap samples. The p-values for the hypothesis of non-zero seasonal
trend for all variables are smaller than 7 * 10-5. Therefore, all variables have statistically significant
trends. We computed the magnitudes of secular and seasonal trends as the difference between
maximum and minimum values of spline estimates and 95% confidence intervals based on 500
bootstrap samples.
Results:
Setting:
We assessed data from 354,176 adult HD patients treated at 2,436 outpatient clinics in the United
States during 2010 through 2014.
Patient Characteristics:
Patients were mean age of 59±15 years, 57% were male, 63% were Caucasian race, 14% were Hispanic,
61% had diabetes, and mean dialysis vintage was 3.87 years (Table 1).
Secular Trends and Seasonal Variations in Cardiovascular Parameters:
Raw secular trends showed a gradual decrease in pre-HD SBP/DBP over the five years with remarkable
variations between seasons (Figure 1 and Supplemental Figure 1). Isolation of distinct secular trends
apart from seasonal trends identified pre-HD SBP/DBP has decreased in a relatively linear manner from
2010 through 2014. Segregation of distinct seasonal trends revealed consistent patterns of seasonal

9
variations with higher pre-HD SBP/DBP levels in winter versus summer. The overall influence of isolated
trends reveal a mean secular decrease in pre-HD SBP of -2.6 mmHg (95%CI -2.4 to -2.8) over the five
years with mean seasonal variations in pre-HD SBP of 3.3 mmHg (95%CI 3.1 to 3.5) (Table 2). Consistent
findings were observed for pre-HD DBP.
Secular Trends and Seasonal Variations in Inflammatory Measures:
Raw trends over time in NLR showed fluctuating increases over the 5-years (Figure 2) and WBC counts
showed a decrease starting in 2012 that increased by the end of 2014 (Supplemental Figure 2). The
segregation of trends found similar secular patterns in NLR and WBC counts. Both NLR and WBC counts
varied seasonally with peak levels in winter and nadir in summer. The overall impact of isolated trends is
detailed in Table 2.
Trends in raw data showed pre-/post-HD body temperatures had no clear secular changes, yet small
seasonal variations (Figure 3 and Supplemental Figure 3). Separation of trends found pre-/post-HD body
temperatures decreased slightly from 2010 through 2014. Pre-HD body temperature increased over
summer and decreased over winter, with post-HD body temperature displaying inverse seasonal
variations. The overall impact of separated trends is shown in Table 2.
Secular Trends and Seasonal Variations in Nutrition Measures:
Trends in raw data for IDWG and IDWG as percent of the post-HD weight showed small gradual
decreases from 2010 through 2014 with variations between seasons (Figure 4 and Supplemental Figure
4). Isolation of trends found small linear secular decreases in IDWG along with seasonal variations. The
overall influence of separated secular trends was a mean decrease in IDWG of -0.35 kg (95%CI -0.33 to -
0.36) along with mean seasonal variations of 0.19 kg (95%CI 0.17 to 0.20). Consistent findings were seen
for IDWG as percent of the post-HD weight (Table 2).

10
Trends over time for pre-/post-HD weight and BMI included relatively linear increases over the study
period (Figure 5 and Supplemental Figures 5-6). Segregation of trends revealed pronounced linear
secular increases in weight and BMI from 2010 to 2013, which then became relatively stable through
2014; there were small, yet remarkable seasonal variations for decreased weight and BMI in summer
versus winter. The overall impacts of separated trends found a mean secular increase in post-HD weight
of 2.76 kg (95%CI 2.58 to 2.97) with mean seasonal variations of 0.62 kg (95%CI 0.46 to 0.79). Findings
for pre-HD weight and BMI exhibited consistent trends (Table 2).
Trends in raw data for albumin levels showed an inverse U-shaped secular trend from 2010 through
2014 (Supplemental Figure 7), while creatinine levels had slight decreases from 2010 to 2011 that
increased and became stable in 2012 through 2014 (Supplemental Figure 8). Separation of trends
identified consistent secular trends for albumin coinciding with small seasonal variations that were
lower in summer versus winter. Isolation of trends for creatinine values showed similar secular changes
to raw trends with seasonal variations for higher levels in summer compared to winter. The overall
impact of separated trends is presented in Table 2.
Raw trends in hemoglobin (Hgb) levels showed predominant decreases in late 2011 with no apparent
seasonal differences (Supplemental Figure 9). Segregation of trends showed consistent secular trends in
Hgb levels and revealed small, consistent seasonal variations with lowest levels in late spring and highest
levels in late fall. The overall impact of segregated trends is shown in Table 2.
Secular Trends and Seasonal Variations in Ultrafiltration:
Trends in raw data for UFV and UFR showed steady decreases over time, with fluctuations across
seasons (Figures 6-7). Separation of trends showed linear secular decreases of from 2010 through 2014,
with seasonal variations with decreases in summer versus winter months. The overall influence of

11
separated secular trends was a mean decrease in UFR of -1.50 mL/kg/hr (95%CI -1.45 to -1.55) with
mean seasonal variations of 0.41 mL/kg/hr (95%CI 0.37 to 0.45); consistent trends were found for UFV
(Table 2).
Secular Trends and Seasonal Variations in Hospitalizations:
Raw trends for hospital admissions and days per patient year (PPY) showed secular decreases with
seasonal variations (Figure 8 and Supplemental Figure 10). Isolation of secular trends found
hospitalization rates slowly decreased from 2010 to 2011, more rapidly decreased from 2012 to 2013,
and slightly increased in 2014. Remarkable seasonal variations were observed in hospitalization rates,
being highest in winter compared to summer. The overall impact of segregated secular trends found
mean decreases in hospital days of -4.02 days PPY (95%CI -3.61 to -4.48) with seasonal variations of 3.30
days PPY (2.90 to 3.77); consistent patterns were observed for hospital admissions (Table 2).
Discussion:
Our findings have established patterns of physiological rhythms across seasons in HD patients
independent of secular changes over calendar time and changes with dialysis time/vintage. HD patients
appeared to on average exhibit a diminished cardiovascular health with more inflammation in winter
months compared to summer months. Although most nutritional markers followed consistent seasonal
patterns, albumin, creatinine, and Hgb levels increased in winter months. Hospitalization rates had
strong seasonal variations accounting for about 3 more days hospitalized PPY in the winter versus
summer months. Many observed seasonal changes appear meaningful. Seasonality may not be
accounted for in current care models, but should possibly be considered by physicians, providers, and
payors. We have also established secular trends in health markers over calendar time which are
independent of seasonal and dialysis time changes. HD patients have experienced improvements in

12
cardiovascular health markers and hospitalization rates over calendar time, yet worsened nutrition and
inflammation. Practice patterns may be driving some of these findings and are important to recognize.
SBP, DBP, NLR, WBC, albumin, creatinine, Hgb, IDWG, Pre/Post-HD weight, body composition, UFR, and
hospitalization rates have been suggested to have seasonal rhythms in the HD population, many
irrespective of climate zone (5, 7-9, 11, 19-21). However, some select reports have not shown significant
seasonal variations in blood pressures, albumin, and Hgb levels (8, 22). By isolating the seasonal
variations in a population in the Northern hemisphere, we found results consistent with the majority of
the literature, yet more clearly marked and persistent in magnitude. To the best of our knowledge, the
application of the flexible nonparametric method to separate seasonal and secular changes is new in
nephrology.
We observed independent seasonal fluctuations of about 3 mmHg for SBP, 1.5 mmHg for DBP, 0.3 for
NLR, 0.25 per 109/L for WBC counts, 0.1 C for post-HD body temperature, 0.1 g/dL for albumin, 0.25
mg/dL for creatinine, 0.2 g/dL for Hgb, 0.7 Kg for pre-HD weight, 0.6 Kg for post-HD weight, 0.2 Kg for
IDWG, 0.2 kg/m2 for BMI, 0.1 L for UFV, 0.4 mL/kg/hr for UFR, 0.4 PPY for hospital admissions, and 3.3
PPY for hospital days, which were all highest in winter and lowest in summer. This adds validity to
previous findings and suggests seasonality might be considered in the management of HD patients, in
particular for blood pressure and weight/fluid control that appear to exhibit clinically meaningful
fluctuations across the seasons. Given we found all-cause hospital admission and day rates were
substantially higher in winter months, and others have found similar trends in all-cause hospital and
cardiovascular event rates in the HD population (5, 8, 9), further research may be warranted to assess if
there is a potential relationship between seasonal changes in blood pressure, vascular tone, fluid
retention, and heart failure (7, 23, 24). Influenza/respiratory infection rates in ESKD patients also exhibit
seasonal variations that peak in the winter months and may be related to changes in cardiovascular and

13
inflammation markers we observed (12). In the general population, associations between cardiovascular
events and respiratory infections are postulated to occur through coagulation/immune system
activation, and/or endothelium dysfunction (25-28). Despite this, systemic and catheter-related
infections appear to exhibit opposite seasonal fluctuations being highest in the summer months (29).
Taken together, the majority of signals suggest there might be a more compromised health state in
patients in the winter versus summer, with exception to increases in albumin, creatinine, and Hgb levels
in the winter months. These observations may be driven by higher food intake in temperate climates
during the winter months that include iron-rich meats. The findings related to markers of fluid
regulation appear to suggest that it is important to more frequently assess dry weight in the winter
months to avoid inadvertent fluid overload. Trends for UFV and UFR being increased in the winter
months coincided with increased weights and IDWG might be representative of clinical responses to
patients gaining body fluid, although further studies are required to test these relationships. Supporting
this hypothesis, another study previously showed higher UFR in the winter months with consistent
magnitude and found a higher proportion of patients used UFR rates >13 mL/kg/hr in the winter (21).
HD patients also tend to experience decreases in lean body mass and increases in fat mass in the winter
months (20), which might make fluid management more challenging. Use of bioimpedance might be
optimal for the establishment of dry weight targets in differing seasons, but further research is needed.
The joint assessment of secular trends most remarkably show blood pressures, IDWG, UFV, UFR, and
hospitalization rates have been decreasing while inflammation and post-HD weight have been increasing
over calendar time. It is possible secular changes in UFV, UFR, IDWG, and post-HD weight are associated
with unfavorable practice patterns in the determination of dry weight and/or targets for fluid removal.
Trends in UFV and UFR are possibly related to higher UFRs being identified to be associated with higher
rates of morbidities and mortality (30-32), and regulatory discussions to have UFR added to the pay for
14
performance Quality Incentive Program during this timeframe (33). Secular trends indicate practice
patterns for blood pressure management steadily improved as seen by decreases in mean levels by
more than 2.5 mmHg over the 5-year period. Despite the expectation that increases in IDWG would
associate negatively with blood pressure control, this was not observed in the isolated trends. Also, we
found hospitalization rates have been generally decreasing over time consistent with trends in USDRS
data (14) and these observations could possibly be related to decreasing blood pressures and UFR, albeit
further studies would be needed to determine associations.
Although this longitudinal study over 5 years in a nationally representative sample has many strengths,
it has some limitations. The mean age of our population including incident and prevalent HD patients is
slightly younger than estimates by the United States Renal Data System (USRDS) report of point
prevalent assessments in 2010 for incident (mean age 63 years) and prevalent (mean age 61 years
patients) (34). However, given the mean age of transplant recipients was 52 years old per the USRDS
report (34), the age in our cohort of patients may be more reflective of the overall ESKD population
including those who transitioned from HD and received a transplant during the 5 year study. The
seasonal and secular trends were identified, but we did not conduct any multivariate analysis to provide
evidence of clinical parameters being associated with outcomes. The study is generalizable specifically to
the HD population in North America. Geographical differences within North America were not
evaluated. Also, we did not consider changes in medication use across the seasons, which may have had
the potential to influence changes in blood pressures and Hgb levels. We did not have data available on
dietary protein intake which could potentially mask the changes in albumin levels in the winter months.
This study used data from outpatient medical records and did not include data during hospitalizations.
Therefore, these seasonal trends may not represent the full spectrum of fluctuations given physiological
disturbances might be the greatest during hospitalization events. Furthermore, we did not consider
changes in methods for laboratory collection and assays, and secular trends of laboratory variables may

15
be in part representative of laboratory methods. Lastly, we did not have objective measures of fluid
status (e.g. bioimpedance) available in the United States, rendering our reasoning regarding secular and
seasonal dynamics of fluid status speculative (35). Repeating the analysis in HD populations who
undergo routine bioimpedance measurements (36) would shed light on secular and seasonal trends of
fluid status.
Conclusions:
We found the changing of the seasons brings about clinically meaningful changes in the physiology of
HD patients, which are independent of dialysis vintage and secular changes due to practice patterns and
technologies. The winter months are associated with a diminished cardiovascular and nutritional health
state and a higher level of inflammation and higher hospitalization rates. Albeit further research is
needed to provide evidence of associations in individual clinical parameters on outcomes, seasonal
trends may be important to consider in assessments of population health.
Disclosures:
AL, MRM, JWL LAU, FWM are employees of Fresenius Medical Care in the Global Medical Office. PK is an
employee of Renal Research Institute, a wholly owned subsidiary of Fresenius Medical Care. LAU, PK,
FWM have share options/ownership in Fresenius Medical Care. PK receives honoraria from Up-To-Date
and is on the Editorial Board of Blood Purification and Kidney and Blood Pressure Research. FWM has
directorships in the American National Bank & Trust and is chairman of Pacific Care Renal Foundation
501(c)(3) nonprofit. All other authors declare no relevant conflicts of interest.
Acknowledgments:
Authors' contributions:

16
Zachary Terner: Conceptualization; Data curation; Formal analysis; Investigation; Methodology;
Validation; Visualization; Writing - original draft; Writing - review and editing
Andrew Long: Conceptualization; Formal analysis; Investigation; Methodology; Validation; Visualization;
Writing - original draft; Writing - review and editing
Marta Reviriego-Mendoza: Investigation; Project administration; Writing - original draft; Writing - review
and editing
John Larkin: Conceptualization; Investigation; Methodology; Project administration; Resources;
Supervision; Validation; Writing - original draft; Writing - review and editing
Len Usvyat: Conceptualization; Data curation; Investigation; Methodology; Project administration;
Resources; Supervision; Validation; Writing - review and editing
Peter Kotanko: Conceptualization; Investigation; Methodology; Project administration; Supervision;
Writing - review and editing
Franklin Maddux: Conceptualization; Investigation; Methodology; Project administration; Resources;
Supervision; Writing - review and editing
Yuedong Wang: Conceptualization; Data curation; Formal analysis; Investigation; Methodology; Project
administration; Resources; Supervision; Validation; Visualization; Writing - review and editing
The decision to submit this manuscript for publication was jointly made by all authors and the
manuscript was confirmed to be accurate and approved by all authors.
Funding:

17
Fresenius Medical Care provided the deidentified data used for this study and infrastructural support for
the management of study data, analysis design, and composition of this manuscript.
References:
1. Shephard RJ, Aoyagi Y: Seasonal variations in physical activity and implications for human health. Eur J Appl Physiol, 107: 251-271, 2009
2. Jia H, Lubetkin EI: Time trends and seasonal patterns of health-related quality of life among U.S. adults. Public Health Rep, 124: 692-701, 2009
3. Shahar DR, Froom P, Harari G, Yerushalmi N, Lubin F, Kristal-Boneh E: Changes in dietary intake account for seasonal changes in cardiovascular disease risk factors. Eur J Clin Nutr, 53: 395-400, 1999
4. Kooman JP, Usvyat LA, Dekker MJE, Maddux DW, Raimann JG, van der Sande FM, Ye X, Wang Y, Kotanko P: Cycles, Arrows and Turbulence: Time Patterns in Renal Disease, a Path from Epidemiology to Personalized Medicine? Blood Purif, 47: 171-184, 2019
5. Guinsburg AM, Usvyat LA, Etter M, Xu X, Thijssen S, Marcelli D, Canaud B, Marelli C, Barth C, Wang Y, Carioni P, van der Sande FM, Kotanko P, Kooman JP, Monitoring Dialysis Outcomes c: Seasonal variations in mortality and clinical indicators in international hemodialysis populations from the MONDO registry. BMC Nephrol, 16: 139, 2015
6. Weber-Mzell D, Kotanko P, Hauer AC, Goriup U, Haas J, Lanner N, Erwa W, Ahmaida IA, Haitchi-Petnehazy S, Stenzel M, Lanzer G, Deutsch J: Gender, age and seasonal effects on IgA deficiency: a study of 7293 Caucasians. Eur J Clin Invest, 34: 224-228, 2004
7. Cheung AK, Yan G, Greene T, Daugirdas JT, Dwyer JT, Levin NW, Ornt DB, Schulman G, Eknoyan G, Hemodialysis Study G: Seasonal variations in clinical and laboratory variables among chronic hemodialysis patients. J Am Soc Nephrol, 13: 2345-2352, 2002
8. Usvyat LA, Carter M, Thijssen S, Kooman JP, van der Sande FM, Zabetakis P, Balter P, Levin NW, Kotanko P: Seasonal variations in mortality, clinical, and laboratory parameters in hemodialysis patients: a 5-year cohort study. Clin J Am Soc Nephrol, 7: 108-115, 2012
9. Wetmore JB, Gilbertson DT, Liu J, Collins AJ: Improving Outcomes in Patients Receiving Dialysis: The Peer Kidney Care Initiative. Clin J Am Soc Nephrol, 11: 1297-1304, 2016
10. Duranton F, Palma A, Stegmayr B, Wauthier M, Torres A, Argiles A: Blood Pressure Seasonality in Hemodialysis Patients from Five European Cities of Different Latitudes. Kidney Blood Press Res, 43: 1529-1538, 2018
11. Duranton F, Kramer A, Szwarc I, Bieber B, Gayrard N, Jover B, Vetromile F, Massy ZA, Combe C, Tentori F, Jager KJ, Servel MF, Argiles A: Geographical Variations in Blood Pressure Level and Seasonality in Hemodialysis Patients. Hypertension, 71: 289-296, 2018
12. Gilbertson DT, Rothman KJ, Chertow GM, Bradbury BD, Brookhart MA, Liu J, Winkelmayer WC, Sturmer T, Monda KL, Herzog CA, Ashfaq A, Collins AJ, Wetmore JB: Excess Deaths Attributable to Influenza-Like Illness in the ESRD Population. J Am Soc Nephrol, 30: 346-353, 2019
13. Wetmore JB, Li S, Molony JT, Guo H, Herzog CA, Gilbertson DT, Peng Y, Collins AJ: Insights From the 2016 Peer Kidney Care Initiative Report: Still a Ways to Go to Improve Care for Dialysis Patients. Am J Kidney Dis, 71: 123-132, 2018
14. Saran R, Robinson B, Abbott KC, Agodoa LYC, Bragg-Gresham J, Balkrishnan R, Bhave N, Dietrich X, Ding Z, Eggers PW, Gaipov A, Gillen D, Gipson D, Gu H, Guro P, Haggerty D, Han Y, He K, Herman W, Heung M, Hirth RA, Hsiung JT, Hutton D, Inoue A, Jacobsen SJ, Jin Y, Kalantar-Zadeh K, Kapke A, Kleine CE, Kovesdy CP, Krueter W, Kurtz V, Li Y, Liu S, Marroquin MV, McCullough K, Molnar

18
MZ, Modi Z, Montez-Rath M, Moradi H, Morgenstern H, Mukhopadhyay P, Nallamothu B, Nguyen DV, Norris KC, O'Hare AM, Obi Y, Park C, Pearson J, Pisoni R, Potukuchi PK, Repeck K, Rhee CM, Schaubel DE, Schrager J, Selewski DT, Shamraj R, Shaw SF, Shi JM, Shieu M, Sim JJ, Soohoo M, Steffick D, Streja E, Sumida K, Kurella Tamura M, Tilea A, Turf M, Wang D, Weng W, Woodside KJ, Wyncott A, Xiang J, Xin X, Yin M, You AS, Zhang X, Zhou H, Shahinian V: US Renal Data System 2018 Annual Data Report: Epidemiology of Kidney Disease in the United States. Am J Kidney Dis, 73: A7-A8, 2019
15. Wetmore JB, Gilbertson DT, Collins AJ: Shaping Public Health Initiatives in Kidney Diseases: The Peer Kidney Care Initiative. Blood Purif, 41: 151-158, 2016
16. Wang Y: Smoothing splines: methods and applications, Chapman and Hall/CRC, 2011 17. R Core Team. R: A language and environment for statistical computing. R Foundation for Statistical
Computing, Vienna, Austria, URL https://www.R-project.org/, 2018 18. Wang Y, Ke C: ASSIST: A Suite of S functions Implementing Spline smoothing Techniques. 2004 19. Dopico XC, Evangelou M, Ferreira RC, Guo H, Pekalski ML, Smyth DJ, Cooper N, Burren OS, Fulford AJ,
Hennig BJ, Prentice AM, Ziegler AG, Bonifacio E, Wallace C, Todd JA: Widespread seasonal gene expression reveals annual differences in human immunity and physiology. Nat Commun, 6: 7000, 2015
20. Broers NJ, Usvyat LA, Marcelli D, Bayh I, Scatizzi L, Canaud B, van der Sande FM, Kotanko P, Moissl U, Kooman JP: Season affects body composition and estimation of fluid overload in haemodialysis patients: variations in body composition; a survey from the European MONDO database. Nephrology, dialysis, transplantation : official publication of the European Dialysis and Transplant Association - European Renal Association, 30: 676-681, 2015
21. Flythe JE, Assimon MM, Wenger JB, Wang L: Ultrafiltration Rates and the Quality Incentive Program: Proposed Measure Definitions and Their Potential Dialysis Facility Implications. Clin J Am Soc Nephrol, 11: 1422-1433, 2016
22. Kovacic V, Kovacic V: Seasonal variations of clinical and biochemical parameters in chronic haemodialysis. Ann Acad Med Singapore, 33: 763-768, 2004
23. Argiles A, Mourad G, Mion C: Seasonal changes in blood pressure in patients with end-stage renal disease treated with hemodialysis. N Engl J Med, 339: 1364-1370, 1998
24. Sposito M, Nieto FJ, Ventura JE: Seasonal variations of blood pressure and overhydration in patients on chronic hemodialysis. Am J Kidney Dis, 35: 812-818, 2000
25. Nguyen JL, Yang W, Ito K, Matte TD, Shaman J, Kinney PL: Seasonal Influenza Infections and Cardiovascular Disease Mortality. JAMA Cardiol, 1: 274-281, 2016
26. Woodhouse PR, Khaw KT, Plummer M, Foley A, Meade TW: Seasonal variations of plasma fibrinogen and factor VII activity in the elderly: winter infections and death from cardiovascular disease. Lancet, 343: 435-439, 1994
27. Chin MH, Goldman L: Factors contributing to the hospitalization of patients with congestive heart failure. Am J Public Health, 87: 643-648, 1997
28. Stewart S, McIntyre K, Capewell S, McMurray JJ: Heart failure in a cold climate. Seasonal variation in heart failure-related morbidity and mortality. J Am Coll Cardiol, 39: 760-766, 2002
29. Lok CE, Thumma JR, McCullough KP, Gillespie BW, Fluck RJ, Marshall MR, Kawanishi H, Robinson BM, Pisoni RL: Catheter-related infection and septicemia: impact of seasonality and modifiable practices from the DOPPS. Semin Dial, 27: 72-77, 2014
30. Saran R, Bragg-Gresham JL, Levin NW, Twardowski ZJ, Wizemann V, Saito A, Kimata N, Gillespie BW, Combe C, Bommer J, Akiba T, Mapes DL, Young EW, Port FK: Longer treatment time and slower ultrafiltration in hemodialysis: associations with reduced mortality in the DOPPS. Kidney international, 69: 1222-1228, 2006

19
31. Flythe JE, Kimmel SE, Brunelli SM: Rapid fluid removal during dialysis is associated with cardiovascular morbidity and mortality. Kidney international, 79: 250-257, 2011
32. Movilli E, Gaggia P, Zubani R, Camerini C, Vizzardi V, Parrinello G, Savoldi S, Fischer MS, Londrino F, Cancarini G: Association between high ultrafiltration rates and mortality in uraemic patients on regular haemodialysis. A 5-year prospective observational multicentre study. Nephrology, dialysis, transplantation : official publication of the European Dialysis and Transplant Association - European Renal Association, 22: 3547-3552, 2007
33. End Stage Renal Disease (ESRD) Quality Measure Development and Maintenance Hemodialysis Adequacy Clinical Technical Expert Panel Summary Report. (Accessed 04 Dec 2019) http://www.cms.gov/Medicare/Quality-Initiatives-Patient-Assessment-Instruments/MMS/Downloads/Hemodialysis-Adequacy-TEP-Summary-Report-and-Addendum.pdf, 2013
34. Collins AJ, Foley RN, Herzog C, Chavers B, Gilbertson D, Herzog C, Ishani A, Johansen K, Kasiske B, Kutner N, Liu J, St Peter W, Ding S, Guo H, Kats A, Lamb K, Li S, Li S, Roberts T, Skeans M, Snyder J, Solid C, Thompson B, Weinhandl E, Xiong H, Yusuf A, Zaun D, Arko C, Chen SC, Daniels F, Ebben J, Frazier E, Hanzlik C, Johnson R, Sheets D, Wang X, Forrest B, Constantini E, Everson S, Eggers P, Agodoa L: US Renal Data System 2012 Annual Data Report. Am J Kidney Dis, 61: A7, e1-476, 2013
35. Kotanko P: The promise of bioimpedance for volume management in American dialysis patients: An unfulfilled opportunity. Semin Dial, 32: 223-224, 2019
36. Dekker MJ, Marcelli D, Canaud BJ, Carioni P, Wang Y, Grassmann A, Konings CJ, Kotanko P, Leunissen KM, Levin NW, van der Sande FM, Ye X, Maheshwari V, Usvyat LA, Kooman JP: Impact of fluid status and inflammation and their interaction on survival: a study in an international hemodialysis patient cohort. Kidney international, 91: 1214-1223, 2017

20
Tables:
Table 1: Patient Characteristics Parameter Mean (SD) or %, or Median (IQR)† Age (years) 58.59 (15.34) Male (%) 56.7% White race (%) 63.2% Hispanic ethnicity (%) 13.9% HD vintage (years) 2.75 (4.17)† Body Mass Index (kg/m2) 29.37 (11.66) Diabetes (%) 61.2% Pre-HD SBP (mmHg) 148.62 (21.30) Pre-HD DBP (mmHg) 77.20 (12.81) Pre-HD weight (Kg) 83.92 (23.48) Post-HD weight (Kg) 81.58 (23.08) Pre-HD temperature (degrees C) 36.34 (0.30) Post-HD temperature (degrees C) 36.42 (0.28) Interdialytic weight gain (IDWG) (kg) 2.55 (1.15) IDWG as percent of post-HD weight 3.18 (1.28) Albumin (g/dL) 3.86 (0.42) Creatinine (mg/dL) 8.30 (3.08) Hemoglobin (g/dL) 11.00 (1.17) White blood cell (WBC) count (per 109/L) 6.93 (2.70) Neutrophil-to-lymphocyte ratio (NLR) 4.13 (3.34)

21
Table 2. Magnitude of secular and seasonal trends and confidence intervals Changes/Variations Mean Patients per
Month Minimum Patients among All Months
Secular Trend Seasonal Trend
Cardiovascular Parameters Pre-HD DBP (mmHg) 103129 81324 -1.0 (-0.9 to -1.2) 1.6 (1.4 to 1.7) Pre-HD SBP (mmHg) 103137 81328 -2.6 (-2.4 to -2.8) 3.3 (3.1 to 3.5) Inflammatory Parameters Post-HD temperature (degrees C) 103965 81926 -0.052 (-0.050 to -0.056) 0.073 (0.070 to 0.076) Pre-HD temperature (degrees C) 103136 81324 0.046 (0.042 to 0.050) 0.068 (0.064 to 0.072) White blood cell (WBC) count (per 109/L)
90242 72329 0.51 (0.48 to 0.54) 0.25 (0.23 to 0.29)
Neutrophil-to-lymphocyte ratio (NLR) 52944 30657 0.465 (0.430 to 0.506) 0.334 (0.299 to 0.374) Nutritional Parameters IDWG as percent of post-HD weight 102299 80130 -0.51 (-0.50 to -0.53) 0.22 (0.21 to 0.24) Interdialytic weight gain (IDWG) (kg) 102400 80208 -0.35 (-0.33 to -0.36) 0.19 (0.17 to 0.20) Pre-HD weight (Kg) 103137 81327 2.57 (2.39 to 2.79) 0.70 (0.55 to 0.87) Post-HD weight (Kg) 103967 81928 2.76 (2.58 to 2.97) 0.62 (0.46 to 0.79) Albumin (g/dL) 92516 74475 -0.135(-0.130 to -0.142) 0.087 (0.082 to 0.092) Body Mass Index (kg/m2) 101980 80190 0.69 (0.63 to 0.76) 0.22 (0.17 to 0.29) Creatinine (mg/dL) 91543 73617 0.39 (0.35 to 0.42) 0.26 (0.23 to 0.29) Hemoglobin (g/dL) 98832 78354 -0.86 (-0.84 to -0.87) 0.17 (0.15 to 0.18) Ultrafiltration Parameters UFV (L) 103076 81281 -0.32 (-0.30 to -0.33) 0.12 (0.11 to 0.14) UFR (mL/kg/hr) 102862 81128 -1.50 (-1.45 to -1.55) 0.41 (0.37 to 0.45) Hospitalization Counts Hospital admissions (PPY) 104658 82530 -0.62 (-0.56 to -0.68) 0.42 (0.37 to 0.47) Hospital days (PPY) 12977 11472 -4.02 (-3.61 to -4.48) 3.30 (2.90 to 3.77)
22
Figures and legends:
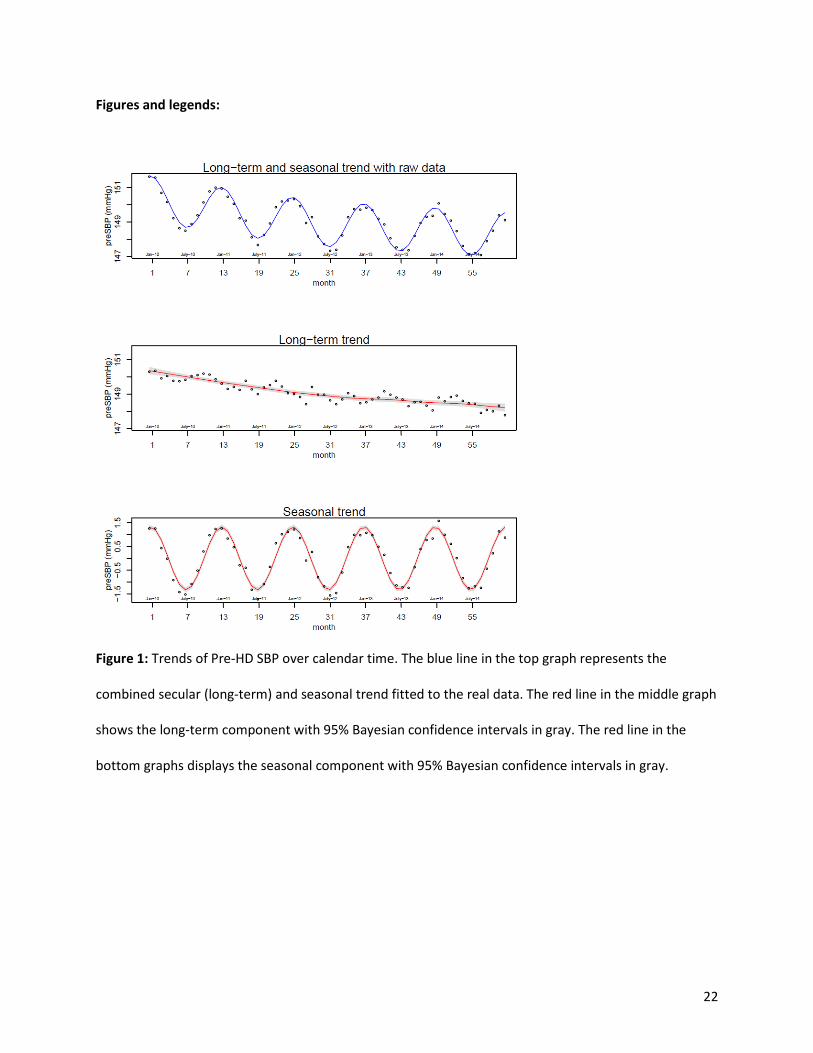
Figure 1: Trends of Pre-HD SBP over calendar time. The blue line in the top graph represents the
combined secular (long-term) and seasonal trend fitted to the real data. The red line in the middle graph
shows the long-term component with 95% Bayesian confidence intervals in gray. The red line in the
bottom graphs displays the seasonal component with 95% Bayesian confidence intervals in gray.

23
Figure 2: Trends of NLR over calendar time. The blue line in the top graph represents the combined
secular (long-term) and seasonal trend fitted to the real data. The red line in the middle graph shows the
long-term component with 95% Bayesian confidence intervals in gray. The red line in the bottom graphs
displays the seasonal component with 95% Bayesian confidence intervals in gray.

24
Figure 3: Trends of Post-HD Temperature over calendar time. The blue line in the top graph represents
the combined secular (long-term) and seasonal trend fitted to the real data. The red line in the middle
graph shows the long-term component with 95% Bayesian confidence intervals in gray. The red line in
the bottom graphs displays the seasonal component with 95% Bayesian confidence intervals in gray.

25
Figure 4: Trends of Interdialytic weight gain (IDWG) over calendar time. The blue line in the top graph
represents the combined secular (long-term) and seasonal trend fitted to the real data. The red line in
the middle graph shows the long-term component with 95% Bayesian confidence intervals in gray. The
red line in the bottom graphs displays the seasonal component with 95% Bayesian confidence intervals
in gray.
26
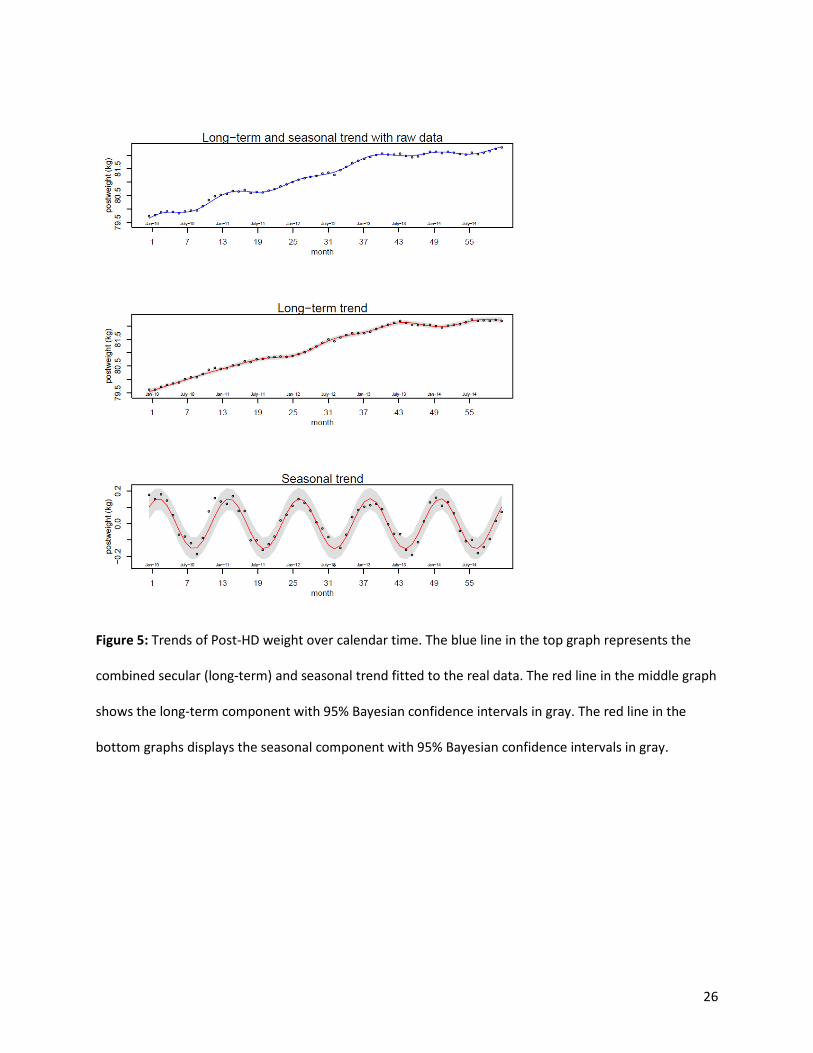
Figure 5: Trends of Post-HD weight over calendar time. The blue line in the top graph represents the
combined secular (long-term) and seasonal trend fitted to the real data. The red line in the middle graph
shows the long-term component with 95% Bayesian confidence intervals in gray. The red line in the
bottom graphs displays the seasonal component with 95% Bayesian confidence intervals in gray.

27
Figure 6: Trends of ultrafiltration volume (UFV) over calendar time. The blue line in the top graph
represents the combined secular (long-term) and seasonal trend fitted to the real data. The red line in
the middle graph shows the long-term component with 95% Bayesian confidence intervals in gray. The
red line in the bottom graphs displays the seasonal component with 95% Bayesian confidence intervals
in gray.

28
Figure 7: Trends of ultrafiltration rate (UFR) over calendar time. The blue line in the top graph
represents the combined secular (long-term) and seasonal trend fitted to the real data. The red line in
the middle graph shows the long-term component with 95% Bayesian confidence intervals in gray. The
red line in the bottom graphs displays the seasonal component with 95% Bayesian confidence intervals
in gray.

29
Figure 8: Trends of hospital days per patient year (PPY) over calendar time. The blue line in the top
graph represents the combined secular (long-term) and seasonal trend fitted to the real data. The red
line in the middle graph shows the long-term component with 95% Bayesian confidence intervals in
gray. The red line in the bottom graphs displays the seasonal component with 95% Bayesian confidence
intervals in gray.