Embed Size (px)
Citation preview

ARTICLE IN PRESS
0967-0645/$ - se
doi:10.1016/j.ds
�CorrespondiPlymouth PL4 8
fax: +441752 2
E-mail addre
(Y. Pradhan).
Deep-Sea Research II 53 (2006) 1548–1559
www.elsevier.com/locate/dsr2
Seasonal and inter-annual variability of chlorophyll-aconcentration in the Mauritanian upwelling: Observation of an
anomalous event during 1998–1999
Yaswant Pradhana,c,�, Samantha J. Lavendera,c,Nick J. Hardman-Mountfordb,c, James Aikenb,c
aSEOES, University of Plymouth, Plymouth PL4 8AA, UKbPlymouth Marine Laboratory, Plymouth PL1 3DH, UK
cCentre for observation of Air– Sea Interactions and fluXes (CASIX), UK
Received 2 August 2005; received in revised form 9 February 2006; accepted 12 May 2006
Available online 10 August 2006
Abstract
Monthly chlorophyll-a (Chl-a) concentrations derived from SeaWiFS data for 1997–2005 and chlorophyll measurements
from the Atlantic Meridional Transect for 1995–2001 have been analysed to describe seasonal and inter-annual variability
of surface Chl-a in the Mauritanian upwelling. There was a moderate to strong correspondence between the seasonal cycles
of surface Chl-a and the seasonal cycles of ocean physical and meteorological fields (such as sea-surface temperature, sea-
surface height, and prevailing wind), with a noticeable exception in 1998 that corresponded to a strong anomalous Chl-a
event (�250% increase) in the Mauritanian upwelling. Alongshore wind-stress and wind-stress curl were found to be the
most significant factors controlling the variability of Chl-a (jointly explaining more than 50% of total variance). The
biological response to the alongshore wind-stress was immediate, but it lagged the wind-stress curl by 1–2 months (each
explaining more than 40% of the total Chl-a variability). These observations also demonstrate a link, hitherto unreported,
between the Pacific El-Nino Southern Oscillation (ENSO) and anomalous Chl-a field in the Mauritanian upwelling. The
multivariate ENSO index was shown to account for a significant part of the variability of the autumn–winter Chl-a
anomaly (r ¼ �0.52, po0.01). A cold event, following an intense El Nino in the Pacific during summer, was found to
mirror the intensity of wind forcing and phytoplankton concentration in the Mauritanian upwelling a few months later.
Therefore, ENSO-related changes in the local atmospheric fields are considered as the preferred candidates for explaining
the observed biological changes in the Mauritanian upwelling during 1998–1999.
r 2006 Elsevier Ltd. All rights reserved.
Keywords: Mauritanian upwelling; Chlorophyll-a; ENSO; Seasonal variations; Time-series; AMT
e front matter r 2006 Elsevier Ltd. All rights reserved
r2.2006.05.016
ng author. SEOES, University of Plymouth,
AA, UK. Tel.: +44 1752 232 435;
32 406.
1. Introduction
Upwelling ecosystems associated with Easternboundary currents (EBC) are characterised byhigh phytoplankton production (Carr, 2001) andhigh levels of spatial and temporal variability
.
ARTICLE IN PRESSY. Pradhan et al. / Deep-Sea Research II 53 (2006) 1548–1559 1549
(Hill et al., 1998). Over seasonal and inter-annualtime scales, this variability may have significantimplications for carbon-cycling in the oceans andthe sustainability of commercially important fishpopulations.
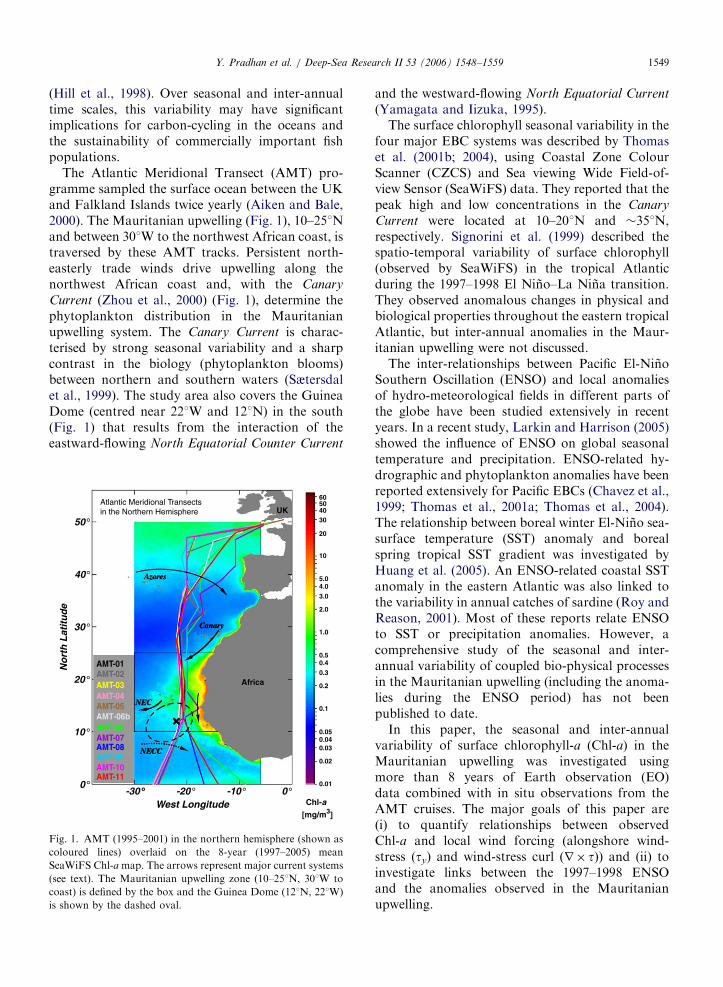
The Atlantic Meridional Transect (AMT) pro-gramme sampled the surface ocean between the UKand Falkland Islands twice yearly (Aiken and Bale,2000). The Mauritanian upwelling (Fig. 1), 10–251Nand between 301W to the northwest African coast, istraversed by these AMT tracks. Persistent north-easterly trade winds drive upwelling along thenorthwest African coast and, with the Canary
Current (Zhou et al., 2000) (Fig. 1), determine thephytoplankton distribution in the Mauritanianupwelling system. The Canary Current is charac-terised by strong seasonal variability and a sharpcontrast in the biology (phytoplankton blooms)between northern and southern waters (Sætersdalet al., 1999). The study area also covers the GuineaDome (centred near 221W and 121N) in the south(Fig. 1) that results from the interaction of theeastward-flowing North Equatorial Counter Current
-30 °° -20 ° -10 ° 0 °West Longitude
0 °
10 °
20 °
30 °
40°
50°
No
rth
Lat
itu
de
Atlantic Meridional Transectsin the Northern Hemisphere
Africa
UK
AMT-02AMT-03AMT-04AMT-05AMT-06bAMT-06AMT-07AMT-08AMT-09AMT-10AMT-11
AMT-01
Chl-a
[mg/m3]
Azores
Canary
NEC
NECC
60504030
20
10
5.04.03.0
2.0
1.0
0.50.40.3
0.2
0.1
0.050.040.03
0.02
0.01
Fig. 1. AMT (1995–2001) in the northern hemisphere (shown as
coloured lines) overlaid on the 8-year (1997–2005) mean
SeaWiFS Chl-a map. The arrows represent major current systems
(see text). The Mauritanian upwelling zone (10–251N, 301W to
coast) is defined by the box and the Guinea Dome (121N, 221W)
is shown by the dashed oval.
and the westward-flowing North Equatorial Current
(Yamagata and Iizuka, 1995).The surface chlorophyll seasonal variability in the
four major EBC systems was described by Thomaset al. (2001b; 2004), using Coastal Zone ColourScanner (CZCS) and Sea viewing Wide Field-of-view Sensor (SeaWiFS) data. They reported that thepeak high and low concentrations in the Canary
Current were located at 10–201N and �351N,respectively. Signorini et al. (1999) described thespatio-temporal variability of surface chlorophyll(observed by SeaWiFS) in the tropical Atlanticduring the 1997–1998 El Nino–La Nina transition.They observed anomalous changes in physical andbiological properties throughout the eastern tropicalAtlantic, but inter-annual anomalies in the Maur-itanian upwelling were not discussed.
The inter-relationships between Pacific El-NinoSouthern Oscillation (ENSO) and local anomaliesof hydro-meteorological fields in different parts ofthe globe have been studied extensively in recentyears. In a recent study, Larkin and Harrison (2005)showed the influence of ENSO on global seasonaltemperature and precipitation. ENSO-related hy-drographic and phytoplankton anomalies have beenreported extensively for Pacific EBCs (Chavez et al.,1999; Thomas et al., 2001a; Thomas et al., 2004).The relationship between boreal winter El-Nino sea-surface temperature (SST) anomaly and borealspring tropical SST gradient was investigated byHuang et al. (2005). An ENSO-related coastal SSTanomaly in the eastern Atlantic was also linked tothe variability in annual catches of sardine (Roy andReason, 2001). Most of these reports relate ENSOto SST or precipitation anomalies. However, acomprehensive study of the seasonal and inter-annual variability of coupled bio-physical processesin the Mauritanian upwelling (including the anoma-lies during the ENSO period) has not beenpublished to date.
In this paper, the seasonal and inter-annualvariability of surface chlorophyll-a (Chl-a) in theMauritanian upwelling was investigated usingmore than 8 years of Earth observation (EO)data combined with in situ observations from theAMT cruises. The major goals of this paper are(i) to quantify relationships between observedChl-a and local wind forcing (alongshore wind-stress (ty) and wind-stress curl (r� t)) and (ii) toinvestigate links between the 1997–1998 ENSOand the anomalies observed in the Mauritanianupwelling.
ARTICLE IN PRESS
1ftp://podaac.jpl.nasa.gov/pub/sea_surface_temperature/reynolds/
oisst/doc/oisst.html#17 and the references therein
Y. Pradhan et al. / Deep-Sea Research II 53 (2006) 1548–15591550
2. Data and methods
2.1. Earth observation data
SeaWiFS Chl-a: Level-3 mapped monthly meanSeaWiFS global 9-km Chl-a data (reprocessingversion 5.1) were downloaded from National Aero-nautics and Space Administration (NASA) Ocean-color website (ftp://oceans.gsfc.nasa.gov/SeaWiFS/L3SMI/). The Chl-a maps were generated using thefourth generation Maximum Band Ratio algorithm,OC4v4, that yields a reasonably good correlation(r2 ¼ 0.892) and small error (RMS ¼ 0.222) on aglobal scale that includes samples from all watertypes (O’Reilly et al., 2000). Generally, the satellite-derived Chl-a measurement represents the meanvalue for the surface layer derived from theupwelling radiance from the surface to first attenua-tion depth, heavily weighted towards the surface.
ERS-2 and QuikSCAT vector wind: Weeklygridded European Remote-Sensing Satellite-2(ERS2) and NASA-QuikSCAT (QS) mean windfields (MWF) at 0.51 resolution were obtainedthrough an anonymous FTP (ftp://ftp.ifremer.fr/ifremer/cersat/products/gridded/). A comparisonbetween ERS2 and QS wind speeds showed goodagreement, but a systematic bias was found over theMauritanian upwelling showing an under-estima-tion of ERS2 wind speed compared to QS windspeed. Based on the concurrent (August 1999–December 2000) datasets from both sensors, thedifference was adjusted to best fit the QS wind; itwas assumed that QS performed better than ERS2since the mean estimation error (provided with theMWF product) for QS wind (0.25m s�1) is sig-nificantly smaller than for ERS2 wind (0.55m s�1).A detailed discussion is beyond the scope of thispaper, but the correction involved the application ofa linear scaling to the zonal and meridionalcomponents of ERS2 wind speed as
u ¼ 1:107uE2 þ 0:4395 and
v ¼ 1:065vE2 � 0:6332, ð1Þ
where u and v are the corrected across-shore (zonal)and alongshore (meridional) wind speed compo-nents, and uE2 and vE2 are the respective ERS2 windspeed components. The wind-stress (t) was calcu-lated using variable drag coefficients (CD) (Yellandand Taylor, 1996)
t ¼ raCDjW jW , (2)
where ra � 1:3 kgm�3 (average air density) and W
is the wind speed.
CD ¼ 0:29þ3:1
Wþ
7:7
W 2
� �10�3 for
3pWp6ms�1� �
CD ¼ 0:6þ 0:07Wð Þ10�3 for
6pWp26ms�1� �
or CD ¼ 10�4; otherwise:
The 9-year (1997–2005) monthly wind parameter(wind speed, wind-stress and wind-stress curl) time-series was constructed using both ERS2 and QSafter applying this correction (Eq. (1)) to the ERS-2data.
Additional EO and climatological data: TheReynolds Optimally Interpolated SST dataset (Rey-nolds and Smith, 1994) is based upon a combinationof advanced very high-resolution radiometer satel-lite and in situ data1, available from the NASAPhysical Oceanography Distributed Active ArchiveCenter (PO.DAAC Product ]119). The 1/31 merged(TOPEX/Poseidon, Jason and ERS1/2) altimetersea-level anomaly (SLA) data were produced andprovided by the enhanced ocean data assimilationand climate prediction project (EVK2-CT2001-00117), and are available via an anonymous FTP(ftp://ftp.cls.fr/pub/oceano/enact/msla/merged/).
Bimonthly multivariate ENSO index (MEI) datafor the 1997–2005 period, available from the NOAAClimate Diagnostics Centre (www.cdc.noaa.gov/people/klaus.wolter/MEI/), were used to verify thelarge-scale atmospheric modulation on the phyto-plankton variability in the study area. All MEIvalues are normalised for each bimonthly period sothat the 44 values (from 1950 to 1993) have zeromean and unit variance (Wolter, 2006). The MEIwas used since it integrates more information thanthe Southern Oscillation Index or various SSTindices; it reflects the nature of the coupledocean–atmosphere system better than either com-ponent and it is less vulnerable to occasional dataglitches in the monthly update cycles (Wolter, 2006).
2.2. In situ data
To obtain the vertical distribution of Chl-a, datafrom fluorometers attached to the AMT conducti-vity–temperature–depth (CTD) frame were used.

ARTICLE IN PRESS
1998 1999 2000 2001 2002 2003 2004 2005
1998 1999 2000 2001 2002 2003 2004 2005
1998 1999 2000 2001 2002 2003 2004 2005
SeaWiFS monthly mean Chlorophyll-a [mg m -3]
10°
15°
20 °
25 °
10°
15°
20 °
25 °
10°
15°
20 °
25 °
0.05
0.50
5.00N 10.0
SeaWiFS monthly Chlorophyll-a anomaly [mg m-3]
-5
-2.5
0
2.5
5
Year
ERS2_QS monthly Windspeed anomaly [m s -1]
-1
-0.5
0
0.5
1
(A)
(B)
(C)
Fig. 2. Zonally averaged (301W–NW African coast) time–-
latitude plots of (A) monthly mean SeaWiFS Chl-a (values
41.0mgm�3 are shown as bold contour), (B) SeaWiFS monthly
Chl-a anomalies from mean monthly Chl-a values for the 8-year
period (1998–2005) and (C) same as B, but for the reconstructed
ERS2_QS wind speed anomaly (see methods).
Y. Pradhan et al. / Deep-Sea Research II 53 (2006) 1548–1559 1551
The fluorometer data were calibrated at the BritishOceanographic Data Centre (BODC) using theflurometric Chl-a measurements made on CTDbottle samples. CTD bottle samples were alsoanalysed to estimate the total Chl-a (Tchl-a)concentration using the high-performance liquidchromatography (HPLC) technique (Aiken et al.,1998); Tchl-a is the sum of chlorophyllide-a, Chl-aepimer, Chl-a allomer, monovinyl Chl-a and divinylChl-a (Mueller et al., 2003). Tchl-a values were thenaveraged over the top 15m in the Mauritanianupwelling region.
All the HPLC data collected during AMT cruiseswere obtained from the SeaWiFS Bio-opticalArchive and Storage System (SeaBASS) publicaccess database (http://seabass.gsfc.nasa.gov/cgi-bin/pigment_search.cgi). Available nutrient data(NO3+NO2 concentration by colorometric auto-analysis method), particulate organic nitrogen(PON) and CTD profile data were collected onAMT cruises and provided by BODC.
2.3. EO data analysis
For all latitude–time cross-sections described inthis paper, the monthly (and reconstructedmonthly) EO data were pre-interpolated to a11� 11 grid space using a kriging method (Stein,1999). Monthly anomalies were then computed asdepartures from 8-year (1998–2005) mean monthlyvalues. Before constructing the spatially averagedtime-series, each anomaly data cube (longitude,latitude and time) was standardised over time sothat the data in each grid point, in the entiremonthly time-series (1997–2005), have an average of‘0’ and a standard deviation of ‘1’. The strength anddirection of the relationship between surface Chl-a(prediction) variability and the forcing fields (ex-planatory) were evaluated using Spearman’s rankcorrelation coefficient as it provides a credible resultwhen the sample size is relatively small (Altman,1991). The combined effect of all independentvariables (only strength) also was determinedthrough multiple correlation analysis (Huberty,2003).
3. Results
The meridional cross-section (zonally averaged)of SeaWiFS estimated Chl-a concentration in theMauritanian upwelling, between 10 and 201N,showed a strong seasonal cycle dominated by a
spring peak (Fig. 2A). Elevated concentrations(41.0mgm�3) were present from January–Mayand typically peaked (up to �8.0mgm�3) inFebruary–March in the south and April–Mayfurther north. Around 201N, elevated Chl-a con-centrations persisted throughout the year; it isaround this latitude that the main branch ofthe Canary Current leaves the African coast. Thisseasonal cycle of Chl-a was consistent throughoutthe time series, with the exception of 1998 whenan anomalous second peak of greater magnitudewas observed from September to December. Atime–latitude plot of Chl-a anomalies (Fig. 2B)showed the magnitude of this anomalous event(42.5mgm�3).
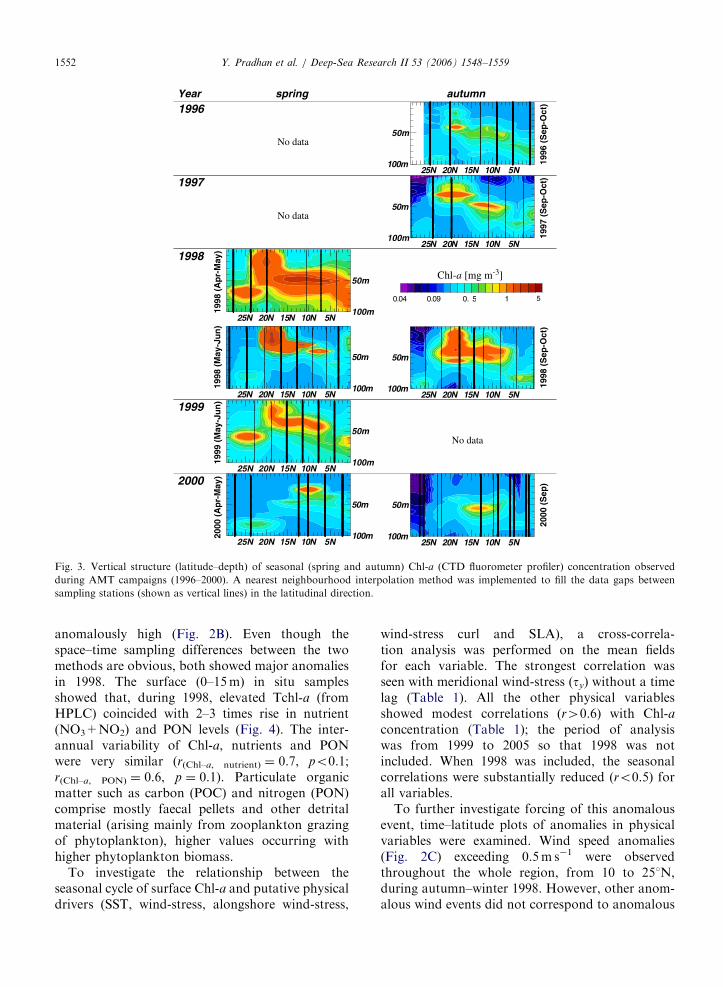
To validate the observed Chl-a anomaly, latitu-de–depth sections from AMT cruises were examined(Fig. 3). These revealed a 2–3 times enhancement ofChl-a concentration between 10 and 221N, duringspring and autumn 1998 as compared with otheryears. In contrast, the surface signature as estimatedby satellite showed only autumn 1998 values to be
ARTICLE IN PRESS
autumnspringYear1996
No data
5N10N15N20N25N
1996
(S
ep-O
ct)
50m
100m
1997
No data
5N10N15N20N25N
1997
(S
ep-O
ct)
50m
100m
5N10N15N20N25N
50m
100m1998
(A
pr-
May
)
Chl-a [mg m-3]
0.04 0.09 0. 5 1 5
1998
5N10N15N20N25N
50m
100m1998
(M
ay-J
un
)
5N10N15N20N25N
1998
(S
ep-O
ct)
50m
100m
1999
5N10N15N20N25N
50m
100m1999
(M
ay-J
un
)
No data
2000
5N10N15N20N25N
50m
100m2000
(A
pr-
May
)
5N10N15N20N25N20
00 (
Sep
)
50m
100m
Fig. 3. Vertical structure (latitude–depth) of seasonal (spring and autumn) Chl-a (CTD fluorometer profiler) concentration observed
during AMT campaigns (1996–2000). A nearest neighbourhood interpolation method was implemented to fill the data gaps between
sampling stations (shown as vertical lines) in the latitudinal direction.
Y. Pradhan et al. / Deep-Sea Research II 53 (2006) 1548–15591552
anomalously high (Fig. 2B). Even though thespace–time sampling differences between the twomethods are obvious, both showed major anomaliesin 1998. The surface (0–15m) in situ samplesshowed that, during 1998, elevated Tchl-a (fromHPLC) coincided with 2–3 times rise in nutrient(NO3+NO2) and PON levels (Fig. 4). The inter-annual variability of Chl-a, nutrients and PONwere very similar (r(Chl–a, nutrient) ¼ 0.7, po0.1;r(Chl–a, PON) ¼ 0.6, p ¼ 0.1). Particulate organicmatter such as carbon (POC) and nitrogen (PON)comprise mostly faecal pellets and other detritalmaterial (arising mainly from zooplankton grazingof phytoplankton), higher values occurring withhigher phytoplankton biomass.
To investigate the relationship between theseasonal cycle of surface Chl-a and putative physicaldrivers (SST, wind-stress, alongshore wind-stress,
wind-stress curl and SLA), a cross-correla-tion analysis was performed on the mean fieldsfor each variable. The strongest correlation wasseen with meridional wind-stress (ty) without a timelag (Table 1). All the other physical variablesshowed modest correlations (r40.6) with Chl-aconcentration (Table 1); the period of analysiswas from 1999 to 2005 so that 1998 was notincluded. When 1998 was included, the seasonalcorrelations were substantially reduced (ro0.5) forall variables.
To further investigate forcing of this anomalousevent, time–latitude plots of anomalies in physicalvariables were examined. Wind speed anomalies(Fig. 2C) exceeding 0.5m s�1 were observedthroughout the whole region, from 10 to 251N,during autumn–winter 1998. However, other anom-alous wind events did not correspond to anomalous
ARTICLE IN PRESS
1995 1996 1997 1998 1999 20000.0
0.5
1.0
1.5
HP
LC
TC
hl-
a [m
g m
-3]
0
0.1
0.2
0.3
0.4
NO
3+N
O2
[µm
ol L
-1]
0
1
2
3
4
PO
N [
µmol
L-1
]
A1/
Oct
A2/
May A3
/Sep
A3
/Oct
A4
/May A5
/Sep
A6b
/Ap
r
A6
/Ju
n
A7/
Sep
A7/
Oct
A8
/May
A10
/Ap
r
A11
/Sep
Fig. 4. Depth and time averaged (top 15m, by cruise, by month) AMT 1995–2000 in situ measurements of HPLC Tchl-a (squares),
nutrients (NO3+NO2; circles) and PON (diamonds) in the Mauritanian upwelling (10–251N, 30�101W). The vertical bars indicate 71s.All sampling stations pass through nearly the same transect close to 201W (Fig. 1). Data from the inshore stations during AMT-07 were
excluded from this analysis.
Table 1
Cross-correlation (r[lag]) between monthly mean Chl-a concentration and the monthly means of physical variables (meridional wind-stress
(ty), wind-stress (t) and wind-stress curl (r� t) in the Mauritanian upwelling)
Period ty SST t SLA r� t
September 1997–November 2005 Chl-a r[0] ¼ 0.48 r[0] ¼ �0.19 r[0] ¼ 0.29 r[0] ¼ �0.31 r[0] ¼ 0.41
r[1] ¼ 0.44 r[1] ¼ 0.33 r[�2] ¼ �0.43 r[1] ¼ 0.46
January 1999–November 2005 Chl-a r[0] ¼ 0.79* r[0] ¼ �0.67* r[0] ¼ 0.64* r[0] ¼ �0.63* r[0] ¼ 0.64*
r[1] ¼ 0.72* r[1] ¼ 0.69* r[�2] ¼ �0.49 r[1] ¼ 0.72*
[N ¼ 12; df ¼ N�(|lag|+1). Correlations significant at 95% confidence limit are assigned with *].
Sep
-97
Jan
-98
May
-98
Sep
-98
Jan
-99
May
-99
Sep
-99
Jan
-00
May
-00
Sep
-00
Jan
-01
May
-01
Sep
-01
Jan
-02
May
-02
Sep
-02
Jan
-03
May
-03
Sep
-03
Jan
-04
May
-04
Sep
-04
Jan
-05
May
-05
Sep
-05
-0.5
-0.25
0
0.25
0.5
No
rmal
ised
Ind
ex
-0.5
-0.25
0
0.25
0.5Chl-a_An
WStr_V_An
WStr_curl_An
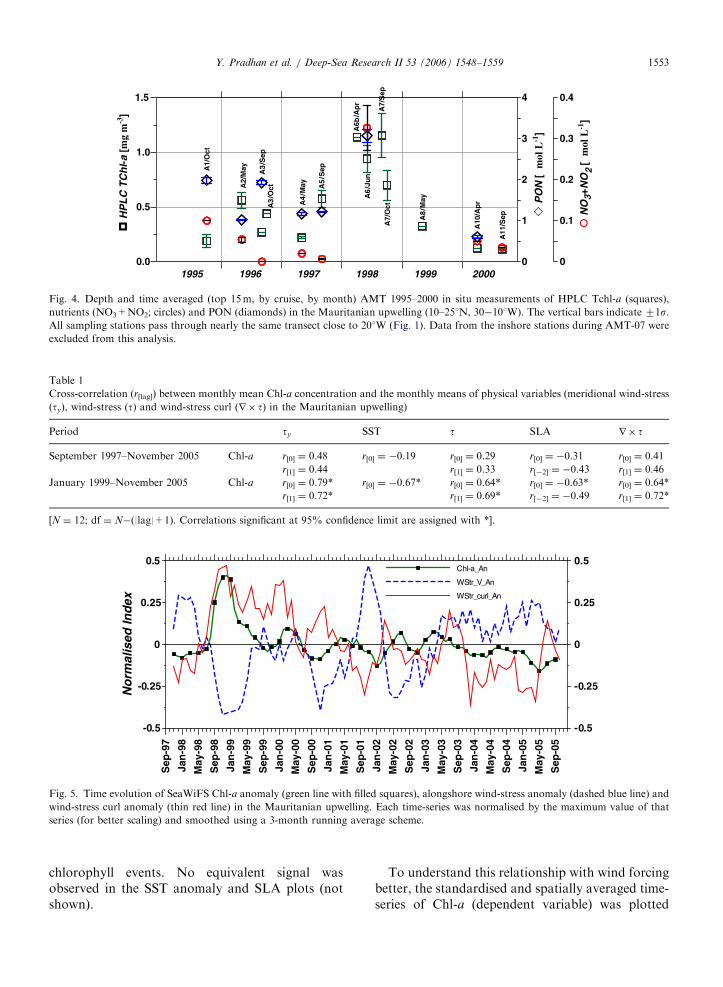
Fig. 5. Time evolution of SeaWiFS Chl-a anomaly (green line with filled squares), alongshore wind-stress anomaly (dashed blue line) and
wind-stress curl anomaly (thin red line) in the Mauritanian upwelling. Each time-series was normalised by the maximum value of that
series (for better scaling) and smoothed using a 3-month running average scheme.
Y. Pradhan et al. / Deep-Sea Research II 53 (2006) 1548–1559 1553
chlorophyll events. No equivalent signal wasobserved in the SST anomaly and SLA plots (notshown).
To understand this relationship with wind forcingbetter, the standardised and spatially averaged time-series of Chl-a (dependent variable) was plotted
ARTICLE IN PRESSY. Pradhan et al. / Deep-Sea Research II 53 (2006) 1548–15591554
against alongshore wind-stress, ty, and wind-stresscurl, r� t (independent variables; Fig. 5). To-gether, ty and r� t anomalies explained more that50% of the Tchl-a anomaly’s variability (R ¼ 0.71;
Table 2
Correlation between (Chl-a)anomaly and alongshore wind-stress
and wind-stress curl anomalies
Lag in
months
r [ty vs. Chl-a]anomaly
r [r� t vs.
Chl-a]anomaly
R [(ty andr� t) vs.Chl-a)]anomaly
�3 �0.36 0.32
�2 �0.48 0.39
�1 �0.58 0.50
0 �0.65 0.60 0.71
+1 �0.64 0.66
+2 �0.57 0.66
+3 �0.48 0.59
R and r represent multiple- and cross-correlation coefficients,
respectively. The degrees of freedom vary with lags in months as
N ¼ 99�(|lag|+1). All correlations are significant at 99%
confidence limit.
Table 3
Seasonal correlation between surface (Chl-a)anomaly and along-
shore wind-stress and wind-stress curl anomalies
Season (boreal) N r (ty vs. Chl-a)anomaly
r (r� t vs.
Chl-a)anomaly
Autumn–winter (ONDJ) 32 �0.39 0.46*
Spring–summer (AMJJ) 30 �0.58* 0.51*
Correlation coefficients with po0.01 are shown with *.
97-98 98-99 99-00 00-01
Yea
-1
-0.5
0
0.5
1
No
rmal
ised
Ind
ex
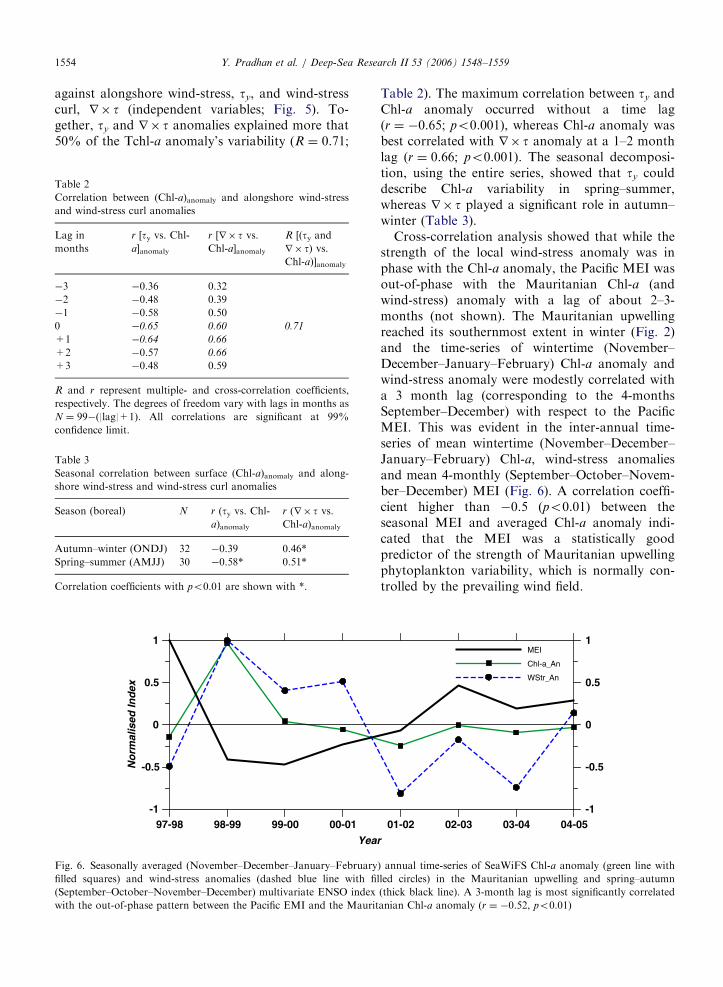
Fig. 6. Seasonally averaged (November–December–January–February
filled squares) and wind-stress anomalies (dashed blue line with fi
(September–October–November–December) multivariate ENSO index
with the out-of-phase pattern between the Pacific EMI and the Maurit
Table 2). The maximum correlation between ty andChl-a anomaly occurred without a time lag(r ¼ �0.65; po0.001), whereas Chl-a anomaly wasbest correlated with r� t anomaly at a 1–2 monthlag (r ¼ 0.66; po0.001). The seasonal decomposi-tion, using the entire series, showed that ty coulddescribe Chl-a variability in spring–summer,whereas r� t played a significant role in autumn–winter (Table 3).
Cross-correlation analysis showed that while thestrength of the local wind-stress anomaly was inphase with the Chl-a anomaly, the Pacific MEI wasout-of-phase with the Mauritanian Chl-a (andwind-stress) anomaly with a lag of about 2–3-months (not shown). The Mauritanian upwellingreached its southernmost extent in winter (Fig. 2)and the time-series of wintertime (November–December–January–February) Chl-a anomaly andwind-stress anomaly were modestly correlated witha 3 month lag (corresponding to the 4-monthsSeptember–December) with respect to the PacificMEI. This was evident in the inter-annual time-series of mean wintertime (November–December–January–February) Chl-a, wind-stress anomaliesand mean 4-monthly (September–October–Novem-ber–December) MEI (Fig. 6). A correlation coeffi-cient higher than �0.5 (po0.01) between theseasonal MEI and averaged Chl-a anomaly indi-cated that the MEI was a statistically goodpredictor of the strength of Mauritanian upwellingphytoplankton variability, which is normally con-trolled by the prevailing wind field.
01-02 02-03 03-04 04-05
r
-1
-0.5
0
0.5
1MEI
Chl-a_An
WStr_An
) annual time-series of SeaWiFS Chl-a anomaly (green line with
lled circles) in the Mauritanian upwelling and spring–autumn
(thick black line). A 3-month lag is most significantly correlated
anian Chl-a anomaly (r ¼ �0.52, po0.01)
ARTICLE IN PRESSY. Pradhan et al. / Deep-Sea Research II 53 (2006) 1548–1559 1555
4. Discussion
In this study, an almost 200-km stretch (10–201N)of the North Atlantic Ocean along the northwestAfrican coast was observed to have high Chl-aconcentrations (41.0mgm�3) from January toMay, typically peaking in April–May (Fig. 2A);this is different from the previously reportedseasonal Chl-a maximum in May–June as observedfrom 1997–2000 monthly SeaWiFS data (Thomaset al., 2001b). An anomalously large Chl-a bloomwas observed in 1998–1999 in both SeaWiFS(Fig. 2B) and in situ data (Figs. 3 and 4), whichwas not observed again in the full 1997–2005SeaWiFS time-series (Fig. 5).
Phytoplankton blooms are modulated by varia-tion of both nutrient and light availability apartfrom other factors (such as temperature, salinity,stratification and turbulence). The observed anti-correlation between SST and Chl-a concentration(Table 1) can be attributed to cold, upwelled,nutrient-rich water and the strong seasonal cyclethat both SST and Chl-a follow. But the coldsignature of the upwelled water may be confined toa local domain (inshore) and not clearly visible inSST data, particularly in a tropical region. On theother hand, Chl-a distribution can be very patchy,which may reflect the nature of the upwellingprocess. Thus, correlations with SST alone cannotbe used effectively to predict the Chl-a field. Verticalfluxes of nutrient-rich water from below thenutricline to the ocean surface can be inferred fromSLA field, because changes in the thermocline depth(often overlaps with the nutricline depth) are largelyreflected in SLA. Satellite-derived surface Chl-a hasbeen compared to SLA variability by many authors(Murtugudde et al., 1999; Cipollini et al., 2001;Siegel, 2001; Uz et al., 2001). But in a recent study,Wilson and Adamec (2002) showed that thecorrelation between Chl-a and SLA variability inthe tropical Atlantic (including the Mauritanianupwelling) is non-significant. Thus, wind-inducedupwelling supplies nutrients to enhance the Chl-aproduction. Strong southerly (negative) alongshorewind-stress would result in strong cross-shelfdivergence along the eastern boundaries in thenorthern hemisphere and Ekman suction due topositive wind-stress curl is directly related to upliftof the pycnocline (Tomczak and Godfrey, 1994).
At low latitudes, seasonal blooms are triggered byan injection of nutrients from depth (less verticalstability) into the permanently warm mixed layer
(Dandonneau et al., 2004). The base of the mixedlayer in the Mauritanian upwelling is quite shallow(about 15–25m near 10–151N) during summer(Monterey and Levitus, 1997), and the large-scalespatial wind structure in this region is alsocharacterised by cyclonic wind-stress curl thatcontributes to an offshore extension of the coastalupwelling boundary (Bakun and Nelson, 1991).Consistent and prolonged alongshore wind-stress(ty) and wind-stress curl (r� t) could bring thedeep pool of nutrients to the surface, enhancing theChl-a concentration in the euphotic layer in thisregion. A primary source of the inter-annualvariability of upwelling signal for the NorthAtlantic is the region of NW Africa in the vicinityof the Guinea dome (McClain and Firestone, 1993).Dynamic uplifting of the thermocline is a commonfeature in the Guinea Dome, which follows thequasi-geostrophic adjustment in response to thewind curl forcing (Signorini et al., 1999). The AMTtransects cross near the Guinea dome at 121N,which could have provided additional informationon an anomalous elevation (doming) of the thermo-haline structure that in turn could have caused theinjection of nutrients from the nutricline. Althoughan ocean general circulation model showed ashallowing of the 201C isotherm by 30–40m fromthe middle of February until the beginning ofSeptember (in 1998) in the eastern tropical Atlantic(Signorini et al., 1999), the AMT in situ hydro-graphic (temperature and salinity) sections did notshow any significant changes compared to otheryears (not shown). The in situ sampling stationpositions may be too widely spaced to resolve thethermohaline changes near the Guinea Dome.
An assumption that Chl-a concentration isdirectly proportional to the upwelling strength wasjustified as both ty and r� t anomalies explainedmore that 50% of the Tchl-a anomaly’s variability(Table 2). Though the prevailing alongshore windfield was generally favourable for coastal upwellingthroughout the year, the seasonal decompositionshowed that ty (potentially triggering the coastalupwelling) is a key forcing function to describe theChl-a variability in spring–summer, whereas r� t(potentially triggering the Ekman suction) plays asignificant role in autumn–winter (Table 3). Follow-ing the large changes in 1998–1999, the Chl-aanomaly followed a near-regular annual oscillationuntil 2003 that was coherent with the wind fields(Fig. 5). In the subsequent years, Chl-a anomaliesremained consistently below normal and in phase

ARTICLE IN PRESSY. Pradhan et al. / Deep-Sea Research II 53 (2006) 1548–15591556
with positive ty anomalies (i.e. weak southerly) andnegative r� t anomalies.
Although the wind-driven coastal upwelling ofnutrient-rich subsurface water (on a regional scale)makes the EBC systems among the most biologi-cally productive regions of the global ocean, thewind-driven upwelling and resultant hydrographicand biological patterns are also interlaced withlarge-scale non-local forcing in a complex and non-linear way (Strub et al., 1990; Hill et al., 1997). Theanomalous Chl-a event in 1998 encouraged theinvestigation of a significant relationship withthe most anomalous climatic event of the century;the 1997–1999 ENSO (McPhaden, 1999). Inverserelationships between the seasonally averaged Chl-aanomaly and wind-stress anomaly with MEI weremutually consistent (Fig. 6) and supported theexistence of a link between ENSO and the strengthof upwelling (and Chl-a blooms) through an atmo-spheric teleconnection. A significantly negativeautumn–winter MEI value indicated an ongoing
Fig. 7. Topex/Poseidon mean SLA (contours in cm; CI ¼ 2 cm) and as
magnitudes greater than 3 cm s�1 are plotted) superimposed on mean S
mature phase of La Nina in the Pacific, resulting ina strengthening of the Atlantic trade winds in borealwinter–spring and vice-versa. A relaxed state ofwind-forcing in the Mauritanian upwelling wasfound to intensify a few months later, followingthe summer–autumn El Nino–La Nina transition.
Although the Mauritanian upwelling is largelyconfined to the waters relatively close to the coast,its impact extends 300–600 km offshore, throughEkman flow, eddies and filaments (Mittelstaedt,1991; Hill et al., 1998). A prominent cold filamentpermanently located at 211N, which contributes tothe entrainment of cold, nutrient-rich water fromthe coast up to 450 km offshore (Van Camp et al.,1991) is accompanied by another cold-core eddybetween 101N and 151N (Fig. 7). The SLA andgeostrophic current anomalies overlaid on Chl-amaps showed the extension of such persistentfilaments in this region during the 1998–1999anomalous months (Fig. 7). The transport ofChl-a offshore, possibly with nutrient-rich water,
sociated geostrophic current fields (vectors in cm s�1; vectors with
eaWiFS Chl-a (colour scale same as in Fig. 1).
ARTICLE IN PRESSY. Pradhan et al. / Deep-Sea Research II 53 (2006) 1548–1559 1557
suggests that these processes could contribute at ascale much larger than the continental shelf.However, there was no concurrent drop in SSTfrom satellite observations, although a strong zonalSST gradient in 1998–1999 along the northwestAfrican coast has been reported elsewhere (Santoset al., 2005); perhaps the ENSO-related warming inthe tropical Atlantic was responsible for the weakanti-correlation between Chl-a anomaly and SSTanomaly in 1998 (not shown).
The entire northwest African coast is alsoinfluenced by the African desert dust transport,which supplements the levels of micronutrients(such as iron) to the adjacent marine ecosystem.Chiapello et al (2005) showed that satellite-deriveddust optical thickness in 1998 over the northerntropical Atlantic was one of the most intense eventsin the last two decades. Although the dust istransported at higher altitudes in summer, it ismore likely that the winter transport corresponds toa settling in the Atlantic Ocean (I. Chiapello, pers.comm.). Whilst the contribution of wind-drivenupwelling is significantly correlated to the Chl-aanomalies in the Mauritanian upwelling, an in-creased level of surface micronutrients (iron) arisingfrom the winter Saharan dust deposition may alsoexplain the anomalous bloom in 1998. Since thelong-term variability of wintertime African dusttransport is influenced by the North AtlanticOscillation (Chiapello et al., 2005), it will be possibleto investigate the decadal changes (regime shift) ofChl-a concentration in the Mauritanian upwellingwhen a longer consistent ocean-colour data recordis available.
5. Conclusions
This study has verified that wind-driven upwellingis the principal mechanism that controls theseasonal cycle and inter-annual variability of sur-face Chl-a concentration in the Mauritanian upwel-ling. The biological response to the strength of thealongshore wind-stress anomaly is coherent; itexplains more than 40% of the regression variance(r ¼ �0.65, po0.001). A delayed response (1–2months) of the Chl-a anomaly to the wind-stresscurl anomaly was also found to be highly correlated(r ¼ 0.66, po0.001). These two principal physicalforcing functions (ty and r� t) jointly explainedmore than 50% of the Tchl-a variance. On aseasonal basis, coastal upwelling (Ekman suction)appeared to be significantly related (|r|40.5,
po0.01) to the Chl-a variability during spring–summer (autumn–winter).
A moderate correlation (r ¼ �0.52, po0.01)between summer–autumn MEI and the Maurita-nian Chl-a anomaly during autumn–winter sup-ported the ENSO-related atmospheric modulationin the tropical Atlantic. This large-scale forcing bythe atmosphere altered the local wind fields thataccounted for the observed surface Chl-a variabilityin the Mauritanian upwelling during 1998. ENSO-related variability is thus a preferred explanation forthe local changes in the biological fields in thevicinity of the northwest African upwelling system.
Acknowledgements
We thank all crew members and scientists ofAMT who collected and analysed the in situ dataand brought them into a ready-to-use form.SeaWiFS data are provided by the SeaWiFSProject, NASA/Goddard Space Flight Center andORBIMAGE. We thank J. Gunson, D. Sengupta,R. Murtugudde, D. Raitsos and R. Perez-Portelafor their help; special thanks to I. Chiapello foruseful discussion on the African dust transport inthe tropical Atlantic. Critical comments by twoanonymous reviewers helped to improve an earlierversion of the manuscript. This is contributionnumber 121 of the AMT programme and wasfunded through collaborative research within CA-SIX (publication number 41).
References
Aiken, J., Bale, A.J., 2000. An introduction to the Atlantic
meridional transect (AMT) programme. Progress in Oceano-
graphy 45 (3–4), 251–256.
Aiken, J., Cummings, D.G., Gibb, S.W., Rees, N.W., Woodd-
Walker, R., Woodward, E.M.S., Woolfenden, J., Hooker,
S.B., Berthon, J.-F., Dempsey, C.D., Suggett, D.J., Wood, P.,
Donlon, C., Gonzalez-Benitez, N., Huskin, I., Quevedo, M.,
Barciela-Fernandez, R., Vargas, C.D., McKee, C., 1998.
AMT5 cruise report. In: Firestone, E.R. (Ed.), NASA Tech.
Memo. 1998-206892, vol.2. NASA Goddard Space Flight
Center, Greenbelt, MD, p. 113p.
Altman, D.G., 1991. Practical Statistics for Medical Research.
Chapman & Hall, London, 611pp.
Bakun, A., Nelson, C.S., 1991. The seasonal cycle of wind-stress
curl in subtropical eastern boundary current regions. Journal
of Physical Oceanography 21 (12), 1815–1834.
Carr, M.-E., 2001. Estimation of potential productivity in eastern
boundary currents using remote sensing. Deep-Sea Research
II 49 (1–3), 59–80.
Chavez, F.P., Strutton, P.G., Friederich, C.E., Feely,
R.A., Feldman, G.C., Foley, D.C., McPhaden, M.J., 1999.
ARTICLE IN PRESSY. Pradhan et al. / Deep-Sea Research II 53 (2006) 1548–15591558
Biological and chemical response of the equatorial Pacific
Ocean to the 1997–1998 El Nino. Science 286 (5447),
2126–2131.
Chiapello, I., Moulin, C., Prospero, J.M., 2005. Understanding
the long-term variability of African dust transport across the
Atlantic as recorded in both Barbados surface concentrations
and large-scale total ozone mapping spectrometer (TOMS)
optical thickness. Journal of Geophysical Research 110 (D18)
(article no.-D18S10).
Cipollini, P., Cromwell, D., Challenor, P.G., Raffaglio, S., 2001.
Rossby waves detected in global ocean colour data. Geophy-
sical Research Letters 28 (2), 323–326.
Dandonneau, Y., Deschamps, P.-Y., Nicolas, J.-M., Loisel, H.,
Blanchot, J., Montel, Y., Thieuleux, F., Becu, G., 2004.
Seasonal and inter-annual variability of ocean color and
composition of phytoplankton communities in the north
Atlantic, equatorial Pacific and south Pacific. Deep Sea
Research II 51 (1–3), 303–318.
Hill, A.E., Brown, J., Fernand, L., 1997. The summer gyre in
the western Irish sea: shelf sea paradigms and management
implications. Estuarine Coastal and Shelf Sciences 44 (Suppl. A),
83–95.
Hill, A.E., Hickey, B.M., Shillington, F.A., Strub, P.T., Brink,
K.H., Barton, E.D., Thomas, A.C., 1998. Eastern ocean
boundaries. Coastal segment (E). In: Robinson, A.R.,
Brink, K.H. (Eds.), The Sea, the Global Coastal Ocean:
Regional Studies and Syntheses, vol. 11. Wiley, New York,
pp. 29–67.
Huang, H.-P., Kushnir, Y., Robertson, A.W., 2005. Atlantic SST
gradient and the influence of ENSO. Geophysical Research
Letters 32 (20), 1–4.
Huberty, C.J., 2003. Multiple correlation versus multiple regres-
sion. Educational and Psychological Measurement 63 (2),
271–278.
Larkin, N.K., Harrison, D.E., 2005. Global seasonal temperature
and precipitation anomalies during El Nino autumn and
winter. Geophysical Research Letters 32 (16), 1–4.
McClain, C.R., Firestone, J., 1993. An investigation of Ekman
upwelling in the North-Atlantic. Journal of Geophysical
Research—Oceans 98 (C7), 12327–12339.
McPhaden, M.J., 1999. Genesis and evolution of the 1997–98 El
Nino. Science 283, 950–954.
Mittelstaedt, E., 1991. The ocean boundary along the northwest
African coast—circulation and oceanographic properties at
the sea-surface. Progress in Oceanography 26 (4), 307–355.
Monterey, G.I., Levitus, S., 1997. Climatological Cycle of Mixed
Layer Depth in the World Ocean. NOAA NESDIS, US
Government Printing Office, 5pp.
Mueller, J.L., Bidigare, R.R., Trees, C., Balch, W.M., Dore, J.,
Drapeau, D.T., Karl, D., VanHeukelem, L., Perl, J., 2003.
Ocean optics protocols for satellite ocean color sensor
validation, In: Biogeochemical and Bio-optical Measurements
and Data Analysis Protocols. NASA Technical Memoran-
dum 2003–211621, Rev. 5, vol. V. NASA Goddard Space
Flight Center, Greenbelt.
Murtugudde, R.G., Signorini, S.R., Christian, J.R., Busalacchi,
A.J., McClain, C.R., Picaut, J., 1999. Ocean color variability
of the tropical Indo-Pacific basin observed by SeaWiFS
during 1997–1998. Journal of Geophysical Research—Oceans
104 (C8), 18351–18366.
O’Reilly, J.E., Maritorena, S., O’Brien, M.C., Siegel, D.A.,
Toole, D., Menzies, D., Smith, R.C., Mueller, J.L., Mitchell,
B.G., Kahru, M., Chavez, F.P., Strutton, P., Cota, G.F.,
Hooker, S.B., McClain, C.R., Carder, K.L., Muller-Karger,
F., Harding, L., Magnuson, A., Phinney, D., Moore, G.F.,
Aiken, J., Arrigo, K.R., Letelier, R., Culver, M., 2000.
SeaWiFS postlaunch calibration and validation analyses. Part
3. NASA Technical Memorandum—SeaWIFS Postlaunch
Technical Report Series 11, 1–49.
Reynolds, R.W., Smith, T.M., 1994. Improved global sea surface
temperature analyses using optimum interpolation. Journal of
Climate 7, 929–948.
Roy, C., Reason, C., 2001. ENSO related modulation of coastal
upwelling in the eastern Atlantic. Progress in Oceanography
49 (1–4), 245–255.
Sætersdal, G., Bianchi, G., Strømme, T., Venema, S.C., 1999.
The DR. FRIDTJOF NANSEN Programme 1975–1993.
Investigations of Fishery Resources in Developing Countries.
History of the Programme and Review of Results. FAO
Fisheries Technical Paper 391. FAO, Rome.
Santos, A.M.P., Kazmin, A.S., Peliz, A., 2005. Decadal changes
in the Canary upwelling system as revealed by satellite
observations: their impact on productivity. Journal of Marine
Research 63 (2), 359–379.
Siegel, D.A., 2001. Oceanography—the Rossby rototiller. Nature
409 (6820), 576–577.
Signorini, S.R., Murtugudde, R.G., McClain, C.R., Christian,
J.R., Picaut, J., Busalacchi, A.J., 1999. Biological
and physical signatures in the tropical and subtropical
Atlantic. Journal of Geophysical Research 104 (C8),
18367–18382.
Stein, M.L., 1999. Interpolation of Spatial Data: Some Theory
for Kriging. Springer Series in Statistics. Springer, Berlin,
275pp.
Strub, P.T., James, C., Thomas, A.C., Abbott, M.R., 1990.
Seasonal and nonseasonal variability of satellite-deri-
ved surface pigment concentration in the California
current. Journal of Geophysical Research 95 (C7),
11501–11530.
Thomas, A.C., Blanco, J.L., Carr, M.E., Strub, P.T., Osses, J.,
2001a. Satellite-measured chlorophyll and temperature
variability off northern Chile during the 1996–1998 La Nina
and El Nino. Journal of Geophysical Research 106 (C1),
899–915.
Thomas, A.C., Carr, M.-E., Strub, P.T., 2001b. Chlorophyll
variability in eastern boundary currents. Geophysical Re-
search Letters 28 (12), 3421–3424.
Thomas, A.C., Strub, P.T., Carr, M.E., Weatherbee, R., 2004.
Comparisons of chlorophyll variability between the four
major global eastern boundary currents. International Jour-
nal of Remote Sensing 25 (7–8), 1443–1447.
Tomczak, M., Godfrey, J.S., 1994. Regional Oceanography: An
Introduction. Pergamon, Oxford, 442pp.
Uz, B.M., Yoder, J.A., Osychny, V., 2001. Pumping of nutrients
to ocean surface waters by the action of propagating
planetary waves. Nature 409 (6820), 597–600.
Van Camp, L., Nykjaer, L., Mittelstaedt, E., Schlittenhardt, P.,
1991. Upwelling and boundary circulation off North-
west Africa as depicted by infrared and visible sate-
llite observations. Progress in Oceanography 26 (4),
357–402.
Wilson, C., Adamec, D., 2002. A global view of bio-physical
coupling from SeaWiFS and TOPEX satellite data, 1997–2001.
Geophysical Research Letters 29 (8) (article no.-1257).

ARTICLE IN PRESSY. Pradhan et al. / Deep-Sea Research II 53 (2006) 1548–1559 1559
Wolter, K., 2006. Multivariate ENSO index (MEI). Climate
Diagnostics Centre, NOAA Available from: /http://www.
cdc.noaa.gov/people/klaus.wolter/MEI/S.
Yamagata, T., Iizuka, S., 1995. Simulation of the tropical
thermal domes in the Atlantic—a seasonal cycle. Journal of
Physical Oceanography 25 (9), 2129–2140.
Yelland, M., Taylor, P.K., 1996. Wind stress measurements from
the open ocean. Journal of Physical Oceanography 26 (4),
541–558.
Zhou, M., Paduan, J.D., Niiler, P.P., 2000. Surface currents in
the Canary Basin from drifter observations. Journal of
Geophysical Research 105 (C9), 21893–21911.