Embed Size (px)
Citation preview

at SciVerse ScienceDirect
Crop Protection 44 (2013) 50e58
Contents lists available
Crop Protection
journal homepage: www.elsevier .com/locate/cropro
Season-long expression of Cry1Ac and Cry2Ab proteins in Bollgard II cotton inAustralia
Kristen Knight a,*, Graham Head b, John Rogers c
aMonsanto Australia, PO Box 92, Harlaxton, Queensland 4350, AustraliabMonsanto Company, 800 North Lindbergh Blvd., St Louis, MO 63167, USAcResearch Connections and Consulting, PO Box 350, Toowong, Queensland 4066, Australia
a r t i c l e i n f o
Article history:Received 12 May 2012Received in revised form11 October 2012Accepted 14 October 2012
Keywords:Bacillus thuringiensisBollgard II cottonHelicoverpa armigeraHelicoverpa punctigeraSeason long controlAustralia
* Corresponding author. Tel.: þ61 7 4634 8300; faxE-mail address: [email protected] (
0261-2194/$ e see front matter � 2012 Elsevier Ltd.http://dx.doi.org/10.1016/j.cropro.2012.10.014
a b s t r a c t
Bollgard II cotton has been grown commercially in Australia since 2003 for control of the primary targetspecies Helicoverpa armigera (Hübner) and Helicoverpa punctigera (Wallengren) Larvae of both specieshave been reported to survive at low frequencies on Bollgard II with larvae >8 mm recorded in between7 and 18% of the area planted to Bollgard II cotton between 2005/06 and 2007/08. F1 and F2 tests haveshown that this is not due to the presence of resistance genes in the surviving larvae. To understand iffluctuations in the expression of the Cry proteins in Bollgard II allow some larvae to survive, plant tissuesamples were taken from five Bollgard II cultivars throughout the growing season within fields and fromdifferent farms within a production region between 2007 and 2010. The data indicate that the expressionof both Cry proteins is similar to the known resistance-monitoring diagnostic concentrations and rela-tively uniform between fields within a farm and between farms within a region, with less than one-thirdof the tests at this level of variation being significant. However, there were intra-seasonal changes inexpression of both Cry proteins and differences in expression between plant structures and betweencultivars for both Cry proteins. Further work is needed to establish if this variation in Cry protein contentin Bollgard II cotton affects the control of Helicoverpa spp. in the field or whether plant-physiological andpest-behavioural factors underlie the occasional occurrence of Helicoverpa larval survival on Bollgard IIcotton.
� 2012 Elsevier Ltd. All rights reserved.
1. Introduction
Bollgard II cotton, Gossypium hirsutum, cultivars expressing theBacillus thuringiensis variety kurstaki (Bt) Cry1Ac and Cry2Ab d-endotoxins have been grown commercially in Australia since 2003/04 (Fitt, 2003). These Bt proteins have highly specific insecticidalactivity against caterpillar pests of cotton, including the targetspecies in Australia Helicoverpa armigera (Hübner) and Helicoverpapunctigera (Wallengren). The two Bt proteins provide high insec-ticidal activity throughout the season against Helicoverpa spp.However, while most larvae feed and die prior to reaching secondinstar, there have been reports since 2005 of larvae surviving in upto 18% of the area planted to Bollgard II cotton (Whitburn andDownes, 2009). Larvae have reached or exceeded economicthreshold levels on Bollgard II cotton (two larvae >3 mm per m ofrow over two consecutive checks, or one larva >8 mm per m row)
: þ61 7 4634 8500.K. Knight).
All rights reserved.
when there have been high egg lays (80e100 eggs/m) but also haveoccurred where egg lays have been low (4e10 eggs/m) (K. Knight,unpublished data). Since these reports of survivors in Bollgard II,collections of these larvae have been made and tested with F1 andF2 screening protocols (Andow and Alstad, 1998; Gould et al., 1997).It was found that larvae surviving in Bollgard II are nomore likely tobe carrying resistance alleles to the proteins in Bollgard II than eggscollected from other hosts (Downes, 2011).What remains unclear ishow and why susceptible larvae able to survive occasionally onBollgard II cotton.
Barber (2008) suggested that the survival must be due toa reduction in the expression of the Cry1Ac and/or the Cry2Abproteins but to date there has not been adequate data to assess thispossibility. Many studies (reviewed by Dong and Li, 2007) haveindicated that the level of Cry1Ac protein in Bollgard (Ingard inAustralia) and Bollgard II cotton plants declines over the course ofthe growing season (Adamczyk et al., 2001; Greenplate, 1999; Holt,1998; Olsen et al., 2005) while the Cry2Ab protein has been re-ported to remain at relatively constant levels (Adamczyk et al.,2001). In addition, various environmental factors can affect the

K. Knight et al. / Crop Protection 44 (2013) 50e58 51
level of the two Cry proteins in Bollgard II cotton plants. Luo et al.(2008) found that a combination of waterlogging and salinitydecreased the expression of Cry1Ac by 45e72%, while waterloggingalone caused a decrease in expression of between 38 and 50%.Apparently as a consequence, waterlogging was found to signifi-cantly affect the control of neonates (Luo et al., 2008). Extendedperiods of high temperatures (>37 �C) at boll setting also werefound to decrease the expression of Cry1Ac in Bollgard II plants(Chen et al., 2005). Olsen et al. (2005) found that in pre-squareplants there were significant changes in Cry1Ac expression, withwarmer conditions enhancing control ofHelicoverpa spp. larvae andcooler conditions decreasing larval mortality. Similarly, theexpression of Cry2Ab in Bollgard II was reduced by low tempera-tures (<14 �C) during the flowering/fruiting growth period for up tosix days after the initial stress event (Addison and Rogers, 2010). Luet al. (2011) examined the preferences of H. armigera larvae forvarious plant parts on Bollgard II and non-transgenic cotton andfound that neonates preferred flowers to other plant parts onBollgard II cotton more strongly than on non-Bt plants, pointing tothe potential importance of neonate larval behaviour on survivaloutcomes on Bollgard II cotton.
Collectively, the results of these earlier studies suggest that thelow levels of observed survival of Helicoverpa larvae could be due tosome combination of (a) the decline in Cry1Ac over the course ofthe growing season, (b) environmental factors affecting theexpression of both Cry1Ac and Cry2Ab2, or (c) behavioural resis-tance (Lu et al., 2011). The purpose of the current research was toevaluate season-long expression of both of the Bt proteins in Boll-gard II cotton to determine if fluctuations in protein expressioncould be a cause of the observed low levels of survival of Heli-coverpa larvae on Bollgard II cotton, as recommended by Lu et al.(2011). The following specific hypotheses were investigated:
1. Does Bt protein expression vary with the position in the field,e.g. head ditch versus tail drain?
2. Does Bt expression vary among fields/farms within a produc-tion region?
3. Does Bt expression vary among Bt cotton cultivars?4. Does the change in Bt protein expression over the season vary
among different plant parts?
In a separate study, bioassays with both Helicoverpa spp. wereconducted on a subset of the samples reported here to determine ifthe observed expression levels were affecting control of the targetLepidoptera (Knight et al., unpublished data). Together these twosets of data provide the baseline to better understand and evaluatecauses of the occasional presence of live Helicoverpa larvae inAustralian Bollgard II cotton.
2. Materials and methods
2.1. Study overview
2.1.1. Trial locationsThe experiments were conducted in the cotton growing seasons
of 2007/08, 2008/09 and 2009/10 in four cotton growing areas ofQueensland, Australia; St George, Goondiwindi, Emerald and theBurdekin. In the Burdekin e a winter production area e twocommercial varieties of Bollgard II, 289B and 60BRF, were plantedon 29 January 2008 at the Ayr Queensland Department of PrimaryIndustries and Fisheries Research Station. In 2008/09, the trial inGoondiwindi was planted on a commercial farmwith two varieties71B and 412B. In 2009/10, the trials were run on three farms at StGeorge with the variety 71BRF. The Emerald trial in 2009/10involved two fields on the same commercial farm; one of the fields
had a history of larvae surviving (Field 1) while the other field hadno history of survivors (Field 2). The variety planted in Emerald was71BRF. The farmers’ commercial crop-scouting services found nounusual survival of larvae in any of these fields during our samplingperiods, indicating that Bollgard II was fully effective in all thesefields at the levels at which the Cry1Ac and Cry2Ab proteins wereexpressed.
2.1.2. Tissue collectionsFor all experiments, the tissues sampled were the first unfurled
leaf, and first-position squares, small bolls and large bolls. In 2007/08, in the Burdekin collections were taken weekly from first flower(1 flower per metre) for eight weeks. In 2008/09 and 2009/10, StGeorge, Goondiwindi and Emerald collections were taken fort-nightly from early squaring (1 square per metre), weekly throughthe flowering period and fortnightly again until first defoliation.Once collected, the tissue was placed into pre-labelled zip lockplastic bags and placed directly into a cooler with an ice brick. Forthe Burdekin experiment, the tissue was sent to the MonsantoResearch Facility in Toowoomba, Queensland, Australia by over-night courier. For the St George trials the material was transportedto the Monsanto Research facility in a car fridge with a temperatureof approximately 5 �C. In Goondiwindi and Emerald, the materialwas processed on site. All tissue was frozen within 24 h ofcollection.
2.1.3. Within-field samplingAt all experimental sites, fixed points for sampling throughout
the season were determined at the first sampling date. The posi-tions were at least 30 m from the head ditch and the tail drain, andin the middle of the field. At each sampling date, 20 of each of theplant structures were collected within 2 rows on either side of thesampling point.
2.1.4. Quantification of Cry protein expression using enzyme-linkedimmunosorbent assays (ELISA)
Tissues were frozen (�20 �C) for at least 24 h, freeze-dried andfinely ground. Three replicates of 5e10mg of each tissue, from eachfield-position, from each sample date, from each trial locationweresent to Monsanto Company, St Louis, USA for ELISA analysis. TheBollgard II tissues were evaluated for Cry1Ac and Cry2Ab2expression by using toxin-specific double-antibody sandwich ELISAprocedures as described by Sims et al. (1996) and as modified byGreenplate et al. (2003).
2.2. Statistical analysis
All statistical analysis was performed in GenStat V13 (Payne,2010). For all data sets, the results of the three laboratory repli-cates from each tissue sample were averaged prior to statisticalanalysis because the variation of interest is between differenttimes, varieties, and farms at the sample level and not betweensubsamples derived from a single field sample. That is, the variationbetween sub-samples measures only laboratory measurementerror.
2.2.1. Within-field variation of Cry protein levelsUnder the furrow-irrigation system that is standard practice in
the Australian cotton industry, there can be differences in moistureregimes between the top, the middle, and close to the tail drain atthe bottom of each field. This analysis aimed to evaluate whetherfield positionwas a significant source of variation in the Cry proteinlevels, compared with the other sources of variation in thesampling design. Because of substantial seasonal non-overlapbetween data sets for the different plant parts in crops planted at

K. Knight et al. / Crop Protection 44 (2013) 50e5852
the standard planting time, each plant part was analysedseparately.
For each dataset, a repeated-measures restricted maximumlikelihood (REML) analysis was performed fitting all main effectsand all two-way interactions involving field position but not fittingany three-way or higher interactions, or interactions involving onlyfactors other than field position. This analysis is analogous toanalysis of an unreplicated factorial, as described by Cochran andCox (1957, pp. 218e219), and provides a test of the magnitude offield-position effects relative to other variation in the data.Residual and normal plots were used to decide if data trans-formation was required prior to analysis.
2.2.2. Temporal, varietal and spatial variation of Cry protein levelsBecause all the field position and field-position interaction
terms in the preliminary REML analyses were non-significant (seeResults), field position was fitted in the random model of REMLanalyses that assessed seasonal, varietal and locality effects on Cryprotein levels. Residual and normal plots were used to decide ifdata transformation was required prior to analysis. Where terms inthe REML table of fixed effects were significant andmore detail wasrequired of significant differences, multiple-comparison tests wereperformed using t-tests with a sequential Bonferroni correction tomaintain family-wise probability levels (Quinn and Keough, 2002pp. 49e50).
3. Results
3.1. Field-position effects
For each Cry protein, a total of 19 data sets were analysed fromfour Australian cotton-growing regions over three years and fourplant parts giving a total of 114 separate estimates of the signifi-cance of field-position and interactions involving field-position(Table 1). Not one was significant at P ¼ 0.05 and two-thirds ofthe probabilities were 0.50 or larger (Table 1). Very clearly, there isnot significant systematic variation in the content of either Cryproteins within fields with respect to sampling position from thetop to the bottom of the field. Table 1 also give typical data (StGeorge, 2009/10) to provide a more detailed picture of the lack ofthis variation. The seasonal trends in Cry protein levels at St Georgein 2009/10 are plotted in Fig. 1 along with the standard errors ofdifference (SEDs) for each sampling date. Any differences betweenfield positions have to be approximately twice the plotted SED to besignificant even for a simple LSD test (and before any Bonferroniprobability correction, as used here). From inspection of Fig. 1, it isclear that differences between field positions within a field areinconsequential, compared to other sources of variation. Because ofthe absence of differences between field positions in any of the data
Table 1Summary of probabilities in the tables of fixed effects associated with field position andanalyses of Cry1Ac and Cry2Ab protein content, plus detailed results from St George, 20
Fixed term in REML analysis Overall summary
Average probability (and range) Numbe
Cry1AcField position 0.569 (0.118e0.943) 19Field position*date 0.720 (0.283e0.997) 19Field position*variety 0.650 (0.466e0.745) 7Field position*farm 0.595 (0.136e0.984) 12Cry2AbField position 0.520 (0.055e0.989) 19Field position*date 0.715 (0.313e0.999) 19Field position*variety 0.641 (0.286e0.896) 7Field position*farm 0.617 (0.135e0.936) 12
sets reported here, the field position factor was regarded asa replication factor and included in the random model for allsubsequent analyses of these data sets.
3.2. Intra-regional and temporal effects on Cry protein content
3.2.1. Cry1Ac protein analyses3.2.1.1. St George. For all four plant parts, the sampling-date� farminteraction was not significant (Table 2), and consequently bothsampling-date and farm effects were considered at the main effectlevel only (Fig. 2A, Table 3). Average Cry1Ac content only variedbetween farms for large bolls; for the other three plant parts,Cry1Ac protein content was equivalent on all farms. This resultpoints to stability of Cry1Ac expression across farms withina production region.
However, there was marked temporal variation in Cry1Accontent of leaves at St George in 2009/10 (Fig. 2A), with a fall inprotein level from the start of sampling in November 2009 to thebeginning of 2010. After that, Cry1Ac content of leaves remainedapproximately constant through to the end of sampling. Therewerealso significant differences between dates for small and large bolls,but this variation was relatively small, compared to the variation inleaf protein (Fig. 2A). The Cry1Ac content of squares did not differsignificantly over the sampling period (Table 2). Up to the end of2009, the level of Cry1Ac protein in leaves was markedly higherthan in the other three plant parts, but as the end of the seasonapproached, content of all plant parts converged to approximately4 mg/g.
3.2.1.2. Emerald. On the Emerald farm, the sampling date � fieldinteraction was not significant for all four plant parts (Table 4), andso both sampling-date (Fig. 3A) and field effects were considered atthemain-effect level only. As for the St George data, average Cry1Accontent only varied between fields for large bolls with Field 1averaging 5.2 mg/g and Field 2 4.8 mg/g; for the other three plantparts, Cry1Ac protein content was equivalent on both fields. Thisagain points to stability of Cry1Ac expression across locationswithin a production region.
There was significant variation in Cry1Ac content of leaves atEmerald from sampling date to sampling date in 2009/10 but withlittle, if any, overall seasonal trend (Fig. 3A). There were significantdifferences between dates for small bolls, but as for leaves thisvariation did not show any obvious seasonal trend. The Cry1Accontent of squares and large bolls did not differ significantly overthe sampling period (Fig. 3A). In the case of squares, the REML tableof fixed effects (Table 4) indicated a difference but no individualcomparisons were significant once the Bonferroni probabilitycorrection was applied (Fig. 3A). At Emerald, the level of Cry1Acprotein in all plant parts was relatively stable over the course of the
interactions involving field position in preliminary restricted maximum likelihood09/10.
St George 2009/10
r of analyses Leaf Square Small boll Large boll
0.802 0.291 0.335 0.8400.962 0.941 0.409 0.533e e e e
0.326 0.308 0.935 0.984
0.903 0.309 0.558 0.8090.970 0.407 0.602 0.381e e e e
0.904 0.634 0.351 0.764
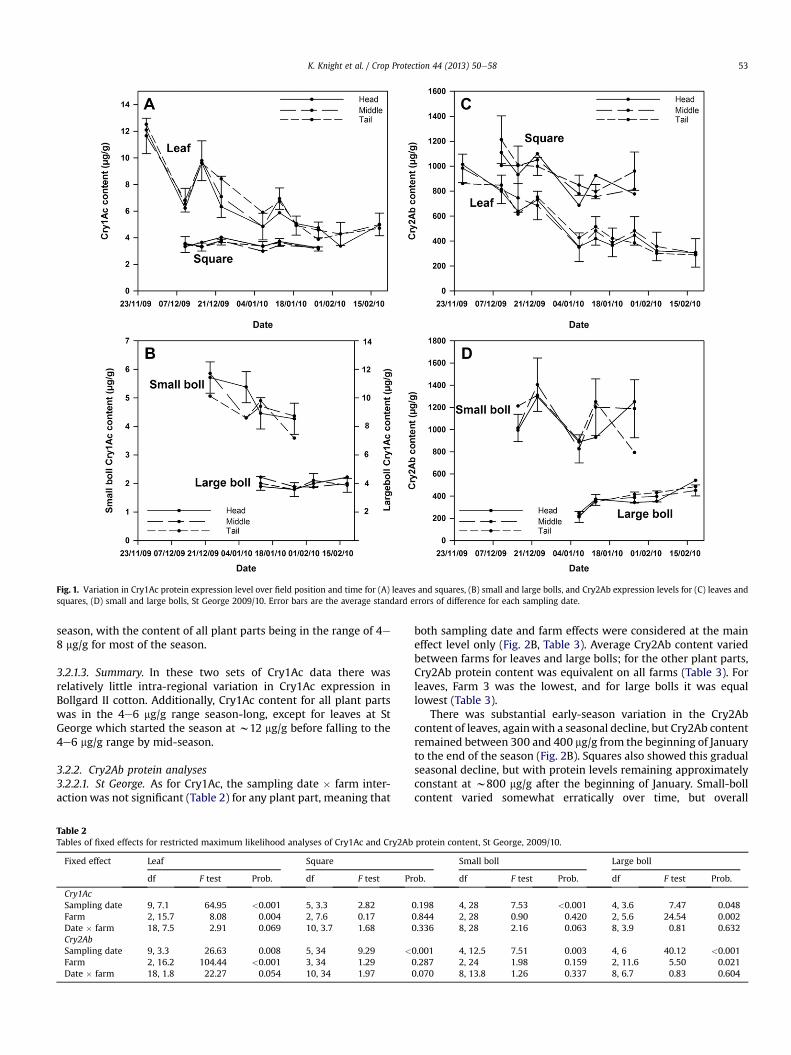
Fig. 1. Variation in Cry1Ac protein expression level over field position and time for (A) leaves and squares, (B) small and large bolls, and Cry2Ab expression levels for (C) leaves andsquares, (D) small and large bolls, St George 2009/10. Error bars are the average standard errors of difference for each sampling date.
K. Knight et al. / Crop Protection 44 (2013) 50e58 53
season, with the content of all plant parts being in the range of 4e8 mg/g for most of the season.
3.2.1.3. Summary. In these two sets of Cry1Ac data there wasrelatively little intra-regional variation in Cry1Ac expression inBollgard II cotton. Additionally, Cry1Ac content for all plant partswas in the 4e6 mg/g range season-long, except for leaves at StGeorge which started the season at w12 mg/g before falling to the4e6 mg/g range by mid-season.
3.2.2. Cry2Ab protein analyses3.2.2.1. St George. As for Cry1Ac, the sampling date � farm inter-actionwas not significant (Table 2) for any plant part, meaning that
Table 2Tables of fixed effects for restricted maximum likelihood analyses of Cry1Ac and Cry2Ab
Fixed effect Leaf Square
df F test Prob. df F test Pr
Cry1AcSampling date 9, 7.1 64.95 <0.001 5, 3.3 2.82Farm 2, 15.7 8.08 0.004 2, 7.6 0.17Date � farm 18, 7.5 2.91 0.069 10, 3.7 1.68Cry2AbSampling date 9, 3.3 26.63 0.008 5, 34 9.29 <
Farm 2, 16.2 104.44 <0.001 3, 34 1.29Date � farm 18, 1.8 22.27 0.054 10, 34 1.97
both sampling date and farm effects were considered at the maineffect level only (Fig. 2B, Table 3). Average Cry2Ab content variedbetween farms for leaves and large bolls; for the other plant parts,Cry2Ab protein content was equivalent on all farms (Table 3). Forleaves, Farm 3 was the lowest, and for large bolls it was equallowest (Table 3).
There was substantial early-season variation in the Cry2Abcontent of leaves, againwith a seasonal decline, but Cry2Ab contentremained between 300 and 400 mg/g from the beginning of Januaryto the end of the season (Fig. 2B). Squares also showed this gradualseasonal decline, but with protein levels remaining approximatelyconstant at w800 mg/g after the beginning of January. Small-bollcontent varied somewhat erratically over time, but overall
protein content, St George, 2009/10.
Small boll Large boll
ob. df F test Prob. df F test Prob.
0.198 4, 28 7.53 <0.001 4, 3.6 7.47 0.0480.844 2, 28 0.90 0.420 2, 5.6 24.54 0.0020.336 8, 28 2.16 0.063 8, 3.9 0.81 0.632
0.001 4, 12.5 7.51 0.003 4, 6 40.12 <0.0010.287 2, 24 1.98 0.159 2, 11.6 5.50 0.0210.070 8, 13.8 1.26 0.337 8, 6.7 0.83 0.604

Fig. 2. Temporal and plant-part variation in (A) Cry1Ac and (B) Cry2Ab proteincontent, St George, 2009/10. For each protein and plant part, dates followed by thesame letter are not significantly different (t-test with a sequential Bonferroni correc-tion (Family-wise probability P ¼ 0.05)). Where only a single pair of dates wasdifferent, the two points are marked with *.
K. Knight et al. / Crop Protection 44 (2013) 50e5854
remained approximately constant over the sampling period. Incontrast, there was a rising trend in Cry2Ab content of large bolls.Overall, the level of Cry2Ab proteinwas markedly higher in squaresand small bolls than leaves and large bolls (Fig. 2B) but this was not
Table 3Season-long mean Cry1Ac and Cry2Ab protein content (mg/g) of leaves, squares,small and large bolls from three farms at St George, 2009/10.
Parameter Farm 1 Farm 2 Farm 3
Cry1AcLeafa 6.960 a 6.618 a 6.079 aSquareb 3.481 3.517 3.392Small bollb 4.625 4.760 4.906Large bolla 3.836 ab 3.968 a 3.472 bCry2AbLeafa 616.9 a 560.4 b 462.4 cSquareb 937.3 963.0 892.5Small bollb 1083.0 1174.0 1034.0Large bolla 349.7 b 405.7 a 358.6 b
a REML F-test significant so means compared using t-tests with a sequentialBonferroni correction (Family-wise probability P ¼ 0.05). Within Cry proteins andplant parts, means followed by the same letter are not significantly different.
b REML F-test not significant so no means testing performed.
tested statistically as there were a limited number of dates onwhich all four plant parts were sampled.
3.2.2.2. Emerald. As for the other intra-regional data sets, thesampling-date � field interaction was not significant (Table 4) forany plant part; again both sampling date (Fig. 3B) and field effectswere considered at the main-effect level only. Average Cry2Abcontent varied between fields for leaves with Field 1 averaging511.2 mg/g, and Field 2 488.9 mg/g but for the other plant parts,Cry2Ab protein content was equivalent on the two fields.
There was a seasonal decline in the Cry2Ab content of leaves atEmerald (Fig. 3B), but Cry2Ab content remained approximatelyconstant at w400 mg/g from the beginning of January to the end ofthe season. Cry2Ab content of squares remained constantthroughout the season at w800 mg/g. Small-boll content variedsomewhat erratically over time, but remained in the range 500e900 mg/g over the sampling period. As for St George, there wasa rising trend in Cry2Ab content of large bolls, but this was notsignificant at Emerald. Overall, the level of Cry2Ab protein wasmarkedly higher in square and small bolls than in large bolls(Fig. 3B), as was the case at St George.
3.2.2.3. Summary. Cry2Ab expression showed some intra-regionalvariation, but this was primarily in the leaves. In both regions,there was no significant intra-regional variation in Cry2Ab contentof squares or small bolls. Temporal changes in expressionwere alsodetected, with the Cry2Ab content of leaves falling during theseason while the large-boll Cry2Ab content rose.
3.3. Cultivar and temporal effects on Cry protein content
3.3.1. Cry1Ac protein analyses3.3.1.1. Burdekin. For all three plant parts, there were no interac-tions between sampling date and cultivar, and no differencesbetween sampling dates for either square or small boll (Fig. 4A) (allP > 0.05 in the REML table of fixed effects, data not shown butpatterns are similar to those in Tables 2 and 4). The only differencesbetween dates in Cry1Ac leaf content was between samplescollected on 12 and 21 May 2008 (Fig. 4A). In summary, there wasrelatively little variation over time in Cry1Ac levels at this site. Thetwo cultivars, 289B and 60BRF had equivalent Cry1Ac contents inboth squares and leaves (P > 0.05), but for small bolls 60BRF(4.76 mg/g) had a higher Cry1Ac season-long average than did 289B(3.82 mg/g) (P ¼ 0.001).
3.3.1.2. Goondiwindi. There were significant differences in Cry1Accontent between cultivars for all four plant parts and significantsampling date � cultivar interactions for three of them (Table 5).The overall picture was for cultivar 412B to have higher levels ofCry1Ac protein than cultivar 71B (Fig. 5A and B). Where botha cultivar main-effect and an interaction existed, the focus ofmultiple testing was on week-by-week cultivar comparisons(Fig. 5A and B). For leaves, the cultivar 412B had a significantlyhigher Cry1Ac content than cultivar 71B for all sampling datesexcept the final two, while for squares, 412B was significantlyhigher than 71B for all dates except 19/1/09. For small bolls, therewas no interaction (P ¼ 0.084) so testing was done at the maineffect level only; cultivar 412B (5.78 mg/g) had a significantly higherseason average than 71B (4.24 mg/g). For large bolls, the two culti-vars were significantly different only on 2 February 2009, againwith 412B being the higher.
3.3.1.3. Summary. At these two sites, within broadly similarseasonal patterns there were differences both in the overallexpression Cry1Ac expression level between cultivars and in the

Table 4Tables of fixed effects for restricted maximum likelihood analyses of Cry1Ac and Cry2Ab protein content, Emerald, 2009/10.
Fixed effect Leaf Square Small boll Large boll
df F test Prob. df F test Prob. df F test Prob. df F test Prob.
Cry1AcSampling date 8, 9.2 5.68 0.008 8, 26.6 3.26 0.010 5, 20 5.34 0.003 5, 3 3.47 0.168Field 1, 26.6 2.80 0.106 1, 11.4 0.25 0.626 1, 2 1.56 0.338 1, 3.8 117.89 <0.001Date � field 8, 9.2 2.62 0.084 8, 26.6 1.26 0.306 5, 20 0.82 0.548 5, 3 3.58 0.163Cry2AbSampling date 8, 8 9.31 0.002 8, 6.3 0.38 0.898 5, 17.9 11.41 <0.001 5, 2.9 3.63 0.167Field 1, 3 23.12 0.015 1, 9.3 3.26 0.103 1, 9.2 0.76 0.406 1, 7.9 1.39 0.272Date � field 8, 8 1.93 0.186 8, 6.3 1.31 0.376 5, 17.9 1.01 0.438 5, 2.9 2.55 0.244
K. Knight et al. / Crop Protection 44 (2013) 50e58 55
changes over time for some plant parts. This suggests that BollgardII cotton cultivars can exhibit somewhat different expressionprofiles, but within broadly similar seasonal expression patterns.
3.3.2. Cry2Ab protein analyses3.3.2.1. Burdekin. For leaves and small bolls, there were no inter-actions between sampling date and cultivar, but a significant cul-tivar� date interaction existed for squares (P¼ 0.011). Examinationof this interaction indicated that while the overall seasonal patternwas similar, peak protein content occurred later in cultivar 60BRF
Fig. 3. Temporal and plant-part variation in (A) Cry1Ac and (B) Cry2Ab proteincontent, Emerald, 2009/10. For each protein and plant part, dates followed by the sameletter are not significantly different (t-test with a sequential Bonferroni correction(Family-wise probability P ¼ 0.05)).
than in 289B, leading to a significant difference on one date(Fig. 4B). However, the overall seasonal pattern of Cry2Ab contentwas essentially the same for all plant parts, with a slight decliningtrend in content over time. This trend was statistically significantonly for leaves, in that the Cry2Ab content on the final samplingdate was lower than on two dates at the beginning of the season(Fig. 4B). Cultivars were not different at the main effect level forleaves and squares (P < 0.05), but for small bolls Cry2Ab content of60BRF (1275 mg/g) was markedly higher than for 289B (768 mg/g)(P < 0.001).
Fig. 4. Temporal, cultivar and plant-part variation in (A) Cry1Ac and (B) Cry2Abprotein content, Burdekin, 2007/08. For each protein and plant part, dates followed bythe same letter are not significantly different (t-test with a sequential Bonferronicorrection (Family-wise probability P ¼ 0.05)). For Cry2Ab content of squares, the twocultivars were significantly different on dates marked *.

Table 5Tables of fixed effects for restricted maximum likelihood analyses of Cry1Ac and Cry2Ab protein content, Goondiwindi, 2008/09.
Fixed effect Leaf Square Small boll Large boll
df F test Prob. df F test Prob. df F test Prob. df F test Prob.
Cry1AcSampling date 11, 11.4 35.36 <0.001 8, 8 67.84 <0.001 7, 7.2 5.90 0.015 5, 5.3 15.86 0.003Cultivar 1, 21.5 424.77 <0.001 1, 6.6 488.52 <0.001 1, 19.4 133.14 <0.001 1, 4 7.97 0.048Date � cultivar 11, 11.4 8.46 <0.001 8, 8 7.36 0.005 7, 7.2 2.97 0.084 5, 5.3 30.83 <0.001Cry2AbSampling date 11, 10.8 43.75 <0.001 8, 8 31.59 <0.001 7, 8.5 9.47 0.002 5, 22 28.41 <0.001Cultivar 1, 22.6 15.46 <0.001 1, 4.5 49.47 0.001 1, 12.9 74.94 <0.001 1, 22 6.58 0.018Date � cultivar 11, 10.8 6.56 0.002 8, 8 6.31 0.009 7, 8.5 6.79 0.006 5, 22 2.34 0.076
K. Knight et al. / Crop Protection 44 (2013) 50e5856
3.3.2.2. Goondiwindi. The Cry2Ab leaf data required trans-formation onto the log10(x þ 1) scale prior to analysis; equivalentmeans are presented in Fig. 5C. As for Cry1Ac content, there weresignificant differences in Cry2Ab content between cultivars for allfour plant parts and significant sampling date � cultivar interac-tions for three of them (Table 5). However, the overall picture ofcultivar differences was much less clear cut than for Cry1Ac, butwith similar seasonal patterns in both cultivars (Fig. 5C and D). Forleaves, 412B was higher than 71B for 10 of the 12 sampling dates,but date-by-date testing showed significant differences on only two
Fig. 5. Temporal and cultivar variation in Cry1Ac protein content in (A) leaf and square and (Band large bolls at Goondiwindi, 2008/09. For each plant part and Cry protein, cultivars scorrection (Family-wise probability P ¼ 0.05)). Where no cultivar differences exist for eachdifferent (t-test with a sequential Bonferroni correction (Family-wise probability P ¼ 0.05))
dates, 19 and 27 January 2009 with one difference in each direction(Fig. 5C). Over the whole season, the average level in 412B leaves(1015 mg/g) was only 10.6% higher than in 71B leaves (913 mg/g).Cry2Ab content of squares on 412B was higher than on 71B onseven of nine dates but there was only three dates with significantdifferences (Fig. 5C). On 27 January and 2 March, Cry2Ab levels in412B squareswere higher than in 71B squares but on 27 January thereverse was true (Fig. 5C). Cry2Ab content of small bolls fluctuatedmarkedly from week-to-week and on two sampling dates, contentof 412B small bolls was significantly higher than in 71B bolls. There
) small and large bolls, and Cry2Ab protein content in (C) leaf and square, and (D) smallignificantly different for each date marked are * (t-test with a sequential BonferroniCry protein and plant part, sampling dates with the same letters are not significantly.

K. Knight et al. / Crop Protection 44 (2013) 50e58 57
was no cultivar� date interaction for large bolls (P¼ 0.076) and theCry2Ab content of cultivar 412B (759.8 mg/g) was higher than in 71B(629.1 mg/g) (P ¼ 0.018). Over the course of the season, Cry2Abcontent of large bolls increased significantly (Fig. 5D).
3.3.2.3. Summary. As for Cry1Ac, there were some cultivar andcultivar � time differences in Cry2Ab expression for some plantparts, but with broad overall similarity across cultivars.
4. Discussion
Diagnostic concentrations for resistance monitoring in Heli-coverpa spp. have been established as 0.25 mg/cm2 and 2.0 mg/cm2
for Cry1Ac and Cry2Ab, respectively, in diet surface-contaminationbioassays (Mahon et al., 2007). Using the range of published data onspecific leaf weight and area (see Supplementary Table 1), weexpressed the range of leaf Cry protein concentrations reportedhere (Table 3, Figs. 2e4) in the same units, i.e. mg/cm2 of leaf. Thispointed to leaf Cry1Ac concentrations being potentially in the range0.02e0.12 mg/cm2 and Cry2Ab concentration between 1.56 and9.31 mg/cm2. Despite the operational differences betweenHelicoverpa larvae feeding on leaves and on insect diet, thecongruence of these extrapolations and the discriminating dosessupports the field observations that in all of the commercial fieldssampled for this study, Bollgard II was fully effective.Furthermore, the results demonstrate that, over a series of years,locations and cultivars, there was not biologically significantvariation in the expression level of either of the Cry proteinswithin Bollgard II fields. For Cry1Ac, protein expression also wasrelatively uniform among fields on a farm and among farms ina region for all plant parts tested. Large bolls were the plant partsthat showed the most variation in Cry1Ac protein content amongfarms and fields. For Cry2Ab, protein expression was uniformamong fields on a farm, and among farms in a region for bothsquares and small bolls. For leaves, there was variation betweenfields on a farm and among farms within a region, while for largebolls the significant variation was between farms in a region butnot between fields on a farm. In the case of large bolls, there wasa rising trend for the Cry2Ab protein over time.
However, the results confirm that there are temporal changes inboth Cry proteins over the season and spatial differences in Cryprotein content among different plant structures (Adamczyk et al.,2001; Kranthi et al., 2005; Olsen et al., 2005). Although there wasan initial e and often significant e decline in both proteins, espe-cially in leaves, this did not continue for the entire season. Typically,protein content remained approximately stable from 19 nodes, orapproximately 7 NAWF (nodes abovewhite flower), onwards. In thecase of large bolls, Cry2Ab protein content even increased later inthe season. Expression of Cry1Ac in leaves was higher than in theother plant parts tested, though by the end of the season Cry1Accontent was similar for all plant structures. The trend for Cry2Abwas that squares and small bolls had higher expression levels thanleaves and large bolls.
In addition, the data demonstrate that there can be differencesamong cultivars in Bt protein expression, but not for the entireseason or for all plant parts. In the Burdekin, there were onlydifferences among cultivars in Cry1Ac and Cry2Ab content in smallbolls whereas in Goondiwindi the Cry1Ac and Cry2Ab content weredifferent for all the plant parts tested. However, these differencesamong cultivars were small, as would be expected given that newcultivars are tested to ensure that the level of expression of bothCry1Ac and Cry2Ab is not significantly less than an establishedreference variety prior to commercialisation.
Collectively, the results demonstrate that the content of Cry1Acand Cry2Ab in Bollgard II plants is stable within a field, among
fields, and among farms, while there is some variation in proteincontent among plant parts and a trend of declining production ofboth the Cry proteins over the season. Given the pattern of larvalsurvival observed with Bollgard II, with survival varying amongfield and farms, the data presented here indicate that overallpatterns of Cry protein expression cannot be the only variable thatallows larvae to survive Bollgard II; other biotic factors mustcontribute to this phenomenon perhaps through their interactionswith Cry protein expression. These potential factors include (a)physiological stress on the plant, (b) variation in susceptibility inthe pest population, and (c) larval behaviour.
The Bt proteins in transgenic cotton plants are a component ofthe total soluble proteins present. Luo et al. (2008) suggested thatreduction in the levels of Bt protein in transgenic cotton couldsimply be part of the overall levels of soluble protein in cottoncaused by environmental stresses. In their experiment on water-logging and salinity stress on Cry1Ac cotton, Luo et al. (2008) foundthat the combination of both these stresses inhibited nitrogenmetabolismwhich reduced production of total protein. In contrast,we found no differences in Cry expression between the top andpotentially-waterlogged tail-drain sections of fields. High temper-atures also degraded total soluble protein by 47e55% during theboll setting period when it was found that insecticidal activitydecreased in Cry1Ac expressing cotton (Chen et al., 2005). Thisindicates that abiotic factors can affect the total soluble proteinspresent in Bollgard II cotton plants and hence the levels of Btproteins, either transiently or throughout the season, but none ofthese effects were evident in our studies.
It is also well known that there is wide variability of suscepti-bility to the Cry proteins inHelicoverpa spp. populations (Adamczyket al., 1998; Greenplate et al., 1998; Stone and Sims, 1993) and thisalso has the potential to impact survival on Bollgard II cottonobserved in the field. In Australia, Liao et al. (2002) found 3 strainsof H. armigera that varied significantly in their susceptibility toCry1Ac and that both H. armigera and H. punctigera are moretolerant of a range of insecticidal proteins than Heliothis virescens.H. armigera field populations tested by Bird and Akhurst (2007) hada 4.6 and a 6.6-fold range in susceptibility to Cry1Ac and Cry2Abrespectively. For H. punctigera the range was 3.2 and 3.5-fold (Birdand Akhurst, 2007). However, tests of H. armigera survivors fromBollgard II cotton found no differences in the frequency of eitherresistance gene between random samples and survivors fromBollgard II cotton (Downes, 2011).
Thirdly, Helicoverpa spp. also have the ability to avoid the Crytoxins in its diet. In a choice situation, H. armigera strongly avoidedmeridic diet that contained Cry1Ac compared to standard diet, andalso preferred feeding on meridic diet to Cry1Ac plant material(Singh et al., 2008). Gore et al. (2005) found that both Helicoverpazea andH. virescens selected diet with low concentrations of Cry1Acover diet with higher concentrations of the toxin, while for Cry2Ab,the avoidance was not as clear. In a study by Singh et al. (2008),H. armigerawas also able to select diet with Cry1Ac concentrationsat sublethal doses, which may mean that larvae have an increasedchance of survival on transgenic cotton plants through suchbehavioural responses.
Behaviour of larvae on Bt cotton has been shown to differ fromlarvae on non-Bt cotton. Lu et al. (2011) showed that in choice testsinvolving leaves, flowers, squares and small bolls, neonates showeda stronger preference for flowers in tests using Bollgard II cottonthan in tests using non-Bt cotton. They also found no differences inpreferences between plant parts between larvae that were theprogeny of survivors from Bollgard II or from non-Bt hosts. Inaddition, Gore et al. (2002) found that larvae move twice as fardown the plant on Bt cotton compared with non-Bt cotton. On Btcotton, fewer larvae remained in the terminals and squares than

K. Knight et al. / Crop Protection 44 (2013) 50e5858
non-Bt cotton and larvae began migrating within 3 h, and by 6 hafter infestation had moved more than 4 nodes below the plantterminal (Gore et al., 2002). Gore et al. (2002) showed that a higherpercentage of larvae were lower in the plant canopy within flowersand bolls in Bt cotton than in non-Bt cotton. Because cotton beginsflowering from the bottom of the plant and younger fruit forms atthe top of plant, as larvae move down the plant they are likely toencounter flowers and as they continue to forage down they arelikely to feed on bolls. The lower expression of Cry protein in whiteflowers may be such that larvae are capable of overcoming theadverse effects of Cry1Ac and Cry2Ab toxicity (Gore et al., 2001).The increased movement of larvae on Bt cotton could providegreater opportunity for encountering white flowers, thusincreasing the chance of surviving Bollgard II cotton. Takentogether, these studies indicate that Helicoverpa species havea diversity of behavioural responses that could contribute to theoccurrence of larger larvae on Bollgard II cotton.
Overall, this study shows that the expression of the Cry proteinsin Bollgard II is relatively uniform within and among cotton fieldsand farms, though the data confirm that there are differences inprotein expression among plant structures and varietiesthroughout the season. Taking this into account, when larvae arefound to be surviving in Bollgard II, factors other than proteinexpression need to be considered, probably acting in concert withprotein expression. Biotic or abiotic factors may have causeda decline or fluctuation in the total soluble proteins and hence theCry proteins in Bollgard II plants. Larval susceptibility as well as thebehaviour of increased movement on Bollgard II could give larvaean opportunity to encounter white flowers that have lowerexpression and high nutritional value. The ability to avoid Cryproteins also gives larvae an increased opportunity to survive anddevelop on Bollgard II. We have shown that generally Bollgard IIprotein production is stable and that other factors need to beconsidered when there are larvae ‘escapes’.
Acknowledgements
Christie Warburton and Riedha Ekalianna provided excellenttechnical assistance. Jamie Street assisted with sampling in StGeorge and the Geddes family took and processed all of the samplesfor the trials in Emerald. Dr. Sharon Downes and her team fromCSIRO Narrabri assisted in sampling in St George. Sincere thanks toall of the growers who allowed us to work on their farms.
Appendix A. Supplementary data
Supplementary data related to this article can be found at http://dx.doi.org/10.1016/j.cropro.2012.10.014.
References
Adamczyk, J., Adams, L.C., Hardee, D.D., 2001. Field efficacy and seasonal expressionprofiles for terminal leaves of single and double Bacillus thuringiensis toxincotton genotypes. J. Econ. Entomol. 94, 1589e1593.
Adamczyk, J.J., Holloway, J.W., Church, G.E., Leonard, B.R., Graves, J.B., 1998. Larvalsurvival and development of the fall armyworm (Lepidoptera: Noctuidae) onnormal and transgenic cotton expressing the Bacillus thuringiensis Cry1A(c) d-endotoxin. J. Econ. Entomol. 91, 539e545.
Andow, D.A., Alstad, D.N., 1998. F2 screen for rare resistance alleles. J. Econ. Entomol.91, 572e578.
Addison, S.J., Rogers, D.J., 2010. Potential impact of differential production of theCry2Ab and Cry1Ac proteins in transgenic cotton in response to cold stress.J. Econ. Entomol. 103, 1206e1215.
Barber, J., 2008. Larval survival in Bollgard II cotton. Aust. Cottongrower 29 (2),10e13.
Bird, L.J., Akhurst, R.J., 2007. Variation in susceptibility of Helicoverpa armigera(Hübner) and Helicoverpa punctigera (Wallengren) (Lepidoptera: Noctuidae) inAustralia to two Bacillus thuringiensis toxins. J. Econ. Entomol. 94, 84e94.
Chen, D., Ye, G., Yang, C., Chen, Y., Wu, Y., 2005. The effect of high temperature onthe insecticidal properties of Bt cotton. Environ. Exp. Bot. 53, 333e342.
Cochran, W.G., Cox, G.M., 1957. Experimental Designs, second ed. Wiley, New York.Dong, H.Z., Li, W.J., 2007. Variability of endotoxin expression in Bt transgenic
cotton. J. Agron. Crop Sci. 193, 21e29.Downes, S., 2011. End of Season Results from CSIRO Bt Resistance Monitoring 2010/
11, Cotton Catchment Communities Report, 6 pp. Internet resource, available at:http://www.cottoncrc.org.au/industry/Publications/Pests_and_Beneficials(accessed 11.10.12.).
Fitt, G., 2003. Deployment and impact of transgenic Bt cotton in Australia. In:Kalaitzandonakes, N. (Ed.), The Economic and Environmental Impacts ofAgbiotech: A Global Perspective. Kluwer Academic/Plenum Publishers, NewYork, pp. 141e161.
Gore, J., Leonard, B.R., Adamczyk, J.J., 2001. Bollworm (Lepidoptera: Noctuidae)survival on ‘Bollgard’ and ‘Bollgard II’ cotton flower bud and flower compo-nents. J. Econ. Entomol. 94, 1445e1451.
Gore, J., Leonard, B.R., Church, G.E., Cook, D.R., 2002. Behavior of bollworm (Lepi-doptera: Noctuidae) larvae on genetically engineered cotton. J. Econ. Entomol.95, 763e769.
Gore, J., Adamczyk, J.J., Blanco, C.A., 2005. Selective feeding of tobacco budwormand bollworm (Lepidoptera: Noctuidae) on meridic diet with differentconcentrations of Bacillus thuringiensis proteins. J. Econ. Entomol. 98, 88e94.
Greenplate, J.T., 1999. Quantification of Bacillus thuringiensis insect control proteinCry1Ac over time in Bollgard cotton fruit and terminals. J. Econ. Entomol. 92,1377e1383.
Greenplate, J.T., Head, G.P., Penn, S.R., Kabuye, V.T., 1998. Factors potentially influ-encing the survival of Helicoverpa zea on Bollgard cotton. In: Proceedings,Beltwide Cotton Conference 1998. National Cotton Council of America, Mem-phis, TN, pp. 1030e1033.
Greenplate, J.T., Mullins, J.W., Penn, S.R., Daham, A., Reich, B.J., Osborn, J.A., Rahn, P.R.,Ruschke, L., Shappley, Z.W., 2003. Partial characterization of cotton plantsexpressing two toxin proteins from Bacillus thuringiensis: relative contribution,toxin interaction, and resistance management. J. Appl. Entomol. 127, 340e347.
Gould, F., Anderson, A., Jones, A., Sumerford, D., Heckel, D.G., Lopez, J., Micinski, S.,Leonard, R., Laster, M., 1997. Initial frequency of alleles for resistance to Bacillusthuringiensis toxins in field populations of Heliothis virescens. Proc. Natl. Acad.Sci. U. S. A. 94, 3519e3523.
Holt, H.E., 1998. Season-long monitoring of transgenic cotton plants e developmentof an assay for the quantification of Bacillus thuringiensis insecticidal crystalprotein. In: Proc. 9th Australian Cotton Conference. Australian Cotton Growers’Research Association, Wee Waa, Australia, pp. 331e335.
Kranthi, K.R., Naidu, S., Dhawad, C.S., Tatwawadi, A., Mate, K., Patil, E., Bharose, A.A.,Behere, G.T., Wadaskar, R.M., Kranthi, S., 2005. Temporal and intra-plant vari-ability of Cry1Ac expression in Bt-cotton and its influence on the survival of thecotton bollworm, Helicoverpa armigera (Hübner) (Noctuidae: Lepidoptera). Curr.Sci. 89, 291e298.
Liao, C., Heckel, D.G., Akhurst, R., 2002. Toxicity of Bacillus thuringiensis insecticidalproteins for Helicoverpa armigera and Helicoverpa punctigera (Lepidoptera:Noctuidae), major pests of cotton. J. Invertebr. Pathol. 80, 55e63.
Lu, B., Downes, S., Wilson, L., Gregg, P., Knight, K., Kauter, G., McCorkell, B., 2011.Preferences of field bollworm larvae for cotton plant structures: impact of Btand history of survival on Bt crops. Entomol. Exp. Appl. 140, 17e27.
Luo, Z., Dong, H., Li, W., Zhao, M., Zhu, Y., 2008. Individual and combined effects ofsalinity and waterlogging on Cry1Ac expression and insecticidal efficacy of Btcotton. Crop Protect. 27, 1485e1490.
Mahon, R.J., Olsen, K.M., Downes, S., Addison, S., 2007. Frequency of allelesconferring resistance to the Bt toxins Cry1Ac and Cry2Ab in Australian pop-ulations of Helicoverpa armigera (Lepidoptera: Noctuidae). J. Econ. Entomol. 100,1844e1853.
Olsen, K.M., Daly, J.C., Holt, H.E., Finnegan, E.J., 2005. Season-long variation inexpression of Cry1Ac gene and efficacy of Bacillus thuringiensis toxin in trans-genic cotton against Helicoverpa armigera (Lepidoptera: Noctuidae). J. Econ.Entomol. 98, 1007e1017.
Payne, R.W., 2010. The Guide to GenStat Release 13. In: Statistics, vol. 2. VSNI, HemelHempstead, UK.
Quinn, G.P., Keough, M.J., 2002. Experimental Design and Data Analysis for Biolo-gists. Cambridge University Press, Cambridge.
Singh, G., Rup, P.J., Koul, O., 2008. Selective feeding of Helicoverpa armigera (Hübner)and Spodoptera litura (Fabricius) on meridic diet with Bacillus thuringiensistoxins. J. Insect Behav. 21, 407e421.
Sims, S.R., Pershing, J.C., Reich, B.J., 1996. Field evaluation of transgenic corn con-taining a Bacillus thuringiensis Berliner insecticidal protein gene against Heli-coverpa zea (Lepidoptera: Noctuidae). J. Entomol. Sci. 31, 340e346.
Stone, T.B., Sims, S.R., 1993. Geographic susceptibility of Heliothis virescens andHelicoverpa zea (Lepidoptera: Noctuidae) to Bacillus thuringiensis. J. Econ.Entomol. 86, 989e994.
Whitburn, G., Downes, S., 2009. Surviving Helicoverpa larvae in Bollgard II: surveyresults. Aust. Cottongrower 30 (3), 12e16.