Embed Size (px)
Citation preview

SEARS 2000 ANNUAL REPORT
Destination: Sears
SEARS 2000 ANNUAL REPORT


Financial Highlights
millions, except per share data 2000 1999 1998
Revenues $40,937 $39,484 $39,953
Income before extraordinary loss 1,343 1,453 1,072
Net income 1,343 1,453 1,048
PER COMMON SHARE
Income before extraordinary loss 3.88 3.81 2.74
Net income 3.88 3.81 2.68
EXCLUDING IMPACT OF
NONCOMPARABLE ITEMS
Income excluding noncomparable items 1,540 1,482 1,300
Per common share 4.45 3.89 3.32
Total assets 36,899 36,954 37,675
Debt 17,860 18,038 19,669
Shareholders’ equity 6,769 6,839 6,066
This annual report, including the chairman’s comments, contains forward-looking statements, which should be read inthe context of the cautionary language found in the financial statements section of this report.

2
Dear Shareholders:
Six years ago, I came to Sears to help revitalize one of America’s
great institutions. At the time, a reinvigorated Sears was winning
back customers and emerging once again as a healthy, financially
sound enterprise. Since then, we’ve had some clear successes and
weathered a few storms. In the process, we’ve learned many valu-
able lessons. Through challenging assignments in our credit and
services businesses and as chief financial officer, I also learned and
witnessed firsthand this company’s resiliency and its tremendous
potential for growth. Now, it’s time for Sears to achieve this poten-
tial, leverage it to become even more relevant to our customers
and, in the process, reward our shareholders.
A SOLID FOUNDATION
I’m honored to succeed Arthur Martinez as chairman and chief
executive officer of this premier retail, credit and service organiza-
tion. Arthur took up the challenge of rebuilding the Sears franchise
and helped restore a solid platform for growth. We thank him
for his many contributions and inspirational leadership. Today’s
Sears boasts some of the strongest brands in any industry;
valuable real estate assets; a wealth of products, formats and
services that resonate with our customers; a hard-earned
reputation for trust; and a dedicated and eager management and
associate team.
I’m also well aware that while we have great strengths, Sears still has
much work ahead to properly position ourselves for future success.
The traditional retail industry is consolidating. New formats and
sales channels are emerging. New alliances are forming. Customer
needs and expectations are increasing. No retail company – and
certainly not Sears – can afford to stand still.
ROOM FOR IMPROVEMENT
Competitive and operational factors both contributed to our com-
pany’s inconsistent 2000 results. We reported full-year net income
of $1.34 billion, or $3.88 per share, compared with $1.45 billion,
or $3.81 per share in 1999. Excluding the effect of noncomparable
items, EPS rose 14 percent, to $4.45 from $3.89 per share in 1999.
Despite the slowing economy and even weaker fourth quarter
sales, 2000 revenue grew by 3.7 percent, from $39.5 billion in 1999
to $40.9 billion. However, operating income excluding noncompa-
rable items was essentially flat.
Given the difficult economic environment of 2000, I’m encouraged
by the positive results a number of our businesses achieved. In retail,
home appliances continued to drive outstanding sales volume and
market share gains, while lawn and garden and the Sears Tire Group
also delivered strong results. In Credit, new accounts, product inno-
vation, productivity gains and substantially improved credit quality,
generated double-digit profit growth and superior return on assets.
In our product repair business, our strategy of focusing on the cus-
tomer, streamlining processes and improving quality, drove strong
growth. And in our online business, revenues quadrupled in the
fourth quarter when many online retailers faltered and our in-store
sales benefited as customers saw the merits of our “bricks and
clicks” strategy. In addition, our exciting new format, The Great
Indoors, established itself as an important growth vehicle.
Despite these successes, we were disappointed in the bottom-line
performance of our retail, services and Canadian businesses.
In retail, our margins were pressured by the intense competitive
environment. Our services decline was concentrated in one of our
home improvement service businesses, which we are addressing.
Sears Canada experienced a softening economic environment much
like the U.S. and difficulties relaunching the Eaton’s format.
Overall, we were pleased with our solid earnings per share growth.
It was aided by an active share repurchase program. We believe

SEARS 2000 ANNUAL REPORT 3
our company is undervalued and that repurchasing shares at these
levels is a very appropriate use of our strong cash flow.
A NEW DESTINATION
New leadership means new vision, fresh priorities and a clear oppor-
tunity to build on what works and fix what doesn’t. That’s why this
year’s annual report is more about looking forward than looking
back. We know what our destination is: We’re striving to become a
destination of choice at every stage of our customers’ lives.
In the past, Sears could operate successfully as a collection of strong
merchandise categories. But our competitive environment is chang-
ing, and we must change with it. We must leverage the strengths of
this franchise and market Sears as a customer-relevant and more
integrated whole.
We must clear up the confusion this category-driven model has
created with our customers. Some consider Sears their hardware
experts. Others swear by our competitively priced, high-quality
children’s clothes. Still, others value the Kenmore appliance brand
or rely on our service capabilities. We’re all this, but the fact is, we’re
also much more. Our blend of hardlines and softlines merchandise,
services and credit is truly differentiating, and it gives us opportuni-
ties to connect with our customers on many levels and at every
stage in their increasingly busy lives. This is a tremendous opportu-
nity for us, but achieving our full potential won’t happen overnight.
A FOCUS ON PERFORMANCE
As we move forward, our first priority is to ensure that our core busi-
ness – Sears Full-line Stores – works effectively for both our cus-
tomers and shareholders. Currently, it is not meeting this objective.
As a result, we are re-evaluating the customer relevance and effec-
tiveness of our operations, marketing and merchandise assortment.
We will continue to invest in merchandise that resonates with our
customers, including both established brands like Craftsman and
Kenmore and emerging brands like Apostrophe and Fieldmaster.
We’ll also eliminate merchandise and activities that don’t measure
up. Our customers will see more focused assortments and deeper
inventories of the products they want, supported by better market-
ing and more efficient operations.
On a parallel course, we’ll attack areas of customer dissatisfaction.
We’ll continue to improve in-store customer service. New store
layouts will make our stores more shoppable and support multi-
department shopping. Sears associates will help tie merchandise
purchases with value-enhancing credit and service offerings. And
direct-to-customer initiatives such as sears.com and new relation-
ship marketing programs will make our business more accessible to
our customers at their convenience.
NEW PRIORITIES
For our organization to achieve greater success, we must adopt new
ways of thinking and establish higher performance benchmarks. For
2001, we will focus on the following four corporate-wide priorities:
Drive profitable growth. We will manage our resources prudently
and invest in businesses that deliver the greatest returns.
Our first priority is to grow our Full-line Stores, but new initiatives
such as The Great Indoors, the new Sears Gold MasterCard
and our direct-to-customer business, offer exciting growth oppor-
tunities as well.
Become truly customer centric. Guided by our knowledge of our
customer, we will align our products, formats and service structure to
meet the preferences and shopping habits of our customers. We will
also adopt a company-wide Six Sigma quality program to systemat-
ically ensure we are listening to our customers and managing our
business accordingly.
■
■

4
Become a diverse, high-performance team. We will set higher per-
formance expectations throughout the organization and expect all of
our associates to work together more effectively. We will also ensure
that our associates reflect our increasingly diverse customer base.
Improve productivity and returns. We will aggressively pursue
improvements in productivity and returns by setting and meeting
clear performance benchmarks. When appropriate, we will also use
excess cash flow to repurchase shares of our stock.
The pages that follow explain these ideas and demonstrate
how they will propel Sears toward its destination – and make
Sears a destination of choice for shoppers of all ages and
ethnic backgrounds.
As we move forward, we will miss the counsel and wisdom of three
members of our Board of Directors. Pete Correll, Dick Notebaert
and Pat Ryan are all accomplished business leaders who brought
diverse backgrounds and valued perspectives to our organization.
THE ROAD AHEAD
There’s a sense of excitement at Sears as we begin our new journey.
As I visit with Sears associates, I find a group of dedicated people
who are eager to embrace change. I thank them for their commit-
ment and enthusiasm for the future success of their company.
Importantly, they are also very committed to doing what is right for
our customers. Going forward, we will ask Sears associates to play
an even greater role in our collective success. Each of us can and
will do more to help Sears operate more efficiently and productively.
And each of us can help customers and communities see and
appreciate the value Sears can bring to their daily lives.
We expect the slowing economy to present some difficult chal-
lenges for Sears and our industry, especially in the first half of 2001.
But fiscal 2000 demonstrated that our multi-faceted organization
can generate solid results from many areas of our business, even
during tough times. As we transition toward our new destination, we
will see abundant opportunities to grow. With today’s economic
uncertainties and competitive realities, profitable growth will go to
retailers with strong franchises and efficient business models. For
these very reasons, we will focus on strengthening our existing busi-
nesses while leveraging our strengths to create new ways for Sears
to better serve our valued customers.
Alan J. Lacy
Chairman and Chief Executive Officer
February 22, 2001
■
■

SEARS 2000 ANNUAL REPORT 5
ALAN J. LACY

6

SEARS 2000 ANNUAL REPORT 7
Sears is a company on the move. Our destina-
tion is clear. We’re pursuing ways to generate
profitable growth. We’re striving to become
more relevant to our customers. We’re learning
to celebrate our diversity, work together and
perform with urgency. And we’re establishing
new benchmarks for productivity and continu-
ous improvement. By turning individual success
stories into models we can replicate across the
organization, we can become the destination of
choice for customers, employees and investors.
8
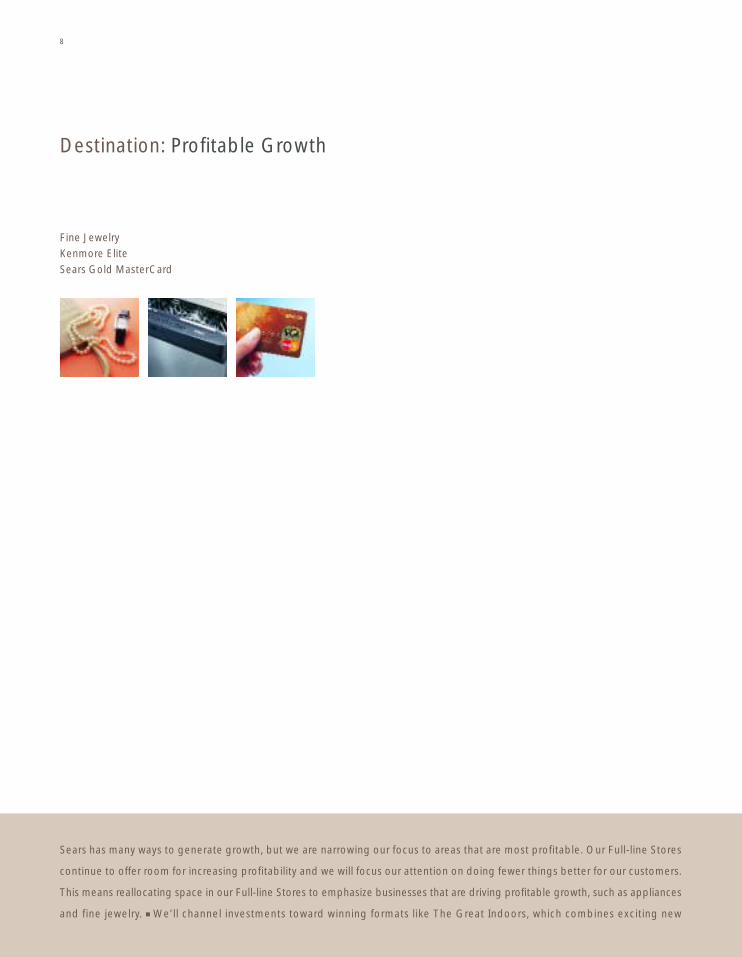
Destination: Profitable Growth
Fine JewelryKenmore Elite Sears Gold MasterCard
Sears has many ways to generate growth, but we are narrowing our focus to areas that are most profitable. Our Full-line Stores
continue to offer room for increasing profitability and we will focus our attention on doing fewer things better for our customers.
This means reallocating space in our Full-line Stores to emphasize businesses that are driving profitable growth, such as appliances
and fine jewelry. ■ We’ll channel investments toward winning formats like The Great Indoors, which combines exciting new

SEARS 2000 ANNUAL REPORT 9
home-related products and services with a creative in-store design staff. ■ We’ll drive top- and bottom-line growth with the
new Sears Gold MasterCard. ■ We’ll capture greater value from our customer relationships, emphasizing our unique blend of
innovative products, convenient credit, reliable delivery, installation and in-home services.

To become the destination of choice for today’s shopper, Sears must fully understand what our customers want – and how they
define value. ■ The power of customer input is at the core of our Tool Territory design, where trained “master tool” professionals
offer practical lessons and take-home instructions. ■ We’ve redefined the Sears Tire Group around customer needs causing a
resurgence in that business. ■ We’re building lifetime customer relationships by focusing on every stage of our customers’ lives
10
Destination: Relevance
Sears Tire GroupTKS Basics/KidVantagesears.com

through such popular programs as KidVantage and Craftsman Club, and building loyalty through recognizing our best customers
with our Premier Card program. ■ We’re giving customers greater flexibility to shop at home by developing specialty catalogs such
as the Wish Book and Baby Me. And for online shoppers, we’ll continue to upgrade sears.com to provide convenient access to the
merchandise and information they value.
SEARS 2000 ANNUAL REPORT 11

12
Destination: Performance
Customer Care NetworkVolunteerismService Training
To enhance our competitive position, we’re building a high-performance culture that fully leverages individual strengths for the
benefit of our customers and shareholders. This requires more than just breaking down silos and uniting people around shared goals;
it also means promoting teamwork and improving speed and execution. ■ Members of the Sears Diversity Council work together to
translate diverse perspectives into innovative ideas. The Council and other associate networks also help Sears better understand the

SEARS 2000 ANNUAL REPORT 13
diverse needs of customers and associates. ■ Sears associates, retirees and vendors are learning the value of community outreach
by contributing more than 350,000 hours per year to key local volunteer efforts. ■ To raise the bar on performance, service techni-
cians spend hours honing their skills so they can fix appliances of every make and model. ■ We're now managing Sears call centers
as a unified Customer Care Network to provide customers with a single point of contact for fulfillment and world-class service.

14
Destination: Productivity
Home ServicesVendor RelationsDirect Sourcing
Productive organizations are never satisfied; they’re always refining their processes and improving their cost structures. Sears is
cultivating this mindset by adopting new productivity tools and managing assets more aggressively. ■ To improve margins and make
our repair services more efficient, we adopted new Six Sigma processes and metrics in our Product Repair Services business.
In 2001, we'll expand those learnings to target similar opportunities within other businesses. ■ We closed Sears stores that fell short

SEARS 2000 ANNUAL REPORT 15
of performance targets to give our most productive stores and formats added room to grow. ■ New working relationships with our
vendors will reduce costs and improve quality metrics on merchandise. ■ We’re continuing to improve our private apparel business
through direct sourcing, resulting in lower costs and greater quality.

Management’s Discussion and Analysis 17
Consolidated Financial Statements 27
Notes to Consolidated Financial Statements 31
Management & Independent Auditors’ Reports 45
Five-Year Summary of Consolidated Financial Data 46
Quarterly Results & Common Stock Information 47
Executive Officers 48
Board of Directors 49
Company Information 50
16

Sears, Roebuck and Co. and its consolidated subsidiaries (“the
Company”) is a multi-line retailer providing a wide array of merchan-
dise and services in the United States, Puerto Rico and Canada. As of
December 30, 2000, operating results for the Company were reported
for four domestic segments and one international segment. The
domestic segments include the Company’s operations in the United
States and Puerto Rico.
The Company’s segments are defined as follows:
Retail – consisting of:
Full-line Stores – 863 Full-line Stores, averaging 88,000 selling square
feet, located primarily in the best malls in the nation and offering:■ Softlines – A complete selection of fashionable, quality apparel
and accessories for the whole family, plus cosmetics, fine jewelry
and home fashions, at value prices; includes leading national
brands as well as exclusive Sears brands such as Canyon River
Blues, Fieldmaster, Crossroads, Apostrophe, TKS Basics and
Circle of Beauty.■ Hardlines – A full assortment of appliances, electronics and
home improvement products including fitness and lawn and gar-
den equipment; includes major national brands as well as exclu-
sive Sears brands such as Kenmore, Craftsman, WeatherBeater
and DieHard.
Specialty Stores – More than 2,100 Specialty Stores, located primarily
in free-standing, off-the-mall locations or high-traffic neighborhood
shopping centers.■ Hardware Stores – 274 neighborhood Hardware Stores under
the Sears Hardware and Orchard Supply Hardware names, aver-
aging 20,000 to 40,000 selling square feet, that carry Craftsman
tools, a wide assortment of national brands and other home
improvement products.■ Dealer Stores – 790 independently-owned stores, primarily
located in smaller communities and averaging 5,000 selling
square feet, that offer appliances, electronics, lawn and garden
merchandise, hardware and automobile batteries and carry
exclusive Sears brands such as Craftsman, Kenmore and DieHard.■ Commercial Sales – Showrooms dedicated to appliance and
home improvement products for commercial customers.■ The Great Indoors – Four stores for home decorating and
remodeling, averaging 100,000 selling square feet, dedicated to
the four main rooms of the house: kitchen, bedroom, bathroom
and great room.■ Automotive Stores – 822 Sears Auto Centers and 229 NTB
National Tire & Battery stores that offer tires, DieHard and other
brands of batteries and related services. Automotive Stores also
included the Parts Group, which sold automotive parts through
Parts America and Western Auto stores until November 2, 1998,
when the Company sold the Parts Group.
■ Outlet Stores – 34 stores averaging 30,000 selling square feet that
offer appliances, electronics and lawn and garden merchandise.■ Homelife Furniture Stores – included in 1998 and 1999 until
January 30, 1999, when the Company sold Homelife.
Services – consisting of:
Home Services – A broad range of services including service con-
tracts, product installation and repair services primarily for products
sold in the Company’s retail outlets, major home improvements and
other home services such as pest control and carpet cleaning.
Direct Response – Direct marketing of goods and services such as
insurance (credit protection, life and health), clubs and services mem-
berships, merchandise through specialty catalogs and impulse and
continuity merchandise.
Credit – Manages the Company’s portfolio of credit card receivables
arising primarily from purchases of merchandise and services from the
Company’s domestic operations. The domestic credit card receivables
portfolio consists primarily of Sears Card, SearsCharge Plus and Sears
Gold MasterCard account balances.
Corporate – Includes activities that are of an overall holding company
nature, primarily consisting of administrative activities, and the Sears
Online investment initiatives related to selling merchandise via
Company web sites, the costs of which are not allocated to the
Company’s businesses.
International – International operations are conducted in Canada
through Sears Canada Inc. (“Sears Canada”), a 54.5% owned sub-
sidiary. Sears Canada offers a diverse array of shopping options, with
125 Full-line Stores and 176 Specialty Stores, a general merchandise
catalog, credit services and a broad range of home-related services.
Throughout management’s analysis of consolidated operations and
financial condition, certain prior year information has been reclassi-
fied to conform to the current year presentation and all references to
earnings per share relate to diluted earnings per common share.
In 2000, in response to the Securities and Exchange Commission’s
Staff Accounting Bulletin No. 101, the Company changed its method
of recording licensed business revenue to include only net commis-
sion income from licensees. The Company’s licensees include third-
party concessions primarily operated in domestic and Canadian
Full-line Stores, as well as licensees of home improvement products,
which are included in the Services segment. Changing the method of
recording licensed business revenues reduced reported revenues by
$1.52, $1.59 and $1.62 billion in 2000, 1999 and 1998, respectively, and
had no effect on net income or earnings per share.
SEARS 2000 ANNUAL REPORT 17
Management’s Discussion and Analysis

RESULTS OF OPERATIONSNet Income Earnings per Share
millions, except per share 2000 1999 1998 2000 1999 1998
Excluding noncomparable items $1,540 $1,482 $1,300 $ 4.45 $ 3.89 $ 3.32
Store closings/staff reductions (99) (29) — (0.29) (0.08) —
Sears Termite and Pest Control impairment (98) — — (0.28) — —
Sales of Western Auto and Homelife — — (264) — — (0.67)
Loss on debt extinguishment — — (24) — — (0.06)
SFAS No. 125 accounting — — 36 — — 0.09
As reported $1,343 $1,453 $1,048 $ 3.88 $ 3.81 $ 2.68
On October 2, 1998, the Company prepaid debt with a face
value of $300 million, which was due in May 2000. The transaction
generated an extraordinary loss of $37 million ($24 million after-tax).
The loss resulted primarily from the write-off of the related unamor-
tized discount.
The implementation of Statement of Financial Accounting
Standards (“SFAS”) No. 125 in 1997 resulted in incremental operating
income of $58 million in 1998 ($36 million after-tax) from receivable
securitizations. SFAS 125 income arising after 1998 is not included in
noncomparable items.
Analysis of Consolidated Results Excluding Noncomparable Items
Excluding noncomparable items, earnings per share were $4.45 in
2000, $3.89 in 1999 and $3.32 in 1998. Net income in 2000, excluding
noncomparable items, was $1.54 billion compared with $1.48 billion in
1999 and $1.30 billion in 1998.
Excluding noncomparable items, 2000 earnings per share
increased 14.4% over 1999 while net income increased by 3.9%. The
increases reflect higher operating income in the Credit segment and
a lower effective tax rate and, with respect to earnings per share, a
reduction of shares outstanding. These improvements were partially
offset by declines in International, Retail and Services segment results,
as well as higher Corporate expenses primarily related to investments
in Sears Online.
In 1999, earnings per share and net income excluding noncom-
parable items increased by 17.2% and 14.0%, respectively, over compa-
rable1998 results. The improvements resulted from better performance
in the Retail, Credit and International segments and a reduction of
shares outstanding, partially offset by a decline in Services results and
higher Corporate expenses including investments in Sears Online.
18
Management’s Discussion and Analysis
Earnings per share for 2000 were $3.88 compared with $3.81 in 1999
and $2.68 in 1998. Net income was $1.34 billion in 2000, $1.45 billion
in 1999 and $1.05 billion in 1998. Results of operations for 2000, 1999
and 1998 were affected by noncomparable items. The effects of
noncomparable items on net income and earnings per share are
summarized in the above table.
Description of Noncomparable Items
In December 2000, the Company announced the planned closure of
89 under-performing stores consisting of 53 NTB, 30 Hardware and
four Full-line Stores (two include Sears Auto Centers) resulting in a
$150 million pretax charge ($99 million after-tax).
In December 2000, the Company also recorded an impairment
charge of $115 million pretax ($98 million after-tax) for Sears Termite
and Pest Control based on ongoing and anticipated future losses and
management’s decision to evaluate strategic options for this business.
In the third quarter of 1999, the Company implemented certain
cost reduction strategies resulting in a $46 million pretax charge ($29 mil-
lion after-tax). Of the $46 million charge, $25 million related to the clos-
ing of 33 automotive stores and $21 million related to severance costs
for headquarters staff reductions of approximately 450 employees.
On November 18, 1998, the Company entered into an agreement
to sell its Homelife furniture business for $100 million in cash, a $10 mil-
lion note receivable and a 19% ownership interest in the new Homelife
business. The Company recorded a loss of $33 million ($21 million
after-tax) in the fourth quarter of 1998 related to this transaction. The
sale was completed on January 30, 1999.
On November 2, 1998, the Company completed an Agreement
and Plan of Merger of Western Auto, a wholly owned subsidiary, with
Advance Auto Parts whereby Sears exchanged its interest in Western
Auto for $175 million in cash and approximately 40% equity ownership
interest in the resulting combined company. Based upon the terms
of the sale, the Company recorded a pretax loss of $319 million
($243 million after-tax) in 1998.

SEARS 2000 ANNUAL REPORT 19
Management’s Discussion and Analysis
Operating Income by Reportable SegmentAs Reported Excluding Noncomparable Items
millions 2000 1999 1998 2000 1999 1998
Retail $ 689 $ 841 $ 382 $ 839 $ 866 $ 734
Services 208 329 375 323 329 375
Credit 1,522 1,347 1,144 1,522 1,347 1,086
Corporate (354) (322) (211) (354) (301) (211)
Domestic operating income 2,065 2,195 1,690 2,330 2,241 1,984
International 122 218 165 122 218 165
Total operating income $2,187 $2,413 $1,855 $2,452 $2,459 $2,149
To provide a more meaningful comparison between years, the follow-
ing discussion of Segment performance generally excludes the effects
of previously described noncomparable items. Segment operating
income as reported and excluding noncomparable items is summa-
rized in the above table.
Retail
Retail store revenues, operating income excluding noncomparable
items, and related information are as follows:
millions, except number of stores and Retail store revenues per selling square foot 2000 1999 1998
Full-line Stores revenues $23,444 $22,797 $22,238
Specialty Stores revenues 6,299 5,909 7,221
Total Retail revenues $29,743 $28,706 $29,459
Operating income excluding
noncomparable items $ 839 $ 866 $ 734
Number of Full-line Stores(1) 863 858 845
Number of Specialty Stores(1) 2,158 2,153 2,198
Total Retail stores 3,021 3,011 3,043
Retail store revenues
per selling square foot(2) $ 333 $ 327 $ 319
Comparable store sales
percentage increase(2) 2.3% 1.7% 1.1%
(1)In December 2000, the Company announced the planned closure of 89 stores. As ofyear-end 2000, 53 NTB stores and two Hardware Stores had been closed and areexcluded from the year-end store count. The remaining 34 stores will be closed in 2001and are included in the year-end store count.
(2)Includes net commissions earned from licensed businesses operating within theRetail stores.
2000 Compared with 1999
In 2000, total retail revenues increased 3.6% to $29.74 billion and
comparable store sales increased by 2.3%. Excluding the sold
Homelife business, total retail revenues increased 3.8% in 2000.
Full-line Stores revenues increased 2.8% to $23.44 billion in 2000,
benefiting from comparable store sales growth as well as the net
addition of five Full-line Stores as 11 stores were opened and six were
closed. The Full-line Stores comparable store sales increase was led
by solid revenue performance in hardlines merchandise. Hardlines
revenue increases in home appliances, home electronics and home
improvement were partially offset by a decline in home office mer-
chandise sales. In Softlines, sales increases in footwear, fine jewelry,
home fashions and cosmetics and fragrances were offset by declines
in children’s and men’s apparel and floor coverings, while sales of
women’s apparel were essentially flat with 1999.
Specialty Store revenues increased 6.6% to $6.30 billion in 2000.
Excluding the sold Homelife business, Specialty Store revenues
increased 7.5% in 2000. The increases reflect comparable store sales
growth as well as new store openings. Dealer Stores revenue
increases in 2000 resulted from the net addition of 52 Dealer Stores
and strong comparable store sales increases. Automotive also
achieved strong revenue growth as Sears Auto Centers benefited
from strong comparable store sales growth and the net addition of six
new stores and 18 NTB and Tire America stores which were converted
to Sears Auto Centers. The Sears Auto Centers’ revenue increase was
partially offset by declines in NTB due to store closures and a decline
in comparable store sales. The Company closed 53 NTB stores in
December 2000 and operated 229 NTB stores as of year-end 2000.
The Great Indoors benefited from strong revenue growth due to the
addition of two new stores as well as double digit comparable store
sales increases. Hardware Stores revenue gains were due primarily
to the addition of seven net new Hardware Stores while comparable
store sales increased slightly. In the fourth quarter, the Company
announced the planned closure of 30 Hardware Stores.
Retail gross margin as a percentage of Retail revenues declined
50 basis points in 2000 compared with 1999. The decrease in the gross
margin rate partially reflects a lower LIFO credit. In 2000, the LIFO
credit was $29 million whereas the LIFO credit was $73 million in 1999.
Excluding the LIFO credit, the gross margin rate declined 30 basis
points primarily reflecting increased markdown activity in 2000.

Retail selling and administrative expense as a percentage of
Retail revenues improved 10 basis points in 2000 from 1999 primarily
driven by lower marketing expenses and the Company’s ongoing
focus on expense productivity. Selling and administrative expense
leverage was unfavorably affected in 2000 by lower than expected
December sales.
Retail depreciation and amortization expense decreased 1.4% in
2000 from 1999. The slight decrease in 2000 reflects less capital spend-
ing in the Full-line Stores in 2000.
Retail operating income excluding noncomparable items
was $839 million in 2000, $27 million lower than 1999 as lower gross
margin rates more than offset higher sales volumes and favorable
expense leverage.
1999 Compared with 1998
Retail revenues decreased 2.6% in 1999 to $28.71 billion from $29.46
billion in 1998. Excluding the exited Western Auto and Homelife
businesses, retail revenues increased 3.0% in 1999.
Full-line Stores revenues increased 2.5% in 1999, benefiting from
the net addition of 13 Full-line Stores as 19 stores were opened and six
were closed. The Full-line Stores increase was led by solid revenue per-
formance in hardlines merchandise as comparable store sales increased
in 1999. Hardlines revenue increases in home appliances, electronics
and home improvement were partially offset by a decline in home
office merchandise sales. Softlines revenue increases in home fashions,
fine jewelry, cosmetics and fragrances and children’s apparel were
mostly offset by results in women’s and men’s apparel and footwear.
Specialty Store revenues decreased to $5.91 billion in 1999 from
$7.22 billion in 1998 due primarily to the sale of Western Auto and
Homelife. Excluding the exited businesses, specialty retail revenues
increased 4.8% in 1999. The strong revenue performance in Hardware
and Dealer Stores was partially offset by a decline in Automotive
Stores revenues. The revenue increases in Hardware and Dealer
Stores in 1999 resulted from new store openings and strong compa-
rable store sales increases. During 1999, the Company added two net
new Hardware Stores and 85 net new Dealer Stores. The Commercial
Sales business and The Great Indoors also produced revenue gains
as the Company continued to expand these businesses. The
Automotive Stores 1999 revenues were below management’s expec-
tations and declined from 1998 levels. Comparable store sales for
Automotive Stores decreased and the Company closed 33 NTB stores
in the third quarter of 1999.
Retail gross margin as a percentage of Retail revenues improved
slightly in 1999 compared with 1998. The LIFO credit was $73 million
in 1999 compared with $34 million in 1998. Excluding the LIFO credit,
the 1999 gross margin rate was essentially flat compared to 1998.
Retail selling and administrative expense as a percentage of
Retail revenues improved 40 basis points in 1999 from 1998. The
improvement was primarily driven by lower marketing expenses and
improvements related to the exit of the Western Auto and Homelife
businesses which had higher cost structures.
Retail depreciation and amortization expense decreased 1.8% in
1999 compared with 1998. The slight decrease in 1999 reflects the
absence of depreciation and amortization from the exited businesses
of Homelife and Western Auto.
Retail operating income excluding noncomparable items was $866
million in 1999, $132 million higher than 1998, primarily reflecting selling
and administrative expense productivity and a favorable LIFO credit.
Services
Services revenues and operating income excluding noncomparable
items are as follows:
millions 2000 1999 1998
Services revenues $2,798 $2,799 $2,695
Operating income excluding
noncomparable items $ 323 $ 329 $ 375
2000 Compared with 1999
Services revenues, which are generated by the Home Services and
Direct Response businesses, were flat in 2000 compared with 1999.
Home Services revenues were down 0.2% as increases in home
improvement services were offset by a decline in repair services.
Within home improvement services, significantly lower revenues from
Sears Termite and Pest Control were more than offset by strong
increases in other businesses. The slight decline in Home Services
revenues was mostly offset by a 0.8% increase in Direct Response
revenues in 2000. Direct Response revenues increased from 1999
with higher insurance revenues being partially offset by lower clubs
and services revenues, while merchandise revenues were relatively flat
with 1999.
In 2000, Services gross margin as a percentage of Services
revenues was 10 basis points lower than 1999. Home Services gross
margin rate improved by 80 basis points primarily due to higher
margins on repair services somewhat offset by unfavorable perfor-
mance by Sears Termite and Pest Control. Direct Response’s gross
margin rate was 70 basis points lower than 1999 mostly because of
inventory losses.
Services selling and administrative expense as a percentage of
Services revenues was unchanged from 1999. In Home Services, sell-
ing and administrative expense productivity improved in the home
improvement businesses and was essentially flat in repair services.
Direct Response selling and administrative expenses as a percent of
revenues increased by 710 basis points due to higher marketing costs
primarily for insurance products and certain clubs and services.
Services depreciation and amortization expense increased by
7.0% in 2000 primarily due to fixed asset additions in the Home
Services business.
20
Management’s Discussion and Analysis
Services operating income in 2000 excluding noncomparable
items was $323 million, a $6 million decline versus 1999. Home Services
operating income improved due to strong performance in repair
services offset by declines in home improvement services mainly
because of operating losses at Sears Termite and Pest Control. Direct
Response operating income declined.
1999 Compared with 1998
Services revenues improved 3.9% in 1999 over 1998. Home Services
revenues were up 4.2% primarily due to the acquisition of a home
improvement business in early 1999. Direct Response revenues
increased 1.9% in 1999 from 1998 as the clubs and services business
improved while insurance and other merchandise revenues were
relatively flat.
Services gross margin as a percentage of Services revenues
decreased by 230 basis points in 1999 from 1998. The gross margin rate
was relatively flat in the Direct Response business and declined by 250
basis points in Home Services largely due to lower home improve-
ment margins and an unfavorable revenue mix. In addition, the exit of
a Home Services licensed business relationship adversely affected the
1999 Services gross margin rate by approximately 70 basis points.
Services selling and administrative expense as a percentage of
Services revenues improved by 50 basis points in 1999 from 1998.
Home Services drove the year-over-year improvement largely due to
improved sales leverage. Direct Response selling and administrative
costs increased primarily due to higher payroll and marketing costs.
Services depreciation and amortization expense increased 16.3%
in 1999 compared with 1998. These increases reflect both infrastruc-
ture investments and acquisitions.
Services operating income excluding noncomparable items was
$329 million in 1999, a decrease of $46 million from 1998. The decrease
reflects lower operating income for both Home Services and Direct
Response. The majority of the decrease came from the home
improvement division of the Home Services business. Direct Response
continued to provide a significant portion of the operating income for
the Services segment in 1999.
Credit
Domestic Credit revenues and operating income excluding noncom-
parable items are as follows:
millions 2000 1999 1998
Credit revenues $4,114 $4,085 $4,369
Operating income excluding
noncomparable items $1,522 $1,347 $1,086
Credit operating income excluding noncomparable items
increased by $175 million in 2000 primarily reflecting lower operating
expenses, favorable charge-off experience and higher income from
securitizations. The domestic provision for uncollectible accounts was
flat from 1999 to 2000, as lower charge-offs in 2000 were largely offset
by $217 million of reductions to the allowance for uncollectible accounts
during 1999.
Operating income excluding noncomparable items was
$1.35 billion in 1999, an increase of $261 million over the 1998 level.
Although credit revenue decreased during 1999, operating income
favorability resulted from a lower provision for uncollectible accounts
as the quality of the portfolio improved due to improved risk man-
agement techniques and investments made in the collection process.
The lower provision expense was driven by lower charge-offs, as well
as the reduction in the allowance for uncollectible accounts. Increases
in SG&A were more than offset by lower interest expense.
In 2000, Credit revenues increased 0.7% to $4.11 billion. The
increase in Credit revenues was primarily due to higher securitization
income. Lower levels of average owned credit card receivables and
lower average retained interest assets in 2000 more than offset a
10 basis point improvement in managed portfolio yields. In1999, Credit
revenues decreased 6.5% to $4.09 billion. The decrease in Credit rev-
enues was attributable to a lower level of average owned credit card
receivables and lower retained interest assets.
A summary of Credit information for the domestic managed
portfolio is as follows:
2000 1999 1998
Sears credit cards as a % of sales(1) 47.4% 48.5% 52.3%
Average account balance
as of year-end (dollars) $ 1,113 $ 1,121 $ 1,076
Average managed credit card
receivables (millions) $25,830 $26,595 $27,922
Ending managed credit card
receivables (millions) $27,001 $26,785 $28,357
(1)1999 and 1998 Sears credit cards shares have been restated to conform with the currentyear calculation which excludes Homelife sales and now includes The Great Indoorssales and Sears Online sales.
The percentage of merchandise sales and services transacted
with Sears credit cards in 2000 declined to 47.4% from 48.5% in 1999,
due to a greater preference for other payment methods, including
cash, check and third-party credit cards. The payment rate during
2000 was also higher than in the comparable prior year periods, con-
tributing to the decrease in average managed receivables. The launch
of the new Sears Gold MasterCard product in 2000, offered at pro-
motional introductory rates, partially offset the declining trend in
average balances.
Credit selling and administrative expense declined 17.0% in
2000 from 1999 levels. Reductions in marketing, legal and collection
expenses contributed to the year-over-year improvement in selling
and administrative expense in 2000. Credit selling and administrative
expense increased 9.0% in 1999 from the 1998 amount. This increase
was primarily attributable to increased investment in credit collection
SEARS 2000 ANNUAL REPORT 21
Management’s Discussion and Analysis
efforts, enhanced risk management systems, the new credit system
(“TSYS”) conversion costs and the launch of the Sears Premier Program.
The domestic allowance for uncollectible owned accounts and
related information is as follows:
millions 2000 1999 1998
Balance, beginning of year $ 725 $ 942 $ 1,077
Provision for uncollectible
owned accounts 836 837 1,261
Net charge-offs (801) (1,054) (1,290)
Transfer to Securitization
Master Trust (111) — (106)
Balance, end of year $ 649 $ 725 $ 942
Allowance as percent of ending
owned credit card receivables 4.03% 4.26% 5.44%
Net credit charge-offs to average
managed credit card receivables(1) 5.12% 6.44% 7.35%
Delinquency rates at year-end –
TSYS(2) 7.56% 7.58% 9.28%
Delinquency rates at year-end –
Proprietary System(2) — — 6.82%
(1)In 1998, the net credit charge-off rate included the effect of the conversion of 12% ofthe accounts to TSYS in the fourth quarter of 1998. The effect on the charge-off rate wasnot material. In 1999, 38% of the accounts were converted in March and 50% in April.Balances are generally charged off earlier under the TSYS system than under the previ-ously used proprietary system. The net charge-off rate is affected by seasonality, peri-odic sales of uncollectible accounts to third parties, bankruptcy trends and othergeneral economic trends. The following table sets forth the quarterly net credit charge-off rates for the managed portfolio for 2000, 1999 and 1998.
Q1 Q2 Q3 Q4 Rate
1998 8.12% 7.37% 7.20% 6.74% 7.35%
1999 7.08% 7.11% 6.39% 5.20% 6.44%
2000 5.69% 5.09% 4.97% 4.79% 5.12%
(2)The delinquency rate in 1998 was calculated based on the Company’s proprietary creditsystem, under which an account was generally considered delinquent when its cumula-tive past due balance was three or more times the scheduled minimum monthly pay-ment. The 1998 proprietary system delinquency rate is for the 88% of the managedaccounts that had not been converted to TSYS. For the TSYS accounts, which repre-sented 12% of the managed accounts at year-end 1998, the delinquency rate was 9.28%.For TSYS accounts, the aging methodology is based on the number of completedbilling cycles during which a customer has failed to make a required payment. UnderTSYS, accounts are considered delinquent when a customer has failed to make a payment in each of the last three or more billing cycles. The 2000 and 1999 year-enddelinquency rates are based on the TSYS methodology.
In 2000, the domestic provision for uncollectible accounts was
roughly flat with 1999. Charge-offs declined by $253 million driven
by the continued improvement in the quality of the credit portfolio.
As shown in the preceding tables, the rate of improvement in credit
quality moderated during the year and was not as pronounced as the
improvement that occurred during 1999 and 1998. This was reflected
in the year-end allowance for uncollectible accounts which was 4.03%
of owned receivable balances or 23 basis points lower than 1999. In
1999, the year-end allowance as a percent of on-book balances was
118 basis points lower than 1998. Also in 2000, the allowance was
reduced by $111 million due to the transfer of $2.4 billion of receiv-
ables to the securitization Master Trust.
In 1999, the domestic provision for uncollectible accounts
decreased $424 million to $837 million. The decrease was attributable
to lower average owned credit card receivable balances and
improvement in portfolio quality during the year. Delinquency rates
on a TSYS basis declined to 7.58% at the end of 1999 from 9.28% at
year-end 1998. In addition, the net charge-off rate for 1999 decreased
to 6.44% from 7.35% in 1998. The allowance for uncollectible accounts
at year-end 1999 was $725 million, or 4.26% of on-book receivables vs.
5.44% at the prior year-end.
Interest expense from the domestic segments is included in the
Credit segment discussion because the majority of the Company’s
domestic interest expense is allocated to the Credit segment.
Generally, the domestic interest expense that is not allocated to the
Credit segment is allocated to the Retail segment and is not signifi-
cant relative to cost of sales, buying and occupancy, selling and
administrative and depreciation and amortization expenses in the
Retail segment.
Domestic interest expense is combined with the funding cost on
receivables sold through securitizations to represent total funding
costs. The Company uses credit card receivable securitizations as a
significant funding source and therefore, for purposes of this analysis,
the interest paid on securitizations is considered a funding cost. Total
domestic funding costs are as follows:
millions 2000 1999 1998
Domestic segments
interest expense(1) $1,135 $1,168 $1,318
Domestic funding cost of
securitized receivables 440 419 433
Total domestic funding costs $1,575 $1,587 $1,751
(1)Credit segment interest expense was $1,101, $1,116 and $1,244 for 2000, 1999 and1998, respectively.
22
Management’s Discussion and Analysis
Annual

Total domestic funding costs decreased 0.8% in 2000 to $1.58 bil-
lion. The slight decrease in funding costs resulted from a lower level
of average managed credit card receivable balances mostly offset
by a higher funding rate environment. Total domestic funding costs
decreased 9.4% in 1999 to $1.59 billion. The decrease in funding costs
reflected the lower level of average managed credit card receivable
balances and a lower funding rate environment.
Corporate
Corporate expenses of $354 million in 2000 increased by $32 million
over 1999. The increase primarily reflected higher investments in on-
line initiatives and one-time expenses related to senior management
changes. These increases were partially offset by $21 million of 1999
special charges, decreased spending in 2000 on information
systems and lower spending in 2000 across other corporate areas.
Corporate expenses increased $111 million in 1999 compared to
1998. The increase was primarily attributable to investment spending
for Sears Online and $21 million of restructuring charges related to
staff reductions in the third quarter of 1999. In addition, increased
spending on information systems and higher performance-based
incentive costs drove Corporate expenses higher in 1999.
International
International revenues and operating income are as follows:
millions 2000 1999 1998
Merchandise sales and services $4,007 $3,636 $3,181
Credit revenues 275 258 249
Total revenues $4,282 $3,894 $3,430
Operating income $ 122 $ 218 $ 165
2000 Compared with 1999
Total International revenues were $4.28 billion in 2000, a 10.0%
increase over 1999. Sears Canada’s total merchandise sales increased
by 10.2% while same store sales increased by 5.0%. Full-line, Specialty
and Catalog formats all posted sales gains. In 2000, 17 new Full-line
Stores were opened primarily representing stores acquired from
T. Eaton Company Limited (“Eaton’s”) on December 30, 1999. Seven
of these stores were reopened under the Eaton’s banner while the
remainder were reopened as Sears stores. Sears Canada also opened
29 specialty off-the-mall stores in 2000. Sears Canada’s Full-line Store
selling square feet increased by 30% in 2000.
The International gross margin rate declined by 190 basis points
in 2000 reflecting increased markdown activity as well as higher
expenses associated with the re-launch of the Eaton’s chain and con-
version of certain Eaton’s stores to Sears banner stores.
International selling and administrative expense as a percentage
of sales was 100 basis points higher than 1999, primarily driven by
higher payroll and store opening costs.
International depreciation and amortization declined by 21.1%
benefiting from amortization of negative goodwill arising from the
Eaton’s acquisition. Interest expense increased by 13.0%. The provi-
sion for uncollectible accounts increased by $15 million due to higher
charge-offs.
International operating income declined by $96 million or 44.0%
mainly because costs associated with integrating and reopening stores
acquired from Eaton’s outpaced the partial year revenue benefits.
1999 Compared with 1998
International revenues were $3.89 billion in 1999, a 13.5% increase from
revenues of $3.43 billion in 1998. International revenues increased as
Sears Canada experienced favorable results across all formats includ-
ing Full-line Stores, Dealer Stores, Furniture Stores, Catalog and
Credit. Comparable store sales were strong throughout the year.
International gross margin as a percentage of International mer-
chandise sales and services increased 20 basis points in 1999 from 1998
primarily due to a sharper focus on the management of the cost of
goods sold.
International selling and administrative expense as a percentage
of total revenues improved 80 basis points in 1999 compared with 1998
as payroll, benefits and other related costs kept pace with the higher
sales levels.
International operating income improved $53 million in 1999
compared with 1998. The improvement is due to revenue growth
resulting from the aggressive growth strategy in the furniture and
dealer store networks and renovations of Full-line Stores.
On December 30, 1999, Sears Canada acquired Eaton’s for
$66 million. The acquisition included trademarks, leases on 16 stores
and certain tax net operating loss carryforwards.
OTHER INCOME
Consolidated other income consists of:
millions 2000 1999 1998
Gain on sales of property
and investments $19 $10 $20
Equity income in unconsolidated
companies 17 (4) 5
Miscellaneous — — 3
Total $36 $ 6 $28
INCOME TAX EXPENSE
Consolidated income tax expense as a percentage of pretax income
was 37.4% in both 2000 and 1999. The 2000 consolidated tax expense
includes an unusually low tax benefit on special charges and impair-
ments due to the write-down of non-tax deductible goodwill.
Excluding special charges and impairments, the 2000 consolidated
effective tax rate would have been 36.1% or 130 basis points lower
than the 1999 tax rate. The decrease from 1999 is primarily due to
SEARS 2000 ANNUAL REPORT 23
Management’s Discussion and Analysis

a reduction in the effective tax rate on Canadian income caused by
non-taxable negative goodwill related to the Eaton’s acquisition.
The effective tax rate of 37.4% in 1999 compared with an effective
tax rate of 40.7% in 1998. The decrease in the effective tax rate in 1999
from 1998 is a result of the unusually high effective rate in 1998 caused
by certain non-tax deductible expenses related to the sale of Western
Auto. Excluding the effect of the Western Auto sale, the Company’s
consolidated effective tax rate would have been 38.2% in 1998.
MARKET RISK
The Company’s outstanding debt securities and off-balance sheet
derivatives are subject to repricing risk. The Company’s policy is to
manage interest rate risk through the strategic use of fixed and vari-
able rate debt and interest rate derivatives. All debt securities and
off-balance sheet derivatives are considered non-trading. At year-end
2000 and 1999, 33% and 23%, respectively, of the funding portfolio was
variable rate (including current maturities of fixed rate long-term debt
that will reprice in the next 12 months and the effect of off-balance
sheet derivative financial instruments, such as interest rate swaps).
Based on the Company’s funding portfolio as of year-end 2000 and
1999, which totaled $25.7 billion and $24.6 billion, respectively, a 100
basis point change in interest rates would have affected annual pretax
funding cost by approximately $85 million and $56 million, respec-
tively. The calculation assumes the funding portfolio balance at year-
end remains constant for an annual period and that the 100 basis point
change occurs at the beginning of the annual period.
INFLATION
The moderate rate of inflation over the past three years has not had
a significant effect on the Company’s sales and profitability.
OUTLOOK
The Company expects the percentage growth in operating income
excluding noncomparable items to be in the mid single digit range.
Earnings per share should also benefit from a reduction in shares out-
standing due to the Company’s $1.0 billion share repurchase program
of which $802 million was still available as of year-end 2000. The
Company anticipates high single to low double digit earnings per
share growth, excluding noncomparable items, for the full year of 2001.
As disclosed in Note 1 to the Consolidated Financial
Statements, the Company will be subject to the provisions of SFAS
No.140, effective April 1, 2001. The adoption of SFAS No.140 may
alter the Company’s accounting for its securitization transactions.
ANALYSIS OF CONSOLIDATED FINANCIAL CONDITION
The Company’s significant financial capacity and flexibility are exem-
plified by the quality and liquidity of its assets and by its ability to
access multiple sources of capital.
The owned credit card receivables balance of $18.0 billion
excludes credit card receivables transferred to a securitization Master
Trust (“Trust”). Through its subsidiary, SRFG, Inc., the Company
obtains funding by selling securities backed by a portion of the receiv-
ables in the Trust. In addition to the receivables in the Trust which sup-
port securities sold to third parties, the Company transfers additional
receivables to the Trust to have receivables readily available for future
securitizations.
A summary of these balances at year-end is as follows:
millions 2000 1999 1998
Domestic:
Managed credit card
receivables $27,001 $26,785 $28,357
Securitized balances sold (7,834) (6,579) (6,626)
Retained interest in
transferred credit card
receivables(1) (3,051) (3,175) (4,400)
Other customer receivables 59 37 112
Domestic owned credit card
receivables 16,175 17,068 17,443
International owned credit
card receivables 1,828 1,725 1,503
Consolidated owned credit
card receivables $18,003 $18,793 $18,946
(1)The 2000, 1999 and 1998 retained interest amounts exclude reserves of $82, $31 and$106 million, respectively, and interest only strip balances of $136, $67 and $55 million,respectively, related to the transfer of credit card receivables into the Trust.
Consolidated credit card receivable balances are geographically
diversified within the United States and Canada. The Company grants
retail consumer credit based on the use of proprietary and commer-
cially available credit histories and scoring models. The Company
promptly recognizes uncollectible accounts and maintains an ade-
quate allowance for uncollectible accounts to reflect losses inherent
in the owned portfolio as of the balance sheet date. There is further
discussion of receivable balances in the discussion of the Credit
Segment’s Results of Operations.
Inventories are primarily valued on the last-in, first-out or LIFO
method. Inventories would have been $566 million higher if valued
on the first-in, first-out or FIFO method at December 30, 2000.
Inventories on a FIFO basis totaled $6.18 billion at December 30, 2000,
compared with $5.66 billion at January 1, 2000. The majority of the
increase in domestic inventory levels was due to increased invest-
ments in hardlines inventories in Full-line and Specialty Stores to sup-
port revenue growth and new store openings. International inventory
increases were due to the acquisition of Eaton’s stores and continued
revenue growth.
24
Management’s Discussion and Analysis

CAPITAL RESOURCES
Total net funding for the Company at December 30, 2000, was $25.69
billion compared with $24.62 billion at January 1, 2000. The $1.08 bil-
lion increase in net funding is primarily due to growth in consolidated
merchandise inventory levels, higher income tax payments and an
increase in domestic managed credit card receivable balances at year-
end 2000 compared with year-end 1999. Year-end funding, including
debt reflected on the balance sheet and investor certificates related
to credit card receivables sold through securitizations, is as follows:
% of % of % of millions 2000 Total 1999 Total 1998 Total
Short-term
borrowings $ 4,280 16.7% $ 2,989 12.2% $ 4,624 17.6%
Long-term debt* 13,580 52.8% 15,049 61.1% 15,045 57.2%
Securitized
balances sold 7,834 30.5% 6,579 26.7% 6,626 25.2%
Total funding $25,694 100.0% $24,617 100.0% $26,295 100.0%
*Includes capitalized lease obligations.
The Company accesses a variety of capital markets to preserve
flexibility and diversify its funding sources. The broad access to capital
markets also allows the Company to effectively manage liquidity and
repricing risk. Liquidity risk is the measure of the Company’s ability to
fund maturities and provide for the operating needs of its businesses.
Repricing risk is the effect on net income from changes in interest
rates. The Company’s cost of funds is affected by a variety of general
economic conditions, including the level and volatility of interest
rates. To aid in the management of repricing risk, the Company uses
off-balance sheet financial instruments, such as interest rate swaps.
The Company has policies that centrally govern the use of such
off-balance sheet financial instruments.
The ratings of the Company’s debt securities as of December 30,
2000, appear in the table below:
Moody’sInvestorsServices, Standard
Inc. & Poor’s Fitch, Inc.
Unsecured long-term debt A3 A– A–
Unsecured commercial paper P–2 A–2 F–2
Term securitization Aaa AAA AAA
On June 1, 2000, Duff & Phelps Credit Rating Co. merged with
Fitch IBCA, Inc. to form Fitch, Inc. and the Company’s ratings were
harmonized to the single set of ratings shown above.
The Company utilizes Sears Roebuck Acceptance Corp.
(“SRAC”), a wholly owned subsidiary, to issue commercial paper,
maintain a medium-term note program, and issue intermediate and
long-term underwritten debt. SRAC commercial paper outstanding
was $3.9 billion and $2.7 billion at December 30, 2000 and January 1,
2000, respectively. SRAC commercial paper is supported by $5.06 bil-
lion of syndicated credit agreements, $875 million of which expires in
April 2002 and $4.19 billion of which expires in April 2003. The follow-
ing securities were issued by SRAC during 2000:
■ $270 million of variable rate medium-term notes, with an aver-
age term of 1.5 years; and■ $25 million of zero coupon medium-term notes, with a yield to
maturity of 7.60% and a term of 6.0 years.
The Company, through its subsidiary SRFG, Inc., securitizes
domestic credit card receivables to access intermediate-term funding
in a cost effective manner. In 2000, the Company issued $2.6 billion of
fixed rate and floating rate term securitizations, compared with
$1.4 billion in 1999. As of December 30, 2000, there were $7.8 billion of
outside investor certificates outstanding that were supported by
sold domestic credit card receivables. In addition, certain of the Com-
pany’s retained interests in securitized receivables were subordinated
to the interests of outside investors.
CAPITAL SPENDING
The Company has an ongoing capital expenditure program to reno-
vate and update its Full-line Stores. In addition, the Company has
added more Full-line and Specialty Stores. Capital expenditures
during the past three years are as follows:
millions 2000 1999 1998
Full-line Stores, primarily
remodeling and
expansion efforts $ 428 $ 530 $ 581
Specialty Stores 198 114 241
Other domestic –
distribution/support 205 246 299
International 253 143 91
Total capital expenditures $1,084 $1,033 $1,212
The Company plans capital expenditures of $1.3 billion for 2001
on a consolidated basis. The planned increase in domestic capital
spending over 2000 is largely to support The Great Indoors with
approximately 10 store openings planned in 2001. The 2001 domestic
capital plan also includes the opening of approximately 10 Full-line
Stores, and more than 115 Specialty Stores. International capital
spending is projected to decline in 2001 from 2000 spending levels.
The Company may also pursue selective strategic acquisitions.
SEARS 2000 ANNUAL REPORT 25
Management’s Discussion and Analysis

SHARE REPURCHASES
During 2000, the Company repurchased 37.9 million common shares
for $1.2 billion under share repurchase programs approved by the
Board of Directors in March 1999 and August 2000. As of the end of
2000, the Company had the capacity to repurchase $802 million of
shares under the $1.0 billion repurchase plan approved in August 2000.
LIQUIDITY
Based upon the expected cash flow to be generated from future
operations and the Company’s ability to cost-effectively access multi-
ple sources of funding, the Company believes sufficient resources will
be available to maintain its planned level of operations, capital expen-
ditures, dividends and share repurchases in the foreseeable future.
CAUTIONARY STATEMENT REGARDING FORWARD-LOOKING
INFORMATION
Certain statements made in this Annual Report including the
Chairman’s letter are forward-looking statements made in reliance on
the safe harbor provisions of the Private Securities Litigation Reform
Act of 1995. As such, they involve risks and uncertainties that could
cause actual results to differ materially. The Company’s forward-
looking statements are based on assumptions about many important
factors, including competitive conditions in the retail industry; changes
in consumer confidence and spending in the United States and
Canada; delinquency and charge-off trends in the credit card receiv-
ables portfolio; the successful implementation and consumer accept-
ance of Sears Gold MasterCard program particularly after promotional
introductory interest rates expire, direct-to-customer strategy and
other initiatives; the ability of the Company to develop appropriate
new sites for The Great Indoors; the successful re-launch of Eaton’s
Stores; anticipated cash flow; general United States and Canada eco-
nomic conditions, such as higher interest rates and unemployment;
the effect and timing of the adoption of SFAS No.140; and normal
business uncertainty. In addition, the Company typically earns a dis-
proportionate share of its operating income in the fourth quarter due
to holiday buying patterns, which are difficult to forecast with certainty.
While the Company believes that its assumptions are reasonable, it
cautions that it is impossible to predict the impact of such factors
which could cause actual results to differ materially from predicted
results. The Company intends the forward-looking statements in this
annual report to speak only at the time of its release and does not
undertake to update or revise these projections as more information
becomes available.
26
Management’s Discussion and Analysis

millions, except per common share data 2000 1999 1998
REVENUES
Merchandise sales and services $36,548 $35,141 $35,335
Credit revenues 4,389 4,343 4,618
Total revenues 40,937 39,484 39,953
COSTS AND EXPENSES
Cost of sales, buying and occupancy 26,899 25,627 25,794
Selling and administrative 8,642 8,416 8,412
Provision for uncollectible accounts 884 871 1,287
Depreciation and amortization 826 848 830
Interest 1,248 1,268 1,423
Special charges and impairments 251 41 352
Total costs and expenses 38,750 37,071 38,098
Operating income 2,187 2,413 1,855
Other income, net 36 6 28
Income before income taxes, minority interest and extraordinary loss 2,223 2,419 1,883
Income taxes 831 904 766
Minority interest 49 62 45
Income before extraordinary loss 1,343 1,453 1,072
Extraordinary loss on early extinguishment of debt, net of tax — — 24
NET INCOME $ 1,343 $ 1,453 $ 1,048
EARNINGS PER COMMON SHARE – BASIC:
Income before extraordinary loss $ 3.89 $ 3.83 $ 2.76
Extraordinary loss — — 0.06
Net income $ 3.89 $ 3.83 $ 2.70
EARNINGS PER COMMON SHARE – DILUTED:
Income before extraordinary loss $ 3.88 $ 3.81 $ 2.74
Extraordinary loss — — 0.06
Net income $ 3.88 $ 3.81 $ 2.68
See accompanying notes.
SEARS 2000 ANNUAL REPORT 27
Consolidated Statements of Income

millions, except per share data 2000 1999
ASSETS
Current assets
Cash and cash equivalents $ 842 $ 729
Retained interest in transferred credit card receivables 3,105 3,211
Credit card receivables 18,003 18,793
Less allowance for uncollectible accounts 686 760
Net credit card receivables 17,317 18,033
Other receivables 506 404
Merchandise inventories 5,618 5,069
Prepaid expenses and deferred charges 486 512
Deferred income taxes 920 709
Total current assets 28,794 28,667
Property and equipment
Land 408 370
Buildings and improvements 6,096 5,837
Furniture, fixtures and equipment 5,559 5,209
Capitalized leases 522 496
Gross property and equipment 12,585 11,912
Less accumulated depreciation 5,932 5,462
Total property and equipment, net 6,653 6,450
Deferred income taxes 174 367
Other assets 1,278 1,470
TOTAL ASSETS $36,899 $36,954
LIABILITIES
Current liabilities
Short-term borrowings $ 4,280 $ 2,989
Current portion of long-term debt and capitalized lease obligations 2,560 2,165
Accounts payable and other liabilities 7,336 6,992
Unearned revenues 1,058 971
Other taxes 562 584
Total current liabilities 15,796 13,701
Long-term debt and capitalized lease obligations 11,020 12,884
Postretirement benefits 1,951 2,180
Minority interest and other liabilities 1,363 1,350
TOTAL LIABILITIES 30,130 30,115
COMMITMENTS AND CONTINGENT LIABILITIES
SHAREHOLDERS’ EQUITY
Common shares ($.75 par value per share, 1,000 shares authorized, 333.2 and 369.1 shares outstanding) 323 323
Capital in excess of par value 3,538 3,554
Retained earnings 6,979 5,952
Treasury stock – at cost (3,726) (2,569)
Deferred ESOP expense (96) (134)
Accumulated other comprehensive loss (249) (287)
TOTAL SHAREHOLDERS’ EQUITY 6,769 6,839
TOTAL LIABILITIES AND SHAREHOLDERS’ EQUITY $36,899 $36,954
See accompanying notes.
28
Consolidated Balance Sheets
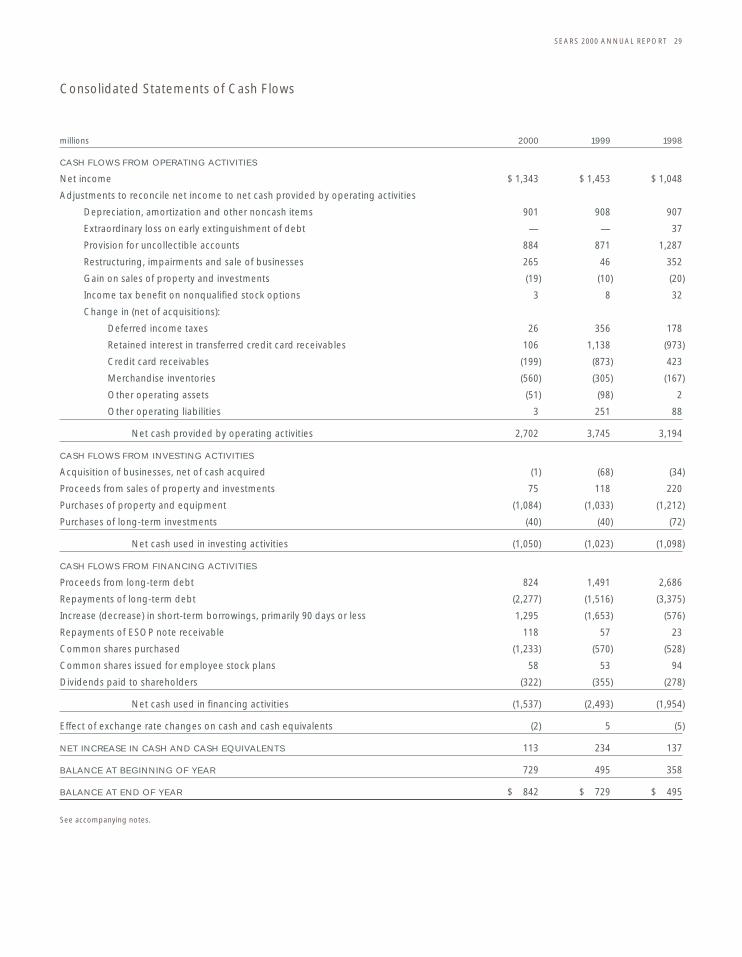
millions 2000 1999 1998
CASH FLOWS FROM OPERATING ACTIVITIES
Net income $ 1,343 $ 1,453 $ 1,048
Adjustments to reconcile net income to net cash provided by operating activities
Depreciation, amortization and other noncash items 901 908 907
Extraordinary loss on early extinguishment of debt — — 37
Provision for uncollectible accounts 884 871 1,287
Restructuring, impairments and sale of businesses 265 46 352
Gain on sales of property and investments (19) (10) (20)
Income tax benefit on nonqualified stock options 3 8 32
Change in (net of acquisitions):
Deferred income taxes 26 356 178
Retained interest in transferred credit card receivables 106 1,138 (973)
Credit card receivables (199) (873) 423
Merchandise inventories (560) (305) (167)
Other operating assets (51) (98) 2
Other operating liabilities 3 251 88
Net cash provided by operating activities 2,702 3,745 3,194
CASH FLOWS FROM INVESTING ACTIVITIES
Acquisition of businesses, net of cash acquired (1) (68) (34)
Proceeds from sales of property and investments 75 118 220
Purchases of property and equipment (1,084) (1,033) (1,212)
Purchases of long-term investments (40) (40) (72)
Net cash used in investing activities (1,050) (1,023) (1,098)
CASH FLOWS FROM FINANCING ACTIVITIES
Proceeds from long-term debt 824 1,491 2,686
Repayments of long-term debt (2,277) (1,516) (3,375)
Increase (decrease) in short-term borrowings, primarily 90 days or less 1,295 (1,653) (576)
Repayments of ESOP note receivable 118 57 23
Common shares purchased (1,233) (570) (528)
Common shares issued for employee stock plans 58 53 94
Dividends paid to shareholders (322) (355) (278)
Net cash used in financing activities (1,537) (2,493) (1,954)
Effect of exchange rate changes on cash and cash equivalents (2) 5 (5)
NET INCREASE IN CASH AND CASH EQUIVALENTS 113 234 137
BALANCE AT BEGINNING OF YEAR 729 495 358
BALANCE AT END OF YEAR $ 842 $ 729 $ 495
See accompanying notes.
SEARS 2000 ANNUAL REPORT 29
Consolidated Statements of Cash Flows

Capital Accumulated
Common in Excess Deferred Other Total
dollars in millions Shares Common of Par Retained Treasury ESOP Comprehensive Shareholders’
shares in thousands Outstanding Stock Value Earnings Stock Expense Loss Equity
Balance, beginning of year 1998 390,888 $323 $3,598 $4,158 $(1,702) $(204) $(311) $ 5,862
Net income 1,048 1,048
Other comprehensive income:
Currency translation (31) (31)
Minimum pension liability,
net of tax of $45 (82) (82)
Total comprehensive income $ 935
Dividends to shareholders ($0.92 per share) (358) (358)
Stock options exercised and other changes 3,263 (15) 141 126
Shares repurchased (10,643) (528) (528)
ESOP expense recognized 29 29
Balance, end of year 1998 383,508 $323 $3,583 $4,848 $(2,089) $(175) $(424) $ 6,066
Net income 1,453 1,453
Other comprehensive income:
Currency translation 14 14
Minimum pension liability,
net of tax of $57 104 104
Unrealized gain on securities held,
net of tax of $11 19 19
Total comprehensive income $1,590
Dividends to shareholders ($0.92 per share) (349) (349)
Stock options exercised and other changes 2,041 (29) 90 61
Shares repurchased (16,421) (570) (570)
ESOP expense recognized 41 41
Balance, end of year 1999 369,128 $323 $3,554 $5,952 $(2,569) $(134) $(287) $ 6,839
Net income 1,343 1,343
Other comprehensive income:
Currency translation (7) (7)
Minimum pension liability,
net of tax of $36 63 63
Unrealized gain on securities held,
net of tax of $10 (18) (18)
Total comprehensive income $1,381
Dividends to shareholders ($0.92 per share) (316) (316)
Stock options exercised and other changes 1,963 (16) 76 60
Shares repurchased (37,888) (1,233) (1,233)
ESOP expense recognized 38 38
Balance, end of year 2000 333,203 $323 $3,538 $6,979 $(3,726) $ (96) $(249) $ 6,769
See accompanying notes.
30
Consolidated Statements of Shareholders’ Equity

NOTE 1 – SUMMARY OF SIGNIFICANT ACCOUNTING POLICIES
Basis of Consolidation
The consolidated financial statements include the accounts of Sears,
Roebuck and Co. and all majority-owned domestic and international
companies (“the Company”). Investments in companies in which
the Company exercises significant influence, but not control, are
accounted for using the equity method of accounting. Investments
in companies in which the Company has less than a 20% ownership
interest, and does not exercise significant influence, are accounted for
at cost.
Nature of Operations
The Company is a multi-line retailer providing a wide array of
merchandise and services. The Company operates principally in
the United States, Puerto Rico and Canada.
Use of Estimates
The preparation of financial statements in conformity with generally
accepted accounting principles requires management to make
estimates and assumptions that affect the amounts reported in the
financial statements and accompanying notes. Actual results could
differ from these estimates.
Reclassifications
Certain reclassifications have been made to prior year financial
statements to conform with the current year presentation. In 2000,
in response to the Securities and Exchange Commission’s Staff
Accounting Bulletin No. 101, the Company changed its method of
recording licensed business revenue to reflect only net commission
income from licensees. This change reduced reported revenues by
$1.52, $1.59 and $1.62 billion in 2000, 1999 and 1998, respectively. The
change did not affect net income or earnings per share.
Fiscal Year
The Company’s fiscal year ends on the Saturday nearest December
31. Unless otherwise stated, references to years in this report relate to
fiscal years rather than to calendar years.
Fiscal year Ended Weeks
2000 December 30, 2000 52
1999 January 1, 2000 52
1998 January 2, 1999 52
Revenue Recognition
Revenues from merchandise sales and services are net of estimated
returns and allowances and exclude sales tax. Revenues include net
commission income earned from licensees.
The Company sells extended service contracts with terms of
coverage generally between 12 and 60 months. Revenues from the
sale of these contracts are deferred and amortized over the lives of
the contracts.
The Company direct markets insurance (credit protection, life
and health), clubs and services memberships, merchandise through
specialty catalogs and impulse and continuity merchandise. For insur-
ance and clubs and services, deferred revenue is recorded when the
member is billed (upon expiration of any free trial period), and
revenue is recognized over the insurance or membership period.
For specialty catalog, impulse and continuity merchandise, revenue is
recognized when merchandise is shipped.
Advertising and Direct Response Marketing
Costs for newspaper, television, radio and other media advertising are
expensed the first time the advertising occurs. The total cost of adver-
tising charged to expense was $1.57, $1.63 and $1.67 billion in 2000,
1999 and 1998, respectively.
Certain direct response advertising and solicitation costs are
capitalized. Membership acquisition and renewal costs, which pri-
marily relate to membership solicitations, are capitalized since such
direct response advertising costs result in future economic benefits.
Generally such costs are amortized over the shorter of the program’s
life or five years, primarily in proportion to when revenues are recog-
nized. For certain insurance products, costs are amortized over 15
years in proportion to income produced. For specialty catalogs, costs
are amortized over the life of the catalog, not to exceed one year.
The consolidated balance sheets include deferred direct response
advertising costs of $202 and $180 million at December 30, 2000
and January 1, 2000, respectively. The current portion is included in
prepaid expenses and deferred charges, the long-term portion is
included in other assets.
Extended Service Contract Costs
Costs related to performing extended service contracts are expensed
as incurred. Incremental costs that are directly related to the acquisi-
tion of a contract are deferred and charged to expense in proportion
to the revenue recognized.
Store Preopening Expenses
Costs associated with the opening of new stores are expensed
as incurred.
Earnings Per Common Share
Basic earnings per common share is computed by dividing net
income available to common shareholders by the weighted average
number of common shares outstanding. Diluted earnings per com-
mon share also includes the dilutive effect of potential common
shares (primarily dilutive stock options) outstanding during the period.
SEARS 2000 ANNUAL REPORT 31
Notes to Consolidated Financial Statements

Stock-Based Compensation
The Company accounts for stock-based compensation in accor-
dance with Accounting Principles Board Opinion (“APB”) No. 25,
“Accounting For Stock Issued to Employees,” and provides the pro
forma disclosures of Statement of Financial Accounting Standards
(“SFAS”) No. 123, “Accounting for Stock-Based Compensation.”
Cash and Cash Equivalents
Cash equivalents include all highly liquid investments with maturities
of three months or less at the date of purchase.
Retained Interest in Transferred Credit Card Receivables
When the Company sells receivables in securitizations of credit card
receivables it retains interest-only strips, one or more subordinated
tranches and servicing rights, all of which are retained interests in the
securitized receivables. In addition, the Company’s retained interest
includes contractually required seller’s interest, which supports secu-
rities sold to third parties, and excess seller’s interest, which represents
receivables available for future securitizations. Gain or loss on sale of
the receivables depends in part on the previous carrying amount of
the financial assets involved in the transfer based on their relative fair
value at the date of transfer. The Company estimates fair value based
on the present value of future expected cash flows estimated using
management’s best estimates of key assumptions – credit losses, yield
and discount rates commensurate with the risks involved.
Credit Card Receivables
Credit card receivables arise primarily under open-end revolving
credit accounts used to finance purchases of merchandise and ser-
vices offered by the Company. These accounts have various billing
and payment structures, including varying minimum payment levels
and finance charge rates. Based on historical payment patterns, the
full receivable balance will not be repaid within one year.
Credit card receivables are shown net of an allowance for uncol-
lectible accounts. The Company provides an allowance for uncol-
lectible accounts based on impaired accounts, historical charge-off
patterns and management judgment.
The Company’s current credit processing system charges off an
account automatically when a customer has failed to make a required
payment in each of the eight billing cycles following a missed pay-
ment. In the fourth quarter of 1998, the Company converted 12% of
its managed portfolio of credit card receivables to the current credit
processing system. The remaining 88% of accounts were converted
to the current system in the first and second quarters of 1999. In 1998,
under the Company’s former proprietary credit system, uncollectible
accounts were generally charged off automatically when the cus-
tomer’s past due balance was eight times the scheduled minimum
monthly payment. Under both systems, finance charge revenue is
recorded until an account is charged off, at which time uncollected
finance charge revenue is recorded as a reduction of credit revenues.
The 2000 and 1999 year-end delinquency rates consider accounts
to be delinquent when a customer has failed to make a payment in
each of the last three or more billing cycles.
Merchandise Inventories
Approximately 86% of merchandise inventories are valued at the
lower of cost (using the last-in, first-out or “LIFO” method) or market
using the retail method. To estimate the effects of inflation on inven-
tories, the Company utilizes internally developed price indices.
The LIFO adjustment to cost of sales was a credit of $29, $73
and $34 million in 2000, 1999 and 1998, respectively. During 2000, the
Company liquidated certain LIFO inventories that were carried at
lower costs prevailing in prior years. This liquidation increased the
LIFO credit by $3 million in 2000. No LIFO layer liquidations occurred
in 1999 or 1998. If the first-in, first-out (“FIFO”) method of inventory
valuation had been used instead of the LIFO method, merchandise
inventories would have been $566 and $595 million higher at
December 30, 2000, and January 1, 2000, respectively.
Merchandise inventories of International operations, operations
in Puerto Rico and certain Automotive stores, which in total represent
approximately 14% of merchandise inventories, are recorded at the
lower of cost or market based on the FIFO method.
Depreciation and Amortization
Depreciation is provided principally by the straight-line method over
the estimated useful lives of the related assets, generally 2 to 10 years
for furniture, fixtures and equipment, and 15 to 50 years for buildings
and building improvements. Goodwill is amortized using the straight-
line method over periods ranging from 5 to 40 years.
Long-Lived Asset Recoverability
Long-lived assets, identifiable intangibles and goodwill related to
those assets are reviewed for impairment whenever events or changes
in circumstances indicate that the carrying amount of such assets may
not be recoverable.
Off-Balance Sheet Financial Instruments
The Company utilizes various off-balance sheet financial instruments
primarily to manage the interest rate risk associated with its borrow-
ings. The counterparties to these instruments generally are major
financial institutions with credit ratings of single-A or better.
Interest rate swap agreements modify the interest characteris-
tics of a portion of the Company’s debt. Any differential to be paid or
received is accrued and is recognized as an adjustment to interest
expense in the statement of income. The related accrued receivable
or payable is included in other assets or liabilities. The fair values of
the swap agreements are not recognized in the financial statements.
32
Notes to Consolidated Financial Statements
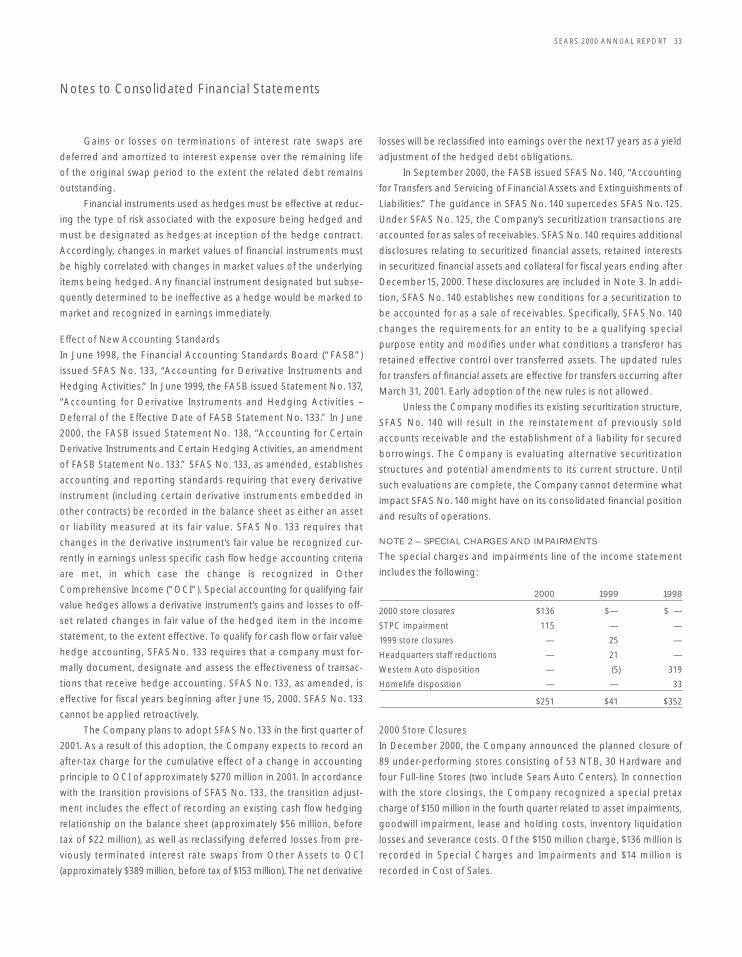
Gains or losses on terminations of interest rate swaps are
deferred and amortized to interest expense over the remaining life
of the original swap period to the extent the related debt remains
outstanding.
Financial instruments used as hedges must be effective at reduc-
ing the type of risk associated with the exposure being hedged and
must be designated as hedges at inception of the hedge contract.
Accordingly, changes in market values of financial instruments must
be highly correlated with changes in market values of the underlying
items being hedged. Any financial instrument designated but subse-
quently determined to be ineffective as a hedge would be marked to
market and recognized in earnings immediately.
Effect of New Accounting Standards
In June 1998, the Financial Accounting Standards Board (“FASB”)
issued SFAS No. 133, “Accounting for Derivative Instruments and
Hedging Activities.” In June 1999, the FASB issued Statement No. 137,
“Accounting for Derivative Instruments and Hedging Activities –
Deferral of the Effective Date of FASB Statement No. 133.” In June
2000, the FASB issued Statement No. 138, “Accounting for Certain
Derivative Instruments and Certain Hedging Activities, an amendment
of FASB Statement No. 133.” SFAS No. 133, as amended, establishes
accounting and reporting standards requiring that every derivative
instrument (including certain derivative instruments embedded in
other contracts) be recorded in the balance sheet as either an asset
or liability measured at its fair value. SFAS No. 133 requires that
changes in the derivative instrument’s fair value be recognized cur-
rently in earnings unless specific cash flow hedge accounting criteria
are met, in which case the change is recognized in Other
Comprehensive Income (“OCI”). Special accounting for qualifying fair
value hedges allows a derivative instrument’s gains and losses to off-
set related changes in fair value of the hedged item in the income
statement, to the extent effective. To qualify for cash flow or fair value
hedge accounting, SFAS No. 133 requires that a company must for-
mally document, designate and assess the effectiveness of transac-
tions that receive hedge accounting. SFAS No. 133, as amended, is
effective for fiscal years beginning after June 15, 2000. SFAS No. 133
cannot be applied retroactively.
The Company plans to adopt SFAS No. 133 in the first quarter of
2001. As a result of this adoption, the Company expects to record an
after-tax charge for the cumulative effect of a change in accounting
principle to OCI of approximately $270 million in 2001. In accordance
with the transition provisions of SFAS No. 133, the transition adjust-
ment includes the effect of recording an existing cash flow hedging
relationship on the balance sheet (approximately $56 million, before
tax of $22 million), as well as reclassifying deferred losses from pre-
viously terminated interest rate swaps from Other Assets to OCI
(approximately $389 million, before tax of $153 million). The net derivative
losses will be reclassified into earnings over the next 17 years as a yield
adjustment of the hedged debt obligations.
In September 2000, the FASB issued SFAS No. 140, “Accounting
for Transfers and Servicing of Financial Assets and Extinguishments of
Liabilities.” The guidance in SFAS No. 140 supercedes SFAS No. 125.
Under SFAS No. 125, the Company’s securitization transactions are
accounted for as sales of receivables. SFAS No. 140 requires additional
disclosures relating to securitized financial assets, retained interests
in securitized financial assets and collateral for fiscal years ending after
December 15, 2000. These disclosures are included in Note 3. In addi-
tion, SFAS No. 140 establishes new conditions for a securitization to
be accounted for as a sale of receivables. Specifically, SFAS No. 140
changes the requirements for an entity to be a qualifying special
purpose entity and modifies under what conditions a transferor has
retained effective control over transferred assets. The updated rules
for transfers of financial assets are effective for transfers occurring after
March 31, 2001. Early adoption of the new rules is not allowed.
Unless the Company modifies its existing securitization structure,
SFAS No. 140 will result in the reinstatement of previously sold
accounts receivable and the establishment of a liability for secured
borrowings. The Company is evaluating alternative securitization
structures and potential amendments to its current structure. Until
such evaluations are complete, the Company cannot determine what
impact SFAS No. 140 might have on its consolidated financial position
and results of operations.
NOTE 2 – SPECIAL CHARGES AND IMPAIRMENTS
The special charges and impairments line of the income statement
includes the following:
2000 1999 1998
2000 store closures $136 $— $ —
STPC impairment 115 — —
1999 store closures — 25 —
Headquarters staff reductions — 21 —
Western Auto disposition — (5) 319
Homelife disposition — — 33
$251 $41 $352
2000 Store Closures
In December 2000, the Company announced the planned closure of
89 under-performing stores consisting of 53 NTB, 30 Hardware and
four Full-line Stores (two include Sears Auto Centers). In connection
with the store closings, the Company recognized a special pretax
charge of $150 million in the fourth quarter related to asset impairments,
goodwill impairment, lease and holding costs, inventory liquidation
losses and severance costs. Of the $150 million charge, $136 million is
recorded in Special Charges and Impairments and $14 million is
recorded in Cost of Sales.
SEARS 2000 ANNUAL REPORT 33
Notes to Consolidated Financial Statements

Asset impairments – The Company recorded a special charge of
$59 million, net of estimated salvage value, for the write-down of
property and equipment to fair value, less costs to sell. The impaired
assets consist of land, abandoned leasehold improvements and
equipment used at the stores. Estimated salvage values are based on
estimates of proceeds upon sale of the affected assets.
Goodwill impairment – Certain of the closed NTB and Hardware
Stores were acquired through purchase business combinations that
resulted in goodwill being recognized by the Company. As part of the
asset impairment review for the closed stores, the Company allocated
the related goodwill to the stores on a pro rata basis using the rela-
tive fair values of the long-lived assets at the acquisition date. This
resulted in a goodwill impairment charge of $17 million.
Lease and holding costs – The special charge also includes $57 mil-
lion for incremental costs and contractual obligations for items such
as estimated future lease obligations net of sublease income, lease
termination payments and other facility exit costs incurred as a direct
result of the store closures.
Inventory liquidation losses – As a result of the store closings, certain
inventory was written down to its net realizable value. This resulted in
a charge to cost of goods sold of $14 million.
Severance costs – Of the special charge, $3 million relates to
employee termination benefits. The Company expects to eliminate
approximately 2,000 positions as a direct result of the store closures.
Impairment of Investment in Sears Termite and Pest Control (“STPC”)
During the fourth quarter of 2000, due to ongoing and anticipated
operating losses and based on estimated future cash flows, manage-
ment determined that the assets of Sears Termite and Pest Control
were impaired and committed to a plan to review strategic options
for this business. Accordingly, the Company recorded a $115 million
charge to reflect the assets at fair value, less related costs.
Following is a summary of the activity in the reserves established
for the 2000 store closures and the write-down of the investment
in STPC.
Asset EndingInitial Cash Write- Reserve
Expense Payments Downs Balance
Asset impairments $ 94 $— $ (69) $25
Goodwill impairments 97 — (97) —
Lease and holding costs 57 — — 57
Inventory liquidation losses 14 — — 14
Severance Costs 3 — — 3
$265 $— $(166) $99
1999 Store Closures
During the third quarter of 1999, the Company closed 33 automotive
stores in three geographic markets. In connection with the store clos-
ings, the Company recognized a special pretax charge of $25 million
related to severance costs, asset impairments and lease and hold-
ing costs.
Asset impairments – The special charge includes $21 million, net
of estimated salvage value, to reflect the assets at fair value, less
cost to sell. The assets consist primarily of land, abandoned lease-
hold improvements and equipment used at the stores. Estimated
salvage values are based on estimates of proceeds upon sale of the
affected assets.
Severance and other costs – Of the special charge, $3 million related
to employee termination benefits and $1 million related to net incre-
mental lease costs.
Headquarters staff reductions
During the third quarter of 1999, the Company recorded a pretax
charge of $21 million related to severance costs for headquarters staff
reductions of approximately 450 employees. The staff reductions took
place during the third quarter of 1999.
At the beginning of 2000, the Company had reserves relating
to the 1999 special charges of $26 million. As of December 30, 2000
the balance of $2 million primarily represents estimated future lease
obligations and estimated losses on properties held for disposal.
Western Auto Disposition
On November 2, 1998, the Company completed an Agreement and
Plan of Merger of Western Auto, a wholly owned subsidiary, with
Advance Auto Parts, whereby Sears exchanged its interest in Western
Auto for $175 million in cash and approximately 40% equity ownership
in the resulting combined company. Based on the terms of the sale,
the Company recorded a pretax charge of $319 million in 1998 to
reflect the Western Auto assets at fair value, less cost to sell. In the
fourth quarter of 1999, certain estimates of remaining liabilities under
the terms of the transaction were revised, resulting in $5 million of
pretax income being recorded.
Homelife Disposition
On November 18, 1998, the Company entered into an agreement to
sell its Homelife furniture business for $100 million in cash, a $10 million
note receivable and a 19% equity ownership in the new Homelife busi-
ness. The Company recorded a $33 million pretax charge to reflect
the Homelife assets at fair value, less cost to sell. The sale was com-
pleted on January 30, 1999.
34
Notes to Consolidated Financial Statements

NOTE 3 – CREDIT CARD SECURITIZATIONS
The Company utilizes credit card securitizations as a part of its overall
funding strategy. Under generally accepted accounting principles, if
the structure of the securitization meets certain requirements, these
transactions are accounted for as sales of receivables.
Summary of Securitization Process
As part of its domestic credit card securitizations, the Company
transfers credit card receivable balances to a Master Trust (“Trust”)
in exchange for certificates representing undivided interests in such
receivables. Balances transferred from the Company’s credit card
portfolio to the Trust become securities upon transfer. These securi-
ties are accounted for as available-for-sale securities. The allowance
for uncollectible accounts that related to the transferred receivables
is amortized over the collection period to recognize income on the
transferred balances on an effective yield basis. This resulted in addi-
tional revenues of $60 and $75 million in 2000 and 1999, respectively,
and did not affect 1998 revenues.
The Trust securitizes balances by issuing certificates represent-
ing undivided interests in the Trust’s receivables to outside investors.
In each securitization transaction the Company retains certain subor-
dinated interests that serve as a credit enhancement to outside
investors and expose the Company’s Trust assets to possible credit
losses on receivables sold to outside investors. The investors and the
Trust have no recourse against the Company beyond Trust assets.
In order to maintain the committed level of securitized assets,
the Company reinvests cash collections on securitized accounts in
additional balances. These additional investments result in increases
to the interest-only strip and credit revenues. As of December 30,
2000, the Company’s securitization transactions mature as follows:
millions
2001 $1,046
2002 1,403
2003 2,020
2004 1,519
2005 and thereafter 1,846
Retained Interest in Transferred Credit Card Receivables
The Company’s retained interest in transferred credit card receivables
consists of investor certificates held by the Company, interest-only
strips, contractually required seller’s interest and excess seller’s inter-
est in the credit card receivables in the Trust. Retained interests at
year-end are as follows:
millions 2000 1999
Subordinated interests:
Investor certificates held by the Company $1,161 $ 960
Unsubordinated interests:
Contractually required seller’s interest 898 760
Excess seller’s interest 992 1,455
Interest-only strip 136 67
Less: Unamortized transferred allowance
for uncollectible accounts 82 31
Retained interest in transferred
credit card receivables $3,105 $3,211
The Company intends to hold the investor certificates and
contractually required seller’s interest to maturity. The excess seller’s
interest is considered available-for-sale. Due to the revolving nature
of the underlying credit card receivables, the carrying value of the
Company’s retained interest in transferred credit card receivables
approximates fair value and is classified as a current asset.
Securitization Gains
Due to the qualified status of the Trust, the issuance of certificates to
outside investors is considered a sale for which the Company recog-
nizes a gain and an asset for the interest-only strip. The interest-only
strip represents the Company’s rights to future cash flows arising after
the investors in the Trust have received the return for which they con-
tracted. The Company also retains servicing responsibilities for which
it receives annual servicing fees approximating 2% of the outstanding
balance. The Company recognized incremental operating income
from net securitization gains of $68, $11 and $58 million in 2000, 1999
and 1998, respectively.
The Company measures its interest-only strip and the related
securitization gains using the present value of estimated future cash
flows. This valuation technique requires the use of key economic
assumptions about yield, payment rates, charge-off rates and returns
to transferees. Approximately 22% of the Company’s outstanding
securitizations offer variable returns to investors with contractual
spreads over LIBOR ranging from 16 to 53 basis points.
SEARS 2000 ANNUAL REPORT 35
Notes to Consolidated Financial Statements

As of December 30, 2000, the interest-only strip was recorded
at its fair value of $136 million. The following table shows the key
economic assumptions used in measuring the interest-only strip and
securitization gains. The table also displays the sensitivity of the
current fair value of residual cash flows to immediate 100 and 200
basis point adverse changes in yield, payment rate, charge-off and
discount rate assumptions:
Effects of Adverse Changesmillions Assumptions 100 bp 200 bp
Yield (annual rate) 19.85% $36 $71
Principal payment rate
(monthly rate) 5.26% $20 $35
Gross charge-off rate
(annual rate) 7.4% $36 $71
Residual cash flows discount
rate (annual rate) 12.0% $ 1 $ 2
These sensitivities are hypothetical and should be used with
caution. As the figures indicate, changes in fair value assumptions
generally cannot be extrapolated because the relationship of the
change in assumption to the change in fair value may not be linear.
Also, in this table, the effect of a variation in a particular assumption
on the fair value of the retained interest is calculated without changing
any other assumption; in reality, changes in one factor may result in
changes in another, which might magnify or counteract the sensitivities.
Managed Portfolio Data
A summary of the domestic year-end securitized receivables and
other domestic credit card receivables managed together with
them follows:
millions 2000 1999
Securitized balances $ 7,834 $ 6,579
Retained interest in transferred
credit card receivables(1) 3,051 3,175
Owned credit card receivables 16,175 17,068
Other customer receivables (59) (37)
Managed credit card receivables $27,001 $26,785
Net Charge-offs of managed
credit card receivables $ 1,323 $ 1,713
Delinquency rates at year-end 7.56% 7.58%
(1)The 2000 and 1999 retained interest amounts exclude reserves of $82 and $31 million,respectively, and interest only strip balances of $136 and $67 million, respectively, relatedto the transfer of credit card receivables into the Trust.
Securitization Cash Flow Data
The table below summarizes certain cash flows that the Company
received from and paid to the securitization trust during 2000:
millions
Proceeds from new securitizations $2,620
Proceeds from collections reinvested in previous securitizations 3,547
Servicing fees received 200
Purchase of charged-off balances, net of recoveries (522)
NOTE 4 – BORROWINGS
Short-term borrowings consist of:
millions 2000 1999
Commercial paper $4,115 $2,824
Bank loans 95 95
Promissory note 70 70
Total short-term borrowings $4,280 $2,989
Weighted average interest rate at year-end 7.3% 6.0%
Weighted average interest rate at year-end,
including effects of swaps 7.6% 7.1%
At December 30, 2000, the credit facilities of the Company’s
financing subsidiary, Sears Roebuck Acceptance Corp (“SRAC”),
totaled $5.06 billion in syndicated credit agreements. Sears Canada
had credit agreements totaling $533 million. These syndicated and
other credit agreements provide for loans at prevailing interest rates
and mature at various dates through April 2003. The Company pays
commitment fees in connection with these credit agreements.
The Company had interest rate swap agreements that estab-
lished fixed rates on $1.38 billion and $1.52 billion of short-term vari-
able rate debt at December 30, 2000 and January 1, 2000, respectively,
resulting in weighted average interest rates of 6.6% and 6.7%, respec-
tively. The weighted average maturity of agreements in effect on
December 30, 2000, was approximately 15 years.
36
Notes to Consolidated Financial Statements

Long-term debt is as follows:
millions Issue 2000 1999
SEARS, ROEBUCK AND CO.
6.25% Notes, due through 2004 $ 300 $ 300
9.375% Debentures, due 2011 300 300
6.15% to 10.0% Medium-Term Notes, due 2001 to 2021 871 1,215
SEARS ROEBUCK ACCEPTANCE CORP.
6% to 7.50% Notes, due 2002 to 2038 5,579 5,827
5.53% to 7.60% Medium-Term Notes, due 2001 to 2013 4,608 5,716
SEARS DC CORP.
8.52% to 9.26% Medium-Term Notes, due 2001 to 2012 213 213
SEARS CANADA INC.
6.55% to 7.80% Debentures, due 2001 to 2010 350 305
SEARS CANADA RECEIVABLES TRUST
5.34% to 9.18% Receivables Trusts, due 2001 to 2006 916 735
CAPITALIZED LEASE OBLIGATIONS 424 417
OTHER NOTES AND MORTGAGES 19 21
Total long-term debt 13,580 15,049
Less current maturities 2,560 2,165
Long-term debt $11,020 $12,884
As of December 30, 2000, long-term debt maturities for the next
five years are as follows:
millions
2001 $2,560
2002 1,754
2003 2,618
2004 863
2005 479
The Company paid interest of $1.2, $1.2 and $1.3 billion in 2000,
1999 and 1998, respectively. Interest capitalized was $4, $5 and $5 mil-
lion in 2000, 1999 and 1998, respectively.
NOTE 5 – FINANCIAL INSTRUMENTS
In the normal course of business, the Company invests in various
financial assets, incurs various financial liabilities and enters into
agreements involving off-balance sheet financial instruments. The
Company’s financial assets and liabilities are recorded in the consoli-
dated balance sheets at historical cost, which approximates fair value.
To determine fair value, credit card receivables are valued by
discounting estimated future cash flows. The estimated cash flows
reflect the historical cardholder payment experience and are dis-
counted at market rates. Long-term debt is valued based on quoted
market prices when available or discounted cash flows, using interest
rates currently available to the Company on similar borrowings.
The Company is a party to off-balance sheet financial instru-
ments to manage interest rate and foreign currency risk. These finan-
cial instruments involve, to varying degrees, elements of market,
credit, foreign exchange and interest rate risk in excess of amounts
recognized in the balance sheet. In certain transactions, the Company
may require collateral or other security to support the off-balance
sheet financial instruments with credit risk.
Debt-related
The Company had the following off-balance sheet financial instruments
related to its outstanding borrowings at the end of 2000 and 1999:
2000 1999
Contract or Contract orNotional Fair Notional Fair
millions Amount Value Amount Value
Interest rate swap
agreements:
Pay floating rate,
receive fixed rate $ — $ — $ 83 $ —
Pay fixed rate,
receive floating rate 1,382 (59) 1,517 148
Foreign currency
hedge agreements 4 (1) 9 (1)
The Company uses interest rate swaps to manage the interest
rate risk associated with its borrowings and to manage the Company’s
allocation of fixed and variable-rate debt. For pay floating rate,
receive fixed rate swaps, the Company paid a weighted average rate
of 6.17% and received a weighted average rate of 6.87% in 2000. For
pay fixed rate, receive floating rate swaps, the Company paid a
weighted average rate of 6.61% and received a weighted average rate
of 6.32% in 2000. The fair values of interest rate swaps are based on
prices quoted from dealers. If a counterparty fails to meet the terms of
a swap agreement, the Company’s exposure is limited to the net
amount that would have been received, if any, over the agreement’s
remaining life.
Maturity dates of the off-balance sheet financial instruments
outstanding at December 30, 2000, are as follows:
Notional amount
millions 1 year 2-5 years Over 5 years
Interest rate swap agreements $100 $67 $1,215
Foreign currency hedge agreements 4 — —
Other
The Company had a financial guaranty of $88 million at December 30,
2000. This guaranty represents a commitment by the Company to
guarantee the performance of certain municipal bonds issued in con-
nection with the Company’s headquarters building. Total payments
under this guaranty were $3.1 million and $0.6 million for 2000 and
1999, respectively. This guaranty expires in 2012. No amounts were
accrued in the balance sheet for any potential loss associated with this
guaranty at December 30, 2000, and January 1, 2000.
SEARS 2000 ANNUAL REPORT 37
Notes to Consolidated Financial Statements

NOTE 6 – SIGNIFICANT GROUP CONCENTRATIONS OF CREDIT RISK
The Company grants credit to customers throughout North America.
The five states and the respective receivable balances in which the
Company had the largest amount of managed credit card receivables
were as follows:
% of % of millions 2000 Balance 1999 Balance
California $2,846 10.5% $2,778 10.4%
Texas 2,113 7.8% 2,127 7.9%
Florida 1,926 7.1% 1,943 7.3%
New York 1,613 6.0% 1,592 5.9%
Pennsylvania 1,351 5.0% 1,364 5.1%
NOTE 7– EARNINGS PER SHARE
The following table sets forth the computations of basic and diluted
earnings per share:
millions, except per share data 2000 1999 1998
Net income available to
common shareholders(1) $1,343 $1,453 $1,048
Average common shares
outstanding 345.1 379.2 388.6
Earnings per share – basic $ 3.89 $ 3.83 $ 2.70
Dilutive effect of stock options 1.2 1.8 3.1
Average common and common
equivalent shares outstanding 346.3 381.0 391.7
Earnings per share – diluted $ 3.88 $ 3.81 $ 2.68
(1)Income available to common shareholders is the same for purposes of calculating basicand diluted EPS.
In each period, certain options were excluded from the compu-
tation of diluted earnings per share because they would have been
anti-dilutive. At December 30, 2000, January 1, 2000 and January 2,
1999, options to purchase 11.3, 11.9 and 5.2 million common shares at
prices ranging from $33 to $64, $40 to $64 and $52 to $64 per share
were excluded from the 2000, 1999 and 1998 calculations, respectively.
NOTE 8 – SHAREHOLDERS’ EQUITY
Dividend Payments
Under terms of indentures entered into in 1981 and thereafter, the
Company cannot take specified actions, including the declaration
of cash dividends, that would cause its unencumbered assets, as
defined, to fall below 150% of its liabilities, as defined. At Decem-
ber 30, 2000, approximately $4.2 billion could be paid in dividends to
shareholders under the most restrictive indentures.
Share Repurchase Program
The Company repurchased shares in 2000, 1999 and 1998 under share
repurchase programs approved by the Board of Directors. As of
December 30, 2000, $802 million was available for future repurchases
under a $1.0 billion share repurchase plan approved by the Board of
Directors on August 9, 2000.
Accumulated Other Comprehensive Loss
The following table displays the components of accumulated other
comprehensive loss:
2000 1999 1998
Currency translation
adjustments $(118) $(111) $(125)
Minimum pension
liability, net of tax (132) (195) (299)
Unrealized gain on securities
held, net of tax 1 19 —
Accumulated other
comprehensive loss $(249) $(287) $(424)
NOTE 9 – STOCK-BASED COMPENSATION
Stock Option Plans
Options to purchase common shares of the Company have been
granted to employees under various plans at prices equal to the fair
market value of the shares on the dates the options were granted.
Generally, options vest over a three- or four-year period and become
exercisable either in equal, annual installments over the vesting
period, or at the end of the vesting period. Options generally expire
in 10 years.
The Company measures compensation cost under APB No. 25,
and no compensation cost has been recognized for its fixed stock
option plans. Had compensation cost for the Company’s stock option
plans been determined using the fair value method under SFAS No.
123, the Company’s net income and earnings per share would have
been reduced to the pro forma amounts indicated below:
millions, except earnings per share 2000 1999 1998
Net income – as reported $1,343 $1,453 $1,048
Net income – pro forma 1,300 1,414 1,023
Earnings per share – basic
As reported 3.89 3.83 2.70
Pro forma 3.77 3.73 2.63
Earnings per share – diluted
As reported 3.88 3.81 2.68
Pro forma 3.75 3.71 2.61
38
Notes to Consolidated Financial Statements
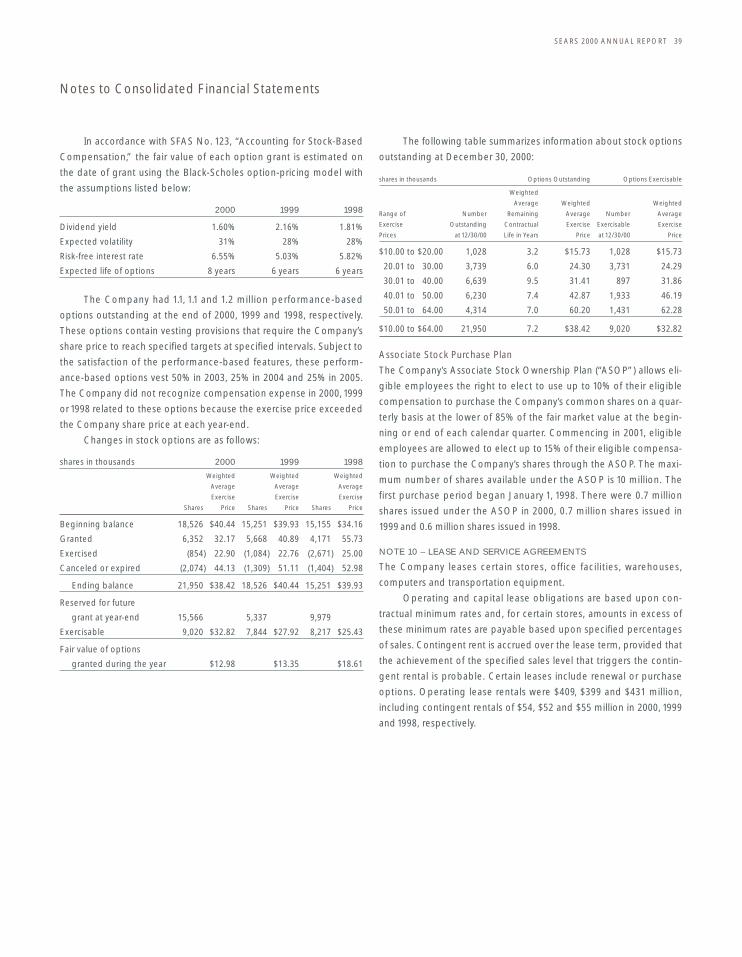
In accordance with SFAS No. 123, “Accounting for Stock-Based
Compensation,” the fair value of each option grant is estimated on
the date of grant using the Black-Scholes option-pricing model with
the assumptions listed below:
2000 1999 1998
Dividend yield 1.60% 2.16% 1.81%
Expected volatility 31% 28% 28%
Risk-free interest rate 6.55% 5.03% 5.82%
Expected life of options 8 years 6 years 6 years
The Company had 1.1, 1.1 and 1.2 million performance-based
options outstanding at the end of 2000, 1999 and 1998, respectively.
These options contain vesting provisions that require the Company’s
share price to reach specified targets at specified intervals. Subject to
the satisfaction of the performance-based features, these perform-
ance-based options vest 50% in 2003, 25% in 2004 and 25% in 2005.
The Company did not recognize compensation expense in 2000, 1999
or 1998 related to these options because the exercise price exceeded
the Company share price at each year-end.
Changes in stock options are as follows:
shares in thousands 2000 1999 1998
Weighted Weighted Weighted
Average Average Average
Exercise Exercise Exercise
Shares Price Shares Price Shares Price
Beginning balance 18,526 $40.44 15,251 $39.93 15,155 $34.16
Granted 6,352 32.17 5,668 40.89 4,171 55.73
Exercised (854) 22.90 (1,084) 22.76 (2,671) 25.00
Canceled or expired (2,074) 44.13 (1,309) 51.11 (1,404) 52.98
Ending balance 21,950 $38.42 18,526 $40.44 15,251 $39.93
Reserved for future
grant at year-end 15,566 5,337 9,979
Exercisable 9,020 $32.82 7,844 $27.92 8,217 $25.43
Fair value of options
granted during the year $12.98 $13.35 $18.61
The following table summarizes information about stock options
outstanding at December 30, 2000:
shares in thousands Options Outstanding Options Exercisable
Weighted
Average Weighted Weighted
Range of Number Remaining Average Number Average
Exercise Outstanding Contractual Exercise Exercisable Exercise
Prices at 12/30/00 Life in Years Price at 12/30/00 Price
$10.00 to $20.00 1,028 3.2 $15.73 1,028 $15.73
20.01 to 30.00 3,739 6.0 24.30 3,731 24.29
30.01 to 40.00 6,639 9.5 31.41 897 31.86
40.01 to 50.00 6,230 7.4 42.87 1,933 46.19
50.01 to 64.00 4,314 7.0 60.20 1,431 62.28
$10.00 to $64.00 21,950 7.2 $38.42 9,020 $32.82
Associate Stock Purchase Plan
The Company’s Associate Stock Ownership Plan (“ASOP”) allows eli-
gible employees the right to elect to use up to 10% of their eligible
compensation to purchase the Company’s common shares on a quar-
terly basis at the lower of 85% of the fair market value at the begin-
ning or end of each calendar quarter. Commencing in 2001, eligible
employees are allowed to elect up to 15% of their eligible compensa-
tion to purchase the Company’s shares through the ASOP. The maxi-
mum number of shares available under the ASOP is 10 million. The
first purchase period began January 1, 1998. There were 0.7 million
shares issued under the ASOP in 2000, 0.7 million shares issued in
1999 and 0.6 million shares issued in 1998.
NOTE 10 – LEASE AND SERVICE AGREEMENTS
The Company leases certain stores, office facilities, warehouses,
computers and transportation equipment.
Operating and capital lease obligations are based upon con-
tractual minimum rates and, for certain stores, amounts in excess of
these minimum rates are payable based upon specified percentages
of sales. Contingent rent is accrued over the lease term, provided that
the achievement of the specified sales level that triggers the contin-
gent rental is probable. Certain leases include renewal or purchase
options. Operating lease rentals were $409, $399 and $431 million,
including contingent rentals of $54, $52 and $55 million in 2000, 1999
and 1998, respectively.
SEARS 2000 ANNUAL REPORT 39
Notes to Consolidated Financial Statements

Minimum lease obligations, excluding taxes, insurance and
other expenses payable directly by the Company, for leases in effect
as of December 30, 2000, are as follows:
Capital Operatingmillions leases leases
2001 $ 65 $ 341
2002 61 291
2003 60 264
2004 59 229
2005 56 194
After 2005 691 1,105
Total minimum payments $992 $2,424
Less imputed interest 568
Present value of minimum lease payments $424
Less current maturities 21
Long-term obligations $403
The Company has committed to purchase data and voice net-
working and information processing services of at least $86 million
annually through 2004 from a third-party provider. Total expenses
incurred by the Company for these services during 2000, 1999 and 1998
were $305, $318 and $355 million, respectively. The Company may also
be responsible for certain store leases that have been assigned.
NOTE 11 – INCOME TAXES
Income before income taxes, minority interest and extraordinary loss
is as follows:
millions 2000 1999 1998
Domestic $2,073 $2,189 $1,704
Foreign 150 230 179
Total $2,223 $2,419 $1,883
The provision for income tax expense consists of:
millions 2000 1999 1998
Current
Federal $736 $414 $472
State 54 24 41
Foreign 15 110 74
Total 805 548 587
Deferred
Federal (4) 332 159
State 3 40 15
Foreign 27 (16) 5
Total 26 356 179
Income tax provision $831 $904 $766
A reconciliation of the statutory federal income tax rate to the
effective income tax rate is as follows:
2000 1999 1998
Statutory federal rate 35.0% 35.0% 35.0%
State income taxes,
net of federal tax benefit 1.7 1.7 1.9
Sale of Western Auto — — 2.3
Other 0.7 0.7 1.5
Effective income tax rate 37.4% 37.4% 40.7%
The major components of deferred tax assets and liabilities follow:
millions 2000 1999
Deferred tax assets:
Unearned service contract income $ 460 $ 429
Allowance for uncollectible accounts 303 320
State income taxes 161 149
Postretirement benefit liability 840 933
Minimum pension liability 73 108
Net operating loss carryforward 171 136
Other deferred tax assets 565 478
Total deferred tax assets 2,573 2,553
Deferred tax liabilities:
Property and equipment 434 421
Prepaid pension 90 53
LIFO 91 109
Deferred gain 295 279
Deferred revenue 55 137
Deferred swap termination loss 162 173
Other deferred tax liabilities 352 305
Total deferred tax liabilities 1,479 1,477
Net deferred taxes $1,094 $1,076
Management believes that the realization of the deferred tax
assets is more likely than not, based on the expectation that the
Company will generate the necessary taxable income in future peri-
ods and, accordingly, no valuation reserve has been provided. Tax
benefits from loss carryforwards will expire by 2006.
U.S. income and foreign withholding taxes were not provided
on certain unremitted earnings of international affiliates which the
Company considers to be permanent investments. The cumulative
amount of unremitted income for which income taxes have not been
provided totaled $475 million at December 30, 2000. If these earnings
were to be remitted, taxes of $80 million would be due.
Income taxes of $868, $327 and $366 million were paid in 2000,
1999 and 1998, respectively.
40
Notes to Consolidated Financial Statements

NOTE 12 – BENEFIT PLANS
Expenses for retirement and savings-related benefit plans were
as follows:
millions 2000 1999 1998
Sears 401(k) Savings Plan $ 29 $ 37 $ 31
Pension plans 116 89 88
Postretirement benefits (68) (46) (38)
Total $ 77 $ 80 $ 81
Sears 401(k) Savings Plan
Most domestic employees are eligible to become members of the
Sears 401(k) Savings Plan (the “Plan”). Under the terms of the Plan,
the Company matches a portion of employee contributions. In 1998,
the Company matching contribution was based on 6% of consoli-
dated income, as defined, for the participating companies and was
limited to 70% of eligible employee contributions. In 1999, the Plan
was changed and the Company match is now fixed at 70% of eligible
employee contributions. The Company’s matching contributions were
$72, $77 and $75 million in 2000, 1999 and 1998, respectively. In 1999
and 1998, matching contributions were made at the end of the cal-
endar year based on the year-end stock price. In 2000, the Plan was
changed and matching contributions are now made at the end of
each calendar quarter, based on the quarter-end stock price.
The Plan includes an Employee Stock Ownership Plan (“the
ESOP”) to prefund a portion of the Company’s anticipated contribu-
tion. The Company provided the ESOP with a loan that was used to
purchase Sears common shares in 1989. In June 1998, the ESOP refi-
nanced the loan and extended its maturity to 2024. The purchased
shares represent deferred compensation expense, which is presented
as a reduction of shareholders’ equity and recognized as expense
when the shares are allocated to employees to fund the Company
contribution. The per share cost of Sears common shares purchased
by the ESOP in 1989 was $15.27. The Company uses the ESOP shares
to fund the Company contribution, which thereby reduces expense.
The ESOP loan bears interest at 6.1% (9.2% prior to refinancing)
and is repaid from dividends on the ESOP shares and additional cash
payments provided by the Company. The Company has contributed
cash to the ESOP annually in the amount equal to the ESOP’s required
interest and principal payments on the loan, less dividends received
on the ESOP shares. The cash payments amounted to $118, $57 and
$24 million in 2000, 1999 and 1998, respectively. The 2000 cash pay-
ments reflect transitional Company contributions resulting from the
Plan change providing matching contributions on a quarterly basis.
The balance of the ESOP loan was $82 and $210 million at December
30, 2000 and January 1, 2000, respectively. Cash on hand in the ESOP
at December 30, 2000 was $3 million.
The reported expense is determined as follows:
millions 2000 1999 1998
Interest expense recognized
by ESOP $ 7 $ 13 $ 21
Less dividends on ESOP shares (16) (17) (19)
Cost of shares allocated to
employees and plan expenses 38 41 29
Sears 401(k) Savings Plan expense $ 29 $ 37 $ 31
In 2000, the ESOP allocated 2.5 million shares to employees. At
December 31, 2000, 19.6 million ESOP shares had been allocated with
6.3 million available for future allocation. All ESOP shares are consid-
ered outstanding in the calculation of earnings per share.
Retirement Benefit Plans
Certain domestic full-time and part-time employees are eligible to
participate in noncontributory defined benefit plans after meeting age
and service requirements. Substantially all Canadian employees are
eligible to participate in contributory defined benefit plans. Pension
benefits are based on length of service, compensation and, in certain
plans, Social Security or other benefits. Funding for the various plans
is determined using various actuarial cost methods. The Company
uses October 31 as the measurement date for determining pension
plan assets and obligations.
In addition to providing pension benefits, the Company pro-
vides certain medical and life insurance benefits for retired employ-
ees. Employees may become eligible for medical benefits if they retire
in accordance with the Company’s established retirement policy and
are continuously insured under the Company’s group medical plans
or other approved plans for 10 or more years immediately prior to
retirement. The Company shares the cost of the retiree medical ben-
efits with retirees based on years of service. Generally, the Company’s
share of these benefit costs will be capped at the Company contribu-
tion calculated during the first year of retirement. The Company’s
postretirement benefit plans are not funded. The Company has the
right to modify or terminate these plans.
SEARS 2000 ANNUAL REPORT 41
Notes to Consolidated Financial Statements

The change in benefit obligation, change in plan assets, funded
status and reconciliation to amounts recognized in the consolidated
balance sheets are as follows:
millions Pension Benefits Postretirement Benefits
2000 1999 2000 1999
Change in benefit obligation:
Beginning balance $2,830 $2,872 $ 934 $ 1,180
Benefits earned
during the period 83 95 5 5
Interest cost 216 192 58 74
Actuarial loss (gain) 53 (16) 59 (205)
Benefits paid (356) (337) (159) (123)
Foreign exchange impact (10) 22 (1) 2
Plan amendments — — — 1
Other 1 2 — —
Ending balance $2,817 $2,830 $ 896 $ 934
Change in plan assets at fair value:
Beginning balance $2,671 $2,560 $ — $ —
Actual return on plan assets 434 368 — —
Company contributions 47 50 159 123
Benefits paid (356) (337) (159) (123)
Foreign exchange impact (14) 28 — —
Other 7 2 — —
Ending balance $2,789 $2,671 $ — $ —
Funded status of the plan: $ (28) $ (159) $ (896) $ (934)
Unrecognized net loss (gain) 203 410 (490) (578)
Unrecognized prior
service benefit (17) (21) (565) (668)
Net amount recognized $ 158 $ 230 $(1,951) $(2,180)
Amounts recognized in the
balance sheet consist of:
Prepaid benefit cost $ 171 $ 171 $ — $ —
Accrued benefit liability (216) (244) (1,951) (2,180)
Accumulated other
comprehensive income 203 303 — —
Net amount recognized $ 158 $ 230 $(1,951) $(2,180)
Weighted average assumptions are as follows:
Pension Benefits Postretirement Benefits
2000 1999 1998 2000 1999 1998
Discount rate 8.25% 8.00% 7.25% 8.25% 8.00% 7.25%
Return on plan assets 9.50% 9.50% 9.50% NA NA NA
Rate of compensation
increases 4.00% 4.00% 4.00% NA NA NA
The components of net periodic benefit cost are as follows:
Pension Benefits Postretirement Benefits
millions 2000 1999 1998 2000 1999 1998
Components of net
periodic benefit cost:
Benefits earned
during the period $ 83 $ 95 $ 78 $ 5 $ 5 $ 7
Interest cost 216 192 184 58 74 84
Expected return
on plan assets (216) (228) (220) — — —
Amortization of
unrecognized net
prior service benefit (4) (3) (8) (102) (102) (103)
Amortization of
unrecognized
transitional asset — — (9) — — —
Recognized net loss (gain) 42 34 47 (29) (23) (26)
Other (5) (1) 16 — — —
Net periodic benefit cost $ 116 $ 89 $ 88 $ (68) $ (46) $ (38)
The projected benefit obligation, accumulated benefit obliga-
tion and fair value of plan assets for the pension plans with accumu-
lated benefit obligations in excess of plan assets were $2,197, $2,089
and $1,873 million, respectively, at December 30, 2000, and $2,236,
$2,110 and $1,866 million, respectively, at January 1, 2000. The provi-
sions of SFAS No. 87, “Employers’ Accounting for Pensions,” require
the recognition of a minimum pension liability for each defined bene-
fit plan for which the accumulated benefit obligation exceeds plan
assets. The minimum pension liability, net of tax, was $132 million at
December 30, 2000 and $195 million at January 1, 2000, and is
included in Accumulated Other Comprehensive Income.
For 2001 and beyond the weighted average health care cost
trend rates used in measuring the postretirement benefit expense are
5.0% for pre-65 retirees and 6.5% for post-65 retirees. A one percent-
age point change in the assumed health care cost trend rate would
have the following effects:
One Percentage One Percentagemillions Point Increase Point Decrease
Effect on total service
and interest cost components $ 2 $ (1)
Effect on postretirement
benefit obligation $16 $(14)
42
Notes to Consolidated Financial Statements

NOTE 13 – LEGAL PROCEEDINGS
The Company is subject to various legal and governmental proceed-
ings, many involving routine litigation incidental to the business.
Other matters contain allegations that are non-routine and involve
compensatory, punitive or treble damage claims in very large
amounts, as well as other types of relief. The consequences of these
matters are not presently determinable but, in the opinion of man-
agement of the Company after consulting with legal counsel, the ulti-
mate liability in excess of reserves currently recorded is not expected
to have a material effect on annual results of operations, financial
position, liquidity or capital resources of the Company.
NOTE 14 – SUMMARY OF SEGMENT DATA
As of December 30, 2000, the Company organized its business into
four domestic segments, which include the Company’s operations in
the United States and Puerto Rico, and one international segment.
The domestic segments are Retail, Services, Credit and Corporate.
There were no changes in the composition of the Company’s seg-
ments during the three years ended December 30, 2000.
The Retail segment primarily includes the operating results of
the Company’s Full-line Stores and Specialty Stores.
The Services segment includes the operating results of the
Company’s Home Services and Direct Response businesses. Home
Services includes extended warranty service contracts, product repair
services, major home improvement and other home services. Direct
Response businesses include insurance, clubs and service member-
ships, specialty catalogs and merchandise.
The Credit segment manages the Company’s portfolio of credit
card receivables arising primarily from purchases of merchandise and
services from domestic operations.
The Corporate segment includes activities that are of an overall
holding company nature primarily consisting of administrative activ-
ities and investment initiatives related to selling merchandise and
services online via Company web sites.
The International segment includes operations conducted by
Sears Canada Inc. a 54.5% owned subsidiary.
These businesses have been aggregated into their respective
reportable segments based on the management reporting structure
and their similar economic characteristics, customers and distribution
channels. No single product or service accounts for a significant
percentage of the Company’s consolidated revenue.
External revenues and expenses are allocated between the
applicable segments. For zero percent financing promotions in which
customers receive free financing, Retail reimburses Credit over the life
of the financing period. The cost is reported as selling expense by
Retail and an offsetting benefit is recognized by Credit.
The domestic segments participate in a centralized funding
program. Interest expense is allocated to the Credit segment based
on its funding requirements assuming a 9-to-1 debt to equity ratio.
Funding includes debt reflected on the balance sheet and investor
certificates related to credit card receivables sold through securitiza-
tions. Services is allocated interest income based on the after-tax cash
flow it generates through the sale of service contracts. The remainder
of net domestic interest expense is reported in the Retail segment.
The Company’s segments are evaluated on a pretax basis, and a
stand-alone income tax provision is not calculated for the individual
segments. The Company includes its deferred income taxes within the
Corporate segment. The other accounting policies of the segments
are substantially the same as those described in the Company’s sum-
mary of significant accounting policies footnote.
SEARS 2000 ANNUAL REPORT 43
Notes to Consolidated Financial Statements

millions Retail Services Credit International Corporate Consolidated
2000
Revenue $29,743 $2,798 $ 4,114 $4,282 $ — $40,937
Depreciation and amortization expense 650 61 16 60 39 826
Interest revenue — 60 — — — 60
Interest expense 94 — 1,101 113 — 1,308
Operating income (expense) 689 208 1,522 122 (354) 2,187
Equity in net income of investees
accounted for by the equity method 9 — — 8 — 17
Noncomparable items –
income (expense), pretax (150) (115) — — — (265)
Total assets 10,567 1,122 19,726 3,729 1,755 36,899
Capital expenditures 676 123 9 253 23 1,084
1999
Revenue $28,706 $2,799 $ 4,085 $3,894 $ — $39,484
Depreciation and amortization expense 659 57 14 76 42 848
Interest revenue — 59 — — — 59
Interest expense 111 — 1,116 100 — 1,327
Operating income (expense) 841 329 1,347 218 (322) 2,413
Equity in net income of investees
accounted for by the equity method (14) — — 9 — (5)
Noncomparable items –
income (expense), pretax (25) — — — (21) (46)
Total assets 10,130 1,087 20,622 3,324 1,791 36,954
Capital expenditures 711 81 39 143 59 1,033
1998
Revenue $29,459 $2,695 $ 4,369 $3,430 $ — $39,953
Depreciation and amortization expense 671 49 13 64 33 830
Interest revenue — 59 — — — 59
Interest expense 133 — 1,244 105 — 1,482
Operating income (expense) 382 375 1,144 165 (211) 1,855
Equity in net income of investees
accounted for by the equity method — — — 5 — 5
Noncomparable items –
income (expense), pretax (352) — 58 — (37) (331)
Total assets 10,046 943 21,605 2,816 2,265 37,675
Capital expenditures 934 50 18 91 119 1,212
Noncomparable items in 2000 were:Retail: Special charges for store closings and related staff reductionsServices: Impairment of investment in Sears Termite and Pest Control
Noncomparable items in 1999 were:Retail: Special charges for NTB store closings and related staff reductionsCorporate: Corporate staff reductions
Noncomparable items in 1998 were:Retail: Impairment loss related to the sales of Western Auto and HomelifeCredit: SFAS No. 125 accountingCorporate: Extraordinary loss on debt extinguishment
44
Notes to Consolidated Financial Statements
SEARS 2000 ANNUAL REPORT 45
Management’s Report
The financial statements, financial analyses and all other information
were prepared by management, which is responsible for their integrity
and objectivity. Management believes the financial statements, which
require the use of certain estimates and judgments, fairly and accu-
rately reflect the financial position and operating results of Sears,
Roebuck and Co. (“the Company”) in accordance with generally
accepted accounting principles. All financial information is consistent
with the financial statements.
Management maintains a system of internal controls that it
believes provides reasonable assurance that, in all material respects,
assets are maintained and accounted for in accordance with manage-
ment’s authorizations and transactions are recorded accurately in the
books and records. The concept of reasonable assurance is based on
the premise that the cost of internal controls should not exceed the
benefits derived. To assure the effectiveness of the internal control
system, the organizational structure provides for defined lines of
responsibility and delegation of authority. The Company’s formally
stated and communicated policies demand of employees high ethical
standards in their conduct of its business. These policies address,
among other things, potential conflicts of interest; compliance with all
domestic and foreign laws, including those related to financial disclo-
sure; and the confidentiality of proprietary information. As a further
enhancement of the above, the Company’s comprehensive internal
audit program is designed for continual evaluation of the adequacy
and effectiveness of its internal controls and measures adherence to
established policies and procedures.
Deloitte & Touche LLP, independent certified public account-
ants, have audited the financial statements of the Company, and their
report is presented below. Their audit also includes a study and eval-
uation of the Company’s control environment, accounting systems
and control procedures to the extent necessary to conclude that the
financial statements present fairly the Company’s financial position
and results of operations. The independent accountants and internal
auditors advise management of the results of their audits, and make
recommendations to improve the system of internal controls.
Management evaluates the audit recommendations and takes appro-
priate action.
The Audit Committee of the Board of Directors is comprised
entirely of directors who are not employees of the Company. The
committee reviews audit plans, internal control reports, financial
reports and related matters and meets regularly with the Company’s
management, internal auditors and independent accountants. The
independent accountants and the internal auditors advise the com-
mittee of any significant matters resulting from their audits and have
free access to the committee without management being present.
Alan J. Lacy
Chairman and Chief Executive Officer
Jeffrey N. Boyer
Senior Vice President and Chief Financial Officer
Glenn R. Richter
Vice President and Controller
To the Shareholders and Board of Directors Sears, Roebuck and Co.
We have audited the accompanying Consolidated Balance Sheets of
Sears, Roebuck and Co. as of December 30, 2000 and January 1, 2000,
and the related Consolidated Statements of Income, Shareholders’
Equity, and Cash Flows for each of the three years in the period ended
December 30, 2000. These financial statements are the responsibility
of the Company’s management. Our responsibility is to express an
opinion on these financial statements based on our audits.
We conducted our audits in accordance with auditing standards
generally accepted in the United States of America. Those standards
require that we plan and perform the audit to obtain reasonable
assurance about whether the financial statements are free of material
misstatement. An audit includes examining, on a test basis, evidence
supporting the amounts and disclosures in the financial statements.
An audit also includes assessing the accounting principles used and
significant estimates made by management, as well as evaluating the
overall financial statement presentation. We believe that our audits
provide a reasonable basis for our opinion.
In our opinion, such consolidated financial statements present
fairly, in all material respects, the financial position of Sears, Roebuck
and Co. as of December 30, 2000 and January 1, 2000, and the results
of its operations and its cash flows for each of the three years in the
period ended December 30, 2000, in conformity with accounting prin-
ciples generally accepted in the United States of America.
Deloitte & Touche LLP
Chicago, Illinois
February 12, 2001
Independent Auditors’ Report

millions, except per common share and shareholder data 2000 1999 1998 1997 1996
OPERATING RESULTS
Revenues $40,937 $39,484 $39,953 $39,837 $36,662
Costs and expenses 38,750 37,071 38,098 37,843 34,579
Operating income 2,187 2,413 1,855 1,994 2,083
Other income, net 36 6 28 144 30
Income before income taxes, minority interest
and extraordinary items 2,223 2,419 1,883 2,138 2,113
Income taxes 831 904 766 912 834
Income from continuing operations 1,343 1,453 1,072 1,188 1,271
Extraordinary loss — — 24 — —
Net income 1,343 1,453 1,048 1,188 1,271
FINANCIAL POSITION
Retained interest in transferred credit card receivables $ 3,105 $ 3,211 $ 4,349 $ 3,376 $ 2,260
Credit card receivables, net 17,317 18,033 17,972 19,843 19,303
Merchandise inventories 5,618 5,069 4,816 5,044 4,646
Property and equipment, net 6,653 6,450 6,380 6,414 5,878
Total assets 36,899 36,954 37,675 38,700 36,167
Short-term borrowings 4,280 2,989 4,624 5,208 3,533
Long-term debt 13,580 15,049 15,045 15,632 14,907
Total debt 17,860 18,038 19,669 20,840 18,440
Percent of debt to equity 264% 264% 324% 356% 373%
Shareholders’ equity $ 6,769 $ 6,839 $ 6,066 $ 5,862 $ 4,945
SHAREHOLDERS’ COMMON SHARE INVESTMENT
Book value per common share $ 20.31 $ 18.53 $ 15.82 $ 15.00 $ 12.63
Shareholders 209,101 220,749 233,494 235,336 243,986
Average common and equivalent shares outstanding 346 381 392 398 399
Earnings per common share – diluted
Income from continuing operations $ 3.88 $ 3.81 $ 2.74 $ 2.99 $ 3.12
Extraordinary loss — — .06 — —
Net income $ 3.88 $ 3.81 $ 2.68 $ 2.99 $ 3.12
Cash dividends declared per common share $ 0.92 $ 0.92 $ 0.92 $ 0.92 $ 0.92
Cash dividend payout percent 23.7% 24.1% 34.3% 30.8% 29.5%
Market price – per common share (high–low) 43.50–25.25 533⁄16–2611⁄16 65–391⁄16 651⁄4–383⁄4 537⁄8–381⁄4
Closing market price at December 31 34.75 303⁄8 421⁄2 451⁄4 46
Price/earnings ratio (high–low) 11–7 14–7 24–15 22–13 17–12
Certain prior year information has been reclassified to conform with current year presentation.
All years presented have been restated to reflect the implementation of SEC Staff Accounting Bulletin No. 101 for licensed business revenue.
46
Five-Year Summary of Consolidated Financial Data
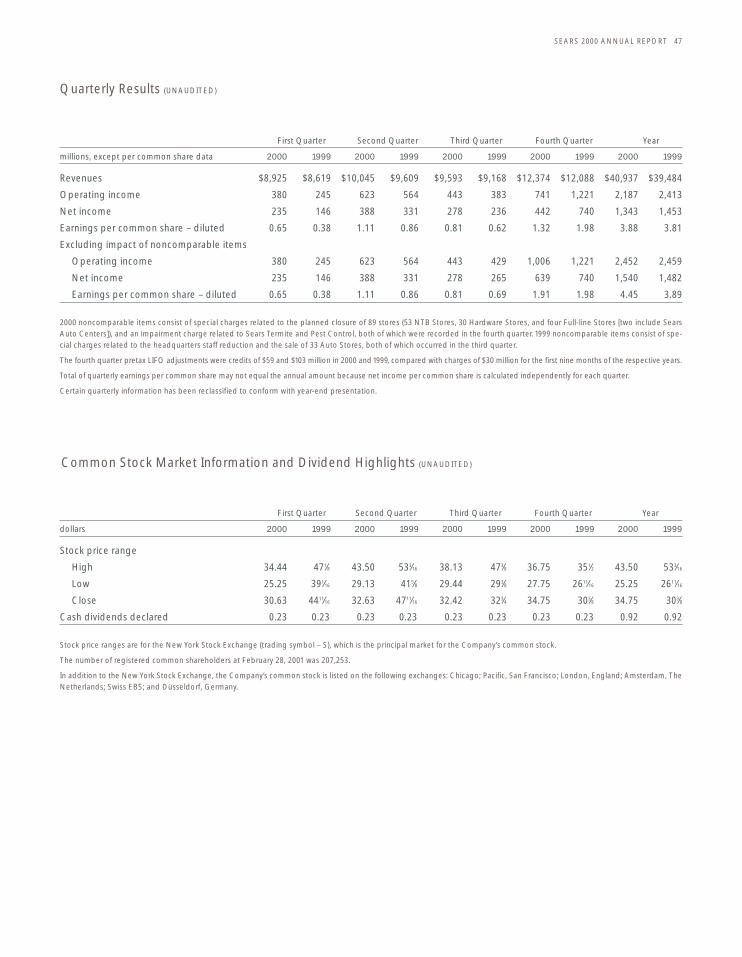
First Quarter Second Quarter Third Quarter Fourth Quarter Year
millions, except per common share data 2000 1999 2000 1999 2000 1999 2000 1999 2000 1999
Revenues $8,925 $8,619 $10,045 $9,609 $9,593 $9,168 $12,374 $12,088 $40,937 $39,484
Operating income 380 245 623 564 443 383 741 1,221 2,187 2,413
Net income 235 146 388 331 278 236 442 740 1,343 1,453
Earnings per common share – diluted 0.65 0.38 1.11 0.86 0.81 0.62 1.32 1.98 3.88 3.81
Excluding impact of noncomparable items
Operating income 380 245 623 564 443 429 1,006 1,221 2,452 2,459
Net income 235 146 388 331 278 265 639 740 1,540 1,482
Earnings per common share – diluted 0.65 0.38 1.11 0.86 0.81 0.69 1.91 1.98 4.45 3.89
2000 noncomparable items consist of special charges related to the planned closure of 89 stores (53 NTB Stores, 30 Hardware Stores, and four Full-line Stores [two include SearsAuto Centers]), and an impairment charge related to Sears Termite and Pest Control, both of which were recorded in the fourth quarter. 1999 noncomparable items consist of spe-cial charges related to the headquarters staff reduction and the sale of 33 Auto Stores, both of which occurred in the third quarter.
The fourth quarter pretax LIFO adjustments were credits of $59 and $103 million in 2000 and1999, compared with charges of $30 million for the first nine months of the respective years.
Total of quarterly earnings per common share may not equal the annual amount because net income per common share is calculated independently for each quarter.
Certain quarterly information has been reclassified to conform with year-end presentation.
SEARS 2000 ANNUAL REPORT 47
Quarterly Results (UNAUDITED)
First Quarter Second Quarter Third Quarter Fourth Quarter Year
dollars 2000 1999 2000 1999 2000 1999 2000 1999 2000 1999
Stock price range
High 34.44 471⁄8 43.50 533⁄16 38.13 473⁄8 36.75 351⁄2 43.50 533⁄16
Low 25.25 391⁄16 29.13 415⁄8 29.44 293⁄8 27.75 2611⁄16 25.25 2611⁄16
Close 30.63 4411⁄16 32.63 4711⁄16 32.42 323⁄4 34.75 303⁄8 34.75 303⁄8
Cash dividends declared 0.23 0.23 0.23 0.23 0.23 0.23 0.23 0.23 0.92 0.92
Stock price ranges are for the New York Stock Exchange (trading symbol – S), which is the principal market for the Company’s common stock.
The number of registered common shareholders at February 28, 2001 was 207,253.
In addition to the New York Stock Exchange, the Company’s common stock is listed on the following exchanges: Chicago; Pacific, San Francisco; London, England; Amsterdam, TheNetherlands; Swiss EBS; and Düsseldorf, Germany.
Common Stock Market Information and Dividend Highlights (UNAUDITED)

48
Executive Officers
Sears Canada
ALAN J. LACY
47, chairman of the board since December 2000. President and chief
executive officer since October 2000; president, Services, from 1999
to October 2000; president, Sears Credit 1997-1999 (additionally
chief financial officer, 1998-1999); executive vice president and chief
financial officer, 1995-1997 and senior vice president of Finance,
1994-1995 of the former Merchandise Group. Sears director since
2000. M.B.A., 1977 Emory University; B.S., 1975, Georgia Institute
of Technology.
JEFFREY N. BOYER
42, senior vice president and chief financial officer since 2000.
Chief financial officer 1999-2000; vice president and controller 1998-
1999; vice president, Finance-Full-line Stores, 1996-1998. The
Pillsbury, Co. – vice president, Business Development, 1995-1996.
Kraft General Foods – vice president of Finance-General Foods,
1994-1995. B.S., 1980, University of Illinois; C.P.A., 1980, Illinois.
JAMES R. CLIFFORD
55, president and chief operating officer, Full-line Stores, since 1998.
Sears Canada, Inc. – president and chief operating officer, 1996-1998;
senior vice president and chief financial officer, 1993-1996. M.B.A.,
1971, Seattle University; B.B.A., 1968, Cleveland State.
MARY E. CONWAY
52, president, Stores since 1999. President, Full-line Stores
1999; senior vice president, Northeast Region 1998-1999;
region general manager 1992-1998. 1982, Beaver College; 1980,
St. Joseph University.
E. RONALD CULP
53, senior vice president, Public Relations and Government Affairs
since 1999. Vice president, Public Relations and Communications,
1995-1999; divisional vice president, Public Affairs, 1993-1995.
Sara Lee Corporation – executive director, Corporate Relations,
1985-1993. B.S., 1970, Indiana State University.
LYLE G. HEIDEMANN
55, president, Hardlines since 1999. Senior vice president,
Appliances/Electronics, 1998-1999; vice president Appliances/
Electronics, 1997-1998; vice president, general merchandise
manager-Home Appliances, 1996-1997; divisional vice president
Lawn and Garden/Sporting Goods, 1992-1996. B.S., 1967, Northern
Illinois University.
KEVIN T. KELEGHAN
43, president, Credit Services since November 2000. Vice president,
Credit Card Products since 1999-2000; vice president, Risk
Management, 1996-1999. GE Capital – senior vice president, Risk
Management and Marketing, 1996. AT&T Universal Card Services –
senior vice president, Risk Management and Operations, 1990-1995.
M.B.A., 1981, Hofstra University; B.S. 1979, State University of New York.
ANASTASIA D. KELLY
51, executive vice president and general counsel since 1999. Executive
vice president, general counsel and secretary, March 1999 to
September 1999. Fannie Mae – senior vice president, general counsel
and secretary, 1996-1999; senior vice president and general counsel,
1996 and senior vice president, deputy general counsel, 1995-1996.
Partner, Wilmer, Cutler & Pickering, 1990-1995. J.D., 1981, George
Washington University National Law Center; B.A., 1971, Trinity College.
GREG A. LEE
51, senior vice president, Human Resources since January 2001.
Whirlpool Corporation – senior vice president, Human Resources,
1998-2000. St. Paul Companies – senior vice president, Human
Resources, 1992-1998. B.S., 1971, Southern Illinois University.
GERALD N. MILLER
53, senior vice president and chief information officer since 1998.
Vice president of Logistics Information Systems, 1995-1998; senior
systems, director 1994-1995. Bergen Brunswig Corporation - vice
president of Information Technology, 1987-1994. B.S., Finance, 1970,
Long Beach State.
WILLIAM G. PAGONIS
59, executive vice president, Logistics since 1994. Senior vice presi-
dent, Logistics, 1993-1994. Retired Lieutenant General, U.S. Army.
M.B.A., 1970, and B.S., 1964, Pennsylvania State University.
DAVID W. SELBY
44, senior vice president, Marketing since January 2001. Senior vice
president, Retail Marketing, 1998-2001; vice president, Marketing
Services, 1997-1998. Leo Burnett Company – senior vice president,
account director, 1993-1997. M.M., 1985, Northwestern University,
Kellogg Graduate School of Management; B.A., 1978, Amherst College.
MICHAEL J. TOWER
42, senior vice president, Strategy since February 2001. President,
Home Improvement Services, 2000-2001; president, Home Improve-
ment Products 1999-2000; vice president, Home Improvement
Services, 1998-1999; vice president, Corporate Strategy, 1997-1998.
A.T. Kearney – partner and vice president, 1994-1997; principal,
1991-1994. M.M., 1987, Northwestern University, Kellogg Graduate
School of Management; B.B.A., 1981, University of Notre Dame.
MARK A. COHEN
53, chairman and chief executive officer, Sears Canada since January
2001. President, Softlines and chief marketing officer, 1999-2001,
executive vice president, Marketing, 1999; senior vice president,
1998-1999. Bradlees – chairman and chief executive officer, 1994-1997.
Lazarus – chairman and chief executive officer, 1989-1994 M.B.A.,
1971 and B.S. 1969, Engineering, Columbia University.

SEARS 2000 ANNUAL REPORT 49
Board of Directors
ALAN J. LACY 3*
47, chairman of the board since December 2000; president and chief
executive officer since October 2000; president, Services, from 1999
to October 2000; president, Sears Credit 1997-1999 (additionally
chief financial officer from 1998 to 1999); executive vice president and
chief financial officer from 1995 to 1997 and senior vice president of
Finance from 1994 to 1995 of the former Merchandise Group. Sears
director since 2000.
HALL ADAMS, JR. 1,4
67, chairman and chief executive officer of Leo Burnett Company,
Inc. from 1987 until his retirement in 1992. Director, Moody’s
Corporation and McDonald’s Corporation. Sears director since 1993.
BRENDA C. BARNES 2*,3,4
47, interim president, Starwood Hotels and Resorts from November
1999 to March 2000; former president and chief executive officer of
PepsiCola North America from 1996 to 1998; chief operating officer
of PepsiCola North America, 1994-1996. Director, Avon Products, Inc.,
Lucas Digital Ltd. and Lucas Arts Entertainment Company, The New
York Times Company and TyCom, Ltd. Sears director since 1997.
WARREN L. BATTS 1*,3,4
68, chairman and chief executive officer of Tupperware Corporation
from 1996 to 1997; chairman of Premark International, Inc. from
1996 to 1997; chairman and chief executive officer of Premark
International, Inc. from 1986 to 1996. Director, The Allstate
Corporation, Cooper Industries, Inc. and Sprint Corporation.
Sears director since 1986.
JAMES R. CANTALUPO 2
57, vice chairman and president of McDonald’s Corporation since
1999; chairman and chief executive officer of McDonald’s
International from 1998 to 1999; president and chief executive officer
of McDonald’s International from 1991 to 1998. Director, McDonald’s
Corporation, Rohm & Haas Co., the Chicago Council of Foreign
Relations and the Mid-America Committee. Sears director since 2000.
W. JAMES FARRELL 1,2
58, chairman and chief executive officer of Illinois Tool Works, Inc.
since 1996; chief executive officer, 1995; executive vice president
from 1983 to 1994. Director, Illinois Tool Works, Inc., The Allstate
Corporation, The Federal Reserve Bank of Chicago and The Quaker
Oats Company. Sears director since 1999.
MICHAEL A. MILES 2,3,4*
61, chairman and chief executive officer of Philip Morris Companies
Inc. from 1991 to 1994. Director, The Allstate Corporation, AMR
Corporation, AOL Time Warner, Community Health Systems,
Dell Computer Corporation, Exult, Inc., The Interpublic Group of
Companies and Morgan Stanley, Dean Witter & Co. Sears director
since 1992.
HUGH B. PRICE 1,4
59, president and chief executive officer of the National Urban
League since 1994; vice president of Rockefeller Foundation from
1988 to 1994. Director, Educational Testing Service, Mayo Clinic
Foundation, Metropolitan Life Insurance Company and Verizon
Communications Inc. Sears director since 1997.
DOROTHY A. TERRELL 1,2
55, president, services group and senior vice president, worldwide
sales of Natural MicroSystems Corporation since 1998; president
of Sun Express, Inc. and corporate executive officer of Sun
Microsystems, Inc. from 1991 to 1997. Director, General Mills, Inc. and
Herman Miller, Inc. Sears director since 1995.
Committee Membership:
1 Audit Committee2 Compensation Committee3 Executive Committee4 Nominating Committee* Chairman of Committee

50
Company Information
HEADQUARTERS
Sears, Roebuck and Co.
3333 Beverly Road
Hoffman Estates, Illinois 60179
847.286.2500
ANNUAL MEETING
The Annual Meeting of Shareholders
of Sears, Roebuck and Co. will be held
at the company’s headquarters at
3333 Beverly Road, Hoffman Estates,
Illinois, on May 10, 2001 at 10:00 a.m.
INVESTOR INFORMATION
Financial analysts and investment
professionals should direct inquiries to:
Investor Relations 847.286.7385.
SEARS DIRECT PURCHASE
STOCK PLAN INFORMATION
Prospective shareholders, and
shareholders whose shares are
held by a broker or bank, should
call 1.888.SEARS.88 (1.888.732.7788).
CUSTOMER RELATIONS
1.800.549.4505
HOME PAGE
This annual report and other financial
information can be found online at:
www.sears.com
FINANCIAL/SHAREHOLDER
INFORMATION
You may call Sears toll-free at
1.800.SEARS.80 (1.800.732.7780)
for any of the following:
Most recent stock price information
Copies of the company’s financial reports
Audiocassette tape of the 2000
Annual Report, for the visually impaired
Form 10-K Annual Report filed with the
Securities and Exchange Commission
Transfer agent/shareholder records
For information or assistance regarding
individual stock records, investment
plan accounts, dividend checks or stock
certificates, please call the toll-free
number above, or write our registrar:
Sears, Roebuck and Co. c/o First Chicago Trust Co. of New York
a division of EquiServe
P.O. Box 2552
Jersey City, New Jersey 07303-2552
First Chicago web site:
http://www.equiserve.com
E-mail address:
TDD for hearing impaired:
201.222.4955
Please use the following address
for items sent by courier:
First Chicago Trust Co. of New York
a division of EquiServe
14 Wall Street
Mail Suite 4505, 8th Floor
New York, New York 10005
For items delivered in person:
STARS, Inc.
100 William St., Galleria
New York, New York 10038
The following trademarks and service marks
appearing in this 2000 Annual Report are the
property of Sears, Roebuck and Co. :
Apostrophe®, Baby Me®, Circle of Beauty®,
Craftsman®, CrossroadsTM, DieHard®, Fieldmaster®,
The Great Indoors®, Kenmore®, Kenmore Elite®,
KidVantage®, NTB National Tire & Battery®, Orchard
Supply Hardware SM, Sears CardSM, Sears HardwareSM,
Sears Gold MasterCard, Sears Good Life AllianceSM,
Sears Premier CardSM, sears.comSM, TKS Basics®,
Tool TerritorySM, WeatherBeater®, Wish Book®,
1-800-4-MY-HOME®
© Sears, Roebuck and Co. 2001
Printed on recycled paper
■
■
■
■
■

$25off
0%financing
$5off
10% off
Destination: Sears
To thank you, our valued shareholder, get 0% finance charge for one
full year on an installed Trane® and Kenmore® high efficiency cen-
tral heating or cooling system when you use your Sears card. Call
1-800-4-MY-HOME® for a free in-home estimate from a Sears heat-
ing and cooling expert. Not valid in Puerto Rico. (SEE BACK FOR DETAILS)
Destination: Sears
To thank you, our valued shareholder, take $5 off any regular,
sale or clearance priced purchase when you use your Sears card.
(SEE BACK FOR DETAILS)
Destination: Sears
To thank you, our valued shareholder, take 10% off the regular,
sale or clearance price of any clothing, accessory, shoe or home
fashions purchase. (SEE BACK FOR DETAILS)
Destination: Sears
To thank you, our valued shareholder, take $25 off any regular or
sale priced home appliance or electronics purchase of $250 or
more. (SEE BACK FOR DETAILS)

COUPON GOOD THROUGH NOVEMBER 30, 2001. Savings off regular and sale prices apply to merchandise only. Not valid on outlet store purchases; catalog orders; sears.com;
Exceptional Values; Bose; Maytag Neptune and Gemini; and maintenance agreements. Void if copied or transferred and where
prohibited by law. Any other use constitutes fraud. Not valid with other coupons or offers. One coupon per purchase. Cash value
1 ⁄ 20 cent. © 2001 Sears, Roebuck and Co. Satisfaction Guaranteed or Your Money Back. Sales Associate: if unable to scan, ring as
miscellaneous reduction. Please collect this coupon.
COUPON GOOD THROUGH NOVEMBER 30, 2001. Savings off regular, sale and clearance prices apply to merchandise only and apply to all Sears credit products except preferred
MasterCard by Sears. Not valid on outlet store purchases; catalog orders; sears.com; Exceptional Values; Bose; Maytag Gemini
and Neptune; hearing aids; cosmetics; fragrances; installed home improvements and maintenance agreements; Homelife Furniture;
BF Goodrich AT/KO tires; Automotive Services; Calphalon; J.A. Henckels; Stearns & Foster; Sealy Posturpedic Crown Jewel mat-
tresses; Optical Exam Fees; Licensed Businesses. Not valid with other coupons or offers. One coupon per purchase. Cash value
1 ⁄ 20 cent. Void if copied or transferred and where prohibited by law. Any other use constitutes fraud. Sales Associate: if unable to
scan, ring as miscellaneous reduction. Please collect this coupon. ©2001 Sears, Roebuck and Co. Satisfaction Guaranteed or Your
Money Back. Sears card accounts are issued by Sears National Bank, or Sears, Roebuck de Puerto Rico Inc.
Don’t have a Sears card? Apply in-store with Rapid ChoiceSM, or online at sears.com.
COUPON GOOD THROUGH NOVEMBER 30, 2001. Present this coupon at time of purchase and receive 0% financing for one full year on selected 13-18 SEER central cooling systems and
90% efficiency central heating systems. Annual Percentage Rate (APR) on Sears cards up to 25.99%. Rates may vary. Minimum monthly
finance charge up to $1, if any finance charge is due. Regular credit terms apply after the 0% period. 0% not applicable to existing bal-
ances. Sears card accounts are issued by Sears National Bank, or Sears, Roebuck de Puerto Rico Inc. Not valid with any other coupons
or offers. One coupon per transaction. Void where prohibited or if copied. Cash value 1/20 cent. © 2001 Sears, Roebuck and Co.
Satisfaction Guaranteed or Your Money Back. The following licenses are held by or on behalf of Sears: AK (Gen. Contr. - Exc. Res.
#675); AR (HVAC #145708); AZ (Res. HVAC #13509 C-39R); CA (HVAC #025455 C-20); CT (HVAC #308530); FL (HVAC #CAC057299);
GA (HVAC REG. CR-108134); HI (Classified Spec. #C-4285 C-68LA); KY (HVAC #M03912); LA (Mech./Spec. Contract. #5526); MD (MHIC
#32117; James Myzick, HVAC #3942); NV (Plum. & Heating #0005543 C-1); Rockland County, NY licensed subcontractors, OR (Gen.
Contr. #0001051); TX (HVAC Lic. Nos. #TACLB016247E, 019160E, 009563C, 009584E, 002235C, 001268C, 009755E, 013523C); VA (Gen.
Contr. #2705 047202); WA (Gen. Contr. #SEARSR-372NT); WV (Gen. Bldg. Spec. #WV008529). Service performed by Sears associates.
Installation performed by Sears-authorized licensed subcontractors; additional Sears License information available upon request.
Service not available in all areas.
COUPON GOOD THROUGH NOVEMBER 30, 2001. Savings apply to merchandise only. Not valid on outlet store purchases; catalog orders; sears.com; Exceptional Values; cosmetics;
fragrances; Calphalon; J.A. Henckels; Stearns & Foster; Sealy Posturpedic Crown Jewel mattresses. Void if copied or transferred
and where prohibited by law. Any other use constitutes fraud. Not valid with other coupons or offers. One coupon per purchase.
Cash value 1/20 cent. © 2001 Sears, Roebuck and Co. Satisfaction Guaranteed or Your Money Back. Sales Associate: if unable to
scan, ring as miscellaneous reduction. Please collect this coupon.
R5872783067%10
R5872783069$500
R5872783068$2500


SEARS, ROEBUCK AND CO.
3333 BEVERLY ROAD
HOFFMAN ESTATES, ILLINOIS 60179www.sears.com