Embed Size (px)
Citation preview
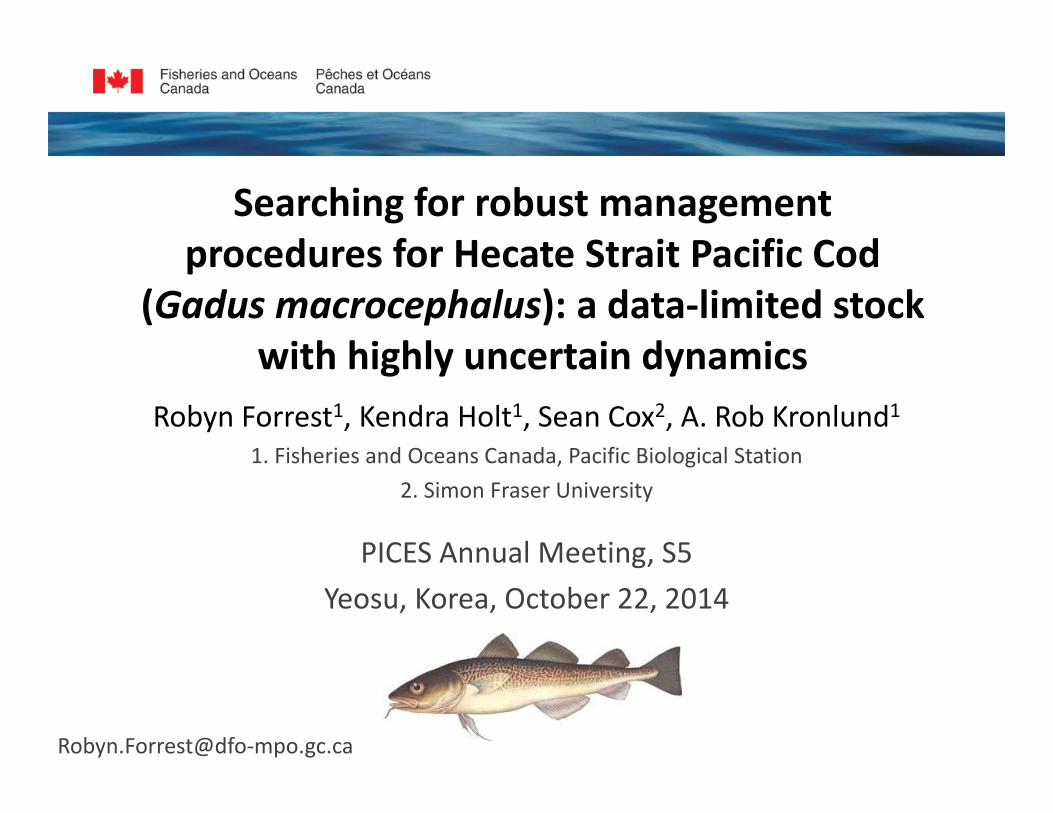
Searching for robust management procedures for Hecate Strait Pacific Cod
(Gadus macrocephalus): a data‐limited stock with highly uncertain dynamics
Robyn Forrest1, Kendra Holt1, Sean Cox2, A. Rob Kronlund11. Fisheries and Oceans Canada, Pacific Biological Station
2. Simon Fraser University
PICES Annual Meeting, S5Yeosu, Korea, October 22, 2014
Robyn.Forrest@dfo‐mpo.gc.ca
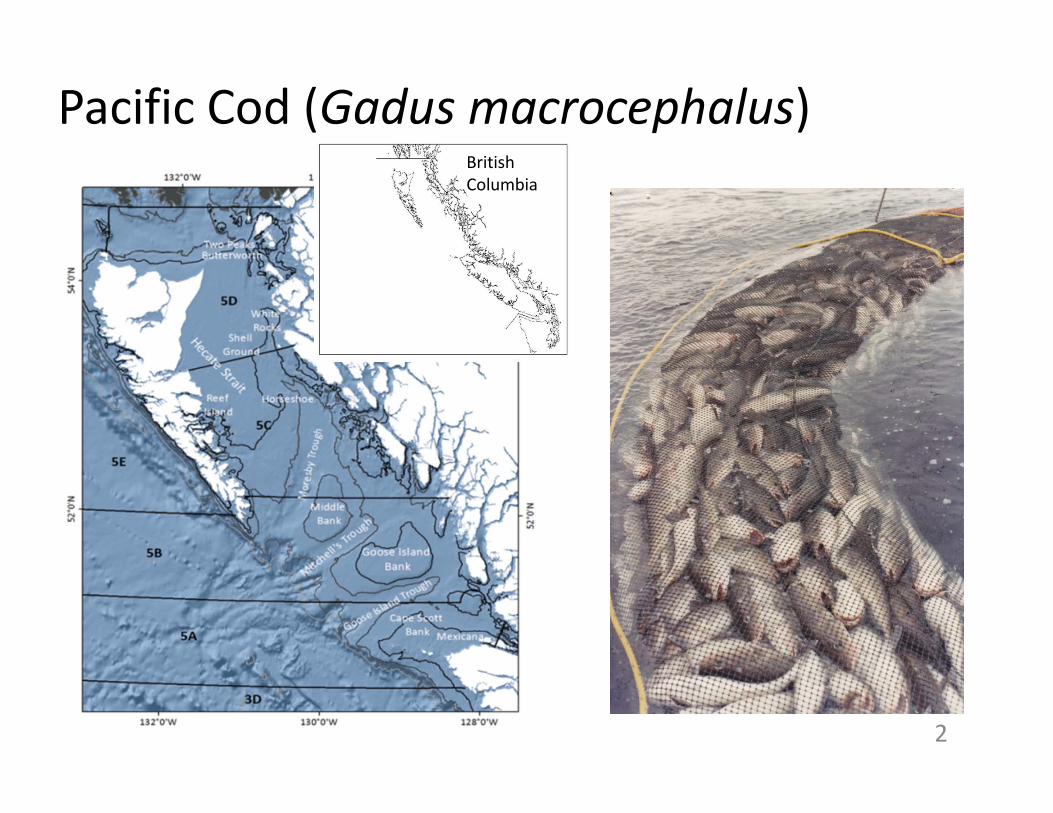
Pacific Cod (Gadus macrocephalus)
2
British Columbia
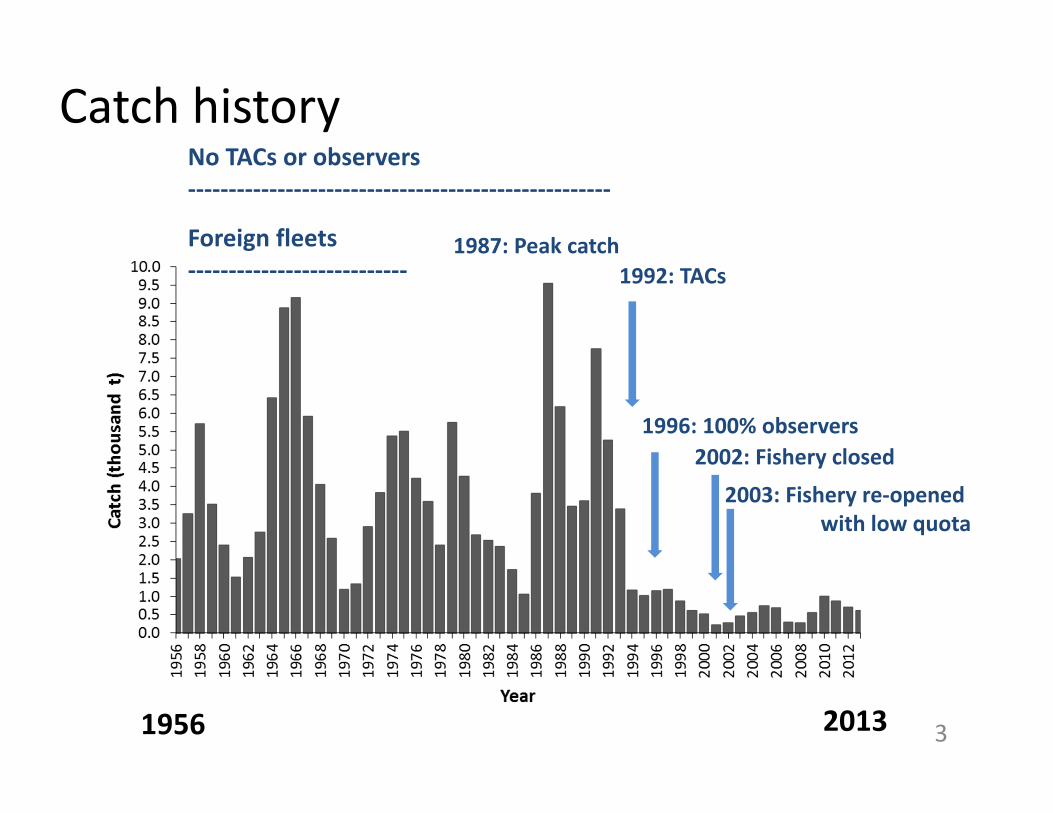
Catch history
1992: TACs
No TACs or observers‐‐‐‐‐‐‐‐‐‐‐‐‐‐‐‐‐‐‐‐‐‐‐‐‐‐‐‐‐‐‐‐‐‐‐‐‐‐‐‐‐‐‐‐‐‐‐‐‐‐‐‐
Foreign fleets‐‐‐‐‐‐‐‐‐‐‐‐‐‐‐‐‐‐‐‐‐‐‐‐‐‐‐
1956 2013 3
1996: 100% observers2002: Fishery closed
2003: Fishery re‐opened with low quota
1987: Peak catch
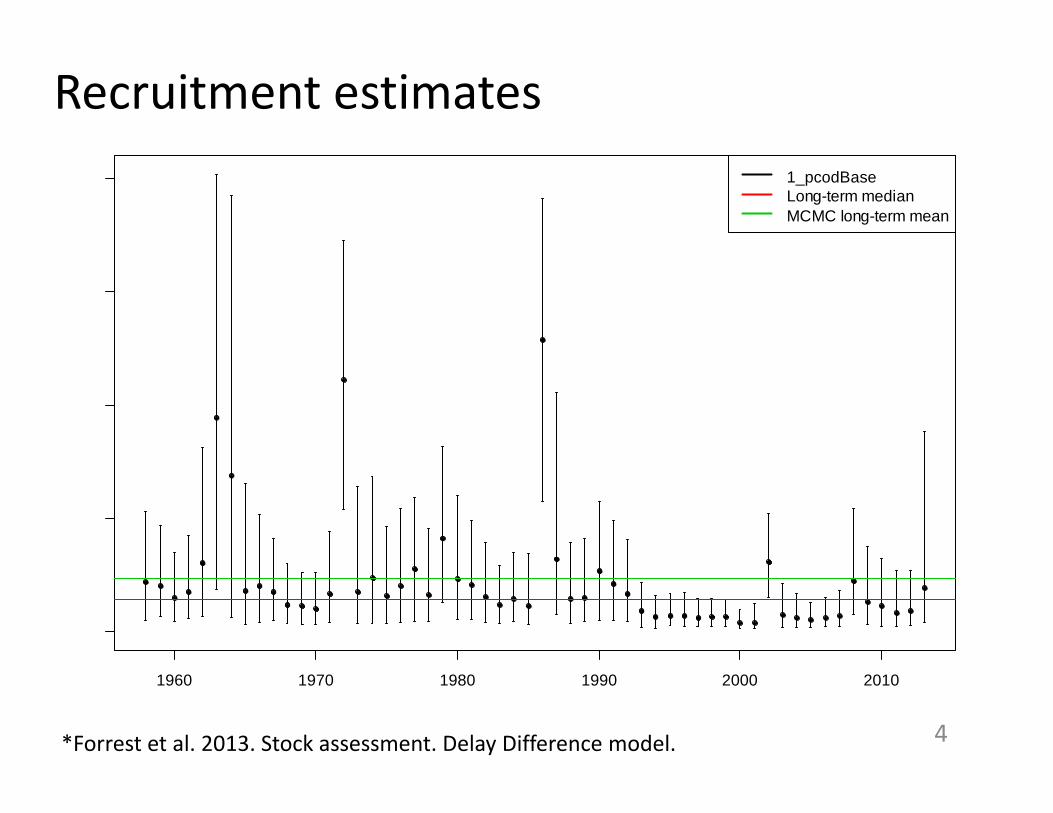
Recruitment estimates
4
1960 1970 1980 1990 2000 2010
1_pcodBaseLong-term medianMCMC long-term mean
*Forrest et al. 2013. Stock assessment. Delay Difference model.
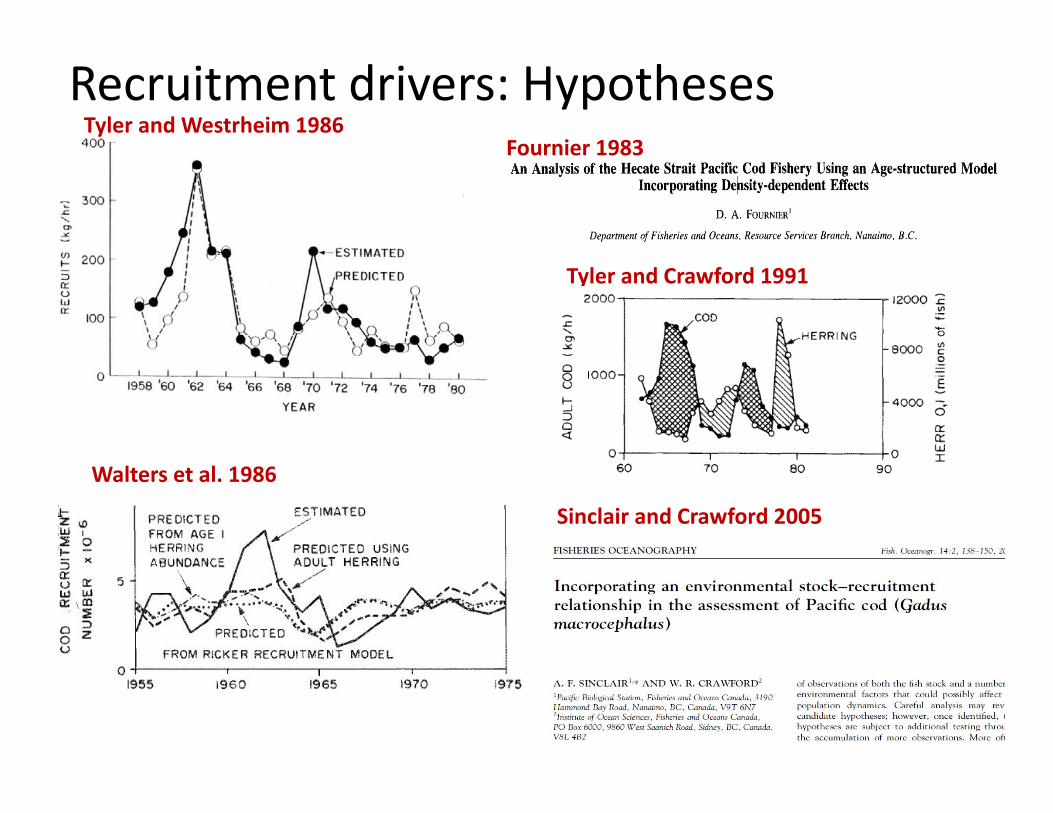
Recruitment drivers: Hypotheses
5
Tyler and Westrheim 1986
Walters et al. 1986
Fournier 1983
Sinclair and Crawford 2005
Tyler and Crawford 1991
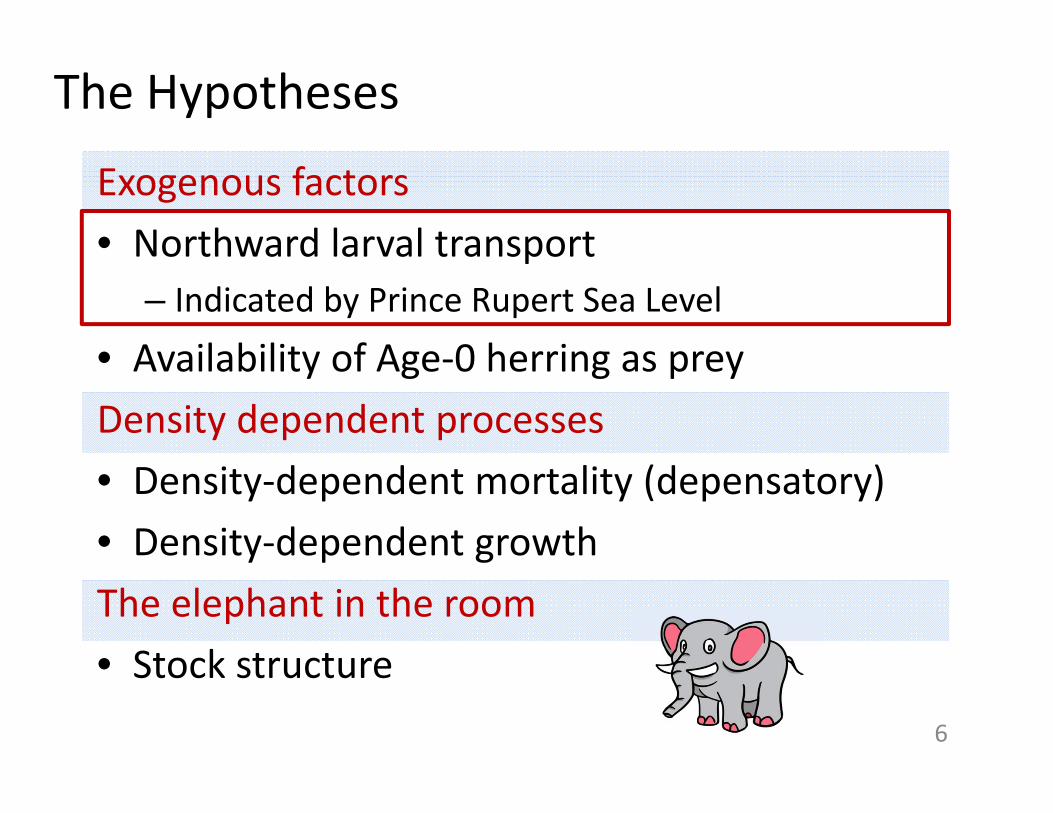
Exogenous factors• Northward larval transport
– Indicated by Prince Rupert Sea Level
• Availability of Age‐0 herring as prey Density dependent processes• Density‐dependent mortality (depensatory)• Density‐dependent growthThe elephant in the room• Stock structure
The Hypotheses
6
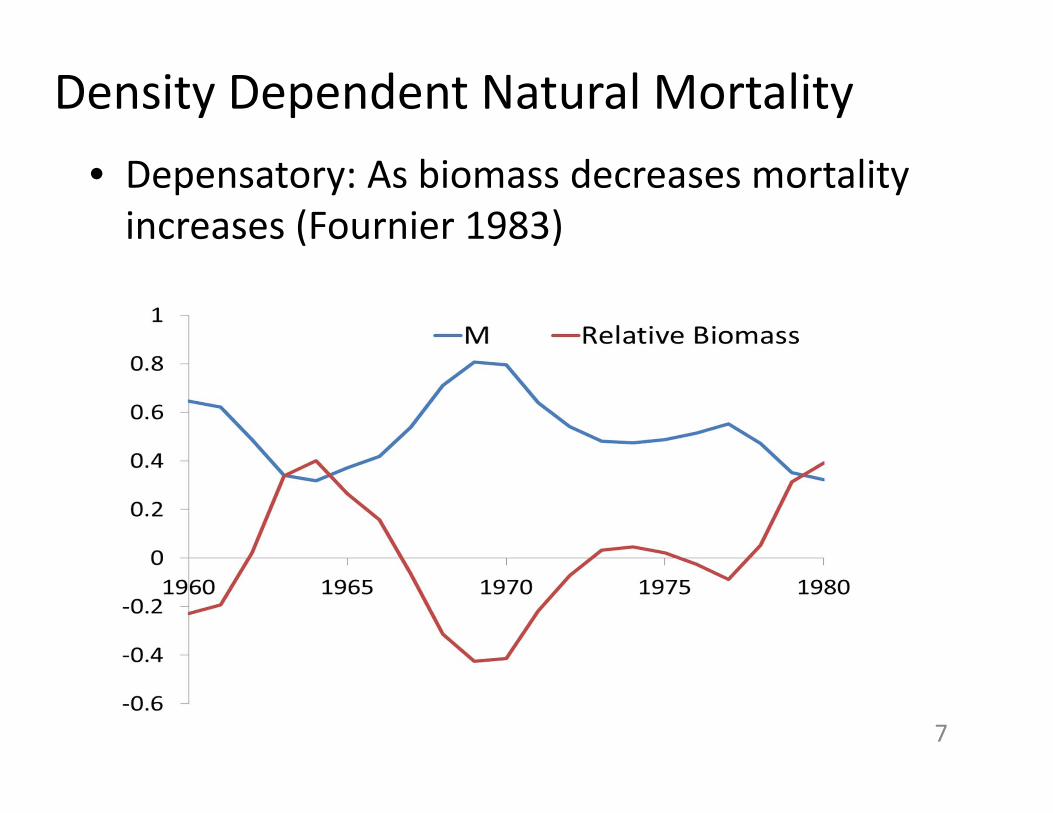
Density Dependent Natural Mortality• Depensatory: As biomass decreases mortality increases (Fournier 1983)
7
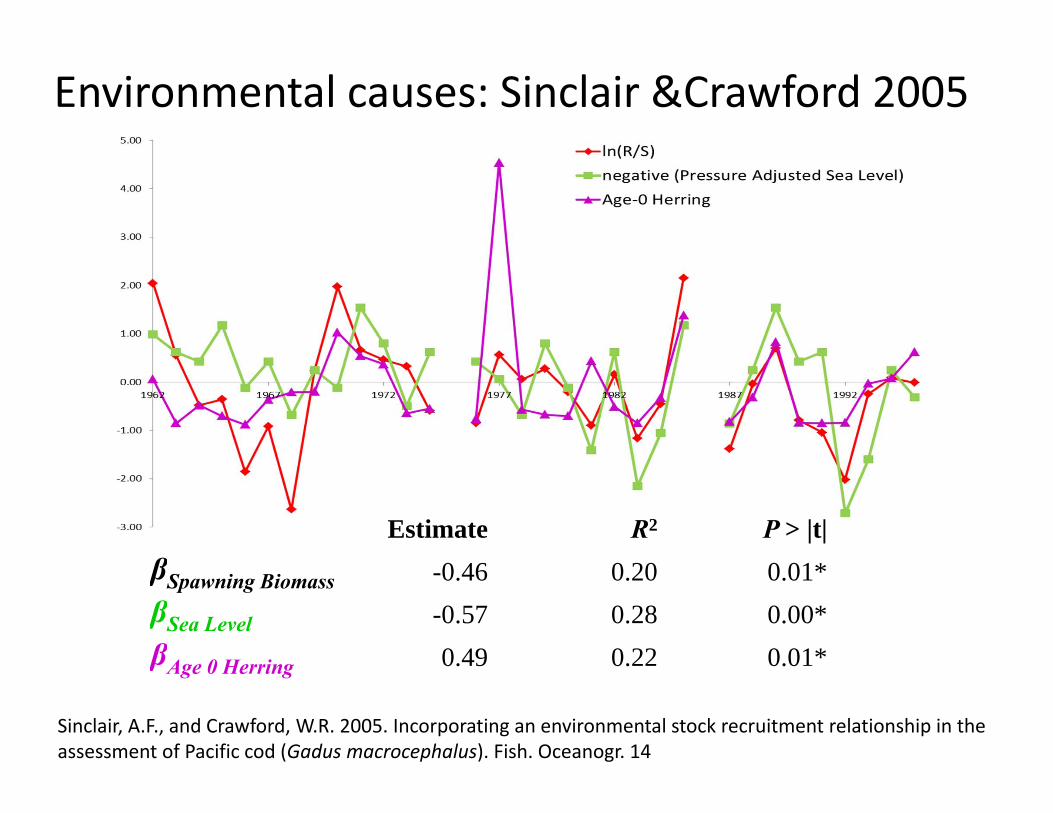
Environmental causes: Sinclair &Crawford 2005
Sinclair, A.F., and Crawford, W.R. 2005. Incorporating an environmental stock recruitment relationship in the assessment of Pacific cod (Gadus macrocephalus). Fish. Oceanogr. 14
R ecru its t S Lt tR e e Eq 1:
Estimate R2 P > |t|βSpawning Biomass -0.46 0.20 0.01*βSea Level -0.57 0.28 0.00*βAge 0 Herring 0.49 0.22 0.01*
Questions
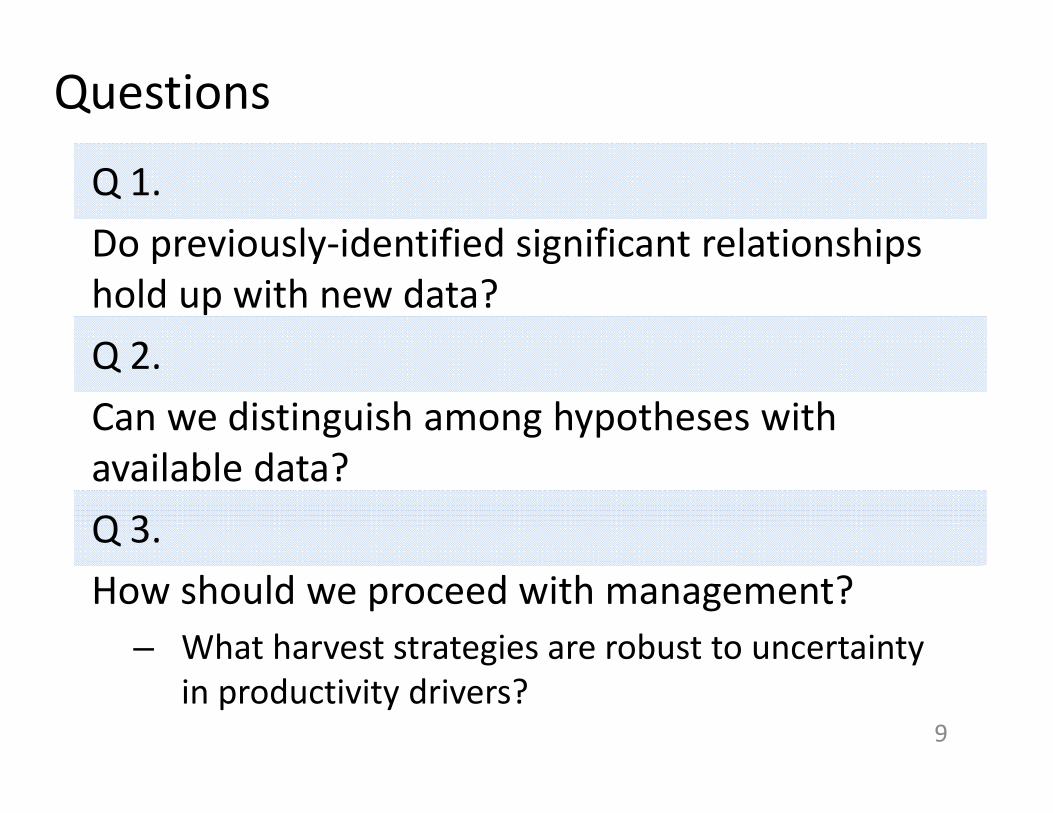
Q 1. Do previously‐identified significant relationships hold up with new data?Q 2. Can we distinguish among hypotheses with available data? Q 3. How should we proceed with management?
– What harvest strategies are robust to uncertainty in productivity drivers?
9
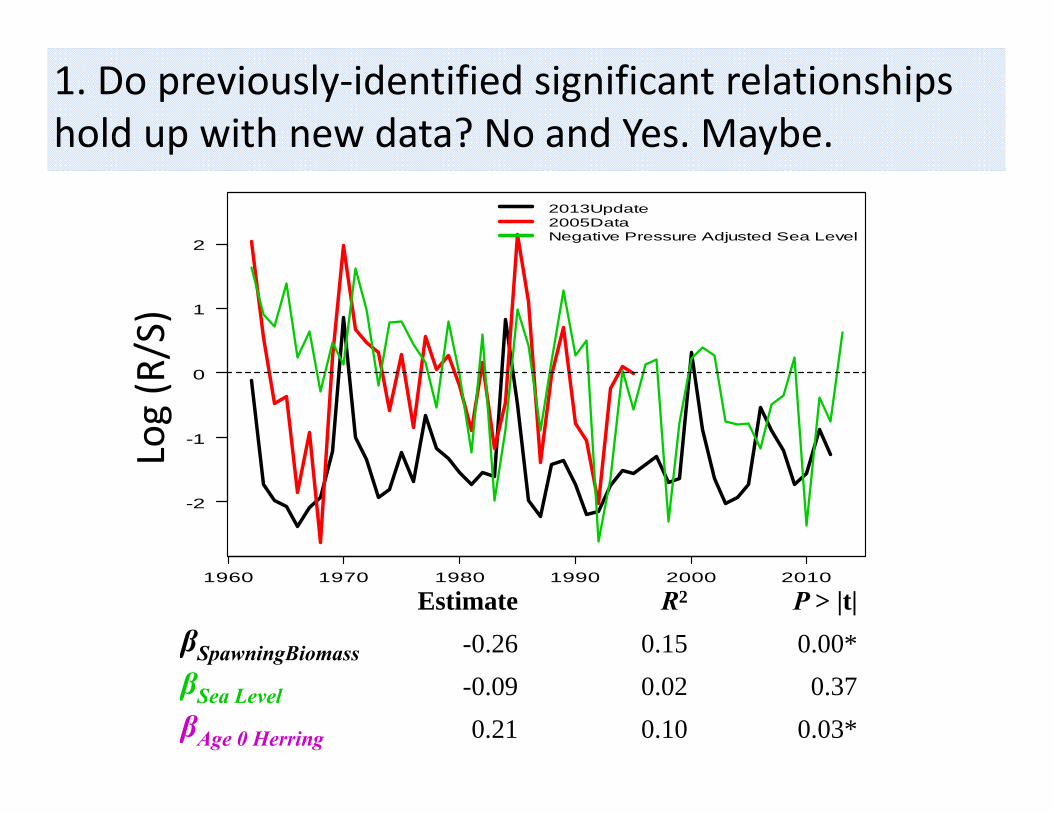
1. Do previously‐identified significant relationships hold up with new data? No and Yes. Maybe.
Estimate R2 P > |t|βSpawningBiomass -0.26 0.15 0.00*βSea Level -0.09 0.02 0.37βAge 0 Herring 0.21 0.10 0.03*
1960 1970 1980 1990 2000 2010
-2
-1
0
1
2
ln(R
/S) or
-PASL
2013Update2005DataNegative Pressure Adjusted Sea Level
Log (R/S)
Recruits and Spawning Biomass are not data
• Not a simple case of an environmental correlation breaking down over time
• The dependent variable ln(Recruits/Spawner) is a model output– Model estimates of abundance and productivity are highly dependent on structural model assumptions (e.g., selectivity)
– Past estimates of abundance and productivity are often revised once new data are added
– Estimates of recruitment since ~1996 influenced by large changes in management and fishing behaviour
11
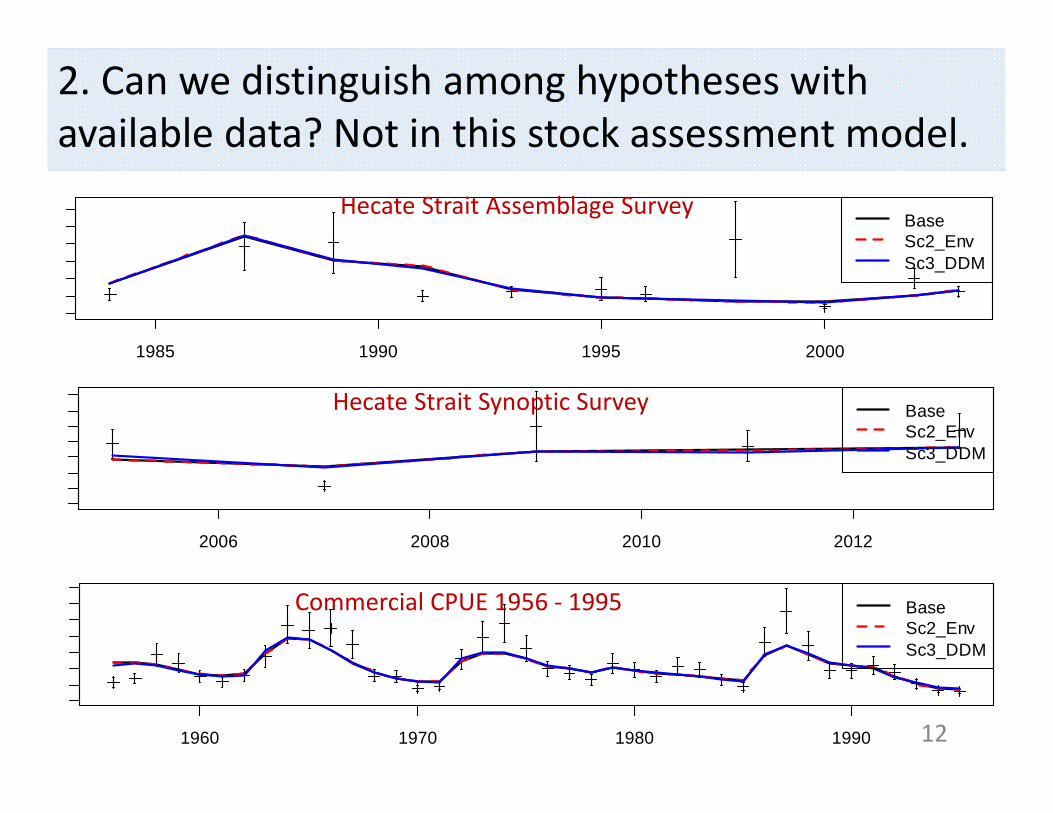
2. Can we distinguish among hypotheses with available data? Not in this stock assessment model.
12
1985 1990 1995 2000
BaseSc2_EnvSc3_DDM
2006 2008 2010 2012
BaseSc2_EnvSc3_DDM
1960 1970 1980 1990
BaseSc2_EnvSc3_DDM
Hecate Strait Assemblage Survey
Hecate Strait Synoptic Survey
Commercial CPUE 1956 ‐ 1995
3. How should we proceed with management?
• What harvest strategies are robust to uncertainty in productivity drivers?
• Feedback simulation approach
• Feedback simulation is the only way to test the performance of the assessment and the harvest control rule simultaneously
13
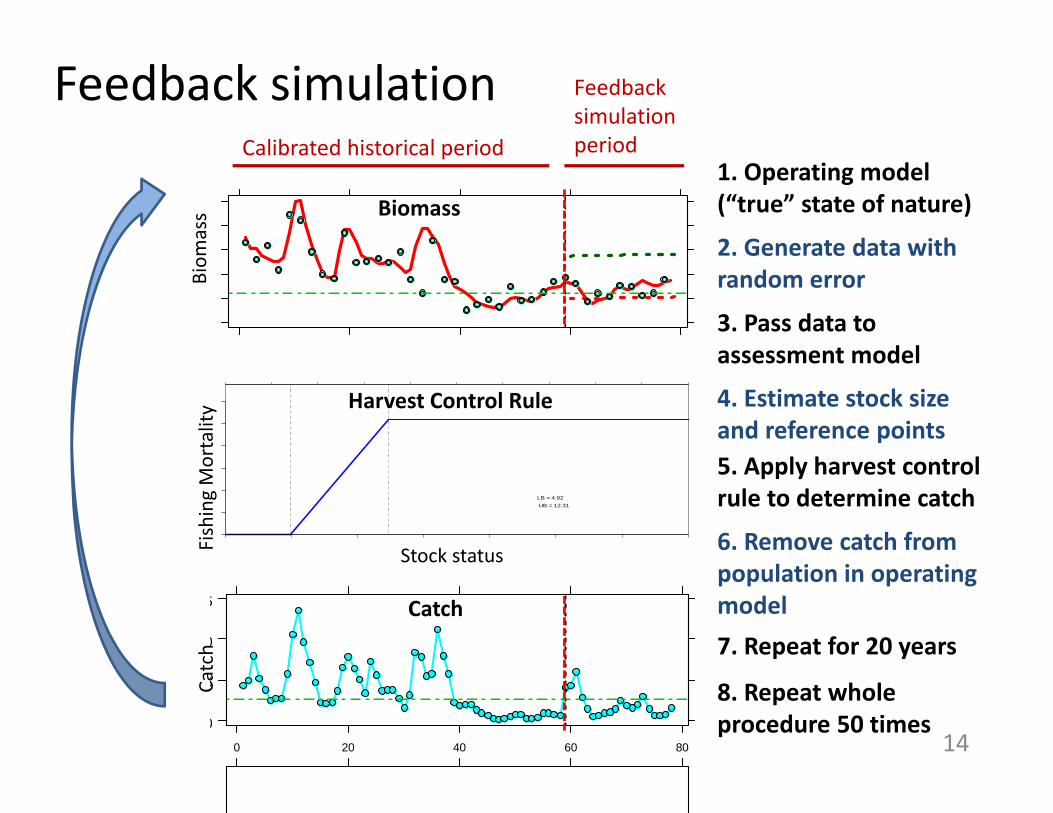
Feedback simulation
0 20 40 60 80
0
5
0
5
LB = 4.92 UB = 12.31
1. Operating model (“true” state of nature)
2. Generate data with random error
3. Pass data to assessment model
4. Estimate stock size and reference points5. Apply harvest control rule to determine catch
6. Remove catch from population in operating model7. Repeat for 20 years
8. Repeat whole procedure 50 times
Biom
ass
Fishing Mortality
Stock status
Catch
Calibrated historical period
Feedback simulation period
Biomass
Harvest Control Rule
Catch
14
0 5 10 15 20 25 30 35
Stock Status
LB = 7.04 UB = 26.44
0 5 10 15 20 25 30 350.00
0.05
0.10
0.15
0.20
0.25
0.30
Stock Status
Rem
oval
Rat
e
LB = 4.92 UB = 12.31
0 5 10 15 20 25 30 35
Stock Status
LB = 4.92 UB = 12.31
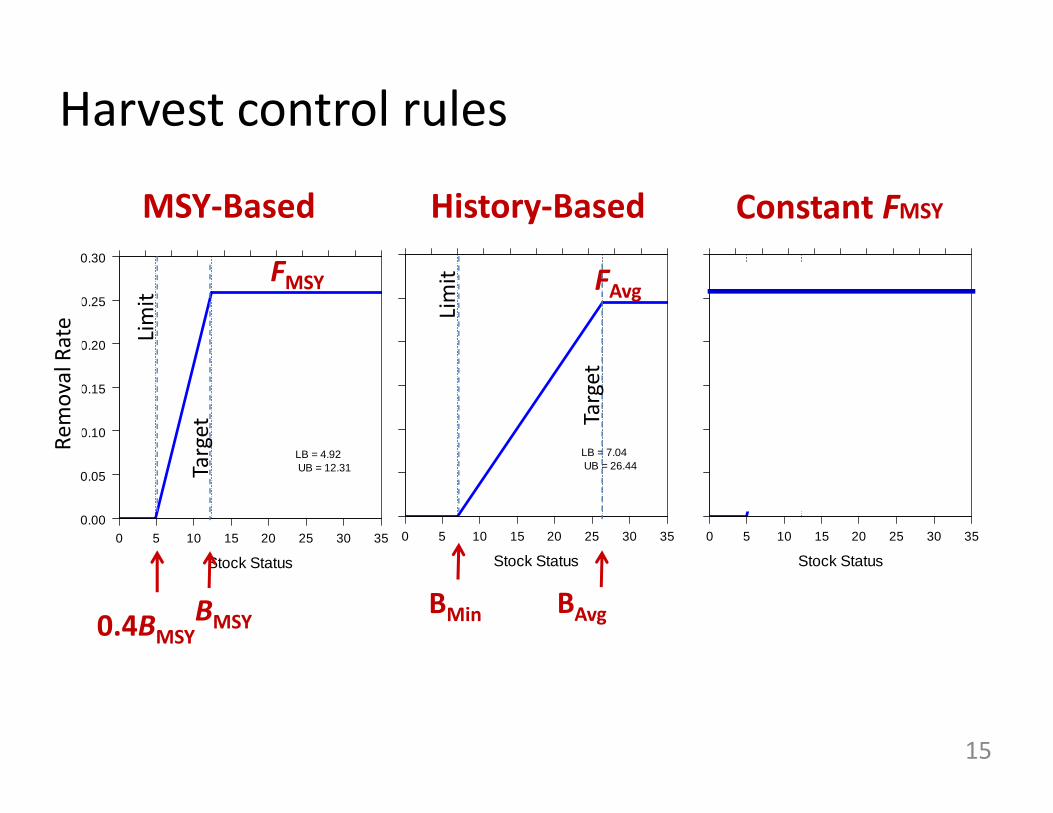
Harvest control rules
MSY‐Based History‐Based Constant FMSY
0.4BMSYBMSY
BMin BAvg
FAvgFMSY
15
Target
Limit
Removal Rate Li
mit
Target
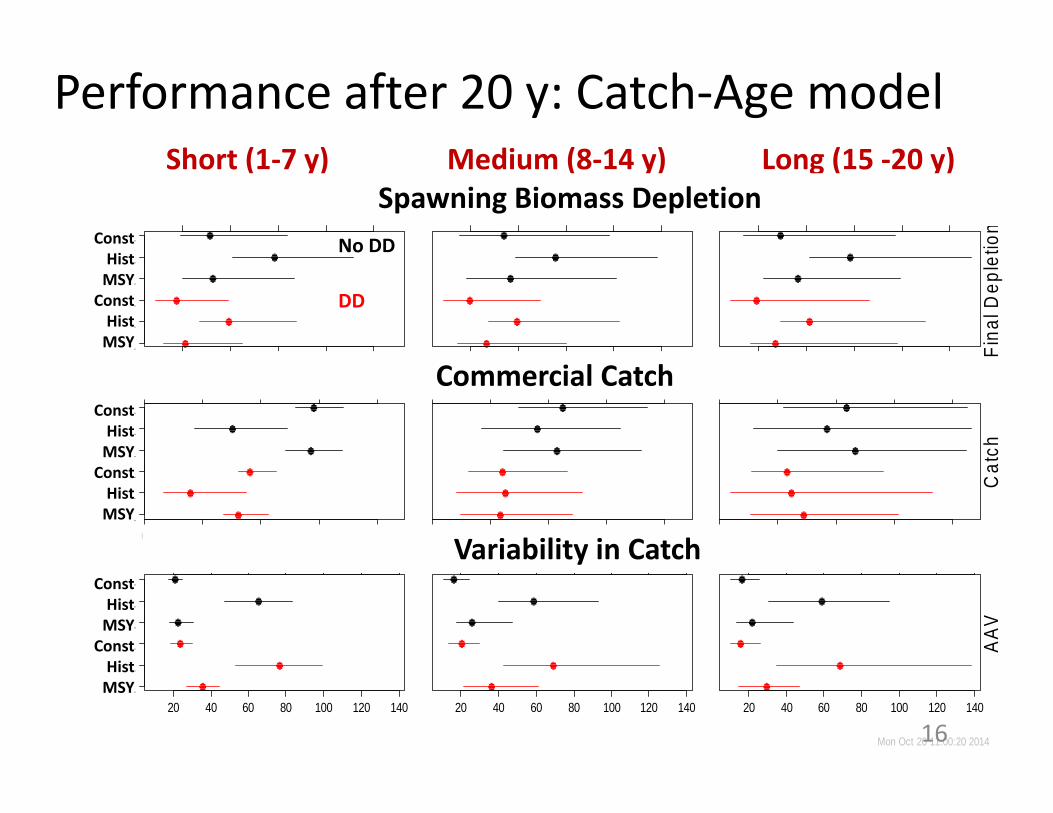
Performance after 20 y: Catch‐Age model
DepDD-MS2A1
DepDD-HS2A1DepDD-CS2A1
NoDD-MS2A1NoDD-HS2A1
NoDD-CS2A1
0.2 0.4 0.6 0.8 1.0
DepDD-MS2A1DepDD-HS2A1DepDD-CS2A1
NoDD-MS2A1
NoDD-HS2A1NoDD-CS2A1
0 1 2 3 4
Short (59,65)
DepDD-MS2A1DepDD-HS2A1DepDD-CS2A1
NoDD-MS2A1NoDD-HS2A1
NoDD-CS2A1
20 40 60 80 100 120 140
Short (59,65)
0.2 0.4 0.6 0.8 1.0
0 1 2 3 4
Medium (66,72)
20 40 60 80 100 120 140
Medium (66,72)
Fina
l Dep
letio
n
0.2 0.4 0.6 0.8 1.0
Cat
ch
0 1 2 3 4
Long (73,78)
AAV
20 40 60 80 100 120 140
Long (73,78)
Mon Oct 20 11:00:20 201416
Long (15 ‐20 y)Short (1‐7 y) Medium (8‐14 y)Spawning Biomass Depletion
Commercial Catch
Variability in Catch
No DD
DD
ConstHistMSYConstHistMSY
ConstHistMSYConstHistMSY
ConstHistMSYConstHistMSY
Trade‐offs• Historical reference points out‐performed MSY‐Based reference points in terms of depletion for both scenarios in all time periods … at the cost of
• … Catch in the short‐term, but not in the long‐term … but
• … Catch variability was high due to catch reductions when stock frequently estimated to be “on the ramp”
• Constant FMSY had the most stable catches under both scenarios in all time periods, at the cost of depletion, especially when mortality was density‐dependent
17
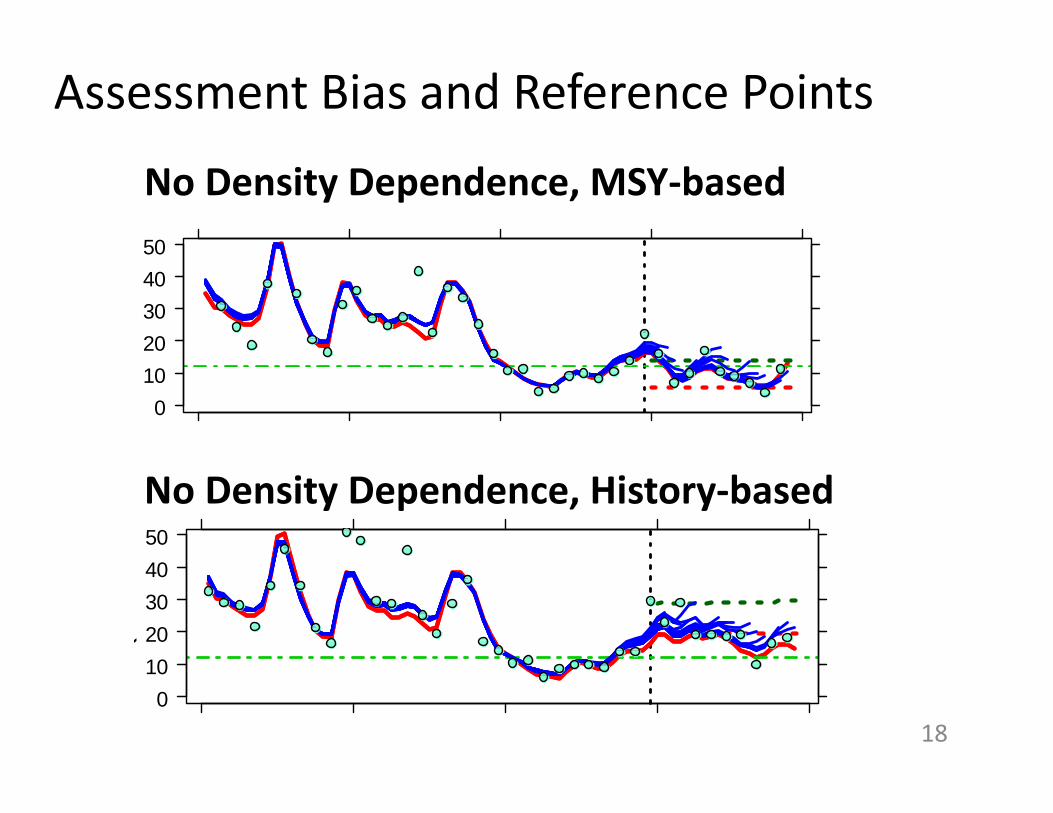
Assessment Bias and Reference Points
01020304050
(
No Density Dependence, MSY‐based
No Density Dependence, History‐based
01020304050
18
A framework
• Simple examples illustrate framework for testing management procedures in the face of uncertainty
• Many types of management procedures currently being proposed to account for climate change impacts, e.g., – dynamic reference points – accounting for non‐stationary parameters – decision‐making frameworks that account for regime shifts …
• Feedback simulation allows for visualisation of trade‐offs associated with alternative management recommendations
19
Concluding comments
• Different mechanisms can give rise to similar observations – especially for data‐poor fisheries
• Consider multiple hypotheses– Density dependent mortality and growth can interact with environmental effects and fishing to give rise to complex dynamics
• Search for robust management strategies– Operating models can be made very complex and are relatively cheap to build!
20

Acknowledgements
• Kendra Holt, Sean Cox and Rob Kronlund• Gordon Kruse and Jackie King• PICES • Maria Surry• Kate Rutherford• Chris Grandin
21


![Research proposal HECATE [Part B2] Section a. State-of-the ...gja/hecate.pdf · Ackland 695527 HECATE Research proposal HECATE [Part B2] Section a. State-of-the-art and objectives](https://img.pdfslide.us/doc/110x75/5c4614a793f3c34c50617eff/research-proposal-hecate-part-b2-section-a-state-of-the-gja-ackland.jpg)