Embed Size (px)
Citation preview

Searching for the social value of a QALY in the Netherlands
The Willingness to Pay for a QALY
Name Maja Obradovic Student number 295113 Project Master Thesis Health Economics Tutor A Bobinac PhD Co-reader 1 NJA van Exel PhD Co-reader 2 R Hoefman MSc Date
2
Abstract
Objective the aim of this study was to elicit the social willingness to pay (WTP) for a Quality
Adjusted Life Year (QALY) from the Socially-Inclusive Individual (SII) perspective in the Netherlands
Methods Respondents valued a hypothetical health state scenario by means of a web-based
contingent valuation exercise The respondents first valued their own health state using the EQ-5D
profile and were asked to rate their own health perfect health death and the hypothetical health
state scenario on the Visual Analogue Scale (VAS) Furthermore respondents expressed their WTP
for avoiding a decline in health from their own current health state (better) to the hypothetical
health state scenario (worse) using a payment scale followed by a bounded open contingent
valuation question
Analysis WTP per QALY was calculated for QALY gains using both VAS valuations as well as the
Dutch EQ-5D tariffs Three different scenariorsquos were created in order to calculate QALY losses (ie
QALY gains) due to premature death Differences in WTP per QALY estimates were examined from
the perspective of household income and the level of certainty in WTP expressed by respondents
Theoretical validity was analyzed using multivariate regressions By means of a sensitivity analysis it
was investigated whether expressed WTP was sensitive to scale
Results 498 respondents representative of the Dutch population participated in the survey Mean
WTP per QALY was euro 65797 based on Dutch EQ-5D tariffs and euro 65194 based on VAS valuations
Incorporating discounting and a correction for age-related quality of life decline lead to much higher
WTP estimates WTP for a QALY was strongly associated with income varying from an average of euro
43611 (EQ-5D) and euro 43211 (VAS) in the lowest income group to an average of euro 84505 (EQ-5D)
and euro 83730 (VAS) in the highest income group Regression analyses confirmed expected relations
between WTP size of the QALY gain income and some other socio-economic characteristics
Conclusion Social WTP per QALY values elicited in this study are higher than those found in studies
reporting individual WTP values Social WTP for a QALY is a rather unexplored item and requires
more research
Keywords cost-effectiveness ICER threshold social decision-making QALY WTP socially-inclusive
individual perspective
3
Preface
By means of this thesis I am completing the Master Health Economics Policy amp Law and its
specialisation Health Economics at the Institute of Health Policy and Management of the Erasmus
University of Rotterdam
Although it was a struggle from time to time I have learned a great deal about doing research
analysing data and writing (and rewriting) my findings Moreover I gained much insight into the
literature concerning the value of health and regarding health technology assessment in general
Hopefully I will be able to apply this knowledge into practice in the future as I would love to make a
career in the field of HTA
Finally I would like to thank my tutor Ana Bobinac PhD for guiding me during the entire process
from analysing the empirical data to writing my thesis and being a great and skilful tutor who has
helped me to finalize my master thesis
Also I would like to thank Job van Exel PhD and Renske Hoefman MSc for taking the time and
trouble to function as my co-readers and everyone else at the Institute of Health Policy and
Management for giving me an opportunity to obtain a Masters degree in science
Rotterdam October 2012
4
Money is the most envied but the least enjoyed
Health is the most enjoyed but the least envied
~ Charles Caleb Colton
5
Table of Contents
List of Abbreviations 6
1 Introduction 7
2 Background 11
21 Previous literature 11
22 The framework of perspectives in CV studies 11
23 The Socially-Inclusive Individual perspective 12
24 Option amp externality values 13
3 Methods 14
31 Design of the questionnaire 14
32 Analysis 16
321 Exclusion criteria 16
322 Rescaling of VAS health states 16
323 Utilities 17
324 WTP for QALY calculation 17
33 Subgroup analysis 21
34 Theoretical validity 21
35 Sensitivity analysis 21
4 Results 23
41 Data 23
42 WTP for non health items 24
43 Utilities 24
44 WTP values 24
45 Subgroup analysis 26
46 Theoretical validity 27
47 Sensitivity analysis 28
5 Discussion 30
References 35
Appendix Questionnaire 39
6
List of Abbreviations
CV Contingent Valuation
EQ-5D EuroQol 5D (5 dimensions)
HRQOL Health-Related Quality of Life
QALY Quality Adjusted Life Year
QOL Quality of Life
SII Socially-inclusive individual (perspective)
SOC Social (perspective)
VAS Visual Analogue Scale
WTP Willingness to Pay
7
1 Introduction
In most countries no market1 for health and healthcare exists due to specific market failures 2 and
most health services are provided directly or subsidized by the government In the absence of a
market healthcare decision-makers require some explicit criteria to help them optimize the allocation
of resources and the distribution of healthcare (Smith amp Richardson 2005) Economic evaluation can
aid decision-makers in doing so Economic evaluation is an accepted method for the appraisal of
healthcare programs and may be defined as lsquothe comparative analysis of alternative courses of action
in terms of both their costs and consequencesrsquo (Drummond et al 2005) The main aim of economic
evaluation is to maximize health from an available budget Economic evaluations in healthcare are
becoming increasingly important because healthcare resources are limited by the total funds
available This raises the question of how to decide how the resources should be allocated most
appropriately (Evans 2004)
There are different methods to perform economic evaluation in healthcare but the majority is
performed by either cost-effectiveness (CEA) or cost-utility analysis (CUA) (Drummond et al 2005)
CUA is a specific type of CEA3 and is particularly a popular method in the field of health economics
because all healthcare outcomes are expressed in one comprehensive measure the Quality Adjusted
Life Year (QALY) (Smith amp Richardson 2005) QALYs can be used to describe the benefit of any
intervention making all benefits mutually comparable (unlike for instance CEA where these benefits
are expressed in natural units4 and thus mostly incomparable) QALYs combine both quality and length
of life into one single measure This measure ranges between zero and one on a cardinal scale where
a QALY of one stands for one year in perfect health and a QALY of zero reflects death5 (Weinstein et al
2009) QALYs are quantified by eliciting individualsrsquo preferences over health states using standard
gamble (SG) time trade-off (TTO) or rating-scale techniques (mostly VAS) (Adler 2010) When using
the QALY in economic evaluation all the alternatives under evaluation have the same outcome
measure which makes it relatively easy to compare alternatives with different health effects
Comparison is done by calculating the incremental cost-effectiveness ratio (ICER) of the competing
alternatives The ICER is the ratio of the difference in costs ie incremental costs (measured in
1 Some (developed) countries are increasingly relying on regulated competition and market principles in
healthcare in order to contain costs 2 Market failures in health care include asymmetric information externalities moral hazard adverse selection
etc 3 The terms CEA and CUA are often used interchangeably as CEA is a particular type of CUA Since CEA is a more
general term and widely used in the health economics literature in this thesis the term CEA will be used for both CUA en CEA 4 Natural health units are for example life years gained amount of deaths averted percentage serum
cholesterol reduced etc 5 Negative QALYs also exist expressing health states worse than death
8
monetary units) and the difference in effects ie incremental effects (measured in QALYs) and is
expressed as the cost per additional QALY The healthcare program with the lowest cost per QALY
gained ie lowest ICER is deemed more cost-effective (Birch amp Gafni 2006) Evaluation of the ICER of
a healthcare intervention however requires a certain threshold value This threshold functions as a
cut-off point to determine if a particular intervention is cost-effective (Evans et al 2004) Healthcare
programs with an ICER below this threshold are deemed cost-effective In the absence of such a value
CEA is not a useful tool for societal decision-making as it lacks a systematic and universally
recognizable decision criterion (Johannesson 1995 Johannesson amp Meltzer 1998) This decision rule
can be formalized by the following equation
ΔC ΔE lt Rt in which ΔC denotes the incremental costs of a healthcare intervention and ΔE denotes the patientrsquos
incremental QALY gain The left-hand side of the equation is the ICER of a healthcare intervention Rt
denotes the ICER threshold (Drummond et al 2005) This formula basically shows the framework of
economic evaluation an intervention can be considered cost-effective or welfare improving if the
incremental costs incurred to produce incremental health benefits do not exceed the ICER threshold
Mccabe et al (2008) have noted three broad approaches for determining the size of the ICER
threshold One way is to infer the threshold value from reviews of previous decisions as to what was
deemed a cost-effective intervention Taking this approach would imply that (a) decision-makerrsquos
objective(s) is (are) consistent over time since the same decision rule would be used for current
decisions as which was used for previous ones This however is not necessarily true which in turn
implies that the ICER threshold may change over time Another proposed way of setting the ICER
threshold is by optimally exhausting a budget In practice this means that the least efficient treatment
within this budget should represent the ICER threshold Any new intervention must be more efficient
than the least efficient program currently funded The problem with this approach is that it is assumed
that all previous decisions were optimal The third way of setting the ICER threshold is identifying
what monetary value the society attaches to health ie discovering the Willingness to Pay (WTP) for a
health gain in a representative sample of the society) Given that CUA is the most popular method to
perform economic evaluation in healthcare (eg Drummond et al 2005) this approach implies
estimating the WTP for a QALY as the most informative result
The WTP for a QALY can be estimated using contingent valuation (CV) studies which is the
most commonly used stated preference method (Hammit 2002) In CV studies a representative
sample of the society is asked what maximum amount it is willing to pay for a hypothetical health
9
benefit in question and thereby placing a monetary value directly on health benefits where no market
prices exist (Drummond et al 2005) This third approach has gained quite some support in the
literature so far (Johannesson amp Meltzer 1998 Hirth et al 2000 Abelson 2003 Gyrd-Hansen 2003
Drummond et al 2005 Mccabe et al 2008) It has been repeatedly argued that the estimates of the
WTP per QALY can provide information on the debate about the size of the cost-effectiveness
threshold However currently there are no valid empirical WTP per QALY estimates that can be
directly applied in societal policy-making in the Netherlands The thresholds currently in use (such as
the threshold in the UK or the Netherlands) lack empirical underpinning (Appleby 2007 Bobinac
2010) meaning that CUA studies in healthcare base their decisions on arbitrarily set thresholds (eg
ltpound30000 per QALY in the UK (Appleby et al 2007)) This can lead to suboptimal allocation decisions
Thus finding an appropriate value of a QALY is an important but an unanswered and underexplored
empirical problem This thesis addresses this important issue
Researchers trying to obtain useful WTP for a QALY estimates to provide information on the
ICER threshold that can be applied in a policy setting face several challenges and methodological
issues (eg Drummond et al 2005 Gyrd-Hansen 2005 Smith amp Richardson 2005 Baker et al2010)
One of those issues is the appropriate perspective from which WTP values should be elicited So far
most researchers have focussed on eliciting WTP values from the individual perspective (King et al
2005 Gyrd-Hansen et al 2003 Bobinac et al 2010) reflecting individualsrsquo monetary valuation of
their own health gain These valuations are quite important to consider from the Welfare economics
perspective which assumes that use of individual WTP is predicated on the notion that the payment
made by each individual will reflect the benefit that he or she receives from the good or service paid
for and that an individual is the best judge of his or her own welfare (Dolan amp Edlin 2002 Dolan et al
2003) However although these valuations seem essential from the Welfare economics perspective
one may question whether they provide the most relevant information for societal decision-making
such as the healthcare sector where interventions are usually delivered through collective financing
The lsquosocial value of a QALYrsquo may therefore be considered more relevant in this context reflecting
broader objectives and principles than purely individual ones such as altruism and solidarity (Dolan et
al 2003 Gyrd-Hansen 2005 Smith amp Richardson 2005) The ICER threshold might therefore have be
based on values that incorporate such broader social objectives A social WTP for a QALY should
include aspects like option and externality values (Bobinac 2010) and can be elicited by taking a social
perspective (Dolan et al 2003) Although important for the debate about the size of the ICER
threshold valid estimates of WTP for a QALY are lacking particularly social values and to date no
study that elicited the WTP for a QALY from a broader social perspective currently exists in the
healthcare arena
10
The aim of this study is to estimate the social value of a QALY in the Netherlands and to
provide an input in the debate on the size of the cost-effectiveness threshold To estimate the broader
societal value of a QALY gain we apply the socially-inclusive individual perspective (SII) To our
knowledge no study in healthcare has elicited the WTP for a QALY from the socially-inclusive
individual perspective (SII)
This Master thesis is constructed as follows the second section describes the background
information about previous research in this field and addresses in more detail the possible
perspectives and their features in conducting CV studies in healthcare The third section describes the
methods to conduct our research project as well as the methods to analyse our empirical data section
four presents our results The discussion of our findings is given in section five
11
2 Background
21 Previous literature
In recent years there have been several attempts to estimate the monetary value of a QALY in various
countries The NICE for example has estimated the ICER threshold ranging from pound 20000 (euro 24415) to
pound 30000 (euro 36632) in the UK (Appleby et al 2007) King et al (2005) have elicited WTP values ranging
from $ 12500 (euro 9547) to $ 32000 (euro 24440) in the US and Gyrd-Hansen et al (2003) elicited a WTP
of euro 12000 from the general Danish population An international survey on the WTP for a QALY by
Shiroiwa et al (2010) revealed WTP values of JPY 5 million in Japan (euro 49935) NT$ 21 million
(euro 55923) in Taiwan pound 23 000 (euro 27885) in the UK AU$ 64000 (euro 50632) in Australia and US$ 62000
(euro 47155) in the US None of the studies estimated the social value of a QALY as they were carried out
from an individual perspective and thus represent individual WTP values Social WTP values can be
estimated by taking another perspective than the individual in CV studies designed to elicit WTP for a
QALY It is important to disentangle the spectrum of the different perspectives that could be applied in
CV studies
22 The framework of perspectives in CV studies
There are multiple perspectives that can be termed lsquoindividualrsquo and lsquosocialrsquo In particular Dolan et al
(2003) have developed a conceptual framework in which six different perspectives are distinguished
to elicit peoplersquos WTP for health (Table 1) In our study we opt for the perspective termed lsquosocially-
inclusive individual (personal)6rsquo perspective
Table 1 A framework of perspectives (Dolan et al 2003)
6 In their framework Dolan et al (2003) use the term lsquopersonalrsquo perspective whereas we choose to use the
term lsquoindividualrsquo perspective
12
This framework has two dimensions the first dimension concerns the relative point in time at which
the WTP values are elicited The question(s) in a WTP study could either be framed from an ex ante or
an ex post perspective In the ex ante perspective respondents are assumed not yet to have fallen ill
but might be at risk of ever needing healthcare in the future In WTP studies carried out from the ex
post perspective on the other hand respondents are asked to value health benefits derived from a
treatment they will in fact utilize or have already utilized (Olsen amp Smith 1999 Dolan et al 2003
Gyrd-Hansen 2005) An advantage of the ex ante perspective is that might activate both option and
externality values (discussed below) whereas the ex post perspective only enables researcher to elicit
so-called use values Use values are obtained from patients or target groups with an identified need
for the intervention in question (Olsen amp Smith 1999) The second dimension of Dolanrsquos framework
relates to the issue of framing the WTP question(s) from an individual or social perspective There are
three approaches to this 1) WTP questions could be asked from an individual perspective in which a
person is asked to value health benefits that will accrue to him- or herself 2) The question(s) in a WTP
study could also entail valuing someone otherrsquos health instead by taking the social perspective
3) Respondents may be asked for their WTP for a health gain that will accrue to both the respondent
as to other people by taking the socially-inclusive individual (personal) perspective Thus in total there
are six different perspectives an individual could be asked to adopt (table 1) The appropriate
perspective depends on the normative considerations and the particular policy context to which it will
be applied (Dolan et al 2003) Additionally it has been argued that the use of WTP values has to take
account of the institutional arrangements of the market in which a study is carried out (Shackely amp
Donaldson 1999) This might best be reflected in the prevailing financing arrangements for healthcare
of a country The individual perspective would seem the most appropriate if there is a direct link
between payment and use at the individual level Private insurance schemes or out of pocket
payments are good examples of this On the other hand in a tax-based healthcare system such as the
NHS the social perspective would seem more appropriate as people should be asked to express their
WTP for the health benefits of other people Lastly the socially-inclusive individual perspective would
seem the most appropriate perspective in a social insurance system particularly when social
insurance is having the dual role of being an insurance agent for each insuree and a social institution
that facilitates redistribution (Dolan et al 2003) This perspective chosen in our study as well is
further discussed below
23 The Socially-inclusive Individual Perspective
In this study we employed the socially-inclusive individual perspective (SII) This perspective combines
both individual and social values that are deemed important for social decision-making In particular
individual and social WTP values may be driven by quite different motivations A person is both driven
13
by individual utility as by the utility of others As a completely self-interested person an individual
bases the maximum amount he or she is willing to pay on his or her own estimate of the likelihood of
using the health service in question and the estimate of the monetary benefits he or she would
receive As a citizen on the other hand an individual is motivated by the utility of the collective and
may adopt a different criterion when he or she is asked to value health (Smith amp Richardson 2005)
Individual utilities are likely to reflect other-regarding preferences in which altruism is one of the many
aspects of an individualistic utility function The socially-inclusive individual perspective (SII) would
therefore seem the most appropriate perspective for the elicitation of social WTP rather than the
social perspective (SOC) that does not take self-interest into account If respondents are faced with
WTP question(s) stating that health gain(s) might accrue to the community as a whole in which the
respondent is only one of the members this might activate preferences for voluntary redistribution
due to caring externalities next to option values To date there have been only a few studies that
have elicited socially-inclusive individual WTP values in healthcare (Dolan et al 2003) and to our
knowledge no study has elicited WTP for a QALY values in healthcare from the SII perspective
24 Externality amp Option values
A great deal of evidence shows that otherrsquos people health in fact matter to individuals ie that
altruism in healthcare exists (Jacobsson et al 2005) Altruism in the context of the WTP for a health
gain raises the possibility of deriving values from those with no probability of future use of health care
(Olsen et al 2004) Such values are called (caring) externalities (Smith amp Olsen 1999) Research has
shown that externality values form a significant source of value in individualsrsquo WTP for health
(Neumann amp Johannesson 1994 Olsen et al 2004 Jacobsson et al 2005 Smith 2006) The presence
of externalities in relation to health care has been acknowledged and has been used as a part of the
justification for extensive government intervention in the health care arena (Cuyler 1971) Although
externality values are commonly mentioned in theory in economic evaluation in healthcare they are
often not taken into account in empirical research (Jacobsson et al 2005) and have not be accounted
for in estimating the social WTP for a QALY Another important value overlooked in individual WTP
valuations is option value (Palmer amp Smith 2000) Option values reflect the utility obtained from
having the option the possibility to use health services in the future In healthcare this concept is
related to that of purchasing insurance in conditions of uncertainty as it reflects individualsrsquo insurance
motive for being willing to pay should they ever need care in the future (Olsen et al 2004) Since both
externality and option values are important to consider in the context of social decision-making in
healthcare one could argue that these should be incorporated into the estimation of the ICER
threshold Both externality and option values can be elicited by taking an ex ante socially-inclusive
individual perspective in empirical WTP exercises as it is done in this study
14
3 Methods
The elicitation of the Willingness to Pay for a QALY (WTP per QALY) was performed by means of
contingent valuation (CV) in a representative sample of the Dutch population in terms of age (18 to 65
years) gender and education The data was collected online by a professional internet sampling
company The dataset was created for the purpose of exploring the WTP per QALY from different
perspectives varying from individual to social In this study we present the subset of the results on
WTP per QALY estimated from the social perspective The social perspective was defined in this study
as a socially-inclusive individual perspective (SII) From the SII perspective respondents are asked to
state the maximum WTP for a hypothetical health gain that could accrue to both the respondent him-
or herself as to other people thus making the respondent part of a larger group of beneficiaries
31 Design of the questionnaire
The questionnaire offered one WTP question to each respondent In the beginning of the
questionnaire the respondents were introduced to the purpose of the study Next they were offered
two lsquowarm-uprsquo questions for two non-health items to familiarize themselves with the WTP exercise
These questions include the WTP for a car and a pair of shoes After the introduction and the warm-up
questions the respondents were asked to describe their own health status using the EQ-5D profile
(Lamers et al 2005) and to rate their own health perfect health (11111) and death on the Visual
Analogue Scale (VAS)
Next the respondents were asked to perform the CV exercise They were provided with a
hypothetical health state (described below) and asked to rate it on the VAS so that a direct valuation
of this health state from the sample could have been obtained The VAS showed the respondentsrsquo
previous valuations of own health death and perfect health The hypothetical health state on which
the contingent valuation exercise was based equalled the EQ-5D profile of 23322 (corresponding to
024 on the QALY scale (Lamers et al 2005)) These two different methods for the valuation of health
were applied because former research showed that the WTP per QALY estimates can differ
substantially with the health state valuation method (King et al 2005)
The specific health state (23322) was chosen because it resembles the symptoms and
conditions of an influenza which is a well-known disease and therefore respondents were assumed to
be able to imagine being in that health state rather well The questionnaire stated that only less than
one percent of the Dutch population and children up to 18 years have no chance of getting the
described disease The WTP question was introduced to our sample as follows
15
ldquoImagine a new virus is likely to affect the Dutch population in the upcoming months Children (up to
18 years) appear to be immune to the virus The disease causes symptoms a lot like influenza fever
moderate pain and being unable to perform usual daily activities A general description of the health
state is as follows
I have some trouble walking
I am not able to wash or dress myself
I am not able to perform my usual activities
I have moderate pain or discomfort
I am moderately anxious or depressed
Just like the entire adult Dutch population you have a 10 percent chance of getting this disease This
chance is independent of age income life-style etc From everyone that gets ill in the Dutch
population every one out of 500 persons dies as a consequence of complications The remaining
people that get diseased will stay for four weeks in the health state described above After these four
weeks they will fully recover and return to their initial health state There is a painless medicine that
will protect adults from the virus (with no side-effects) This medicine prevents everyone from getting
the disease and thereby also prevents all deaths Everyone will then stay for sure in the better health
state The Dutch government has decided to provide this medicine to everyone The medicine will be
financed through an increase in the monthly insurance premium for all the Dutch residents The
increase of the premium is paid out of pocket After twelve months the monthly premium will return
to its initial level Keep in mind that you belong to the group at risk ldquo
After this introduction the respondents were asked to express their willingness to pay to
avoid being (or someone else being) in the described health state scenario The respondents were
asked to express their willingness to pay as an increase in their monthly health insurance premium
The WTP was elicited in a two step procedure First a payment scale was presented expressed in
monthly installments in Eurorsquos These monthly installments were 0 1 2 3 4 5 6 8 10 12 15 18
20 22 25 30 40 50 75 100 150 250 500 Respondents were asked to indicate the maximum
amount they would certainly pay and the maximum amount they would certainly not pay on this
payment scale
16
In the next step the respondents were provided with an open-ended question asking them to
state the maximum amount they would be willing to pay if they would have been asked to do so right
now This estimate was bounded by the higher and lower values the respondents chose on the
payment scale before and was used for further analysis
Respondents providing a zero valuation were asked to clarify why theyrsquore not willing to pay for a
health gain They could choose out of three explanations 1) I cannot afford more than euro 0 2) I think
that avoiding the worse health state and remaining in the better health state is not worth more than euro
0 or 3) I have ethical objections to pay anything The first two explanations are considered true WTP
values while the third explanation is considered as a protest answer
Finally respondents were asked to express the level of certainty regarding their stated
maximum WTP in the range of 1) totally sure I would pay the stated amount 2) pretty sure I would
pay the stated amount 3) neither sure nor unsure I would pay the stated amount 4) not very sure I
would pay the stated amount or 5)unsure I would pay the stated amount Asking this follow-up
question may identify the values that reflect respondentsrsquo lsquotruersquo WTP However the extent of
certainty does not necessarily imply that an elicited WTP value is true (Smith 2006)
32 Analysis
321 Exclusion criteria
The respondents that valued the described health state (23322) higher than their own current health
were excluded for the analysis as the aim of the WTP exercise was to investigate what the
respondents are willing to pay for a health gain (ie avoiding the potential health loss) Valuing the
health state scenario higher than onersquos current health state means that no health gain can be
calculated thus making this data meaningless for the analysis
322 Rescaling of VAS health states
In order to set the VAS health state values for death at zero and perfect health (11111) at one it was
necessary to rescale the VAS values and thus these values were all truncated to (ndash1)(+1) To rescale
the mean VAS values for each of the directly valued health states by our respondents the following
formula was applied VAS rescaled = (VAS own current health ndash VAS death)(100 ndash VAS
death)(Wittrup-Jensen et al 2008)
17
323 Utilities
With respect to the utility scores a correlation test between the EQ-5D health gain and the VAS health
gain was performed to test for consistency Here we tested the null hypothesis that there is no
association between the VAS and EQ-5D variable
324 WTP for a QALY calculation
In order to obtain the total maximum WTP per year we multiplied the expressed mean WTP by twelve
This number then was multiplied by the total amount of people over 18 living in the Netherlands (CBS
2010) WTP per QALY was calculated as the ratio of the WTP for avoiding the move from the own
current (better) to the scenario 23322 (worse) health state to the QALY difference between the two
health states using both utility elicitation techniques ie VAS scores and EQ-5D tariffs As determined
by the design of the exercise the total expected QALYs lost ie the total expected QALY gained were
disentangled in the QALYs lost due to the described disease and QALYs lost due to premature death
Regarding the expected QALY loss due to premature death three scenarios were created (details of
the calculations are given below)
(A) In scenario A no discounting of future QALY losses was performed and a constant quality of
life for the remaining life-span of people was assumed
(B) In scenario B we also assumed a constant quality of life for the respondentsrsquo remaining life-
span but contrary to scenario A discounting was applied taking a discount rate of 3 percent
(C) In scenario C future QALYs were discounted with a discount rate of 3 percent as well but here
we assumed a non-constant quality of life for the remaining life-span of people ie a
correction for age-related quality of life decline was applied
Discounting was applied in scenario B and C because the QALY losses due to premature death would
appear in the future The consideration of a constant quality of life for the remaining life-span
(scenario A and B) is the most common approach used by health economists to calculate QALY gains
(or losses) (Hirth et al 2005 Gold et al 2002)7 However as peoplersquos health in fact deteriorates over
time (Chappel amp Cooke 2010) it would seem realistic to take an age-related quality of life decline into
account No data on the average age (group)-related health states of the Dutch population was found
and therefore we used data from the US UK and Swedish literature to infer the weights for the Dutch
population We assumed that the age-specific health states in these countries are similar to the
average Dutch numbers as these are Western countries with a high welfare level as well
7 Gold et al (2002) state that ldquofor simplicity QALY modelers frequently omit adjusting for gradations of HRQL during different
segments of a life pathmdashonce a diminution in health has occurred it is frequently handled as persisting throughout the remaining years of liferdquo
18
All the calculations that were performed are summed in table 2 in which
- QALYown denotes the mean current health state of the respondents expressed in QALYs
- QALYscenario denotes the hypothetical health state scenario expressed in QALYs
- age refers to the mean age of our sample
- agegr refers to the different age groups described in table 3
- QALYgr denotes the average health state per age group expressed in QALYs
- LE denotes the average life expectancy of Dutch people
The calculations are all based on mean values and are calculated the same way for both of the health
state valuation methods (EQ-5D and VAS) In the next subsections we explain in detail the calculation
procedure The exact calculation procedure is explained in the following two subsections
Table 2 Summary calculations WTP for QALY in the Dutch population
Outcome Calculation
Expected QALY loss disease (01 13060511) (((QALYown ndash QALYscenario) 52) 4)
Expected QALY loss premature death (scenario A) (01 (0002 13060511)) ( (8055 ndash age) ( QALYown) )
Expected QALY loss premature death (scenario B) (01 (0002 13060511)) ( (8055 ndash age)
(Σ QALYown (1 + 003 )LE
))
Expected QALY loss premature death (scenario C) (01 (0002 13060511)) Σ (((agegr - age) QALYgr)
(1 + 003)LE
)
Total expected QALY loss expected QALY loss disease + expected QALY loss premature death
Maximum WTP 13060511 (WTP 12)
WTPQALY (euro) Maximum WTPTotal expected QALY loss
QALY loss due to illness calculation
As shown in table 2 the expected QALYs lost due to the described health sate scenario were
calculated by subtracting the valuation of the health state offered in the scenario (using the EQ-5D
tariffs and the VAS-scores) from the respondentsrsquo own health for every respondent individually We
took the mean of these outcomes which represents the respondentsrsquo mean QALY gain The
hypothetical health state scenario only takes four weeks and after taking the medicine people will
fully recover to their initial health state This should be taken into account in the calculation since
QALYs are calculated on annual basis We accounted for this by dividing the mean health gain by 52
and then multiplying this number by four Furthermore the questionnaire stated that ten percent of
the population of 18 years and older is at risk of getting the disease Therefore we multiplied 010 by
13060511 (in 2010 there were 13060511 people of 18 years and older living in the Netherlands
19
(CBS 2010)) Finally this result was multiplied by the average monthly health gain giving us the total
expected health loss in the Dutch population due to the disease
QALY loss due to premature death calculation
In order to calculate the expected QALYs lost due to premature death 3 different approaches were
taken (Table 2) The three scenarios (A B C) are described below Overall in the contingent valuation
exercise we stated that one out of 500 persons is likely to die as a consequence of the disease As
shown in table 2 this amounts to 01 (probability of getting disease) 0002 (probability of dying)
13060511 (amount of adult people living in the Netherlands) equals 2612 people that are likely to
die without treatment in the Dutch population Then in order to calculate how much QALYs will be lost
due to prematurely dying respondentsrsquo average remaining life expectancy was calculated We
subtracted respondentsrsquo average age from the average life expectancy of the Dutch population Mean
age of death of the Dutch population in 2009 was 8055 for both men and women taken together (CBS
2009) The three scenarios differ in terms of the assumption about discounting future health gains and
the constancy of the health-related quality of life throughout ones life The total expected QALY lost
because of the disease and premature death is simply the sum of the two calculations described
above QALY loss disease + QALY loss premature death
Scenario A QALY loss undiscounted and unadjusted by QOL decline
In this scenario the assumption is that people will remain in their current health state over the entire
span of their remaining life expectancy The mean of our samplersquos initial health state was taken So the
total amount of the expected QALYs lost in the population due to premature death as a consequence
of the disease is (current health) (remaining life expectancy) (amount of people dying)
Scenario B QALY loss discounted and unadjusted by QOL decline
In scenario B future health benefits were discounted Taking a discount rate of 3 percent (Gold et al
2002) assured that future QALYs are converted into present values which is a common approach in
estimating the Quality Adjusted Life Expectancy (QALE) (Sassi 2006) The formula is given by
Σ QALYown (1 + r )LE
In which QALYown denotes the mean own current health of the respondents r denotes the discount
rate and LE denotes the remaining life expectancy which is equal to 8055 (average life expectancy of
Dutch people) minus the average age in our sample In summary we are calculating the sum of the
20
respondentsrsquo mean current health state divided by the discount factor (1+003) to the power of the
remaining life expectancy The summation consists of the number of people dying multiplied by the
remaining life expectancy which will give us the total discounted QALYs lost due to premature death
As in scenario A this amount must be summed by the total QALYs lost as a consequence of the
hypothetical health state scenario
Scenario C QALY loss discounted and adjusted by QOL decline
Since itrsquos known that peoplersquos average health-related quality of life declines with ageing (Chappel amp
Cooke 2012) this should be taken into account in the calculation of the QALYs lost due to premature
death However no systematic data on the average (self-reported) age-specific health state valuations
of the Dutch population was found Therefore this data was taken from the Swedish (Burstroumlm et al
2001) US (Lubetkin et al 2005) and UK literature (Kind et al 1999) with respect to the EQ-5D utilities
Regarding the VAS-scores the European average age-specific valuations were obtained from the
EuroQol Group (2004) and used for the calculation of lost QALYs due to premature death The US
population was divided in 4 different age groups 18-39 40-59 60-69 and 70+ The populations of the
other countries on the other hand showed ranges of five or ten years Therefore we first converted
the Swedish and UK age groups into the same age categories as the US taking the average of different
categories These utilities are presented in table 3
To calculate the Dutch QALY decline due to ageing we took the average decline of the UK US
and Swedish data Then we subtracted the mean age of our sample from the age groups and
multiplied this number by the average quality of life in the corresponding age group eg mean age of
our sample is 3939 years so the first 061 years the respondent loses 0909 QALYs measured by the
EQ-5D and the next twenty years the respondent loses 0849 QALYs Then finally we summed and
discounted this amount taking a discount rate of three percent The discounting procedure was equal
to that described in scenario B
Table 3 Average age-specific HRQOL
Age categories Average HRQL (QALYs)
18-39
40-59
60-69
70+
UK (EQ-5D) 0927 0852 0790 0755
US (EQ-5D) 0901 0856 0823 0785
Sweden (EQ-5D) 0900 0840 0760 0660
Average (EQ-5D) 0909 0849 0791 0733
Average VAS 0825 0765 0700 0645
21
33 Subgroup analysis
As we have taken the mean WTP to calculate WTP for a QALY values we were also interested in
examining what average amount different income groups were willing to pay and whether these
amounts significantly differ from each other and from the sample mean We took four different
income groups 1) respondents earning less than 1000 eurorsquos per month 2) respondents earning
between 1000 and 2000 eurorsquos per month 3) respondents earning between 2000 and 3500 eurorsquos per
month and 4) respondents earning more than 3500 eurorsquos per month Then we tested the null
hypothesis that there is no significant difference between the different subgroups Moreover we
suspect that the higher income groups will express higher WTP values Finally we examined the level
of certainty the respondents from the different income groups indicated and we expect the
respondents in higher income groups to be more certain about their expressed WTP than the
respondents in the lower income groups
34 Theoretical Validity
To investigate the theoretical validity of our dataset we estimated different multivariate regression
analyses with the maximum WTP as the dependent variable The only independent variable that
varied across the four regression models was the different specification of respondentrsquos expected
health gain In two regression models the included health gain variable was measured by the VAS
while the other two models included the EQ-5D health gain Moreover we performed a regression
including the lsquorawrsquo mean variable of a health gain and a regression including different health gain
(small to large) categories for both the VAS and the EQ-5D Prior to making these categories the
distribution of these variables was investigated
Overall nine different independent variables were included into the model Prior to
performing the regression analyses a normality test was performed on both the independent and the
dependent variables The continuous variables showing a non-normal distribution were log
transformed The independent variables included income health gain employment age and others A
priori we expected the income to have a positive effect on the WTP Peoplersquos willingness to pay is
highly related to their ability to pay which is best reflected by their income (eg Donaldson 1999)
35 Sensitivity Analysis
To test the validity of our WTP values we investigated whether the WTP estimates are sensitive to the
scale of the QALY gains on offer Insensitivity points to the fact that WTP will not discriminate between
different sizes of health gains Since economic theory assumes a positive relation between WTP and
the size of a benefit an insensitivity to scale would not be in accordance with economic theory and is
22
therefore said to not possess lsquoconstruct validityrsquo (Smith 2005) Testing for the sensitivity to scale was
done by examining whether a higher potential health gain was accompanied by a higher WTP In order
to do so different categories of health gain size were made for both of the health state valuations
techniques First the distribution of these health gain variables was investigated in order to make
adequate categories Then we tested whether the potential differences between the WTP values per
health gain category were significant
All the analyses were performed using Stata 110 for Windows
23
4 Results
41 Data
498 respondents representative of the Dutch population with respect to age gender income and
other socio-economic characteristics have participated in this survey 56 respondents were excluded
for the analysis as they valued the health state scenario higher than their own current health Table 4
shows the summary statistics The majority of our sample had an income between euro 1999 and euro 3500
a month is married and employed The average respondent is fairly healthy
Table 4 Summary statistics
(N=442) Mean Stddev Min Max
Age 3917 1235 18 65 Sex ( men) 5045 Children(yes) 4661 Number of children 208
(N=206) 13 1 15
Age oldest child 1823 1169 0 44 Income 258725 147014 999 10000 Income groups () lt 1000 gt 999 and lt 2000 gt1999 and lt 3500 gt 3499
1448 3439 3620 1493
People living on household income 245 144 1 15 Higher Education ( yes) 3688 Employment status () Employed Unemployed Student Housewifeman
6788 1199 1063
95
Marital Status () Married Divorced Single Widow Marital status unknown
5656 882
2670 069 724
Paid work partner ( yes) 7560 Health state VAS-score 8192 1375 30 100 Health state VAS-score rescaled 099 023 013 129 Health state EQ-5D 091 011 0516 1 Duration completion survey (min) 1623 6 42 4415
24
42 WTP for non health items
The respondents indicated plausible WTP estimates for their favourite car and a pair of shoes The
results are shown in table 58
Table 5 WTP non-health items
Mean Stddev
WTP car 14020 (n=442)
39401
WTP shoes 11128 (n=439)
25267
3 observations were excluded for the analysis as these were extreme outliers showing no plausible estimates for the WTP
for a pair of shoes
43 Utilities
The average health gain was 067 on the QALY scale measured by the EQ-5D VAS utilities averaged at
068 on the QALY scale We tested the null hypothesis that there is no association between the VAS
and EQ-5D variable and we cannot reject this hypothesis as there is strong evidence that there is no
association between the two different health state valuations methods in this study (p=000)
44 WTP values
The expressed mean WTP was 4579 Eurorsquos per month This equals 54948 Eurorsquos per year Table 6
shows the amount of respondents expressing a zero WTP and their motive for doing so
Approximately six percent of our sample expressed a zero WTP Most of these respondents gave
explanation three for not willing to pay anything for a health gain which is deemed as a protest
answer rather than true WTP However this percentage is still relatively small so we did not exclude
this data for our analysis Furthermore table 7 shows that 14 percent of the respondents were totally
sure they would pay the stated amount and almost 38 percent of our sample indicated that they were
pretty sure about paying the amount they indicated Respondents indicating uncertainty about their
expressed WTP were found to be a minority in our sample (317 )
Table 6 Clarifications Zero WTP
Explanations Frequency
1 I am unable to pay more than euro 0 11 (25) 2 Avoiding the worse health state and remaining in the better health state is not worth more than euro 0
5 (113)
3 I am not willing to pay out of ethical considerations 12 (27 )
Total 28 (633)
8 Even though these estimates may imply that the respondents understood the exercise itrsquos quite different to value health monetarily since no market prices for health (care) exist
25
Table 7 Certainty level of expressed WTP
Certainty level Frequency Percentage
1Totally sure I would pay the stated amount 62 1403 2 Pretty sure I would pay the stated amount 167 3778 3 Neither sure nor unsure I would pay the stated amount 177 4005 4 Not very sure I would pay the stated amount 22 498 5 Unsure I would pay the stated amount 14 317
Total 442 100
In table 8 the mean age mean own health state mean health gain and mean WTP are presented
which were necessary for our calculations of the WTP for a QALY These values are the same across
the three different scenarios for calculating WTP for a QALY Table 9 shows the results of the
calculations of the WTP for a QALY of which the formulas were described in table 1 The expected
QALY losses differed substantially since we have taken different approaches to the calculation of
QALY losses due to premature death in the three different scenarios This leads to different average
WTP for a QALY values Table 9 shows a WTP for a QALY of euro 41919 (VAS) and euro 44196 (EQ-5D) in
scenario A The other scenariorsquos show higher WTP for a QALY values respectively euro 73362 (VAS) and euro
74924 (EQ-5D) in scenario B and euro 80300 (VAS) and euro 78270 (EQ-5D) in scenario C
Table 8 Mean values
EQ-5D VAS
Mean own health state (QALY) 091 099
Mean health gain (QALY) 067 068
Mean age 3939 3939
Mean WTP (euro per month) 4574 4574
WTP is 56088 eurorsquos per year
Table 9 Average WTP for QALY values (euro)
Scenario A WTP for a QALY undiscounted and unadjusted by age-related QOL decline
Scenario B WTP for a QALY discounted and unadjusted by age-related QOL decline
Scenario C WTP for a QALY discounted and adjusted by age-related QOL decline
EQ-5D VAS EQ-5D VAS EQ-5D VAS
Expected QALY loss disease 67915 68317 67915 68317 67915 68317
Expected QALY loss death 97834 106435 29856 31536 25676 22908
Total expected QALY loss 165749 174751 97771 99853 93591 91225
Average WTPQALY (euro) 44196 41919 74924 73362 78270 80300
26
45 Subgroup analysis
In table 10 the mean monthly WTP value of each of the four income groups is presented As suspected
the respondents in the higher income groups expressed a higher mean WTP value The highest income
group expressed an average WTP value almost twice as high as the lowest income group However no
significant difference was found between the WTP values across either of the income groups Nor did
we find a significant difference between the mean WTP expressed by our total sample and the mean
WTP of either of the income groups Table 11 shows the WTP for a QALY estimates within each
income group using the calculations described in table 2 of section three As can be seen the highest
WTP for a QALY estimates are found in scenario C within the highest income group reaching a value
beyond 100000 Eurorsquos per QALY gained
Table 10 WTP by income groups
Income groups (euro) Mean WTP Frequency Percentage
Income lt 1000 3098 64 145
1000 lt Income lt 2000 3850 152 344
2000 lt Income gt 3500 5303 159 36
Income gt 3500 6003 66 149
These values represent monthly WTP values
Table 11 Average WTP for a QALY by income groups (euro)
Scenario A WTP for a QALY undiscounted and unadjusted by age related QOL decline
Scenario B WTP for a QALY discounted and unadjusted by age related QOL decline
Scenario C WTP for a QALY discounted and adjusted by age related QOL decline
EQ-5D VAS EQ-5D VAS EQ-5D VAS
Income lt 1000 29294 27785 49661 48625 51879 53224
1000 lt Income lt 2000 36404 34529 61715 60428 64472 66144
2000 lt Income lt 3500 50143 47560 85007 83234 88803 91106
Income gt 3500 56762 53838 96228 94221 100525 103133
Table 12 presents the certainty levels of the stated WTP values in the different income groups The
highest percentage of respondents indicating being totally sure was found in the highest income group
whereas being unsure about the indicated WTP amount was slightly higher in the lowest income
group compared to the other income groups Being indifferent or pretty sure whether to pay the
stated amount is overall the most indicated level of certainty
27
Table 12 WTP certainty level by income groups
Certainty level Income 999 1000-2000 2000- 3500 gt3500
Freq Freq Freq Freq
1Totally sure I would pay the stated amount
4 625 22 1447 20 1258 16 2424
2 Pretty sure I would pay the stated amount
15 2344 54 3684 74 4654 21 3182
3 Neither sure nor unsure I would pay the stated amount
36 5625 65 4276 52 3270 24 3636
4 Not very sure I would pay the stated amount
6 938 5 329 8 503 3 455
5 Unsure I would pay the stated amount
3 469 4 263 5 314 2 303
Total 64 100 152 100 159 100 66 100
46 Theoretical validity
Table 13 shows the results of the multivariate logarithmic regressions with the (log) maximum WTP
estimates as the dependent variable This table presents four regression models in which only the
health gain variable varied Models 1 and 2 include respectively the raw and categorical EQ-5D health
gain variable as the dependant variable whereas models 3 and 4 include the VAS also respectively
raw health gain and health gain categories as the dependant variable Due to its distribution the EQ-
5D health gain variable was separated into a small gain and large gain whereas the distribution of the
VAS variable allowed for three categories (including a moderate health gain category)
Model 3 reported the highest Rsup2 but overall the explained variance was low in all of the
models The models showed statistically significant F-tests As expected WTP was positively
associated with income and its coefficient was significant in all of our models On the other hand the
size of the VAS health gain (presented as a continuous or a categorical variable) was not found to be a
significant predictor of WTP Moreover the sign of this variable was opposite from what one might
expect The models show negative coefficients of the categorical dummy variables as compared to
the reference category which was the smallest health gain This would imply that the higher the
health gain the smaller the maximum WTP Regarding the EQ-5D health gains the models show no
significance of these variables The socio-economic variables show betas that are quite similar in each
model except for having a higher education which is higher in models 3 and 4 The log income betas
on the other hand are somewhat smaller in models 3 and 4 compared to models 1 and 2 Finally the
effect of the large health gain variable in model 2 is relatively low compared to its reference category
whereas this effect is larger in models 3 and 4 However this relationship in models 3 and 4 is negative
28
Table 13 Multivariate Regression Analysis Model 1 EQ-5D raw health
gain Model 2 EQ-5D health gain
categories Model 3 VAS raw health gain Model 4 VAS health gain
categories
Dependent variable Log Maximum WTP
Coef Std Error
Pgt|t| Coef Std Error
Pgt|t| Coef Std Error
Pgt|t| Coef Std Error
Pgt|t|
Age -0034 0007 0000 -0035 0007 0000 -0034 0007 0000 -0034 0007 0000
Employed -0172 0147 0244 -0164 0148 0269 -0133 0147 0365 -0140 0146 0340
Higher education 0011 0044 0805 0011 0044 0797 0216 0139 0121 0221 0140 0114
Gender 0132 0133 0321 0142 0132 0283 0130 0131 0323 0129 0131 0326
Children 0324 0196 0100 0330 0196 0092 0320 0196 0103 0315 0196 0109
Married -0146 0163 0372 -0149 0164 0364 -0160 0163 0325 -0147 0163 0365
Log income 0468 0151 0002 0473 0151 0002 0437 0150 0004 0434 0150 0004
Log income people
-0265 0167 0118 -0265 0169 0119 -0214 0170 0209 -0221 0171 0197
Log health gain (EQ-5D)
0187 0355 0599 - - - - - - - - -
Large health gain (EQ-5D)
- - - 0005 0185 0977 - - - - - -
Health gain (VAS) - - - - - - -0237 0167 0158 - - -
Moderate health gain (VAS score)
-
-
-
-
-
-
-
-
-
-0117
0157
0457
Large health gain (VAS score)
- - - - - - - - - -0215 0159 0176
Intercept 1029 1118 0358 0753 1104 0492 1018 1095 0353 1076 1099 0328
Rsup2 Prob gt F N
00888 00000
414
00902 00000
414
00996 00000
414
00970 00000
414
Significant at 5 Significant at 10
47 Sensitivity analysis
The results of our sensitivity analysis (table 14) show that the sensitivity to scale of our study is
somewhat supported by the EQ-5D data This is shown by the large health gain category being
accompanied by a larger WTP than the small health gain category This result however is not
statistically significant at 5 (p = 01015)
Table 14 EQ-5D sensitivity to scale
Health gain EQ-5d Obs Mean EQ-5D health gain
Mean WTP (euro)
Std dev Min Max
Small gain (0- 50) 221 059 3906 8075 0 500
Large gain (50 - 100) 221 076 5251 9418 0 500
The VAS-variable lends no support for the sensitivity to scale of WTP to the size of the health gain on
offer as table 15 shows The health gain in quartile 1 was accompanied by a higher WTP than the WTP
in quartile 2 and 4 This is in line with the regression results presented in the former paragraph
showing a reversed association between VAS health gain size and WTP than we a priori expected
29
Table 15 VAS sensitivity to scale
Health gain VAS Obs Mean VAS health gain
Mean WTP (euro)
Std dev Min Max
First quartile (0- 25) 110 020 4654 9395 0 500
Second quartile (25 - 50) 110 055 3895 8192 0 500
Third quartile (50 - 75) 110 080 5780 9511 0 500 Fourth quartile (75- 100) 110 118 3938 7950 0 500
2 random observations were deleted so that we could create equally sized groups
30
5 Discussion
A commonly mentioned ICER threshold in the Netherlands is euro 20000 per QALY (Boersma 2010) with
a maximum of euro 80000 proposed by the RVZ (RVZ 2006) This value however is set arbitrarily which
necessitates further empirical research into the monetary value of a QALY in the Netherlands The first
empirical results on the Dutch monetary value of a QALY show that the WTP for a QALY equals
euro24500 (Bobinac et al 2010) The elicitation of the WTP for a QALY in that study was performed by
taking the individual perspective However taking the individual perspective may not lead to an
optimal resource allocation in collective decision-making in healthcare A social WTP for a QALY would
seem more relevant in social decision-making as this value should include aspects like option and
externality values In this study we have therefore elicited WTP values from the social perspective -
more specifically the socially-inclusive individual perspective Our results show (mean) WTP values
ranging from euro 41919 to euro 80300 per QALY gained Aggregating and taking the average of the
different scenarios leads to a WTP for a QALY of euro 65500
The results of this study are systematically higher than the estimates published in the
literature so far (King et al 2005 Gyrd-Hansen et al 2003 Shiroiwa et al 2010) There are
potentially several explanations for this difference First these differences could be explained by the
fact that most WTP for a QALY studies were performed by eliciting WTP values under certainty and
from the individual perspective As our contingent valuation questions were stated under risk this
could (partly) explain why we have found higher values than those reported by other researchers in
the literature Secondly another explanation of why we have found higher WTP values is because we
have elicited WTP values from the social perspective defined as the socially-inclusive individual
perspective The WTP for a QALY values reported in the literature so far were elicited from an
individual perspective and thus reflect use andor option value only but exclude the externality value
Some researchers have found that the addition of externality values could possibly lead to
considerably higher WTP estimates A study of Smith (2006) for example showed that the addition of
externality value will lead to a higher average WTP estimate than the elicitation of use and option
value alone (Smith 2006) Comparable results were also demonstrated by Neumann and Johannesson
(1994) when investigating the WTP of in vitro fertilization They showed that eliciting ex ante WTP
estimates by way of public insurance questions may ceteris paribus disclose higher WTP estimates
than taking the (ex post) individual perspective An explanation for this may be that the individual
perspective will include respondentsrsquo valuations of their own potential treatment only whereas
answers to WTP questions from a social perspective also include altruistic preferences for the
treatment of other members of the community which could lead to altruistic lsquoadd-onsrsquo to the WTP
31
values (Gyrd-Hansen 2003) A study of Olsen et al (2004) however rejected this hypothesis showing
that the WTP values from respondents valuing health from a community perspective (comparable to
the socially-inclusive individual perspective) did not differ significantly from those respondents that
valued health gains from an insurance perspective (comparable to the individual perspective) They
showed instead that a higher amount of respondents were willing to pay in the community-based
sample as opposed to the insurance-based sample rather than expressing an altruistic add-on to the
WTP estimate(s) Given the variability in these findings more research is needed to investigate the
existence and the extent of such an lsquoaltruistic add-onrsquo to individual valuations Moreover none of
these studies investigated the WTP for QALY gains and to date this study is the first in which WTP for
QALY gains are elicited from the socially-inclusive individual perspective
We found considerable variation within WTP per QALY estimates obtained in this study The
WTP estimates varied substantially with the chosen method of calculation The results depend for
instance on the way in which the future health gains are calculated (VAS or EQ-5D) and whether
discounting was applied Particularly the assumption of a non-constant quality of life profile over a
lifetime lead to WTP per QALY values that were approximately euro 30000 to euro 40000 higher than
assuming a constant quality of life over peoplersquos remaining life expectancy King et al (2005) pointed
out that ldquothere is no standard method for extrapolating health state valuations into cumulative
lifetime quality adjusted survivalrdquo and we cannot infer from our results which method should be used
However we can argue that the WTP estimates of scenario C might be the most realistic ones since
this scenario has both taken discounting and age-related quality of life decline into account Other
assumptions on future QALY gains would have undoubtedly yielded different WTP estimates as well
Furthermore the different health valuation techniques also yielded different WTP estimates which
has been already found by King et al (2005) and Bobinac et al (2010) as well The VAS is known to
elicit higher utility scores than the TTO (on which the EQ-5D is based) (King et al 2005) thus leading to
lower WTP for a QALY estimates However after rescaling the VAS-scores these values did not differ
much from the EQ-5D tariffs in our study we found a difference of 001 QALY In spite of this we can
argue that the WTP estimates based on EQ-5D tarrifs are more relevant in our study as this utility
valuation method is most commonly used and there are many more caveats to the VAS than there are
to the TTO method Our results perhaps also point to the inapplicability of VAS-scores in this study as
the regression models showed a counter-intuitive negative relationship between the WTP and health
gains measured by the VAS This was also confirmed by our sensitivity analysis as opposed to the WTP
for a health gain measured by the EQ-5D the WTP for VAS health gains revealed more insensitivity to
scale It must be noted however that comparisons regarding the sensitivity to scale may be biased as
we were only able to make two categories with respect to the EQ-5D health gains whereas the VAS
32
health gains contain four categories Furthermore as we were not able to find systematic data on the
average age-related quality of life of Dutch residents measured by the VAS we used this data from
the UK US and Sweden to calculate WTP values in scenario C Regarding the age-related quality of life
measured by the EQ-5D we took the European average from the EuroQol group The true Dutch age-
related quality of life numbers may however differ somewhat and lead to different WTP estimates
The method of calculating the WTP for a QALY may have influenced our results Instead of taking the
means of the relevant values as was done in this study one may argue to take median values instead
Even though there are no guidelines concerning this matter it must be noted that taking median
values may have resulted in different WTP values The chosen discount rate may be a point of
discussion as well In order to convert future QALY gains to present values we took a discount rate of
3 percent but other rates could have been chosen instead Most studies for the economic evaluation
in healthcare show a range between 1 and 8 percent (Gravelle amp Smith 2001)
Finally our subgroup analysis showed that people in the highest income groups are willing to
pay a higher average amount than those in the lower income groups However as no significant
differences were found between any of the income groups regarding the expressed WTP nor between
any of the income groups and the sample mean WTP we could argue that the WTP for a QALY
estimates based on the sample mean represent a rather reliable estimate of the lsquotrue value of a QALYrsquo
which is not constrained by the level of income This is a common problem in any WTP study inside or
outside healthcare One may argue that the elicited WTP values could be severely constrained by
budget restrictions which could limit our results If this were the case the estimates would reflect
ability to pay rather than willingness to pay This however appeared to be a minor problem in this
study as the average WTP as a proportion of the average monthly income appeared to be only 177
percent This shows that the respondents were not bidding to the point where the opportunity costs
become catastrophic
Some other methodological issues need mentioning First the payment scale and payment
vehicle may have biased our results The range of the payment scale may have affected the
respondentrsquos maximum WTP A further inspection shows that only eight respondents expressed the
highest amount offered We can thereby conclude that end-point bias was not present in our results
In order to minimize mid-point bias respondents were asked to state their maximum WTP in a two-
step procedure first by using the payment scale and then stating their maximum WTP bounded by
the minimum and maximum of the provided scale The payment vehicle and frequency may have
influenced individualrsquos WTP as well We asked our respondents to imagine paying for health out-of-
pocket as monthly instalments instead of taking out insurance for example or paying the stated
33
amount all at once Even though Dutch people are to some extent familiar with paying out of pocket
for healthcare9 it is questionable to what extent this scenario seemed realistic to the respondents
Stating the questions in monthly instalments instead of a lump sum for example has the advantage of
spreading the burden of payment over time which prevents problems with ability to pay and budget
constraints to some extent Finally as in any other stated preferences study the hypothetical
character of the exercise may have formed an important limitation to this study Respondents might
have found it difficult to imagine being in a health state which they have never experienced before
Even though the hypothetical bias was tried to minimize by designing the survey as much realistically
as possible by stating aspects like lsquopainless medicinersquo and lsquono side-effectsrsquo it remains a hypothetical
scenario which is most definitely valued differently than truly experienced scenariorsquos
The mentioned variability in WTP for a QALY estimates in this study suggests that it may be
difficult to derive a unitary ICER threshold The large differences we found between our elicited WTP
values but also between our WTP values and those elicited from the individual perspective in the
Netherlands (Bobinac et al 2010) add to the evidence that applying one WTP for a QALY as a
decision-making tool is not without problems and caution must be taken when using the term lsquothe
value of a QALYrsquo As we have shown the precise estimates of WTP per QALY depend on the method
used to calculate both the WTP values as QALY gains or losses and the perspective applied As the
Dutch healthcare system is characterized by a social insurance system following Dolan et al (2003)
would make the socially-inclusive individual perspective the most appropriate perspective to elicit
WTP for a QALY in the Netherlands in order to inform decision-makers on the size of the ICER
threshold Solidarity and altruism play a role in collective decision-making in healthcare and these
aspects appear to form a significant source of value in individualsrsquo WTP for health (Neumann amp
Johannesson 1994 Olsen et al 2004 Jacobsson et al 2005 Smith 2006) Such externality values are
not likely captured by the individual perspective and thus eliciting WTP for a QALY from the socially-
inclusive individual seems a better approach Since self-interest in the form of option value is already
taken into account in the socially-inclusive individual perspective we can argue that the individual
perspective is indeed irrelevant to elicit WTP values in the Dutch healthcare context
Finally there is the question of applying one single and unique value of a QALY as the ICER
threshold value The alternative would be to have context-specific ICER thresholds to evaluate
healthcare interventions aimed at different diseases or different population groups The rationale
behind this approach is that aspects like disease severity the amount of beneficiaries the age of the
9 In order to contain the rising costs in health care in the Netherlands the Dutch government is increasingly relying on forms
of out-of-pocket payments like the introduction of deductibles and slimming the basic benefit package
34
beneficiaries and other things beyond the QALY tend to affect peoplersquos WTP for health (Baker et al
2010) In this context we would refer to the Social Value of a QALY project (Donaldson et al 2011)
conducted in the UK The purpose of this research project was to investigate whether QALYs gained by
different beneficiaries of healthcare should be weighted equally and to evaluate the monetary value
of a QALY Although Donaldson et al (2011) point out that this study did not provide compelling
evidence for moving the NICE cost-effectiveness threshold up or down many members of the public in
fact appear to be open to the possibility of using different QALY weights for different groups of
beneficiaries More research however is needed to reveal more reliable WTP estimates in order to
decide to what extent the NICE threshold should change Future research in the Netherlands should
also focus on such aspects lsquobeyond the QALY rsquo as these may lead to significantly different WTP
estimates than elicited so far If the Dutch Health Care Insurance Board (CVZ) is to adopt (a) formal
ICER threshold(s) in order to evaluate the cost-effectiveness of healthcare interventions we would
argue that different threshold values for different beneficiaries in healthcare should definitely form a
key aspect to be taken into account into future research and into the debate about the threshold
values that can be applied in policy settings As the quest for the monetary value of a QALY goes on
this study hoped to give insight into the social value of a WTP for a QALY in the Netherlands
particularly in the context of choosing the right perspective from which this WTP value is elicited
35
References Abelson P 2003 The Value of Life and Health for Public Policy Economic Record Volume 79 Special Issue S2ndashS13 Adler MD 2010 Contingent valuation studies and health policy Health Economics Policy and Law 5 123ndash131 Appleby J N Devlin D Parkin 2007 NICErsquos cost effectiveness threshold BMJ 2007335358ndash9 Baker R Bateman I Donaldson C Jones-Lee M Lancsar E Loomes G Mason H Odejar M Pinto Prades JL Robinson A Ryan M Shackley P Smith R Sugden R Wildman J SVQ Research Team 2010 Weighting and valuing quality-adjusted life-years using stated preference methods preliminary results from the Social Value of a QALY Project Health Technol Assess 2010 May14(27)1-162 Birch S A Gafni 2006 The Biggest Bang for the Buck or the Bigger Bucks for the Bang The Falacy of a Cost-Effectiveness Threshold The Journal of Health Services Research and Policy 2006 1146 -51 Bobinac A N J A van Exel F H RuttenW B F Brouwer 2010 Willingness to Pay for a Quality-Adjusted Life-Year The Individual Perspective Value in Health Volume 13 Issue 8 pages 1046ndash1055 December 2010 Boersma C A Broere MJ Postma 2010 Quantification of the potential impact of cost-effectiveness thresholds on Dutch drug expenditures using retrospective analysis Value in Health 2010 Sep-Oct13(6)853-6 Burstroumlm K M Johannesson F Diderichsen 2001 Swedish population health-related quality of life results using the EQ-5D Qual Life Res 200110(7)621-35 CBS Available from httpstatlinecbsnlStatWebpublicationDM=SLNLampPA=7461BEVampD1=0ampD2=1-2ampD3=0-100ampD4=01020304050lampHDR=TG3ampSTB=G1G2ampVW=T [accessed March 4 2011] CBS Available from httpstatlinecbsnlStatWebpublicationDM=SLNLampPA=37979nedampD1=26-27ampD2=(l-11)-lampVW=T [accessed March 4 2011] Chappell NL Cooke HA 2010 Age Related Disabilities ndash Aging and Quality of Life In JH Stone M Blouin editors International Encyclopedia of Rehabilitation Available at httpcirriebuffaloeduencyclopediaenarticle189 [ accessed August 2012] Cuyler AJ 1971 The nature of the commodity health care and its efficient allocation Oxford Economic Papers 197124189ndash 211 Dolan P R Edlin 2002 Is it really possible to build a bridge between cost-benefit analysis and cost-effectiveness analysis Journal of Health Economics 21 827ndash843 Dolan P R Edlin A Tsuchiya 2008 The relative societal value of health gains to different beneficiaries HEDS Discussion Paper 0812 Dolan P JA Olsen P Menzel J Richardson 2003 An inquiry into the different perspectives that can be used when eliciting preferences in making Health Econ 200312545ndash51
36
Donaldson C 1999 Valuing the benefits of publicly-provided health care does lsquoability to payrsquo preclude the use of lsquowillingness to payrsquo Social Science amp Medicnine Volume 49 Issue 4 August 1999 551-563 Drummond MF B OrsquoBrien GL Stoddart GW Torrance 2005 Methods for the economic evaluation of health care programmes 2nd ed Oxford Oxford Medical Publications 2005 Euroqol group 2004 Measuring self-reported population health an international perspective based on EQ-5D Available at httpwwweuroqolorgfileadminuser_uploadDocumentenPDFBooksMeasuring_Self-Reported_Population_Health_-_An_International_Perspective_based_on_EQ-5Dpdf [accessed June 2011] Evans C M Tavakoli B Crawford 2004 Use of Quality Adjusted Life Years and Life Years Gained as in Economic Evaluations A Critical Appraisal Health Care Management Science 2004 7 43ndash49 Gafni A Birch S 2006 Incremental Cost-Effectiveness Ratios (ICERs) The Silence of the Lamda Social Science and Medicine 2006 622091-2100 Gold MR Stevenson D Fryback DG 2002 HALYS AND QALYS AND DALYS OH MY Similarities and Differences in Summary Measures of Population Health Annu Rev Public Health 2002 23 115ndash34 Gravelle H D Smith 2001 The practice of discounting in economic evaluations of healthcare interventions International Journal of Technology Assessment in Health Care 2001 17(2) 236ndash243 Grosse SD 2008 Assessing cost-effectiveness in healthcare history of the $ 50000 per QALY threshold Expert rev Pharmacoeconomics Outcomes Res 20088(2) 165-178 Gyrd-Hansen D 2003 Willingness to pay for a QALY Health Econ 2003121049ndash60 Gyrd-Hansen D 2005 Willingness to pay for a QALY theoretical and methodological issues Pharmacoeconomics 200523423ndash32 Hammit JK 2002 How much is a QALY worth Admissible Utility functions for health and wealth Working Paper Department of Health Policy and Management and Center for Risk Analysis Harvard University Hirth R ME Chernwe E Miller M Fendrick WG Weisert 2000 Willingness to Pay for a Quality-adjusted Life Year in Search of a Standard Med Decis Making 2000 20 332 Jacobson F J Carstensen Borgquist L 2005 Caring externalities in health economic evaluation how are they related to severity of illness Health Policy 73 (2005) 172ndash182 Johannesson M 1995 The relationship between cost-effectiveness analysis and cost-benefit analysis Soc Sci Med Vol 414 483-489 Johannesson M D Meltzer 1998 Some reflections on cost-effectiveness analysis Health Economics Volume 7 Issue 1 1ndash7 Kind P G Hardman S Macran 1999 UK population norms for EQ-5D The university of York Centre for health economics discussion paper 172
37
King JT J Tsevat JR Lave MS Roberts 2005 Willingness to pay for a quality-adjusted life year implications for societal health care resource allocation Med Decis Making 200525667ndash77 Lamers M PFM Stalmeier J McDonnell PFM Krabbe JJ van Busschbach 2005 Kwaliteit van leven meten in economische evaluaties het Nederlands EQ-5D-tarief Ned Tijdschr Geneeskd 20051491574-8 Lubetkin EI H Jia P Franks MR Gold 2005 Relationship among sociodemographic factors clinical conditions and health-related quality of life examining the EQ-5D in the US general population Qual Life Res 2005 Dec14(10)2187-96 McCabe C K Claxton A Culyer 2008 The NICE cost-effectiveness threshold what it is and what that means Pharmacoeconomics 200826733ndash44 Neumann P M Johannesson 1994 The willingness to pay for in vitro fertilization a pilot study using contingent valuation Med Care 1994 Jul32(7)686-99 OrsquoBrien B A Gafni 2006 When do the ldquodollarsrdquo make sense Toward a conceptual framework for contingent valuation studies in health care Med Decis Making 199616288ndash99 Olsen JA K Kidholm C Donaldson P Shackley 2004 Willingness to pay for public health care a comparison of two approaches Health Policy 70 (2004) 217ndash228 Olsen JA R Smith 2001 Theory versus practice a review of lsquowillingness-to-payrsquo in health and health care Health Economics 20011039ndash52 Olsen JA R Smith 1999 Who have been asked to value what A Review of 54 lsquoWillingness-to-Payrsquo Surveys in Health Care Centre for Health program evaluation working paper 83 1999 Palmer S PC Smith 2000 Incorporating option values into the economic evaluation of health care technologies Journal of Health Economics 19 755ndash766 RVZ Available from httpwwwrvznetpersberichtrvz-stelt-objectieve-en-eerlijke-methode-voor-om-pakket-vast-te-stellen [ accessed March 20 2012 ] Sassi 2006 Calculating QALYs comparing QALY and DALY calculations Oxford Journals Medicine Health Policy and Planning Volume 215 402-408 Shackley P C Donaldson 1999 Willingness to pay for publicly-financed health care how should we use the numbers Sheffeld Health Economics Group Discussion Paper Series 1999 Shiroiwa T Y Sung T Fukuda et al 2010 International survey on willingness-to-pay (WTP) for one additional QALY gained what is the threshold of cost effectiveness Health Econ 201019422ndash 37 Smith RD 2005 Sensitivity to scale in contingent valuation the importance of the budget constraint Journal of Health Economics 24 515ndash529 Smith RD 2006 Use option and externality values are contingent valuation studies in health care mis-specified Health Econ 16 861ndash869
38
Smith RD J Richardson 2005 Can we estimate the ldquosocialrdquo value of a QALY Four core issues to resolve Health Policy 20057477ndash84 Weinstein MC GTorrance A McGuire 2009 QALYs the basics International Society for Pharmacoeconomics and Outcomes Research (ISPOR) Value in Health volume 12 supplement 1 Wittrup-Jensen K J Lauridsen KM Pedersen 2008 Assessment of the Visual Analogue Scale (VAS) as a Valuation Method for Hypothetical Health States using the EuroQol (EQ-5D) Health Economics Paper 20086
39
Appendix Questionnaire
40
41
42
43
44
45
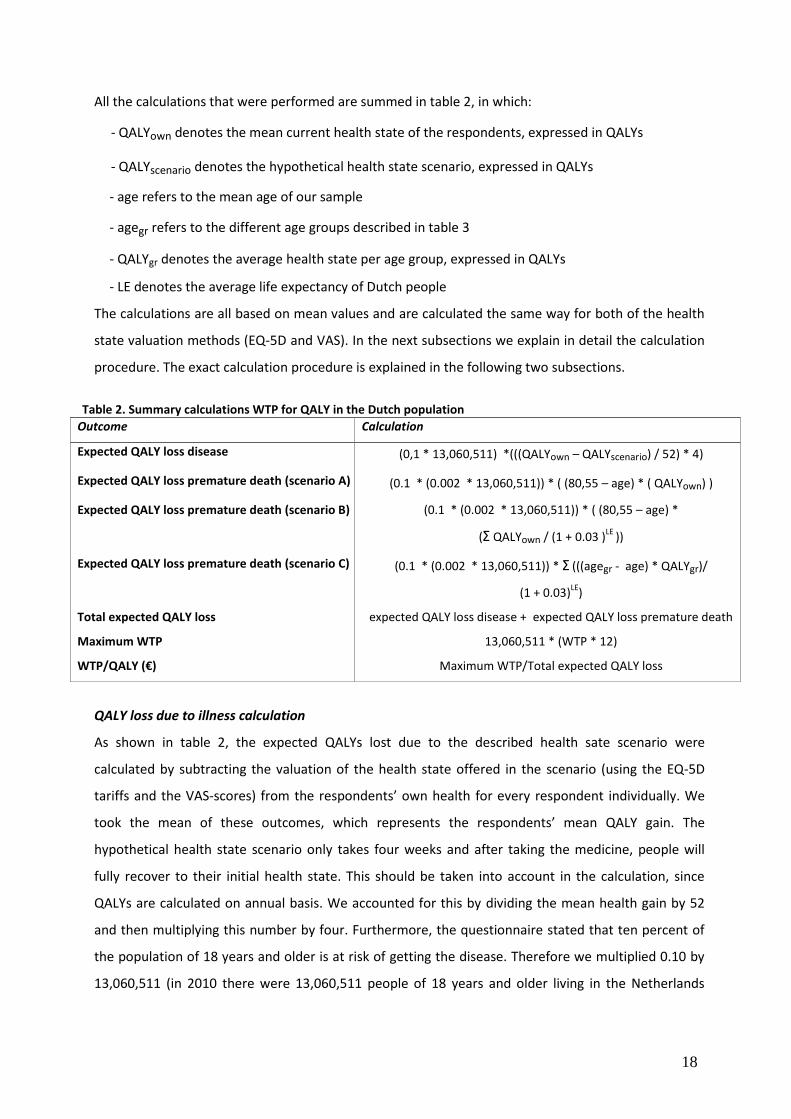

39
Appendix Questionnaire
40
41
42
43
44
45

40
41
42
43
44
45

41
42
43
44
45

42
43
44
45

43
44
45

44
45

45
![Evolution of HTA in Scotland [Read-Only] · If NDC propose “not recommended”, manufacturer can invoke PACE meeting Discuss value not captured in QALY (severity of condition, unmet](https://img.pdfslide.us/doc/110x75/5f1fe6813bcbee06f14a3594/evolution-of-hta-in-scotland-read-only-if-ndc-propose-aoenot-recommendeda-manufacturer.jpg)