Embed Size (px)
Citation preview
2
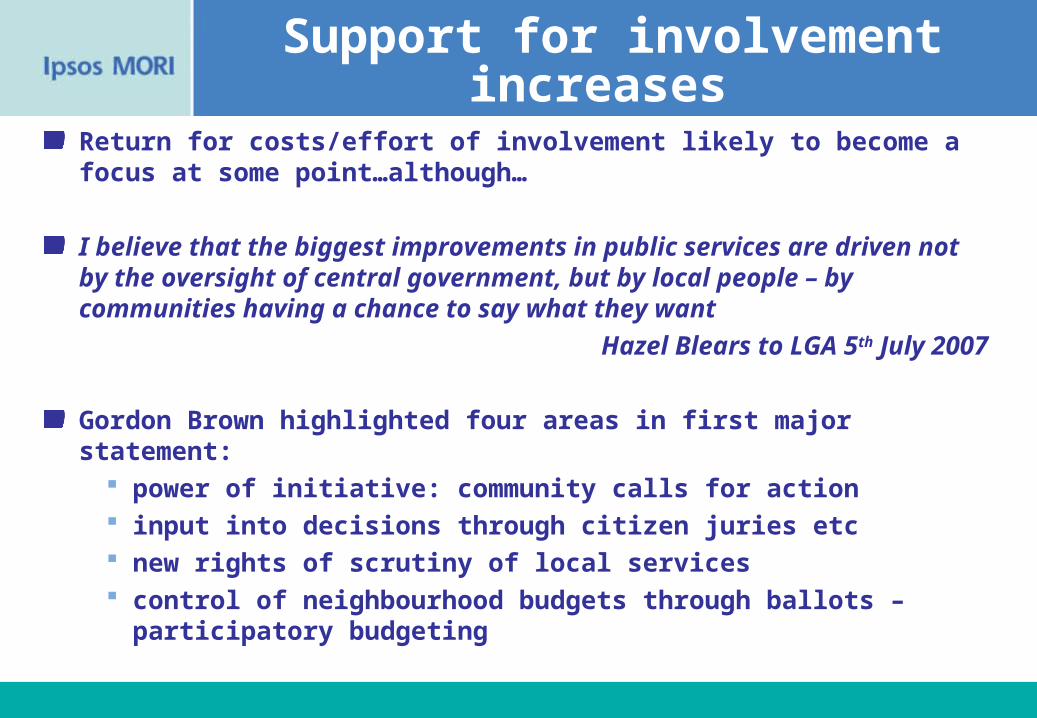
Return for costs/effort of involvement likely to become a focus at some point…although…
I believe that the biggest improvements in public services are driven not by the oversight of central government, but by local people – by communities having a chance to say what they want
Hazel Blears to LGA 5th July 2007
Gordon Brown highlighted four areas in first major statement: power of initiative: community calls for action input into decisions through citizen juries etc new rights of scrutiny of local services control of neighbourhood budgets through ballots –
participatory budgeting
Support for involvement increases
3
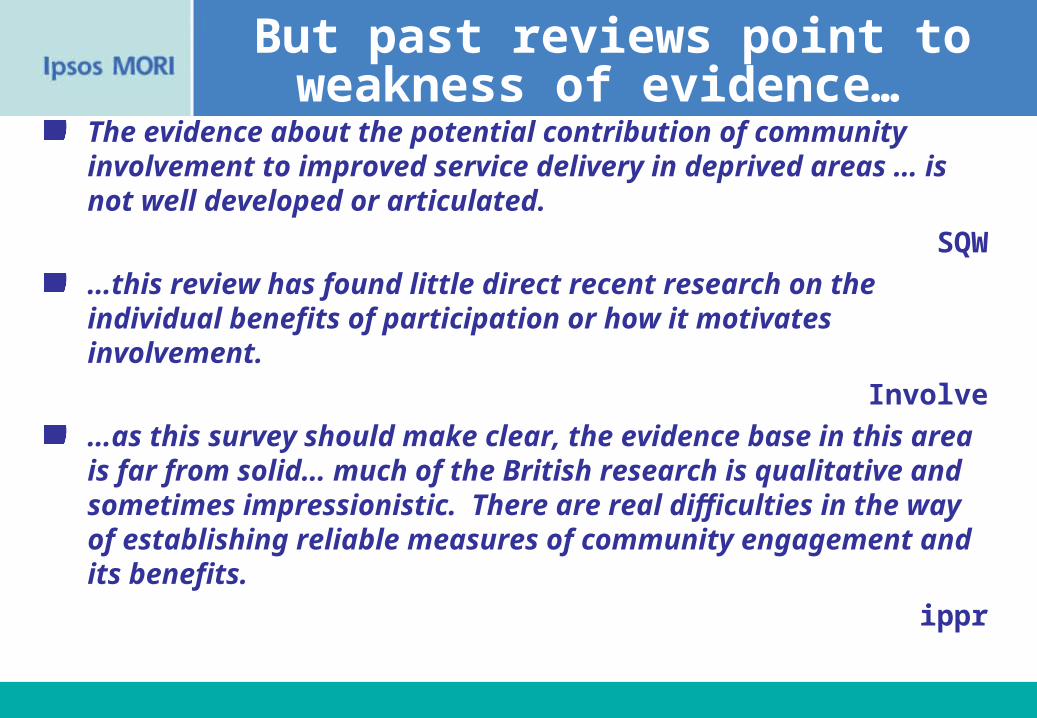
The evidence about the potential contribution of community involvement to improved service delivery in deprived areas … is not well developed or articulated.
SQW
…this review has found little direct recent research on the individual benefits of participation or how it motivates involvement.
Involve
…as this survey should make clear, the evidence base in this area is far from solid… much of the British research is qualitative and sometimes impressionistic. There are real difficulties in the way of establishing reliable measures of community engagement and its benefits.
ippr
But past reviews point toweakness of evidence…
4
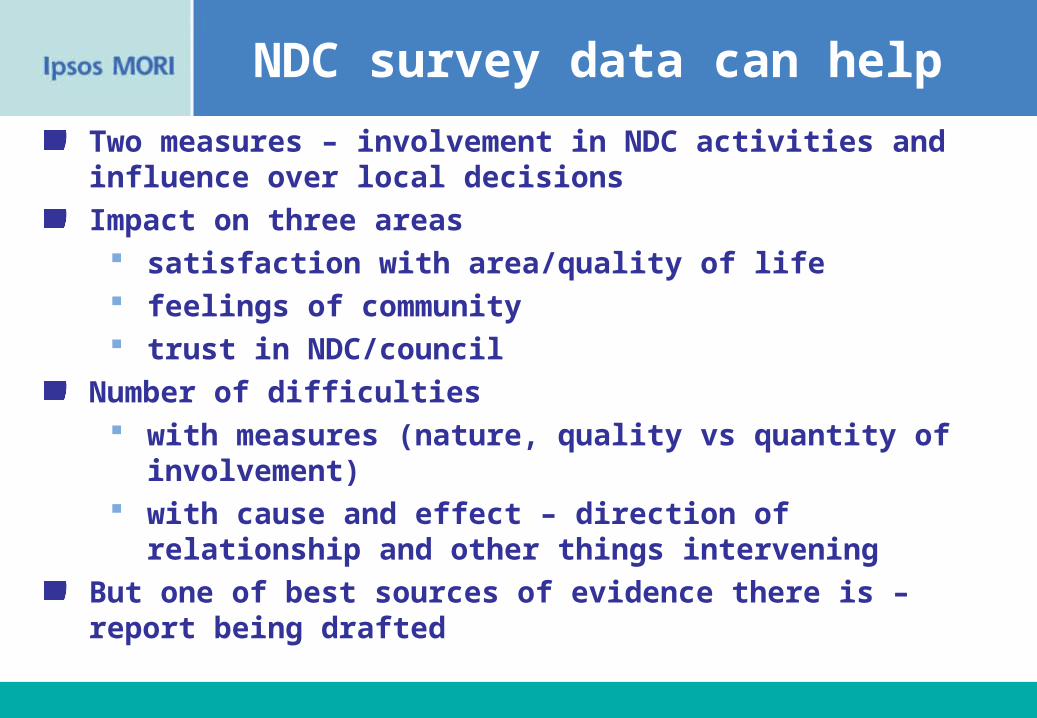
Two measures – involvement in NDC activities and influence over local decisions
Impact on three areas satisfaction with area/quality of life feelings of community trust in NDC/council
Number of difficulties with measures (nature, quality vs quantity of
involvement) with cause and effect – direction of relationship and
other things intervening
But one of best sources of evidence there is – report being drafted
NDC survey data can help
5
Is involvement/influence related to positive outcomes?
Four types of survey evidence

6
86%
73%
78%
50%
54%
80%
Influence vs. contentment with local area
Good quality of life
Satisfied with area
Feel NDC improved area
Feel able to influence
Don’t feel able to influence
Source: NDC Survey 2006Base: 15,972 residents aged 16+
7
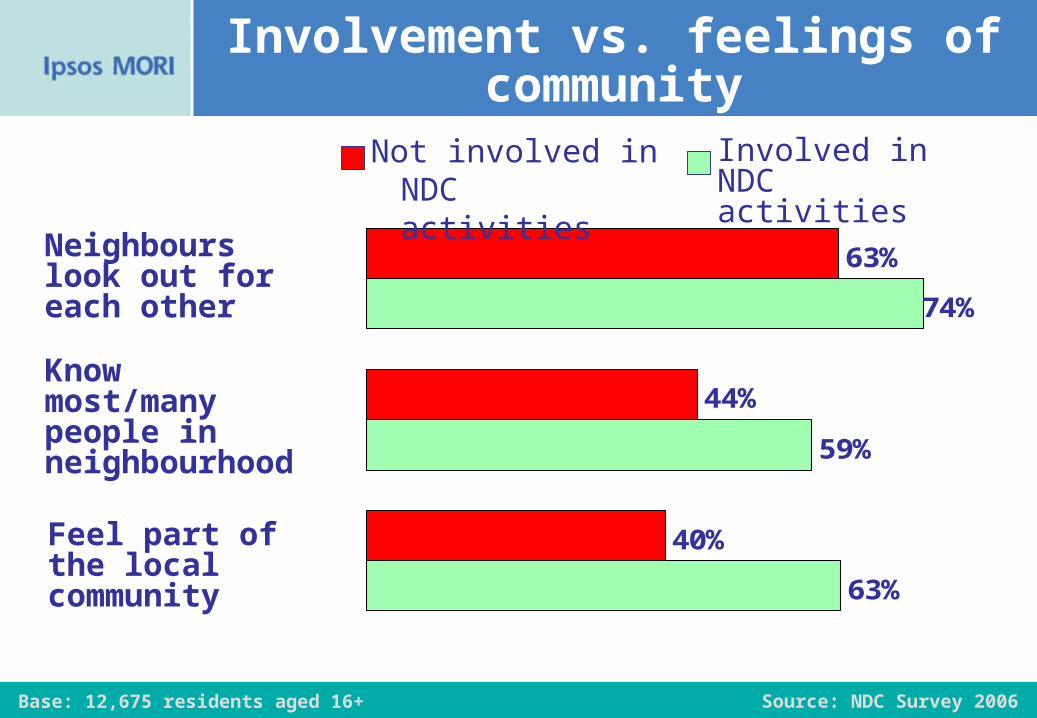
63%
59%
40%
44%
63%
74%
Involvement vs. feelings of community
Neighbours look out for each other
Know most/many people in neighbourhood
Feel part of the local community
Involved in NDC activities
Not involved in NDC activities
Source: NDC Survey 2006Base: 12,675 residents aged 16+
8
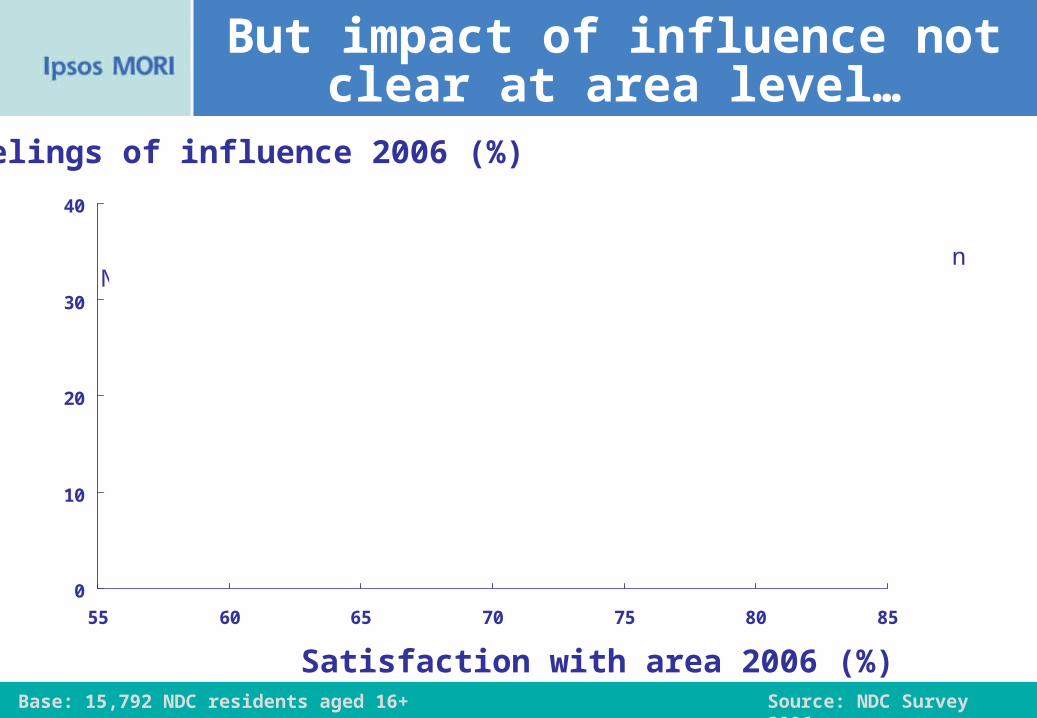
But impact of influence not clear at area level…
R2 = 0.003
0
10
20
30
40
55 60 65 70 75 80 85
Satisfaction with area 2006 (%)
Feelings of influence 2006 (%)
Source: NDC Survey 2006Base: 15,792 NDC residents aged 16+
Nottingham
Liverpool
HaringeyIslingtonSheffield
Fulham
Hull
B’ham Aston
Brent
Doncaster
9
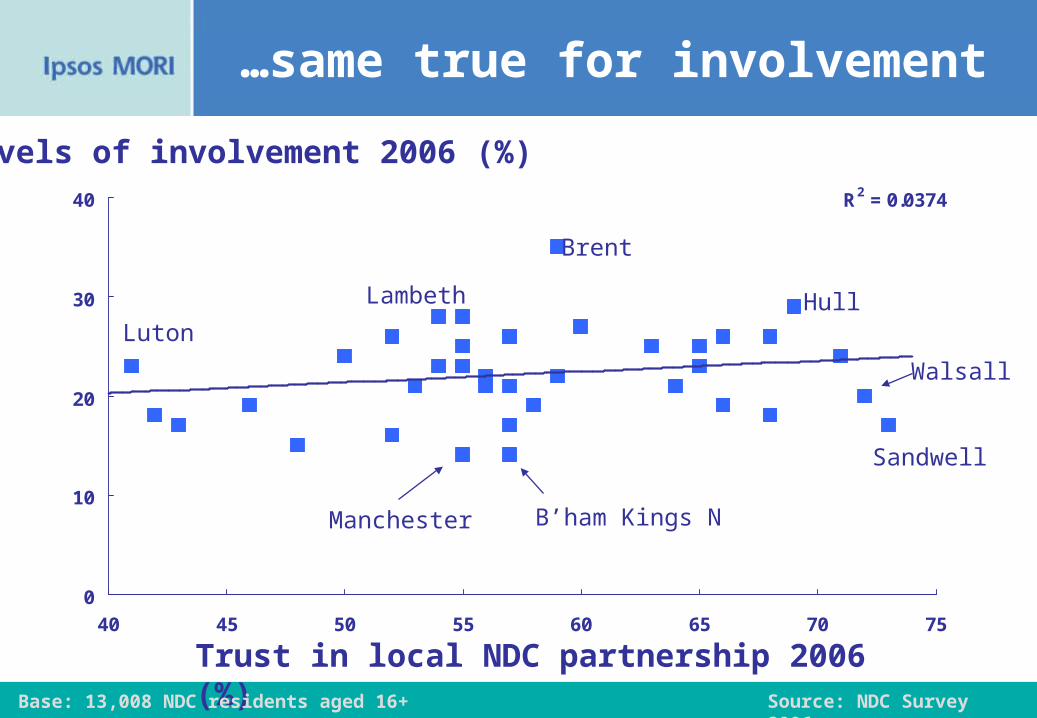
…same true for involvement
R2 = 0.0374
0
10
20
30
40
40 45 50 55 60 65 70 75
Trust in local NDC partnership 2006 (%)
Levels of involvement 2006 (%)
Source: NDC Survey 2006Base: 13,008 NDC residents aged 16+
Brent
Luton
Sandwell
Manchester B’ham Kings N
Hull
Walsall
Lambeth
10
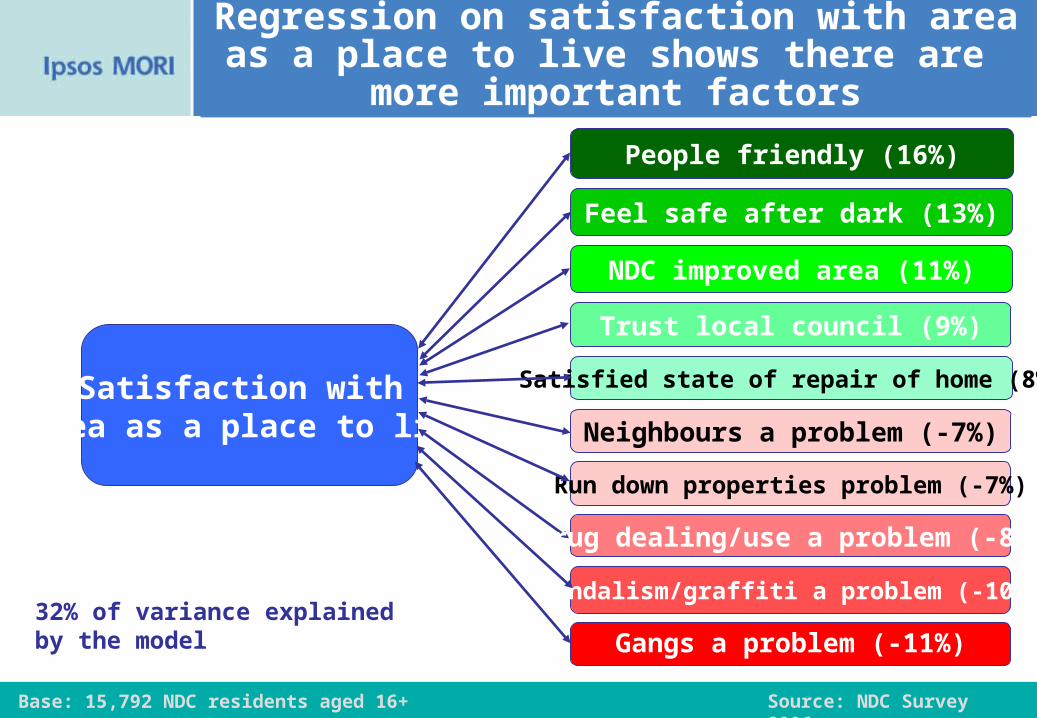
Regression on satisfaction with area as a place to live shows there are
more important factors
32% of variance explained by the model
Satisfaction with area as a place to live
Source: NDC Survey 2006
People friendly (16%)
Feel safe after dark (13%)
NDC improved area (11%)
Trust local council (9%)
Satisfied state of repair of home (8%)
Neighbours a problem (-7%)
Run down properties problem (-7%)
Drug dealing/use a problem (-8%)
Vandalism/graffiti a problem (-10%)
Gangs a problem (-11%)
Base: 15,792 NDC residents aged 16+
11
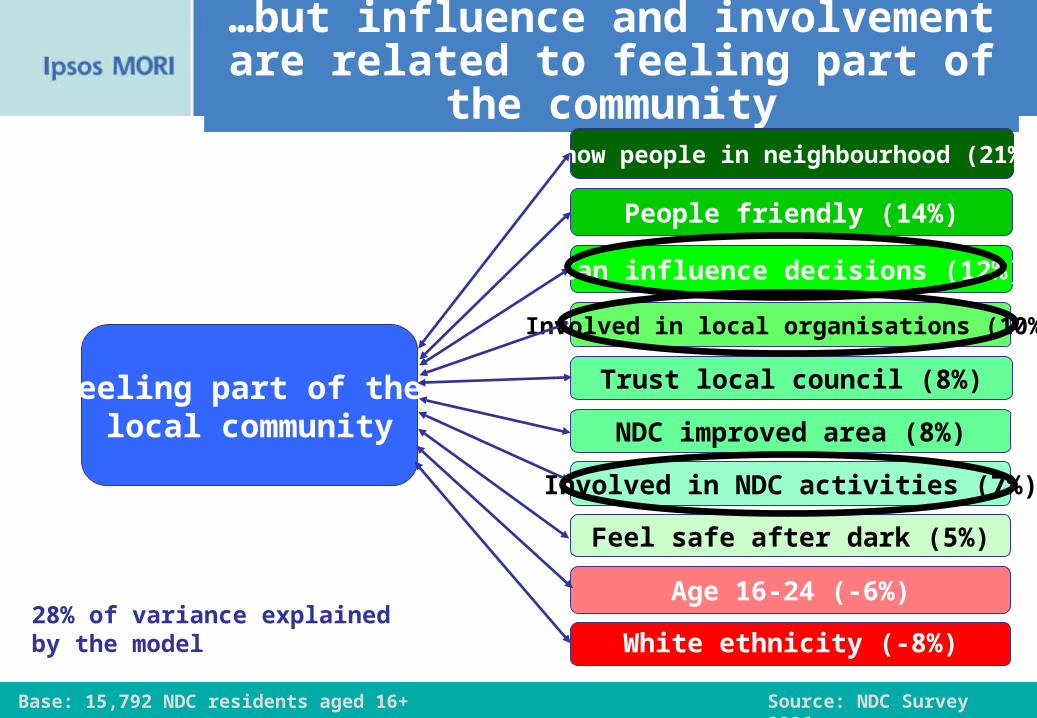
…but influence and involvement are related to feeling part of the
community
28% of variance explained by the model
Feeling part of the local community
Can influence decisions (12%)
Involved in NDC activities (7%)
Know people in neighbourhood (21%)
People friendly (14%)
Involved in local organisations (10%)
Trust local council (8%)
NDC improved area (8%)
Feel safe after dark (5%)
Age 16-24 (-6%)
White ethnicity (-8%)
Source: NDC Survey 2006Base: 15,792 NDC residents aged 16+
12
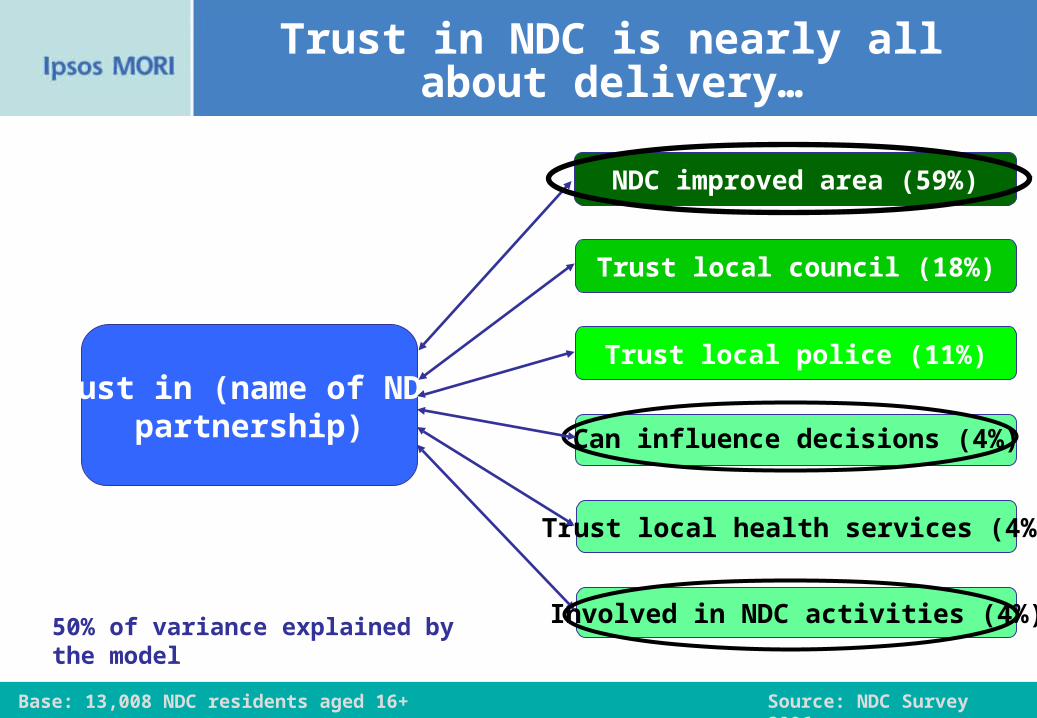
Trust in NDC is nearly all about delivery…
50% of variance explained by the model
Trust in (name of NDC partnership)
NDC improved area (59%)
Trust local council (18%)
Trust local police (11%)
Trust local health services (4%)
Can influence decisions (4%)
Involved in NDC activities (4%)
Source: NDC Survey 2006Base: 13,008 NDC residents aged 16+
13
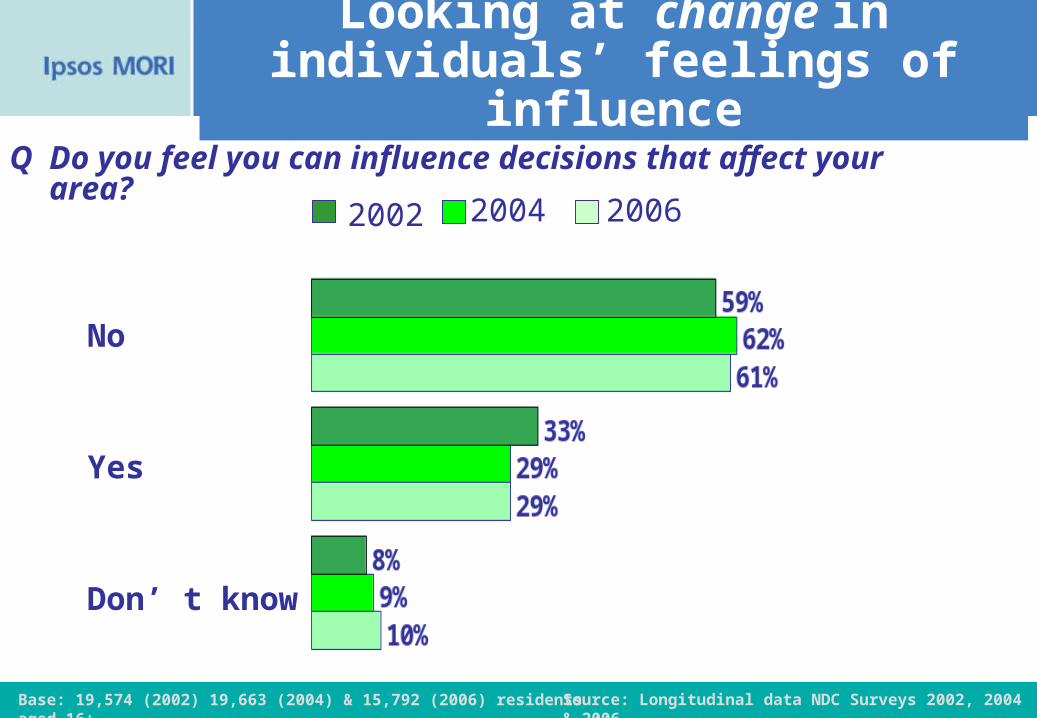
Looking at change in individuals’ feelings of influence
No
Q Do you feel you can influence decisions that affect your area?
Yes
Don’ t know
2002 2004 2006
Source: Longitudinal data NDC Surveys 2002, 2004 & 2006Base: 19,574 (2002) 19,663 (2004) & 15,792 (2006) residents aged 16+

14
But hides greater individual change…
Never felt able to influence
Q Do you feel you can influence decisions that affect your area?
Did feel able in 2002, do not in 2006
Did not feel able in 2002, do feel able in 2006
Have always felt able to influence
Source: Longitudinal data NDC Surveys 2002 & 2006
Base: 19,574 (2002) & 15,792 (2006) residents aged 16+
49%
11%
13%
12%
15
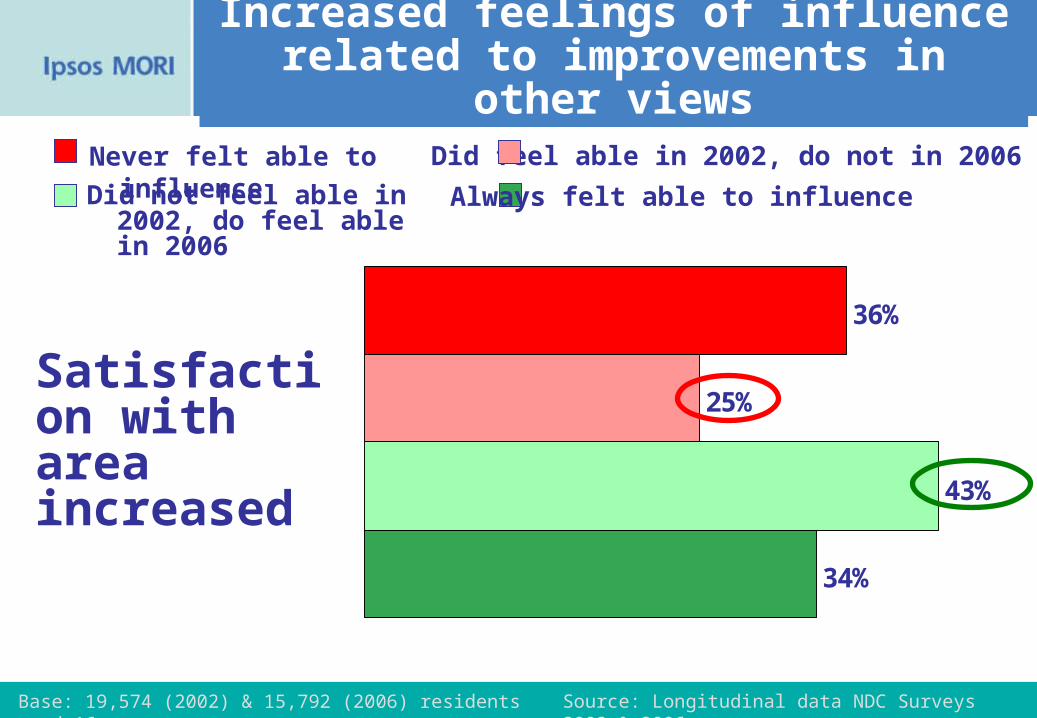
34%
43%
25%
36%
Increased feelings of influence related to improvements in other views
Did not feel able in 2002, do feel able in 2006
Always felt able to influence
Did feel able in 2002, do not in 2006Never felt able to influence
Satisfaction with area increased
Source: Longitudinal data NDC Surveys 2002 & 2006Base: 19,574 (2002) & 15,792 (2006) residents aged 16+
16
Mixed evidence – but overall fairly encouraging (if have reasonable expectations)?
More important things in determining some of the outcomes claimed for involvement/influence – but seems key for others
Although note lapsed involved/influencers tend to be most negative – one of the risks of promoting involvement?
BUT unpicking cause and effect very difficult, even with longitudinal data
Needs more work – but firm evidence very difficult Experimental design varying levels of involvement, with pre/post
measures? Need better measures of reasons for and nature/quality of involvement Return to people to unpick reasons for responses?
Initial conclusions