Embed Size (px)
Citation preview
Searching for gravitational radiation from Scorpius X-1: Limits from the second LIGO
science run
Alberto Vecchio
on behalf of the LIGO Scientific Collaboration
GWDAW10 - UTB, 14th - 17th December, 2005
LIGO - G05xxxx
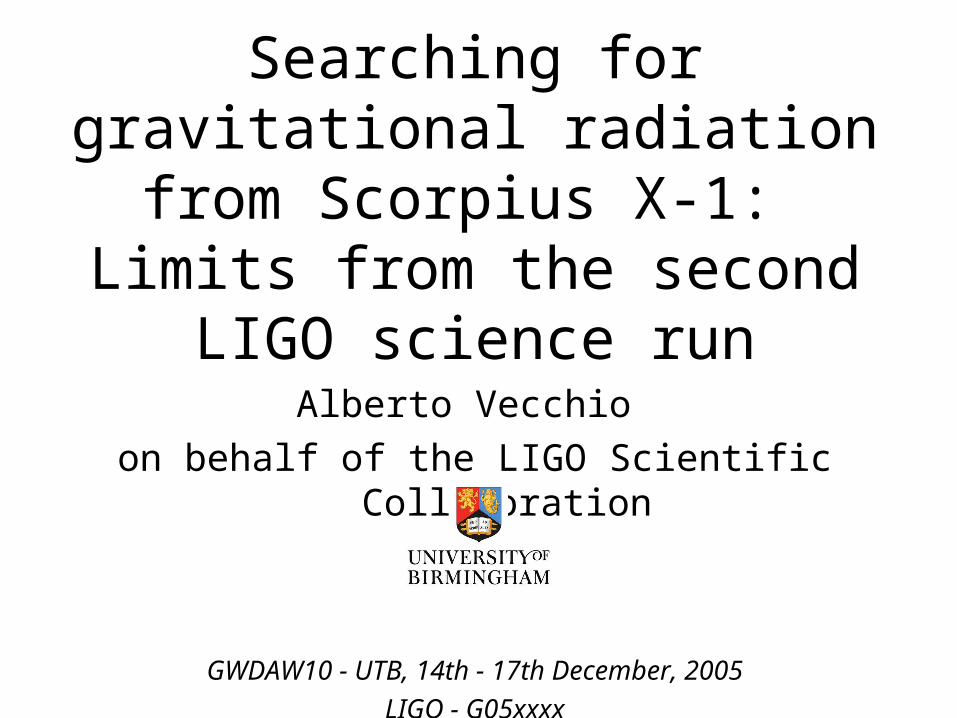
Outline
• Analyses carried out by the LSC Pulsar group• Coherent wide parameter space searches:
several astrophysical targets– This talk: Scorpius X-1 (low-mass X-ray binary)
• Second LIGO science run (S2)• Method and results from the Sco X-1 analysis
using S2 data• Ongoing work and future plans
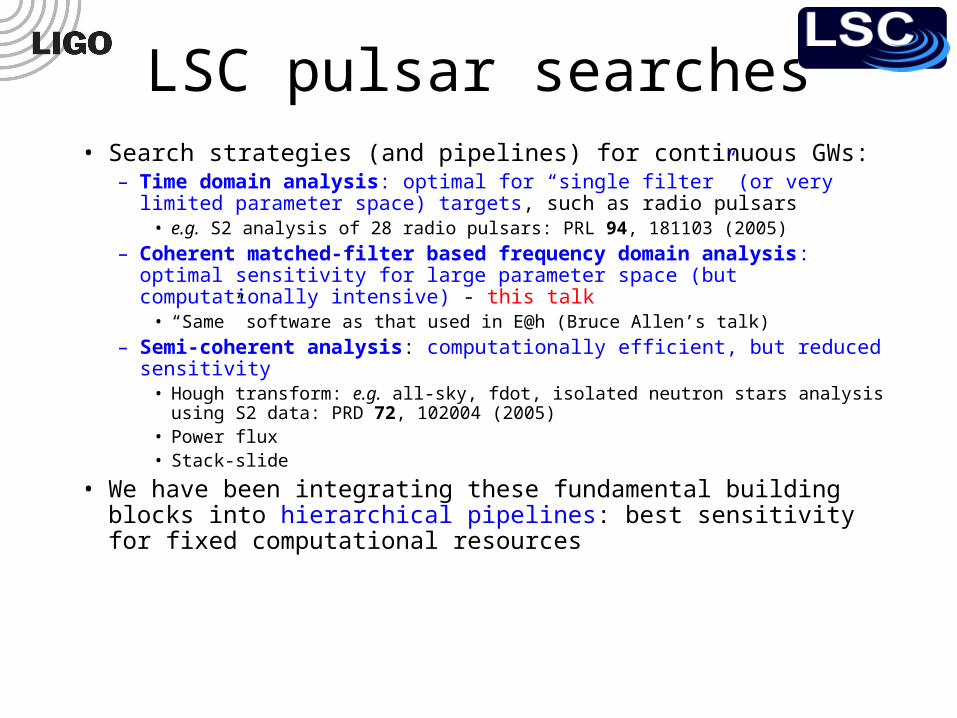
LSC pulsar searches• Search strategies (and pipelines) for continuous GWs:
– Time domain analysis: optimal for “single filter” (or very limited parameter space) targets, such as radio pulsars
• e.g. S2 analysis of 28 radio pulsars: PRL 94, 181103 (2005)
– Coherent matched-filter based frequency domain analysis: optimal sensitivity for large parameter space (but computationally intensive) - this talk
• “Same” software as that used in E@h (Bruce Allen’s talk)
– Semi-coherent analysis: computationally efficient, but reduced sensitivity • Hough transform: e.g. all-sky, fdot, isolated neutron stars analysis using S2 data:
PRD 72, 102004 (2005)• Power flux• Stack-slide
• We have been integrating these fundamental building blocks into hierarchical pipelines: best sensitivity for fixed computational resources
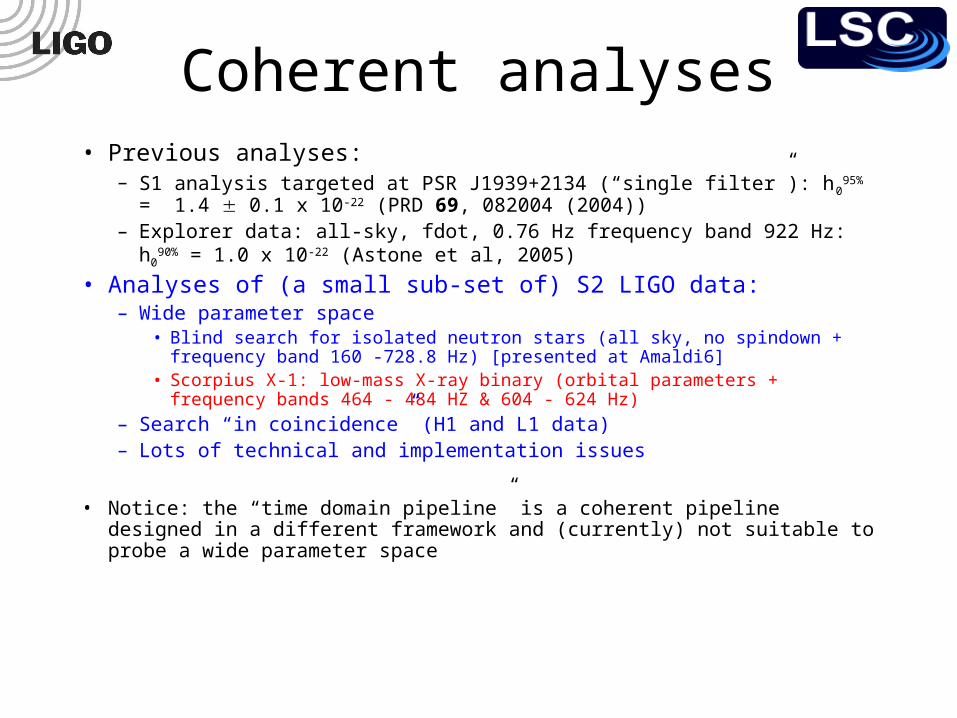
Coherent analyses• Previous analyses:
– S1 analysis targeted at PSR J1939+2134 (“single filter”): h095% = 1.4 0.1 x
10-22 (PRD 69, 082004 (2004))– Explorer data: all-sky, fdot, 0.76 Hz frequency band 922 Hz: h0
90% = 1.0 x 10-
22 (Astone et al, 2005)
• Analyses of (a small sub-set of) S2 LIGO data:– Wide parameter space
• Blind search for isolated neutron stars (all sky, no spindown + frequency band 160 -728.8 Hz) [presented at Amaldi6]
• Scorpius X-1: low-mass X-ray binary (orbital parameters + frequency bands 464 - 484 HZ & 604 - 624 Hz)
– Search “in coincidence” (H1 and L1 data)– Lots of technical and implementation issues
• Notice: the “time domain pipeline” is a coherent pipeline designed in a different framework and (currently) not suitable to probe a wide parameter space
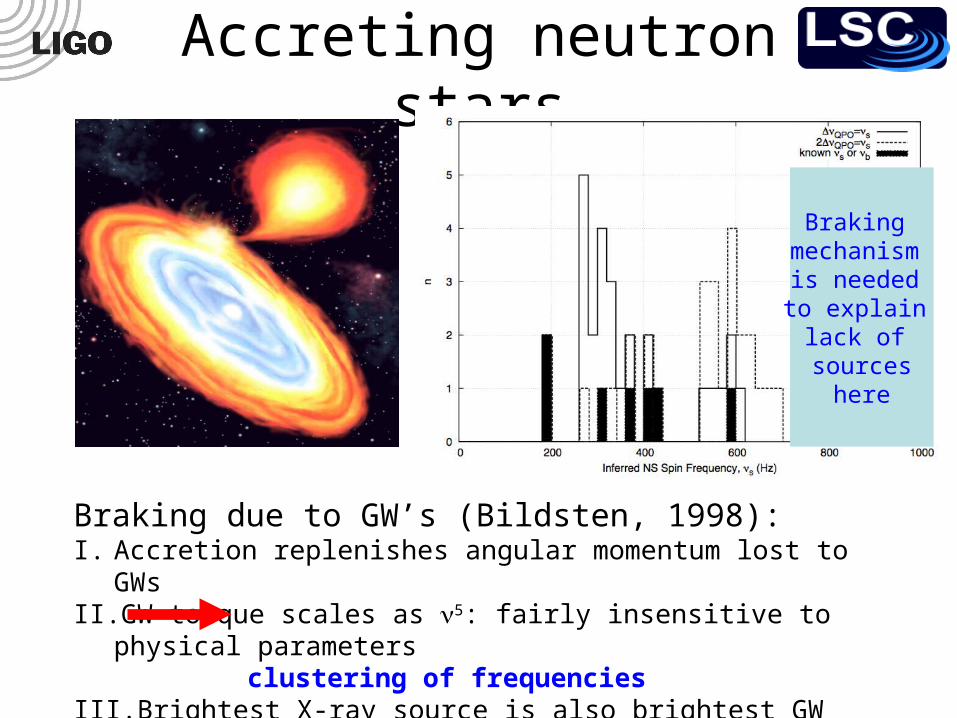
Accreting neutron stars
Braking mechanism is needed to explain lack of sourceshere
Braking due to GW’s (Bildsten, 1998):I. Accretion replenishes angular momentum lost to GWsII. GW torque scales as 5: fairly insensitive to physical parameters
clustering of frequenciesIII. Brightest X-ray source is also brightest GW source: Sco X-1
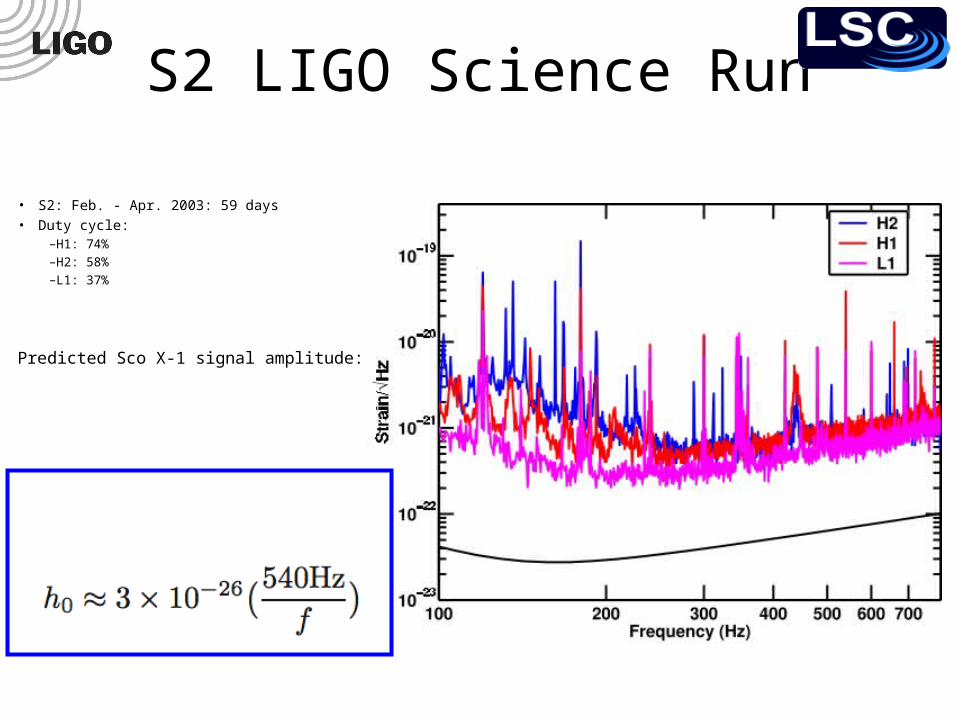
S2 LIGO Science Run
• S2: Feb. - Apr. 2003: 59 days • Duty cycle:
–H1: 74%–H2: 58%–L1: 37%
Predicted Sco X-1 signal amplitude:
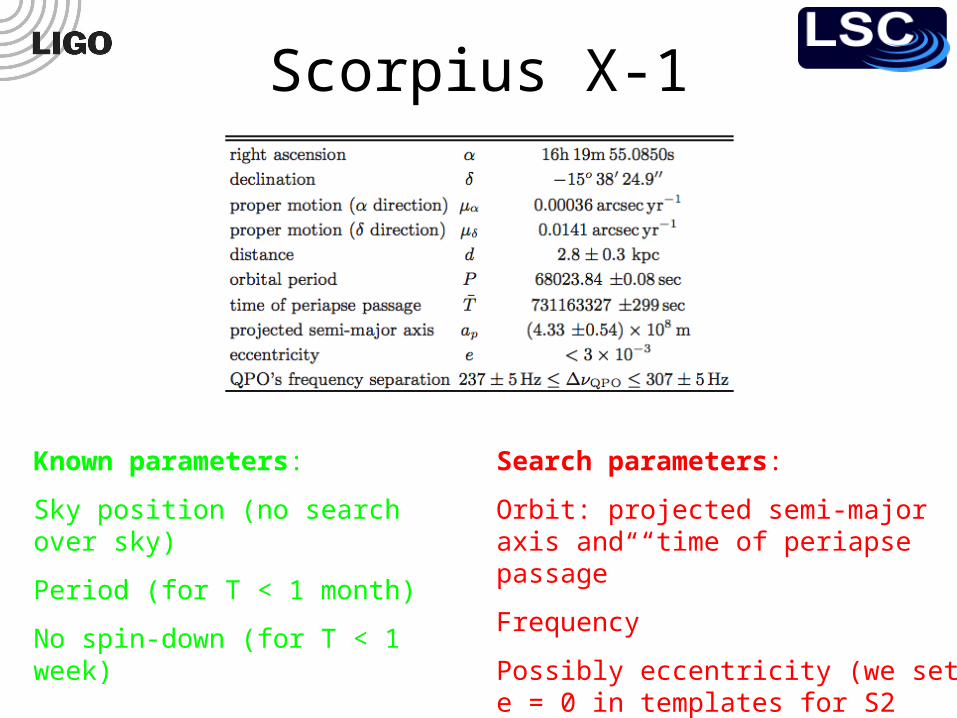
Scorpius X-1
Known parameters:
Sky position (no search over sky)
Period (for T < 1 month)
No spin-down (for T < 1 week)
Search parameters:
Orbit: projected semi-major axis and “time of periapse passage”
Frequency
Possibly eccentricity (we set e = 0 in templates for S2 search)
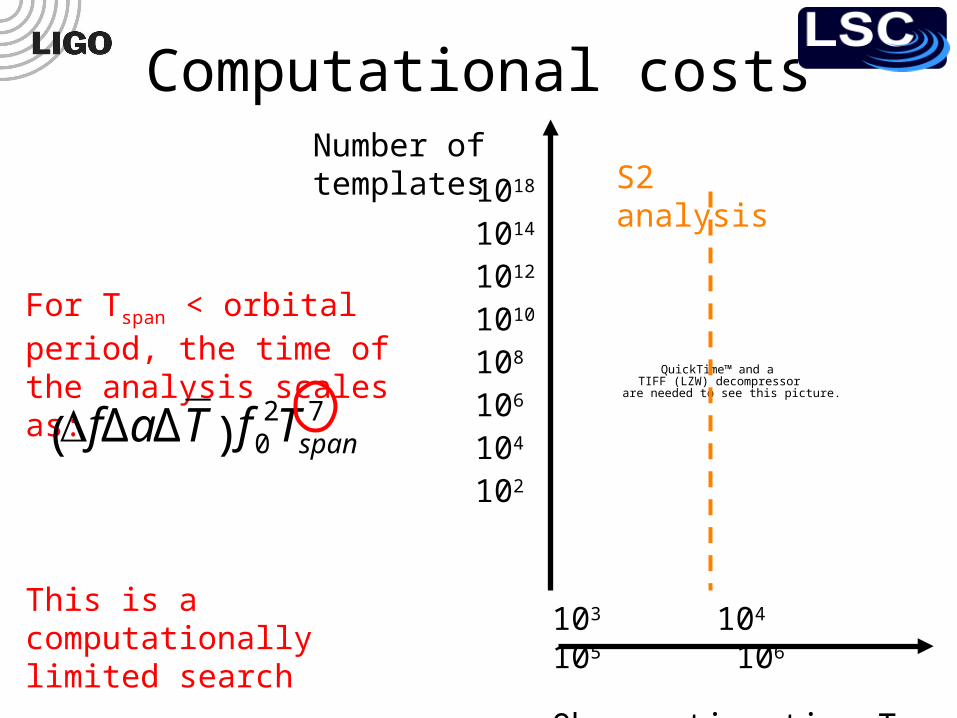
Computational costs
QuickTime™ and aTIFF (LZW) decompressor
are needed to see this picture.
For Tspan < orbital period, the time of the analysis scales as:
This is a computationally limited search
€
ΔfΔaΔT( ) f02Tspan
7
103 104 105 106
Observation time Tspan /sec
1018
1014
1012
1010
108
106
104
102
Number of templates S2 analysis
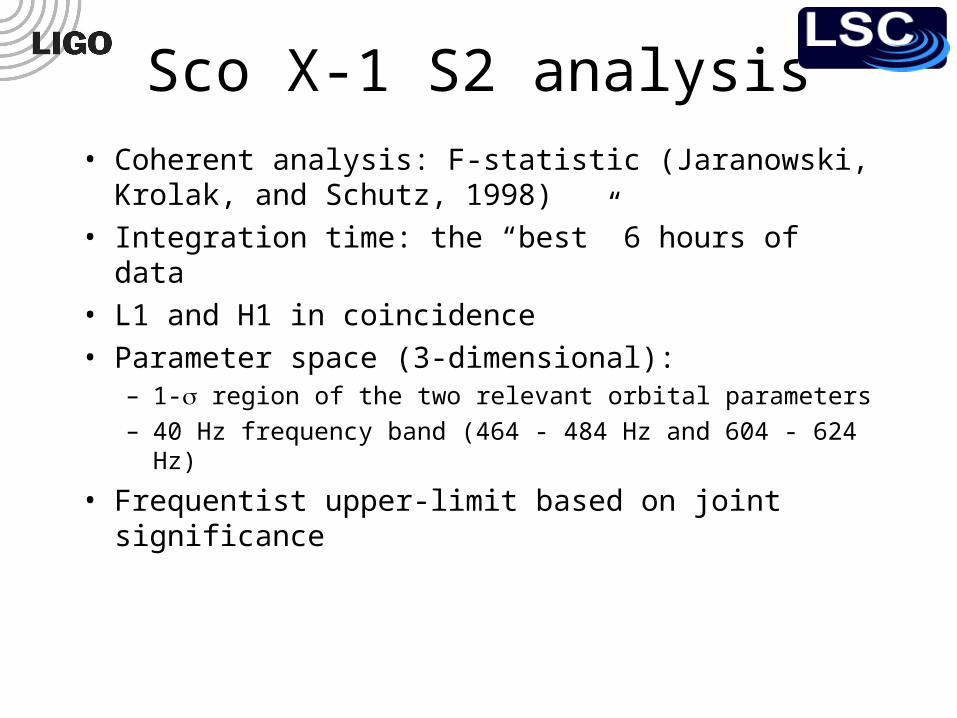
Sco X-1 S2 analysis• Coherent analysis: F-statistic (Jaranowski, Krolak,
and Schutz, 1998)• Integration time: the “best” 6 hours of data• L1 and H1 in coincidence• Parameter space (3-dimensional):
– 1- region of the two relevant orbital parameters– 40 Hz frequency band (464 - 484 Hz and 604 - 624 Hz)
• Frequentist upper-limit based on joint significance
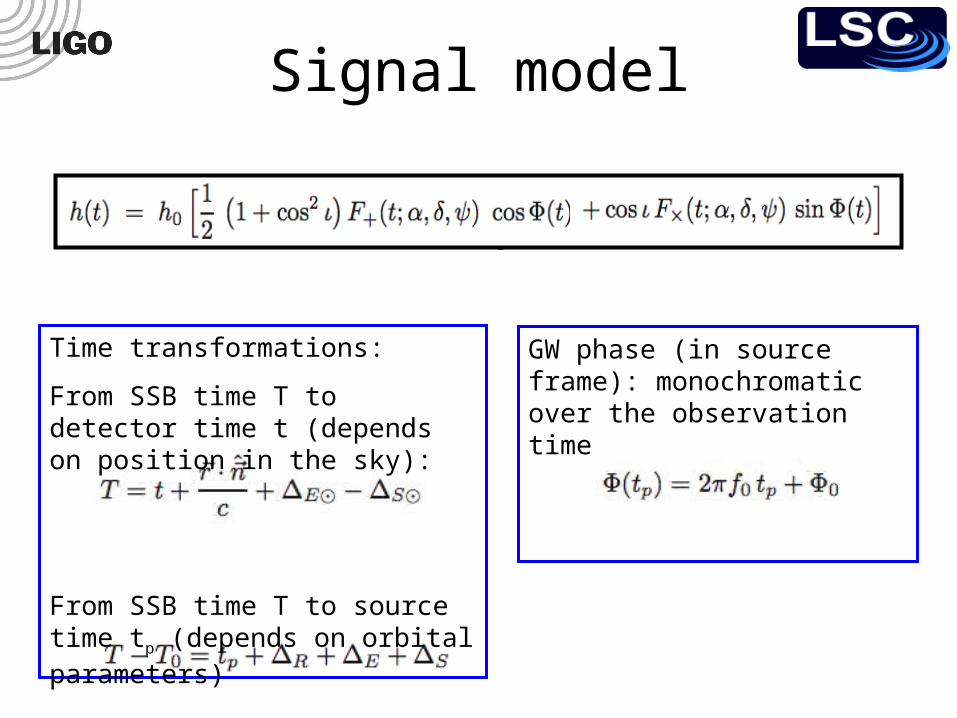
Signal model
GW phase (in source frame): monochromatic over the observation time
Time transformations:
From SSB time T to detector time t (depends on position in the sky):
From SSB time T to source time tp (depends on orbital parameters)
QuickTime™ and aTIFF (Uncompressed) decompressor
are needed to see this picture.
Pipeline
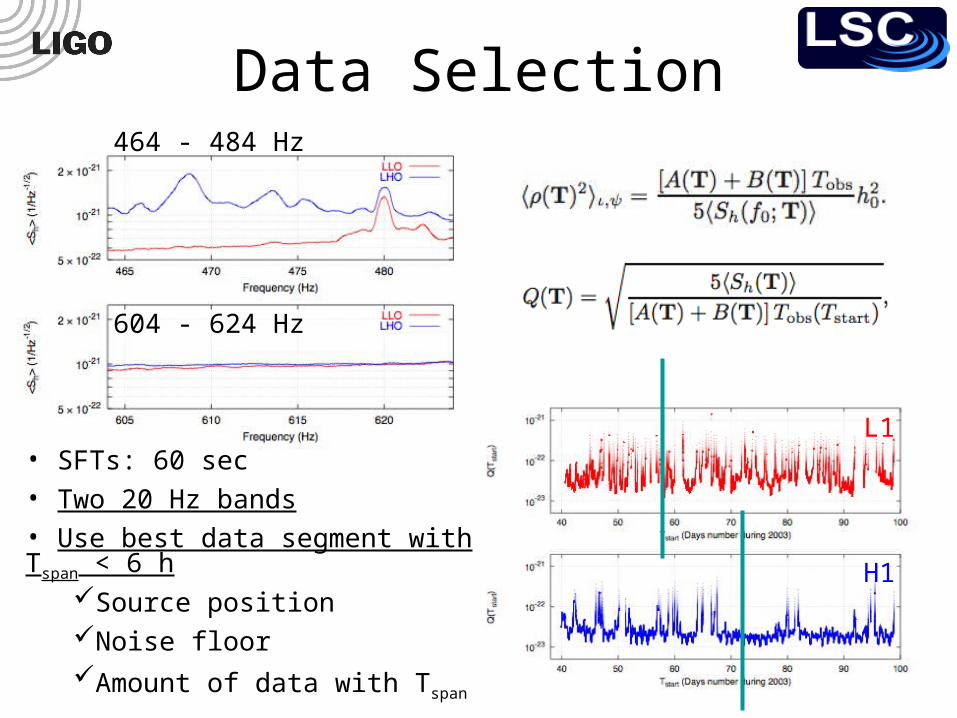
Data Selection
• SFTs: 60 sec• Two 20 Hz bands
• Use best data segment with Tspan < 6 h Source positionNoise floorAmount of data with Tspan
464 - 484 Hz
604 - 624 Hz
L1
H1
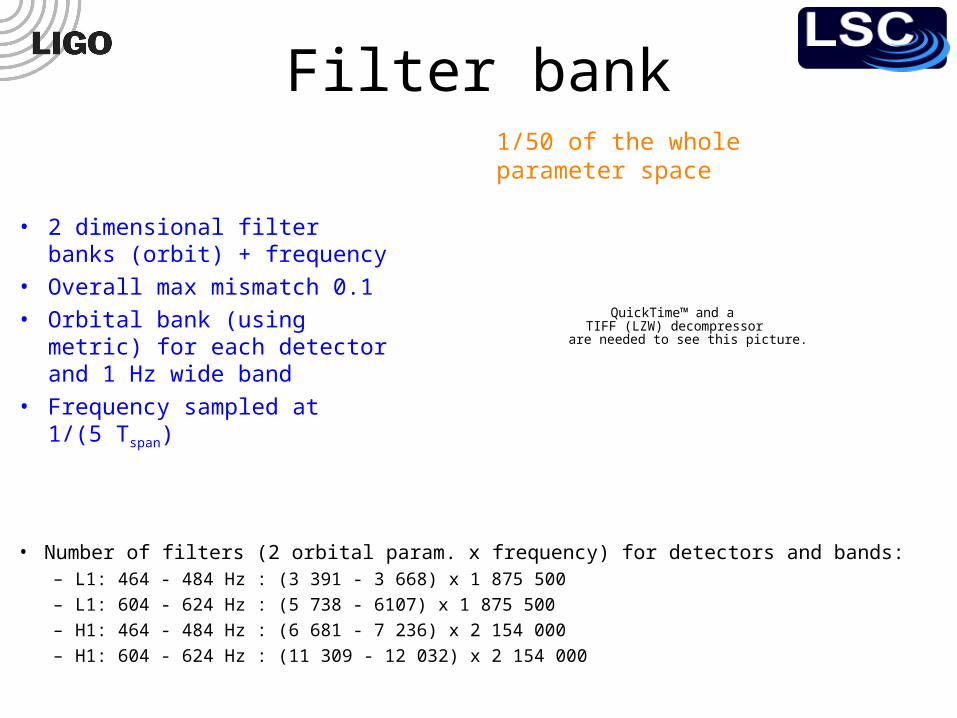
Filter bank
• Number of filters (2 orbital param. x frequency) for detectors and bands:– L1: 464 - 484 Hz : (3 391 - 3 668) x 1 875 500– L1: 604 - 624 Hz : (5 738 - 6107) x 1 875 500 – H1: 464 - 484 Hz : (6 681 - 7 236) x 2 154 000– H1: 604 - 624 Hz : (11 309 - 12 032) x 2 154 000
• 2 dimensional filter banks (orbit) + frequency
• Overall max mismatch 0.1 • Orbital bank (using metric) for
each detector and 1 Hz wide band
• Frequency sampled at 1/(5 Tspan)
QuickTime™ and aTIFF (LZW) decompressor
are needed to see this picture.
1/50 of the whole parameter space
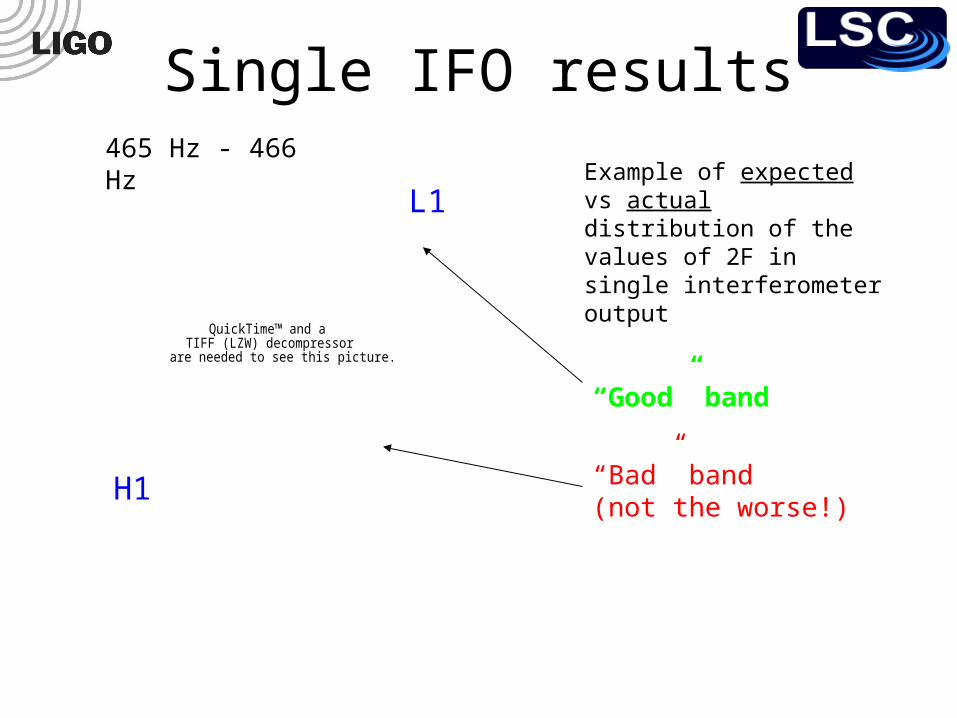
Single IFO results
QuickTime™ and aTIFF (LZW) decompressor
are needed to see this picture.
465 Hz - 466 HzExample of expected vs actual distribution of the values of 2F in single interferometer output
“Good” band
“Bad” band (not the worse!)
L1
H1
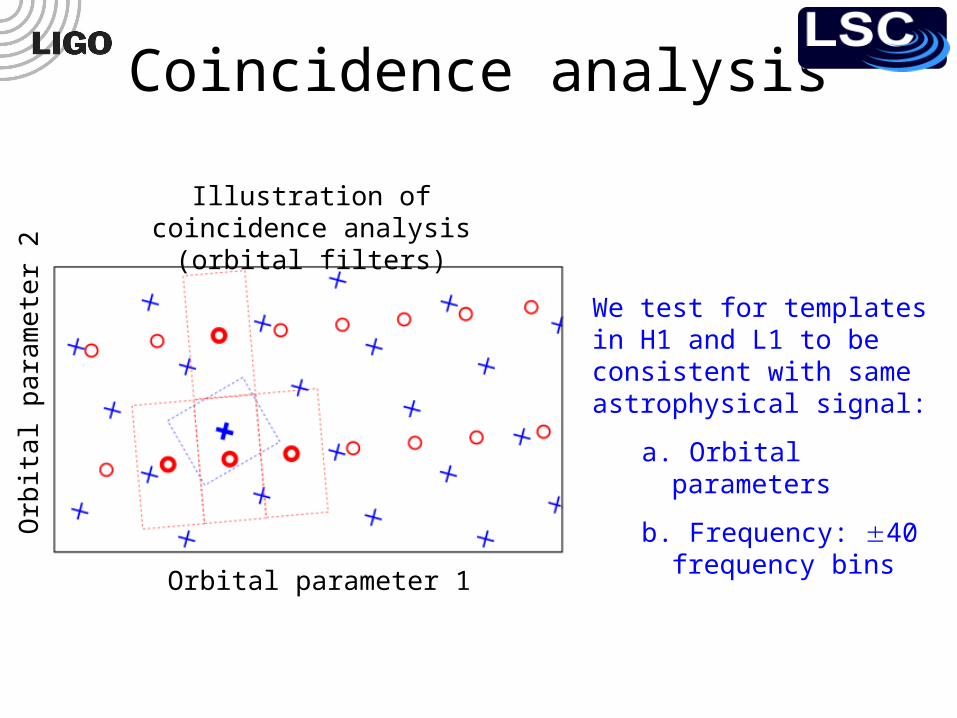
Coincidence analysis
Illustration of coincidence analysis (orbital filters)
We test for templates in H1 and L1 to be consistent with same astrophysical signal:
a. Orbital parameters
b. Frequency: 40 frequency bins
Orbital parameter 1
Orb
ital p
ara
me
ter
2
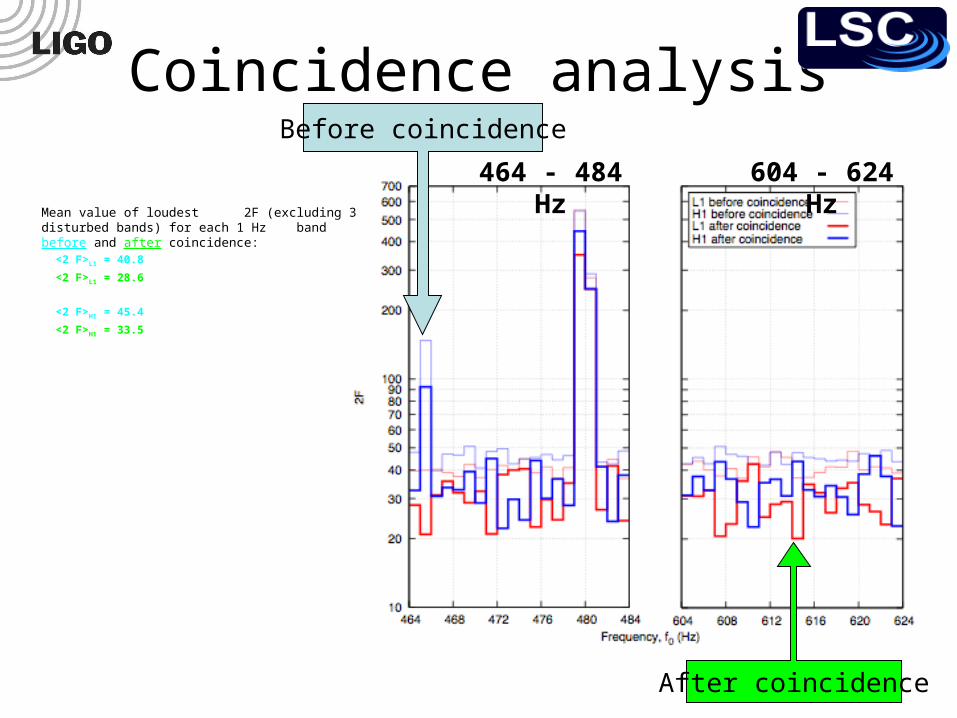
Coincidence analysisBefore coincidence
After coincidence
464 - 484 Hz 604 - 624 HzMean value of loudest 2F (excluding 3 disturbed bands) for each 1 Hz band before and after coincidence:
<2 F>L1 = 40.8
<2 F>L1 = 28.6
<2 F>H1 = 45.4
<2 F>H1 = 33.5
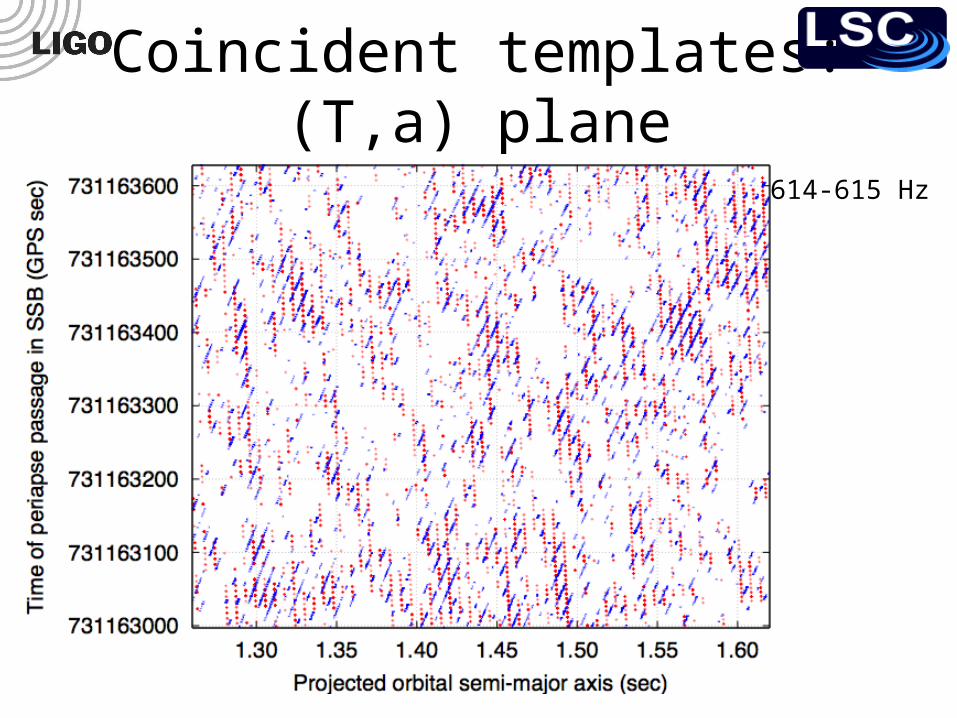
Coincident templates:(T,a) plane
614-615 Hz
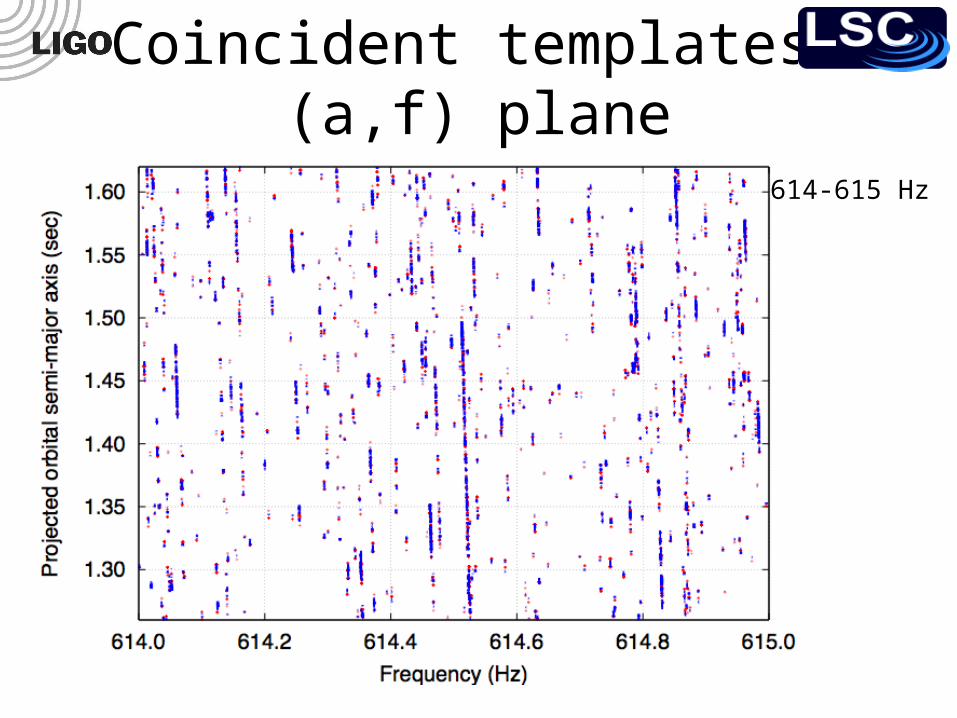
Coincident templates:(a,f) plane
614-615 Hz
Setting an upper limit
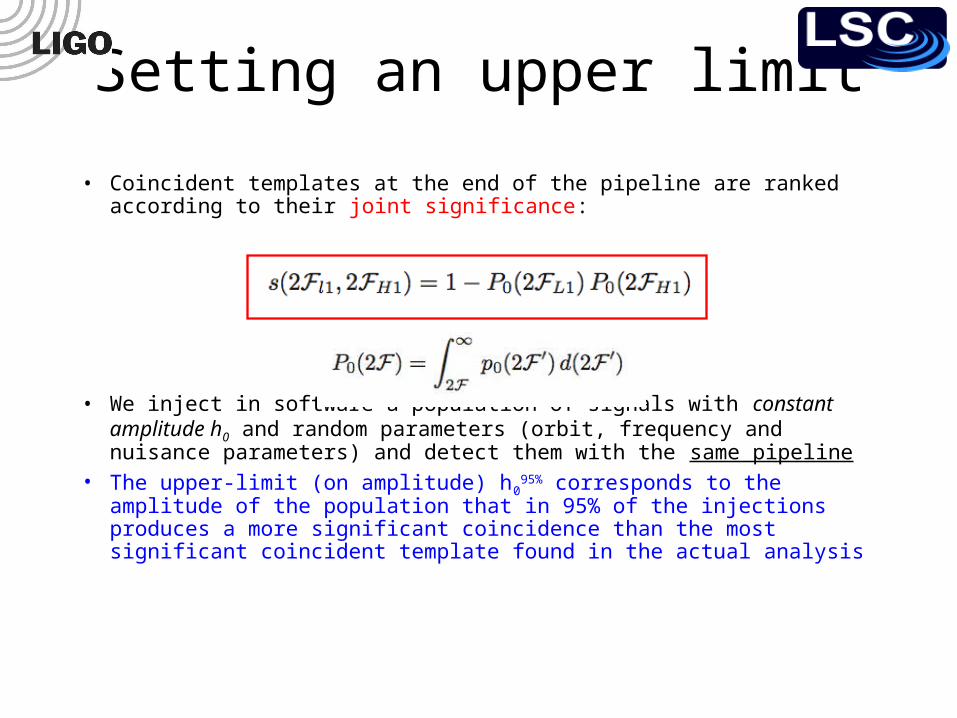
• Coincident templates at the end of the pipeline are ranked according to their joint significance:
• We inject in software a population of signals with constant amplitude h0 and random parameters (orbit, frequency and nuisance parameters) and detect them with the same pipeline
• The upper-limit (on amplitude) h095% corresponds to the amplitude of
the population that in 95% of the injections produces a more significant coincidence than the most significant coincident template found in the actual analysis
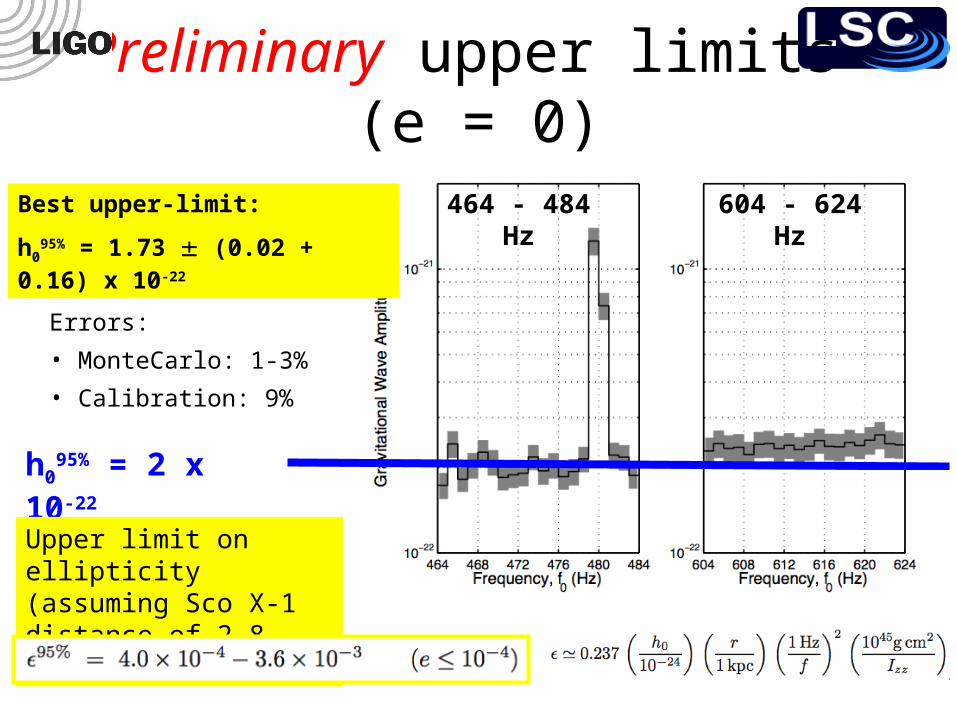
Preliminary upper limits (e = 0)
464 - 484 Hz 604 - 624 Hz
h095% = 2 x 10-22
Errors:
• MonteCarlo: 1-3%
• Calibration: 9%
Best upper-limit:
h095% = 1.73 (0.02 + 0.16) x 10-22
Upper limit on ellipticity (assuming Sco X-1 distance of 2.8 kpc):
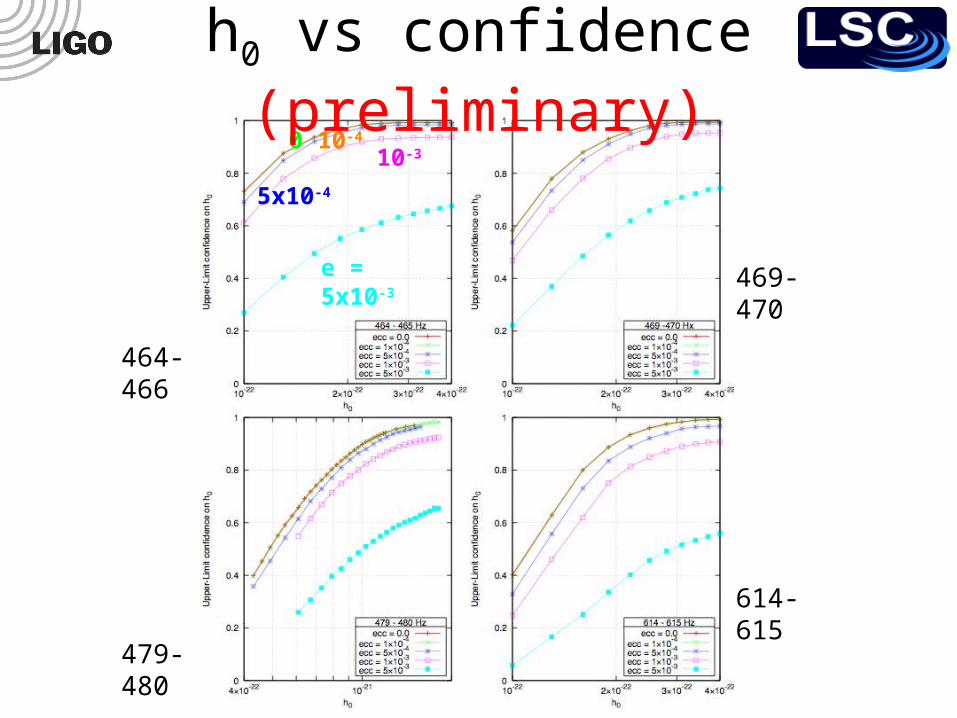
469-470
464-466
614-615
479-480
e = 5x10⁻³
10-3
5x10⁻⁴
0 10-4
h0 vs confidence (preliminary)
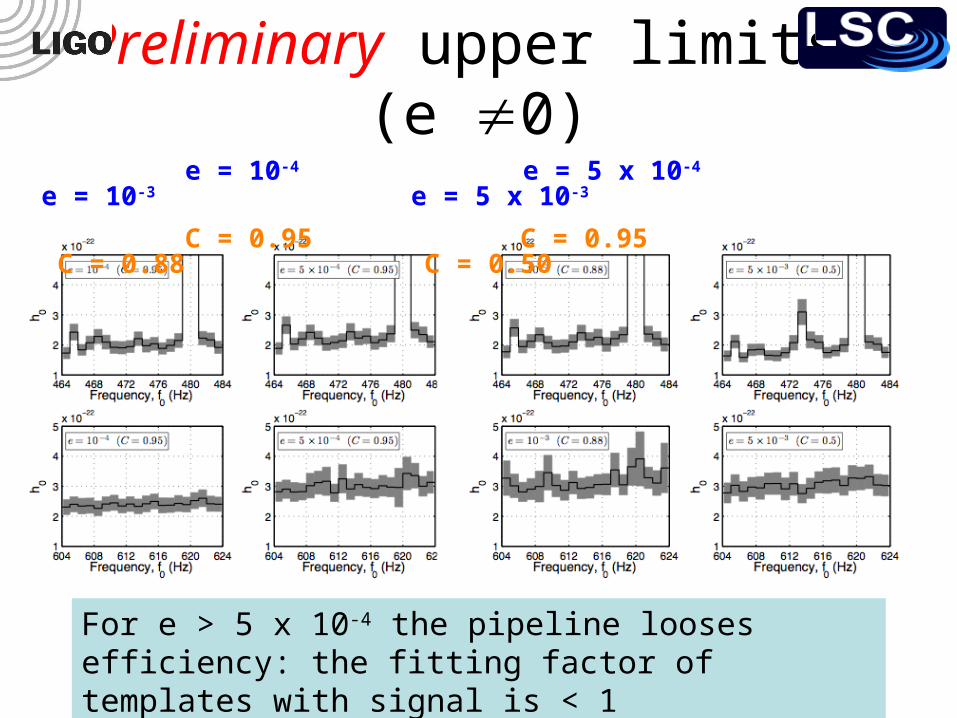
Preliminary upper limits (e 0)
e = 10-4 e = 5 x 10⁻⁴ e = 10-3 e = 5 x 10⁻³
C = 0.95 C = 0.95 C = 0.88 C = 0.50
For e > 5 x 10⁻⁴ the pipeline looses efficiency: the fitting factor of templates with signal is < 1
Conclusions• Coherent analyses in coincidence of S2 data over a wide parameter
space:– Blind search for isolated neutron stars over 10 hours of data: all sky, no
spindowns, frequency band 160 -728.8 Hz– Scorpius X-1 over 6 hours of data: orbital parameters and frequency bands 464
- 484 Hz & 604 - 624 Hz
• First (preliminary) upper limit on gravitational radiation from Sco X-1: h0
95% ~ 2 x 10-22 and 95% ~ 5 x 10⁻⁴
• Future work:– Pipeline: incorporated as coherent stage into hierarchical search schemes– Accreting neutron stars:
• Same pipeline used to target X-ray accreting milli-second neutron stars (source parameters much better known) over whole S4/5
• Hierarchical search using whole S4/5 aimed at Sco X-1 and the other low mass x-ray binaries
• How close can we get to the predicted signal strength?