Embed Size (px)
Citation preview
General rights Copyright and moral rights for the publications made accessible in the public portal are retained by the authors and/or other copyright owners and it is a condition of accessing publications that users recognise and abide by the legal requirements associated with these rights.
Users may download and print one copy of any publication from the public portal for the purpose of private study or research.
You may not further distribute the material or use it for any profit-making activity or commercial gain
You may freely distribute the URL identifying the publication in the public portal If you believe that this document breaches copyright please contact us providing details, and we will remove access to the work immediately and investigate your claim.
Downloaded from orbit.dtu.dk on: Jan 19, 2020
Searching for electrolytes and electrodes for CO2 reduction below 300 °C
Vico, Federica
Publication date:2015
Document VersionPublisher's PDF, also known as Version of record
Link back to DTU Orbit
Citation (APA):Vico, F. (2015). Searching for electrolytes and electrodes for CO
2 reduction below 300 °C. Department of
Energy Conversion and Storage, Technical University of Denmark.
Searching for electrolytes and electrodes for
CO2 reduction below 300 °C
Federica Vico
Department of Energy Conversion and Storage
Ph.D. Thesis, May 2015
DTU Energy
Department of Energy Conversion and Storage

I
Abstract
Electrochemical CO2 reduction research is driven by the desire to reduce reliance on fossil fuels and
lower greenhouse gas emissions. The conversion of CO2 into fuels and chemicals using energy
derived from a renewable source, such as wind or solar, could replace the use of fossil fuels.
This thesis uses the knowledge derived from earlier investigations on electrolysis techniques as the
foundation for an exploratory work to find acceptable materials and fabricate an electrochemical
cell able to produce hydrocarbons and alcohols directly from reduction of CO2 and steam. The
operating conditions should be between 200 – 300 ⁰C and at elevated pressure in the range of 20 –
30 bar. The temperature range is chosen according to the thermal stability of the hydrocarbons
produced by conversion of CO2. The electrochemical performance of the fabricated cells was
evaluated using electrochemical impedance spectroscopy and chronoamperometry, while the gas
analysis was carried out via gas chromatography.
The initial part of the study focused on electrolyte materials in order to identify a promising
candidate to be implemented in the full cells. Some proton conducting materials, such as Y-doped
BaZrO3-BaCeO3 solid solutions and K-doped BaZr1-xYxO3-δ were evaluated. BaCe0.5Zr0.4Y0.1O3-δ
would have been the best electrolyte candidate because of its low resistivity in high pH2O (2 · 10-3
S/cm) even at temperatures as low as 240 °C. However, the instability in the acidic CO2 gas
atmosphere hinders practical application for carbon dioxide reduction at high pressure. K-doped
BaZr1-xYxO3-δ was successfully synthesized by hydrothermal technique, but the conductivity
recorded in high pH2O and at 240 °C was too low (3 · 10-5
S/cm) to be considered as a suitable
electrolyte.
A literature survey showed that most CO2 reduction studies were performed in aqueous potassium
bicarbonate (KHCO3) and with a copper metal catalyst. Therefore, it was decided to investigate the
electrocatalytic activity of copper foam in aqueous media at ambient conditions for electrochemical
reduction of CO2. The measurements were conducted at Stanford University – Chemical Engineer
Department, where it was possible to utilize an experimental setup which ensures high sensitivity
for minor products from the CO2 reduction reaction. Seven products were identified with the copper
foam electrode tested to -0.98 V vs. RHE. H2, formate and CO were the main products observed
and in particular the faradaic efficiency of H2 was ca. 90 %. The highest current density that could
be sustained with this setup was about -20 mA/cm2. Therefore, it was decided to develop a new cell
that could operate at higher current densities, pressures and temperatures.
A foam based CO2 conversion cell with gas diffusion electrodes and a ceramic porous structure in
which the liquid electrolyte is immobilized by capillary forces was developed and tested up to 20
bar and to a maximum temperature of 50 °C. Potassium carbonate was selected as aqueous
electrolyte and various concentrations of this electrolyte were immobilized in a ceramic porous
matrix at both ambient and elevated temperatures and pressures. Copper and silver metal foams
were tested as cathode. Nickel metal foam was chosen as anode. When copper was used as
electrocatalyst, a high faradaic efficiency for the evolution of H2, i.e. between 92 to 99 % was
registered. The other products detected were CO and during one test also methane was identified.
The performance of Ag cathode metal foam confirmed its higher selectivity for CO2 reduction to
II
CO. The formation of passive oxide layers and the subsequent degradation of nickel foam
electrodes affected the electrochemical performance and the stability of the cells negatively.
Resumé på dansk
Forskning i elektrokemisk reduktion af CO2 er motiveret af ønsket om at reducere afhængigheden af
fossile brændsler og mindske udledningen af drivhusgasser. Med omdannelsen af CO2 og vand til
brændsler og nyttige kemikalier ved hjælp af fornybar energi, f.eks. vind og sol, kan fossile
brændsler erstattes helt med CO2 neutrale syntetiske brændsler.
Denne afhandling anvender viden, der stammer fra tidligere forskning og udvikling af
elektrolyseteknikker, som grundlag for et eksplorativt arbejde med henblik på at finde brugbare
materialer og at fremstille en elektrokemisk celle, der i stand til at producere kulbrinter og alkoholer
direkte fra reduktion af CO2 og vanddamp under driftsbetingelser mellem 200 - 300 ⁰C og ved
forhøjet tryk på 20 – 30 atm. Temperaturområdet er valgt i overensstemmelse med den termiske
stabilitet af kulbrinter fremstillet ved omdannelse af CO2. Reaktionshastigheden for dannelse af
produkterne stiger med øget tryk. Den elektrokemiske ydeevne af de fremstillede celler blev
undersøgt ved anvendelse af elektrokemisk impedans spektroskopi og kronoamperometri, mens
gasanalysen blev udført ved hjælp af gaskromatografi.
De indledende undersøgelser var fokuseret på elektrolytmaterialer med det formål at identificere
den bedste kandidat, der ville kunne bruges i hele celler. Nogle protonledende materialer, såsom Y-
doterede BaZrO3-BaCeO3 faststof opløsninger og K-doteret BaZr1-xYxO3-δ blev undersøgt.
BaCe0.5Zr0.4Y0.1O3-δ ville have været den bedste elektrolytkandidat på grund af dens lave modstand i
høj pH2O (2 · 10-3
S / cm), selv ved lave temperaturer som 240 °C hvis ikke dens manglende
stabilitet i sur CO2-gas atmosfære forhindrede dens praktiske anvendelse til kuldioxid reduktion ved
højt tryk. K-doteret BaZr1-xYxO3-δ blev succesfuldt syntetiseret ved hjælp af hydrotermal syntese,
men ledningsevnen der blev målt ved høj vanddamptryk og ved 240 °C var for lav (3 · 10-5
S/cm) til
at materialet kunne komme i betragtning som en egnet elektrolyt.
En litteraturundersøgelse viste, at de fleste undersøgelser CO2-reduktion blev udført i vandigt
kaliumbikarbonat (KHCO3) og med kobbermetal katalysator. Det blev derfor besluttet at undersøge
den elektrokatalytiske aktivitet af kobberskum i vandig opløsning ved stuetemperatur og
atmosfæretryk for elektrokemisk reduktion af CO2. Målingerne blev udført på Stanford University -
Chemical Engineering Department, hvor det var muligt at anvende en forsøgsopstilling, der sikrede
høj følsomhed for produkter med lav udbytte fra CO2-reduktionsreaktionen. Syv produkter blev
identificeret ved forsøg med kobberskumelektroden, der blev polariseret til -0,98 V vs. RHE. H2,
HCOO- og CO blev observeret som hovedprodukter, og især H2 udviste en høj Faradayisk
effektivitet på ca. 90 %. Den højeste strømtæthed, der kunne opnås med denne opstilling, var ca. -
20 mA/cm2. Derfor blev det besluttet at udvikle en ny celle, som kunne operere ved højere
strømtætheder, tryk og temperaturer.
Alkaliske elektrolyseceller, der er baseret på metalskum, og som kan omdanne CO2 og vand til
brændsler, blev fremstillet. De var konstrueret af gasdiffusionselektroder og en keramisk porøs
struktur, i hvilken den flydende elektrolyt blev immobiliseret ved hjælp af kapillære kræfter.
Cellerne blev testet op til 20 bar og en maksimum temperatur på 50 °C. En vandig opløsning af

III
kaliumkarbonat blev valgt som elektrolyt. Kobber og sølv metalskum blev testet som katode, da de
er velkendte elektrokatalysatorer for CO2-reduktion. Nikkel metalskum blev valgt som anode. Når
kobberskum blev anvendt som elektrokatalysator, blev en høj Faradayisk effektivitet, 92 til 99 %,
for udviklingen af H2 registreret. Det andet påviste produkt var CO og under en enkelt test blev
metan også identificeret. Ydeevnen af Ag metalskumkatoden bekræftede den højere selektivitet af
CO ved reduktion af CO2 på Ag. Dannelsen af et passivt oxidlag på nikkel og den efterfølgende
nedbrydning af nikkelskumelektroden påvirkede den elektrokemiske ydeevne og stabilitet af
cellerne negativt.
Acknowledgements
First of all I would like to thank my supervisor, Mogens B. Mogensen, for his help, his ideas and
patience in teaching, and his enormous and contagious curiosity. I am very thankful for his support
and his wise suggestions during these three years.
It was a pleasure to listen to and discuss together with him, not only about scientific topics.
I am especially grateful to my co-supervisor Christodoulos Chatzichristodoulou for his work on the
high pressure and temperature measurement setup, for his collaboration, for his brilliant ideas and
his comments on my manuscripts.
Also, my second co-supervisor and section leader, Peter Holtappels should be acknowledged for his
contribution during my “monthly meetings”.
Frank Allebrod, Jonathan Hallinder, Alberto Lapina and Davide Ippolito were precious colleagues
and friends during these three years. I am very thankful for their time and their helpful advices.
They managed to cheer me up and support me during the difficult moments of this journey.
We had really good time together.
I would like to thank also my office mates and colleagues Ragnar Kiebach and Jimmy Nielsen. It
has been a pleasure to share the office with you.
Ebtisam Abdellahi and Jens Borchsenius should be named and granted in representation of all the
technicians and laboratorians, because without their help this work would not have been possible.
I would like to thank Prof. Thomas Jaramillo and Prof. Anders Nilsson for hosting me in the
SUNCAT group at SLAC, Stanford. In particular, I am grateful to Kendra Kuhl and Toru
Hatsukade for introducing me to a new experimental setup, for the interesting and useful discussion
on the CO2 reduction process.
I would like to thank Simone, Andreas, Iva, Arianna, Kristian, Carlo, Sune, Lisa, Philip and Pia for
their precious friendship during these last years.
I am very grateful to my family, because since I was young they have given me the possibility and
the freedom to travel and to experience different cultures. I feel very lucky for it.
This work was carried out as a part of the “Catalysis for Sustainable Energy” (CASE), initiative
funded by the Danish Ministry of Science, Technology and Innovation.
IV
TABLE OF CONTENTS
Abstract........................................................................................................................................I
Dansk Resumé.............................................................................................................................II
Acknowledgments...........................................................................................................................III
Table of contents........................................................................................................................IV
List of Figures..........................................................................................................................VII
List of Tables............................................................................................................................. XIII
List of Abbreviations................................................................................................................ XV
Part I
Chapter 1
Introduction and motivation……………………………………………………………………….2
1.1. The energy challenge………………………………………………………………………….2
1.2. Production of Hydrogen and Synthetic fuels………………………………………………….6
1.2.1 Heterogeneous catalysis……………………………………………………………………6
1.2.2 Electrolysis cells……………………………………………………………………………………..7
1.2.2.1 Low temperature electrolysis…………………………………………………………………..7
1.2.2.2 High temperature electrolysis………………………………………………………………..10
1.3. Thesis Purpose and Outline………………………………………………………………….12
References………………………………………………………………………………………..14
Chapter 2
Electrochemical reduction of CO2 in aqueous electrolyte………………………………………16
2.1. Cell Concept…………………………………………………………………………………16
2.1.1 Conductivity of aqueous and immobilized K2CO3………………………………………..18
2.2. Electrocatalysts for CO2 reduction…………………………………………………………..20
2.2.1 CO2 electrochemical reduction on copper………………………………………………..21
2.2.2 CO2 electrochemical reduction on silver………….…………………………………………...25
References………………………………………………………………………………………..27
Part II
Chapter 3
Phase stability and conductivity of BaCe1-x-yZryYxO3-δ at elevated partial pressures of H2, H2O
and CO2 at 240 °C………………………………………………………………………………….30
Abstract………………………………………………………………………………………………………30
3.1. Introduction………………………………………………………………………………….31
3.2. Experimental…………………………………………………………………………………33
3.2.1 Synthesis of pellets………………………………………………………………………...33
3.2.2 Characterization…………………………………………………………………………..34
V
3.3. Results……………………………………………………………………………………….35
3.3.1 Chemical stability in CO2………………………………………………………………………...35
3.3.2 SEM……………………………………………………………………………………….39
3.3.3 Conductivity measurements of BCZY……………………………………………………..42
3.4. Discussion……………………………………………………………………………………46
3.5. Conclusions………………………………………………………………………………….49
References………………………………………………………………………………………..50
Chapter 4
Hydrothermal synthesis and electrochemical characterization of K-doped BaZr0.9Y0.1O3-δ…52
Abstract…………………………………………………………………………………………....52
4.1. Introduction………………………………………………………………………………….53
4.2. Experimental…………………………………………………………………………………54
4.2.1 Synthesis procedure……………………………………………………………………….54
4.2.2 Characterization…………………………………………………………………………..55
4.2.3 Conductivity……………………………………………………………………………….55
4.3. Results……………………………………………………………………………………….56
4.3.1 XRD and SEM characterization…………………………………………………………..56
4.3.2 Conductivity characterization…………………………………………………………………….61
4.4. Discussion……………………………………………………………………………………67
4.4.1 Crystallographic structure………………………………………………………………..67
4.4.2 Conductivity……………………………………………………………………………….68
4.5. Conclusions and outlook…………………………………………………………………….70
References………………………………………………………………………………………..71
Chapter 5
Summary of Part II: Electrolytes…………………………………………………………………73
References…………………………………………………………………………………………..74
Part III
Chapter 6
CO2 reduction on copper foam electrocatalyst at room temperature and ambient pressure...76
Abstract……………………………………………………………………………………………...76
6.1. Introduction………………………………………………………………………………….76
6.2. Experimental…………………………………………………………………………………77
6.3 Results and Discussion……………………………………………………………………….79
6.4 Conclusions…………………………………………………………………………………..84
References………………………………………………………………………………………..84
VI
Chapter 7
CO2 reduction on electrochemical cells using gas diffusion electrodes at elevated pressure…85
Abstract…………………………………………………………………………………………...85
7.1. Introduction………………………………………………………………………………….85
7.2. Experimental…………………………………………………………………………………87
7.2.1 Materials and cell fabrication…………………………………………………………….87
7.2.2 Characterization…………………………………………………………………………..89
7.3. Results……………………………………………………………………………………….93
7.3.1 Microstructure…………………………………………………………………………….93
7.3.2 Electrochemical characterization………………………………………………………...96
7.3.2.1 Copper………………………………………………………………………………...96
7.3.2.2 Silver…………………………………………………………………………………104
7.3.3 Post mortem analysis…………………………………………………………………….108
7.3.3.1 Scanning electron microscopy……………………………………………………….108
7.3.3.2 X-ray photoemission spectroscopy…………………………………………………..110
7.4. Discussion…………………………………………………………………………………..115
7.4.1 Electrochemical performance and microstructure………………………………………115
7.4.2 CO2 reduction products………………………………………………………………….118
7.4.3 CO2 reduction on copper foam electrodes: a comparison………………………………120
7.5. Conclusions………………………………………………………………………………...121
References………………………………………………………………………………………122
Part IV
Chapter 8
Overall Discussion and Conclusions…………………………………………………………….126
8.1. Overall Discussion and Outlook……………………………………………………………126
8.2. Conclusion……………………………………………………………...…………………..130
References……………………………………………………………………………………....131
VII
List of Figures
Fig. 1.1. Data obtained from the Vostok ice core on the CO2, CH4 and temperature levels
in the atmosphere in the past 420 000 years. Adapted from [Petit et al.1]
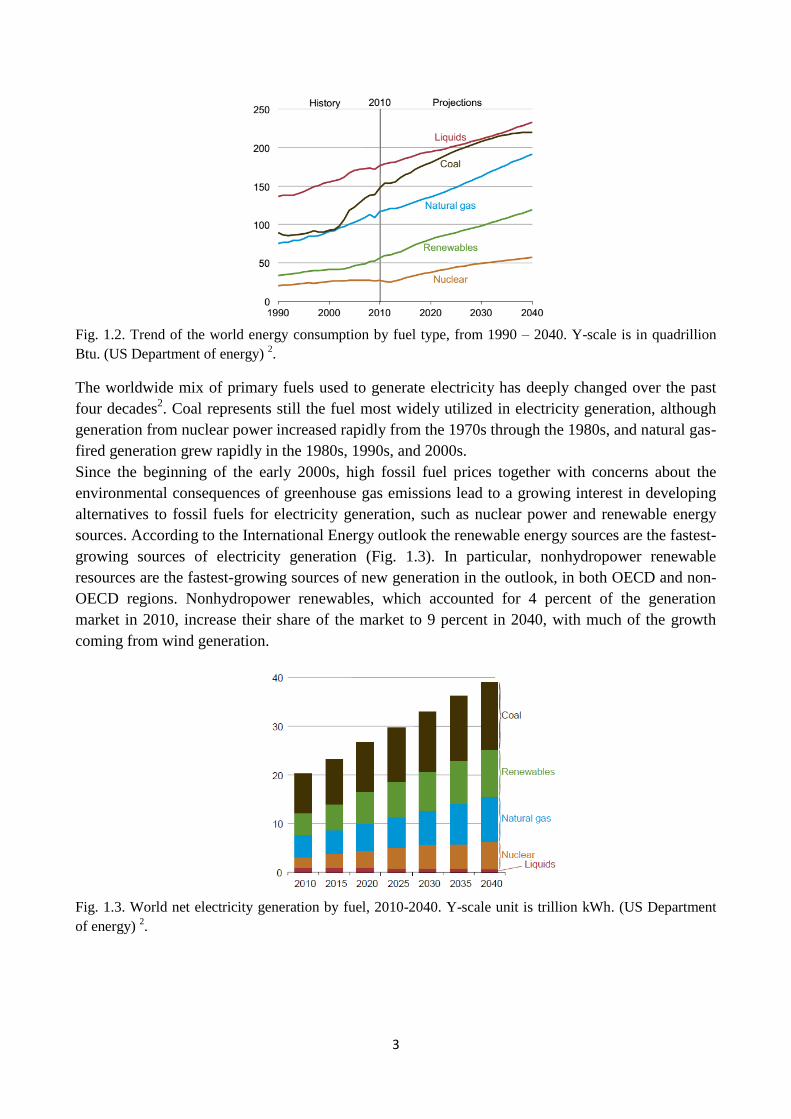
Fig. 1.2. Trend of the world energy consumption by fuel type, from 1990 – 2040. Y-scale is in
quadrillion Btu. (US Department of energy) 2.
Fig. 1.3. World net electricity generation by fuel, 2010-2040. Y-scale unit is trillion kWh. (US
Department of energy) 2.
Fig. 1.4. Renewable energy share in Denmark in 2010 was 21.9%.
Fig.1.5. Renewable energy share in the European Union in 2010 was 11.6%.
Fig. 1.6. Renewable energy target for Denmark in 2020 is 30%.
Fig. 1.7. Renewable energy target for the European Union in 2020 is 20%.
Fig. 1.8. A possible scheme for a hydrocarbon fuel cycle that does not contribute to anthropogenic
CO2 emissions. Originally published by Mogensen et al.6
Fig. 1.9. Schematic representation of an electrolyser for bulk CO2 reduction.
Fig. 1.10. Schematics of a proton conducting electrolyte based electrochemical cell that combine
H2O electrolysis and CO2 reduction into hydrocarbons.
Fig. 1.11. Schematic representation of an alkaline electrolysis cell with aqueous KOH electrolyte
immobilized in a porous matrix and gas diffusion electrodes. Originally published by F. Allebrod.25
Fig. 2.1. Illustration of the suggested electrochemical cell with immobilized aqueous K2CO3 as
electrolyte and with gas diffusion electrodes. The cathode is exposed to CO2 and to the H2O present
in the electrolyte, while on the anode O2 evolution takes place as well as some CO2 formation.
𝐻𝐶𝑂3− and 𝐶𝑂3
− are the possible charge carriers. Adapted and modified from P. L. Mollerup3.
Fig. 2.2. Conductivity of 0.01-50 wt% K2CO3 at ambient temperature. Originally published by P.L.
Mollerup et al. 6
Fig. 2.3. Conductivity of 5-30 wt% aqueous K2CO3 from ambient temperature to 180-200 ⁰C and at
30 bar. Originally published by P.L. Mollerup et al. 6.
VIII
Fig. 2.4. Conductivity of 10 wt% aqueous K2CO3 both pure and immobilized in SrTiO3 and TiO2,
from 25-185 ⁰C. The initial pressure was 30 bar and kept constant during the test with SrTiO3,
while the pressure was allowed to increase with the temperature in the other tests. Originally
published by P.L. Mollerup3.
Fig. 2.5. Product distribution as a function of applied potential in the electrochemical reduction of
CO2 at a copper electrode in 0.1 M KHCO3, measured by Y. Hori et al.14
They are also reported the
reversible potentials for formation of all the products form CO2.
Fig. 2.6. Faradaic efficiency for each product as a function of potential is shown for major,
intermediate and minor products. Originally published by K. Kuhl et al.15
.
Fig. 2.7. Suggested CO2 electroreduction pathway for methane formation on Cu(211) model
surface. The free energy diagram is shown at 0V vs. RHE and at the minimum theoretical
overpotential of -0.74 V vs. RHE. Originally printed by A. Peterson et al16
.
Fig. 2.8. Rates of total CO2 reduction and H2 formation under 30 atm of CO2 with stirring
electrolyte. ( ) Rate of CO2 reduction, ( ) rate of H2 formation. Originally published by Hara et al.25
Fig. 2.9. Faradaic efficiency for each products detected as a function of potential. Originally
published by T. Hatsukade et al31
.
Fig. 3.1. XRD of (a) BCZY541, (b) BCZY262 and (c) BZY91, prepared by solid state reactive
sintering at 1550 °C. * Indicates the phase Ba2YNiO5 (reflection (112)).
Fig. 3,2. XRDs of BCZY541 powders during exposure to CO2 atmosphere at different temperatures.
(a) 30 °C, (b) 700 °C after 7 h, (c) 900 °C after 12 h and (d) 30 °C after test. The extra peaks present
are due to diffraction from the sample holder which is a Platinum foil.
Fig. 3.3. XRDs for the pellets of (a) BZY91, (b) BCZY262, (c) BCZY541 five days after the
conductivity test and (d) BCZY41 powder one month after the conductivity test at 240 °C. The
BCZY541 sample is influenced by the carbonation reaction.
Fig. 3.4. XRDs for the pellets of (a) BCZY262 and (b) BCZY541 five months after the sequence 1
of the conductivity test at 240 °C. Both samples are characterized by formation of minor phases of
BaCO3 (Ø).
Fig.3.5. SEM micrograph of the fractured cross section of: a) freshly sintered BZY91 cell and b)
BZY91 cell tested under the 2 sequences of the high pressure conductivity test.
Fig. 3.6. SEM micrograph of the fractured cross section of: a) freshly sintered BCZY541 pellet and
b) BCZY541 after exposure to elevated partial pressures of H2O and CO2 during the conductivity
test.
IX
Fig. 3.7. SEM micrograph of the fractured cross section of the BCZY541 pellet after exposure to
high steam partial pressure during conductivity testing (sequence 1).
Fig. 3.8. SEM micrograph of the fractured cross section of: a) just sintered BCZY262 cell and b)
BCZY262 cell tested under the two sequences of the high partial pressure test. Note: the
magnifications are different as indicated by the scale bars. These pellets had a density of 93%.
Fig. 3.9. SEM micrograph of the fractured cross section of the BCZY262 cell tested under high
steam partial pressure. This pellet was only 85 % dense.
Fig. 3.10. Nyquist plot recorded for BCZY541 at 240 °C and Ptot = 50 bar, with a gas mixture of
pH2 = 2.5 bar, pH2O = 10 bar and pN2 = 37.5 bar.
Fig. 3.11. a) Nyquist plots at different acquisition times and b) conductivity relaxation of the
BCZY541 cell at 240 °C and Ptot = 50 bar, following the gas composition change from pH2O = 10
bar ( ), to pH2O = 25 bar ( , , , ) in 5 vol.% H2 in N2.
Fig. 3.12. Conductivity dependence on increasing pH2O at 240 ⁰C at 50 bar in a wet mixture of 5
vol.% H2 in N2 and during the ramp down phase for BCZY541 cell. Closed and open symbols are
used to distinguish between equilibrated and non-equilibrated values, respectively. The total
conductivity at 10 mbar for the three compounds is compared with extrapolated and measured
literature data
Fig. 3.13. Conductivity dependence on pCO2 at 240 ⁰C in the gas mixture: 50 vol.% CO2, 5 vol.%
H2 and 45 vol.% N2. The total pressure was between 1 bar and 50 bar. The pH2O values given on
top are the calculated equilibrium values of the gas mixture at 240 ⁰C.
Fig.4.1. XRD of (a) as synthesized powders of BKZY91 prepared by hydrothermal synthesis, (b)
powders of BKZY91 sintered at 1550 °C with added 0.1 wt% of Si powder as standard reference
and (c) powders of BZY91 sintered by solid state reactive sintering at 1550 °C with added 0.1 wt%
of Si powder as standard reference. The Si peaks position is indicated with dotted lines in pattern b)
and c)
Fig.4.2. XRDs for the pellets of (a) BZY91, (b) BKZY91, (c) BCZY541 after the conductivity test
in ambient pressure and various temperatures. Platinum peaks are due to traces of Pt paint
(contained in the electrodes) left on the material after testing.
Fig. 4.3. XRDs for the pellets of (a) BZY91 and (b) BKZY91 after the conductivity test at 240 °C in
high pH2O and in high pCO2.
Fig. 4.4. SEM images of as synthesized Ba1-xKxZr0.9Y0.1O3-δ powders obtained a hydrothermal
treatment of 72 h at 200 °C.
X
Fig. 4.5. SEM micrograph of the fractured cross section of: a) freshly sintered BKZY91 cell and b)
BKZY91 cell tested under the 2 sequences of the high pressure conductivity test.
Fig.4.6. Nyquist plots recorded at 275 °C in wet N2, pH2O = 0.1 atm for (a) BKZY91 and (b)
BZY91.
Fig. 4.7. Conductivity dependence curves of the bulk, specific grain boundary and total as a
function of time at 275 °C in N2 under varying pH2O.
Fig. 4.8. Total conductivity of BZY91, BKZY91, BCZY541 as a function of time at 440 °C in N2
under varying pH2O.
Fig. 4.9. Total conductivity of BZY91, BKZY91 and BCZY541 as a function of temperature in: a)
dry N2 (pH2O < 0.001 atm) and b) wet N2 pH2O = 0.1 atm.
Fig. 4.10. Total conductivity of BZY91, BKZY91 as a function of temperature in dry N2 (pH2O <
0.001 atm) and wet N2 (pH2O = 0.1 atm). For comparison are reported data measured by X.Xu et
al.23
on a Ba0.95K0.05Zr0.85Y0.11 Zn0.04O3-δ cell, and by A.S. Patnaik et al.17
on a Ba0.8K0.2Zr0.9Y0.1O3-δ
cell.
Fig. 4.11. Bulk, specific grain boundary and total conductivity dependence curves on increasing
pH2O at 240 ⁰C at 50 bar in a wet mixture of 5 vol.% H2 in N2 and during the ramp down phase for
BCZY541 cell.
Fig. 4.12. Conductivity dependence on pCO2 at 240 ⁰C in the gas mixture: 50 vol.% CO2, 5 vol.%
H2 and 45 vol.% N2. The total pressure was between 1 bar and 50 bar. The pH2O values given on
top are the calculated equilibrium values of the gas mixture at 240 ⁰C.
Fig. 6.1 . Schematic of the electrochemical cell and experimental setup used in electrolysis
experiments.
Fig. 6.2. SEM pictures of: a) and b) untreated copper foam; c) and d) after test copper foam. Note:
the magnifications are different as indicated in the scale bars.
Fig. 6.3. XPS spectra of the copper surface: a) before the electrolysis experiment and b) after the
electrolysis experiment at -0.98 V vs. RHE.
Fig. 6.4. Faradic efficiency for each product reduced as a function of potential on a copper foam
electrode. For comparison also data reported by K. Kuhl et al.9 on a dense copper foil electrode.
Fig. 6.5. Partial current density required for the formation of each product as a function of potential.
Fig. 7.1. Two photographs of the different part composing the electrolysis cell. Left: copper
electrode foam and YSZ porous layers sintered on the nickel foam. Right: nickel foam.
XI
Fig. 7.2. Electrochemical cell holder for testing the foam based electrolyser cells. Left: Top-side
view and Right: cross section view.
Fig. 7.3. SEM pictures of an untreated nickel foam. Note: the magnifications are different as
indicated by the scale bars.
Fig. 7.4. SEM pictures of an untreated copper foam. Note: the magnifications are different as
indicated by the scale bars.
Fig. 7.5. SEM pictures of an untreated silver foam. Note: the magnifications are different as
indicated by the scale bars.
Fig. 7.6. XPS spectra of the pristine surface copper foam. It is also reported the quantitative analysis
of the elements detected on the surface.
Fig. 7.7. XPS spectra of the pristine surface silver foam. It is also reported the quantitative analysis
of the elements detected on the surface.
Fig. 7.8. Bode representation of EIS measurements performed on copper foam based cathode at
pressures varying from 2 to 10 bar and different applied potential: a) -1.75 V , b) -2 V, c) -2.5V.
The gas mixture present in the anode side was composed by N2, H2O (steam) and H2 while on the
cathode was only CO2.
Fig. 7.9. CO2 reduction current densities as a function of time at pressures from 2 to 10 bar and at
different voltages: a) -1.75 V, b) -2 V and c) -2.5 V.
Fig. 7.10. Total cell resistance, serial resistance and electrode polarization resistance for EIS
measurements showed in Fig. 7.11 a) and b), and additional measurements performed at OCV
before each CA measurement. The y axis is plotted on a logarithmic scale.
Fig. 7.11. Representation of EIS measurements performed on copper foam based cathode when
applied a potential of -2.5 V and at pressures varying: a) from 5 to 20 bar (Nyquist plot) and b) from
10 to 2 bar (Bode plot).
Fig. 7.12. Total cell resistance, serial resistance and electrode polarization resistance for EIS
measurements showed in Fig. 7.13 a) and b), and additional measurements performed at OCV
before each CA measurement.
Fig. 7.13. Bode representation of EIS measurements performed on copper foam based cathode when
applied a potential of -2.5 V and at pressures varying: a) from 3 to 5 bar and after the ramp down at
2 bar, and b) from 2 to 5 bar after the ramp down at 2 bar. The operational temperature was 25°C in
a) and 50 °C in b).
XII
Fig. 7.14. Nyquist representation of EIS spectra performed when applying a cell voltage of -2.5V at
3 bar pressure and T = 25°C. Gas conditions: 86 vol % N2 + 4 vol % H2O + 10 vol % H2 in the
anode side and 100 vol % CO2 on the cathode side.
Fig. 7.15. Total cell resistance, serial resistance and electrode polarization resistance for EIS
measurements showed in Fig. 7.16 a) and b), and additional measurements performed at OCV
before each CA measurement. The y axis is plotted on a logarithmic scale.
Fig. 7.16. Representation of EIS spectra performed on Ag based cathode foam when applied a
potential of -2.5 V and at pressures varying: a) from 3 to 10 bar (Nyquist plot), and b) from 3 to 20
and along the ramp down phase to 2 bar (Bode plots).
Fig. 7.17. Nyquist representation of EIS spectra performed when applying a cell voltage of -2.5V at
3 bar pressure and T = 25°C. Gas conditions: 86 vol % N2 + 4 vol % H2O + 10 vol % H2 in the
anode side and 100 vol % CO2 on the cathode side.
Fig. 7.18. Images taken on the electrolyser cell after Test 2. a) SEM image of the copper foam
cathode, b) magnified SEM image of the copper foam, c) SEM image of YSZ layer in contact with
the copper foam and d) photograph of the YSZ layer after the test; the black rectangular area
corresponds to where the copper foam was put in contact.
Fig. 7.19. Images taken on the electrolyser cell after Test 3. a) SEM image of the Silver foam
cathode, b) magnified SEM image of the silver foam, c) SEM image of YSZ layer in contact with
the silver foam and d) photograph of the YSZ layer after the test; the black rectangular area
corresponds to where the silver foam was put in contact.
Fig. 7.20. Images taken on the electrolyser cell after Test 3. a) SEM image of the nickel foam
anode, b) magnified SEM image of the nickel foam.
Fig. 7.21. XPS spectra of: a) the surface of Cu foam tested during Test 2. It also reports the
quantitative analysis of the elements detected on the surface. b) XPS detailed region of Ni-2p
detected on the Cu foam.
Fig. 7.22. XPS spectra of: a) the surface of YSZ layer in contact with the Cu foam tested during
Test 2. It is also reported the quantitative analysis of the elements detected. b) XPS detailed region
of Ni-2p detected on the YSZ layer.
Fig. 7.23. XPS spectra of: a) the surface of Ag foam tested during Test 3. It is also reported the
quantitative analysis of the elements detected on the surface. b) XPS detailed region of Ni-2p
detected on the Ag foam.
Fig. 7.24. XPS spectra of: a) the surface of YSZ layer in contact with the Ag foam tested during
Test 3. It is also reported the quantitative analysis of the elements detected. b) XPS detailed region
of Ni-2p detected on the YSZ layer.
XIII
List of Tables
Table 1.1. Heterogeneous catalysis reactions for production of hydrocarbons or ammonia from
synthesis gas or a mixture of N2 and H2.
Table 1.2. List of CO2 reduction reactions with their corresponding equilibrium potentials10
.
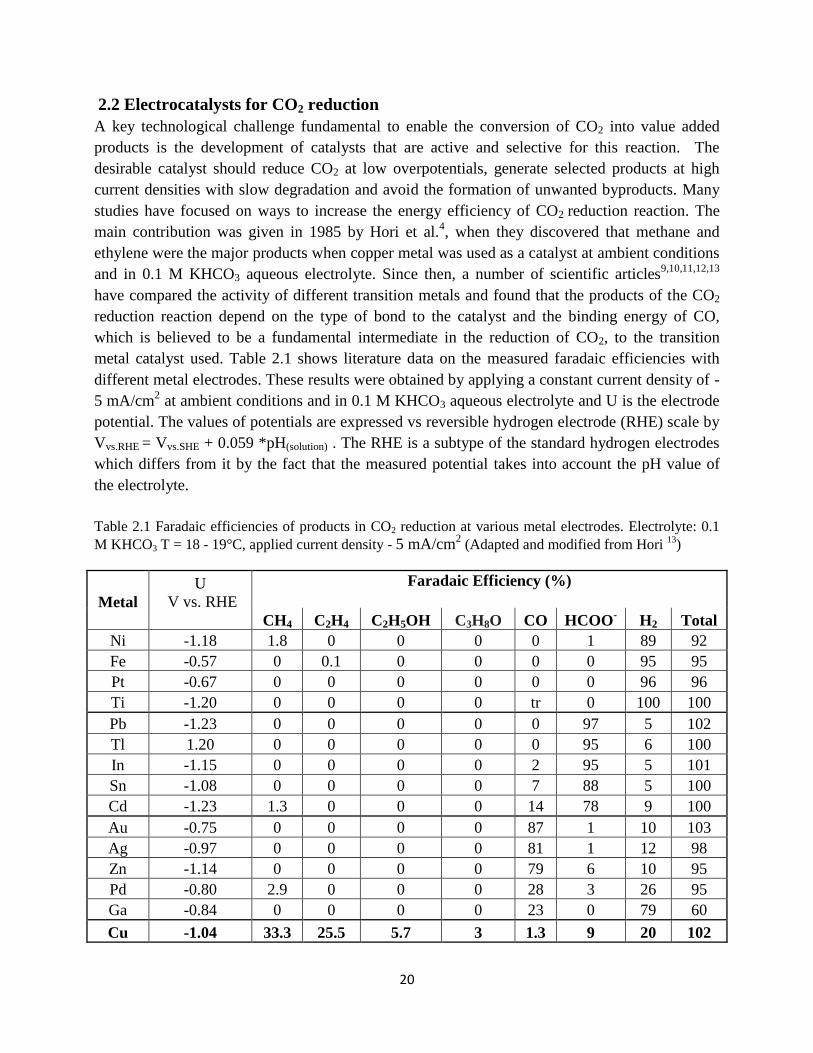
Table 2.1 Faradaic efficiencies of products in CO2 reduction at various metal electrodes.
Electrolyte: 0.1 M KHCO3 T=18 - 19°C (Adapted and modified from 13
)
Table 2.2 Literature overview of the faradaic efficiencies of CO, HCOO- and H2 obtained during
electrolysis on Ag electrodes at room temperature and pressure. The potentials are expressed vs.
SHE.
Table 3.1. Relative density for the BCZY pellets prepared by solid state reactive sintering.
Table 3.2. Space group, lattice parameters and unit cell volume of sintered BaCe1-x-yZryYxO3-δ
obtained through Diffrac.EVA.
Table 3.3. Structural refinement factors; lattice parameters, unit cell volume and quantities of
BCZY541, CeO2 and BaCO3 five days after the high pressure conductivity test. The profile R value
(Rp = 3.22), weighted profile R-factor (Rwp = 5.76) and Goodness of fit (GOF = 1.79) values were
obtained.
Table 3.4. Structural refinement factors; lattice parameters, unit cell volume and quantities of
BCZY541, CeO2 and BaCO3 one month after the high pressure conductivity test. The profile R
value (Rp = 2.65), weighted profile R-factor (Rwp = 4.75) and Goodness of fit (GOF = 1.79) values
were obtained.
Table 4.1. Chemical compositions determined for Ba1-xKxZr0.9Y0.1O3-δ powders and pellets sintered
at 1550 °C for 10 h by ICP-MS.
Table 5.1 Summary of the results for the different tested solid proton conductor electrolyte
materials according to the relevant requirements for CO2 reduction application.
Table 6.1. Average current density measured during one-hour potentiostatic measurements at three
different potentials. For comparison K. Kuhl data from dense copper foil electrodes are reported.
Table 7.1. Summary of measurement types and settings used for measurements performed within
each cycle during Test 0.
Table 7.2. Summary of measurement types and settings used for measurements performed within
each cycle of test 1 to 3.

XIV
Table 7.3. Average current density (mA/ cm2) obtained from CA measurements performed for 2
hours at -2.5 V applied cell voltage and various pressures.
Table 7.4. Average current densities (mA/ cm2) obtained from CA measurements performed for 2
hours at -2.5 V applied cell voltage and various pressures.
Table 7.5. Average CO, H2 and CH4 faradaic efficiency during the 2 hours of CA measurements.
The applied cell voltage was of -2.5 V.
Table 7.6. Average current densities (mA/cm2) from CA measurements performed for 2 hours at -
2.5 V applied cell voltage and various pressures.
Table 7.7. Average CO and H2 faradaic efficiency during the 2 hours of CA measurements. The
applied cell voltage was of -2.5 V.
XV
List of Abbreviations
AC Alternating Current
AEC Alkaline Electrolysis Cell
BET Brunauer–Emmett–Teller
EIS Electrochemical Impedance Spectroscopy
CA ChronoAmperometry
CV Cyclic Voltammetry
DFT Density Functional Theory
FE Faradaic Efficiency
FobAEC Foam based Alkaline Electrolysis Cell
GC Gas Chromatograph
GLS Gas Liquid Separator
HF High Frequency
Hz Hertz
IF Intermediate Frequency
LF Low Frequency
MHz Mega Hertz
NMR Nuclear Magnetic Resonance
OCV Open Circuit Voltage
PEM Proton Exchange Membrane
PLD Pulse Laser Deposition
PTFE PolyTetraFluorEten
Q Constant phase element
Rs Serial resistance
Rp Polarization resistance
SEM Scanning Electron Microscope
SOEC Solid Oxide Electrolytic Cell
SPCEC Solid Proton Conducting Electrolysis Cell
TCD Thermal Conductivity Detector
TEM Tunneling Electron Microscope
XPS X-ray Photoelectron Spectroscopy
Y Admittance
YSZ Yttrium Stabilized Zirconia
Z Impedance
ε Energy efficiency

1
Part I
INTRODUCTION
2
Chapter 1
Introduction and Motivation
1.1 The energy challenge
The interest in electrocatalytic conversion of CO2 into fuels and chemicals is connected to concerns
about climate changes. By using renewable or nuclear energy for the conversion process, it is
possible to create hydrocarbon products in a way that does not contribute to anthropogenic CO2
emissions. It is not the scope of this work to go into detail on the discussion on climate changes.
However, it is pertinent to include some literature on the topic in order to elucidate the scale of the
challenges. According to Petit et al.1, there is a correlation between the atmospheric CO2, CH4 and
temperature levels. Data on these levels until 420 000 years before present (bp) were obtained by
analysing an ice core that was drilled near the Vostok station in Antarctica. In this time period, it
was found that the atmospheric CO2 concentration varied between 210 and 300 ppm. In
comparison, the atmospheric CO2 concentration was measured to be 403.3 ppm in April 2015.2 The
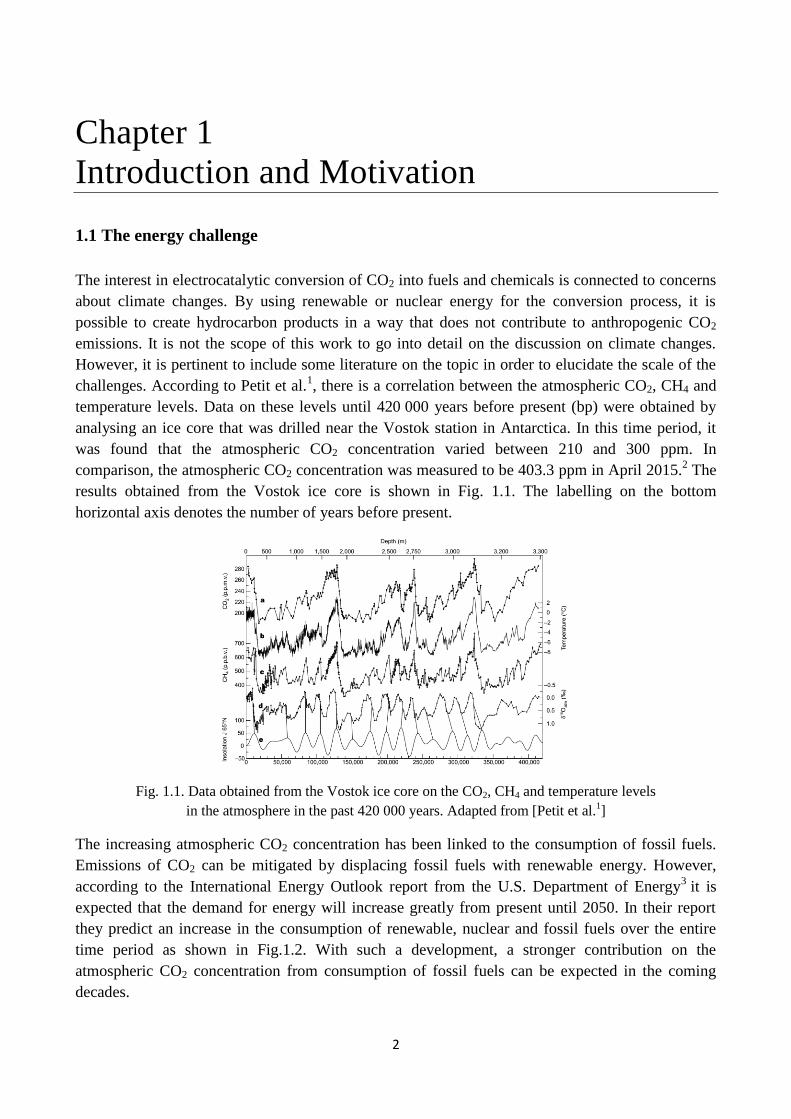
results obtained from the Vostok ice core is shown in Fig. 1.1. The labelling on the bottom
horizontal axis denotes the number of years before present.
Fig. 1.1. Data obtained from the Vostok ice core on the CO2, CH4 and temperature levels
in the atmosphere in the past 420 000 years. Adapted from [Petit et al.1]
The increasing atmospheric CO2 concentration has been linked to the consumption of fossil fuels.
Emissions of CO2 can be mitigated by displacing fossil fuels with renewable energy. However,
according to the International Energy Outlook report from the U.S. Department of Energy3 it is
expected that the demand for energy will increase greatly from present until 2050. In their report
they predict an increase in the consumption of renewable, nuclear and fossil fuels over the entire
time period as shown in Fig.1.2. With such a development, a stronger contribution on the
atmospheric CO2 concentration from consumption of fossil fuels can be expected in the coming
decades.
3
Fig. 1.2. Trend of the world energy consumption by fuel type, from 1990 – 2040. Y-scale is in quadrillion
Btu. (US Department of energy) 2.
The worldwide mix of primary fuels used to generate electricity has deeply changed over the past
four decades2. Coal represents still the fuel most widely utilized in electricity generation, although
generation from nuclear power increased rapidly from the 1970s through the 1980s, and natural gas-
fired generation grew rapidly in the 1980s, 1990s, and 2000s.
Since the beginning of the early 2000s, high fossil fuel prices together with concerns about the
environmental consequences of greenhouse gas emissions lead to a growing interest in developing
alternatives to fossil fuels for electricity generation, such as nuclear power and renewable energy
sources. According to the International Energy outlook the renewable energy sources are the fastest-
growing sources of electricity generation (Fig. 1.3). In particular, nonhydropower renewable
resources are the fastest-growing sources of new generation in the outlook, in both OECD and non-
OECD regions. Nonhydropower renewables, which accounted for 4 percent of the generation
market in 2010, increase their share of the market to 9 percent in 2040, with much of the growth
coming from wind generation.
Fig. 1.3. World net electricity generation by fuel, 2010-2040. Y-scale unit is trillion kWh. (US Department
of energy) 2.
4
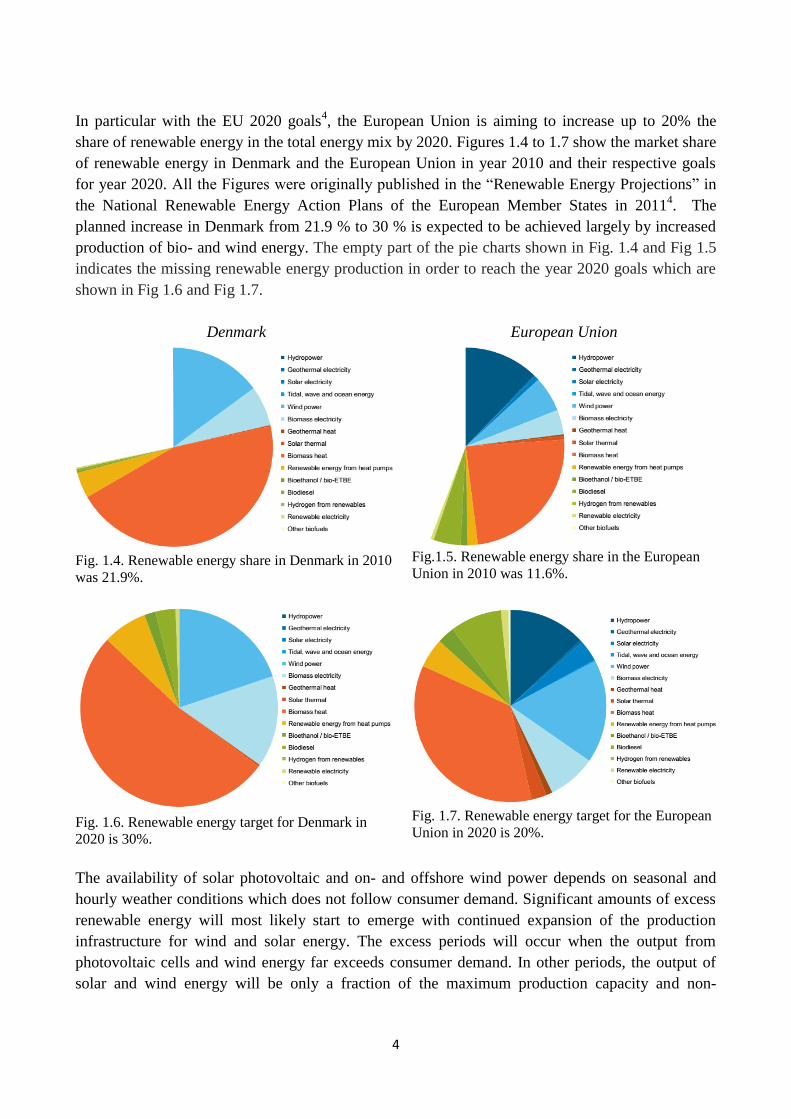
In particular with the EU 2020 goals4, the European Union is aiming to increase up to 20% the
share of renewable energy in the total energy mix by 2020. Figures 1.4 to 1.7 show the market share
of renewable energy in Denmark and the European Union in year 2010 and their respective goals
for year 2020. All the Figures were originally published in the “Renewable Energy Projections” in
the National Renewable Energy Action Plans of the European Member States in 20114. The
planned increase in Denmark from 21.9 % to 30 % is expected to be achieved largely by increased
production of bio- and wind energy. The empty part of the pie charts shown in Fig. 1.4 and Fig 1.5
indicates the missing renewable energy production in order to reach the year 2020 goals which are
shown in Fig 1.6 and Fig 1.7.
Denmark European Union
Fig. 1.4. Renewable energy share in Denmark in 2010
was 21.9%.
Fig.1.5. Renewable energy share in the European
Union in 2010 was 11.6%.
Fig. 1.6. Renewable energy target for Denmark in
2020 is 30%.
Fig. 1.7. Renewable energy target for the European
Union in 2020 is 20%.
The availability of solar photovoltaic and on- and offshore wind power depends on seasonal and
hourly weather conditions which does not follow consumer demand. Significant amounts of excess
renewable energy will most likely start to emerge with continued expansion of the production
infrastructure for wind and solar energy. The excess periods will occur when the output from
photovoltaic cells and wind energy far exceeds consumer demand. In other periods, the output of
solar and wind energy will be only a fraction of the maximum production capacity and non-
5
renewable or stored energy from periods of excess production will be required. This behaviour has
to some degree been observed already. For example, in Germany in 2013 the average rate of
electricity consumption was 64 GW and the largest over- and undersupply was 15 and 9 GW,
respectively5. Electric energy from periods of excess production can be stored in systems that can
be charged and hold energy that later can be discharged as electrical energy. Examples of this are
pumped hydro, flywheels, compressed air and batteries. An alternative is to convert excess electric
energy into energy carriers such as heat, hydrogen or hydrocarbons and alcohols that can be
discharged outside the electrical power system and used for other applications.
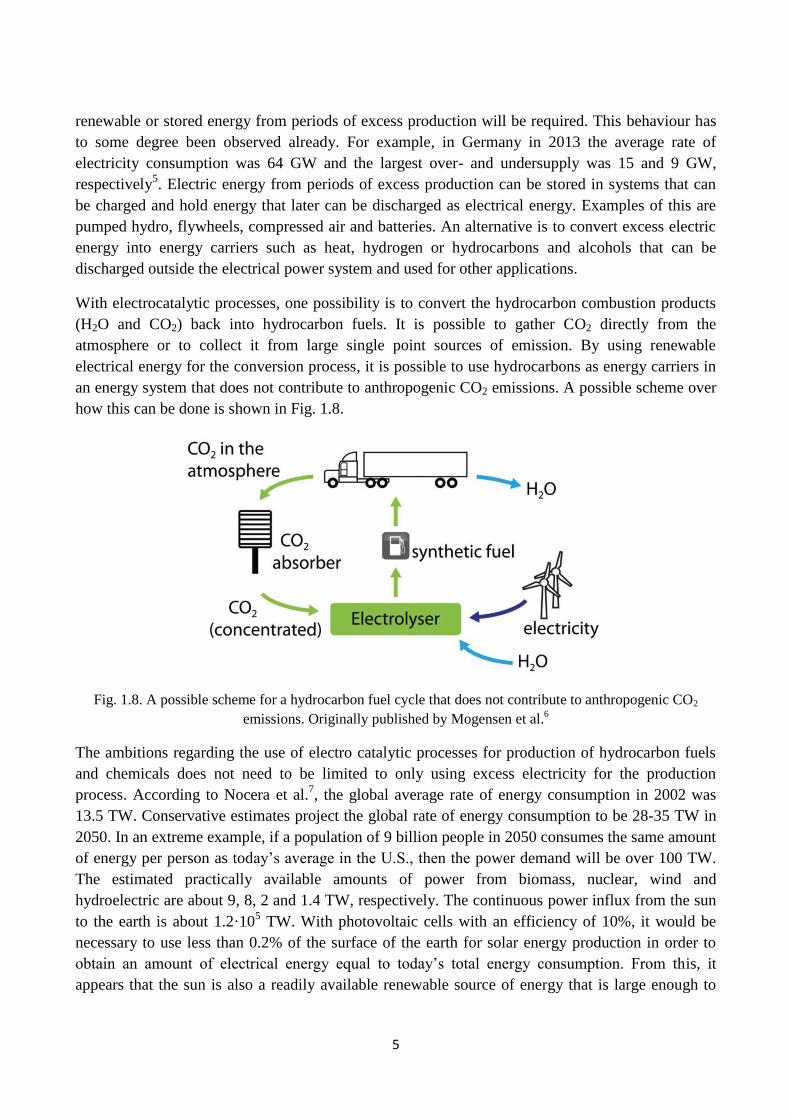
With electrocatalytic processes, one possibility is to convert the hydrocarbon combustion products
(H2O and CO2) back into hydrocarbon fuels. It is possible to gather CO2 directly from the
atmosphere or to collect it from large single point sources of emission. By using renewable
electrical energy for the conversion process, it is possible to use hydrocarbons as energy carriers in
an energy system that does not contribute to anthropogenic CO2 emissions. A possible scheme over
how this can be done is shown in Fig. 1.8.
Fig. 1.8. A possible scheme for a hydrocarbon fuel cycle that does not contribute to anthropogenic CO2
emissions. Originally published by Mogensen et al.6
The ambitions regarding the use of electro catalytic processes for production of hydrocarbon fuels
and chemicals does not need to be limited to only using excess electricity for the production
process. According to Nocera et al.7, the global average rate of energy consumption in 2002 was
13.5 TW. Conservative estimates project the global rate of energy consumption to be 28-35 TW in
2050. In an extreme example, if a population of 9 billion people in 2050 consumes the same amount
of energy per person as today’s average in the U.S., then the power demand will be over 100 TW.
The estimated practically available amounts of power from biomass, nuclear, wind and
hydroelectric are about 9, 8, 2 and 1.4 TW, respectively. The continuous power influx from the sun
to the earth is about 1.2·105 TW. With photovoltaic cells with an efficiency of 10%, it would be
necessary to use less than 0.2% of the surface of the earth for solar energy production in order to
obtain an amount of electrical energy equal to today’s total energy consumption. From this, it
appears that the sun is also a readily available renewable source of energy that is large enough to
6
satisfy expected future energy needs. Because of this, the development of processes for conversion
of electric energy into other energy carriers and also chemicals could become essential in order to
allow the creation of a sustainable energy future that permits a high standard of living for a wider
part of the global population.
1.2 Production of hydrogen and synthetic fuels
1.2.1 Heterogeneous catalysis
Heterogeneous catalysis is already commercially used to convert coal and natural gas into liquid
hydrocarbons. These processes are abbreviated as CTL, GTL or BTL when the feedstock is coal,
natural gas or biomass, respectively. Since the only major difference between these processes is the
feedstock, they are commonly referred to as X-to-liquids (XTL) processes in order to include all
processes in one term. In XTL processes, a feedstock is converted into synthesis gas (CO2 + CO +
H2) which later can be converted into methanol, olefins, dimethyl ether (DME) or paraffin.
Ammonia can also be made from synthesis gas if a water gas shift reactor is used to convert the CO
into H2 which can be mixed with N2 for the Haber-Bosch process. All of these processes consist of
two or three steps that are the production of synthesis gas, conversion of synthesis gas into
intermediate or final products and if necessary final upgrading to products. For the low temperature
Fischer-Tropsch process the intermediate product is a hydrocarbon wax that is solid at ambient
conditions and that needs to be upgraded to final products through hydrocracking. In the methanol
synthesis process the intermediate product is a mixture of water and methanol that needs to be
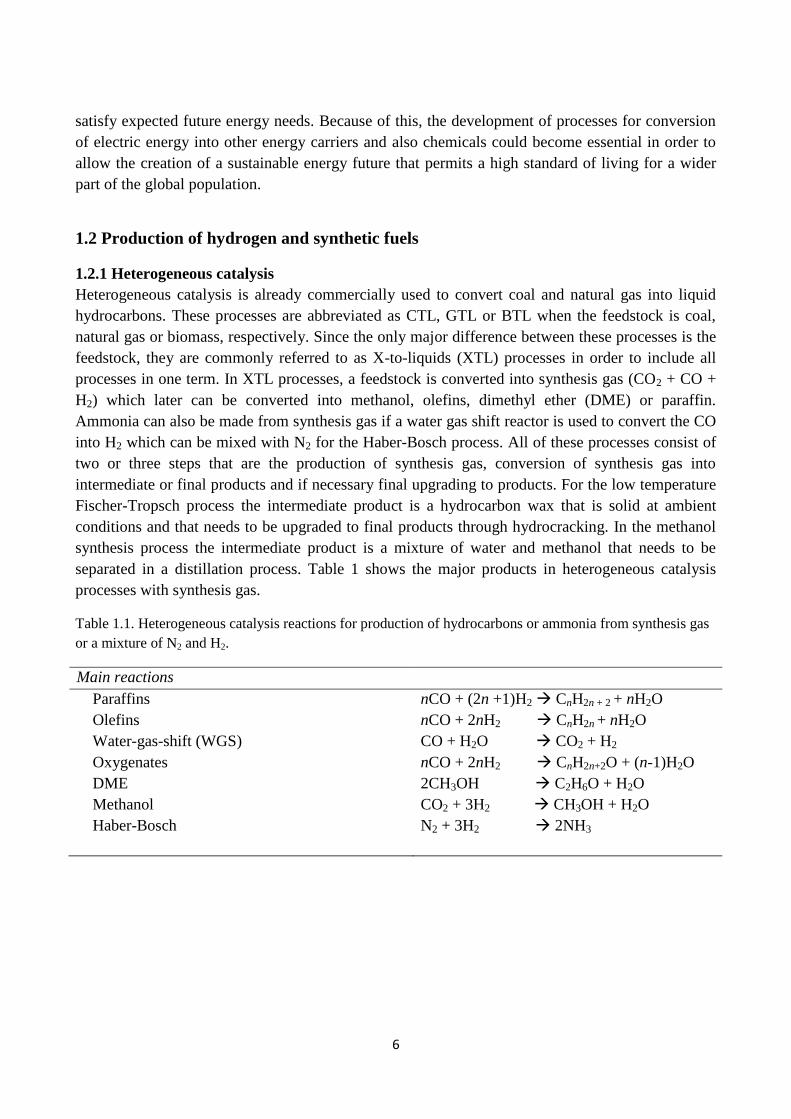
separated in a distillation process. Table 1 shows the major products in heterogeneous catalysis
processes with synthesis gas.
Table 1.1. Heterogeneous catalysis reactions for production of hydrocarbons or ammonia from synthesis gas
or a mixture of N2 and H2.
Main reactions
Paraffins nCO + (2n +1)H2 CnH2n + 2 + nH2O
Olefins nCO + 2nH2 CnH2n + nH2O
Water-gas-shift (WGS) CO + H2O CO2 + H2
Oxygenates nCO + 2nH2 CnH2n+2O + (n-1)H2O
DME 2CH3OH C2H6O + H2O
Methanol CO2 + 3H2 CH3OH + H2O
Haber-Bosch N2 + 3H2 2NH3
7
One step processes for conversion of methane directly into liquids does exist. One example of this
is a process that uses a Mo/H-ZSM5 catalyst for conversion of CH4 directly into a mixture
consisting mainly of solid carbon, naphthalene and benzene8. Since the two latter products are toxic
and have a limited marked these products also need further processing in order to make mass
market products.
It is also possible to make synthetic natural gas (SNG) from synthesis gas. This reaction was
discovered in 1913 by Sabatier and Senderens who used a nickel catalyst to carry out the reaction.
With the Sabatier process it is possible to make methane from other hydrocarbon feedstocks such as
biomass, coal and oil via synthesis gas.
𝐶𝑂 + 3𝐻2 → 𝐶𝐻4 + 𝐻2𝑂
1.2.2 Electrolysis cells
Electrolysis is an efficient technology for converting electrical and thermal energy into chemical
energy stored in fuels, by passing an electric current through two electrodes separated by an
electrolyte. Various kinds of electrolyser cells have been developed and are currently under
improvement. The different cells are often defined and classified by their electrolyte materials. The
electrolyte can be liquid like an alkaline solution as it is for alkaline electrolyser cells (AEC), or an
acid solution as it is for phosphoric acid and sulphuric acid electrolysis cells. On the other hand, the
electrolyte can be solid like a polymer as it is for polymer electrolyte membrane cells (PEMEC), or
a solid oxide as it is for solid oxide electrolysis cells (SOEC) or a proton conductor as for solid
proton conducting electrolysis cells (SPC-EC)9. The overall electrolysis reaction of H2O and/or CO2
is a sum of two half-cell reactions, which take place at each of the two electrodes. The reduction of
reactants or intermediates occurs at the cathode electrode, while the oxidation occurs at the anode
electrode. The operating conditions of the various electrolyser cells are related to the properties and
characteristics of the electrolytes used.
1.2.2.1 Low-temperature electrolysis
Alkaline water electrolysis cells are the most commonly used electrolysers and are already
commercially available. The electrode reactions are:
Cathode: 4 H2O (l) + 4 e- → 2 H2 (g) + 4 OH
- (aq)
Anode: 4 OH- (aq) → O2 (g) + 2 H2O (l) + 4 e
-
The conventional electrolyte is a 30 wt% KOH solution and the operating temperature is ~80 ⁰C. A
proton conducting membrane is used to separate the two electrodes to avoid crossover of evolved
gases. Nickel electrodes are applied in most commercial alkaline electrolyzers10
. In order to
electrochemically split H2O it is necessary to apply a voltage that exceeds a minimum that can be
determined by thermodynamics. At 25 °C and 1 atm pressure of the reactants, this is 1.23 V for
water splitting. Typically, it is necessary to apply a greater potential in order to electrochemically
split water at a feasible rate. The difference between the thermodynamically necessary potential to
drive the reaction and the applied voltage is typically referred to as the overpotential. Several
factors contribute to the necessary overpotential, but the typically largest contributing factor is the
8
reaction barriers related to the catalytic properties of the anode and the cathode. Alkaline
electrolysers are usually operated at rather high cell voltages (1.7 – 1.9 V) to obtain an acceptable
hydrogen production rate.
Co-electrolysis of H2O and CO2 related to alkaline electrolysis has been performed and is still under
development using aqueous carbonate or bicarbonate electrolyte11
. The electrochemical reduction of
H2O and CO2 can produce synthesis gas, alcohols and hydrocarbons such as formate, methanol,
methane and ethylene, depending on the cathode materials and cell parameters. The necessary
thermodynamic potential for electrochemical conversion of CO2 into hydrocarbons or alcohols is
similar to that of hydrogen evolution. Some of the reactions that can occur on the cathode during
CO2 reduction along with their equilibrium potential are shown in Table 1.2. The electrochemical
conversion of CO2 into hydrocarbons involves several electron transfers and intermediates. It is also
necessary to apply a large overpotential with currently available electrocatalysts.
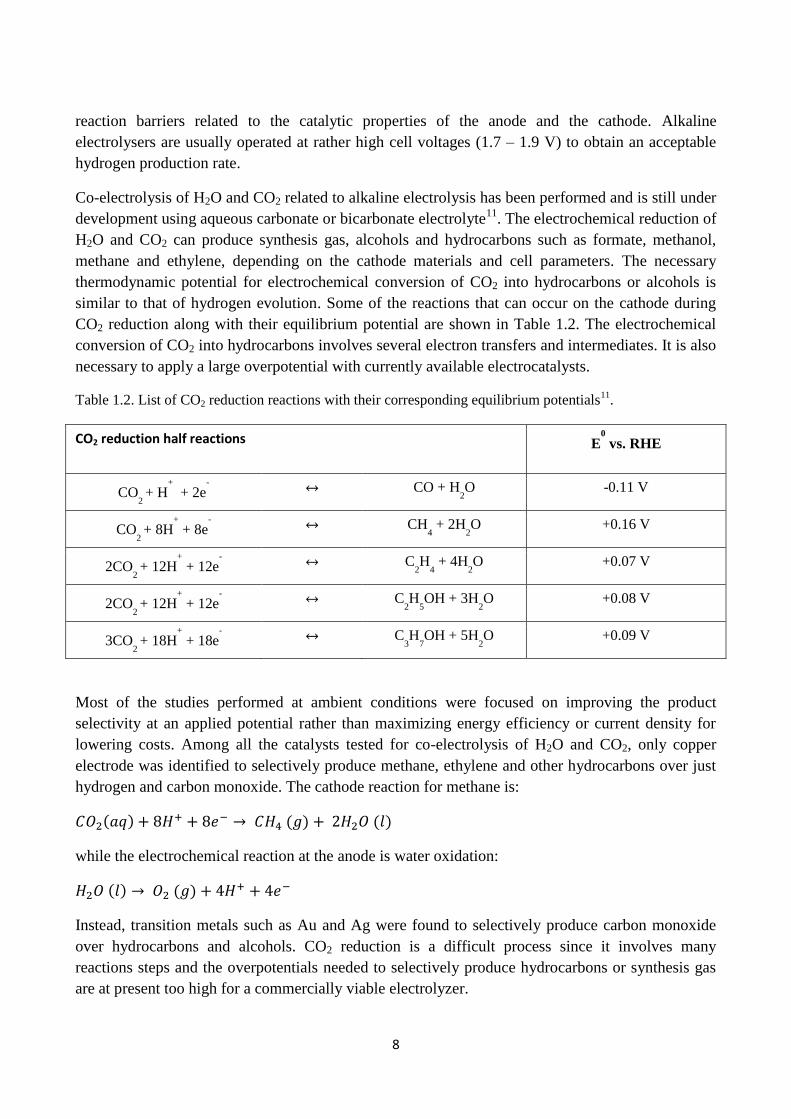
Table 1.2. List of CO2 reduction reactions with their corresponding equilibrium potentials11
.
CO2 reduction half reactions E0
vs. RHE
CO2 + H
+
+ 2e-
↔ CO + H2O -0.11 V
CO2 + 8H
+
+ 8e-
↔ CH4 + 2H
2O +0.16 V
2CO2 + 12H
+
+ 12e-
↔ C2H
4 + 4H
2O +0.07 V
2CO2 + 12H
+
+ 12e-
↔ C2H
5OH + 3H
2O +0.08 V
3CO2 + 18H
+
+ 18e-
↔ C3H
7OH + 5H
2O +0.09 V
Most of the studies performed at ambient conditions were focused on improving the product
selectivity at an applied potential rather than maximizing energy efficiency or current density for
lowering costs. Among all the catalysts tested for co-electrolysis of H2O and CO2, only copper
electrode was identified to selectively produce methane, ethylene and other hydrocarbons over just
hydrogen and carbon monoxide. The cathode reaction for methane is:
𝐶𝑂2(𝑎𝑞) + 8𝐻+ + 8𝑒− → 𝐶𝐻4 (𝑔) + 2𝐻2𝑂 (𝑙)
while the electrochemical reaction at the anode is water oxidation:
𝐻2𝑂 (𝑙) → 𝑂2 (𝑔) + 4𝐻+ + 4𝑒−
Instead, transition metals such as Au and Ag were found to selectively produce carbon monoxide
over hydrocarbons and alcohols. CO2 reduction is a difficult process since it involves many
reactions steps and the overpotentials needed to selectively produce hydrocarbons or synthesis gas
are at present too high for a commercially viable electrolyzer.
9
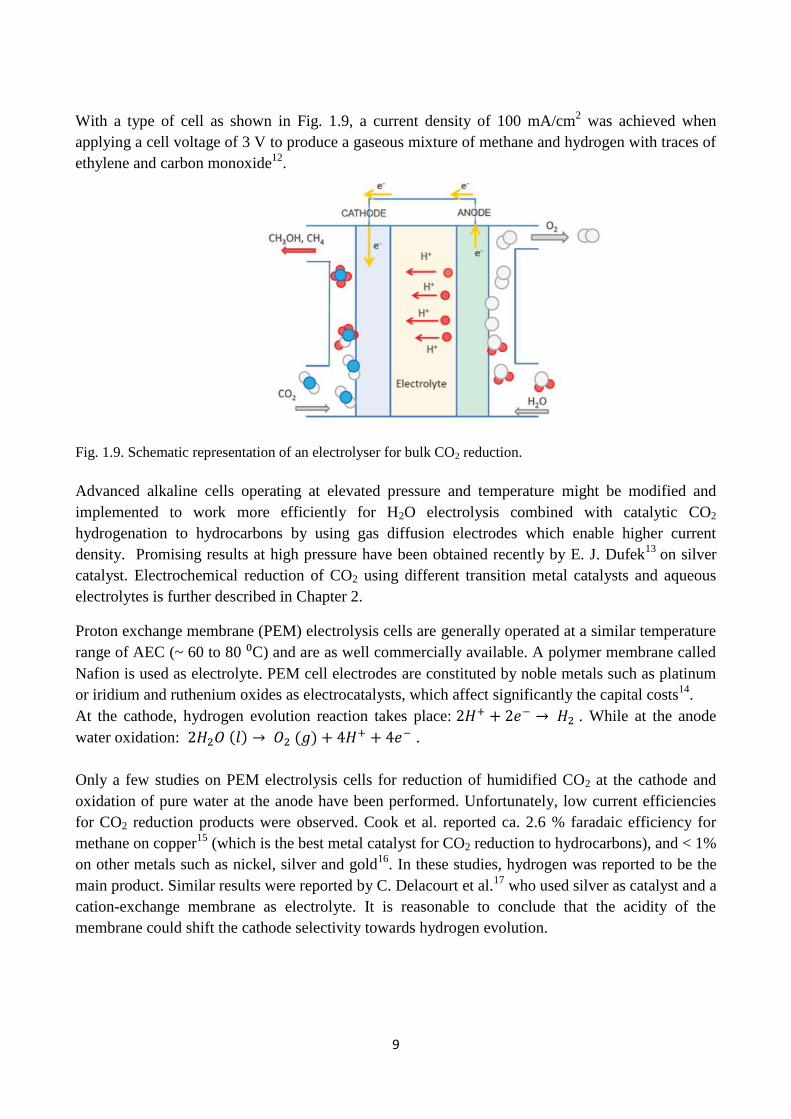
With a type of cell as shown in Fig. 1.9, a current density of 100 mA/cm2 was achieved when
applying a cell voltage of 3 V to produce a gaseous mixture of methane and hydrogen with traces of
ethylene and carbon monoxide12
.
Fig. 1.9. Schematic representation of an electrolyser for bulk CO2 reduction.
Advanced alkaline cells operating at elevated pressure and temperature might be modified and
implemented to work more efficiently for H2O electrolysis combined with catalytic CO2
hydrogenation to hydrocarbons by using gas diffusion electrodes which enable higher current
density. Promising results at high pressure have been obtained recently by E. J. Dufek13
on silver
catalyst. Electrochemical reduction of CO2 using different transition metal catalysts and aqueous
electrolytes is further described in Chapter 2.
Proton exchange membrane (PEM) electrolysis cells are generally operated at a similar temperature
range of AEC (~ 60 to 80 ⁰C) and are as well commercially available. A polymer membrane called
Nafion is used as electrolyte. PEM cell electrodes are constituted by noble metals such as platinum
or iridium and ruthenium oxides as electrocatalysts, which affect significantly the capital costs14
.
At the cathode, hydrogen evolution reaction takes place: 2𝐻+ + 2𝑒− → 𝐻2 . While at the anode
water oxidation: 2𝐻2𝑂 (𝑙) → 𝑂2 (𝑔) + 4𝐻+ + 4𝑒− .
Only a few studies on PEM electrolysis cells for reduction of humidified CO2 at the cathode and
oxidation of pure water at the anode have been performed. Unfortunately, low current efficiencies
for CO2 reduction products were observed. Cook et al. reported ca. 2.6 % faradaic efficiency for
methane on copper15
(which is the best metal catalyst for CO2 reduction to hydrocarbons), and < 1%
on other metals such as nickel, silver and gold16
. In these studies, hydrogen was reported to be the
main product. Similar results were reported by C. Delacourt et al.17
who used silver as catalyst and a
cation-exchange membrane as electrolyte. It is reasonable to conclude that the acidity of the
membrane could shift the cathode selectivity towards hydrogen evolution.
10
1.2.2.2 High-temperature electrolysis
Performing electrolysis at high temperature has both a thermodynamic advantage and an advantage
in reaction rates. By increasing the temperature, a bigger contribution of heat and therefore a
smaller contribution of electricity is required for the dissociation of the reactants. The high
temperature leads to faster reaction kinetics, which allows to decrease the utilization of expensive
catalyst materials. These aspects permit higher operational efficiency and higher current density.
Solid oxide electrolysis cells (SOECs) can operate for both steam electrolysis and co-electrolysis of
steam and carbon dioxide. The electrode reactions are:
Cathode: 𝐻2𝑂 (𝑔) + 2𝑒− → 𝐻2 (𝑔) + 𝑂2−
Or 𝐶𝑂2(𝑔) + 2𝑒− → 𝐶𝑂 (𝑔) + 𝑂2−
Anode: 𝑂2− →1
2𝑂2 (𝑔) + 2𝑒−
The only products that can be formed during the co-electrolysis process are CO and H2 (syngas),
which can be used as reactants for hydrocarbons and alcohols synthesis via heterogeneous catalysis.
The operating temperature of SOECs is between 750 – 900 ⁰C and the cells are usually constituted
by YSZ (yttria stabilized zirconia) electrolyte, Nickel-YSZ cathode and a LSM-YSZ anode, where
LSM is lanthanum strontium manganite (La1-xSrxMnyO3-δ)18,19
.
Solid proton conducting electrolysis cells (SPCECs) have been mainly studied for electrolysis of
water and recently it has been investigated the possibility of combining the electrolysis of water
with electrochemical conversion of CO220
,21
. The electrolytes are proton conducting oxides, mainly
based on ABO3-δ type perovskites such as SrCeO3, BaZrO3 and BaCeO3. The operating temperature
is usually above 400 ⁰C. The conductivity of cerates is higher than zirconates, however, zirconates
exhibit a better chemical stability in CO2, water and H2 containing atmospheres. The conduction
mechanism and other properties of this group of materials are further described in the Introduction
part of Chapter 3 and 4. The reactions for water electrolysis taking place at the electrodes are
oxidation of steam at the anode and hydrogen evolution at the cathode. Evolution of pure hydrogen
at the cathode represents an advantage compared to SOECs, in which the hydrogen needs to be
separated from the steam used as reactant. When both CO2 and water is involved in the electrolysis
process (co-electrolysis), the following electrode reactions can occur:
Anode: 2𝐻2𝑂 (𝑔) → 𝑂2 (𝑔) + 4𝐻+ + 4𝑒−
Cathode: 𝐶𝑂2(𝑔) + 2𝐻+ + 2𝑒− → 𝐶𝑂 (𝑔) + 𝐻2𝑂 (𝑔)
2𝐻+ + 2𝑒− → 𝐻2
Using solid solutions of Y-doped BaCeO3 and BaZrO3 (i.e. BaCe0.5Zr0.3Y0.16Zn0.04O3-δ or BCZYZ)
as proton conducting electrolyte and an iron based composite as cathode electrode, K. Xie et al. 22
have demonstrated that at 650 ⁰C it is possible to convert CO2 into CO with a faradaic efficiency of
29.5 %, but also into methane with a faradaic efficiency of ca. 2.4%, following the reaction:
11
𝐶𝑂2(𝑔) + 8𝐻+ + 8𝑒− → 𝐶𝐻4 (𝑔) + 2𝐻2𝑂 (𝑔)
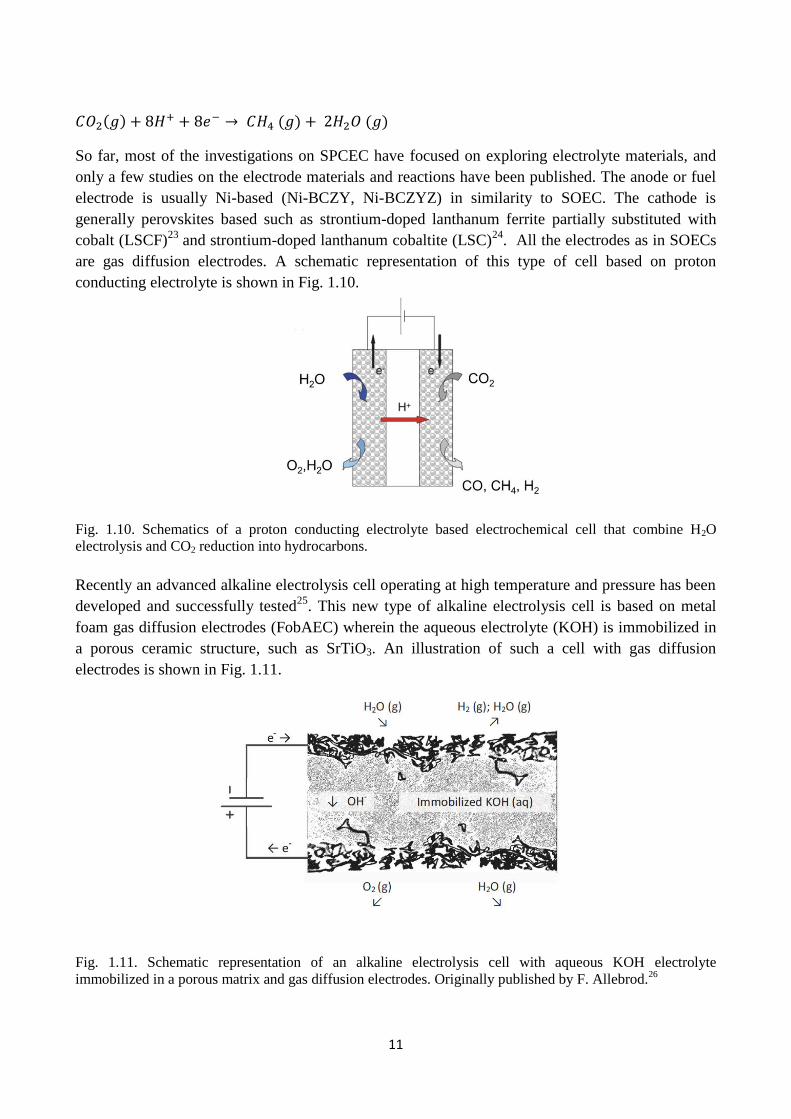
So far, most of the investigations on SPCEC have focused on exploring electrolyte materials, and
only a few studies on the electrode materials and reactions have been published. The anode or fuel
electrode is usually Ni-based (Ni-BCZY, Ni-BCZYZ) in similarity to SOEC. The cathode is
generally perovskites based such as strontium-doped lanthanum ferrite partially substituted with
cobalt (LSCF)23
and strontium-doped lanthanum cobaltite (LSC)24
. All the electrodes as in SOECs
are gas diffusion electrodes. A schematic representation of this type of cell based on proton
conducting electrolyte is shown in Fig. 1.10.
Fig. 1.10. Schematics of a proton conducting electrolyte based electrochemical cell that combine H2O
electrolysis and CO2 reduction into hydrocarbons.
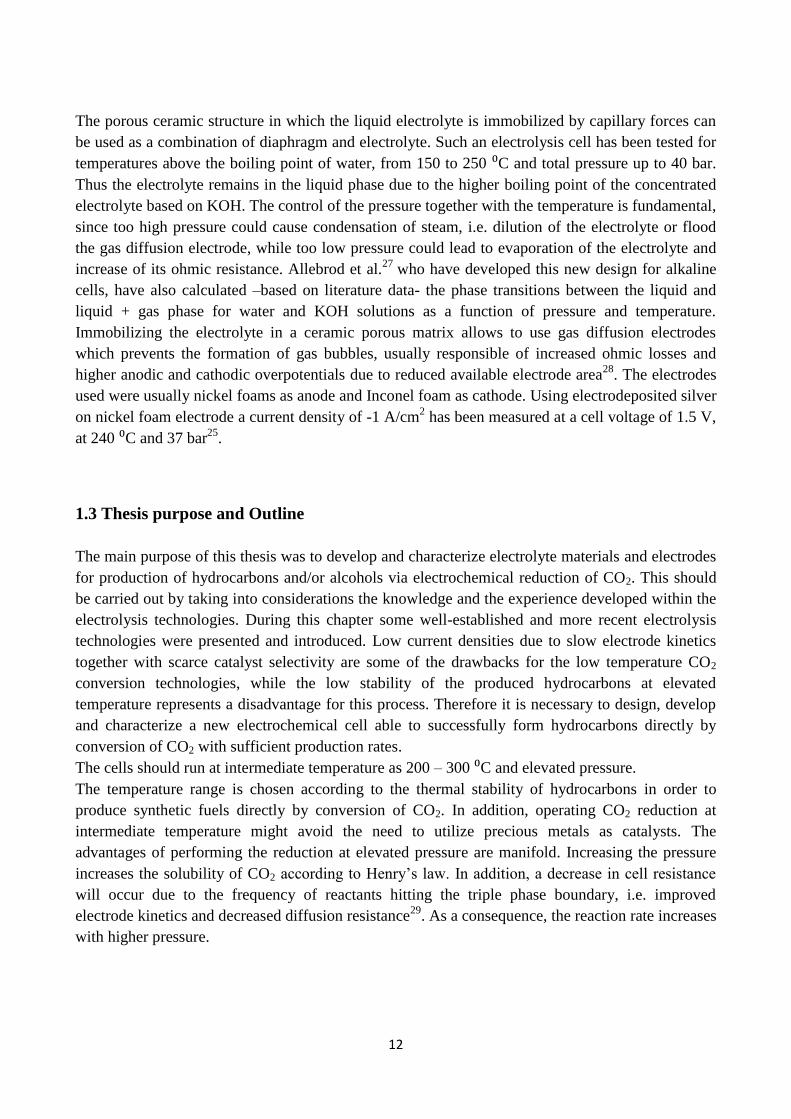
Recently an advanced alkaline electrolysis cell operating at high temperature and pressure has been
developed and successfully tested25
. This new type of alkaline electrolysis cell is based on metal
foam gas diffusion electrodes (FobAEC) wherein the aqueous electrolyte (KOH) is immobilized in
a porous ceramic structure, such as SrTiO3. An illustration of such a cell with gas diffusion
electrodes is shown in Fig. 1.11.
Fig. 1.11. Schematic representation of an alkaline electrolysis cell with aqueous KOH electrolyte
immobilized in a porous matrix and gas diffusion electrodes. Originally published by F. Allebrod.26
12
The porous ceramic structure in which the liquid electrolyte is immobilized by capillary forces can
be used as a combination of diaphragm and electrolyte. Such an electrolysis cell has been tested for
temperatures above the boiling point of water, from 150 to 250 ⁰C and total pressure up to 40 bar.
Thus the electrolyte remains in the liquid phase due to the higher boiling point of the concentrated
electrolyte based on KOH. The control of the pressure together with the temperature is fundamental,
since too high pressure could cause condensation of steam, i.e. dilution of the electrolyte or flood
the gas diffusion electrode, while too low pressure could lead to evaporation of the electrolyte and
increase of its ohmic resistance. Allebrod et al.27
who have developed this new design for alkaline
cells, have also calculated –based on literature data- the phase transitions between the liquid and
liquid + gas phase for water and KOH solutions as a function of pressure and temperature.
Immobilizing the electrolyte in a ceramic porous matrix allows to use gas diffusion electrodes
which prevents the formation of gas bubbles, usually responsible of increased ohmic losses and
higher anodic and cathodic overpotentials due to reduced available electrode area28
. The electrodes
used were usually nickel foams as anode and Inconel foam as cathode. Using electrodeposited silver
on nickel foam electrode a current density of -1 A/cm2 has been measured at a cell voltage of 1.5 V,
at 240 ⁰C and 37 bar25
.
1.3 Thesis purpose and Outline
The main purpose of this thesis was to develop and characterize electrolyte materials and electrodes
for production of hydrocarbons and/or alcohols via electrochemical reduction of CO2. This should
be carried out by taking into considerations the knowledge and the experience developed within the
electrolysis technologies. During this chapter some well-established and more recent electrolysis
technologies were presented and introduced. Low current densities due to slow electrode kinetics
together with scarce catalyst selectivity are some of the drawbacks for the low temperature CO2
conversion technologies, while the low stability of the produced hydrocarbons at elevated
temperature represents a disadvantage for this process. Therefore it is necessary to design, develop
and characterize a new electrochemical cell able to successfully form hydrocarbons directly by
conversion of CO2 with sufficient production rates.
The cells should run at intermediate temperature as 200 – 300 ⁰C and elevated pressure.
The temperature range is chosen according to the thermal stability of hydrocarbons in order to
produce synthetic fuels directly by conversion of CO2. In addition, operating CO2 reduction at
intermediate temperature might avoid the need to utilize precious metals as catalysts. The
advantages of performing the reduction at elevated pressure are manifold. Increasing the pressure
increases the solubility of CO2 according to Henry’s law. In addition, a decrease in cell resistance
will occur due to the frequency of reactants hitting the triple phase boundary, i.e. improved
electrode kinetics and decreased diffusion resistance29
. As a consequence, the reaction rate increases
with higher pressure.
13
This thesis is divided in eight chapters which are grouped into four parts. The introductory Part I
comprises two chapters explaining the purpose of this thesis, an introduction to the topic and
relevant theoretical backgrounds and concepts. Part II and Part III contain 3 and 2 chapters
presenting the experimental investigations on electrolytes and electrodes, respectively. Part II
contains the studies performed on proton conducting materials, such as Y-doped BaZrO3-BaCeO3
solid solutions and K-doped BaZr1-xYxO3-δ, where the main aim was to identify a proper electrolyte
which could be implemented into full cells. Chapter 5 compares the different materials considered
and explains the reason behind the choice of electrolyte to use in the third part of the thesis.
In Part III of the thesis the results of CO2 reduction acquired with two different electrochemical
cells and experimental setups are reported. In Chapter 6 is studied the electrocatalytic activity of
copper foam in aqueous media and at ambient condition for electrochemical reduction of CO2. It
represents a fundamental study of the copper foam electrode. The measurements were conducted at
the laboratory of Prof. Thomas F. Jaramillo (Stanford University – Chemical Engineer Department),
where it was possible to utilize an experimental setup which ensures high sensitivity for minor
products of CO2 reduction reaction. In Chapter 7 are reported the description of the new designed
electrochemical cell based on metal foam gas diffusion electrodes, able to reduce CO2 in a single
step process at elevated pressure. This chapter includes the results on the electrochemical
performance and product selectivity of such newly designed cell. The electrocatalysts tested were
copper and silver metal foams. Nickel metal foam was chosen as anode. The evaluation and
characterization of both microstructure and surface elemental composition of the different parts of
the cells are included.
Finally, the main conclusions of this work and the outlook are presented in Part IV - Chapter 8.
14
References
1 J. R. Petit, J. Jouzel, D. Raynaud, N. I. Barkov, J.M. Barnola, I. Basile, M. Bender, J. Chappellaz,
M. Davisk, G. Delaygue, M. Delmotte, V. M. Kotlyakov, M. Legrand, V. Y. Lipenkov, C. Lorius,
L. Pepin, C. Ritz, E. Saltzmank & M. Stievenard, Nature, 399 (1999) 429-436. 2 http://www.esrl.noaa.gov/gmd/ccgg/trends/ (accessed 30/05-2015)
3 U.S. Energy Information Administration, Independent Statistics & Analysis, International Energy
Outlook 2013, DOE/EIA – 0484 (2013). 4 L.W.M. Beurskens, M. Hekkenberg, “Renewable Energy Projections” as published in the National
Renewable Energy Action Plans of the European Member States, European Environment Agency,
2011. 5 J. Mayer, «Electricity Spot-Prices and Production Data in Germany 2013», Fraunhofer Institute
for Solar Energy Systems ISE, 2014.
http://www.ise.fraunhofer.de/de/downloads/pdf-files/aktuelles/boersenstrompreise-und-
stromproduktion-2013.pdf (accessed 29/05-2015) 6 M. Mogensen, F. Allebrod, J.R. Bowen, C. Chatzichristodoulou, M. Chen, S. D. Ebbesen, C.
Graves, J. Hallinder, A. Hauch, P.V. Hendriksen, P. Holtappels, J. V.T. Høgh, S.H. Jensen, A.
Lapina, P.L. Mollerup, X. Sun, 10th
International workshop on Large-Scale Integration of wind
power into Power System as well as on Transmission Networks for Offshore wind farms, ISBN:
978-3-9813870-3-2. (2011). 7 a) N.S. Lewis and D.G. Nocera, Proceedings of the National Academy of Sciences of the United
States of America, 103(43) (2006) 15729–15735. b) D.G. Nocera, 2006 Daedalus, 135(4) 112-115.
8 R.W. Borry, Y. H. Kim, A. Huffsmith, J. A. Reimer and E. Iglesia, Journal of Physical Chemistry
B, 103 (28) (1999) 5787-5796. 9 S. D. Ebbesen, S. H. Jensen, A. Hauch and M.B. Mogensen, Chemical Reviews, 114(21) (2014)
10697-10734. 10
P. Ragunathan, S. K. Mitra, M.G. Nayar, International Journal of Hydrogen Energy, 6(5) (1981)
487-496. 11
Y. Hori, “Electrochemical CO2 Reduction on Metal Electrodes”, MODERN ASPECTS OF
ELECTROCHEMISTRY No. 42, Edited by VAYENAS et al., Springer (NY) 2008 12
M. Gattrell, N. Gupta, A. Co, Energy Conversion and Management, 48 (4) (2007) 1255-1265. 13
E.J. Dufek, T. E. Lister, S. G. Stone, M.E. McIlwain , Journal of the Electrochemical Society, 159
(9) (2012) F514-F517. 14
C.A. Linkous, H.R. Anderson, R.W. Kopitzke, G.L. Nelson, International Journal of Hydrogen
Energy, 23 (1998) 525-529. 15
R.L. Cook, R.C. MacDuff, A.F. Sammells, Journal of The Electrochemical Society, 135 (1988)
1470. 16
R.L. Cook, R.C. MacDuff, A.F. Sammells, Journal of The Electrochemical Society, 137 (1990)
187. 17
C. Delacourt, P. L. Ridgway, J. B. Kerr, J. Newman, Journal of the Electrochemical Society,
155(1) (2008) B42-B49. 18
A. Ursúa, L. M. Gandia, P. Sanchis, Proceedings of the IEEE, 100 (2012) 410. 19
S.H. Jensen, X. Sun, S.D. Ebbesen, R. Knibbe, M. Mogensen, International Journal of Hydrogen
Energy, 35 (2010) 9544-9549. 20
E. Ruiz-Trejo, J.T.S. Irvine, Solid State Ionics, 216 (2012) 36. 21
E. Ruiz-Trejo, J.T.S. Irvine, Solid State Ionics, 252 (2013) 157. 22
K. Xie, Y. Zhang, G. Meng, J.T.S. Irvine, Journal of Materials Chemistry, 21 (2011) 195.

15
23
V. Kyriakou, C. Athanasiou, I. Garagounis, A. Skodra, M. Stoukides, Solid State Ionics, 225
(2012) 219. 24
H. Iwahara, H. Uchida, I. Yamasaki, International Journal of Hydrogen Energy, 12 (1987) 73. 25
F. Allebrod, C. Chatzichristodoulou, M.B. Mogensen, Journal of Power Sources, 229 (2013) 22-
31. 26
Frank Allebrod, “High Temperature and Pressure Alkaline Electrolysis”, PhD Thesis, DTU
Technical University of Denmark, Department of Energy, March 2013. 27
F. Allebrod, C. Chatzichristodoulou, P.L. Mollerup, M.B. Mogensen, International Journal of
Hydrogen Energy, 37 (2012) 16505. 28
G. Kreysa and H. J. Kuelps, Journal of the Electrochemical Society, 128(5) (1981), 979–984. 29
A. Momma, K. Takano, Y. Tanaka, T. Kato, A. Yamamoto, ECS Transaction, 57 (2013) 699.
16
Chapter 2
Electrochemical reduction of CO2 in
aqueous electrolytes. This Chapter provides a description of the cell design used for CO2 reduction in aqueous
electrolytes. It includes a brief literature review on both the ionic conductivity of a suitable
electrolyte and on the electrocatalytic properties of various transition metals for CO2 reduction.
2.1 Cell concept
The main aim of this exploratory study was to develop and characterize electrolyte and electrode
materials for electrochemical reduction of CO2 into hydrocarbons and/or alcohols in a single
device.
A temperature range between 200 to 300 ⁰C and elevated pressure up to 50 bar are the target
operating conditions, since several hydrocarbons are stable and reaction kinetics are improved at
these conditions. There are no current electrochemical systems that can produce hydrocarbons at
such temperatures and pressures. Because of this, investigation of promising and potentially
suitable electrolytes and electrodes is needed.
The electrochemical cell consists of three main parts: anode, cathode and electrolyte.
Different classes of electrolytes, all having their optimal operating conditions are described in the
literature. The electrolyte can be solid or liquid. However, aqueous electrolytes are known for
their high conductivity at low temperatures1. As reported in Chapter 1, F. Allebrod et al.
2
developed a new alkaline steam electrolysis cell operating at temperatures and pressures up to
250 ⁰C and 42 bar, respectively. By immobilizing the aqueous electrolyte (KOH) via capillary
forces into a porous structure it was possible to use metal foam gas diffusion electrodes and to
avoid the formation of bubbles at the electrodes.
Similarly P.L. Mollerup3 investigated the potential of immobilized aqueous K2CO3 as a possible
electrolyte for co-electrolysis of CO2 and water at ca. 200 ⁰C. This was done by studying the
properties of pure aqueous K2CO3 and immobilized aqueous K2CO3 in two different porous
ceramic matrixes. KHCO3 is a well-known electrolyte for reduction of CO2 4,5
.
Using K2CO3 (aq) as electrolyte leads to the following equilibrium reactions in the
electrochemical cell:
𝐻2𝑂 + 𝐶𝑂32− ↔ 𝑂𝐻− + 𝐻𝐶𝑂3
−
𝐶𝑂2 + 𝑂𝐻− ↔ 𝐻𝐶𝑂3−
These equilibrium reactions can also be written as:
𝐶𝑂2 + 𝐻2𝑂 + 𝐶𝑂32− ↔ 2 𝐻𝐶𝑂3
−
17
This indicates that increasing the partial pressure of 𝐶𝑂2 the equilibrium will be shifted to the
right and therefore the amount of 𝐻𝐶𝑂3− ions will also increase. This also suggests that the 𝐶𝑂2
partial pressure can influence the possible charge carriers in the aqueous electrolyte.
P.L. Mollerup3 calculated that the main charge carriers for 10wt% K2CO3 used in CO2
atmosphere are most likely K+ and 𝐻𝐶𝑂3
−.
The anode reaction (water oxidation) can be written as:
2𝐻2𝑂 ↔ 𝑂2 + 4 𝑒− + 4𝐻+
Or
4 𝑂𝐻− ↔ 𝑂2 + 4 𝑒− + 2𝐻2𝑂
While at the cathode 𝐶𝑂2 is reduced and 𝐻2𝑂 is involved as proton donor (𝑂𝐻− ) since the
electrochemical reactions occur in an aqueous solution. If the products are CO, methane or
methanol the reactions are as follows:
𝐶𝑂2 + 𝐻2𝑂 + 2𝑒− ↔ 𝐶𝑂 + 2 𝑂𝐻−
𝐶𝑂2 + 6𝐻2𝑂 + 8𝑒− ↔ 𝐶𝐻4 + 8 𝑂𝐻−
𝐶𝑂2 + 5𝐻2𝑂 + 6𝑒− ↔ 𝐶𝐻3𝑂𝐻 + 6 𝑂𝐻−
At the same potential as 𝐶𝑂2 reduction reaction occurs, it is also possible for water to be reduced
to make hydrogen, which is a concurrent reaction:
2𝐻2𝑂 + 2𝑒− ↔ 𝐻2 + 2 𝑂𝐻− .
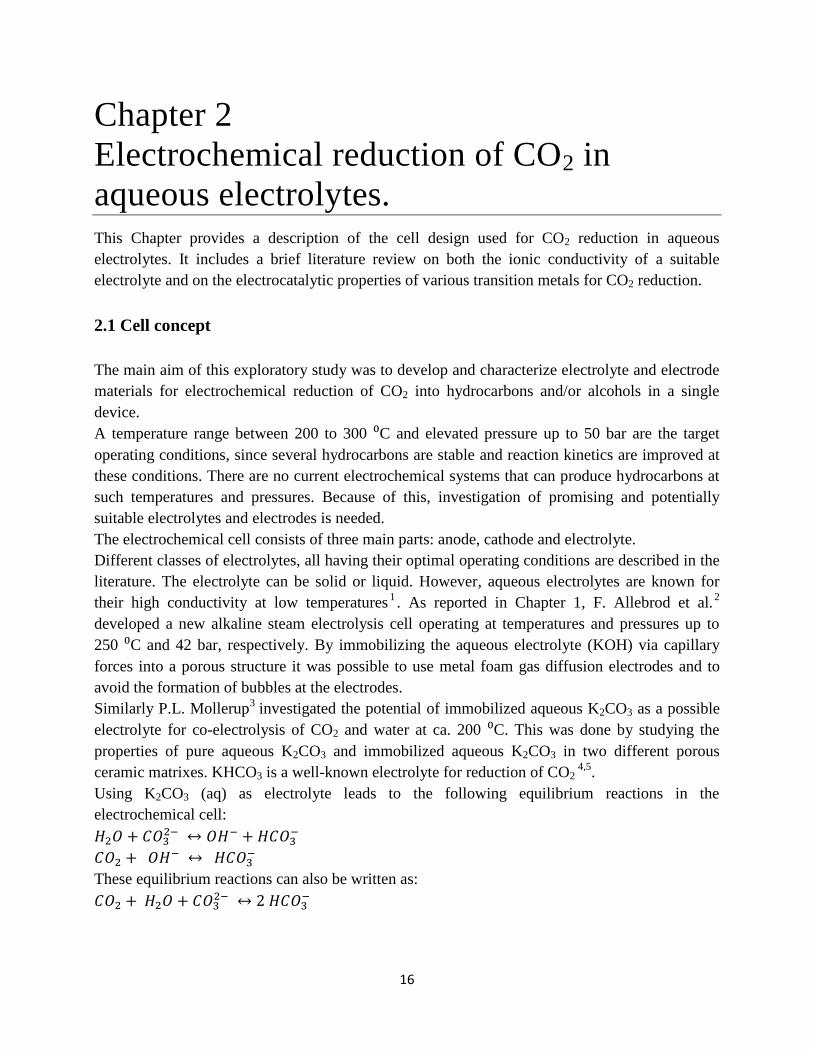
The cell concept that was proposed for this study could consist of an immobilized aqueous
electrolyte and electrocatalytic active gas diffusion electrodes for CO2 fixation and O2 evolution,
respectively. A schematic representation is shown in Fig. 2.1.
Fig. 2.1. Illustration of the suggested electrochemical cell with immobilized aqueous K2CO3 as electrolyte
and with gas diffusion electrodes. The cathode is exposed to CO2 and to the H2O present in the electrolyte,
while on the anode O2 evolution takes place as well as some CO2 formation. 𝐻𝐶𝑂3− and 𝐶𝑂3
− are the
possible charge carriers. Adapted and modified from P. L. Mollerup3.
18
2.1.1 Conductivity of aqueous and immobilized K2CO3
In order to use aqueous electrolytes at intermediate temperatures and elevated pressure it is
important to know the ionic conductivity at different concentrations as a function of the operating
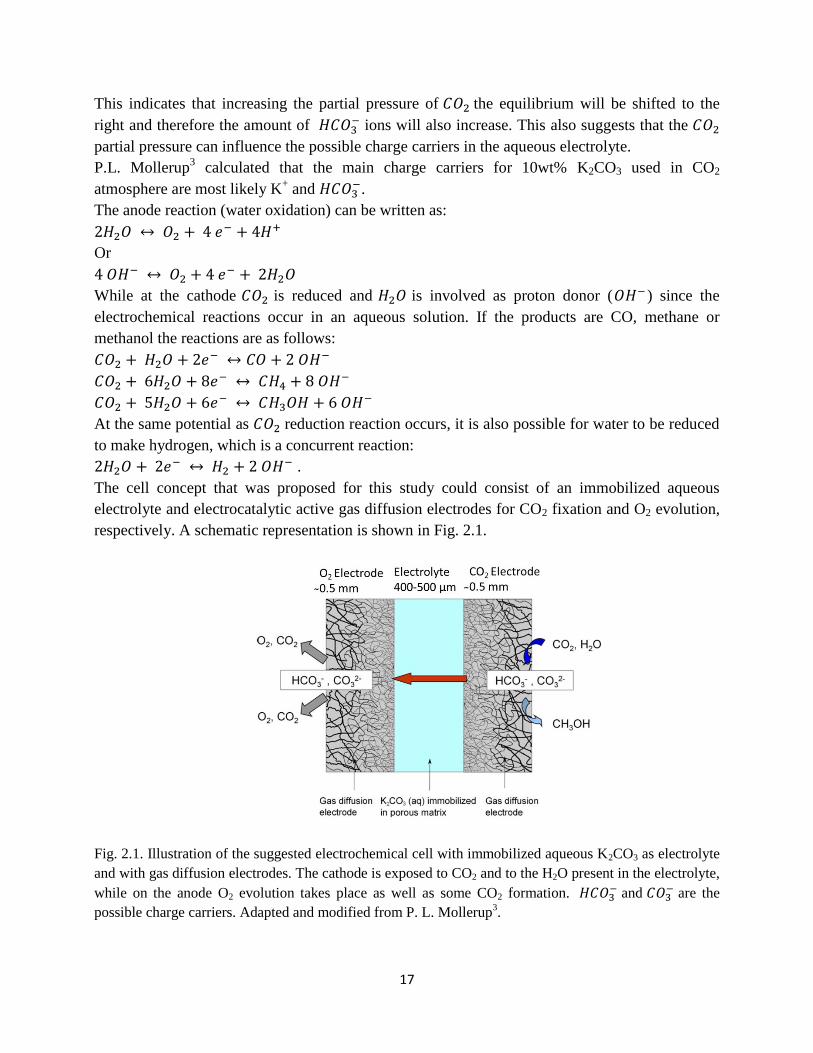
conditions. The conductivity of 10-50 wt% aqueous K2CO3 at ambient conditions was measured
by P.L. Mollerup6
using the van der Pauw method in combination with electrochemical
impedance spectroscopy (EIS) . Fig. 2.2 shows the comparison between the measured values and
other published literature results 1,7
. The maximum conductivity was observed for a concentration
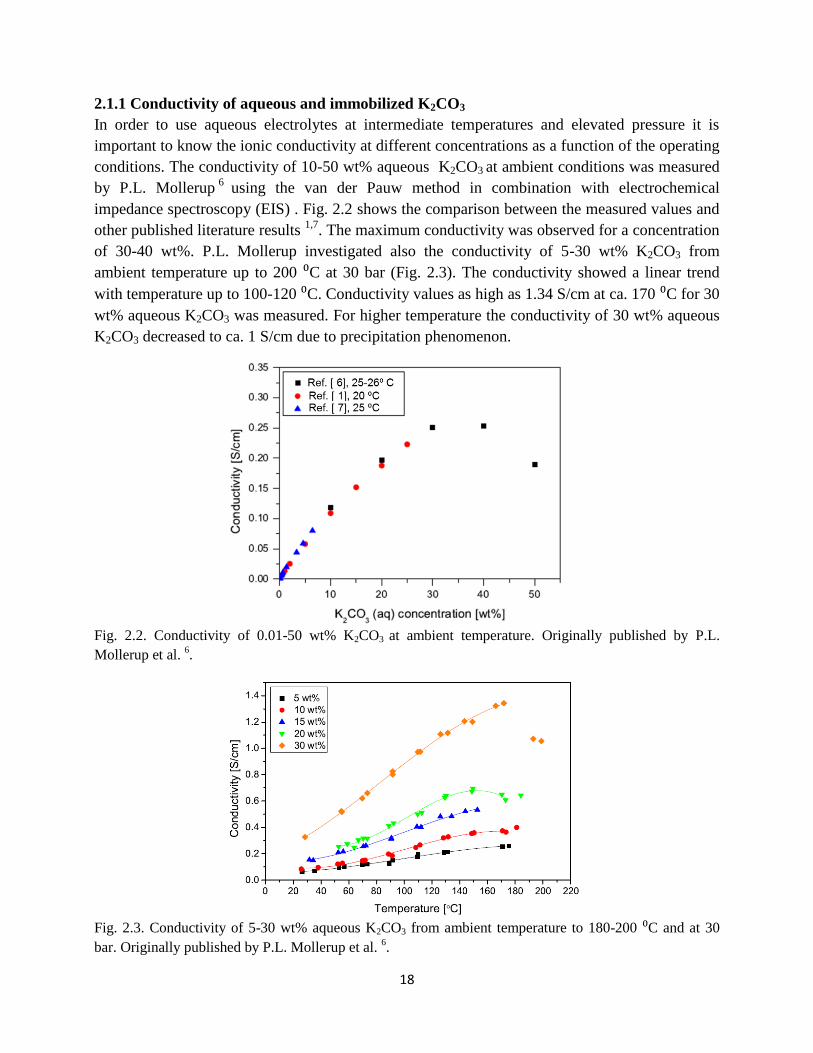
of 30-40 wt%. P.L. Mollerup investigated also the conductivity of 5-30 wt% K2CO3 from
ambient temperature up to 200 ⁰C at 30 bar (Fig. 2.3). The conductivity showed a linear trend
with temperature up to 100-120 ⁰C. Conductivity values as high as 1.34 S/cm at ca. 170 ⁰C for 30
wt% aqueous K2CO3 was measured. For higher temperature the conductivity of 30 wt% aqueous
K2CO3 decreased to ca. 1 S/cm due to precipitation phenomenon.
Fig. 2.2. Conductivity of 0.01-50 wt% K2CO3 at ambient temperature. Originally published by P.L.
Mollerup et al. 6.
Fig. 2.3. Conductivity of 5-30 wt% aqueous K2CO3 from ambient temperature to 180-200 ⁰C and at 30
bar. Originally published by P.L. Mollerup et al. 6.
19
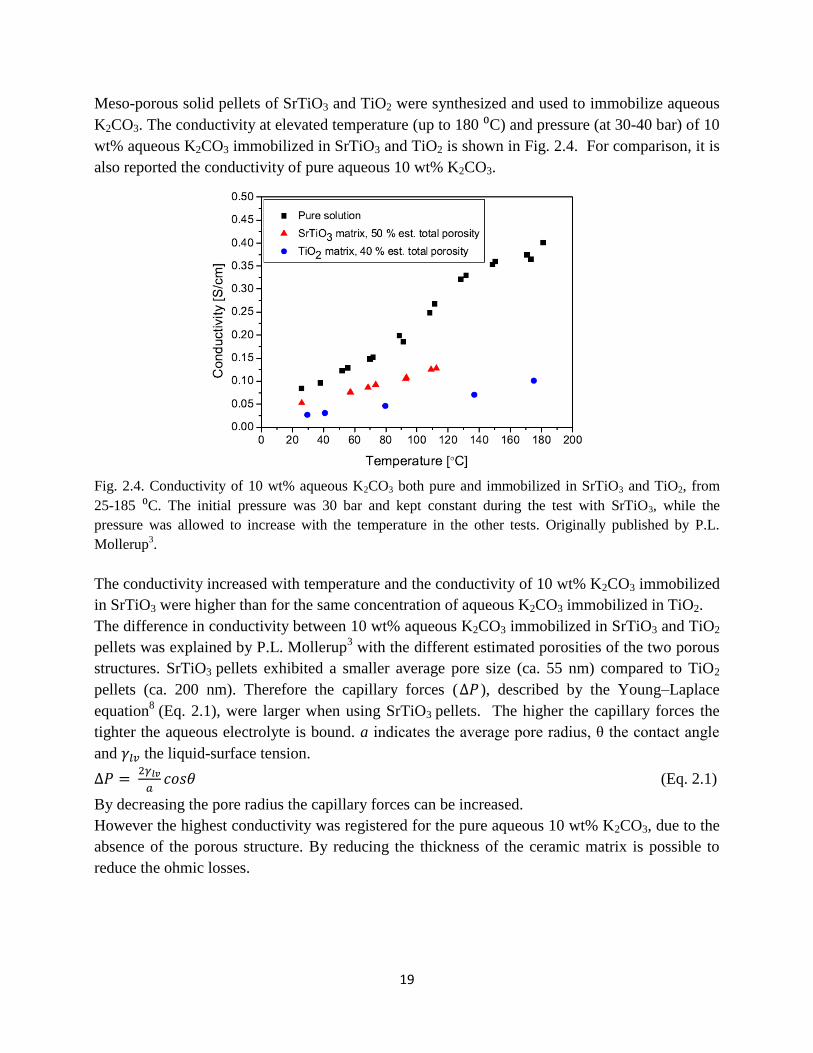
Meso-porous solid pellets of SrTiO3 and TiO2 were synthesized and used to immobilize aqueous
K2CO3. The conductivity at elevated temperature (up to 180 ⁰C) and pressure (at 30-40 bar) of 10
wt% aqueous K2CO3 immobilized in SrTiO3 and TiO2 is shown in Fig. 2.4. For comparison, it is
also reported the conductivity of pure aqueous 10 wt% K2CO3.
Fig. 2.4. Conductivity of 10 wt% aqueous K2CO3 both pure and immobilized in SrTiO3 and TiO2, from
25-185 ⁰C. The initial pressure was 30 bar and kept constant during the test with SrTiO3, while the
pressure was allowed to increase with the temperature in the other tests. Originally published by P.L.
Mollerup3.
The conductivity increased with temperature and the conductivity of 10 wt% K2CO3 immobilized
in SrTiO3 were higher than for the same concentration of aqueous K2CO3 immobilized in TiO2.
The difference in conductivity between 10 wt% aqueous K2CO3 immobilized in SrTiO3 and TiO2
pellets was explained by P.L. Mollerup3 with the different estimated porosities of the two porous
structures. SrTiO3 pellets exhibited a smaller average pore size (ca. 55 nm) compared to TiO2
pellets (ca. 200 nm). Therefore the capillary forces (∆𝑃 ), described by the Young–Laplace
equation8 (Eq. 2.1), were larger when using SrTiO3 pellets. The higher the capillary forces the
tighter the aqueous electrolyte is bound. a indicates the average pore radius, θ the contact angle
and 𝛾𝑙𝑣 the liquid-surface tension.
∆𝑃 = 2𝛾𝑙𝑣
𝑎𝑐𝑜𝑠𝜃 (Eq. 2.1)
By decreasing the pore radius the capillary forces can be increased.
However the highest conductivity was registered for the pure aqueous 10 wt% K2CO3, due to the
absence of the porous structure. By reducing the thickness of the ceramic matrix is possible to
reduce the ohmic losses.
20
2.2 Electrocatalysts for CO2 reduction
A key technological challenge fundamental to enable the conversion of CO2 into value added
products is the development of catalysts that are active and selective for this reaction. The
desirable catalyst should reduce CO2 at low overpotentials, generate selected products at high
current densities with slow degradation and avoid the formation of unwanted byproducts. Many
studies have focused on ways to increase the energy efficiency of CO2 reduction reaction. The
main contribution was given in 1985 by Hori et al.4, when they discovered that methane and
ethylene were the major products when copper metal was used as a catalyst at ambient conditions
and in 0.1 M KHCO3 aqueous electrolyte. Since then, a number of scientific articles9,10,11,12,13
have compared the activity of different transition metals and found that the products of the CO2
reduction reaction depend on the type of bond to the catalyst and the binding energy of CO,
which is believed to be a fundamental intermediate in the reduction of CO2, to the transition
metal catalyst used. Table 2.1 shows literature data on the measured faradaic efficiencies with
different metal electrodes. These results were obtained by applying a constant current density of -
5 mA/cm2 at ambient conditions and in 0.1 M KHCO3 aqueous electrolyte and U is the electrode
potential. The values of potentials are expressed vs reversible hydrogen electrode (RHE) scale by
Vvs.RHE = Vvs.SHE + 0.059 *pH(solution) . The RHE is a subtype of the standard hydrogen electrodes
which differs from it by the fact that the measured potential takes into account the pH value of
the electrolyte.
Table 2.1 Faradaic efficiencies of products in CO2 reduction at various metal electrodes. Electrolyte: 0.1
M KHCO3 T = 18 - 19°C, applied current density - 5 mA/cm2 (Adapted and modified from Hori
13)
Metal
U
V vs. RHE
Faradaic Efficiency (%)
CH4 C2H4 C2H5OH C3H8O CO HCOO- H2 Total
Ni -1.18 1.8 0 0 0 0 1 89 92
Fe -0.57 0 0.1 0 0 0 0 95 95
Pt -0.67 0 0 0 0 0 0 96 96
Ti -1.20 0 0 0 0 tr 0 100 100
Pb -1.23 0 0 0 0 0 97 5 102
Tl 1.20 0 0 0 0 0 95 6 100
In -1.15 0 0 0 0 2 95 5 101
Sn -1.08 0 0 0 0 7 88 5 100
Cd -1.23 1.3 0 0 0 14 78 9 100
Au -0.75 0 0 0 0 87 1 10 103
Ag -0.97 0 0 0 0 81 1 12 98
Zn -1.14 0 0 0 0 79 6 10 95
Pd -0.80 2.9 0 0 0 28 3 26 95
Ga -0.84 0 0 0 0 23 0 79 60
Cu -1.04 33.3 25.5 5.7 3 1.3 9 20 102
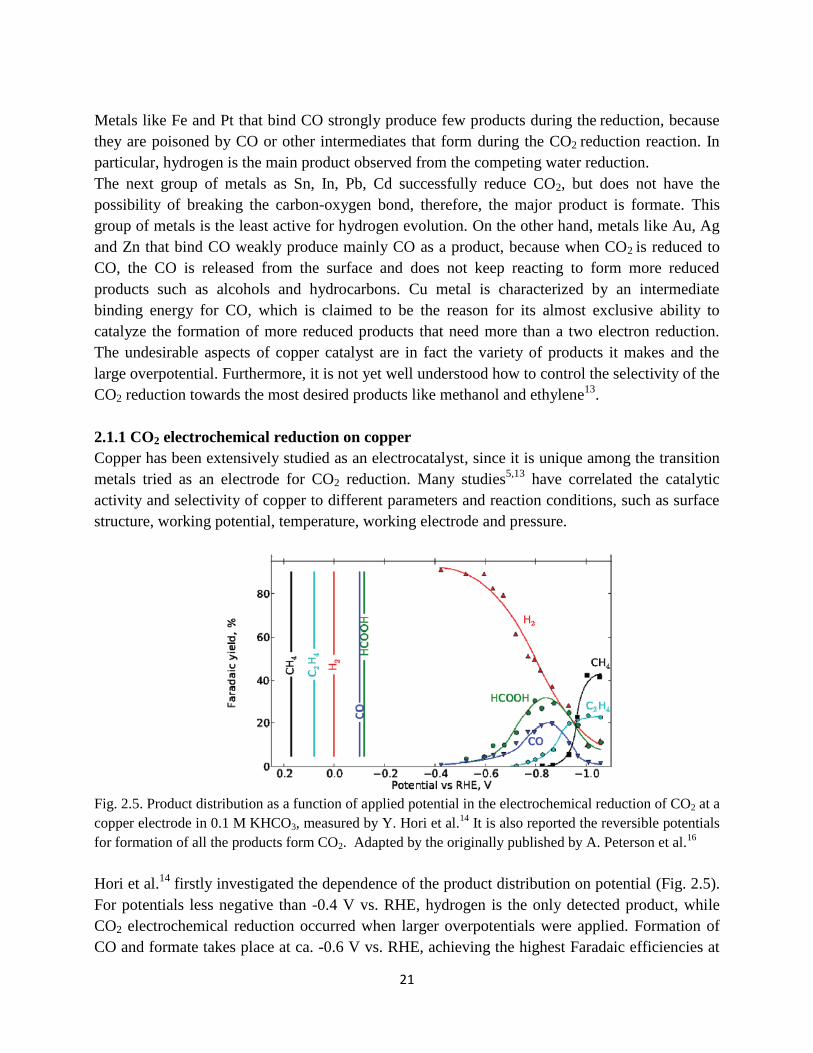
21
Metals like Fe and Pt that bind CO strongly produce few products during the reduction, because
they are poisoned by CO or other intermediates that form during the CO2 reduction reaction. In
particular, hydrogen is the main product observed from the competing water reduction.
The next group of metals as Sn, In, Pb, Cd successfully reduce CO2, but does not have the
possibility of breaking the carbon-oxygen bond, therefore, the major product is formate. This
group of metals is the least active for hydrogen evolution. On the other hand, metals like Au, Ag
and Zn that bind CO weakly produce mainly CO as a product, because when CO2 is reduced to
CO, the CO is released from the surface and does not keep reacting to form more reduced
products such as alcohols and hydrocarbons. Cu metal is characterized by an intermediate
binding energy for CO, which is claimed to be the reason for its almost exclusive ability to
catalyze the formation of more reduced products that need more than a two electron reduction.
The undesirable aspects of copper catalyst are in fact the variety of products it makes and the
large overpotential. Furthermore, it is not yet well understood how to control the selectivity of the
CO2 reduction towards the most desired products like methanol and ethylene13
.
2.1.1 CO2 electrochemical reduction on copper
Copper has been extensively studied as an electrocatalyst, since it is unique among the transition
metals tried as an electrode for CO2 reduction. Many studies5,13
have correlated the catalytic
activity and selectivity of copper to different parameters and reaction conditions, such as surface
structure, working potential, temperature, working electrode and pressure.
Fig. 2.5. Product distribution as a function of applied potential in the electrochemical reduction of CO2 at a
copper electrode in 0.1 M KHCO3, measured by Y. Hori et al.14
It is also reported the reversible potentials
for formation of all the products form CO2. Adapted by the originally published by A. Peterson et al.16
Hori et al.14
firstly investigated the dependence of the product distribution on potential (Fig. 2.5).
For potentials less negative than -0.4 V vs. RHE, hydrogen is the only detected product, while
CO2 electrochemical reduction occurred when larger overpotentials were applied. Formation of
CO and formate takes place at ca. -0.6 V vs. RHE, achieving the highest Faradaic efficiencies at
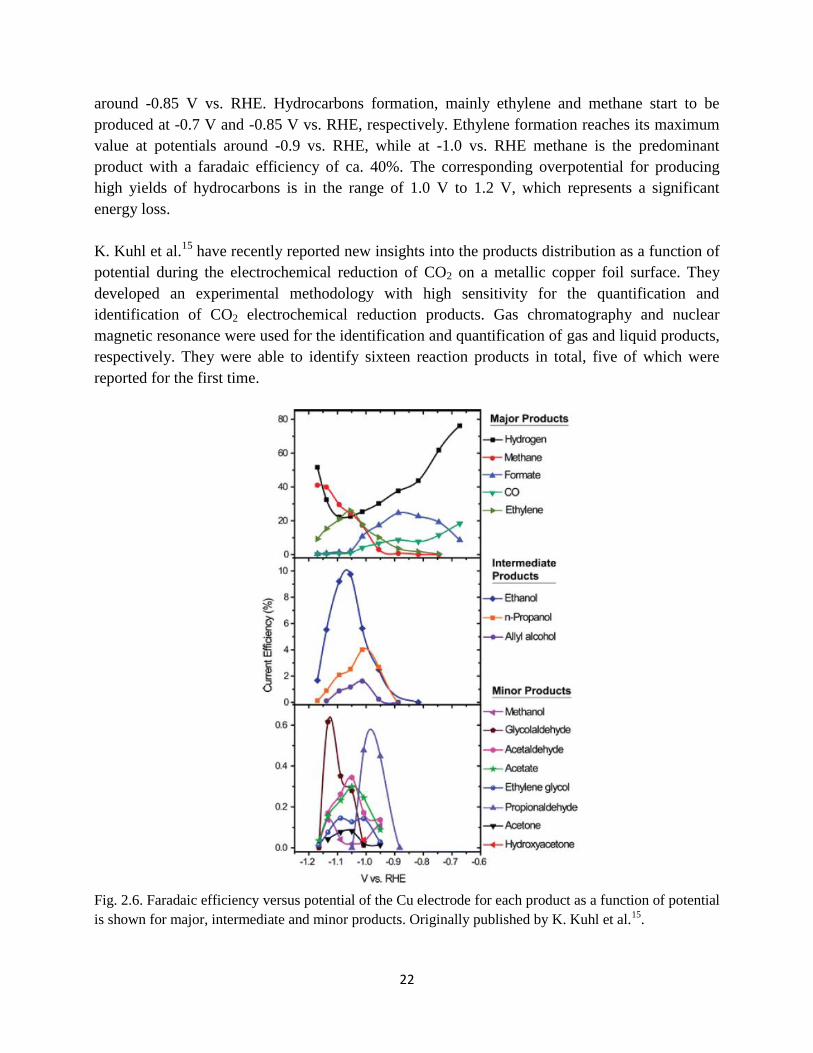
22
around -0.85 V vs. RHE. Hydrocarbons formation, mainly ethylene and methane start to be
produced at -0.7 V and -0.85 V vs. RHE, respectively. Ethylene formation reaches its maximum
value at potentials around -0.9 vs. RHE, while at -1.0 vs. RHE methane is the predominant
product with a faradaic efficiency of ca. 40%. The corresponding overpotential for producing
high yields of hydrocarbons is in the range of 1.0 V to 1.2 V, which represents a significant
energy loss.
K. Kuhl et al.15
have recently reported new insights into the products distribution as a function of
potential during the electrochemical reduction of CO2 on a metallic copper foil surface. They
developed an experimental methodology with high sensitivity for the quantification and
identification of CO2 electrochemical reduction products. Gas chromatography and nuclear
magnetic resonance were used for the identification and quantification of gas and liquid products,
respectively. They were able to identify sixteen reaction products in total, five of which were
reported for the first time.
Fig. 2.6. Faradaic efficiency versus potential of the Cu electrode for each product as a function of potential
is shown for major, intermediate and minor products. Originally published by K. Kuhl et al.15
.
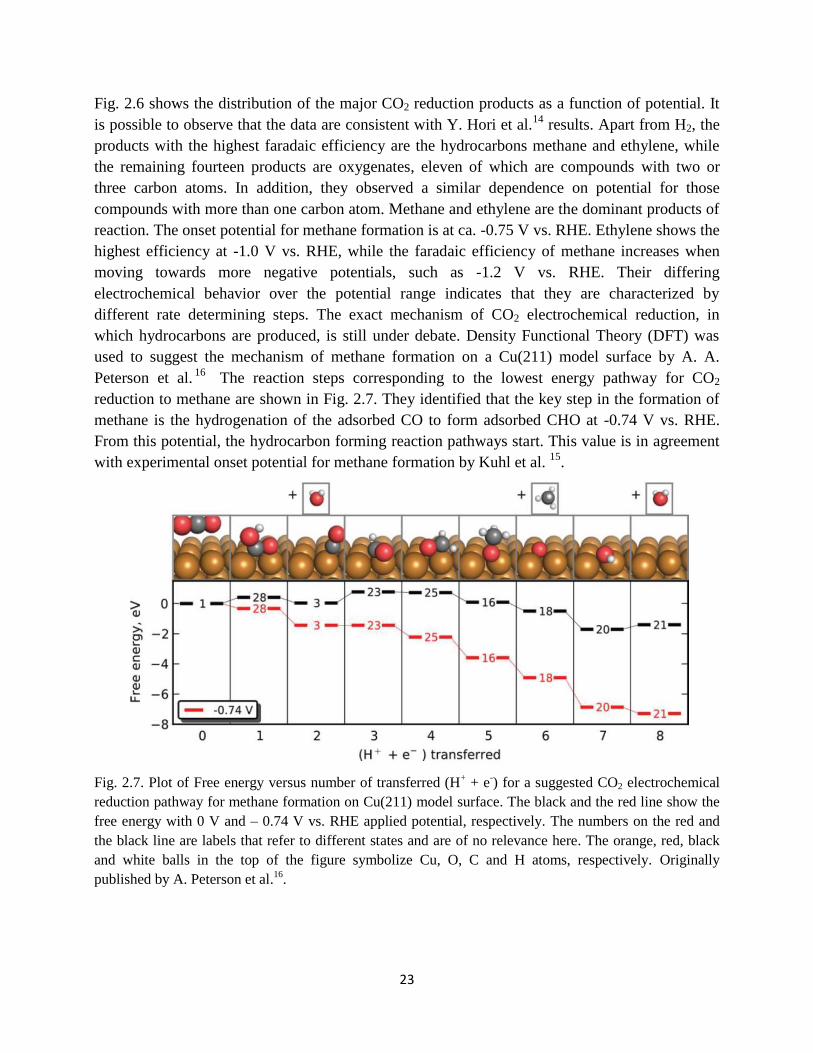
23
Fig. 2.6 shows the distribution of the major CO2 reduction products as a function of potential. It
is possible to observe that the data are consistent with Y. Hori et al.14
results. Apart from H2, the
products with the highest faradaic efficiency are the hydrocarbons methane and ethylene, while
the remaining fourteen products are oxygenates, eleven of which are compounds with two or
three carbon atoms. In addition, they observed a similar dependence on potential for those
compounds with more than one carbon atom. Methane and ethylene are the dominant products of
reaction. The onset potential for methane formation is at ca. -0.75 V vs. RHE. Ethylene shows the
highest efficiency at -1.0 V vs. RHE, while the faradaic efficiency of methane increases when
moving towards more negative potentials, such as -1.2 V vs. RHE. Their differing
electrochemical behavior over the potential range indicates that they are characterized by
different rate determining steps. The exact mechanism of CO2 electrochemical reduction, in
which hydrocarbons are produced, is still under debate. Density Functional Theory (DFT) was
used to suggest the mechanism of methane formation on a Cu(211) model surface by A. A.
Peterson et al.16
The reaction steps corresponding to the lowest energy pathway for CO2
reduction to methane are shown in Fig. 2.7. They identified that the key step in the formation of
methane is the hydrogenation of the adsorbed CO to form adsorbed CHO at -0.74 V vs. RHE.
From this potential, the hydrocarbon forming reaction pathways start. This value is in agreement
with experimental onset potential for methane formation by Kuhl et al. 15
.
Fig. 2.7. Plot of Free energy versus number of transferred (H+ + e
-) for a suggested CO2 electrochemical
reduction pathway for methane formation on Cu(211) model surface. The black and the red line show the
free energy with 0 V and – 0.74 V vs. RHE applied potential, respectively. The numbers on the red and
the black line are labels that refer to different states and are of no relevance here. The orange, red, black
and white balls in the top of the figure symbolize Cu, O, C and H atoms, respectively. Originally
published by A. Peterson et al.16
.
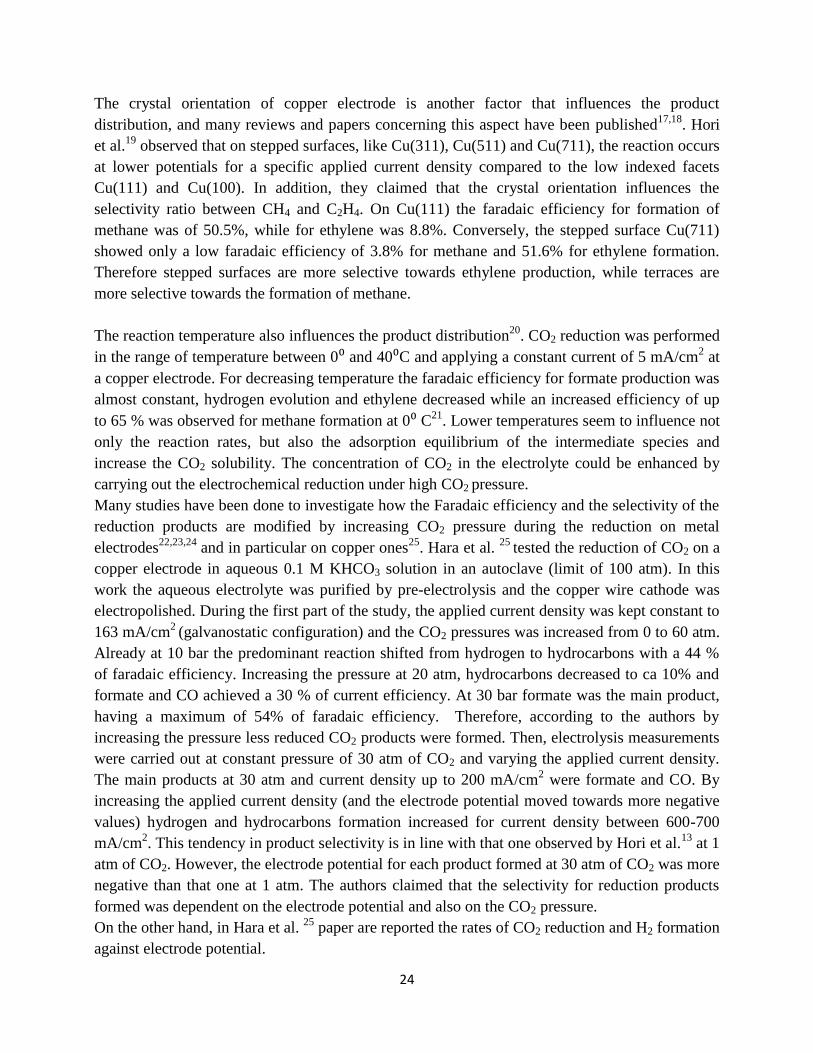
24
The crystal orientation of copper electrode is another factor that influences the product
distribution, and many reviews and papers concerning this aspect have been published17,18
. Hori
et al.19
observed that on stepped surfaces, like Cu(311), Cu(511) and Cu(711), the reaction occurs
at lower potentials for a specific applied current density compared to the low indexed facets
Cu(111) and Cu(100). In addition, they claimed that the crystal orientation influences the
selectivity ratio between CH4 and C2H4. On Cu(111) the faradaic efficiency for formation of
methane was of 50.5%, while for ethylene was 8.8%. Conversely, the stepped surface Cu(711)
showed only a low faradaic efficiency of 3.8% for methane and 51.6% for ethylene formation.
Therefore stepped surfaces are more selective towards ethylene production, while terraces are
more selective towards the formation of methane.
The reaction temperature also influences the product distribution20
. CO2 reduction was performed
in the range of temperature between 0⁰ and 40⁰C and applying a constant current of 5 mA/cm2 at
a copper electrode. For decreasing temperature the faradaic efficiency for formate production was
almost constant, hydrogen evolution and ethylene decreased while an increased efficiency of up
to 65 % was observed for methane formation at 0⁰ C21
. Lower temperatures seem to influence not
only the reaction rates, but also the adsorption equilibrium of the intermediate species and
increase the CO2 solubility. The concentration of CO2 in the electrolyte could be enhanced by
carrying out the electrochemical reduction under high CO2 pressure.
Many studies have been done to investigate how the Faradaic efficiency and the selectivity of the
reduction products are modified by increasing CO2 pressure during the reduction on metal
electrodes22,23,24
and in particular on copper ones25
. Hara et al. 25
tested the reduction of CO2 on a
copper electrode in aqueous 0.1 M KHCO3 solution in an autoclave (limit of 100 atm). In this
work the aqueous electrolyte was purified by pre-electrolysis and the copper wire cathode was
electropolished. During the first part of the study, the applied current density was kept constant to
163 mA/cm2
(galvanostatic configuration) and the CO2 pressures was increased from 0 to 60 atm.
Already at 10 bar the predominant reaction shifted from hydrogen to hydrocarbons with a 44 %
of faradaic efficiency. Increasing the pressure at 20 atm, hydrocarbons decreased to ca 10% and
formate and CO achieved a 30 % of current efficiency. At 30 bar formate was the main product,
having a maximum of 54% of faradaic efficiency. Therefore, according to the authors by
increasing the pressure less reduced CO2 products were formed. Then, electrolysis measurements
were carried out at constant pressure of 30 atm of CO2 and varying the applied current density.
The main products at 30 atm and current density up to 200 mA/cm2 were formate and CO. By
increasing the applied current density (and the electrode potential moved towards more negative
values) hydrogen and hydrocarbons formation increased for current density between 600-700
mA/cm2. This tendency in product selectivity is in line with that one observed by Hori et al.
13 at 1
atm of CO2. However, the electrode potential for each product formed at 30 atm of CO2 was more
negative than that one at 1 atm. The authors claimed that the selectivity for reduction products
formed was dependent on the electrode potential and also on the CO2 pressure.
On the other hand, in Hara et al. 25
paper are reported the rates of CO2 reduction and H2 formation
against electrode potential.
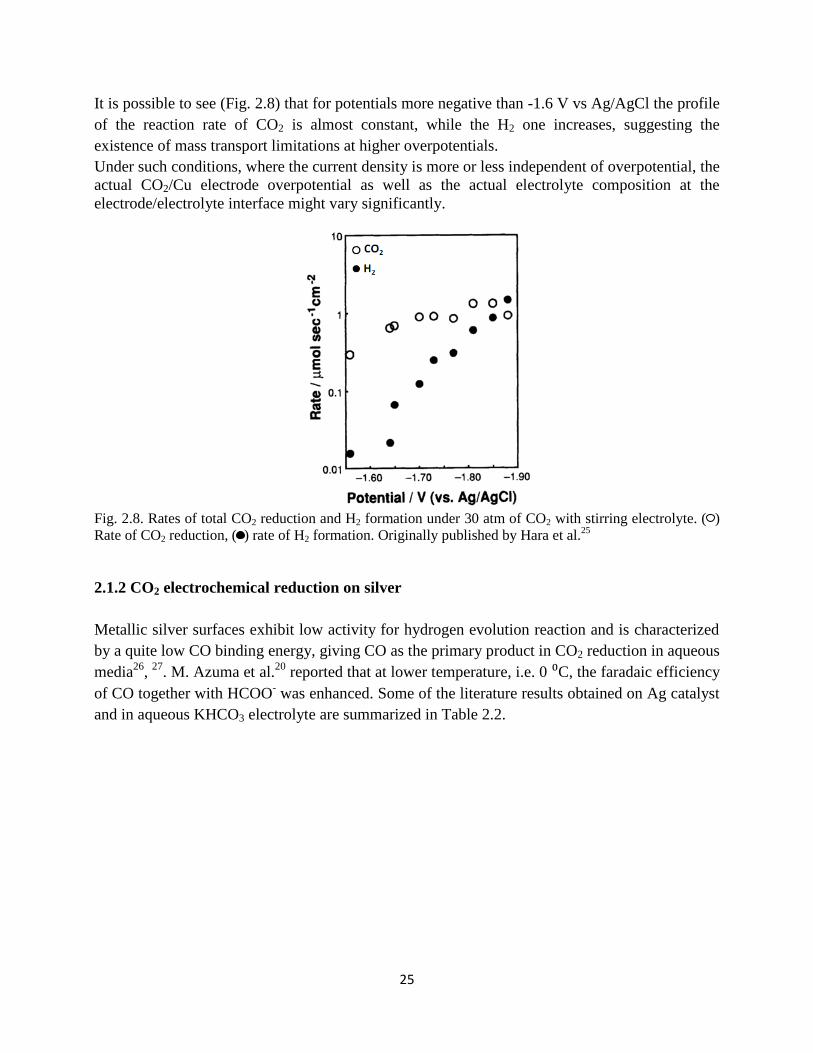
25
It is possible to see (Fig. 2.8) that for potentials more negative than -1.6 V vs Ag/AgCl the profile
of the reaction rate of CO2 is almost constant, while the H2 one increases, suggesting the
existence of mass transport limitations at higher overpotentials.
Under such conditions, where the current density is more or less independent of overpotential, the
actual CO2/Cu electrode overpotential as well as the actual electrolyte composition at the
electrode/electrolyte interface might vary significantly.
Fig. 2.8. Rates of total CO2 reduction and H2 formation under 30 atm of CO2 with stirring electrolyte. ( )
Rate of CO2 reduction, ( ) rate of H2 formation. Originally published by Hara et al.25
2.1.2 CO2 electrochemical reduction on silver
Metallic silver surfaces exhibit low activity for hydrogen evolution reaction and is characterized
by a quite low CO binding energy, giving CO as the primary product in CO2 reduction in aqueous
media26
, 27
. M. Azuma et al.20
reported that at lower temperature, i.e. 0 ⁰C, the faradaic efficiency
of CO together with HCOO- was enhanced. Some of the literature results obtained on Ag catalyst
and in aqueous KHCO3 electrolyte are summarized in Table 2.2.
26
Table 2.2 Literature overview of the faradaic efficiencies of CO, HCOO- and H2 obtained during
electrolysis on Ag electrodes at room temperature and pressure. The potentials are expressed vs. SHE.
Electrode Electrolyte Faradaic efficiencies Ref
Ag-based
GDEs
0.2 M KHCO3 65-80 % CO and ca. 15 % HCOO- between -1.5 and -2.8 V
vs SHE; current density is not given; H2 efficiency not
determined experimentally.
[28
]
Ag planar
electrode
0.5 M KHCO3 61.4-89.9 % CO, 1.6-4.6 % HCOO-, and 10.4-35.3 % H2 at
-1.4 V vs SHE, and 5 mA/cm2.
[4]
Ag planar
electrode
0.1 M KHCO3 81.5 % CO, 0.8 % HCOO-, and 12.4 % H2 at – 1.37 V vs
SHE and 5 mA/cm2.
[29
]
Ag planar
electrode
0.05 M KHCO3 30 % CO, 16 % HCOO-, and 50 % H2 at -1.96 V vs SHE;
current density not given.
[20
]
Ag planar
electrode
0.1 M KHCO3 64.7 % CO and 28 % H2 at -1.4 V vs SHE and 1.5 mA/cm2. [
26]
Ag planar
electrode
0.5 M KHCO3 15-20 % CO and 60-65 % H2 at -1.8 V vs SHE; current
density not given.
[30
]
Recent work from T. Hatsukade et al. 31
provides a more detailed insight into the product
distribution as a function of potential during the electrocatalytic CO2 reduction on silver foil
electrodes in aqueous electrolyte and ambient conditions.
Fig. 2.9. Faradaic efficiency for each products detected as a function of potential. Originally published by
T. Hatsukade et al31
.
27
The same highly sensitive electrochemical cell setup used by K. Kuhl allowed the detection of six
different products, two of them reported for the first time. H2 and CO are the major products
detected and four different minor products were also observed: formate, methane, methanol and
ethanol. In Fig. 2.9 the faradaic efficiency is reported as a function of the applied potential.
Hydrogen and CO have a combined faradaic efficiency of 90 % over the potential range
investigated. The evolution of hydrogen is dominant at the lowest (-0.6 V to -1 V vs RHE) and
highest (-1.2 V to -1.4 V vs RHE) overpotential, while CO has its maximum in the intermediate
(-1.0 V to -1.2 V vs RHE) overpotential. On the other hand, the faradaic efficiencies of the minor
products increase with the overpotential. The onset potential (ca. -1.2 V vs RHE) for the
formation of methane, methanol and ethanol is similar and according to the authors this might be
due to similarities in their mechanistic pathways, and perhaps indicate a common rate-
determining step.
The pressurized electrochemical reduction of CO2 has been investigated on Ag electrode surface
both at ambient temperature20
and at 60⁰ to 90⁰ C32
. The predominant reduction product is CO
on Ag electrodes under high pressure, as is the case under a pressure of 1 atm. The faradaic
efficiency for CO formation reaches 78.8% at a current density of 300 mA cm-2
, and is 34.9% at
600 mA cm-2
at 30 bar in 0.1 M KHCO3 electrolyte. The faradaic efficiency for CO formation
decreases with increasing current density. E. Dufek et al.32
reported an initial study on the
operation of an electrolysis cell for pressurized reduction of CO2 able to generate syngas mixtures
continuously at high current density. By using a gas diffusion silver electrode the amount of CO
generated at 18.5 bar is five times higher than that observed at ambient pressure, with faradaic
efficiency of ca. 90% observed at 350 mA/cm2. At 18.5 bar and 60⁰ C the faradaic efficiency for
CO production was still ca. 90 % after one hour electrolysis test even applying a lower current
density of 225 mA/cm2.
References
1 W. M. Haynes, Ed. CRC Handbook of Chemistry and Physics, 92
nd ed.; CRC Press/Taylor and
Francis: Boca Raton, FL. 2 F. Allebrod, C. Chatzichristodoulou, M.B. Mogensen, Journal of Power Sources, 229 (2013) 22-
31. 3 Pia Lolk Mollerup, “New Electrolytes for CO2 Electrolysis cells”, Department of Energy
Conversion and Storage, Technical University of Denmark, December 2012. 4 Y. Hori, K. Kikuchi, S. Suzuki, Chemistry Letters, 14 (1985), 1695-1698.
5 M. Gattrell, N. Gupta, A. Co, Journal of Electroanalytical Chemistry, 594 (2006), 1-19.
6 P.L. Mollerup, A.S. Christiansen, N. Bonanos, M.B. Mogensen, Journal of new materials for
electrochemical system, 16 (2013), 279-285. 7 E.W. Washburn, Ed. International Critical Tables of Numerical Data, Physics, Chemistry and
Technology (1st Electronic Edition); Knovel, 2003; Chapter VI, pp 259-256.
8 S. Lowell, J.E. Shields, M.A. Thomas, M. Thommes, Characterization of Porous Solids and
Powders: Surface Area, Pore Size and Density, 4th
ed.; Springer New York, 2004.
28
9 Handbook of Fuel Cells: Fundamentals, Technology and Application; Hori, Y., Ed.; VHC-
Wiley: Chichester, 2003; Vol. 2. 10
K. J. P Schouten,Y. Kwon, C.J.M. van der Ham, Z. Qin, M.T. M. Koper, Chemical Science, 2
(2011) 1902. 11
M. Jitaru, D.A. Lowy, M. Toma, B. C. Toma, L. Oniciu, Journal of Applied Electrochemistry
27 (1997), 875. 12
K. Watanabe, U. Nagashima, and H. Hosoya, Chemical Physics letters, 209 (1993) 109-110. 13
Y. Hori, in Modern aspects of electrochemistry, ed. C. Vayenas, R. White, and M. Gamboa-
Aldeco, Springer, New York, 2008, vol. 42, pp. 89-189. 14
Y. Hori, A. Murata, R. Takahashi, Journal of the Chemical Society, Faraday Transactions 1:
Physical Chemistry in Condensed Phases, 85 (1989) 2309. 15
K. P. Kuhl, E. R. Cave, D. N. Abram and T. F. Jaramillo, Energy & Environmental Science, 5
(2012) 7050 – 7059. 16
A. A. Peterson, F. Abild-Pedersen, F. Studt, J. Rossmeisl, J.K. Nørskov, Energy &
Environmental Science 2010, 3, 1311. 17
Y. Hori, I. Takahashi, O. Koga, N. Hoshi, Journal of Molecular Catalysis A, 199 (2003) 39. 18
W. Tang, A. A. Peterson, J. K. Norskov, I. Chorkendorff, Phys. Chem. Chem. Phys.,14, 2012,
76. 19
Y.Hori, I. Takahashi, O. Koga, N. Hoshi, The Journal of Physical Chemistry B, 106 (2001) 15. 20
M. Azuma, K. Hashimoto, and M. Hiramoto, Journal of Electrochemical Society, 137, 1990,
1772. 21
Y. Hori, K. Kikuchi, A. Murata, S. Suzuki, Chemistry Letters, (1986) 897-898. 22
K. Hara, A. Kudo, and T. Sakata, Journal of Electroanalytical Chemistry, 391 (1995) 141. 23
K. Hara, A. Kudo, T. Sakata and M. Watanabe, Journal of Electrochemical Society, 142 (1995)
57-59. 24
A. Kudo, S. Nakagawa, A. tsuneto, T. Sakata, Journal of Electrochemical Society, 140 (1993)
1541-1545. 25
K. Hara, A. Tsuneto, A. Kudo, and T. Sakata, Journal of Electrochemical Society, 141 (1994)
2097. 26
H. Noda, S. Ikeda, Y. Oda, K. Imai, M. Maeda, and K. Ito, Bulletin of the Chemical Society of
Japan, 63 (1990) 2459. 27
K. Watanabe, U. Nagashima and H. Hosoya, Applied Surface Science, 75 (1994) 121-124. 28
M. Shibata, K. Yoshida, N. Furuya, Journal of Electroanalytical Chemistry 442 (1998) 67. 29
Y. Hory, H. Wakebe, T. Tsukamoto, O. Koga, Electrochemica Acta, 39 (1994) 1833. 30
H. Yano, F. Shirai, M. Nakayama, K. Ogura, Journal of Electroanalytical Chemistry, 533
(2002) 113. 31
T. Hatsukade, K.P. Kuhl, E.R. Cave, D.N. Abram, T.F. Jaramillo, Phys. Chem. Chem. Phys.,
16 (2014) 13814- 13819. 32
E.J. Dufek, T.E. Lister, S.G. Stone, M.E. McIlwain, Journal of Electrochemical Society, 159
(2012) 514-517.
29
Part II
ELECTROLYTES
30
Chapter 3
Phase stability and conductivity of
BaCe1-x-yZryYxO3-δ at elevated partial
pressures of H2, H2O and CO2 at 240 ⁰Ca
The aim of Part II was to find suitable electrolyte materials for an electrochemical cell able to
reduce CO2 at intermediate temperature and high pressure. This Chapter consists of an exploratory
study on three different proton conducting materials, such as Y- doped BaZrO3-BaCeO3 solid
solutions. The purpose was to investigate the conductivity and the phase stability of the different
compounds.
Abstract
BaCe1-x-yZryYxO3-δ is a family of proton conductors with potential for use at intermediate
temperatures. The conductivity of BaCe1-x-yZryYxO3-δ (x; y) = (0.1; 0.9) – (0.1; 0.4) – (0.2; 0.6) was
studied with Electrochemical Impedance Spectroscopy at 240 ⁰C at a total pressure of 50 bar in a
wet mixture of 5 vol.% H2 in N2 (pH2O = 10 mbar – 25 bar), and in a gas mixture of 50 vol.% CO2,
5 vol.% H2 and 45 vol.% N2 with a gradual increase of the total pressure from 1 to 50 bar. Contrary
to the compounds containing CeO2, BaZr0.9Y0.1O3-δ showed a gradual increase of one order of
magnitude in conductivity with increasing pH2O from 10 mbar to 5 bar. The compound with the
highest cerium content, BaCe0.5Zr0.4Y0.1O3-δ, exhibited the highest conductivity values at all
conditions. Especially at high pH2O a drastic increase in conductivity was observed, reaching a
value of 2·10-3
S/cm, the highest value ever reported for this type of compounds at low
temperatures. Post-test phase analysis revealed that the chemical stability in H2O and CO2 increased
with increasing ZrO2 content and that phase separation was obstructed at high degrees of
densification. Formation of CeO2 and BaCO3 was observed in the BaCe0.5Zr0.4Y0.1O3-δ electrolyte
after exposure to elevated pH2O and pCO2.
a This chapter has been submitted to: Solid State Ionics in February 2015: F. Vico*, C. Chatzichristodoulou, M.B.
Mogensen. Title: Phase stability and conductivity of BaCe1-x-yZryYxO3-δ at elevated partial pressures of H2, H2O and
CO2 at 240 ⁰C.
31
3.1 Introduction
The electrochemical conversion of CO2 for production of renewable hydrocarbon fuels is a research
field of growing interest, as it can enable the use of carbon based fuels in a CO2 neutral manner.1
Electrochemical CO2 reduction at intermediate temperatures (T ~ 300 °C) can be advantageous as
compared to room temperature operation, as it will increase the rate of thermally activated
processes, thereby increasing the rate of CO2 reduction. Elevated pressure can also have a positive
influence on electrode activity, due to the increased impinging frequency of gaseous reactants on
the electrode surface, while enhancing the thermodynamic stability of hydrocarbon products and
offering a means to control product selectivity. Thus intermediate temperature and elevated pressure
electrolysis represents a promising route for production of renewable hydrocarbons, as it can
potentially lead to a system where hydrocarbons are produced in a single step process, selectively
and at industrially feasible rates without the use of precious metals.
One of the challenges is to identify an electrolyte material that shows high conductivity and high
mechanical and chemical stability over several years under these relatively extreme operating
conditions. As an alternative to the oxide ion conducting electrolytes, widely used in solid oxide
electrolysis cells (SOEC) and solid oxide fuel cells (SOFC), proton conducting doped perovskite
oxides have been the subject of extensive investigation ever since Iwahara et al.2 demonstrated their
properties and potential. In particular, proton conducting perovskite oxides exhibit lower activation
energy compared to oxide ion conductors, which makes them interesting candidates for
intermediate temperature operation. These materials are termed high-temperature proton conductors
(HTPCs), because their working temperatures (400 – 800 °C) are noticeably higher than the
working temperatures of proton conducting polymers (~100 °C).
HTPCs have been considered very attractive electrolyte materials for high-temperature steam
electrolysis3 and more recently for reforming of hydrocarbon fuels by steam permeation in a
protonic ceramic fuel cell4. Moreover, Irvine et al. have successfully demonstrated electrochemical
reduction of CO2, accompanied by formation of hydrocarbons and CO at 614 °C and atmospheric
pressure in a proton conducting solid oxide electrolyser based on BaCe0.5Zr0.3Y0.16Zn0.04O3-δ
electrolyte5.
HTPCs display proton conductivity when exposed to hydrogen and/or water vapor atmospheres6.
This characteristic belongs to a restricted group of the oxides with perovskite-type structure ABO3,
where A and B denote two different cations with oxidation states yielding a sum of 6, e.g. 1 + 5, 2 +
4, and 3 + 3. Protonic conductivity is promoted by doping the B-site with a suitable acceptor
element M, obtaining AB1-xMxO3-δ where δ represents the oxygen deficiency per formula unit.
Substitution of the M acceptor dopant cations in the B site induces the formation of oxide-ion
vacancies.7 In Kröger-Vink notation:
2𝐵𝐵𝑥 + 𝑂𝑂
𝑥 + 𝑀2𝑂3 ↔ 2𝑀𝐵′ + 𝑉𝑂
∙∙ + 2𝐵𝑂2 (Eq. 3.1)
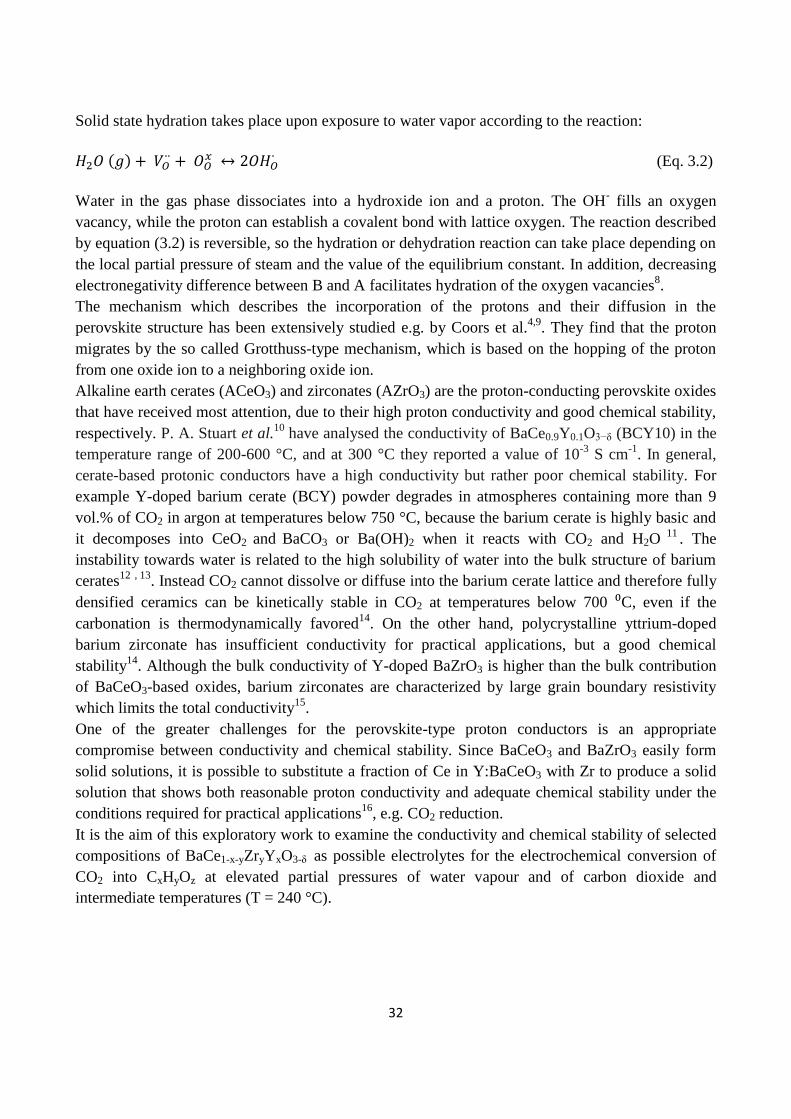
32
Solid state hydration takes place upon exposure to water vapor according to the reaction:
𝐻2𝑂 (𝑔) + 𝑉𝑂∙∙ + 𝑂𝑂
𝑥 ↔ 2𝑂𝐻𝑂∙ (Eq. 3.2)
Water in the gas phase dissociates into a hydroxide ion and a proton. The OH- fills an oxygen
vacancy, while the proton can establish a covalent bond with lattice oxygen. The reaction described
by equation (3.2) is reversible, so the hydration or dehydration reaction can take place depending on
the local partial pressure of steam and the value of the equilibrium constant. In addition, decreasing
electronegativity difference between B and A facilitates hydration of the oxygen vacancies8.
The mechanism which describes the incorporation of the protons and their diffusion in the
perovskite structure has been extensively studied e.g. by Coors et al.4,9
. They find that the proton
migrates by the so called Grotthuss-type mechanism, which is based on the hopping of the proton
from one oxide ion to a neighboring oxide ion.
Alkaline earth cerates (ACeO3) and zirconates (AZrO3) are the proton-conducting perovskite oxides
that have received most attention, due to their high proton conductivity and good chemical stability,
respectively. P. A. Stuart et al.10
have analysed the conductivity of BaCe0.9Y0.1O3−δ (BCY10) in the
temperature range of 200-600 °C, and at 300 °C they reported a value of 10-3
S cm-1
. In general,
cerate-based protonic conductors have a high conductivity but rather poor chemical stability. For
example Y-doped barium cerate (BCY) powder degrades in atmospheres containing more than 9
vol.% of CO2 in argon at temperatures below 750 °C, because the barium cerate is highly basic and
it decomposes into CeO2 and BaCO3 or Ba(OH)2 when it reacts with CO2 and H2O 11
. The
instability towards water is related to the high solubility of water into the bulk structure of barium
cerates12
, 13
. Instead CO2 cannot dissolve or diffuse into the barium cerate lattice and therefore fully
densified ceramics can be kinetically stable in CO2 at temperatures below 700 ⁰C, even if the
carbonation is thermodynamically favored14
. On the other hand, polycrystalline yttrium-doped
barium zirconate has insufficient conductivity for practical applications, but a good chemical
stability14
. Although the bulk conductivity of Y-doped BaZrO3 is higher than the bulk contribution
of BaCeO3-based oxides, barium zirconates are characterized by large grain boundary resistivity
which limits the total conductivity15
.
One of the greater challenges for the perovskite-type proton conductors is an appropriate
compromise between conductivity and chemical stability. Since BaCeO3 and BaZrO3 easily form
solid solutions, it is possible to substitute a fraction of Ce in Y:BaCeO3 with Zr to produce a solid
solution that shows both reasonable proton conductivity and adequate chemical stability under the
conditions required for practical applications16
, e.g. CO2 reduction.
It is the aim of this exploratory work to examine the conductivity and chemical stability of selected
compositions of BaCe1-x-yZryYxO3-δ as possible electrolytes for the electrochemical conversion of
CO2 into CxHyOz at elevated partial pressures of water vapour and of carbon dioxide and
intermediate temperatures (T = 240 °C).
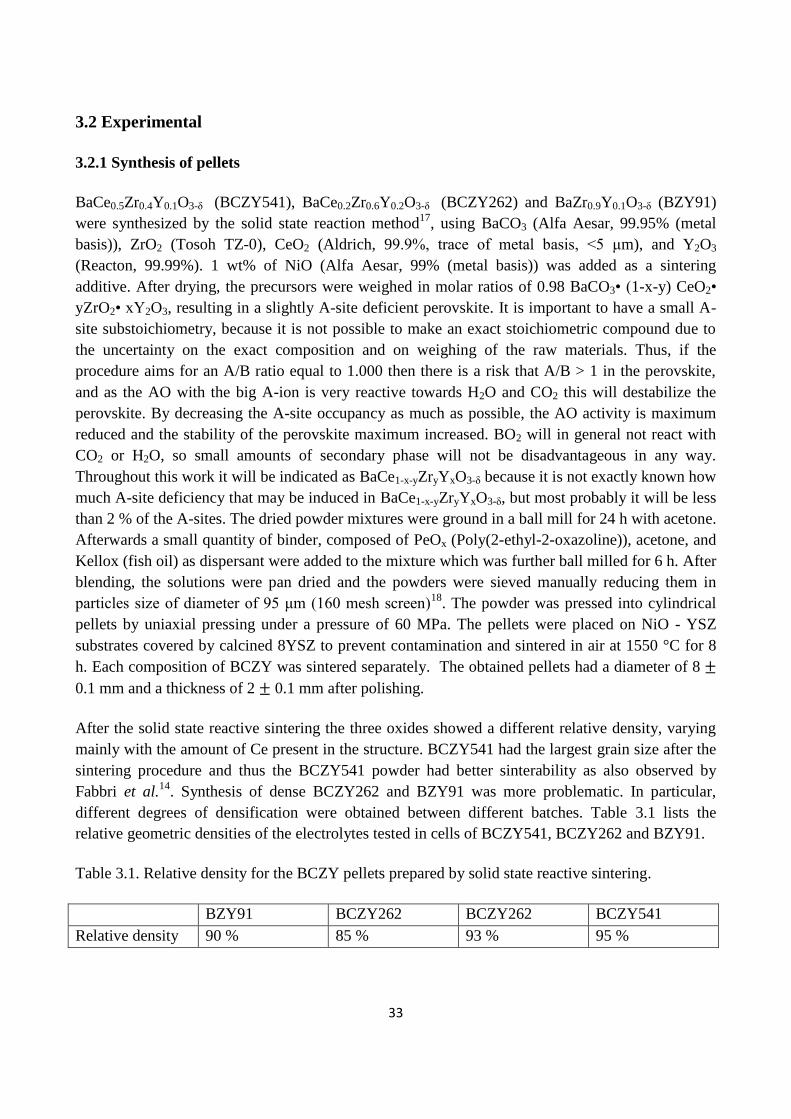
33
3.2 Experimental
3.2.1 Synthesis of pellets
BaCe0.5Zr0.4Y0.1O3-δ (BCZY541), BaCe0.2Zr0.6Y0.2O3-δ (BCZY262) and BaZr0.9Y0.1O3-δ (BZY91)
were synthesized by the solid state reaction method17
, using BaCO3 (Alfa Aesar, 99.95% (metal
basis)), ZrO2 (Tosoh TZ-0), CeO2 (Aldrich, 99.9%, trace of metal basis, <5 μm), and Y2O3
(Reacton, 99.99%). 1 wt% of NiO (Alfa Aesar, 99% (metal basis)) was added as a sintering
additive. After drying, the precursors were weighed in molar ratios of 0.98 BaCO3• (1-x-y) CeO2•
yZrO2• xY2O3, resulting in a slightly A-site deficient perovskite. It is important to have a small A-
site substoichiometry, because it is not possible to make an exact stoichiometric compound due to
the uncertainty on the exact composition and on weighing of the raw materials. Thus, if the
procedure aims for an A/B ratio equal to 1.000 then there is a risk that A/B > 1 in the perovskite,
and as the AO with the big A-ion is very reactive towards H2O and CO2 this will destabilize the
perovskite. By decreasing the A-site occupancy as much as possible, the AO activity is maximum
reduced and the stability of the perovskite maximum increased. BO2 will in general not react with
CO2 or H2O, so small amounts of secondary phase will not be disadvantageous in any way.
Throughout this work it will be indicated as BaCe1-x-yZryYxO3-δ because it is not exactly known how
much A-site deficiency that may be induced in BaCe1-x-yZryYxO3-δ, but most probably it will be less
than 2 % of the A-sites. The dried powder mixtures were ground in a ball mill for 24 h with acetone.
Afterwards a small quantity of binder, composed of PeOx (Poly(2-ethyl-2-oxazoline)), acetone, and
Kellox (fish oil) as dispersant were added to the mixture which was further ball milled for 6 h. After
blending, the solutions were pan dried and the powders were sieved manually reducing them in
particles size of diameter of 95 μm (160 mesh screen)18
. The powder was pressed into cylindrical
pellets by uniaxial pressing under a pressure of 60 MPa. The pellets were placed on NiO - YSZ
substrates covered by calcined 8YSZ to prevent contamination and sintered in air at 1550 °C for 8
h. Each composition of BCZY was sintered separately. The obtained pellets had a diameter of 8 ±
0.1 mm and a thickness of 2 ± 0.1 mm after polishing.
After the solid state reactive sintering the three oxides showed a different relative density, varying
mainly with the amount of Ce present in the structure. BCZY541 had the largest grain size after the
sintering procedure and thus the BCZY541 powder had better sinterability as also observed by
Fabbri et al.14
. Synthesis of dense BCZY262 and BZY91 was more problematic. In particular,
different degrees of densification were obtained between different batches. Table 3.1 lists the
relative geometric densities of the electrolytes tested in cells of BCZY541, BCZY262 and BZY91.
Table 3.1. Relative density for the BCZY pellets prepared by solid state reactive sintering.
BZY91 BCZY262 BCZY262 BCZY541
Relative density 90 % 85 % 93 % 95 %
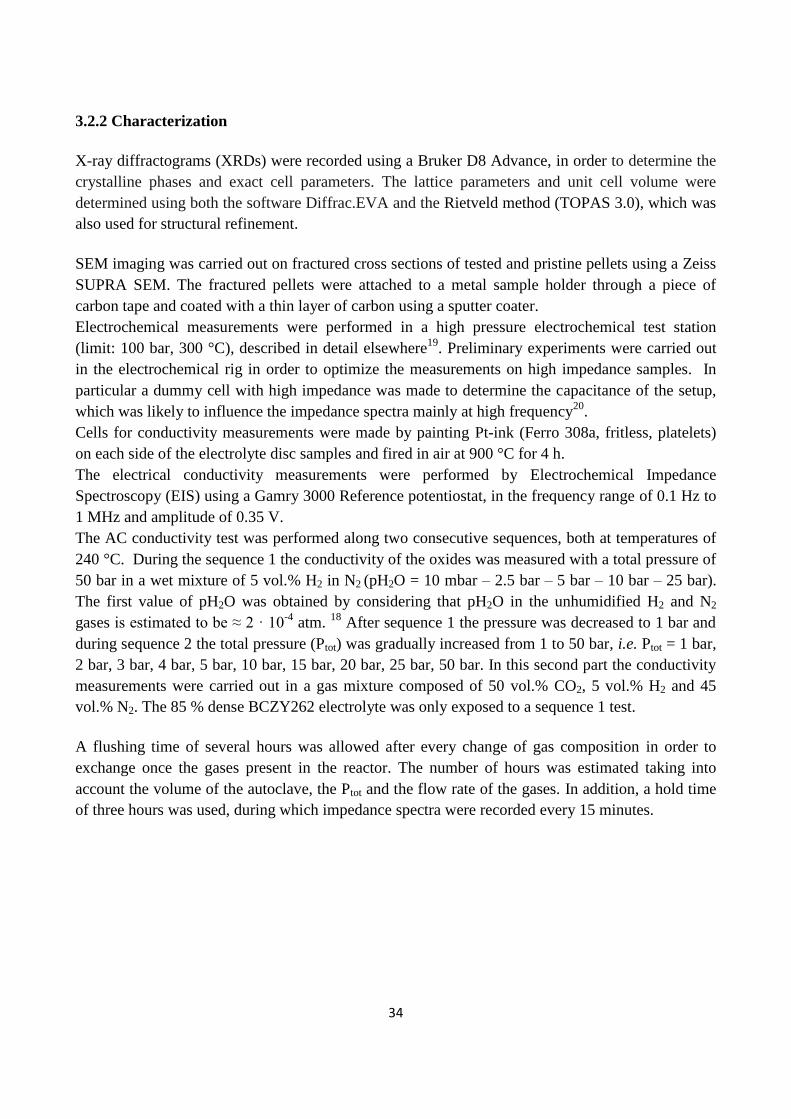
34
3.2.2 Characterization
X-ray diffractograms (XRDs) were recorded using a Bruker D8 Advance, in order to determine the
crystalline phases and exact cell parameters. The lattice parameters and unit cell volume were
determined using both the software Diffrac.EVA and the Rietveld method (TOPAS 3.0), which was
also used for structural refinement.
SEM imaging was carried out on fractured cross sections of tested and pristine pellets using a Zeiss
SUPRA SEM. The fractured pellets were attached to a metal sample holder through a piece of
carbon tape and coated with a thin layer of carbon using a sputter coater.
Electrochemical measurements were performed in a high pressure electrochemical test station
(limit: 100 bar, 300 °C), described in detail elsewhere19
. Preliminary experiments were carried out
in the electrochemical rig in order to optimize the measurements on high impedance samples. In
particular a dummy cell with high impedance was made to determine the capacitance of the setup,
which was likely to influence the impedance spectra mainly at high frequency20
.
Cells for conductivity measurements were made by painting Pt-ink (Ferro 308a, fritless, platelets)
on each side of the electrolyte disc samples and fired in air at 900 °C for 4 h.
The electrical conductivity measurements were performed by Electrochemical Impedance
Spectroscopy (EIS) using a Gamry 3000 Reference potentiostat, in the frequency range of 0.1 Hz to
1 MHz and amplitude of 0.35 V.
The AC conductivity test was performed along two consecutive sequences, both at temperatures of
240 °C. During the sequence 1 the conductivity of the oxides was measured with a total pressure of
50 bar in a wet mixture of 5 vol.% H2 in N2 (pH2O = 10 mbar – 2.5 bar – 5 bar – 10 bar – 25 bar).
The first value of pH2O was obtained by considering that pH2O in the unhumidified H2 and N2
gases is estimated to be ≈ 2 · 10-4
atm. 18
After sequence 1 the pressure was decreased to 1 bar and
during sequence 2 the total pressure (Ptot) was gradually increased from 1 to 50 bar, i.e. Ptot = 1 bar,
2 bar, 3 bar, 4 bar, 5 bar, 10 bar, 15 bar, 20 bar, 25 bar, 50 bar. In this second part the conductivity
measurements were carried out in a gas mixture composed of 50 vol.% CO2, 5 vol.% H2 and 45
vol.% N2. The 85 % dense BCZY262 electrolyte was only exposed to a sequence 1 test.
A flushing time of several hours was allowed after every change of gas composition in order to
exchange once the gases present in the reactor. The number of hours was estimated taking into
account the volume of the autoclave, the Ptot and the flow rate of the gases. In addition, a hold time
of three hours was used, during which impedance spectra were recorded every 15 minutes.
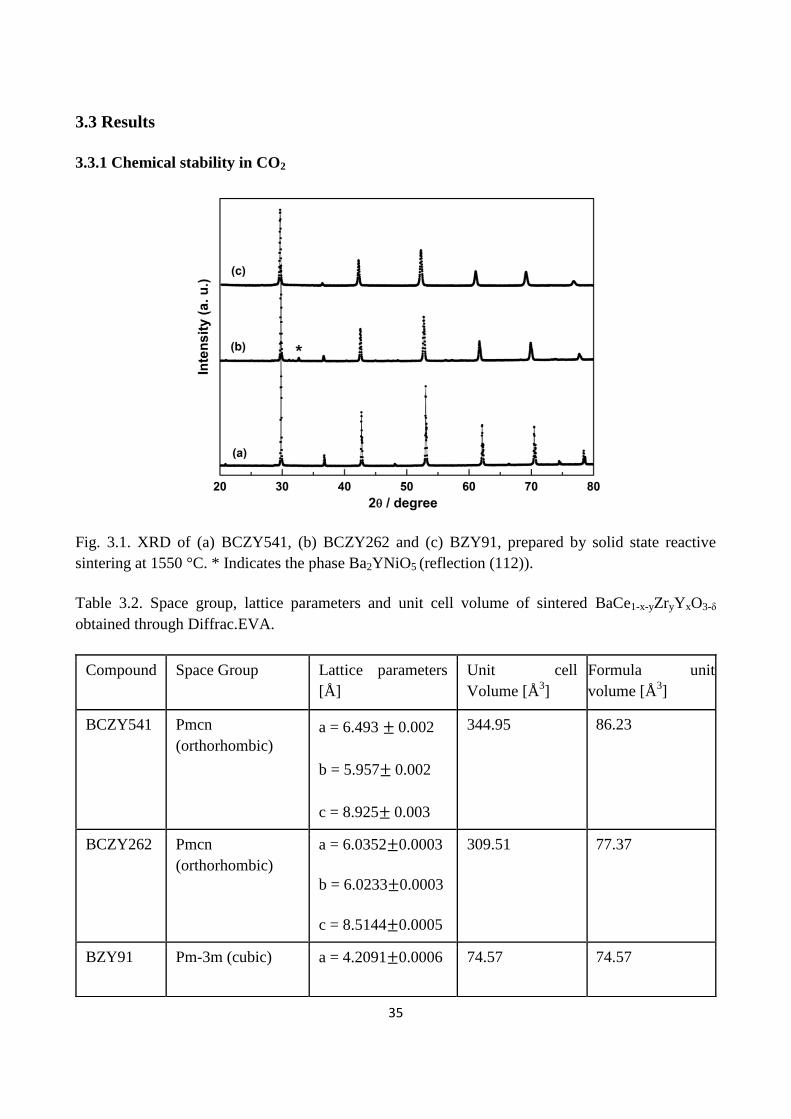
35
3.3 Results
3.3.1 Chemical stability in CO2
Fig. 3.1. XRD of (a) BCZY541, (b) BCZY262 and (c) BZY91, prepared by solid state reactive
sintering at 1550 °C. * Indicates the phase Ba2YNiO5 (reflection (112)).
Table 3.2. Space group, lattice parameters and unit cell volume of sintered BaCe1-x-yZryYxO3-δ
obtained through Diffrac.EVA.
Compound Space Group Lattice parameters
[Å]
Unit cell
Volume [Å3]
Formula unit
volume [Å3]
BCZY541 Pmcn
(orthorhombic)
a = 6.493 ± 0.002
b = 5.957± 0.002
c = 8.925± 0.003
344.95 86.23
BCZY262 Pmcn
(orthorhombic)
a = 6.0352±0.0003
b = 6.0233±0.0003
c = 8.5144±0.0005
309.51 77.37
BZY91 Pm-3m (cubic) a = 4.2091±0.0006 74.57 74.57
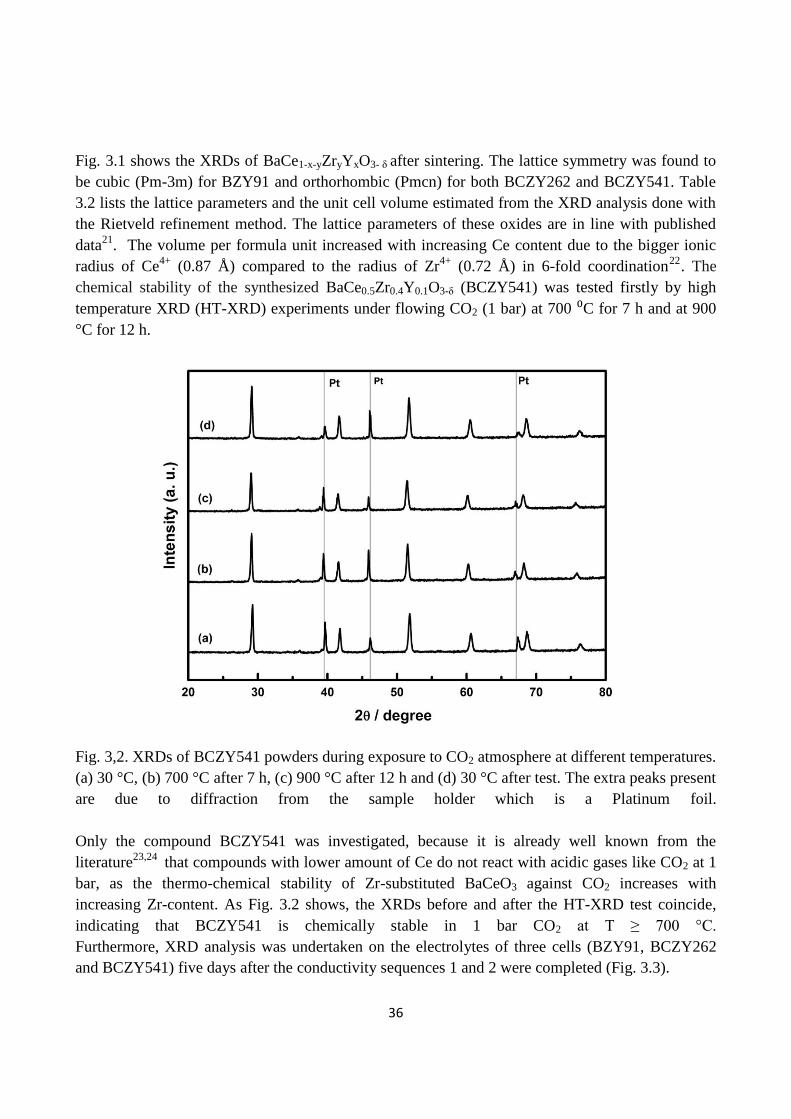
36
Fig. 3.1 shows the XRDs of BaCe1-x-yZryYxO3- δ after sintering. The lattice symmetry was found to
be cubic (Pm-3m) for BZY91 and orthorhombic (Pmcn) for both BCZY262 and BCZY541. Table
3.2 lists the lattice parameters and the unit cell volume estimated from the XRD analysis done with
the Rietveld refinement method. The lattice parameters of these oxides are in line with published
data21
. The volume per formula unit increased with increasing Ce content due to the bigger ionic
radius of Ce4+
(0.87 Å) compared to the radius of Zr4+
(0.72 Å) in 6-fold coordination22
. The
chemical stability of the synthesized BaCe0.5Zr0.4Y0.1O3-δ (BCZY541) was tested firstly by high
temperature XRD (HT-XRD) experiments under flowing CO2 (1 bar) at 700 ⁰C for 7 h and at 900
°C for 12 h.
Fig. 3,2. XRDs of BCZY541 powders during exposure to CO2 atmosphere at different temperatures.
(a) 30 °C, (b) 700 °C after 7 h, (c) 900 °C after 12 h and (d) 30 °C after test. The extra peaks present
are due to diffraction from the sample holder which is a Platinum foil.
Only the compound BCZY541 was investigated, because it is already well known from the
literature23,24
that compounds with lower amount of Ce do not react with acidic gases like CO2 at 1
bar, as the thermo-chemical stability of Zr-substituted BaCeO3 against CO2 increases with
increasing Zr-content. As Fig. 3.2 shows, the XRDs before and after the HT-XRD test coincide,
indicating that BCZY541 is chemically stable in 1 bar CO2 at T ≥ 700 °C.
Furthermore, XRD analysis was undertaken on the electrolytes of three cells (BZY91, BCZY262
and BCZY541) five days after the conductivity sequences 1 and 2 were completed (Fig. 3.3).
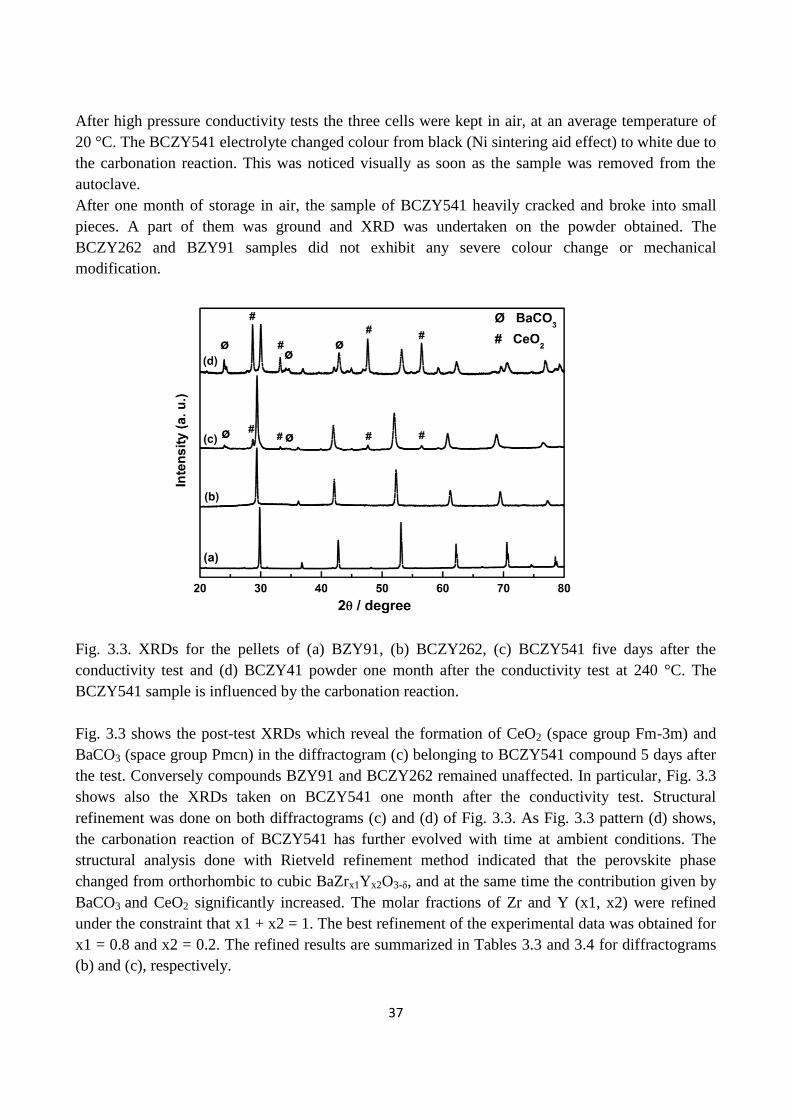
37
After high pressure conductivity tests the three cells were kept in air, at an average temperature of
20 °C. The BCZY541 electrolyte changed colour from black (Ni sintering aid effect) to white due to
the carbonation reaction. This was noticed visually as soon as the sample was removed from the
autoclave.
After one month of storage in air, the sample of BCZY541 heavily cracked and broke into small
pieces. A part of them was ground and XRD was undertaken on the powder obtained. The
BCZY262 and BZY91 samples did not exhibit any severe colour change or mechanical
modification.
Fig. 3.3. XRDs for the pellets of (a) BZY91, (b) BCZY262, (c) BCZY541 five days after the
conductivity test and (d) BCZY41 powder one month after the conductivity test at 240 °C. The
BCZY541 sample is influenced by the carbonation reaction.
Fig. 3.3 shows the post-test XRDs which reveal the formation of CeO2 (space group Fm-3m) and
BaCO3 (space group Pmcn) in the diffractogram (c) belonging to BCZY541 compound 5 days after
the test. Conversely compounds BZY91 and BCZY262 remained unaffected. In particular, Fig. 3.3
shows also the XRDs taken on BCZY541 one month after the conductivity test. Structural
refinement was done on both diffractograms (c) and (d) of Fig. 3.3. As Fig. 3.3 pattern (d) shows,
the carbonation reaction of BCZY541 has further evolved with time at ambient conditions. The
structural analysis done with Rietveld refinement method indicated that the perovskite phase
changed from orthorhombic to cubic BaZrx1Yx2O3-δ, and at the same time the contribution given by
BaCO3 and CeO2 significantly increased. The molar fractions of Zr and Y (x1, x2) were refined
under the constraint that x1 + x2 = 1. The best refinement of the experimental data was obtained for
x1 = 0.8 and x2 = 0.2. The refined results are summarized in Tables 3.3 and 3.4 for diffractograms
(b) and (c), respectively.
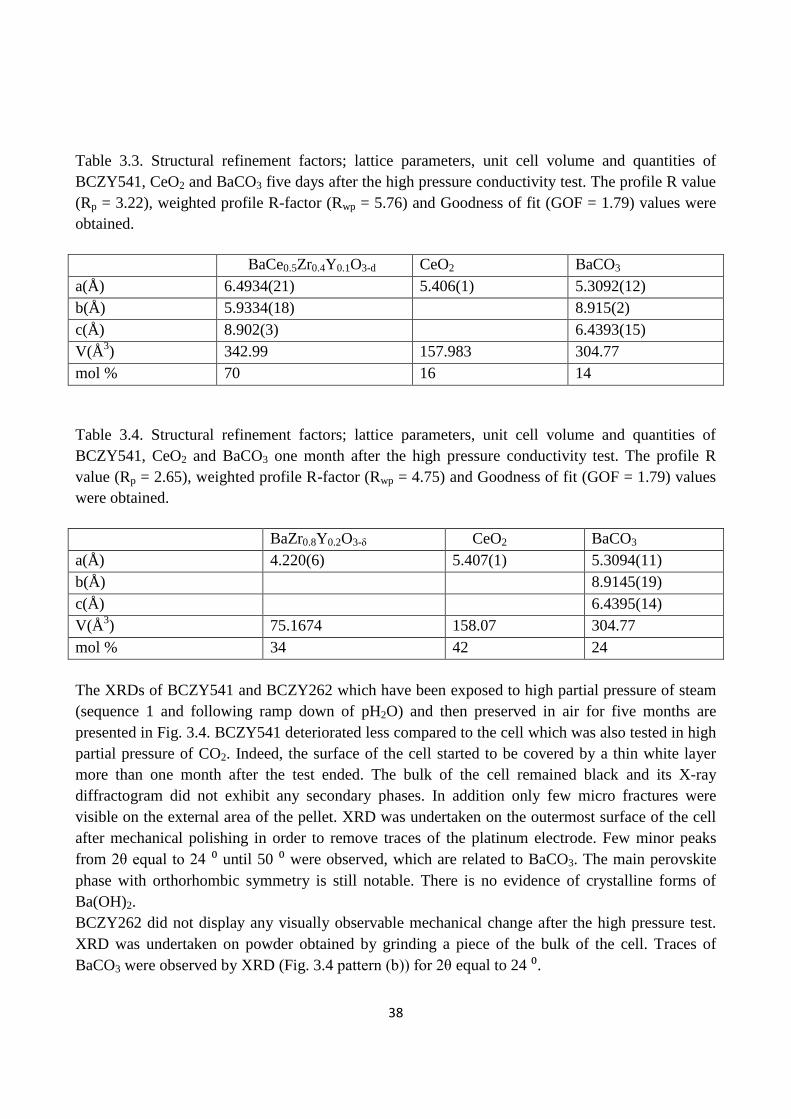
38
Table 3.3. Structural refinement factors; lattice parameters, unit cell volume and quantities of
BCZY541, CeO2 and BaCO3 five days after the high pressure conductivity test. The profile R value
(Rp = 3.22), weighted profile R-factor (Rwp = 5.76) and Goodness of fit (GOF = 1.79) values were
obtained.
BaCe0.5Zr0.4Y0.1O3-d CeO2 BaCO3
a(Å) 6.4934(21) 5.406(1) 5.3092(12)
b(Å) 5.9334(18) 8.915(2)
c(Å) 8.902(3) 6.4393(15)
V(Å3) 342.99 157.983 304.77
mol % 70 16 14
Table 3.4. Structural refinement factors; lattice parameters, unit cell volume and quantities of
BCZY541, CeO2 and BaCO3 one month after the high pressure conductivity test. The profile R
value (Rp = 2.65), weighted profile R-factor (Rwp = 4.75) and Goodness of fit (GOF = 1.79) values
were obtained.
BaZr0.8Y0.2O3-δ CeO2 BaCO3
a(Å) 4.220(6) 5.407(1) 5.3094(11)
b(Å) 8.9145(19)
c(Å) 6.4395(14)
V(Å3) 75.1674 158.07 304.77
mol % 34 42 24
The XRDs of BCZY541 and BCZY262 which have been exposed to high partial pressure of steam
(sequence 1 and following ramp down of pH2O) and then preserved in air for five months are
presented in Fig. 3.4. BCZY541 deteriorated less compared to the cell which was also tested in high
partial pressure of CO2. Indeed, the surface of the cell started to be covered by a thin white layer
more than one month after the test ended. The bulk of the cell remained black and its X-ray
diffractogram did not exhibit any secondary phases. In addition only few micro fractures were
visible on the external area of the pellet. XRD was undertaken on the outermost surface of the cell
after mechanical polishing in order to remove traces of the platinum electrode. Few minor peaks
from 2θ equal to 24 ⁰ until 50 ⁰ were observed, which are related to BaCO3. The main perovskite
phase with orthorhombic symmetry is still notable. There is no evidence of crystalline forms of
Ba(OH)2.
BCZY262 did not display any visually observable mechanical change after the high pressure test.
XRD was undertaken on powder obtained by grinding a piece of the bulk of the cell. Traces of
BaCO3 were observed by XRD (Fig. 3.4 pattern (b)) for 2θ equal to 24 ⁰.
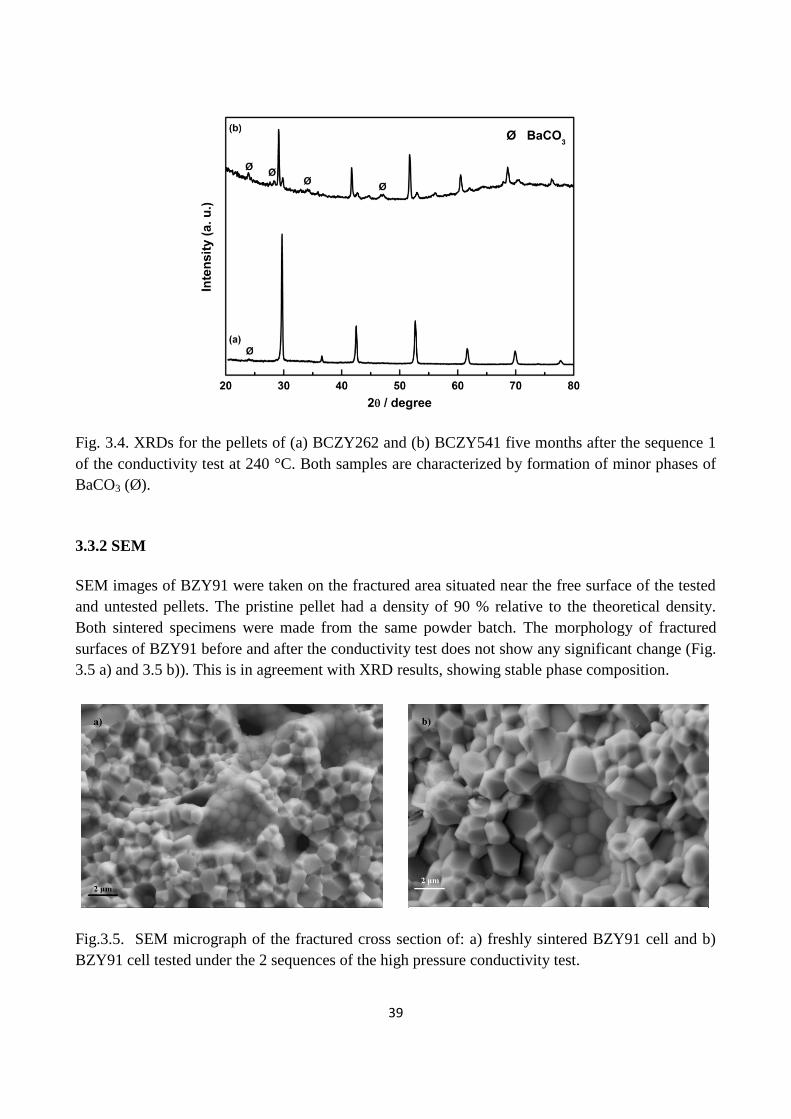
39
Fig. 3.4. XRDs for the pellets of (a) BCZY262 and (b) BCZY541 five months after the sequence 1
of the conductivity test at 240 °C. Both samples are characterized by formation of minor phases of
BaCO3 (Ø).
3.3.2 SEM
SEM images of BZY91 were taken on the fractured area situated near the free surface of the tested
and untested pellets. The pristine pellet had a density of 90 % relative to the theoretical density.
Both sintered specimens were made from the same powder batch. The morphology of fractured
surfaces of BZY91 before and after the conductivity test does not show any significant change (Fig.
3.5 a) and 3.5 b)). This is in agreement with XRD results, showing stable phase composition.
Fig.3.5. SEM micrograph of the fractured cross section of: a) freshly sintered BZY91 cell and b)
BZY91 cell tested under the 2 sequences of the high pressure conductivity test.
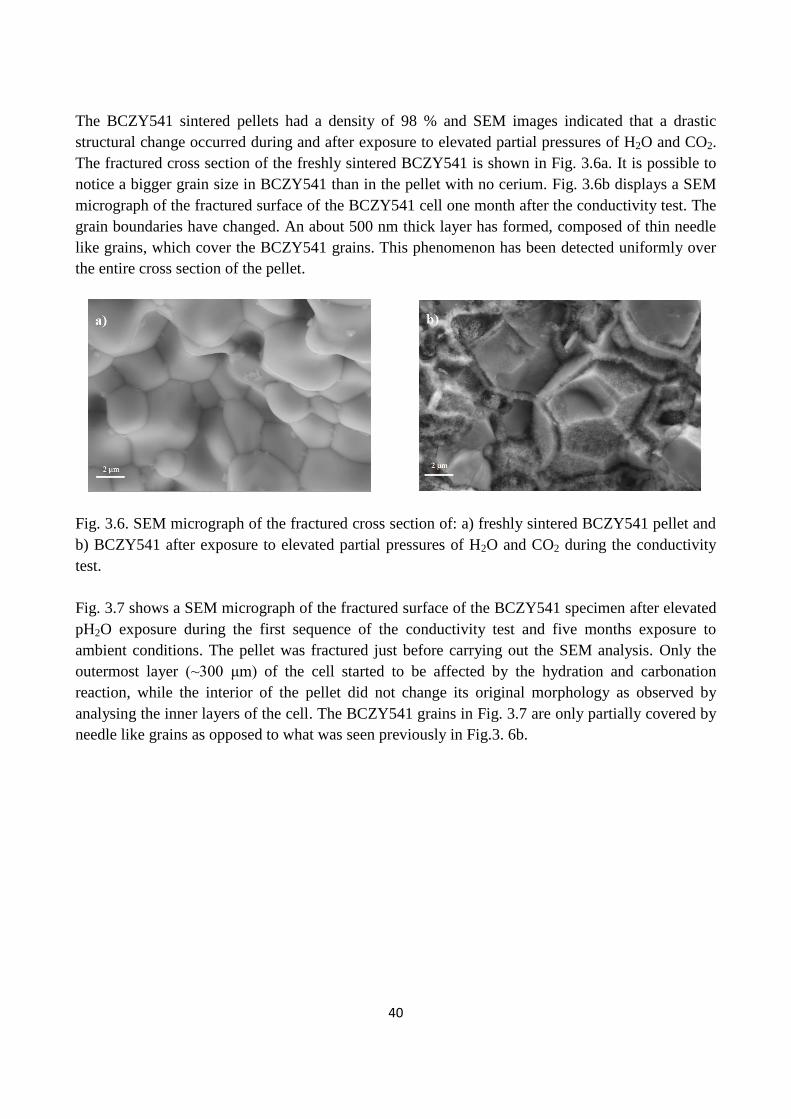
40
The BCZY541 sintered pellets had a density of 98 % and SEM images indicated that a drastic
structural change occurred during and after exposure to elevated partial pressures of H2O and CO2.
The fractured cross section of the freshly sintered BCZY541 is shown in Fig. 3.6a. It is possible to
notice a bigger grain size in BCZY541 than in the pellet with no cerium. Fig. 3.6b displays a SEM
micrograph of the fractured surface of the BCZY541 cell one month after the conductivity test. The
grain boundaries have changed. An about 500 nm thick layer has formed, composed of thin needle
like grains, which cover the BCZY541 grains. This phenomenon has been detected uniformly over
the entire cross section of the pellet.
Fig. 3.6. SEM micrograph of the fractured cross section of: a) freshly sintered BCZY541 pellet and
b) BCZY541 after exposure to elevated partial pressures of H2O and CO2 during the conductivity
test.
Fig. 3.7 shows a SEM micrograph of the fractured surface of the BCZY541 specimen after elevated
pH2O exposure during the first sequence of the conductivity test and five months exposure to
ambient conditions. The pellet was fractured just before carrying out the SEM analysis. Only the
outermost layer (~300 μm) of the cell started to be affected by the hydration and carbonation
reaction, while the interior of the pellet did not change its original morphology as observed by
analysing the inner layers of the cell. The BCZY541 grains in Fig. 3.7 are only partially covered by
needle like grains as opposed to what was seen previously in Fig.3. 6b.
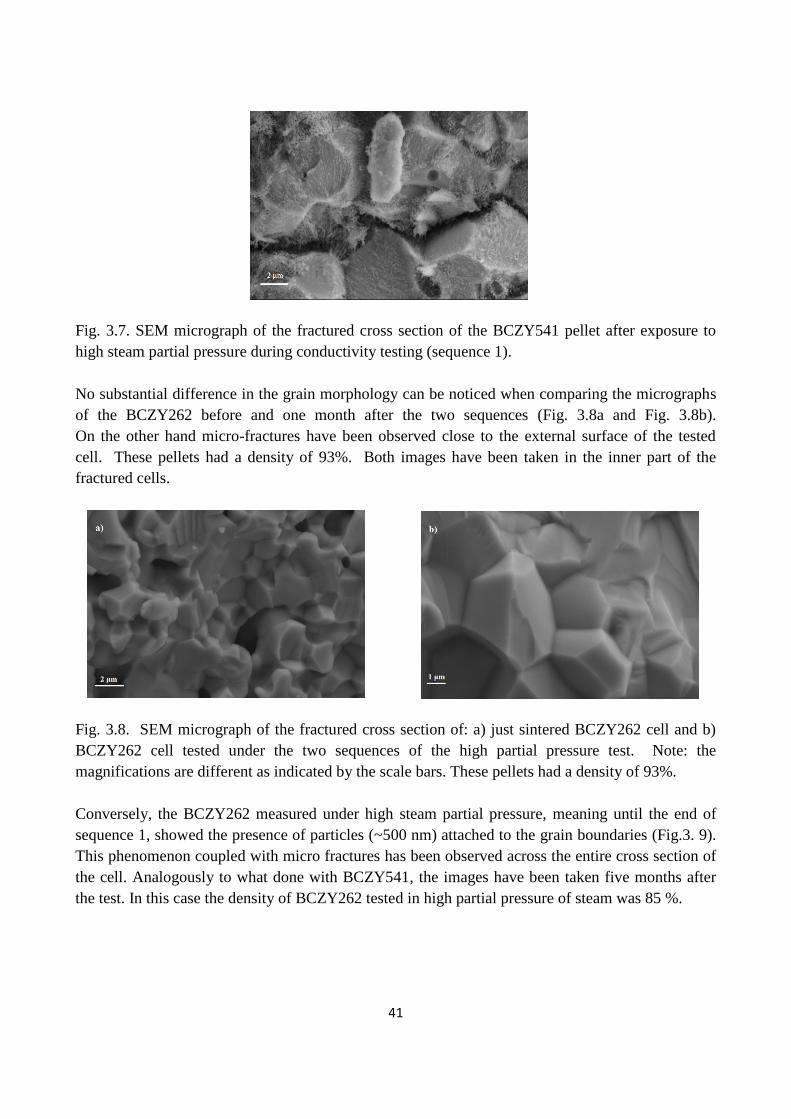
41
Fig. 3.7. SEM micrograph of the fractured cross section of the BCZY541 pellet after exposure to
high steam partial pressure during conductivity testing (sequence 1).
No substantial difference in the grain morphology can be noticed when comparing the micrographs
of the BCZY262 before and one month after the two sequences (Fig. 3.8a and Fig. 3.8b).
On the other hand micro-fractures have been observed close to the external surface of the tested
cell. These pellets had a density of 93%. Both images have been taken in the inner part of the
fractured cells.
Fig. 3.8. SEM micrograph of the fractured cross section of: a) just sintered BCZY262 cell and b)
BCZY262 cell tested under the two sequences of the high partial pressure test. Note: the
magnifications are different as indicated by the scale bars. These pellets had a density of 93%.
Conversely, the BCZY262 measured under high steam partial pressure, meaning until the end of
sequence 1, showed the presence of particles (~500 nm) attached to the grain boundaries (Fig.3. 9).
This phenomenon coupled with micro fractures has been observed across the entire cross section of
the cell. Analogously to what done with BCZY541, the images have been taken five months after
the test. In this case the density of BCZY262 tested in high partial pressure of steam was 85 %.
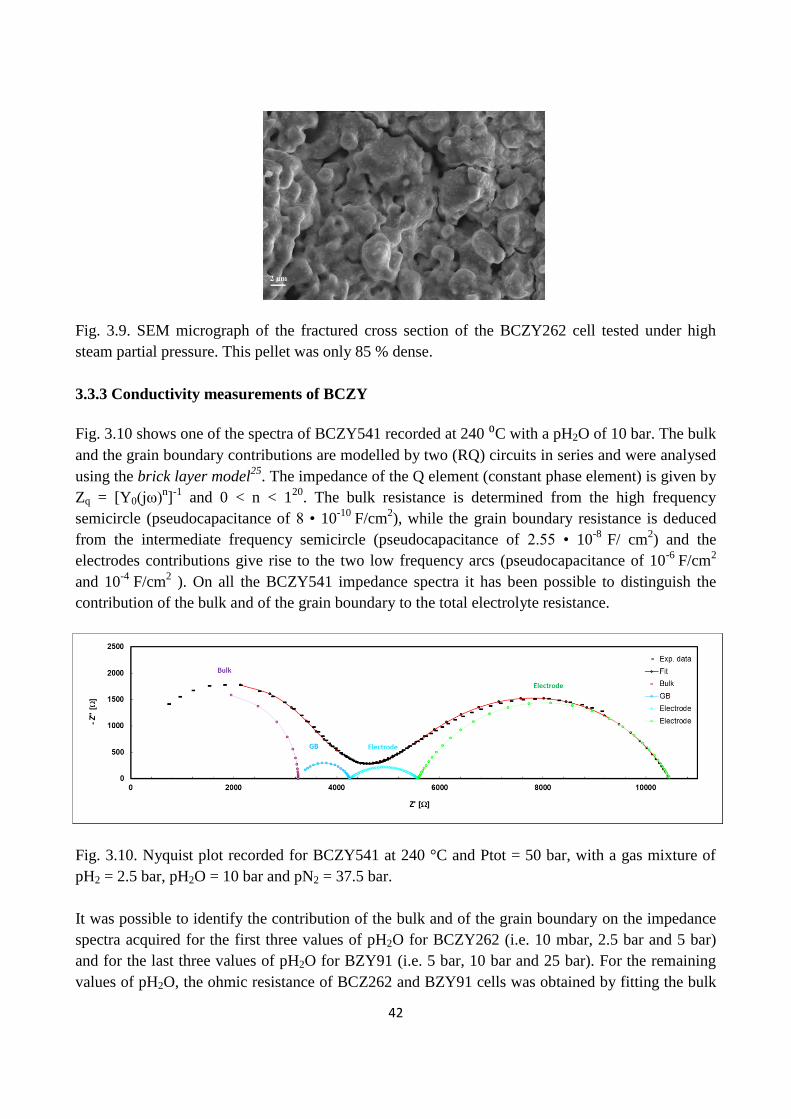
42
Fig. 3.9. SEM micrograph of the fractured cross section of the BCZY262 cell tested under high
steam partial pressure. This pellet was only 85 % dense.
3.3.3 Conductivity measurements of BCZY
Fig. 3.10 shows one of the spectra of BCZY541 recorded at 240 ⁰C with a pH2O of 10 bar. The bulk
and the grain boundary contributions are modelled by two (RQ) circuits in series and were analysed
using the brick layer model25
. The impedance of the Q element (constant phase element) is given by
Zq = [Y0(jω)n]
-1 and 0 < n < 1
20. The bulk resistance is determined from the high frequency
semicircle (pseudocapacitance of 8 • 10-10
F/cm2), while the grain boundary resistance is deduced
from the intermediate frequency semicircle (pseudocapacitance of 2.55 • 10-8
F/ cm2) and the
electrodes contributions give rise to the two low frequency arcs (pseudocapacitance of 10-6
F/cm2
and 10-4
F/cm2 ). On all the BCZY541 impedance spectra it has been possible to distinguish the
contribution of the bulk and of the grain boundary to the total electrolyte resistance.
Fig. 3.10. Nyquist plot recorded for BCZY541 at 240 °C and Ptot = 50 bar, with a gas mixture of
pH2 = 2.5 bar, pH2O = 10 bar and pN2 = 37.5 bar.
It was possible to identify the contribution of the bulk and of the grain boundary on the impedance
spectra acquired for the first three values of pH2O for BCZY262 (i.e. 10 mbar, 2.5 bar and 5 bar)
and for the last three values of pH2O for BZY91 (i.e. 5 bar, 10 bar and 25 bar). For the remaining
values of pH2O, the ohmic resistance of BCZ262 and BZY91 cells was obtained by fitting the bulk
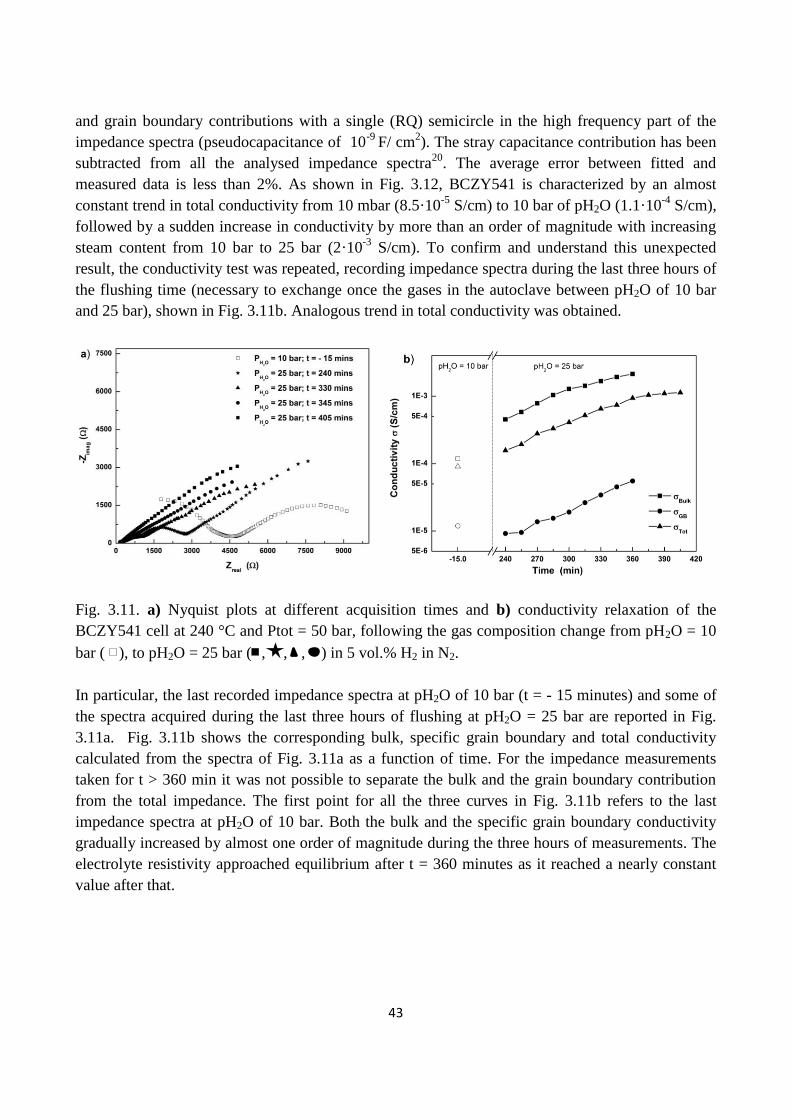
43
and grain boundary contributions with a single (RQ) semicircle in the high frequency part of the
impedance spectra (pseudocapacitance of 10-9
F/ cm2). The stray capacitance contribution has been
subtracted from all the analysed impedance spectra20
. The average error between fitted and
measured data is less than 2%. As shown in Fig. 3.12, BCZY541 is characterized by an almost
constant trend in total conductivity from 10 mbar (8.5·10-5
S/cm) to 10 bar of pH2O (1.1·10-4
S/cm),
followed by a sudden increase in conductivity by more than an order of magnitude with increasing
steam content from 10 bar to 25 bar (2·10-3
S/cm). To confirm and understand this unexpected
result, the conductivity test was repeated, recording impedance spectra during the last three hours of
the flushing time (necessary to exchange once the gases in the autoclave between pH2O of 10 bar
and 25 bar), shown in Fig. 3.11b. Analogous trend in total conductivity was obtained.
Fig. 3.11. a) Nyquist plots at different acquisition times and b) conductivity relaxation of the
BCZY541 cell at 240 °C and Ptot = 50 bar, following the gas composition change from pH2O = 10
bar ( ), to pH2O = 25 bar ( , , , ) in 5 vol.% H2 in N2.
In particular, the last recorded impedance spectra at pH2O of 10 bar (t = - 15 minutes) and some of
the spectra acquired during the last three hours of flushing at pH2O = 25 bar are reported in Fig.
3.11a. Fig. 3.11b shows the corresponding bulk, specific grain boundary and total conductivity
calculated from the spectra of Fig. 3.11a as a function of time. For the impedance measurements
taken for t > 360 min it was not possible to separate the bulk and the grain boundary contribution
from the total impedance. The first point for all the three curves in Fig. 3.11b refers to the last
impedance spectra at pH2O of 10 bar. Both the bulk and the specific grain boundary conductivity
gradually increased by almost one order of magnitude during the three hours of measurements. The
electrolyte resistivity approached equilibrium after t = 360 minutes as it reached a nearly constant
value after that.
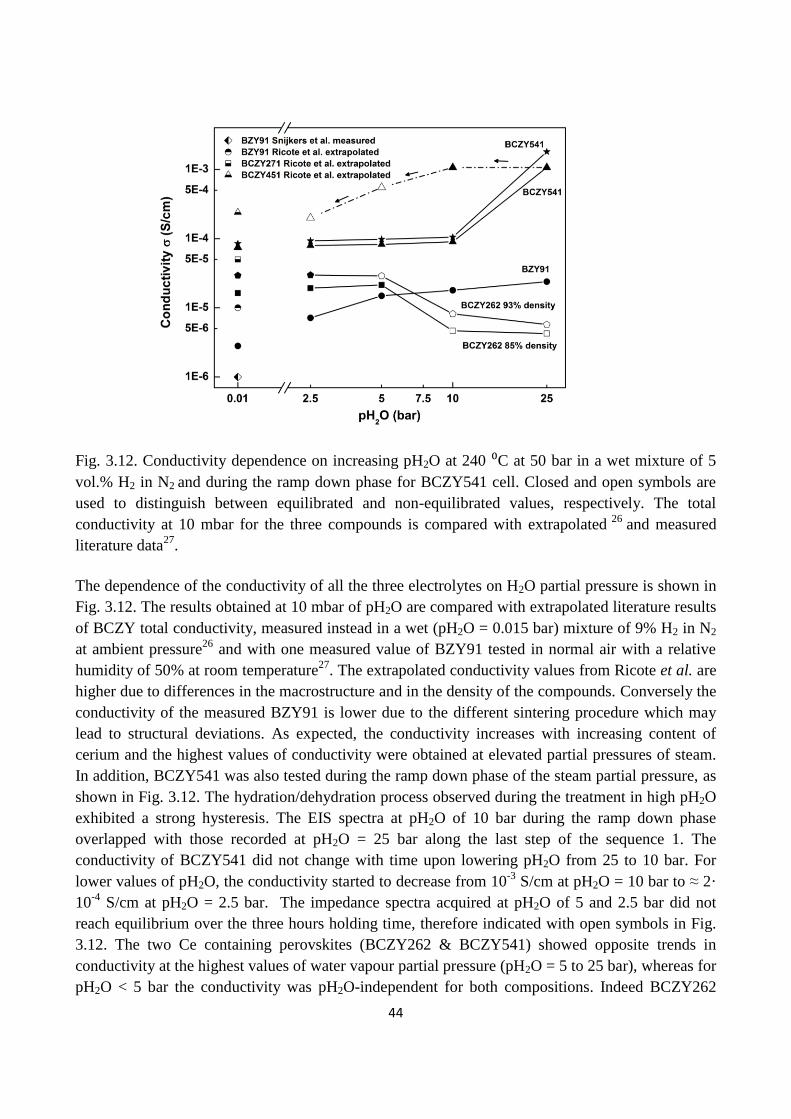
44
Fig. 3.12. Conductivity dependence on increasing pH2O at 240 ⁰C at 50 bar in a wet mixture of 5
vol.% H2 in N2 and during the ramp down phase for BCZY541 cell. Closed and open symbols are
used to distinguish between equilibrated and non-equilibrated values, respectively. The total
conductivity at 10 mbar for the three compounds is compared with extrapolated 26
and measured
literature data27
.
The dependence of the conductivity of all the three electrolytes on H2O partial pressure is shown in
Fig. 3.12. The results obtained at 10 mbar of pH2O are compared with extrapolated literature results
of BCZY total conductivity, measured instead in a wet (pH2O = 0.015 bar) mixture of 9% H2 in N2
at ambient pressure26
and with one measured value of BZY91 tested in normal air with a relative
humidity of 50% at room temperature27
. The extrapolated conductivity values from Ricote et al. are
higher due to differences in the macrostructure and in the density of the compounds. Conversely the
conductivity of the measured BZY91 is lower due to the different sintering procedure which may
lead to structural deviations. As expected, the conductivity increases with increasing content of
cerium and the highest values of conductivity were obtained at elevated partial pressures of steam.
In addition, BCZY541 was also tested during the ramp down phase of the steam partial pressure, as
shown in Fig. 3.12. The hydration/dehydration process observed during the treatment in high pH2O
exhibited a strong hysteresis. The EIS spectra at pH2O of 10 bar during the ramp down phase
overlapped with those recorded at pH2O = 25 bar along the last step of the sequence 1. The
conductivity of BCZY541 did not change with time upon lowering pH2O from 25 to 10 bar. For
lower values of pH2O, the conductivity started to decrease from 10-3
S/cm at pH2O = 10 bar to ≈ 2·
10-4
S/cm at pH2O = 2.5 bar. The impedance spectra acquired at pH2O of 5 and 2.5 bar did not
reach equilibrium over the three hours holding time, therefore indicated with open symbols in Fig.
3.12. The two Ce containing perovskites (BCZY262 & BCZY541) showed opposite trends in
conductivity at the highest values of water vapour partial pressure (pH2O = 5 to 25 bar), whereas for
pH2O < 5 bar the conductivity was pH2O-independent for both compositions. Indeed BCZY262
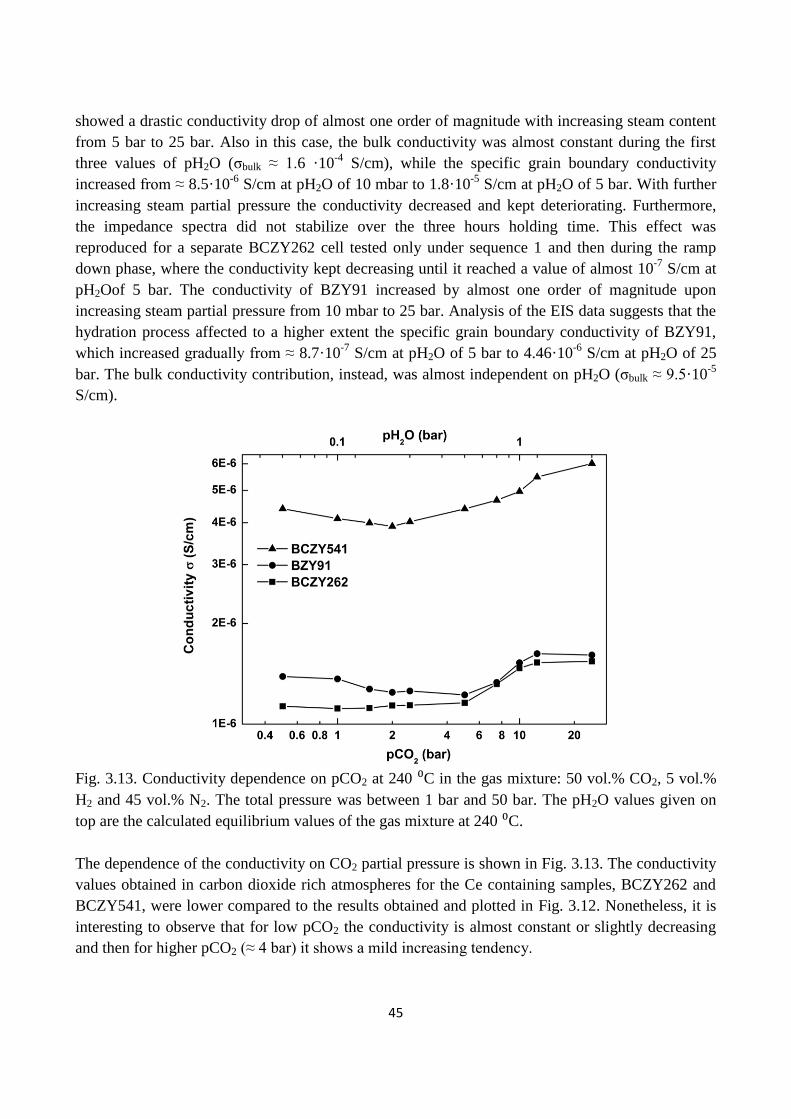
45
showed a drastic conductivity drop of almost one order of magnitude with increasing steam content
from 5 bar to 25 bar. Also in this case, the bulk conductivity was almost constant during the first
three values of pH2O (σbulk ≈ 1.6 ·10-4
S/cm), while the specific grain boundary conductivity
increased from ≈ 8.5·10-6
S/cm at pH2O of 10 mbar to 1.8·10-5
S/cm at pH2O of 5 bar. With further
increasing steam partial pressure the conductivity decreased and kept deteriorating. Furthermore,
the impedance spectra did not stabilize over the three hours holding time. This effect was
reproduced for a separate BCZY262 cell tested only under sequence 1 and then during the ramp
down phase, where the conductivity kept decreasing until it reached a value of almost 10-7
S/cm at
pH2Oof 5 bar. The conductivity of BZY91 increased by almost one order of magnitude upon
increasing steam partial pressure from 10 mbar to 25 bar. Analysis of the EIS data suggests that the
hydration process affected to a higher extent the specific grain boundary conductivity of BZY91,
which increased gradually from ≈ 8.7·10-7
S/cm at pH2O of 5 bar to 4.46·10-6
S/cm at pH2O of 25
bar. The bulk conductivity contribution, instead, was almost independent on pH2O (σbulk ≈ 9.5·10-5
S/cm).
Fig. 3.13. Conductivity dependence on pCO2 at 240 ⁰C in the gas mixture: 50 vol.% CO2, 5 vol.%
H2 and 45 vol.% N2. The total pressure was between 1 bar and 50 bar. The pH2O values given on
top are the calculated equilibrium values of the gas mixture at 240 ⁰C.
The dependence of the conductivity on CO2 partial pressure is shown in Fig. 3.13. The conductivity
values obtained in carbon dioxide rich atmospheres for the Ce containing samples, BCZY262 and
BCZY541, were lower compared to the results obtained and plotted in Fig. 3.12. Nonetheless, it is
interesting to observe that for low pCO2 the conductivity is almost constant or slightly decreasing
and then for higher pCO2 (≈ 4 bar) it shows a mild increasing tendency.
46
3.4 Discussion
The modification of the grain boundaries in all three compounds, along with microstructural
changes may help rationalize the conductivity trends in high partial pressure of steam.
The bulk conductivity of BCZY262 and BCZY541 was only weakly influenced by the increasing
concentration of steam in the range between 10 mbar to 5 bar. This is in line with the anticipated
complete hydration of BCZY at 240 °C and pH2O > 10 mbar
28. Upon increasing pH2O from 10 bar
to 25 bar the conductivity of BCZY541 increased by one order of magnitude showing values
around 2· 10-3
S/cm (at 240 °C), which is usually obtained for the same compound at 400 °C in a
steam partial pressure of 0.03 bar14
. To the best of the authors’ knowledge this is the highest proton
conductivity ever reported for polycrystalline ceramic proton conductors at such low temperatures.
Both the grain and the grain boundary conductivity increased by almost one order of magnitude
(Fig. 3.11b). A possible explanation may be related to the modification of the phase composition
and microstructure at the grain boundaries (as observed in SEM images of the tested cell), and in
particular to the formation of a continuous conductive secondary phase around the grains. Structural
refinement of the diffractogram of the tested cell revealed that the molar ratio between BaCO3 (24
mol%) and CeO2 (42 mol%) deviates substantially from unity (Table 3.4), which supports the
hypothesis of formation of an amorphous secondary phase at the grain boundaries containing Ba,
e.g. Ba(OH)2, not detectable by XRD. In case of no amorphous Ba(OH)2, the molar ratio of BaCO3
to CeO2, should indeed be almost equal to one, because barium zirconate cannot tolerate a large A-
site non-stoichiometry29
. In particular, a maximum 5% barium deficiency is the threshold for the
formation of a single phase perovskite30
. Why the grain bulk conductivity also increases with
almost a decade is less clear, but probably a significant higher amount of H2O has been absorbed –
probably irreversibly forming Ba(OH)2 - into both the grain boundaries and part of the grain bulk.
This might also explain the continued reactivity of BCZY541 to BaCO3 in air at room temperature
(Fig. 3.3).
Surprisingly, the conductivity of BCZY262 above 5 bar of steam partial pressure decreased by
almost one order of magnitude. This is believed to arise due to the formation of micro fractures on
the outer layers of the electrolyte in the cell, as observed by SEM. Small amount of secondary
phases (such as BaY2NiO5, Ba(OH)2, CeO2) and modification of the grain boundaries may be the
cause of mechanical stress that lead to the formation of micro fractures. This hypothesis is further
supported by the observed no equilibrated impedance spectra acquired at 10 and 25 bar of pH2O and
the irreversible deterioration of the conductivity of the tested cell when ramping down the pH2O. In
fact the conductivity was further deteriorated by about one order of magnitude after ramping down
the pH2O. In BCZY262 a minor amount of the secondary phase BaY2NiO5 has been observed, as
also reported in a previous study26
. According to Ricote et al., the nickel added as sintering aid and
the presence of this impurity phase did not influence the conductivity or the chemical and
mechanical stability at atmospheric pressure. The crack formation in BCZY262 and not in
BCZY541 might be due to a much slower diffusion of H2O into BCZY262 than into BCZY541.
This might make stresses in the surface region temporally bigger in BCZY262 and cause the crack
formation.
47
Finally, the conductivity of BZY91 gradually increased from 2.8·10-6
S/cm to 2.4·10-5
S/cm with
increasing pH2O in the range 10 mbar – 25 bar. BZY91 is expected to be fully hydrated already at
the beginning of the conductivity measurements at 240 °C and 10 mbar28
. In particular, the grain
boundary resistivity decreased for pH2O > 10 mbar, resulting in the increase of the total
conductivity, as the bulk conductivity was almost independent of pH2O. The observed conductivity
increase may again be explained by a change in the grain boundary structure under elevated pH2O,
influencing the space charge potential, and thereby the concentration of charge carriers in the space
charge region. The positively charged grain boundary core of BZY91 is understood to be the cause
of the well-known high grain boundary resistivity31
. An analogous increase of BZY91 grain
boundary conductivity was registered at 250 °C by Bohn and Schober 32
when increasing the pH2O
from 10-7
bar to 4·10-2
bar, due to incorporation of H2O. It should be noticed though that this pH2O
range is below that required for full hydration of the BZY91 bulk 28
. The compound with the
highest Ce loading (BCZY541) exhibited under all conditions the largest conductivity values. This
can be explained partly by the increasing grain boundary proton mobility with increasing Ce
content14
and partly by the difference in grain size between the oxides containing only Zr and the
ones doped also with Ce. In particular, BCZY541 has grain sizes in the range 2 – 6 μm, while
BZY91 around 1 μm. A bigger grain size leads to a smaller number of grain boundaries that the
current must pass, ensuring a higher conductivity33
.
The impedance spectra of BCZY541 were stable during the three hours measuring time at each
pH2O of sequence 1. On the contrary, the conductivity values obtained along the ramp down phase
of pH2O were not equilibrated and were almost one order of magnitude higher compared to the
results acquired while increasing the pH2O in sequence 1. This aspect may be related to slower
kinetics of the dehydration process at 240 °C.
The conductivity values obtained during sequence 2 were lower than the results obtained in high
partial pressure of steam (Fig. 3.13). It is interesting to note that all three compounds exhibit a
common trend as a function of carbon dioxide partial pressure. The conductivity is almost constant
until 3 bar, then starts to increase and finally stabilizes at the highest CO2 partial pressures.
Residual amounts of steam from sequence 1 may still be present during sequence 2, due to the short
transition time between the two sequences and the slow release of steam upon dehydration of the
compounds. Moreover, platinum is active for the water gas shift reaction34
. According to
thermodynamic calculations performed with FactSage35
, the equilibrium partial pressure of steam
with the gas mixture present at the electrode is 0.05 bar at 1 bar total pressure. Assuming ideal gas
behaviour, the equilibrium partial pressure of steam increases gradually from 0.1 to 2.5 bar when
the total pressure is raised from 2 to 50 bar, respectively. The increase in conductivity observed for
pCO2 > 3 bar can thus be related to the increasing amount of water vapour formed at the Pt
electrodes.
The hydration process under high pH2O and the exposure in elevated pCO2 affected not only the
conductivity, but also the chemical stability of the compounds containing Ce. Indeed, BCZY541
demonstrated chemical modifications after exposure to high pH2O and pCO2. After an additional
five days exposure to ambient conditions, the orthorhombic symmetry of the BCZY541 was still
present, but its decomposition had started to take place with the formation of BaCO3 and CeO2. The
two former phases are then predominant in the same compound analysed one month after the high
48
pressure test, while the orthorhombic perovskite phase changed into a cubic perovskite phase,
having an approximate composition of BaZr0.8Y0.2O3-δ. Indeed, BaCeO3 and BaCeO3 – based proton
conductors can react with H2O and decompose according to Eq. 3.3.
𝐵𝑎𝐶𝑒1−𝑥𝑅𝐸𝑥𝑂3−𝑑 + 𝐻2𝑂 → 𝐵𝑎(𝑂𝐻)2 + 𝐶𝑒1−𝑥𝑅𝐸𝑥𝑂2−𝛾 (Eq. 3.3)
In the above equations RE is a rare-earth ion. Virkar et al.13
studied the kinetics of this
decomposition on 20 mol % Gd-doped BaCeO3 and they observed formation of Ba(OH)2 after
seven days of exposure to 1 bar of water vapour at 200°C. Moreover Ba(OH)2 can further react in
the presence of CO2, according to:
𝐵𝑎(𝑂𝐻)2 + 𝐶𝑂2 → 𝐵𝑎𝐶𝑂3 + 𝐻2𝑂 (Eq. 3.4)
Therefore Eq. 3.3 and 3.4 can be used to explain the chemical decomposition process that occurred
to BCZY compounds. Ba(OH)2 may form under high partial pressure of steam, but when exposed
to highly pressurized carbon dioxide (up to 25 bar of pCO2) it reacts and transforms to BaCO3. The
time of exposure to atmospheric air after test influenced the decomposition of BCZY541 and the
consequent formation of BaCO3, CeO2 and phase transition from orthorhombic to cubic. This is also
confirmed by the SEM images taken on the tested cell which showed a clear difference in the grain
boundaries compared to the pristine BCZY541 structure (Fig. 3.6b).
The results obtained for BCZY541 exposed only to high partial pressure of steam have been
important to understand the kinetics of decomposition of the BCZY541 consequent to the sequence
1 and sequence 2. Indeed, formation of minor amounts of BaCO3 has been observed in the
diffraction pattern of BCZY541 taken on the external surface of the cell after the test in high partial
pressure of steam (Fig. 3.4). Also, its SEM images have revealed the presence of different
microstructures at the grain boundary, mainly on the outermost part of the cell. So the Ba(OH)2,
which could be formed near the surface of the BCZY541 electrolyte, may react with CO2 when it
gets in contact with air. The decomposition rate is nevertheless quite sluggish. Within five months
after the test a thin white layer appeared on the external surface of the pellet and micro fractures
started to affect its mechanical stability. Therefore a prolonged exposure time in high pCO2 is
necessary to affect the chemical stability of BCZY541. Conversely, BCZY541 did not show any
chemical instability at 1 bar of CO2 and T > 700 °C. In spite of the thermodynamic instability of
BaCeO3–based compounds in CO2 containing atmospheres, sintered powders of BaCeO3–based
ceramics can be kinetically stable due to strong kinetic limitations in the range of temperatures
between 500 and 850 °C.
The scarcely dense (85 %) cell of BCZY262 tested only in high partial pressure of steam showed
the presence of particles (~500 nm) attached to the grain boundaries across the entire cross section
of the cell (Fig. 3.9). Minor amounts of BaCO3 were also observed by XRD (Fig. 3.4a). The
formation of Ba(OH)2 could be enhanced due to the higher porosity of the sample, which provoked
fractures along the cell. On the other hand, the more dense BCZY262 (93 % density) tested also in
elevated partial pressure of CO2 exhibited micro fractures on the external layers but no modification
in its inner morphology, suggesting that high density can kinetically limit the chemical
49
decomposition of the BaCeO3–based proton conductors. Indeed, Colomban et al. observed that
scarcely dense perovskite proton conductors can be affected by crumbling and chemical
decomposition when treated under pH2O = 80 bar and temperature of 300 °C.36
The addition of more zirconium into barium cerate played an important role concerning the
chemical and mechanical stability. Indeed, BZY91 maintained its morphology and structure during
the entire test confirming that the higher basicity of the cerates facilitates the reaction with an acidic
gas as CO2 and therefore the chemical instability.
3.5 Conclusions
The conductivity of BaCe1-x-yZryYxO3-δ (x; y) = (0.1; 0.9) – (0.1; 0.4) – (0.2; 0.6) electrolytes was
studied in wet H2/N2 and in CO2/H2/N2 gas mixtures at a total pressure of up to 50 bar and
temperature of 240 °C for the first time. The highest conductivity values were found for the
compound with the highest Ce content (BCZY541), reaching a value of 10-3
S/cm at pH2O = 25 bar.
The conductivity of BCZY262 and BCZY541 was almost constant in the pH2O range from 10 mbar
to 5 bar and 10 bar, respectively, in line with the anticipated fully hydrated state of the compounds
under these conditions. Increasing pH2O from 10 to 25 bar resulted in almost one order of
magnitude increase in the conductivity of BCZY541. On the contrary, the conductivity of
BCZY262 dropped irreversibly by one order of magnitude for pH2O > 5 bar. These changes are
most probably associated with the formation of Ba(OH)2 at the grain boundaries, which enhances
the conducting properties of the BCZY541 cell but decreases the conductivity of the BCZY262 cell
due to the formation of micro-cracks. The resistivity of BZY91 gradually decreased by increasing
pH2O, which was found to arise from a positive influence of increasing pH2O to the grain boundary
conductivity of BZY91.
BCZY541 would have been the best electrolyte candidate because of its low resistivity in high
pH2O even at temperatures as low as 240 °C. However, the instability in the acidic CO2 gas
atmosphere hinders practical application for carbon dioxide reduction at high pressure.
Nevertheless, BCZY541 is an interesting electrolyte candidate for elevated pressure steam
electrolysis, but long term stability needs to be explored. BZY91 appears to be a suitable electrolyte
for CO2 reduction thanks to its stability and promising conductivity, which may possibly be further
improved by additives that decrease the grain boundary resistivity.
50
References
1 C. Graves, S.D. Ebbesen, M. Mogensen, K.S. Lackner, Renewable and Sustainable Energy
Reviews, 15 (2011) 1-23.
2 H. Iwahara, T. Esaka, H. Uchida and N. Maeda, Solid State Ionics, 3-4 (1981) 359.
3 H. Iwahara, H. Uchida, I. Yamasaki, International Journal of Hydrogen Energy, 12 (2) (1987) 73-
77.
4 W. Grover Coors, Journal of the Electrochemical Society, 151 (7) (2004) A994-A997.
5 K. Xie, Y. Zhang, G. Meng, J. T. S. Irvine, Journal of Material Chemistry, 21 (2011) 195.
6 H. Iwahara, T. Esaka, H. Uchida and N. Maeda, Solid State Ionics, 11 (1983) 109-115.
7 N. Bonanos, K.S. Knight and B. Ellis, Solid State Ionics, 79 (1995) 161-170.
8 T. Norby, “Perovskite oxide for solid oxide fuel cells”, Chapter 11, ed. T. Ishihara, 2009,
Springer, p. 238.
9 W. Grover Coors, Solid State Ionics, 178 (2007) 481 - 485.
10 P. A. Stuart, T. Unno, J. A. Kilner, S. J. Skinner, Solid State Ionics, 179 (2008) 1120.
11 N. Zakowsky, S. Williamson and John T. S. Irvine, Solid State Ionics, 176 (2006) 3019 – 3026.
12 C. W. Tanner and A. V. Virkar, Journal of the Electrochemical Society, 143 (1996) 1386 – 1389.
13 S. V. Bhide and A. V. Virkar, Journal of the Electrochemical Society, 146 (1999) 2038 – 2044. S.
14 E. Fabbri, A. D. Epifanio, E.D. Bartolomeo, S. Licoccia, E. Traversa, Solid State Ionics, 179
(2008) 558.
15 K.D. Kreuer, Solid State Ionics, 97 (1997) 1.
16 K.H. Ryu, S.M. Haile, Solid State Ionics, 125 (1999) 355.
17 J. Tong, D. Clark, L. Bernau, M. Sanders and R. O’Hayre, Journal of Material Chemistry, 20
(2010) 6333 – 6341.
18A. Lapina, C. Chatzichristodoulou, P. Holtappels and M. Mogensen, Journal of the
Electrochemical Society, 161 (2014) 833-837.
19 C. Chatzichristodoulou, F. Allebrod, and M. Mogensen, Review of Scientific Instruments, 84
(2013) 054101.
51
20 J.R. MacDonald, E. Barsoukov, Impedance Spectroscopy, J. R. MacDonald, Wiley and Sons,
Second Edition, New York, 2005.
21 X. Ma, J. Dai, H. Zhang, D. E. Reisner, Surface & Coatings Technology, 200 (2005) 1252 –
1258.
22 R.D. Shannon, Acta Crystallographica A 32 (1976) 751.
23 S. Barison, M. Battagliarin, T. Cavallin, L. Doubova, M. Fabrizio, C. Mortalo’, S. Boldrini, L.
Malavasi and R. Gerbasi, Journal of Materials Chemistry, 18 (2008) 5120-5128
24 S. Ricote, N. Bonanos, Solid State Ionics, 181 (2010) 694-700.
25 J. R. Macdonald, Solid State Ionics, 13 (1984) 147.
26 S. Ricote, N. Bonanos, A. Manerbino, W.G. Coors, International Journal of Hydrogen Energy,
37 (2012) 7954-7961.
27 F.M.M. Snijkers, A. Buekenhoudt, J. Cooymans, J.J. Luyten, Scripta Materialia, 50 (5) (2004)
655.
28 K.D. Kreuer, Annual Review of Material Research, 33 (2003) 333.
29 D. Shima and S. M. Haile, Solid State Ionics, 97 (1997) 443.
30 G. Ma, H. Matsumoto and H. Iwahara, Solid State Ionics, 122 (1999) 237.
31 M. Shirpour, PhD thesis, University of Stuttgart, Germany (2011).
32 H. G. Bohn and T. Schober, Journal of the American Ceramic Society, 83 (4) (2000) 768.
33 S. M. Haile, G. Staneff, K.H. Ryu, Journal of Material Science, 36 (2001) 1149.
34 I. Yati, M. Ridwan, G. E. Jeang, Y. Lee, J. Choi, C.W. Yoon, D. J. Suh and J. Ha, Catalysis
Communications, 56 (2014) 11 -16.
35 C. W. Bale, P. Chartrand, S.A. Degterov, G. Eriksson, K. Hack, R.B. Mahfoud, J. Melançon,
A.D. Pelton, S. Petersen, Calphad 26 (2) (2002), 189 – 228.
36 P. Colomban, O. Zaafrani, A. Slodczyk, Membranes, 2 (2012) 493 – 509.
52
Chapter 4
Hydrothermal synthesis and characerization
of K-doped BaZr0.9Y0.1O3-δ. Chapter 3 presented results for a number of proton conducting materials, i.e. BaCe1-x-yZryYxO3-δ,
tested at elevated partial pressures of water vapour and of carbon dioxide and intermediate
temperatures (T = 240 °C). Only BaCe0.5Zr0.4Y0.1O3-δ exhibited conductivity above 10-3
S/cm in
high steam partial pressure (pH2O = 25 bar), but it did not show a sufficient chemical stability
during the after tests analysis. Indeed, BaZr0.9Y0.1O3-δ appeared to be a suitable electrolyte for CO2
reduction thanks to its stability and promising conductivity. Therefore, it was decided that
additional studies on yttrium doped barium zirconate based electrolyte were needed to improve the
conductivity in high steam and carbon dioxide pressures at intermediate temperature. The main aim
with this study was to evaluate if potassium doped BZY91 was suitable as an electrolyte material
for an electrochemical cell for CO2 reduction at intermediate temperature and high pressure.
Abstract
The effect of doping potassium on the A-site of BaZr0.9Y0.1O3-δ for application as intermediate
temperature proton conductor was studied. Potassium doped barium zirconates was synthesized for
the first time by the hydrothermal method. The synthesis procedures of Ba1-xKxZr0.9Y0.1O3-δ and its
characterization by X-ray diffraction, inductively coupled plasma and scanning electron microscopy
are presented. The sintering conditions were improved by adding 1 wt% ZnO during material
synthesis. The actual composition of the electrolyte tested was Ba0.92K0.08Zr0.9Y0.1O3-δ. The
conductivity was measured via electrochemical impedance spectroscopy as a function of
temperature (from 790 °C to 275°C) and steam partial pressure (from pH2O < 0.001 atm to 0.1 atm)
in N2/H2O gas mixtures. Ba0.92K0.08Zr0.9Y0.1O3-δ exhibited higher total conductivity compared to
BaZr0.9Y0.1O3-δ sintered by solid state reactive sintering. In particular, it showed higher specific
grain boundary conductivity when the grain boundary and bulk contributions were distinguished by
the analysis of the low temperature spectra. In addition, the conductivity of Ba0.92K0.08Zr0.9Y0.1O3-δ
exhibited higher values compared to BaZr0.9Y0.1O3-δ during two consecutive sequences in high
steam partial pressure and in high carbon dioxide pressure, as described in the previous chapter.
After the test, X-ray diffraction and scanning electron microscopy analysis confirmed the chemical
stability in high pressure of H2O and of CO2 for barium zirconate based materials.
53
4.1 Introduction
Electrolysers based on proton conducting electrolytes are of great interest for their potential to
operate at intermediate temperatures (400-600 °C), compared to solid oxide electrolytic cells
(SOECs) which require operating temperatures above 700 °C. Reducing the operating temperature
can limit degradation phenomena, interfacial reactions among components, thermal expansion
mismatches and can lower production costs. Proton conductors are viable electrolytes at
intermediate temperatures because protons migrate more easily than oxygen ions at 400-600 °C,
thus conductivities are high enough for technical applications. High protonic conduction is observed
for several perovskite-type oxides, such as doped BaCeO3, BaZrO3, SrCeO3 and SrZrO3 1, 2
. These
materials are termed high-temperature proton conductors (HTPCs), because their working
temperatures (400 – 600 °C) are noticeably higher than the working temperatures of proton
conducting polymers (~100 °C). HTPCs have been considered very attractive electrolyte materials
for high-temperature steam electrolysis3 and more recently for reforming of hydrocarbon fuels by
steam permeation in a protonic ceramic fuel cell4. One interesting application for proton conducting
electrochemical cells operating at intermediate temperatures is electrochemical reduction of carbon
dioxide at the cathode of a proton conducting solid oxide electrolyser based on
BaCe0.5Zr0.3Y0.16Zn0.04O3-δ electrolyte5. In Chapter 3 it has been already described the main
properties and characteristics of high protonic conductivity and low chemical stability in CO2
atmosphere of these perovskite-type oxides. Among HTPCs, barium zirconate-based electrolytes
have been extensively studied because of their good chemical stability6, also confirmed by the
analysis in high pCO2, as studied in Chapter 3. In particular, K. Kreuer7 reported that
BaZr0.8Y0.2O3-δ is characterized by very high proton conductivity in the grain bulk, which results to
be higher than that of the best oxygen ion conductors below 600 °C. On the other hand, Y-doped
BaZrO3 exhibits poor sinterability, small grain size (on average 1μm or smaller)8 and high grain
boundary resistivity7. Different approaches have been studied to reduce its grain boundary surface,
i.e. annealing at high temperature9 or using sintering aids
10. In particular, the solid-state reacting
sintering technique is often the method used to prepare dense Y-doped BaZrO3 ceramics11
. It
consists of a single firing step of the precursors pressed in a pellet shape with the addition of small
amount of sintering aid which helps perovskite phase formation and sintering. Recently, solution-
based synthesis route such as the hydrothermal method have been developed to produce perovskite
materials with controlled morphology and narrow particle-size distribution, in particular for
BaCeO3 and BaZrO312,13
. Hydrothermal synthesis is a process for crystallizing materials directly
from aqueous solution by suitable control of temperature (> 25 C) and pressure (> 1 atm) and
precursor composition. Typically, a mixture of the reactants and a solvent is heated to the
established reaction temperature in a sealed vessel under autogenous pressure. The product
formation follows defined steps. Firstly, the reactants start to dissolve having a significantly higher
solubility under hydrothermal conditions; secondly, the nuclei begin to form in the solution and
finally they grow to larger crystallites by incorporation of material from the solution. All these
sequential steps may be influenced by a large variety of reaction parameters like temperature,
pressure, nature of the solvent, reaction time and surfactants. This allows control over the size,
crystal morphology and stoichiometry of the resulting particles14
.
54
In this work, K- doped BaZr0.9Y0.1O3-δ powders were synthesized by the hydrothermal technique in
order to improve its sinterability and decrease the grain boundary surface. Pellets were sintered in
air at different elevated temperature. In particular, it was used a solution of KOH in the aqueous
solution both to control its pH but also to dope Ba with an alkali metal as potassium and therefore to
affect the basicity of the perovskite. Indeed, the proton conductivity is reported in the literature to
be enhanced by the basicity of the constituent oxides due to its influence on water uptake capacity15,
16. Introducing highly basic alkaline oxides should improve the conductivity, as also proved by A.
S. Patnaik et al17
. Potassium was chosen as dopant due to its matching ionic radius to that of Ba for
a coordination number of twelve18
. The aim of the work described in this chapter is to evaluate the
structural and conductivity properties of Ba1-xKxZr0.9Y0.1O3-δ and comparing its performance with
that of BaZr0.9Y0.1O3-δ (BZY91) and of BaCe0.5Zr0.4Y0.1O3-δ (BCZY541) obtained by solid state
reactive sintering method. In addition, the objective is also to examine the conductivity and
chemical stability of K- doped BaZr0.9Y0.1O3-δ as possible electrolytes for the electrochemical
conversion of CO2 at elevated partial pressures of water vapour and of carbon dioxide and
intermediate temperatures (T = 240 °C).
4.2 Experimental
4.2.1 Synthesis procedure
K-doped BaZr0.9Y0.1O3-δ powders were synthesized by the hydrothermal method. In this process, a
solution was prepared by dissolving barium nitrate (0.01 mol Ba(NO3)2 – Aldrich, 99.999 %) in
distilled water. In parallel, zirconium nitrate (0.009 mol ZrO(NO3)2 – Aldrich, 99 %) and yttrium
nitrate hexahydrate (0.001 mol Y(NO3)3 · 6H2O – Aldrich, 99.8% ) were dissolved in distilled
water, obtaining a second solution. The two solutions were mixed and stirred in equal ratio to obtain
a homogenized solution. Furthermore an aqueous solution of potassium hydroxide (16 M KOH –
Alfa Aesar) was prepared separately. Equal volume of the homogenized solution and of the
potassium hydroxide solution were blended and placed in a stainless steel autoclave with a Teflon-
liner. Subsequently, the autoclave was heated to a temperature of 200 °C and maintained at this
temperature for 72 h. After cooling, the obtained paste was washed with distilled water and ethanol
and then dried at 80 °C. 1 wt% of ZnO (Aldrich, 99%) was added to the product as sintering
additive and manually ground to obtain powder. To another batch was instead added 1 wt% of NiO
(Alfa Aesar, 99% (metal basis)). Then the powder was used to produce cylindrical pellets, by
uniaxial pressing under a pressure of 60 MPa. The pellets were placed on alumina crucibles covered
by calcined 8YSZ and with an alumina cap to prevent contamination and to minimize the loss of
potassium. The pellets were sintered in air at 1550 °C for 10 or 24 h or at 1670 °C for 10 h. The
obtained pellets of Ba1-xKxZr0.9Y0.1O3-δ sintered at 1550 °C for 10 h had a diameter of 8 ± 0.1 mm
and a thickness of 2 ± 0.1 mm after polishing.
55
4.2.2 Characterization
XRD measurements were undertaken in air using a Bruker D8 X-Ray Diffractometer (Bruker-
Siemens, Germany), using Cu Kα radiation, with an acceleration voltage of 40 kV and a filament
current of 40 mA. TOPAS 3.0 software was used to perform Rietveld refinement of the lattice
parameters and unit cell volume of the sintered compounds. SEM imaging was carried out on as
synthesized powders and on fractured cross sections of tested and pristine pellets using a Zeiss
SUPRA SEM. The powders and the fractured pellets were attached to a metal sample holder
through a piece of carbon tape, and the pellets were also coated with a thin layer of carbon using a
sputter coater. As synthesized powders of Ba1-xKxZr0.9Y0.1O3-δ and sintered pellets were analyzed
using inductively coupled plasma mass spectroscopy (ICP-MS, X Series II, Thermo Fisher
Scientific, Waltham, MA) to evaluate their chemical compositions. Experiments were performed
multiple times on a sample from the same batch to determine the uncertainty of the concentration of
the cations. The relative density of the materials was determined from the mass and geometrical
dimensions of the pellets, using 6 g/cm3 as theoretical density.
4.2.3 Conductivity
Cells for conductivity measurements were made by painting Pt-ink (Ferro 308a, fritless, platelets)
on each side of the electrolyte disc samples and fired in air at 900 °C for 4 h. The electrical
conductivity of the materials was measured at 1 atm using a single atmosphere setup, which is
constructed so that diluted H2 in N2 (maximum 9% H2), N2, air and O2 and various humidity (from
pH2O < 0.001 atm up to pH2O = 0.2 atm) can be used and mixed at temperatures ranging from
room temperature up to 850 °C. Four samples can be tested in each test. For comparison, BCZY541
and BZY91 cells sintered by solid state reactive sintering and a BKZY91 cell were tested
simultaneously. A Solartron 1260 frequency response analyzer (Solartron Analytical, UK) was used
for electrochemical impedance spectroscopy (EIS) measurements. EIS measurements were
performed using an AC signal with amplitude of 350 mV over a frequency range of 1 MHz down to
0.1 Hz. Data analysis was carried out using ZSimpWin 3.21 and Elchemea Analytical. During
testing the material was exposed to a constant flux of gas (N2), either dry (gases from the gas
system, estimated pH2O < 0.001 atm) or humidified (pH2O = 0.038 or 0.1 atm). A humidity cycle
was done at each temperature investigated, from 790 °C to 275 °C. The gas was humidified by
bubbling through a water bottle at controlled temperature prior to entering the experimental setup.
A pellet of Ba1-xKxZr0.9Y0.1O3-δ was also tested in the high pressure electrochemical test station
(limit: 100 bar, 300 °C), explained in detail elsewhere19
. The AC conductivity test was performed
along two consecutive sequences in high pH2O and in high pCO2, both at temperatures of 240 °C,
as already described in Chapter 3.
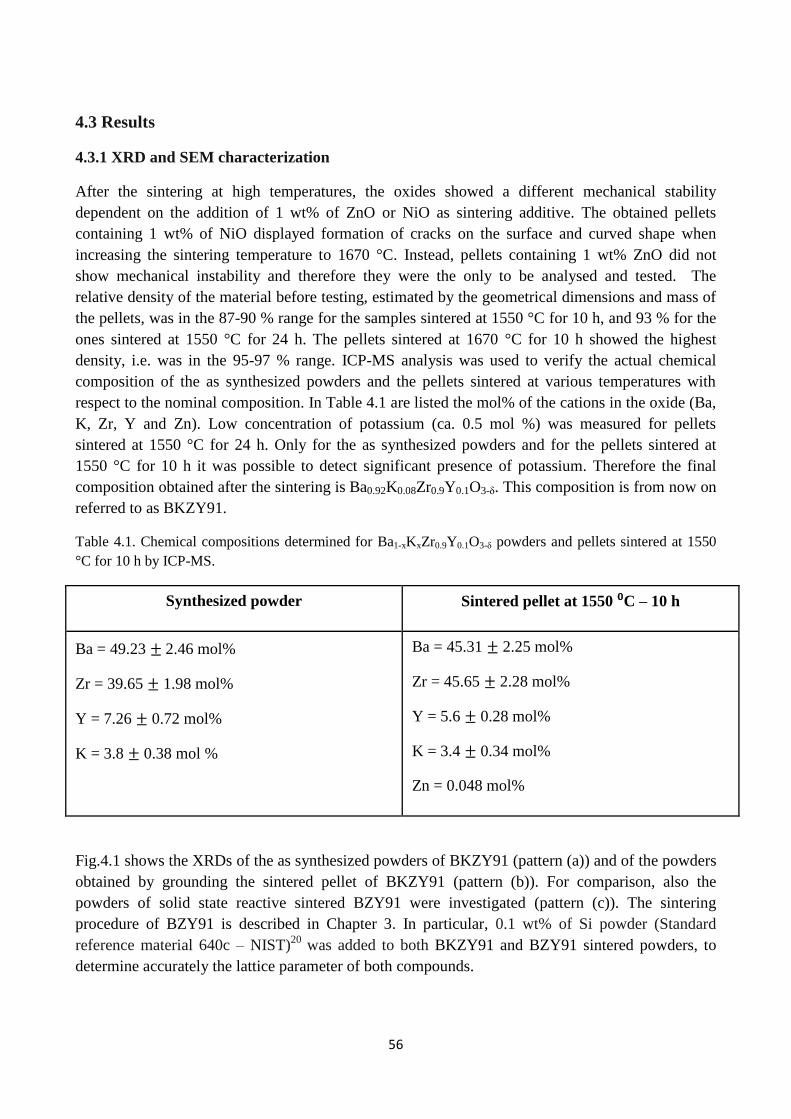
56
4.3 Results
4.3.1 XRD and SEM characterization
After the sintering at high temperatures, the oxides showed a different mechanical stability
dependent on the addition of 1 wt% of ZnO or NiO as sintering additive. The obtained pellets
containing 1 wt% of NiO displayed formation of cracks on the surface and curved shape when
increasing the sintering temperature to 1670 °C. Instead, pellets containing 1 wt% ZnO did not
show mechanical instability and therefore they were the only to be analysed and tested. The
relative density of the material before testing, estimated by the geometrical dimensions and mass of
the pellets, was in the 87-90 % range for the samples sintered at 1550 °C for 10 h, and 93 % for the
ones sintered at 1550 °C for 24 h. The pellets sintered at 1670 °C for 10 h showed the highest
density, i.e. was in the 95-97 % range. ICP-MS analysis was used to verify the actual chemical
composition of the as synthesized powders and the pellets sintered at various temperatures with
respect to the nominal composition. In Table 4.1 are listed the mol% of the cations in the oxide (Ba,
K, Zr, Y and Zn). Low concentration of potassium (ca. 0.5 mol %) was measured for pellets
sintered at 1550 °C for 24 h. Only for the as synthesized powders and for the pellets sintered at
1550 °C for 10 h it was possible to detect significant presence of potassium. Therefore the final
composition obtained after the sintering is Ba0.92K0.08Zr0.9Y0.1O3-δ. This composition is from now on
referred to as BKZY91.
Table 4.1. Chemical compositions determined for Ba1-xKxZr0.9Y0.1O3-δ powders and pellets sintered at 1550
°C for 10 h by ICP-MS.
Synthesized powder Sintered pellet at 1550 ⁰C – 10 h
Ba = 49.23 ± 2.46 mol%
Zr = 39.65 ± 1.98 mol%
Y = 7.26 ± 0.72 mol%
K = 3.8 ± 0.38 mol %
Ba = 45.31 ± 2.25 mol%
Zr = 45.65 ± 2.28 mol%
Y = 5.6 ± 0.28 mol%
K = 3.4 ± 0.34 mol%
Zn = 0.048 mol%
Fig.4.1 shows the XRDs of the as synthesized powders of BKZY91 (pattern (a)) and of the powders
obtained by grounding the sintered pellet of BKZY91 (pattern (b)). For comparison, also the
powders of solid state reactive sintered BZY91 were investigated (pattern (c)). The sintering
procedure of BZY91 is described in Chapter 3. In particular, 0.1 wt% of Si powder (Standard
reference material 640c – NIST)20 was added to both BKZY91 and BZY91 sintered powders, to
determine accurately the lattice parameter of both compounds.
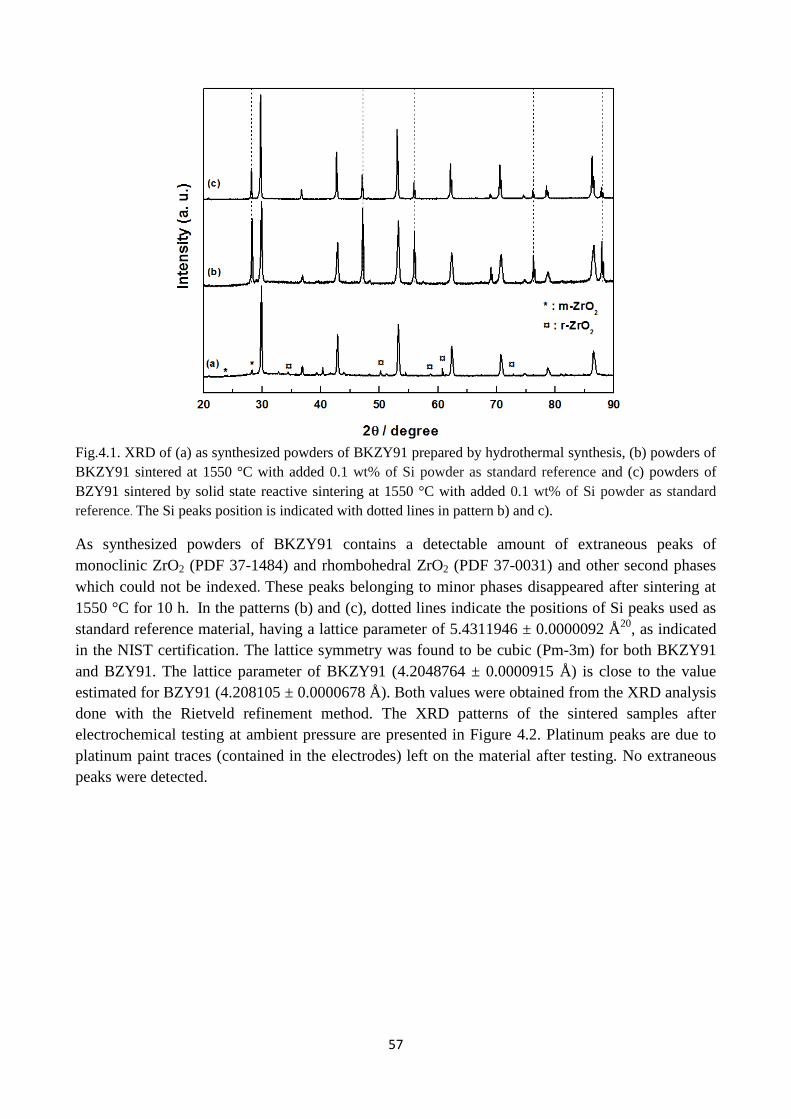
57
Fig.4.1. XRD of (a) as synthesized powders of BKZY91 prepared by hydrothermal synthesis, (b) powders of
BKZY91 sintered at 1550 °C with added 0.1 wt% of Si powder as standard reference and (c) powders of
BZY91 sintered by solid state reactive sintering at 1550 °C with added 0.1 wt% of Si powder as standard
reference. The Si peaks position is indicated with dotted lines in pattern b) and c).
As synthesized powders of BKZY91 contains a detectable amount of extraneous peaks of
monoclinic ZrO2 (PDF 37-1484) and rhombohedral ZrO2 (PDF 37-0031) and other second phases
which could not be indexed. These peaks belonging to minor phases disappeared after sintering at
1550 °C for 10 h. In the patterns (b) and (c), dotted lines indicate the positions of Si peaks used as
standard reference material, having a lattice parameter of 5.4311946 ± 0.0000092 Å20
, as indicated
in the NIST certification. The lattice symmetry was found to be cubic (Pm-3m) for both BKZY91
and BZY91. The lattice parameter of BKZY91 (4.2048764 ± 0.0000915 Å) is close to the value
estimated for BZY91 (4.208105 ± 0.0000678 Å). Both values were obtained from the XRD analysis
done with the Rietveld refinement method. The XRD patterns of the sintered samples after
electrochemical testing at ambient pressure are presented in Figure 4.2. Platinum peaks are due to
platinum paint traces (contained in the electrodes) left on the material after testing. No extraneous
peaks were detected.
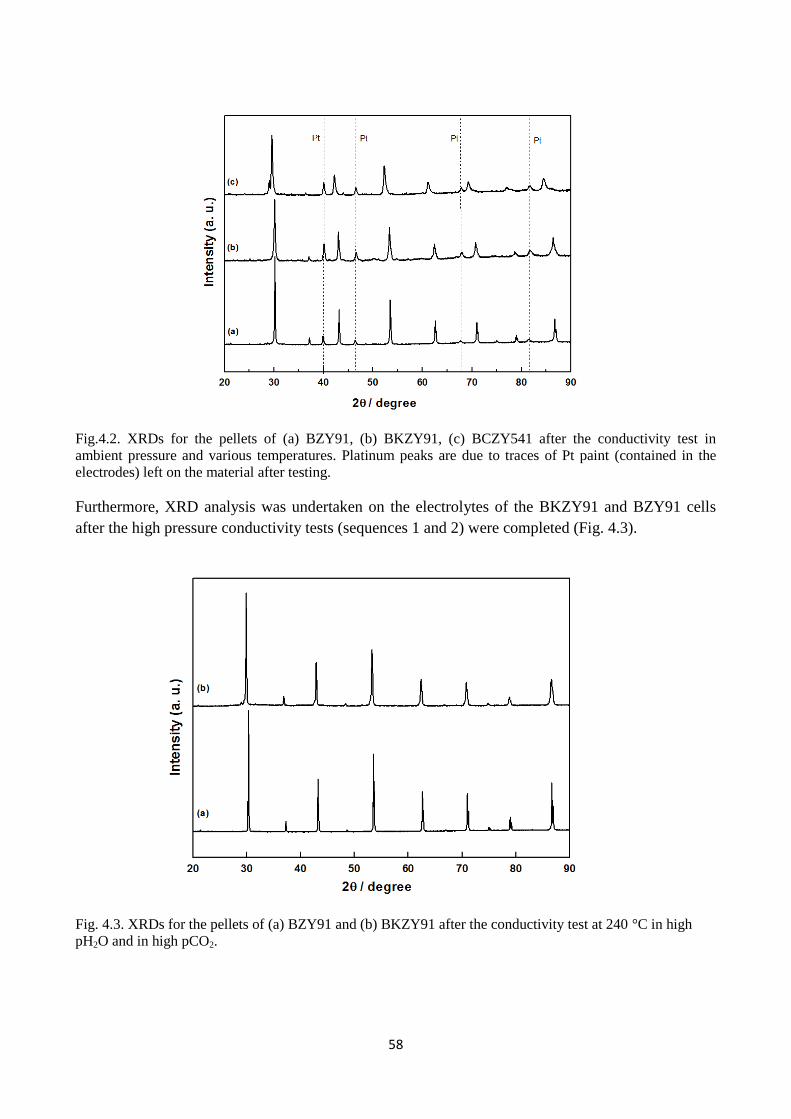
58
Fig.4.2. XRDs for the pellets of (a) BZY91, (b) BKZY91, (c) BCZY541 after the conductivity test in
ambient pressure and various temperatures. Platinum peaks are due to traces of Pt paint (contained in the
electrodes) left on the material after testing.
Furthermore, XRD analysis was undertaken on the electrolytes of the BKZY91 and BZY91 cells
after the high pressure conductivity tests (sequences 1 and 2) were completed (Fig. 4.3).
Fig. 4.3. XRDs for the pellets of (a) BZY91 and (b) BKZY91 after the conductivity test at 240 °C in high
pH2O and in high pCO2.
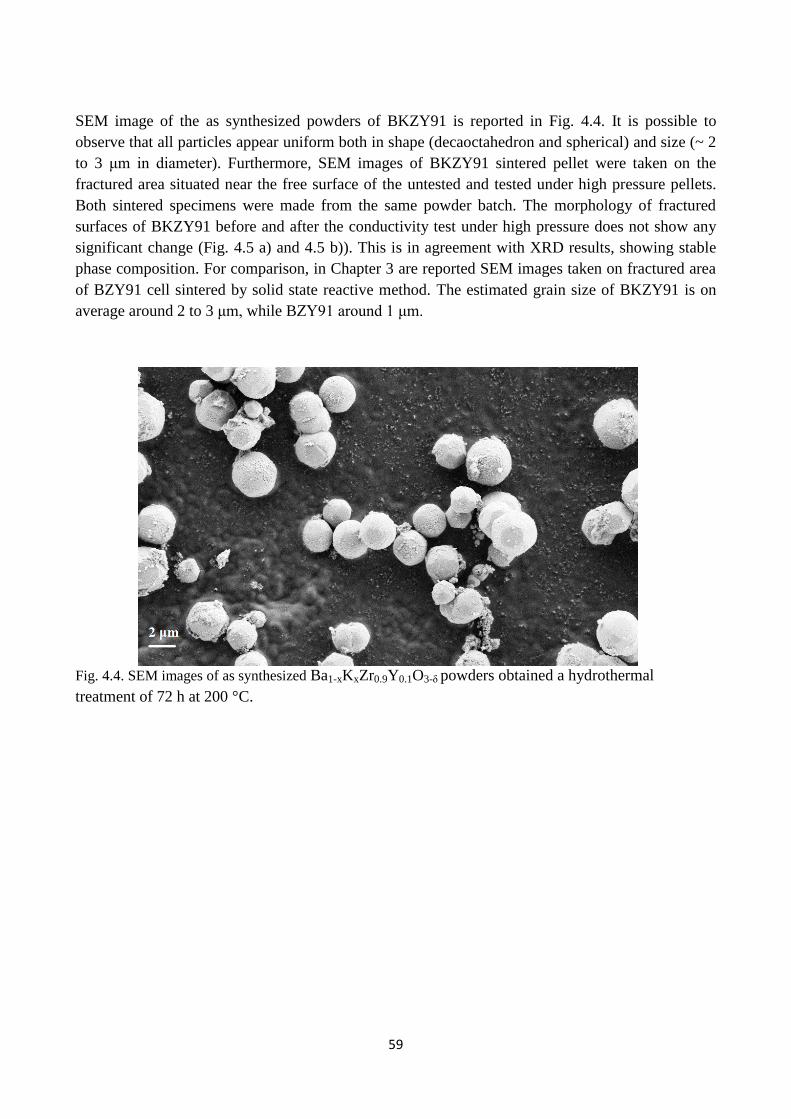
59
SEM image of the as synthesized powders of BKZY91 is reported in Fig. 4.4. It is possible to
observe that all particles appear uniform both in shape (decaoctahedron and spherical) and size (~ 2
to 3 μm in diameter). Furthermore, SEM images of BKZY91 sintered pellet were taken on the
fractured area situated near the free surface of the untested and tested under high pressure pellets.
Both sintered specimens were made from the same powder batch. The morphology of fractured
surfaces of BKZY91 before and after the conductivity test under high pressure does not show any
significant change (Fig. 4.5 a) and 4.5 b)). This is in agreement with XRD results, showing stable
phase composition. For comparison, in Chapter 3 are reported SEM images taken on fractured area
of BZY91 cell sintered by solid state reactive method. The estimated grain size of BKZY91 is on
average around 2 to 3 μm, while BZY91 around 1 μm.
Fig. 4.4. SEM images of as synthesized Ba1-xKxZr0.9Y0.1O3-δ powders obtained a hydrothermal
treatment of 72 h at 200 °C.
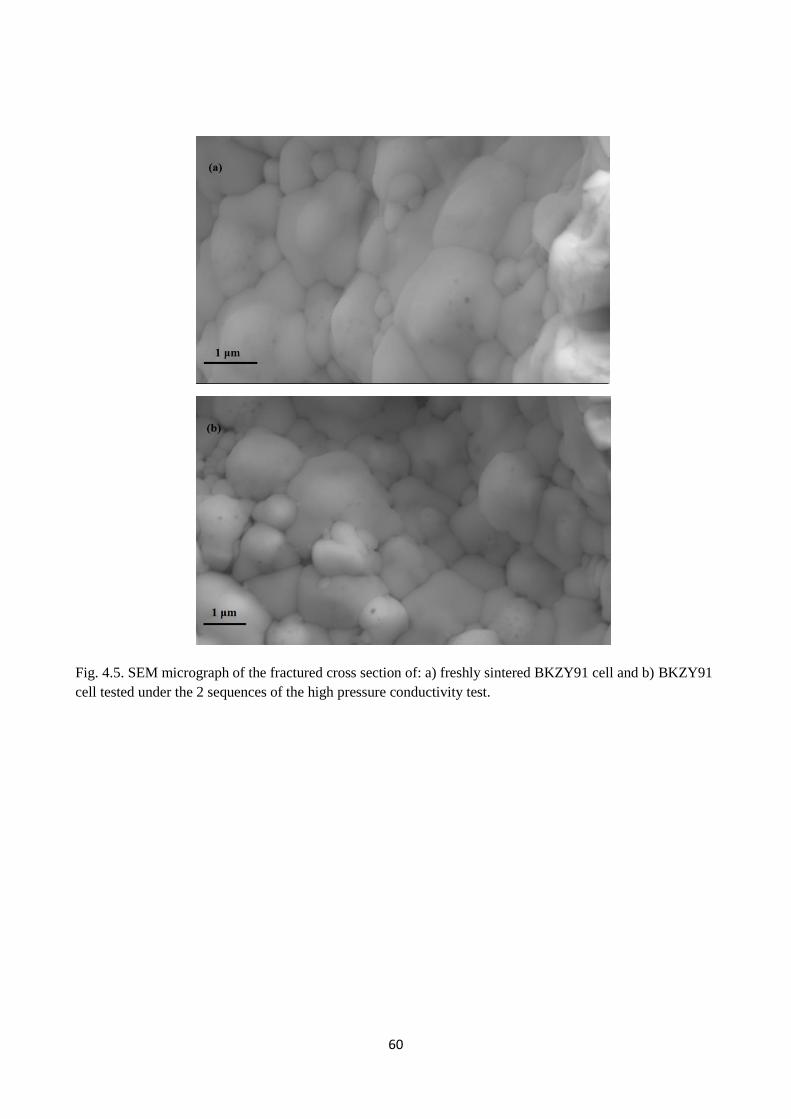
60
Fig. 4.5. SEM micrograph of the fractured cross section of: a) freshly sintered BKZY91 cell and b) BKZY91
cell tested under the 2 sequences of the high pressure conductivity test.
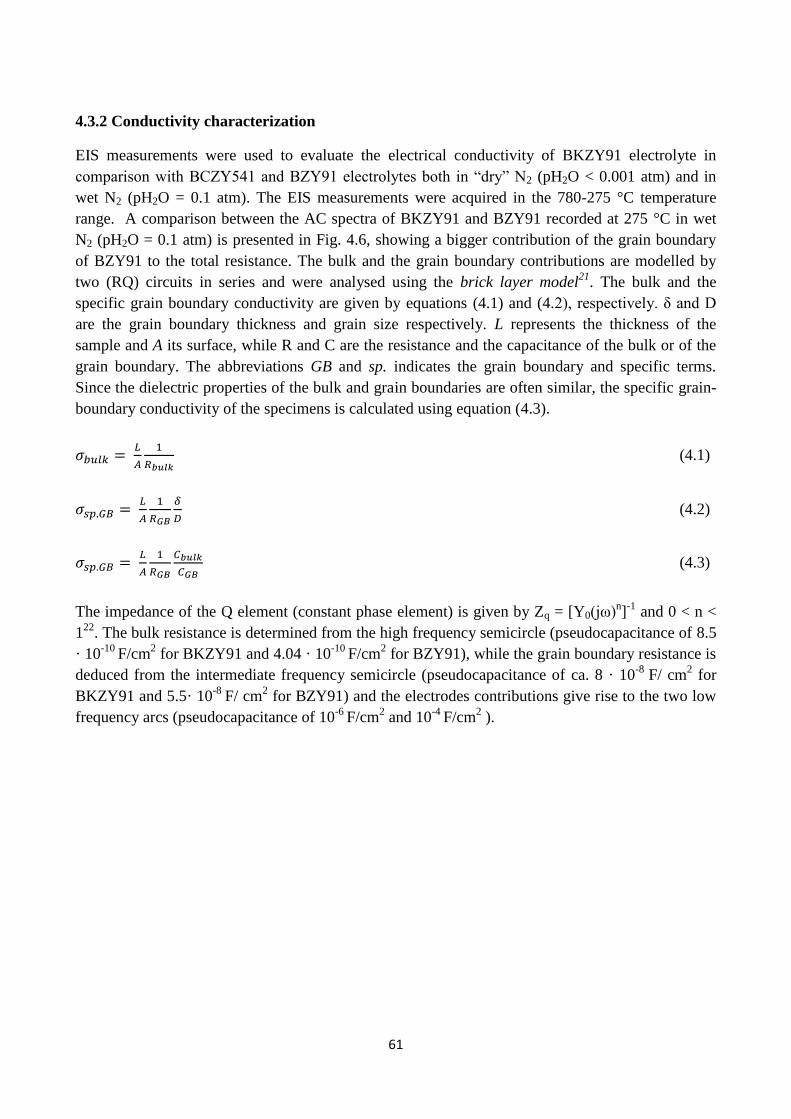
61
4.3.2 Conductivity characterization
EIS measurements were used to evaluate the electrical conductivity of BKZY91 electrolyte in
comparison with BCZY541 and BZY91 electrolytes both in “dry” N2 (pH2O < 0.001 atm) and in
wet N2 (pH2O = 0.1 atm). The EIS measurements were acquired in the 780-275 °C temperature
range. A comparison between the AC spectra of BKZY91 and BZY91 recorded at 275 °C in wet
N2 (pH2O = 0.1 atm) is presented in Fig. 4.6, showing a bigger contribution of the grain boundary
of BZY91 to the total resistance. The bulk and the grain boundary contributions are modelled by
two (RQ) circuits in series and were analysed using the brick layer model21
. The bulk and the
specific grain boundary conductivity are given by equations (4.1) and (4.2), respectively. δ and D
are the grain boundary thickness and grain size respectively. L represents the thickness of the
sample and A its surface, while R and C are the resistance and the capacitance of the bulk or of the
grain boundary. The abbreviations GB and sp. indicates the grain boundary and specific terms.
Since the dielectric properties of the bulk and grain boundaries are often similar, the specific grain-
boundary conductivity of the specimens is calculated using equation (4.3).
𝜎𝑏𝑢𝑙𝑘 = 𝐿
𝐴
1
𝑅𝑏𝑢𝑙𝑘 (4.1)
𝜎𝑠𝑝.𝐺𝐵 = 𝐿
𝐴
1
𝑅𝐺𝐵
𝛿
𝐷 (4.2)
𝜎𝑠𝑝.𝐺𝐵 = 𝐿
𝐴
1
𝑅𝐺𝐵
𝐶𝑏𝑢𝑙𝑘
𝐶𝐺𝐵 (4.3)
The impedance of the Q element (constant phase element) is given by Zq = [Y0(jω)n]
-1 and 0 < n <
122
. The bulk resistance is determined from the high frequency semicircle (pseudocapacitance of 8.5
· 10-10
F/cm2 for BKZY91 and 4.04 · 10
-10 F/cm
2 for BZY91), while the grain boundary resistance is
deduced from the intermediate frequency semicircle (pseudocapacitance of ca. 8 · 10-8
F/ cm2 for
BKZY91 and 5.5· 10-8
F/ cm2 for BZY91) and the electrodes contributions give rise to the two low
frequency arcs (pseudocapacitance of 10-6
F/cm2 and 10
-4 F/cm
2 ).
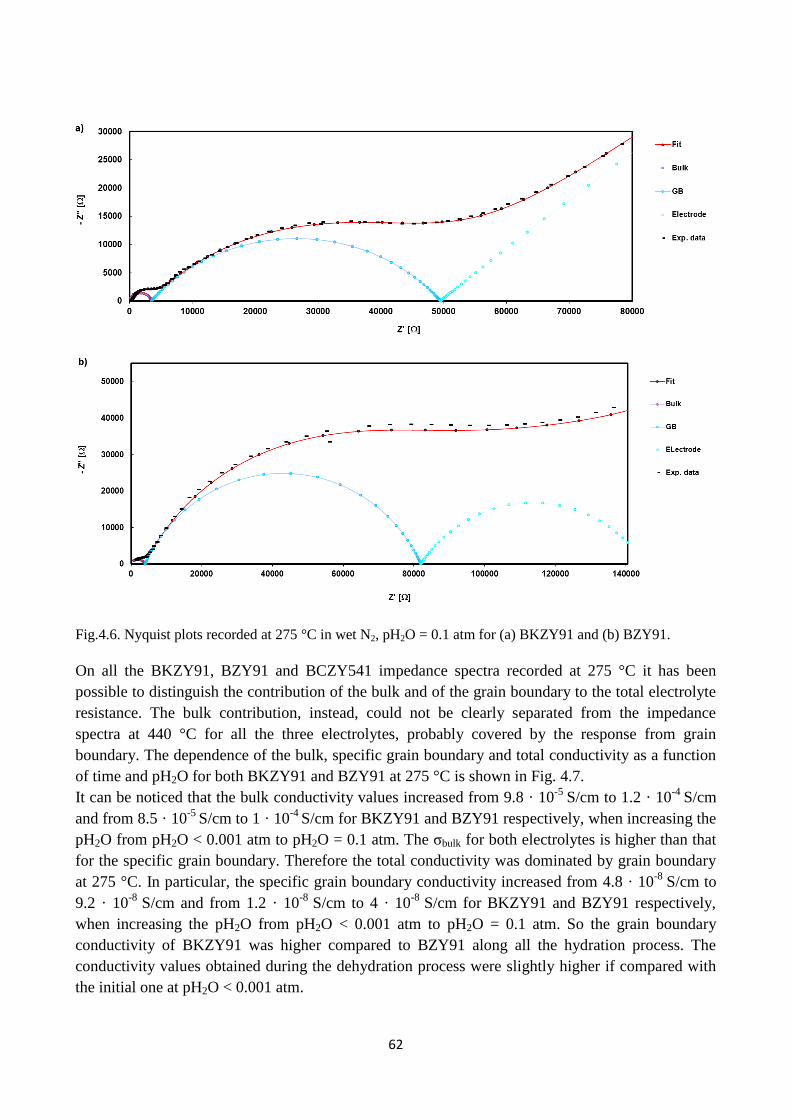
62
Fig.4.6. Nyquist plots recorded at 275 °C in wet N2, pH2O = 0.1 atm for (a) BKZY91 and (b) BZY91.
On all the BKZY91, BZY91 and BCZY541 impedance spectra recorded at 275 °C it has been
possible to distinguish the contribution of the bulk and of the grain boundary to the total electrolyte
resistance. The bulk contribution, instead, could not be clearly separated from the impedance
spectra at 440 °C for all the three electrolytes, probably covered by the response from grain
boundary. The dependence of the bulk, specific grain boundary and total conductivity as a function
of time and pH2O for both BKZY91 and BZY91 at 275 °C is shown in Fig. 4.7.
It can be noticed that the bulk conductivity values increased from 9.8 · 10-5
S/cm to 1.2 · 10-4
S/cm
and from 8.5 · 10-5
S/cm to 1 · 10-4
S/cm for BKZY91 and BZY91 respectively, when increasing the
pH2O from pH2O < 0.001 atm to pH2O = 0.1 atm. The σbulk for both electrolytes is higher than that
for the specific grain boundary. Therefore the total conductivity was dominated by grain boundary
at 275 °C. In particular, the specific grain boundary conductivity increased from 4.8 · 10-8
S/cm to
9.2 · 10-8
S/cm and from 1.2 · 10-8
S/cm to 4 · 10-8
S/cm for BKZY91 and BZY91 respectively,
when increasing the pH2O from pH2O < 0.001 atm to pH2O = 0.1 atm. So the grain boundary
conductivity of BKZY91 was higher compared to BZY91 along all the hydration process. The
conductivity values obtained during the dehydration process were slightly higher if compared with
the initial one at pH2O < 0.001 atm.
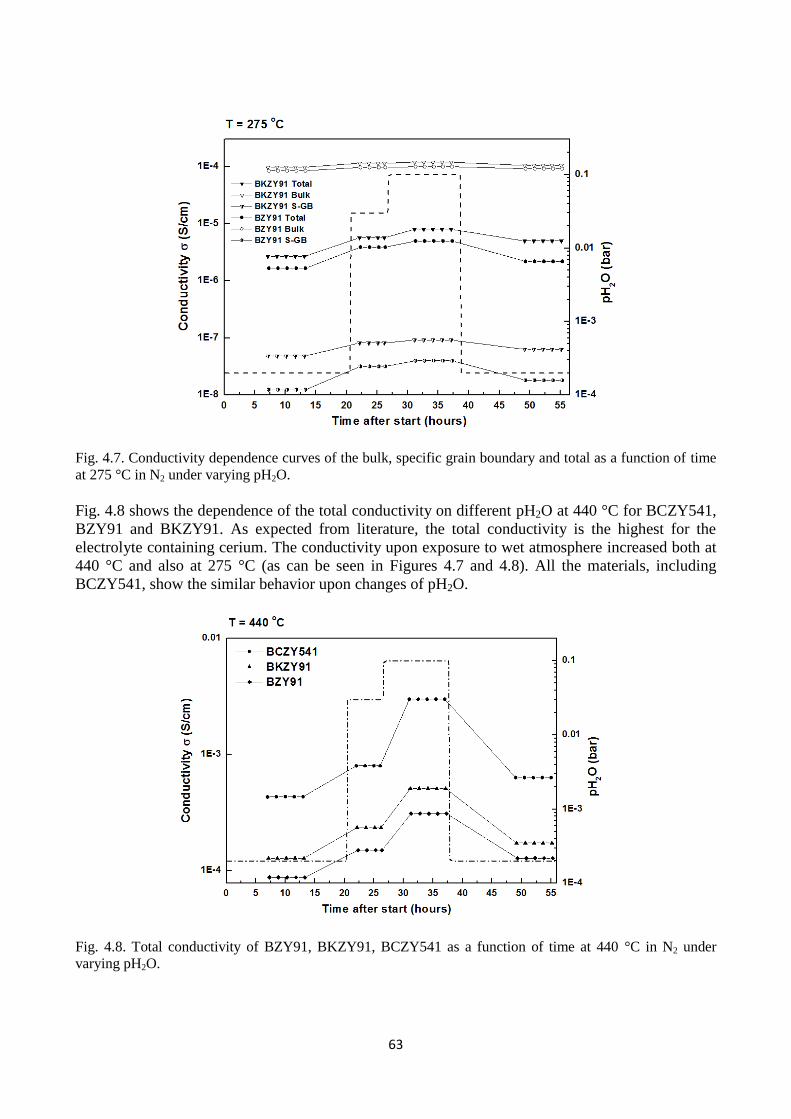
63
Fig. 4.7. Conductivity dependence curves of the bulk, specific grain boundary and total as a function of time
at 275 °C in N2 under varying pH2O.
Fig. 4.8 shows the dependence of the total conductivity on different pH2O at 440 °C for BCZY541,
BZY91 and BKZY91. As expected from literature, the total conductivity is the highest for the
electrolyte containing cerium. The conductivity upon exposure to wet atmosphere increased both at
440 °C and also at 275 °C (as can be seen in Figures 4.7 and 4.8). All the materials, including
BCZY541, show the similar behavior upon changes of pH2O.
Fig. 4.8. Total conductivity of BZY91, BKZY91, BCZY541 as a function of time at 440 °C in N2 under
varying pH2O.
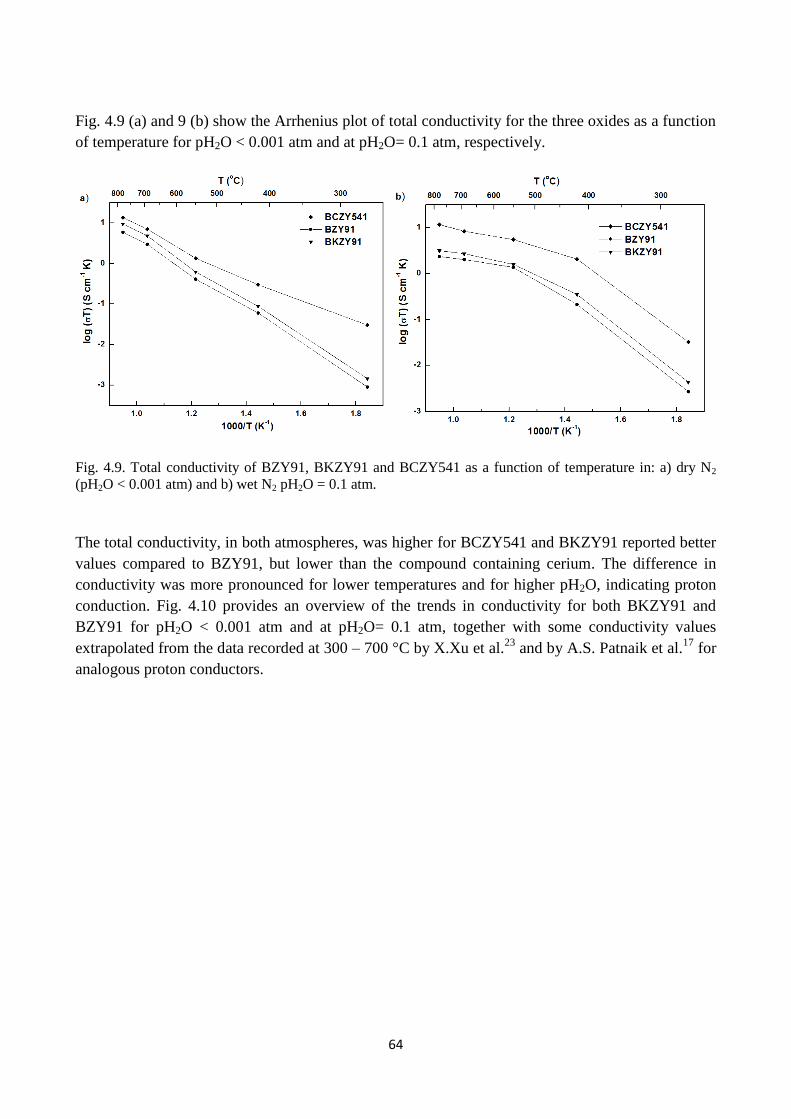
64
Fig. 4.9 (a) and 9 (b) show the Arrhenius plot of total conductivity for the three oxides as a function
of temperature for pH2O < 0.001 atm and at pH2O= 0.1 atm, respectively.
Fig. 4.9. Total conductivity of BZY91, BKZY91 and BCZY541 as a function of temperature in: a) dry N2
(pH2O < 0.001 atm) and b) wet N2 pH2O = 0.1 atm.
The total conductivity, in both atmospheres, was higher for BCZY541 and BKZY91 reported better
values compared to BZY91, but lower than the compound containing cerium. The difference in
conductivity was more pronounced for lower temperatures and for higher pH2O, indicating proton
conduction. Fig. 4.10 provides an overview of the trends in conductivity for both BKZY91 and
BZY91 for pH2O < 0.001 atm and at pH2O= 0.1 atm, together with some conductivity values
extrapolated from the data recorded at 300 – 700 °C by X.Xu et al.23
and by A.S. Patnaik et al.17
for
analogous proton conductors.
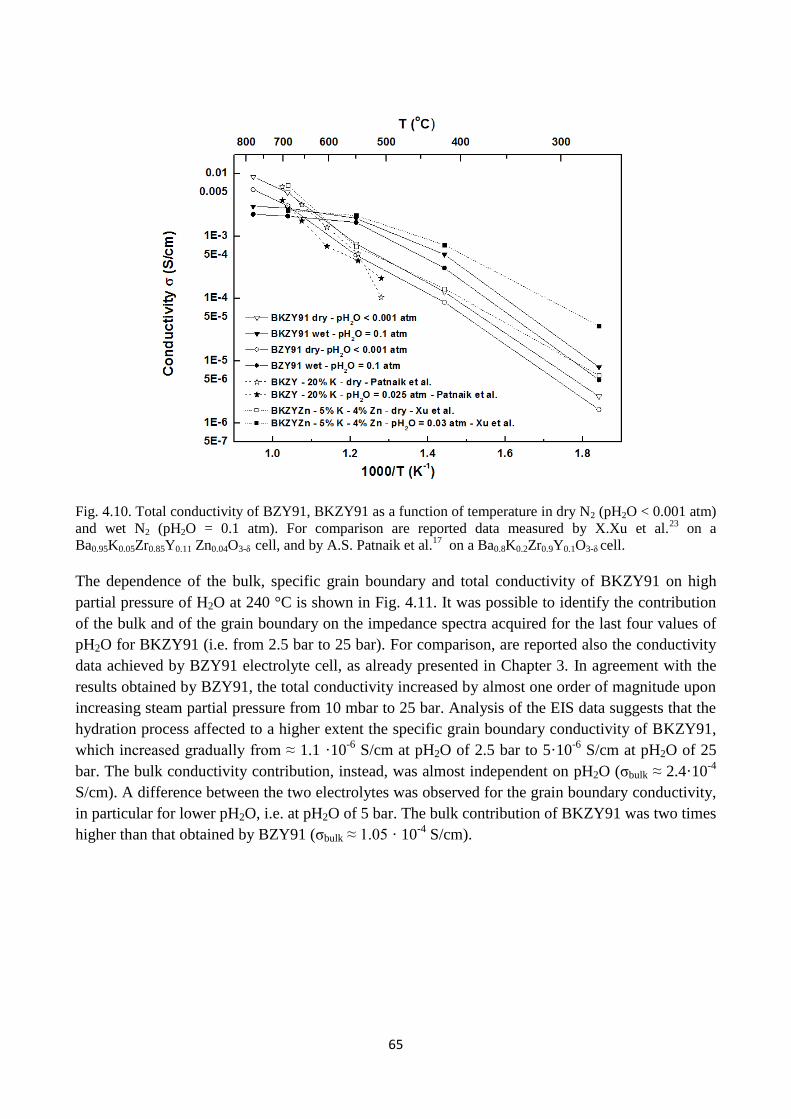
65
Fig. 4.10. Total conductivity of BZY91, BKZY91 as a function of temperature in dry N2 (pH2O < 0.001 atm)
and wet N2 (pH2O = 0.1 atm). For comparison are reported data measured by X.Xu et al.23
on a
Ba0.95K0.05Zr0.85Y0.11 Zn0.04O3-δ cell, and by A.S. Patnaik et al.17
on a Ba0.8K0.2Zr0.9Y0.1O3-δ cell.
The dependence of the bulk, specific grain boundary and total conductivity of BKZY91 on high
partial pressure of H2O at 240 °C is shown in Fig. 4.11. It was possible to identify the contribution
of the bulk and of the grain boundary on the impedance spectra acquired for the last four values of
pH2O for BKZY91 (i.e. from 2.5 bar to 25 bar). For comparison, are reported also the conductivity
data achieved by BZY91 electrolyte cell, as already presented in Chapter 3. In agreement with the
results obtained by BZY91, the total conductivity increased by almost one order of magnitude upon
increasing steam partial pressure from 10 mbar to 25 bar. Analysis of the EIS data suggests that the
hydration process affected to a higher extent the specific grain boundary conductivity of BKZY91,
which increased gradually from ≈ 1.1 ·10-6
S/cm at pH2O of 2.5 bar to 5·10-6
S/cm at pH2O of 25
bar. The bulk conductivity contribution, instead, was almost independent on pH2O (σbulk ≈ 2.4·10-4
S/cm). A difference between the two electrolytes was observed for the grain boundary conductivity,
in particular for lower pH2O, i.e. at pH2O of 5 bar. The bulk contribution of BKZY91 was two times
higher than that obtained by BZY91 (σbulk ≈ 1.05 · 10-4
S/cm).
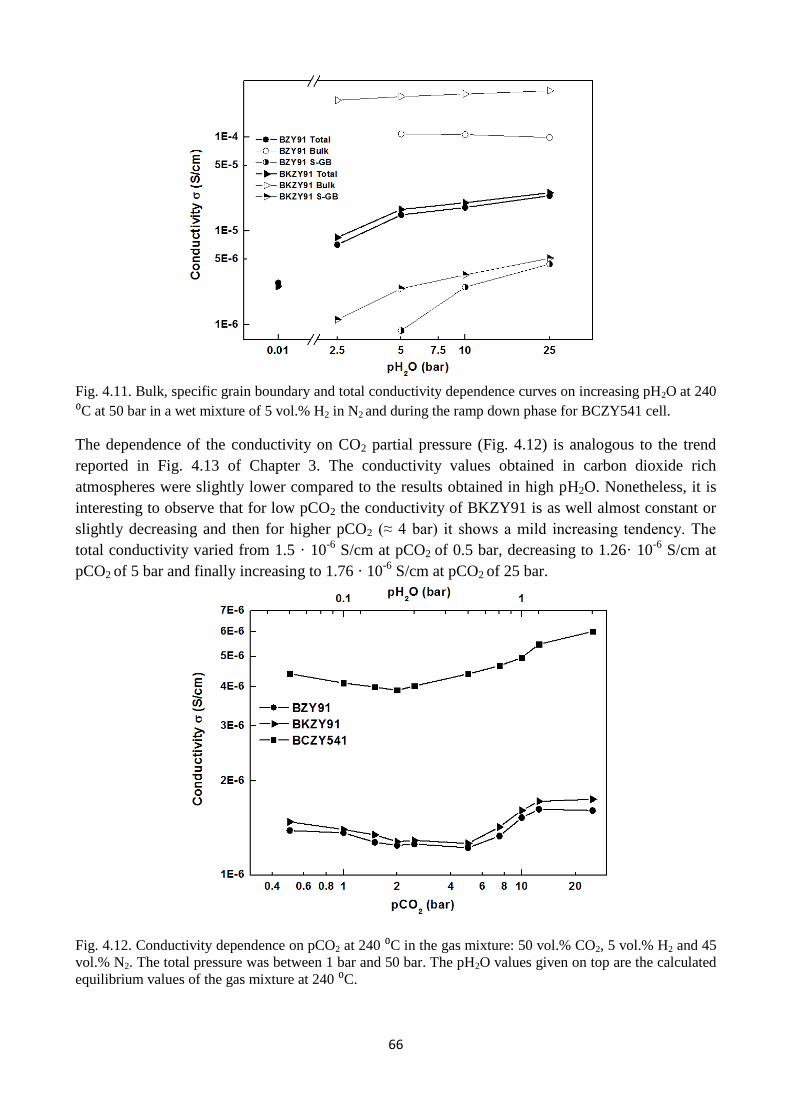
66
Fig. 4.11. Bulk, specific grain boundary and total conductivity dependence curves on increasing pH2O at 240
⁰C at 50 bar in a wet mixture of 5 vol.% H2 in N2 and during the ramp down phase for BCZY541 cell.
The dependence of the conductivity on CO2 partial pressure (Fig. 4.12) is analogous to the trend
reported in Fig. 4.13 of Chapter 3. The conductivity values obtained in carbon dioxide rich
atmospheres were slightly lower compared to the results obtained in high pH2O. Nonetheless, it is
interesting to observe that for low pCO2 the conductivity of BKZY91 is as well almost constant or
slightly decreasing and then for higher pCO2 (≈ 4 bar) it shows a mild increasing tendency. The
total conductivity varied from 1.5 · 10-6
S/cm at pCO2 of 0.5 bar, decreasing to 1.26· 10-6
S/cm at
pCO2 of 5 bar and finally increasing to 1.76 · 10-6
S/cm at pCO2 of 25 bar.
Fig. 4.12. Conductivity dependence on pCO2 at 240 ⁰C in the gas mixture: 50 vol.% CO2, 5 vol.% H2 and 45
vol.% N2. The total pressure was between 1 bar and 50 bar. The pH2O values given on top are the calculated
equilibrium values of the gas mixture at 240 ⁰C.
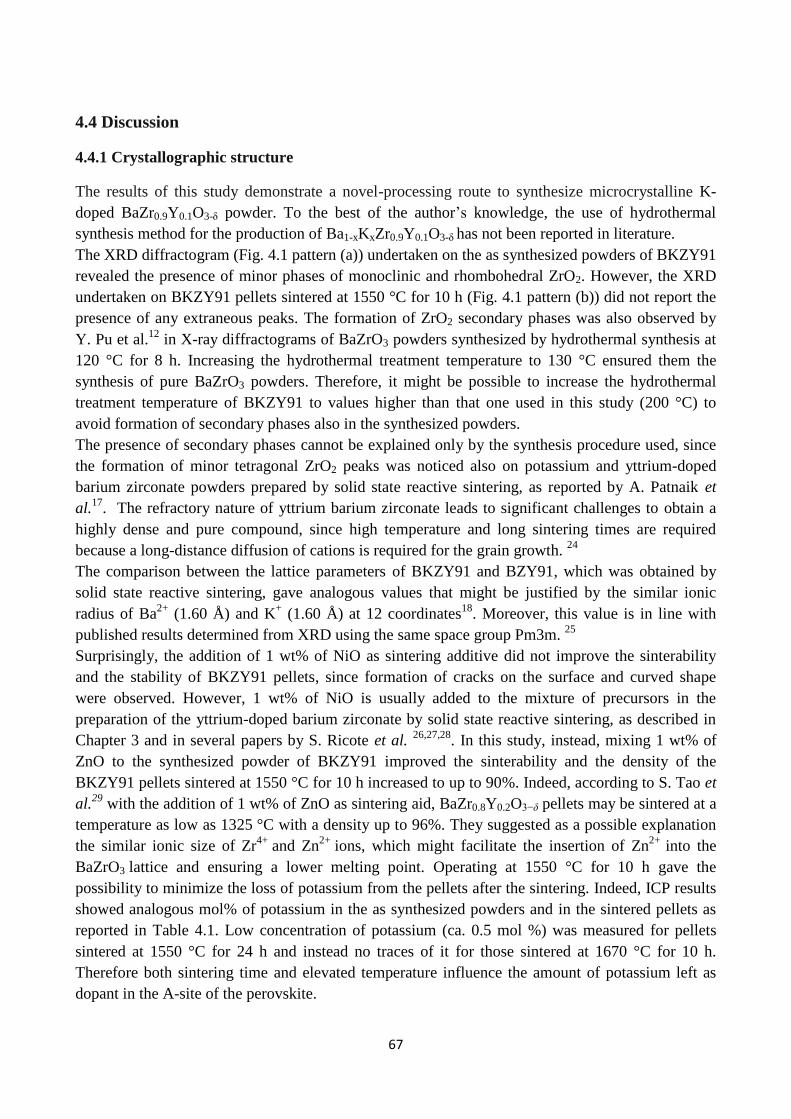
67
4.4 Discussion
4.4.1 Crystallographic structure
The results of this study demonstrate a novel-processing route to synthesize microcrystalline K-
doped BaZr0.9Y0.1O3-δ powder. To the best of the author’s knowledge, the use of hydrothermal
synthesis method for the production of Ba1-xKxZr0.9Y0.1O3-δ has not been reported in literature.
The XRD diffractogram (Fig. 4.1 pattern (a)) undertaken on the as synthesized powders of BKZY91
revealed the presence of minor phases of monoclinic and rhombohedral ZrO2. However, the XRD
undertaken on BKZY91 pellets sintered at 1550 °C for 10 h (Fig. 4.1 pattern (b)) did not report the
presence of any extraneous peaks. The formation of ZrO2 secondary phases was also observed by
Y. Pu et al.12
in X-ray diffractograms of BaZrO3 powders synthesized by hydrothermal synthesis at
120 °C for 8 h. Increasing the hydrothermal treatment temperature to 130 °C ensured them the
synthesis of pure BaZrO3 powders. Therefore, it might be possible to increase the hydrothermal
treatment temperature of BKZY91 to values higher than that one used in this study (200 °C) to
avoid formation of secondary phases also in the synthesized powders.
The presence of secondary phases cannot be explained only by the synthesis procedure used, since
the formation of minor tetragonal ZrO2 peaks was noticed also on potassium and yttrium-doped
barium zirconate powders prepared by solid state reactive sintering, as reported by A. Patnaik et
al.17
. The refractory nature of yttrium barium zirconate leads to significant challenges to obtain a
highly dense and pure compound, since high temperature and long sintering times are required
because a long-distance diffusion of cations is required for the grain growth. 24
The comparison between the lattice parameters of BKZY91 and BZY91, which was obtained by
solid state reactive sintering, gave analogous values that might be justified by the similar ionic
radius of Ba2+
(1.60 Å) and K+ (1.60 Å) at 12 coordinates
18. Moreover, this value is in line with
published results determined from XRD using the same space group Pm3m. 25
Surprisingly, the addition of 1 wt% of NiO as sintering additive did not improve the sinterability
and the stability of BKZY91 pellets, since formation of cracks on the surface and curved shape
were observed. However, 1 wt% of NiO is usually added to the mixture of precursors in the
preparation of the yttrium-doped barium zirconate by solid state reactive sintering, as described in
Chapter 3 and in several papers by S. Ricote et al. 26,27,28
. In this study, instead, mixing 1 wt% of
ZnO to the synthesized powder of BKZY91 improved the sinterability and the density of the
BKZY91 pellets sintered at 1550 °C for 10 h increased to up to 90%. Indeed, according to S. Tao et
al.29
with the addition of 1 wt% of ZnO as sintering aid, BaZr0.8Y0.2O3−δ pellets may be sintered at a
temperature as low as 1325 °C with a density up to 96%. They suggested as a possible explanation
the similar ionic size of Zr4+
and Zn2+
ions, which might facilitate the insertion of Zn2+
into the
BaZrO3 lattice and ensuring a lower melting point. Operating at 1550 °C for 10 h gave the
possibility to minimize the loss of potassium from the pellets after the sintering. Indeed, ICP results
showed analogous mol% of potassium in the as synthesized powders and in the sintered pellets as
reported in Table 4.1. Low concentration of potassium (ca. 0.5 mol %) was measured for pellets
sintered at 1550 °C for 24 h and instead no traces of it for those sintered at 1670 °C for 10 h.
Therefore both sintering time and elevated temperature influence the amount of potassium left as
dopant in the A-site of the perovskite.
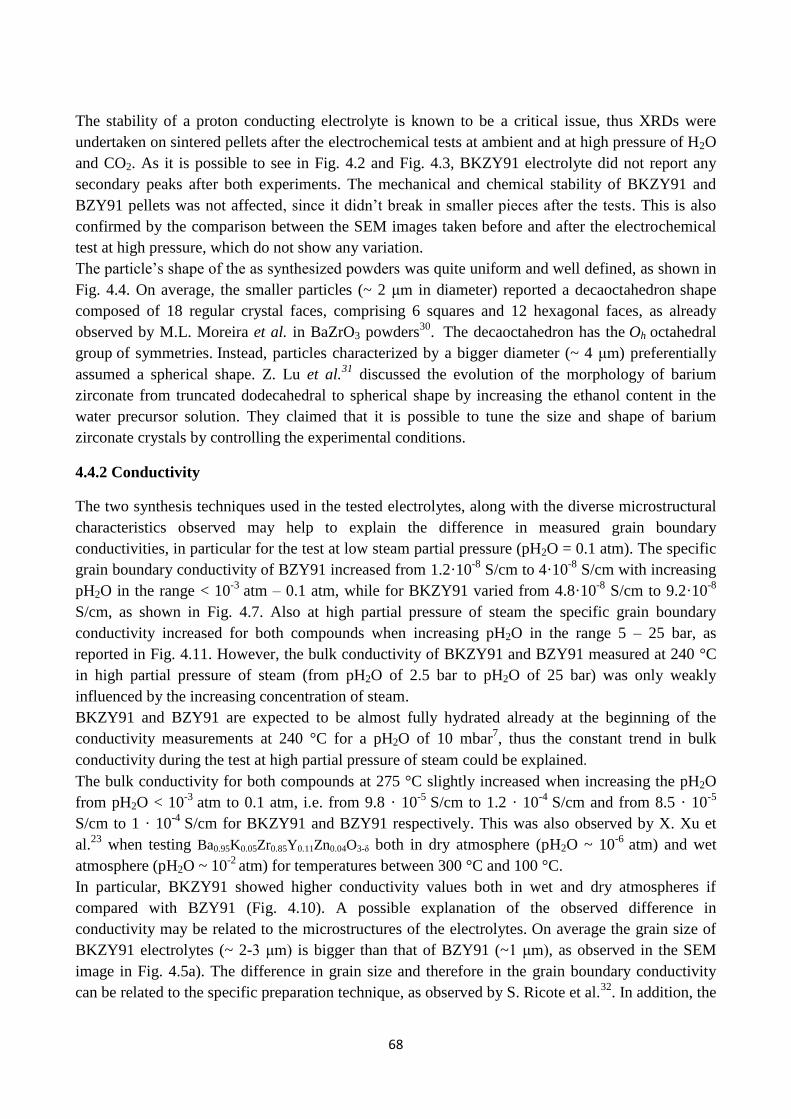
68
The stability of a proton conducting electrolyte is known to be a critical issue, thus XRDs were
undertaken on sintered pellets after the electrochemical tests at ambient and at high pressure of H2O
and CO2. As it is possible to see in Fig. 4.2 and Fig. 4.3, BKZY91 electrolyte did not report any
secondary peaks after both experiments. The mechanical and chemical stability of BKZY91 and
BZY91 pellets was not affected, since it didn’t break in smaller pieces after the tests. This is also
confirmed by the comparison between the SEM images taken before and after the electrochemical
test at high pressure, which do not show any variation.
The particle’s shape of the as synthesized powders was quite uniform and well defined, as shown in
Fig. 4.4. On average, the smaller particles (~ 2 μm in diameter) reported a decaoctahedron shape
composed of 18 regular crystal faces, comprising 6 squares and 12 hexagonal faces, as already
observed by M.L. Moreira et al. in BaZrO3 powders30
. The decaoctahedron has the Oh octahedral
group of symmetries. Instead, particles characterized by a bigger diameter (~ 4 μm) preferentially
assumed a spherical shape. Z. Lu et al.31
discussed the evolution of the morphology of barium
zirconate from truncated dodecahedral to spherical shape by increasing the ethanol content in the
water precursor solution. They claimed that it is possible to tune the size and shape of barium
zirconate crystals by controlling the experimental conditions.
4.4.2 Conductivity
The two synthesis techniques used in the tested electrolytes, along with the diverse microstructural
characteristics observed may help to explain the difference in measured grain boundary
conductivities, in particular for the test at low steam partial pressure (pH2O = 0.1 atm). The specific
grain boundary conductivity of BZY91 increased from 1.2·10-8
S/cm to 4·10-8
S/cm with increasing
pH2O in the range < 10-3
atm – 0.1 atm, while for BKZY91 varied from 4.8·10-8
S/cm to 9.2·10-8
S/cm, as shown in Fig. 4.7. Also at high partial pressure of steam the specific grain boundary
conductivity increased for both compounds when increasing pH2O in the range 5 – 25 bar, as
reported in Fig. 4.11. However, the bulk conductivity of BKZY91 and BZY91 measured at 240 °C
in high partial pressure of steam (from pH2O of 2.5 bar to pH2O of 25 bar) was only weakly
influenced by the increasing concentration of steam.
BKZY91 and BZY91 are expected to be almost fully hydrated already at the beginning of the
conductivity measurements at 240 °C for a pH2O of 10 mbar7, thus the constant trend in bulk
conductivity during the test at high partial pressure of steam could be explained.
The bulk conductivity for both compounds at 275 °C slightly increased when increasing the pH2O
from pH2O < 10-3
atm to 0.1 atm, i.e. from 9.8 · 10-5
S/cm to 1.2 · 10-4
S/cm and from 8.5 · 10-5
S/cm to 1 · 10-4
S/cm for BKZY91 and BZY91 respectively. This was also observed by X. Xu et
al.23
when testing Ba0.95K0.05Zr0.85Y0.11Zn0.04O3-δ both in dry atmosphere (pH2O ~ 10-6
atm) and wet
atmosphere (pH2O ~ 10-2
atm) for temperatures between 300 °C and 100 °C.
In particular, BKZY91 showed higher conductivity values both in wet and dry atmospheres if
compared with BZY91 (Fig. 4.10). A possible explanation of the observed difference in
conductivity may be related to the microstructures of the electrolytes. On average the grain size of
BKZY91 electrolytes (~ 2-3 μm) is bigger than that of BZY91 (~1 μm), as observed in the SEM
image in Fig. 4.5a). The difference in grain size and therefore in the grain boundary conductivity
can be related to the specific preparation technique, as observed by S. Ricote et al.32
. In addition, the
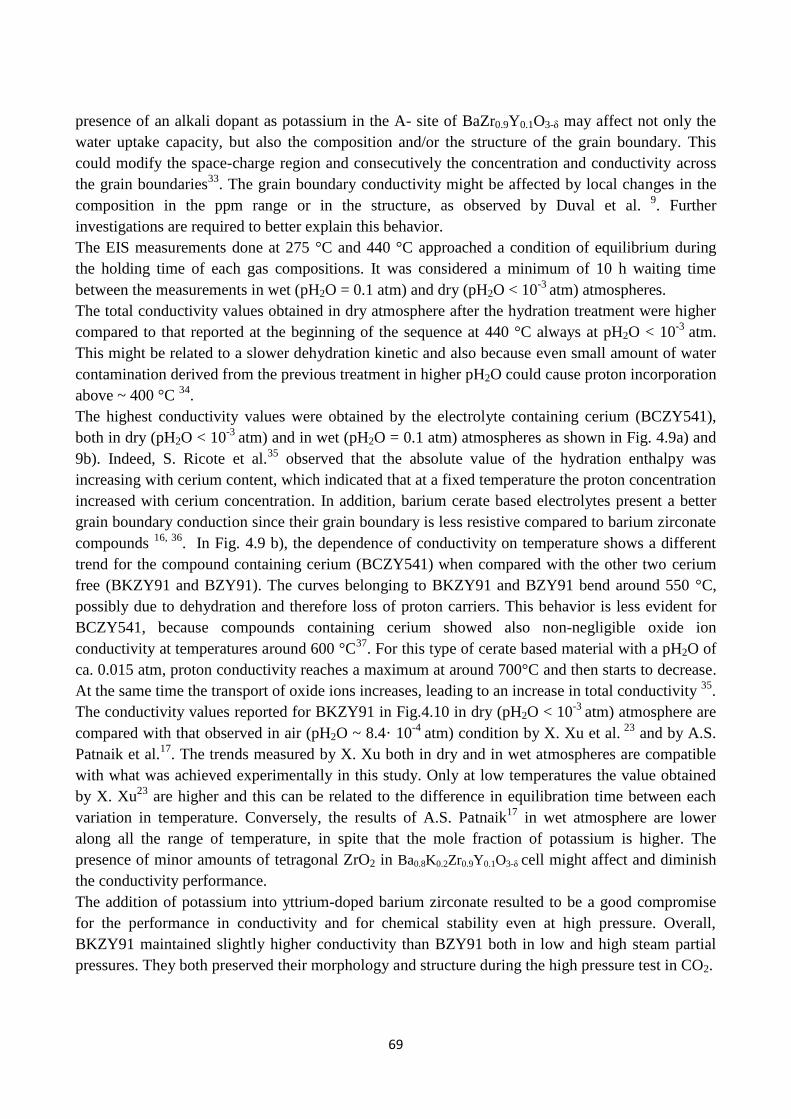
69
presence of an alkali dopant as potassium in the A- site of BaZr0.9Y0.1O3-δ may affect not only the
water uptake capacity, but also the composition and/or the structure of the grain boundary. This
could modify the space-charge region and consecutively the concentration and conductivity across
the grain boundaries33
. The grain boundary conductivity might be affected by local changes in the
composition in the ppm range or in the structure, as observed by Duval et al. 9. Further
investigations are required to better explain this behavior.
The EIS measurements done at 275 °C and 440 °C approached a condition of equilibrium during
the holding time of each gas compositions. It was considered a minimum of 10 h waiting time
between the measurements in wet (pH2O = 0.1 atm) and dry (pH2O < 10-3
atm) atmospheres.
The total conductivity values obtained in dry atmosphere after the hydration treatment were higher
compared to that reported at the beginning of the sequence at 440 °C always at pH2O < 10-3
atm.
This might be related to a slower dehydration kinetic and also because even small amount of water
contamination derived from the previous treatment in higher pH2O could cause proton incorporation
above ~ 400 °C 34
.
The highest conductivity values were obtained by the electrolyte containing cerium (BCZY541),
both in dry (pH2O < 10-3
atm) and in wet (pH2O = 0.1 atm) atmospheres as shown in Fig. 4.9a) and
9b). Indeed, S. Ricote et al.35
observed that the absolute value of the hydration enthalpy was
increasing with cerium content, which indicated that at a fixed temperature the proton concentration
increased with cerium concentration. In addition, barium cerate based electrolytes present a better
grain boundary conduction since their grain boundary is less resistive compared to barium zirconate
compounds 16, 36
. In Fig. 4.9 b), the dependence of conductivity on temperature shows a different
trend for the compound containing cerium (BCZY541) when compared with the other two cerium
free (BKZY91 and BZY91). The curves belonging to BKZY91 and BZY91 bend around 550 °C,
possibly due to dehydration and therefore loss of proton carriers. This behavior is less evident for
BCZY541, because compounds containing cerium showed also non-negligible oxide ion
conductivity at temperatures around 600 °C37
. For this type of cerate based material with a pH2O of
ca. 0.015 atm, proton conductivity reaches a maximum at around 700°C and then starts to decrease.
At the same time the transport of oxide ions increases, leading to an increase in total conductivity 35
.
The conductivity values reported for BKZY91 in Fig.4.10 in dry (pH2O < 10-3
atm) atmosphere are
compared with that observed in air (pH2O ~ 8.4· 10-4
atm) condition by X. Xu et al. 23
and by A.S.
Patnaik et al.17
. The trends measured by X. Xu both in dry and in wet atmospheres are compatible
with what was achieved experimentally in this study. Only at low temperatures the value obtained
by X. Xu23
are higher and this can be related to the difference in equilibration time between each
variation in temperature. Conversely, the results of A.S. Patnaik17
in wet atmosphere are lower
along all the range of temperature, in spite that the mole fraction of potassium is higher. The
presence of minor amounts of tetragonal ZrO2 in Ba0.8K0.2Zr0.9Y0.1O3-δ cell might affect and diminish
the conductivity performance.
The addition of potassium into yttrium-doped barium zirconate resulted to be a good compromise
for the performance in conductivity and for chemical stability even at high pressure. Overall,
BKZY91 maintained slightly higher conductivity than BZY91 both in low and high steam partial
pressures. They both preserved their morphology and structure during the high pressure test in CO2.
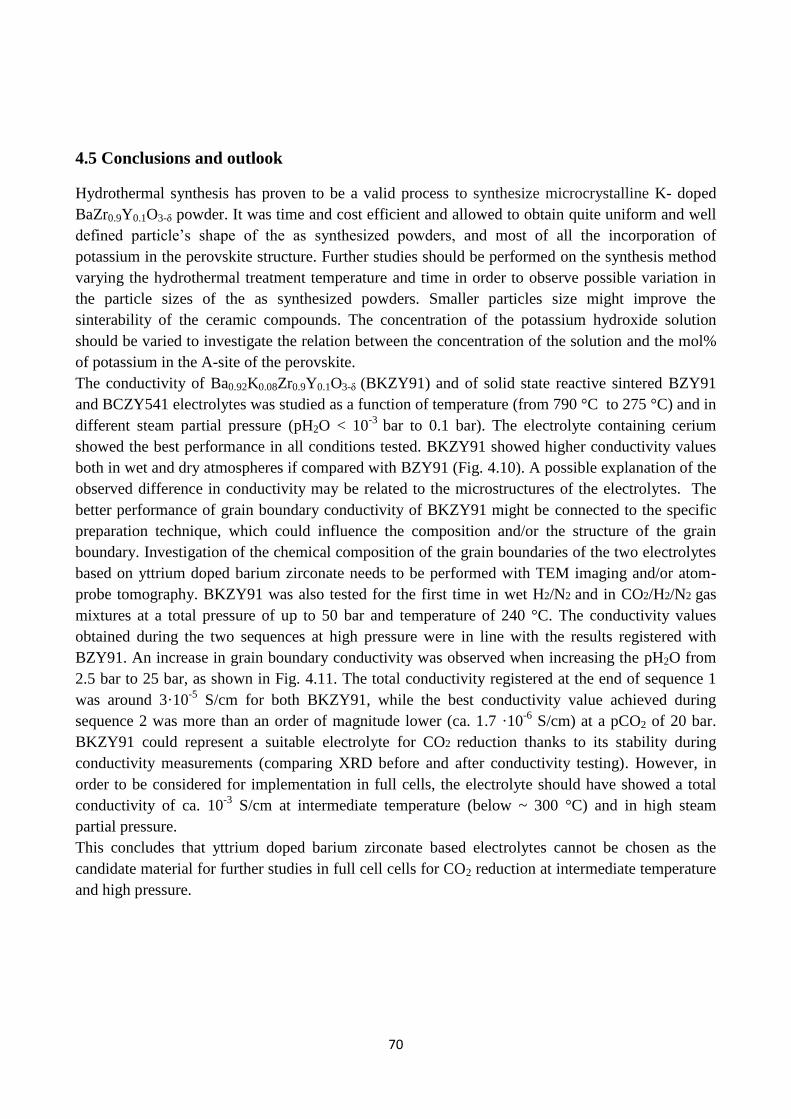
70
4.5 Conclusions and outlook
Hydrothermal synthesis has proven to be a valid process to synthesize microcrystalline K- doped
BaZr0.9Y0.1O3-δ powder. It was time and cost efficient and allowed to obtain quite uniform and well
defined particle’s shape of the as synthesized powders, and most of all the incorporation of
potassium in the perovskite structure. Further studies should be performed on the synthesis method
varying the hydrothermal treatment temperature and time in order to observe possible variation in
the particle sizes of the as synthesized powders. Smaller particles size might improve the
sinterability of the ceramic compounds. The concentration of the potassium hydroxide solution
should be varied to investigate the relation between the concentration of the solution and the mol%
of potassium in the A-site of the perovskite.
The conductivity of Ba0.92K0.08Zr0.9Y0.1O3-δ (BKZY91) and of solid state reactive sintered BZY91
and BCZY541 electrolytes was studied as a function of temperature (from 790 °C to 275 °C) and in
different steam partial pressure (pH2O < 10-3
bar to 0.1 bar). The electrolyte containing cerium
showed the best performance in all conditions tested. BKZY91 showed higher conductivity values
both in wet and dry atmospheres if compared with BZY91 (Fig. 4.10). A possible explanation of the
observed difference in conductivity may be related to the microstructures of the electrolytes. The
better performance of grain boundary conductivity of BKZY91 might be connected to the specific
preparation technique, which could influence the composition and/or the structure of the grain
boundary. Investigation of the chemical composition of the grain boundaries of the two electrolytes
based on yttrium doped barium zirconate needs to be performed with TEM imaging and/or atom-
probe tomography. BKZY91 was also tested for the first time in wet H2/N2 and in CO2/H2/N2 gas
mixtures at a total pressure of up to 50 bar and temperature of 240 °C. The conductivity values
obtained during the two sequences at high pressure were in line with the results registered with
BZY91. An increase in grain boundary conductivity was observed when increasing the pH2O from
2.5 bar to 25 bar, as shown in Fig. 4.11. The total conductivity registered at the end of sequence 1
was around 3·10-5
S/cm for both BKZY91, while the best conductivity value achieved during
sequence 2 was more than an order of magnitude lower (ca. 1.7 ·10-6
S/cm) at a pCO2 of 20 bar.
BKZY91 could represent a suitable electrolyte for CO2 reduction thanks to its stability during
conductivity measurements (comparing XRD before and after conductivity testing). However, in
order to be considered for implementation in full cells, the electrolyte should have showed a total
conductivity of ca. 10-3
S/cm at intermediate temperature (below ~ 300 °C) and in high steam
partial pressure.
This concludes that yttrium doped barium zirconate based electrolytes cannot be chosen as the
candidate material for further studies in full cell cells for CO2 reduction at intermediate temperature
and high pressure.
71
References
1 H. Iwahara, Solid State Ionics, 86-88 (1996) 9.
2 T. Norby, Solid State Ionics, 125 (1999) 1.
3 H. Iwahara, H. Uchida, I. Yamasaki, International Journal of Hydrogen Energy, 12 (2) (1987) 73-
77. 4 W. Grover Coors, Journal of the Electrochemical Society, 151 (7) (2004) A994-A997.
5 K. Xie, Y. Zhang, G. Meng, J. T. S. Irvine, Journal of Material Chemistry, 21 (2011) 195.
6 E. Fabbri, A. D’Epifanio, E. Di Bartolomeo, S. Licoccia, E. Traversa, Solid state ionics, 179
(2008) 558. 7 K. D. Kreuer, Annual Review of Material Research, 33 (2003) 333.
8 Y. Yamazaki, R. Hernandez-Sanchez, S.M. Haile, Chemistry of Materials, 21 (2009) 2755.
9 S.B.C. Duval, P. Holtappels, U.F. Vogt, E. Pomjakushina, K. Conder, U. Stimmimg and T.
Grauele, Solid state Ionics, 178 (2007) 1437. 10
P. Babilo and S.M. Haile, Journal of American Ceramic Society, 88 (2009) 2362. 11
J. Tong, D. Clark, M. Hoban, R. O’Hayre, Solid State Ionics, 181, 2010, 496. 12
Y. Pu, H. Wu, K. Chen, Advanced Materials research 156 (2011) 988-991. 13
S. Bhowmick, J. Basu, Y. Xue, C. Barry Carter, Journal of American Ceramic Society, 93 (2010)
4041-4046. 14
H.L. Lin, R.K. Chiang, C.L. Kuo, C.W. Chang, Journal of non-crystalline solids, 353 (2007)
1188-1194. 15
K.D. Kreuer, Solid state ionics, 97 (1997) 1. 16
T. Norby, M. Wideroe, R. Glockner, Y. Larring, Journal chemical society, Dalton transaction,
(2004) 3012. 17
A. S. Patnaik, A. V. Virkar, Journal of Electrochemical Society, 153 (2006) 1397-1405. 18
R.D. Shannon, C.T. Prewitt, Acta crystallographica, B 25 (1969) 925. 19
C. Chatzichristodoulou, F. Allebrod, and M. Mogensen, Review of Scientific Instruments, 84
(2013) 054101. 20
https://www-s.nist.gov/srmors/certificates/archive/640c.pdf 21
J. R. Macdonald, Solid State Ionics, 13 (1984) 147. 22
J.R. MacDonald, E. Barsoukov, Impedance Spectroscopy, J. R. MacDonald, Wiley and Sons,
Second Edition, New York, 2005. 23
X. Xu, S. Tao, J.T.S. Irvine, Journal of Solid State Chemistry, 183 (2010) 93-98. 24
S. Imashuku, T. Uda, Y. Nose, and Y. Awakura, Journal of phase equilibria and diffusion, 31
(2010) 348-356. 25
C.D. Savaniu, J. Canales-Vazquez, J.T.S. Irvine, Journal of Material Chemistry, 15 (2005) 598. 26
S. Ricote, N. Bonanos, Solid State Ionics, 181 (2010) 694 – 700. 27
S. Ricote, N. Bonanos, A. Manerbino, W.G. Coors, International Journal of Hydrogen Energy 37
(2012) 7954-7961. 28
S. Ricote, N. Bonanos, P.M. Rørvik, C. Haavik, Journal of Power Sources, 209 (2012) 172-179. 29
S. Tao, J.T.S. Irvine, Journal of Solid State Chemistry, 180, (2007), 3493-3503.

72
30
M. L. Moreira, J. Andres, J. A. Varela and E. Longo, Crystal growth & design, 9 (2009) 833-839. 31
Z. Lu, Y. Tang, L. Chen and Y. Li, Journal of Crystal growth 266 (2004) 539-544. 32
S. Ricote, N. Bonanos, A. Manerbino, N. P. Sullivan and W.G. Coors, Journal of Materials
chemistry A, 2, 2014, 16107. 33
M. Shirpour, B. Rahmati, W. Sigle, P. A van Aken, R. Merkle, J. Maier, The Journal of physical
chemistry C, 116 (2012) 2453-2461. 34
H. G. Bohn, T. Schober, Journal of American Ceramic Society, 83, 2000, 768. 35
S. Ricote, N. Bonanos and G. Caboche, Solid State Ionics, 180 (2009) 990-997. 36
K. H. Ryu, S. M. Haile, Solid State Ionics, 125 (1999) 355 – 367. 37
S. Ricote, N. Bonanos, H. J. Wang, R. Haugsrud, Solid State Ionics, 185 (2011) 11-17.
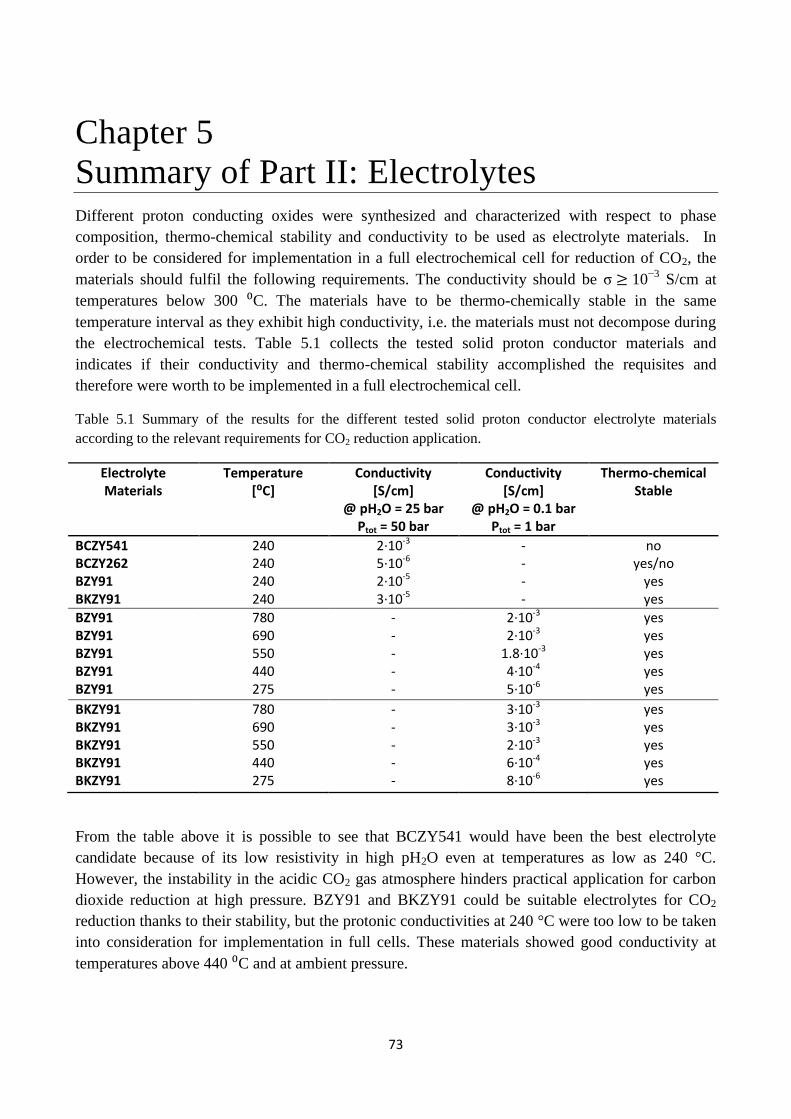
73
Chapter 5
Summary of Part II: Electrolytes Different proton conducting oxides were synthesized and characterized with respect to phase
composition, thermo-chemical stability and conductivity to be used as electrolyte materials. In
order to be considered for implementation in a full electrochemical cell for reduction of CO2, the
materials should fulfil the following requirements. The conductivity should be σ ≥ 10−3
S/cm at
temperatures below 300 ⁰C. The materials have to be thermo-chemically stable in the same
temperature interval as they exhibit high conductivity, i.e. the materials must not decompose during
the electrochemical tests. Table 5.1 collects the tested solid proton conductor materials and
indicates if their conductivity and thermo-chemical stability accomplished the requisites and
therefore were worth to be implemented in a full electrochemical cell.
Table 5.1 Summary of the results for the different tested solid proton conductor electrolyte materials
according to the relevant requirements for CO2 reduction application.
Electrolyte Materials
Temperature [⁰C]
Conductivity [S/cm]
@ pH2O = 25 bar Ptot = 50 bar
Conductivity [S/cm]
@ pH2O = 0.1 bar Ptot = 1 bar
Thermo-chemical Stable
BCZY541 BCZY262
240 240
2·10-3 5·10-6
- -
no yes/no
BZY91 240 2·10-5 - yes BKZY91 240 3·10-5 - yes
BZY91 780 - 2·10-3 yes BZY91 690 - 2·10-3 yes BZY91 550 - 1.8·10-3 yes BZY91 440 - 4·10-4 yes BZY91 275 - 5·10-6 yes
BKZY91 BKZY91 BKZY91 BKZY91 BKZY91
780 690 550 440 275
- - - - -
3·10-3
3·10-3 2·10-3
6·10-4 8·10-6
yes yes yes yes yes
From the table above it is possible to see that BCZY541 would have been the best electrolyte
candidate because of its low resistivity in high pH2O even at temperatures as low as 240 °C.
However, the instability in the acidic CO2 gas atmosphere hinders practical application for carbon
dioxide reduction at high pressure. BZY91 and BKZY91 could be suitable electrolytes for CO2
reduction thanks to their stability, but the protonic conductivities at 240 °C were too low to be taken
into consideration for implementation in full cells. These materials showed good conductivity at
temperatures above 440 ⁰C and at ambient pressure.
74
The study of proton conducting Y-doped BaCeO3-BaZrO3 solid solutions did not provide a clear
electrolyte candidate, therefore aqueous alkaline based electrolytes were considered. As mentioned
in Chapter 2, KHCO3 is a well-known electrolyte for reduction of CO2 both in ambient conditions
and at elevated pressures1. Therefore it could represent a valid candidate as electrolyte.
In addition, P.L. Mollerup2 investigated the potential of immobilized aqueous K2CO3 as a possible
electrolyte for co-electrolysis of CO2 and water at ca. 200 ⁰C. This was done by studying the
properties of pure aqueous K2CO3 and immobilized aqueous K2CO3 in porous ceramic matrixes. As
shown in Fig. 2.2 and Fig. 2.4 the conductivities of both pure aqueous 10 wt% K2CO3 and
immobilized 10 wt% aqueous K2CO3 were much higher than 10−3
S/cm at temperature below 200
⁰C and at 30 bar pressure. The lowest ionic conductivity value of 10 wt% aqueous K2CO3
immobilized in a porous SrTiO3 pellet was ca. 0.05 S/cm at room temperature and at 30 bar
pressure.
In conclusion, aqueous KHCO3 and K2CO3 were the most promising electrolytes compared to the
materials evaluated in Part II, and were therefore chosen as electrolytes for further studies in full
electrochemical cells.
References
1 Y. Hori, in Modern aspects of electrochemistry, ed. C. Vayenas, R. White, and M. Gamboa-
Aldeco, Springer, New York, 2008, vol. 42, pp. 89-189. 2 Pia Lolk Mollerup, “New Electrolytes for CO2 Electrolysis cells”, Department of Energy
Conversion and Storage, Technical University of Denmark, December 2012.

75
Part III
ELECTRODES and CELL DEVELOPMENT
76
Chapter 6
CO2 reduction on copper foam
electrocatalyst at room temperature and
ambient pressure. Copper is the commonly used carbon dioxide reduction catalyst, and therefore a reasonable first
candidate for this electrocatalyst screening analysis. CO2 reduction reaction was studied on copper
foam electrode in aqueous media (0.1 M KHCO3 electrolyte) and at ambient condition. The
identification and quantification of the reduction products as a function of the applied potential was
the main focus of this Chapter.
Abstract
The potential dependent activity and selectivity of the electrochemical reduction of CO2 on metallic
copper foam surfaces was investigated under ambient conditions. This was enabled by the
utilization of highly sensitive experimental methods for the identification and quantification of CO2
electroreduction products. Copper foam was analysed across a range of potentials and it was
observed a total of seven different CO2 reduction products. In this study it is shown that both the
number of products formed and their faradaic efficiencies differ from those obtained at smooth
electropolished copper foil electrodes.
6.1 Introduction
As mentioned in Chapter 2, copper metal is the only known material capable of catalysing the
formation of relevant quantities of hydrocarbons at high reaction rates over prolonged periods of
time. On the other hand, a cathodic overpotential of ca. 1 V is necessary to obtain a wide variety of
major and minor products such as formic acid, carbon monoxide, methane and alcohols at room
temperatures and ambient pressure. In all cases aqueous inorganic salt solutions were utilized as the
electrolyte1,2,3,4
. The products distribution is largely related to the overpotential at the cathode
copper electrode. Indeed hydrogen evolution is the main reaction taking place at lower
overpotentials (-0.8 to -1 V vs. NHE), while for more negative overpotentials CO, hydrocarbons
and alcohols are produced 1,5
.
The overall chemical reaction taking place in the electrochemical device is:
𝐶𝑂2 + 𝐻2𝑂 → 𝐶𝑥𝐻𝑦𝑂𝑧 + 𝑂2 (6.1)
It represents the sum of two electrochemical half reactions. Water oxidation (oxygen evolution
reaction, OER) taking place at the anode:
𝐻2𝑂 → 𝑂2 + 4𝐻+ + 4𝑒− (6.2)
77
And carbon dioxide reduction taking place at the cathode:
𝐶𝑂2 + 8𝐻+ + 8𝑒− → 𝐶𝐻4 + 2𝐻2𝑂 (6.3)
𝐶𝑂2 + 6𝐻+ + 6𝑒− → 𝐶𝐻3𝑂𝐻 + 2𝐻2𝑂 (6.4)
𝐶𝑂2 + 2𝐻+ + 2𝑒− → 𝐶𝑂 + 𝐻2𝑂 (6.5)
At the cathode electrode also the undesired hydrogen evolution reaction takes place (Eq. 6.6) since
it is kinetically favoured compared to the other reactions.
2𝐻+ + 2𝑒− → 𝐻2 (6.6)
Platinum foil was used for the anode, since it is a well-known and widely studied catalyst both for
the oxygen evolution reaction6 , 7
and the oxygen reduction reaction8. While both the oxygen
evolution reaction and the carbon dioxide reaction are necessary, this study focused only on the
carbon dioxide reduction.
In this Chapter, the electrocatalytic activity of copper foam was investigated in aqueous media and
at ambient condition for electrochemical reduction of CO2. It represents a fundamental study of the
copper foam electrode. The measurements were conducted at the laboratory of Prof. Thomas F.
Jaramillo (Stanford University – Chemical Engineering Department), where it was possible to
utilize an experimental setup with high detection sensitivity for minor products from the CO2
reduction reaction. In particular, the results obtained with copper foam cathode electrode were
compared to those reported on copper foil by K. Kuhl et al.9 with the same electrochemical device.
6.2 Experimental
The electrochemical experiments were performed in a custom made two compartment electrolysis
cell of polycarbonate which has been previously described by Kuhl et al.9, shown in Fig. 6.1. The
structure of the cell kept the working electrode parallel to the counter electrode to obtain a uniform
voltage. The compartments were divided by an anion exchange membrane (Selemion AMV, AGC
inc.) to reduce the transport of liquid phase products from the cathode electrode to the anode where
they could be oxidized. The surface area of the electrocatalyst was of 4.5 cm2 (3 cm x 1.5 cm) and
the cell was designed to have a small electrolyte volume (8 ml) in each of the two compartments, a
gas volume of ca. 3 ml above the electrolyte on each side of the membrane. The electrolyte was
constituted by 0.1 M KHCO3 (Sigma-Aldrich, 99.99% metals basis) and 20 ml/min of CO2 was
constantly flowing through the electrolyte during the electrolysis test. 30 minutes prior to start the
experiments, CO2 was flown through the electrolyte to obtain a stable pH of 6.8. This value was
measured both before and after the electrochemical test. The gas outlet from the cathode electrode
compartment was connected to a gas chromatograph (GC, SRI 8610C in the Multi-Gas #3
configuration) to analyze the gas phase products. For each electrolysis test the cell was constituted
by copper foam (MMC Superalloy. 0.5 mm) as working electrode and platinum foil as counter
electrode. As reference electrode an Ag/AgCl electrode (Accumet) was utilized. An aluminium foil
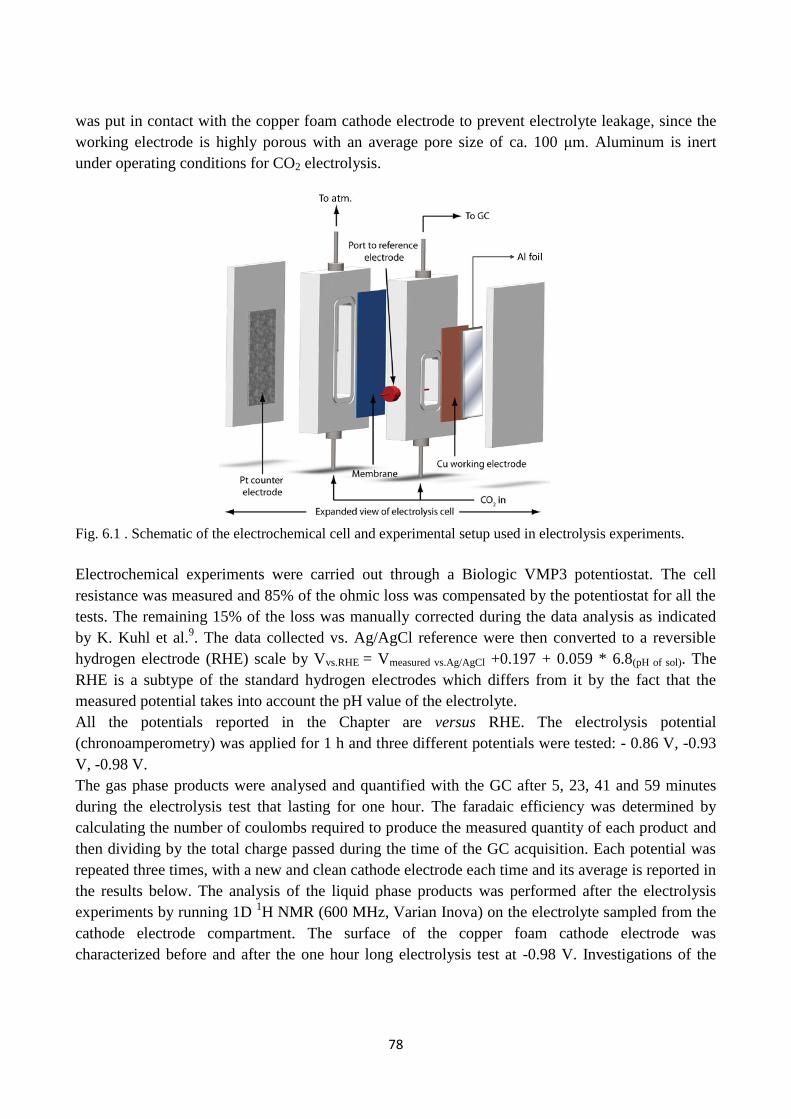
78
was put in contact with the copper foam cathode electrode to prevent electrolyte leakage, since the
working electrode is highly porous with an average pore size of ca. 100 μm. Aluminum is inert
under operating conditions for CO2 electrolysis.
Fig. 6.1 . Schematic of the electrochemical cell and experimental setup used in electrolysis experiments.
Electrochemical experiments were carried out through a Biologic VMP3 potentiostat. The cell
resistance was measured and 85% of the ohmic loss was compensated by the potentiostat for all the
tests. The remaining 15% of the loss was manually corrected during the data analysis as indicated
by K. Kuhl et al.9. The data collected vs. Ag/AgCl reference were then converted to a reversible
hydrogen electrode (RHE) scale by Vvs.RHE = Vmeasured vs.Ag/AgCl +0.197 + 0.059 * 6.8(pH of sol). The
RHE is a subtype of the standard hydrogen electrodes which differs from it by the fact that the
measured potential takes into account the pH value of the electrolyte.
All the potentials reported in the Chapter are versus RHE. The electrolysis potential
(chronoamperometry) was applied for 1 h and three different potentials were tested: - 0.86 V, -0.93
V, -0.98 V.
The gas phase products were analysed and quantified with the GC after 5, 23, 41 and 59 minutes
during the electrolysis test that lasting for one hour. The faradaic efficiency was determined by
calculating the number of coulombs required to produce the measured quantity of each product and
then dividing by the total charge passed during the time of the GC acquisition. Each potential was
repeated three times, with a new and clean cathode electrode each time and its average is reported in
the results below. The analysis of the liquid phase products was performed after the electrolysis
experiments by running 1D 1H NMR (600 MHz, Varian Inova) on the electrolyte sampled from the
cathode electrode compartment. The surface of the copper foam cathode electrode was
characterized before and after the one hour long electrolysis test at -0.98 V. Investigations of the
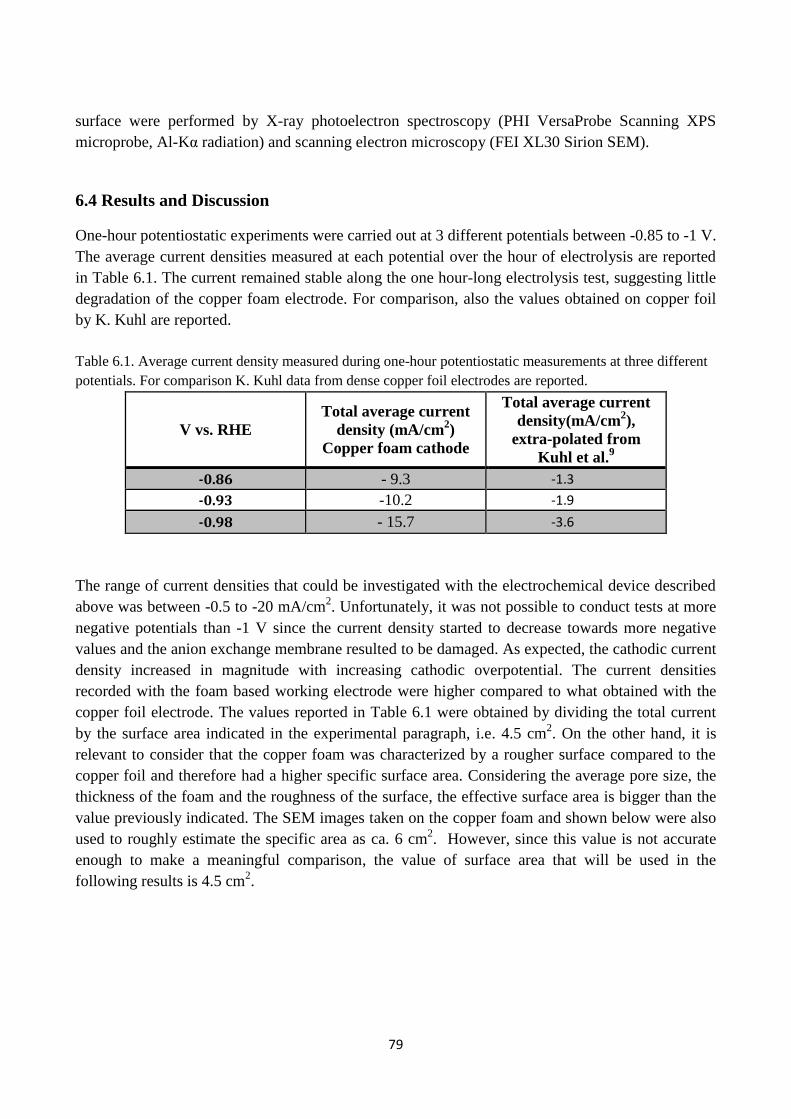
79
surface were performed by X-ray photoelectron spectroscopy (PHI VersaProbe Scanning XPS
microprobe, Al-Kα radiation) and scanning electron microscopy (FEI XL30 Sirion SEM).
6.4 Results and Discussion
One-hour potentiostatic experiments were carried out at 3 different potentials between -0.85 to -1 V.
The average current densities measured at each potential over the hour of electrolysis are reported
in Table 6.1. The current remained stable along the one hour-long electrolysis test, suggesting little
degradation of the copper foam electrode. For comparison, also the values obtained on copper foil
by K. Kuhl are reported.
Table 6.1. Average current density measured during one-hour potentiostatic measurements at three different
potentials. For comparison K. Kuhl data from dense copper foil electrodes are reported.
V vs. RHE
Total average current
density (mA/cm2)
Copper foam cathode
Total average current
density(mA/cm2),
extra-polated from
Kuhl et al.9
-0.86 - 9.3 -1.3
-0.93 -10.2 -1.9
-0.98 - 15.7 -3.6
The range of current densities that could be investigated with the electrochemical device described
above was between -0.5 to -20 mA/cm2. Unfortunately, it was not possible to conduct tests at more
negative potentials than -1 V since the current density started to decrease towards more negative
values and the anion exchange membrane resulted to be damaged. As expected, the cathodic current
density increased in magnitude with increasing cathodic overpotential. The current densities
recorded with the foam based working electrode were higher compared to what obtained with the
copper foil electrode. The values reported in Table 6.1 were obtained by dividing the total current
by the surface area indicated in the experimental paragraph, i.e. 4.5 cm2. On the other hand, it is
relevant to consider that the copper foam was characterized by a rougher surface compared to the
copper foil and therefore had a higher specific surface area. Considering the average pore size, the
thickness of the foam and the roughness of the surface, the effective surface area is bigger than the
value previously indicated. The SEM images taken on the copper foam and shown below were also
used to roughly estimate the specific area as ca. 6 cm2. However, since this value is not accurate
enough to make a meaningful comparison, the value of surface area that will be used in the
following results is 4.5 cm2.
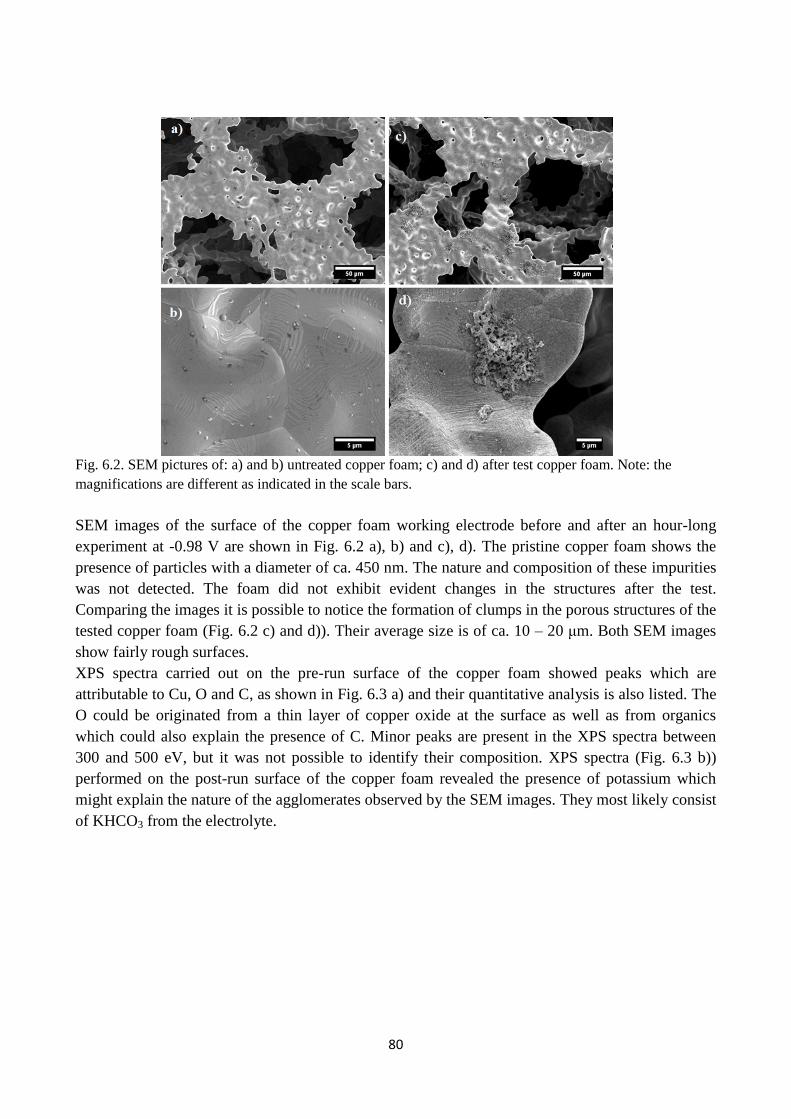
80
Fig. 6.2. SEM pictures of: a) and b) untreated copper foam; c) and d) after test copper foam. Note: the
magnifications are different as indicated in the scale bars.
SEM images of the surface of the copper foam working electrode before and after an hour-long
experiment at -0.98 V are shown in Fig. 6.2 a), b) and c), d). The pristine copper foam shows the
presence of particles with a diameter of ca. 450 nm. The nature and composition of these impurities
was not detected. The foam did not exhibit evident changes in the structures after the test.
Comparing the images it is possible to notice the formation of clumps in the porous structures of the
tested copper foam (Fig. 6.2 c) and d)). Their average size is of ca. 10 – 20 μm. Both SEM images
show fairly rough surfaces.
XPS spectra carried out on the pre-run surface of the copper foam showed peaks which are
attributable to Cu, O and C, as shown in Fig. 6.3 a) and their quantitative analysis is also listed. The
O could be originated from a thin layer of copper oxide at the surface as well as from organics
which could also explain the presence of C. Minor peaks are present in the XPS spectra between
300 and 500 eV, but it was not possible to identify their composition. XPS spectra (Fig. 6.3 b))
performed on the post-run surface of the copper foam revealed the presence of potassium which
might explain the nature of the agglomerates observed by the SEM images. They most likely consist
of KHCO3 from the electrolyte.
81
Fig. 6.3. XPS spectra of the copper surface: a) before the electrolysis experiment and b) after the electrolysis
experiment at -0.98 V vs. RHE.
During the CO2 electrolysis experiments, a total of seven reduction products were identified. The
major products were H2 and formate followed by CO, and interestingly four different minor
products were detected: methane, methanol, ethylene and ethylene glycol. The faradaic efficiency
of each product as a function of potential is reported in Fig. 6.4. For all the three potentials
investigated the highest faradaic efficiency recorded was for H2, with an almost constant trend close
to 90 %. The data were compared with previously reported data from K. Kuhl et al. as shown as
well in Fig. 6.4.
The faradaic efficiency of H2 obtained with the copper foil cathode was significantly lower and it
decreased moving towards more negative potentials, i.e. from ca. 45 % to 25 %. On the other hand,
the faradaic efficiencies of formate, CO and methane obtained with the copper foil were higher,
when compared to the copper foam electrode.
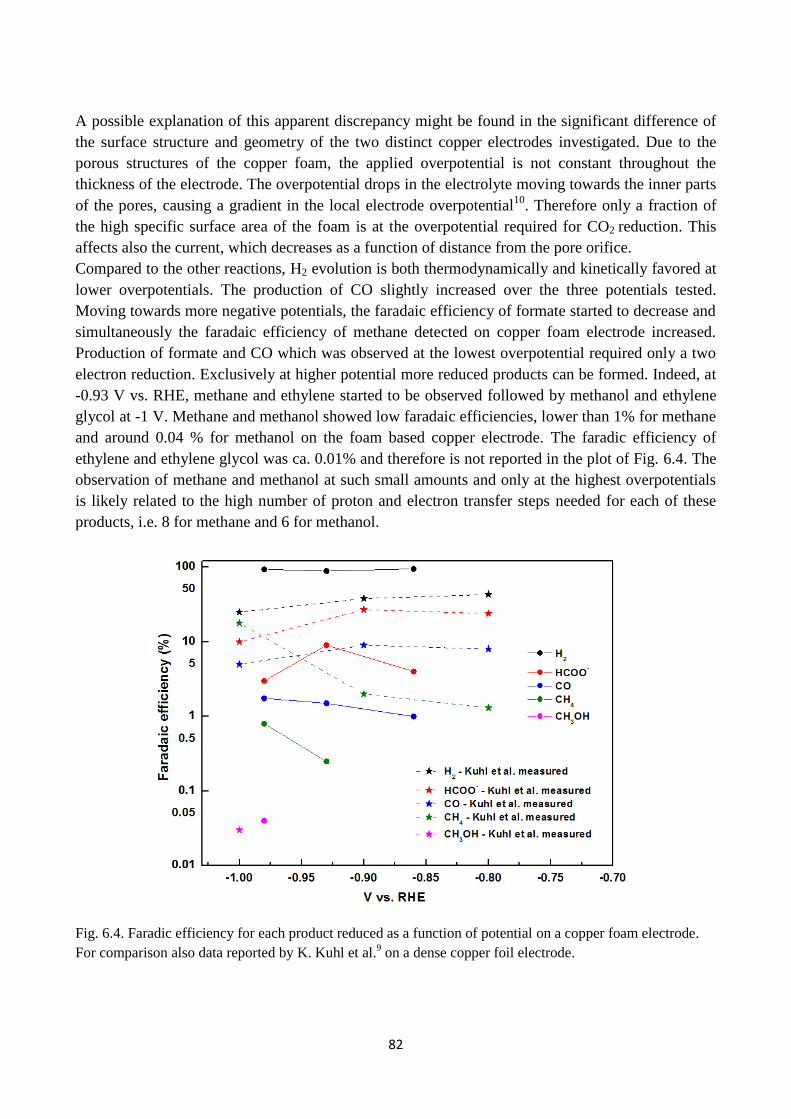
82
A possible explanation of this apparent discrepancy might be found in the significant difference of
the surface structure and geometry of the two distinct copper electrodes investigated. Due to the
porous structures of the copper foam, the applied overpotential is not constant throughout the
thickness of the electrode. The overpotential drops in the electrolyte moving towards the inner parts
of the pores, causing a gradient in the local electrode overpotential10
. Therefore only a fraction of
the high specific surface area of the foam is at the overpotential required for CO2 reduction. This
affects also the current, which decreases as a function of distance from the pore orifice.
Compared to the other reactions, H2 evolution is both thermodynamically and kinetically favored at
lower overpotentials. The production of CO slightly increased over the three potentials tested.
Moving towards more negative potentials, the faradaic efficiency of formate started to decrease and
simultaneously the faradaic efficiency of methane detected on copper foam electrode increased.
Production of formate and CO which was observed at the lowest overpotential required only a two
electron reduction. Exclusively at higher potential more reduced products can be formed. Indeed, at
-0.93 V vs. RHE, methane and ethylene started to be observed followed by methanol and ethylene
glycol at -1 V. Methane and methanol showed low faradaic efficiencies, lower than 1% for methane
and around 0.04 % for methanol on the foam based copper electrode. The faradic efficiency of
ethylene and ethylene glycol was ca. 0.01% and therefore is not reported in the plot of Fig. 6.4. The
observation of methane and methanol at such small amounts and only at the highest overpotentials
is likely related to the high number of proton and electron transfer steps needed for each of these
products, i.e. 8 for methane and 6 for methanol.
Fig. 6.4. Faradic efficiency for each product reduced as a function of potential on a copper foam electrode.
For comparison also data reported by K. Kuhl et al.9 on a dense copper foil electrode.
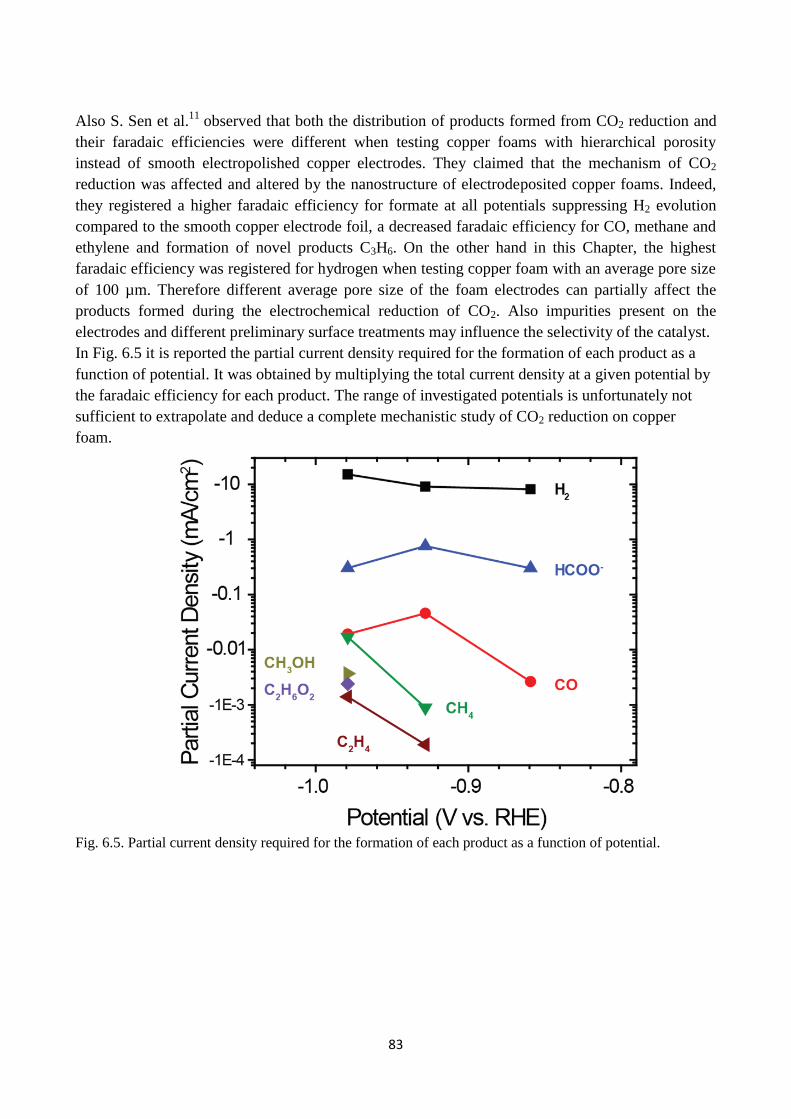
83
Also S. Sen et al.11
observed that both the distribution of products formed from CO2 reduction and
their faradaic efficiencies were different when testing copper foams with hierarchical porosity
instead of smooth electropolished copper electrodes. They claimed that the mechanism of CO2
reduction was affected and altered by the nanostructure of electrodeposited copper foams. Indeed,
they registered a higher faradaic efficiency for formate at all potentials suppressing H2 evolution
compared to the smooth copper electrode foil, a decreased faradaic efficiency for CO, methane and
ethylene and formation of novel products C3H6. On the other hand in this Chapter, the highest
faradaic efficiency was registered for hydrogen when testing copper foam with an average pore size
of 100 µm. Therefore different average pore size of the foam electrodes can partially affect the
products formed during the electrochemical reduction of CO2. Also impurities present on the
electrodes and different preliminary surface treatments may influence the selectivity of the catalyst.
In Fig. 6.5 it is reported the partial current density required for the formation of each product as a
function of potential. It was obtained by multiplying the total current density at a given potential by
the faradaic efficiency for each product. The range of investigated potentials is unfortunately not
sufficient to extrapolate and deduce a complete mechanistic study of CO2 reduction on copper
foam.
Fig. 6.5. Partial current density required for the formation of each product as a function of potential.
84
6.4 Conclusions
The aim of this study was to analyse the dependence of the applied potential on the catalytic activity
of copper foams during CO2 reduction at ambient conditions. In addition, a comparison between
copper foam and a smooth electropolished copper electrode regarding the distribution of products
formed from this reaction and their faradaic efficiencies was carried out.
The different roughness of the two electrode surfaces affected the current densities registered during
the one hour long potentiostatic experiments. The current densities acquired on copper foams are ca.
5 times higher than the values obtained at the same potentials with smooth copper foil electrodes.
Accurate Brunauer–Emmett–Teller (BET) measurements of the effective surface area of copper
foams are necessary to establish a fundamental comparison, i.e. is this a pure effect of surface area
or is it also due to differences in surface structures. Traces of impurities on pristine copper foam
electrodes, observed through XPS studies, suggest the need of improving and implementing
cleaning procedures before the electrolysis tests. Seven products were identified on the copper foam
electrode tested up to -0.98 V vs. RHE. H2, formate and CO were the main products observed and in
particular the faradaic efficiency of H2 was ca. 90 %. The comparison with K. Kuhl results9
suggested the idea that porous electrodes facilitate reaction pathways that are different from those
that take place on smooth electrodes, due to graded electrical potential in the electrolyte through the
Cu foam perpendicular to the electrode/electrolyte interface. The overpotential drops in the
electrolyte in the pores when moving away from the main electrolyte causing a gradient in the local
electrode overpotential. The products formed during the electrochemical reduction of CO2 are
affected by the electrode structure and design. Further studies that investigate how controlled
variations in pore size, pore depth and effective surface area influence the products formed by the
reduction of CO2 are necessary. To realize this, it is also required to improve the electrochemical
cell setup in order to sustain more negative current densities than -20 mA/cm2.
References
1 Y. Hori, A. Murata, R. Takahashi, Journal of the Chemical Society, Faraday Transactions 1: Physical
Chemistry in Condensed Phases, 85 (1989) 2309-2326. 2 H. Yano, F. Shirai, M. Nakayama, K. Ogura, Journal of Electroanalytical Chemistry, 519 (2002) 93 - 100.
3 M. Gattrell, N. Gupta, A. Co, Journal of Electroanalytical Chemistry, 594 (2006) 1-19.
4 Y. Hori, K. kikichi, S. Suzuki, Chemistry Letters, (1985) 1695 – 1698.
5 M. Gattrell, N. Gupta, A. Co, Energy Conversion and Management, 48 (2007) 1255 - 1265.
6 T. Reier, M. Oezaslan and P Strasser, ACS Catalysis 2 (8) (2012) 1765–1772.
7 I.C. Man, H.Y. Su, F. Calle-Vallejo, H.A. Hansen, J.I. Martinez, N.G. Inoglu, J. Kitchin, T.F. Jaramillo,
J.K. Nørskov, J. Rossmeisl, Journal of ChemCatChem 3 (2011) 1159-1165. 8 J. Greeley, I. E. L. Stephens, A. S. Bondarenko, T. P. Johansson, H. A. Hansen, T. F. Jaramillo, J.
Rossmeisl, I. Chorkendorff & J. K. Nørskov, Nature chemistry 1 (2009) 552-556. 9 K. P. Kuhl, E. R. Cave, D. N. Abram and T. F. Jaramillo, Energy & Environmental Science, 5 (2012) 7050
– 7059. 10
A. Lasia, Modeling of impedances of porous electrodes, in Modern Aspects of Electrochemistry,
ed. by M. Schlesinger, vol. 43 (Springer, New York, 2009), pp. 67–138. 11
S. Sen, D. Liu, G. Tayhas and R. Palmore, American Chemical Society Catalysis, 4 (2014) 3091-3095.
85
Chapter 7
CO2 reduction on electrochemical cells using
gas diffusion electrodes at elevated pressure. The main aim of this study was to design and test a new electrochemical cell based on metal foam
gas diffusion electrodes, as described in Chapter 2, able to reduce CO2 in a single step process at
elevated pressure. This chapter includes the results on the electrochemical performance and product
selectivity of such newly designed cell. The evaluation and characterization of both microstructure
and surface elemental composition of the different parts of the cells are included.
Abstract
An electrolysis cell for electrochemical reduction of CO2 based on a new technology was
developed. The aqueous electrolyte (0.5 M K2CO3) of the cell is immobilized by capillary forces in
a ceramic porous structure (YSZ). Metal foam based gas diffusion electrodes were used to enhance
the active surface area and three phase boundary length. The cells have been shown to operate at
pressures up to 20 bar and to a maximum temperature of 50 °C. Copper and silver metal foams were
studied as cathode, since they are promising electrocatalysts for CO2 reduction. Nickel was chosen
as anode, since it is a well-known catalyst for oxygen evolution reaction in alkaline electrolysis cell.
The cells were tested by electrochemical impedance spectroscopy and chronoamperometric
measurements across a range of applied voltages of -1.75 V, -2 V and -2.5 V. The total cell
resistance was, for the cell with copper electrocatalyst and the lowest cell resistance, ca.14 Ω·cm2 at
an applied cell voltage of -2.5 V, 3 bar total pressure and ambient temperature. It exhibited a
gradual degradation throughout the operation at high cell voltage. Gas chromatography
measurements were conducted for the duration of the various tests. The only cathode products
detected were CO, H2 and methane when -2.5 V was the applied cell voltage. Scanning electron
microscopy and X-ray photoemission spectroscopy analysis before and after the tests were used to
investigate the degradation mechanism.
7.1 Introduction
Electrochemical CO2 reduction research is driven by the aspiration to decrease reliance on fossil
fuels and lower greenhouse gas emissions. Thanks to the electrocatalytic reduction process is
possible to convert CO2 and H2O into alcohols and hydrocarbons such as methane and methanol
that can eventually recover an important role in a CO2 – neutral energy system1. Electrolysis can
convert electrical energy produced by a renewable source into chemical energy in the form of
syngas and hydrocarbons, and therefore could enable a shift to a sustainable energy economy and
chemical industry. However, a key technological challenge to its utilization is the lack of efficient
and selective electrocatalysts. Previous works in this area focused on ways to increase the energy
efficiency of CO2 reduction reaction and control other relevant aspects, such as selectivity and
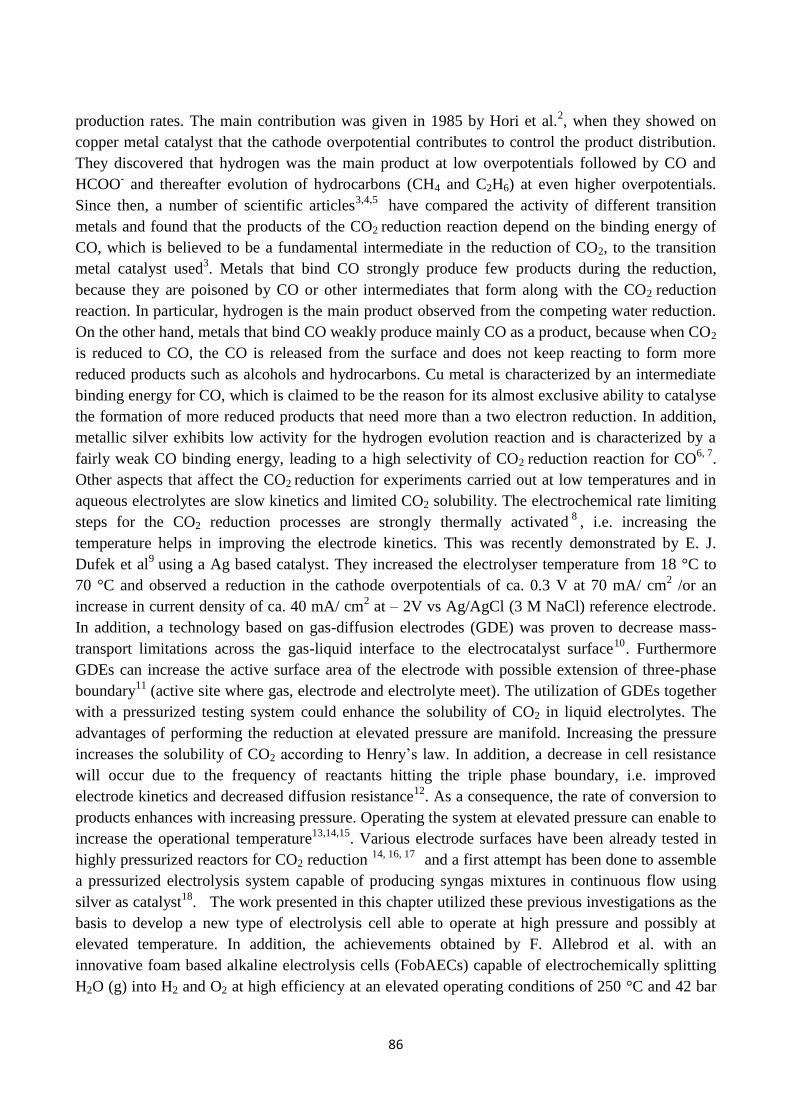
86
production rates. The main contribution was given in 1985 by Hori et al.2, when they showed on
copper metal catalyst that the cathode overpotential contributes to control the product distribution.
They discovered that hydrogen was the main product at low overpotentials followed by CO and
HCOO- and thereafter evolution of hydrocarbons (CH4 and C2H6) at even higher overpotentials.
Since then, a number of scientific articles3,4,5
have compared the activity of different transition
metals and found that the products of the CO2 reduction reaction depend on the binding energy of
CO, which is believed to be a fundamental intermediate in the reduction of CO2, to the transition
metal catalyst used3. Metals that bind CO strongly produce few products during the reduction,
because they are poisoned by CO or other intermediates that form along with the CO2 reduction
reaction. In particular, hydrogen is the main product observed from the competing water reduction.
On the other hand, metals that bind CO weakly produce mainly CO as a product, because when CO2
is reduced to CO, the CO is released from the surface and does not keep reacting to form more
reduced products such as alcohols and hydrocarbons. Cu metal is characterized by an intermediate
binding energy for CO, which is claimed to be the reason for its almost exclusive ability to catalyse
the formation of more reduced products that need more than a two electron reduction. In addition,
metallic silver exhibits low activity for the hydrogen evolution reaction and is characterized by a
fairly weak CO binding energy, leading to a high selectivity of CO2 reduction reaction for CO6, 7
.
Other aspects that affect the CO2 reduction for experiments carried out at low temperatures and in
aqueous electrolytes are slow kinetics and limited CO2 solubility. The electrochemical rate limiting
steps for the CO2 reduction processes are strongly thermally activated8
, i.e. increasing the
temperature helps in improving the electrode kinetics. This was recently demonstrated by E. J.
Dufek et al9 using a Ag based catalyst. They increased the electrolyser temperature from 18 °C to
70 °C and observed a reduction in the cathode overpotentials of ca. 0.3 V at 70 mA/ cm2 /or an
increase in current density of ca. 40 mA/ cm2 at – 2V vs Ag/AgCl (3 M NaCl) reference electrode.
In addition, a technology based on gas-diffusion electrodes (GDE) was proven to decrease mass-
transport limitations across the gas-liquid interface to the electrocatalyst surface10
. Furthermore
GDEs can increase the active surface area of the electrode with possible extension of three-phase
boundary11
(active site where gas, electrode and electrolyte meet). The utilization of GDEs together
with a pressurized testing system could enhance the solubility of CO2 in liquid electrolytes. The
advantages of performing the reduction at elevated pressure are manifold. Increasing the pressure
increases the solubility of CO2 according to Henry’s law. In addition, a decrease in cell resistance
will occur due to the frequency of reactants hitting the triple phase boundary, i.e. improved
electrode kinetics and decreased diffusion resistance12
. As a consequence, the rate of conversion to
products enhances with increasing pressure. Operating the system at elevated pressure can enable to
increase the operational temperature13,14,15
. Various electrode surfaces have been already tested in
highly pressurized reactors for CO2 reduction 14, 16, 17
and a first attempt has been done to assemble
a pressurized electrolysis system capable of producing syngas mixtures in continuous flow using
silver as catalyst18
. The work presented in this chapter utilized these previous investigations as the
basis to develop a new type of electrolysis cell able to operate at high pressure and possibly at
elevated temperature. In addition, the achievements obtained by F. Allebrod et al. with an
innovative foam based alkaline electrolysis cells (FobAECs) capable of electrochemically splitting
H2O (g) into H2 and O2 at high efficiency at an elevated operating conditions of 250 °C and 42 bar
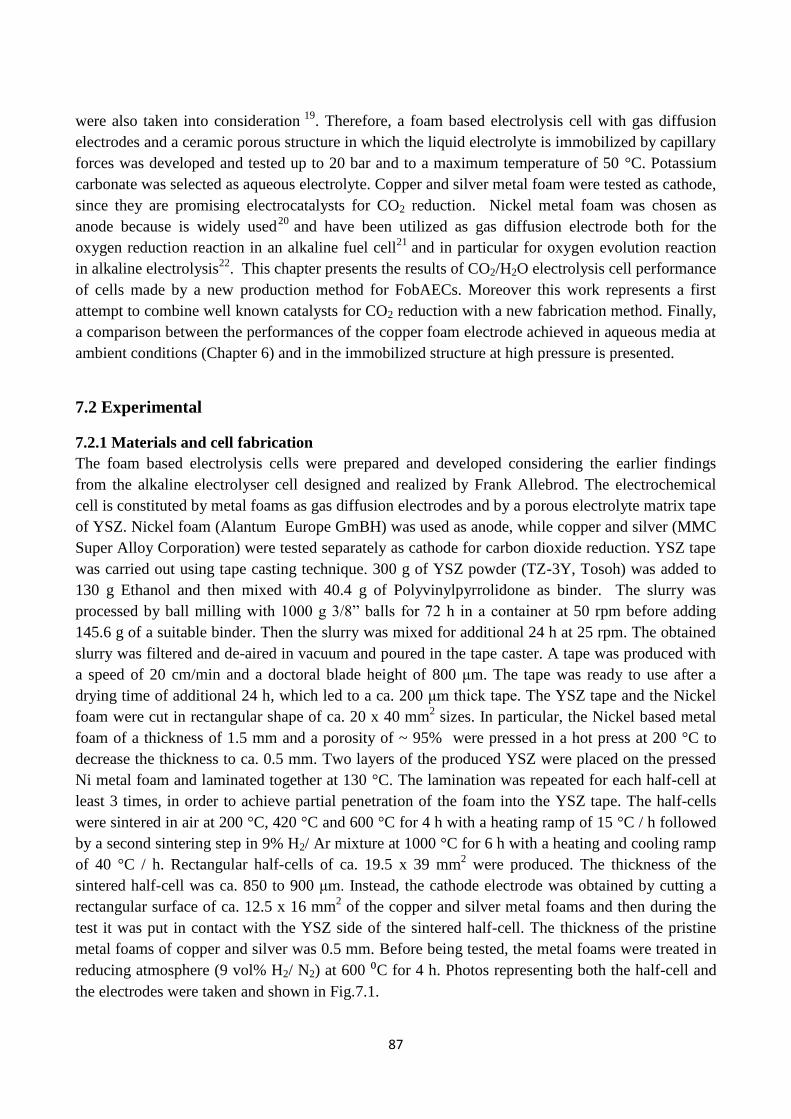
87
were also taken into consideration 19
. Therefore, a foam based electrolysis cell with gas diffusion
electrodes and a ceramic porous structure in which the liquid electrolyte is immobilized by capillary
forces was developed and tested up to 20 bar and to a maximum temperature of 50 °C. Potassium
carbonate was selected as aqueous electrolyte. Copper and silver metal foam were tested as cathode,
since they are promising electrocatalysts for CO2 reduction. Nickel metal foam was chosen as
anode because is widely used20
and have been utilized as gas diffusion electrode both for the
oxygen reduction reaction in an alkaline fuel cell21
and in particular for oxygen evolution reaction
in alkaline electrolysis22
. This chapter presents the results of CO2/H2O electrolysis cell performance
of cells made by a new production method for FobAECs. Moreover this work represents a first
attempt to combine well known catalysts for CO2 reduction with a new fabrication method. Finally,
a comparison between the performances of the copper foam electrode achieved in aqueous media at
ambient conditions (Chapter 6) and in the immobilized structure at high pressure is presented.
7.2 Experimental
7.2.1 Materials and cell fabrication
The foam based electrolysis cells were prepared and developed considering the earlier findings
from the alkaline electrolyser cell designed and realized by Frank Allebrod. The electrochemical
cell is constituted by metal foams as gas diffusion electrodes and by a porous electrolyte matrix tape
of YSZ. Nickel foam (Alantum Europe GmBH) was used as anode, while copper and silver (MMC
Super Alloy Corporation) were tested separately as cathode for carbon dioxide reduction. YSZ tape
was carried out using tape casting technique. 300 g of YSZ powder (TZ-3Y, Tosoh) was added to
130 g Ethanol and then mixed with 40.4 g of Polyvinylpyrrolidone as binder. The slurry was
processed by ball milling with 1000 g 3/8” balls for 72 h in a container at 50 rpm before adding
145.6 g of a suitable binder. Then the slurry was mixed for additional 24 h at 25 rpm. The obtained
slurry was filtered and de-aired in vacuum and poured in the tape caster. A tape was produced with
a speed of 20 cm/min and a doctoral blade height of 800 μm. The tape was ready to use after a
drying time of additional 24 h, which led to a ca. 200 μm thick tape. The YSZ tape and the Nickel
foam were cut in rectangular shape of ca. 20 x 40 mm2 sizes. In particular, the Nickel based metal
foam of a thickness of 1.5 mm and a porosity of ~ 95% were pressed in a hot press at 200 °C to
decrease the thickness to ca. 0.5 mm. Two layers of the produced YSZ were placed on the pressed
Ni metal foam and laminated together at 130 °C. The lamination was repeated for each half-cell at
least 3 times, in order to achieve partial penetration of the foam into the YSZ tape. The half-cells
were sintered in air at 200 °C, 420 °C and 600 °C for 4 h with a heating ramp of 15 °C / h followed
by a second sintering step in 9% H2/ Ar mixture at 1000 °C for 6 h with a heating and cooling ramp
of 40 °C / h. Rectangular half-cells of ca. 19.5 x 39 mm2 were produced. The thickness of the
sintered half-cell was ca. 850 to 900 μm. Instead, the cathode electrode was obtained by cutting a
rectangular surface of ca. 12.5 x 16 mm2 of the copper and silver metal foams and then during the
test it was put in contact with the YSZ side of the sintered half-cell. The thickness of the pristine
metal foams of copper and silver was 0.5 mm. Before being tested, the metal foams were treated in
reducing atmosphere (9 vol% H2/ N2) at 600 ⁰C for 4 h. Photos representing both the half-cell and
the electrodes were taken and shown in Fig.7.1.
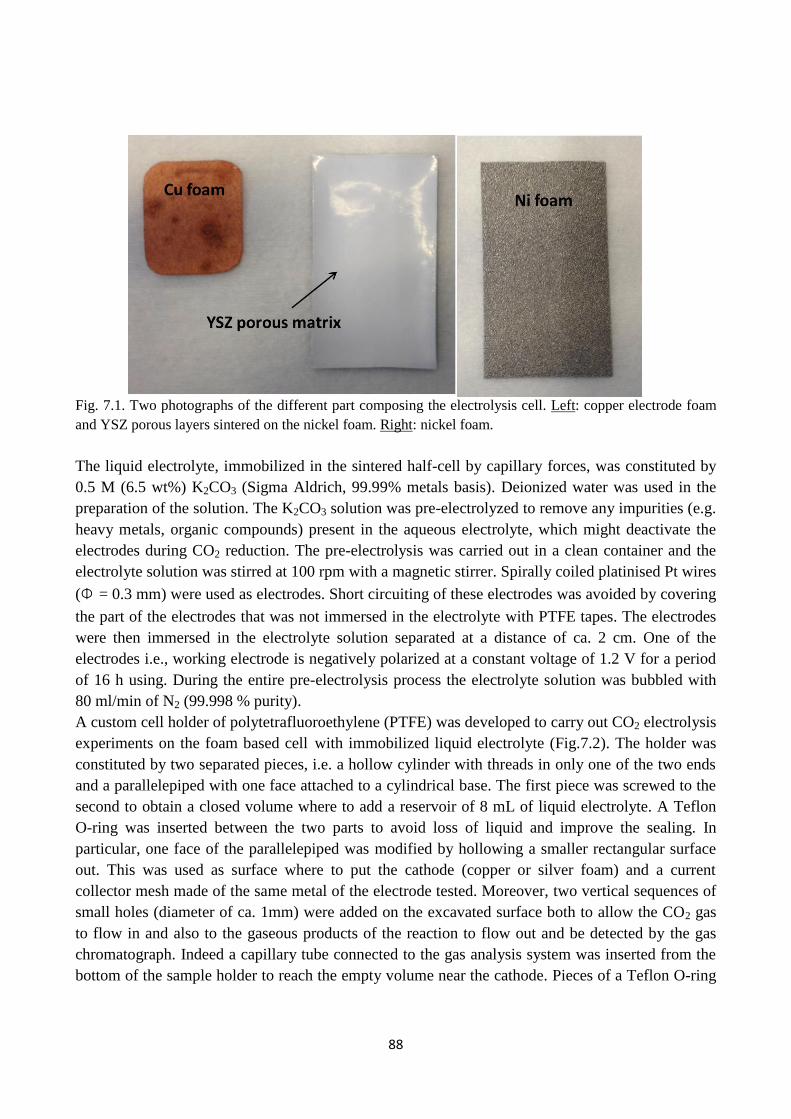
88
Fig. 7.1. Two photographs of the different part composing the electrolysis cell. Left: copper electrode foam
and YSZ porous layers sintered on the nickel foam. Right: nickel foam.
The liquid electrolyte, immobilized in the sintered half-cell by capillary forces, was constituted by
0.5 M (6.5 wt%) K2CO3 (Sigma Aldrich, 99.99% metals basis). Deionized water was used in the
preparation of the solution. The K2CO3 solution was pre-electrolyzed to remove any impurities (e.g.
heavy metals, organic compounds) present in the aqueous electrolyte, which might deactivate the
electrodes during CO2 reduction. The pre-electrolysis was carried out in a clean container and the
electrolyte solution was stirred at 100 rpm with a magnetic stirrer. Spirally coiled platinised Pt wires
(Φ = 0.3 mm) were used as electrodes. Short circuiting of these electrodes was avoided by covering
the part of the electrodes that was not immersed in the electrolyte with PTFE tapes. The electrodes
were then immersed in the electrolyte solution separated at a distance of ca. 2 cm. One of the
electrodes i.e., working electrode is negatively polarized at a constant voltage of 1.2 V for a period
of 16 h using. During the entire pre-electrolysis process the electrolyte solution was bubbled with
80 ml/min of N2 (99.998 % purity).
A custom cell holder of polytetrafluoroethylene (PTFE) was developed to carry out CO2 electrolysis
experiments on the foam based cell with immobilized liquid electrolyte (Fig.7.2). The holder was
constituted by two separated pieces, i.e. a hollow cylinder with threads in only one of the two ends
and a parallelepiped with one face attached to a cylindrical base. The first piece was screwed to the
second to obtain a closed volume where to add a reservoir of 8 mL of liquid electrolyte. A Teflon
O-ring was inserted between the two parts to avoid loss of liquid and improve the sealing. In
particular, one face of the parallelepiped was modified by hollowing a smaller rectangular surface
out. This was used as surface where to put the cathode (copper or silver foam) and a current
collector mesh made of the same metal of the electrode tested. Moreover, two vertical sequences of
small holes (diameter of ca. 1mm) were added on the excavated surface both to allow the CO2 gas
to flow in and also to the gaseous products of the reaction to flow out and be detected by the gas
chromatograph. Indeed a capillary tube connected to the gas analysis system was inserted from the
bottom of the sample holder to reach the empty volume near the cathode. Pieces of a Teflon O-ring
89
were inserted on the excavated surface to improve the contact between the metal foam and the
ceramic porous matrix. A second O-ring was displaced along the perimeter of the surface to
improve the sealing and to assure two distinct gas atmospheres in the cathode and anode side.
Finally, the sintered half-cell and the cathode were located within two aluminium plates connected
with insulating screws to improve the contact between the two parts of the electrochemical cell and
the gas tightness, as shown in Fig. 7.2. The Ni foam was in direct contact with one of the aluminium
plates, while the second plate faced the polytetrafluoroethylene (PTFE) holder as illustrated in Fig.
7.2. The sintered ceramic layers of YSZ laminated with the Ni foam happened to crack near the
edges while assembling the different components and compressing them together. This might have
an effect on the conductivity and on the mechanical stability of the cell depending on the size and
position of the crack.
Fig. 7.2. Electrochemical cell holder for testing the foam based electrolyser cells. Left: Top-side view and
Right: cross section view.
7.2.2 Characterization
The microstructure of the metal foams electrodes was investigated using a scanning electron
microscope, SEM (Zeiss SUPRA), prior and after being tested electrochemically. In addition, X-ray
photoelectron spectroscopy (XPS) was used to investigate the surface of pristine and
electrochemically tested copper and silver foams. It was also studied by XPS the side of the ceramic
porous electrolyte matrix in contact with the cathode to allow a better understanding of the reactions
at the interface after the electrolysis test. The XPS analyses were performed on a K-alpha (Thermo
Electron Limited, Winsford, UK) using a monochromatic Al-Kα X-ray source and a take-off angle
of 90 from the surface plane. Atomic concentrations were determined from surface spectra (0–1350
eV, 200 eV detector pass energy, 50 ms dwell time, 3 scans) and were calculated by determining the
relevant integral peak intensities using a Shirley type background. All XPS analyses were repeated
three times on different surface locations. SEM and XPS analysis on pristine copper and metal
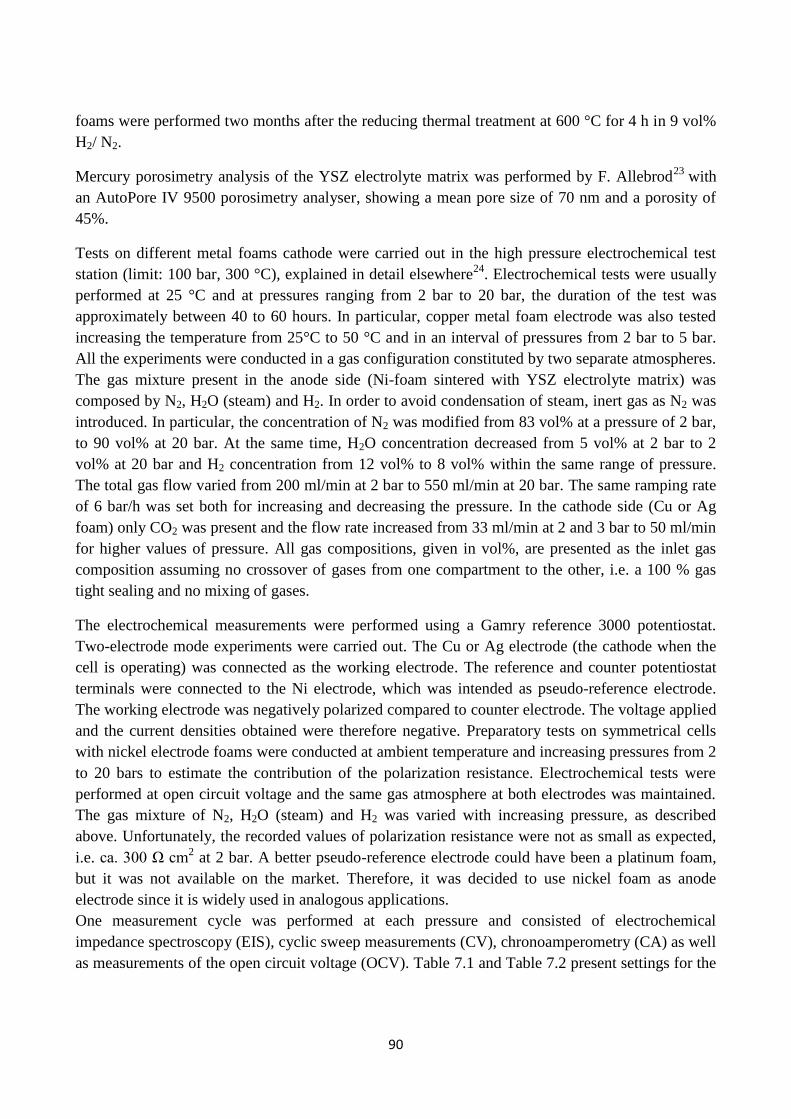
90
foams were performed two months after the reducing thermal treatment at 600 °C for 4 h in 9 vol%
H2/ N2.
Mercury porosimetry analysis of the YSZ electrolyte matrix was performed by F. Allebrod23
with
an AutoPore IV 9500 porosimetry analyser, showing a mean pore size of 70 nm and a porosity of
45%.
Tests on different metal foams cathode were carried out in the high pressure electrochemical test
station (limit: 100 bar, 300 °C), explained in detail elsewhere24
. Electrochemical tests were usually
performed at 25 °C and at pressures ranging from 2 bar to 20 bar, the duration of the test was
approximately between 40 to 60 hours. In particular, copper metal foam electrode was also tested
increasing the temperature from 25°C to 50 °C and in an interval of pressures from 2 bar to 5 bar.
All the experiments were conducted in a gas configuration constituted by two separate atmospheres.
The gas mixture present in the anode side (Ni-foam sintered with YSZ electrolyte matrix) was
composed by N2, H2O (steam) and H2. In order to avoid condensation of steam, inert gas as N2 was
introduced. In particular, the concentration of N2 was modified from 83 vol% at a pressure of 2 bar,
to 90 vol% at 20 bar. At the same time, H2O concentration decreased from 5 vol% at 2 bar to 2
vol% at 20 bar and H2 concentration from 12 vol% to 8 vol% within the same range of pressure.
The total gas flow varied from 200 ml/min at 2 bar to 550 ml/min at 20 bar. The same ramping rate
of 6 bar/h was set both for increasing and decreasing the pressure. In the cathode side (Cu or Ag
foam) only CO2 was present and the flow rate increased from 33 ml/min at 2 and 3 bar to 50 ml/min
for higher values of pressure. All gas compositions, given in vol%, are presented as the inlet gas
composition assuming no crossover of gases from one compartment to the other, i.e. a 100 % gas
tight sealing and no mixing of gases.
The electrochemical measurements were performed using a Gamry reference 3000 potentiostat.
Two-electrode mode experiments were carried out. The Cu or Ag electrode (the cathode when the
cell is operating) was connected as the working electrode. The reference and counter potentiostat
terminals were connected to the Ni electrode, which was intended as pseudo-reference electrode.
The working electrode was negatively polarized compared to counter electrode. The voltage applied
and the current densities obtained were therefore negative. Preparatory tests on symmetrical cells
with nickel electrode foams were conducted at ambient temperature and increasing pressures from 2
to 20 bars to estimate the contribution of the polarization resistance. Electrochemical tests were
performed at open circuit voltage and the same gas atmosphere at both electrodes was maintained.
The gas mixture of N2, H2O (steam) and H2 was varied with increasing pressure, as described
above. Unfortunately, the recorded values of polarization resistance were not as small as expected,
i.e. ca. 300 Ω cm2 at 2 bar. A better pseudo-reference electrode could have been a platinum foam,
but it was not available on the market. Therefore, it was decided to use nickel foam as anode
electrode since it is widely used in analogous applications.
One measurement cycle was performed at each pressure and consisted of electrochemical
impedance spectroscopy (EIS), cyclic sweep measurements (CV), chronoamperometry (CA) as well
as measurements of the open circuit voltage (OCV). Table 7.1 and Table 7.2 present settings for the
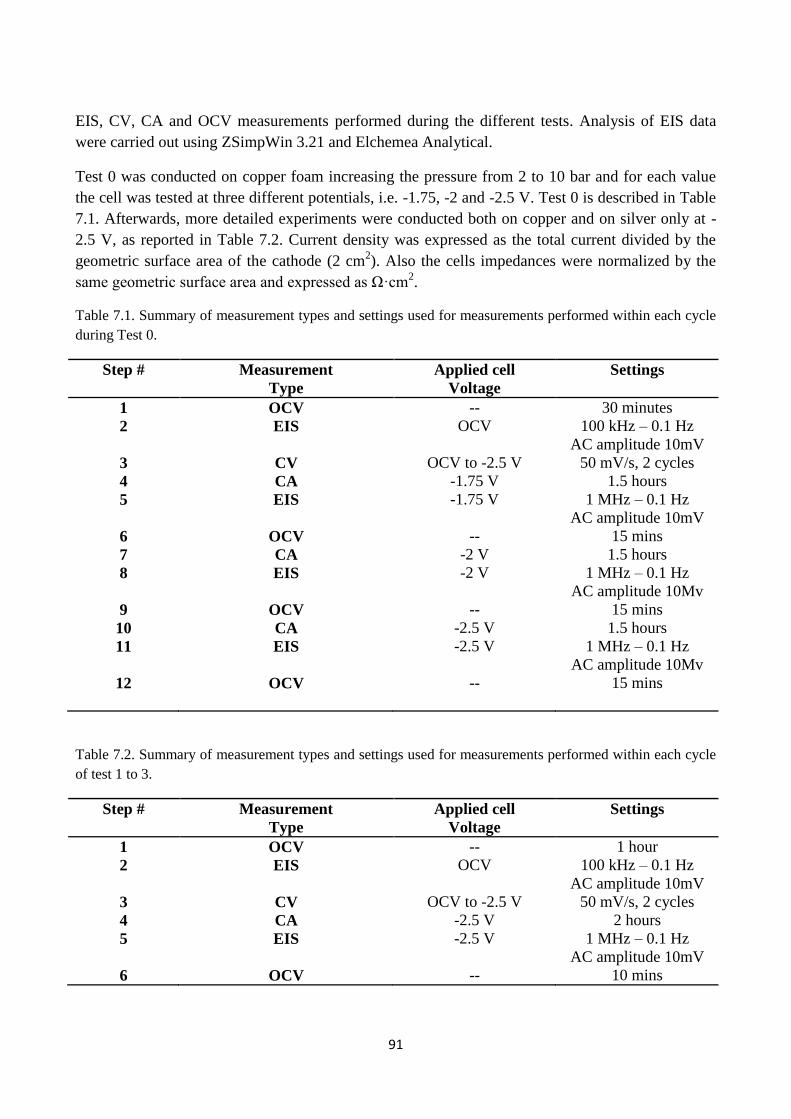
91
EIS, CV, CA and OCV measurements performed during the different tests. Analysis of EIS data
were carried out using ZSimpWin 3.21 and Elchemea Analytical.
Test 0 was conducted on copper foam increasing the pressure from 2 to 10 bar and for each value
the cell was tested at three different potentials, i.e. -1.75, -2 and -2.5 V. Test 0 is described in Table
7.1. Afterwards, more detailed experiments were conducted both on copper and on silver only at -
2.5 V, as reported in Table 7.2. Current density was expressed as the total current divided by the
geometric surface area of the cathode (2 cm2). Also the cells impedances were normalized by the
same geometric surface area and expressed as Ω·cm2.
Table 7.1. Summary of measurement types and settings used for measurements performed within each cycle
during Test 0.
Step # Measurement
Type
Applied cell
Voltage
Settings
1 OCV -- 30 minutes
2 EIS OCV 100 kHz – 0.1 Hz
AC amplitude 10mV
3 CV OCV to -2.5 V 50 mV/s, 2 cycles
4 CA -1.75 V 1.5 hours
5 EIS -1.75 V 1 MHz – 0.1 Hz
AC amplitude 10mV
6
7
8
9
10
11
12
OCV
CA
EIS
OCV
CA
EIS
OCV
--
-2 V
-2 V
--
-2.5 V
-2.5 V
--
15 mins
1.5 hours
1 MHz – 0.1 Hz
AC amplitude 10Mv
15 mins
1.5 hours
1 MHz – 0.1 Hz
AC amplitude 10Mv
15 mins
Table 7.2. Summary of measurement types and settings used for measurements performed within each cycle
of test 1 to 3.
Step # Measurement
Type
Applied cell
Voltage
Settings
1 OCV -- 1 hour
2 EIS OCV 100 kHz – 0.1 Hz
AC amplitude 10mV
3 CV OCV to -2.5 V 50 mV/s, 2 cycles
4 CA -2.5 V 2 hours
5 EIS -2.5 V 1 MHz – 0.1 Hz
AC amplitude 10mV
6 OCV -- 10 mins
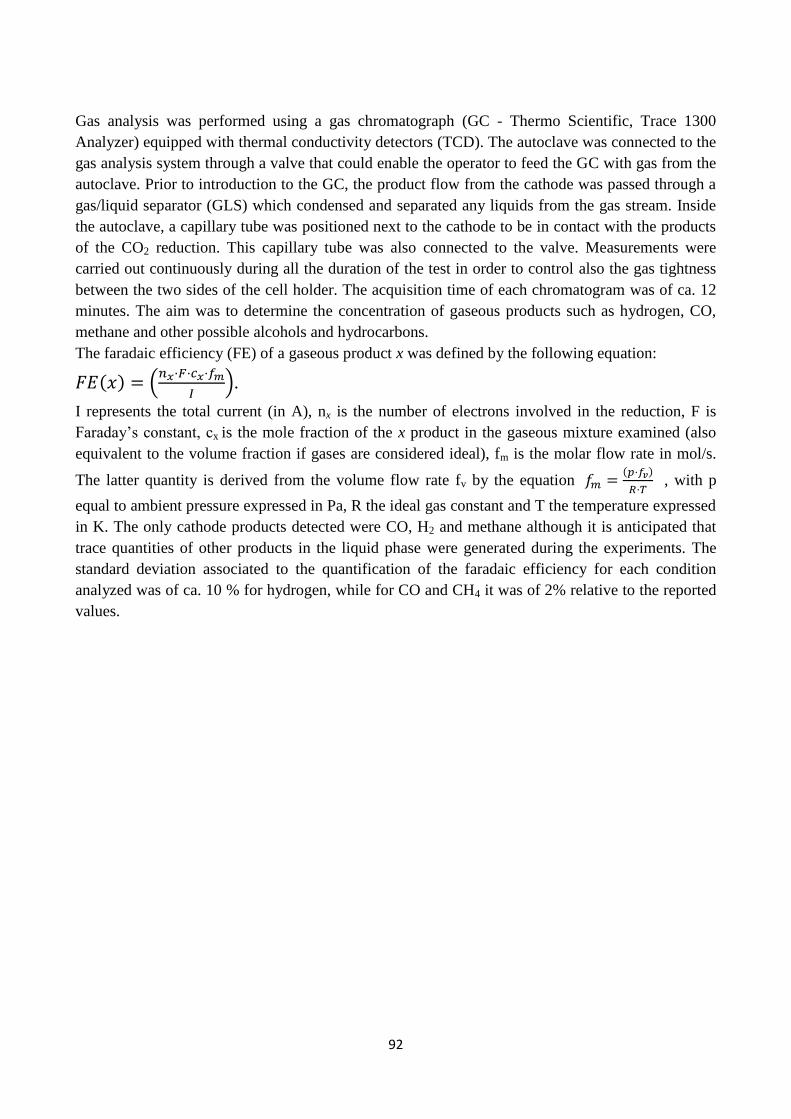
92
Gas analysis was performed using a gas chromatograph (GC - Thermo Scientific, Trace 1300
Analyzer) equipped with thermal conductivity detectors (TCD). The autoclave was connected to the
gas analysis system through a valve that could enable the operator to feed the GC with gas from the
autoclave. Prior to introduction to the GC, the product flow from the cathode was passed through a
gas/liquid separator (GLS) which condensed and separated any liquids from the gas stream. Inside
the autoclave, a capillary tube was positioned next to the cathode to be in contact with the products
of the CO2 reduction. This capillary tube was also connected to the valve. Measurements were
carried out continuously during all the duration of the test in order to control also the gas tightness
between the two sides of the cell holder. The acquisition time of each chromatogram was of ca. 12
minutes. The aim was to determine the concentration of gaseous products such as hydrogen, CO,
methane and other possible alcohols and hydrocarbons.
The faradaic efficiency (FE) of a gaseous product x was defined by the following equation:
𝐹𝐸(𝑥) = (𝑛𝑥·𝐹·𝑐𝑥·𝑓𝑚
𝐼).
I represents the total current (in A), nx is the number of electrons involved in the reduction, F is
Faraday’s constant, cx is the mole fraction of the x product in the gaseous mixture examined (also
equivalent to the volume fraction if gases are considered ideal), fm is the molar flow rate in mol/s.
The latter quantity is derived from the volume flow rate fv by the equation 𝑓𝑚 =(𝑝·𝑓𝑣)
𝑅·𝑇 , with p
equal to ambient pressure expressed in Pa, R the ideal gas constant and T the temperature expressed
in K. The only cathode products detected were CO, H2 and methane although it is anticipated that
trace quantities of other products in the liquid phase were generated during the experiments. The
standard deviation associated to the quantification of the faradaic efficiency for each condition
analyzed was of ca. 10 % for hydrogen, while for CO and CH4 it was of 2% relative to the reported
values.
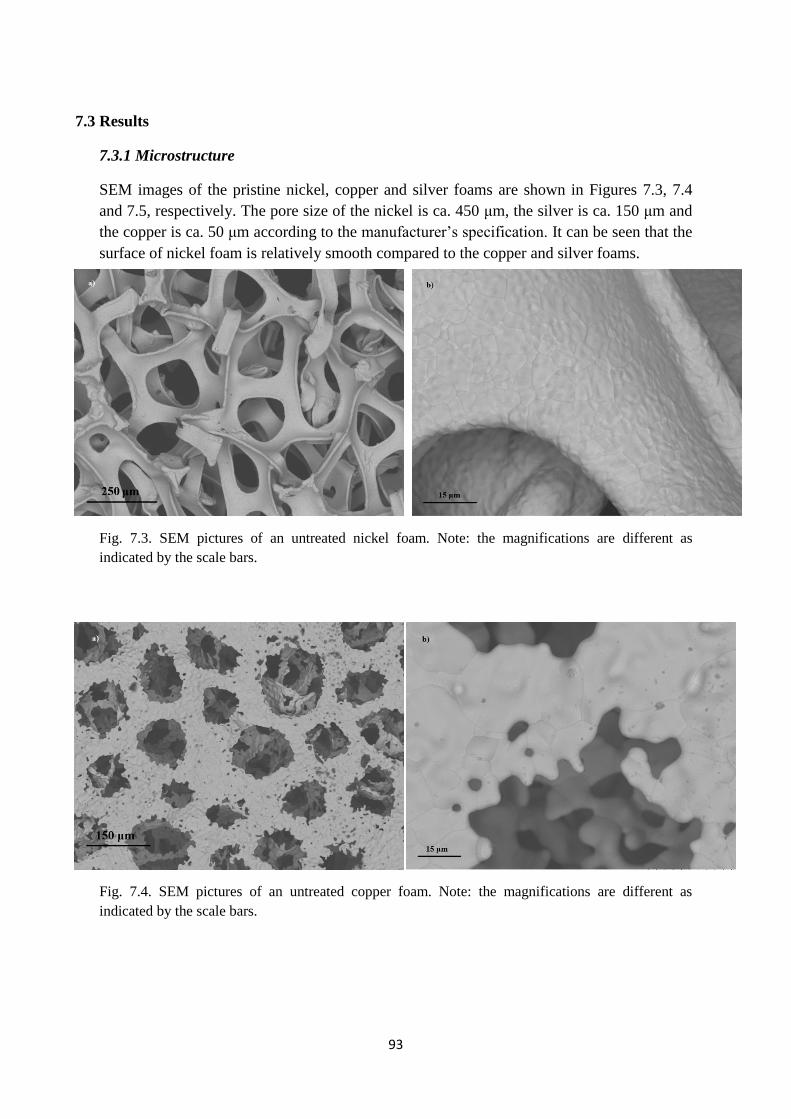
93
7.3 Results
7.3.1 Microstructure
SEM images of the pristine nickel, copper and silver foams are shown in Figures 7.3, 7.4
and 7.5, respectively. The pore size of the nickel is ca. 450 μm, the silver is ca. 150 μm and
the copper is ca. 50 μm according to the manufacturer’s specification. It can be seen that the
surface of nickel foam is relatively smooth compared to the copper and silver foams.
Fig. 7.3. SEM pictures of an untreated nickel foam. Note: the magnifications are different as
indicated by the scale bars.
Fig. 7.4. SEM pictures of an untreated copper foam. Note: the magnifications are different as
indicated by the scale bars.
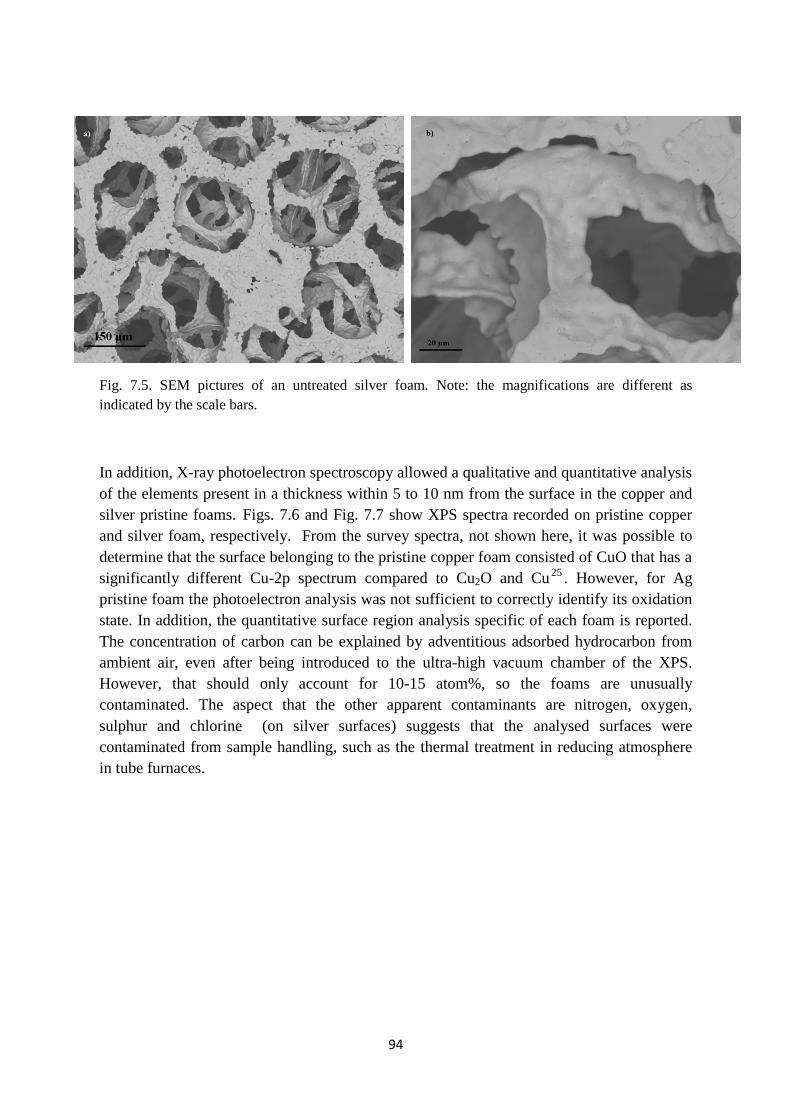
94
Fig. 7.5. SEM pictures of an untreated silver foam. Note: the magnifications are different as
indicated by the scale bars.
In addition, X-ray photoelectron spectroscopy allowed a qualitative and quantitative analysis
of the elements present in a thickness within 5 to 10 nm from the surface in the copper and
silver pristine foams. Figs. 7.6 and Fig. 7.7 show XPS spectra recorded on pristine copper
and silver foam, respectively. From the survey spectra, not shown here, it was possible to
determine that the surface belonging to the pristine copper foam consisted of CuO that has a
significantly different Cu-2p spectrum compared to Cu2O and Cu25
. However, for Ag
pristine foam the photoelectron analysis was not sufficient to correctly identify its oxidation
state. In addition, the quantitative surface region analysis specific of each foam is reported.
The concentration of carbon can be explained by adventitious adsorbed hydrocarbon from
ambient air, even after being introduced to the ultra-high vacuum chamber of the XPS.
However, that should only account for 10-15 atom%, so the foams are unusually
contaminated. The aspect that the other apparent contaminants are nitrogen, oxygen,
sulphur and chlorine (on silver surfaces) suggests that the analysed surfaces were
contaminated from sample handling, such as the thermal treatment in reducing atmosphere
in tube furnaces.
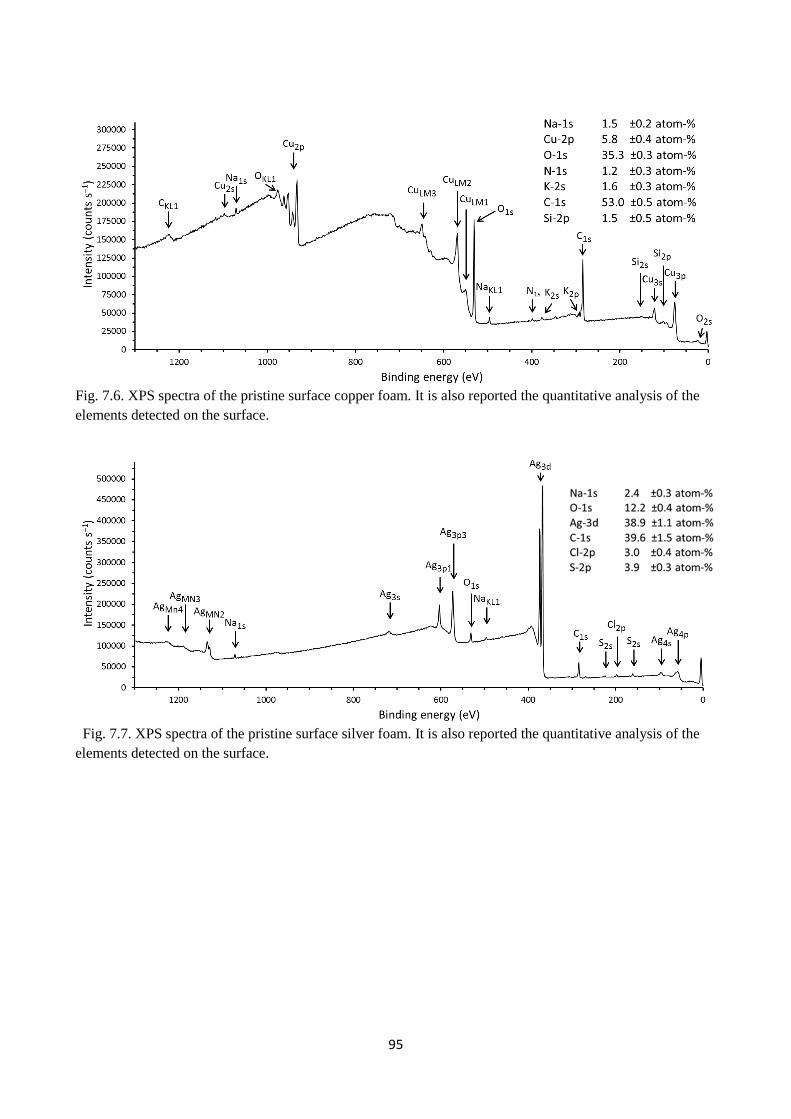
95
Fig. 7.6. XPS spectra of the pristine surface copper foam. It is also reported the quantitative analysis of the
elements detected on the surface.
Fig. 7.7. XPS spectra of the pristine surface silver foam. It is also reported the quantitative analysis of the
elements detected on the surface.
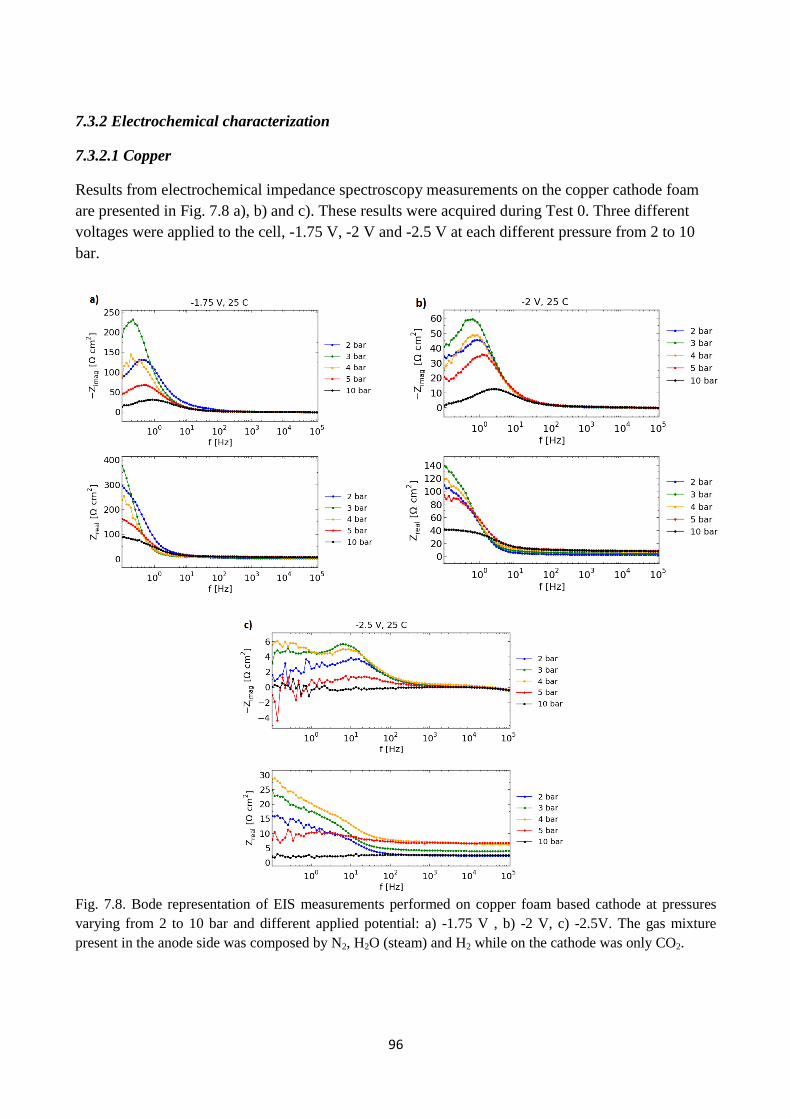
96
7.3.2 Electrochemical characterization
7.3.2.1 Copper
Results from electrochemical impedance spectroscopy measurements on the copper cathode foam
are presented in Fig. 7.8 a), b) and c). These results were acquired during Test 0. Three different
voltages were applied to the cell, -1.75 V, -2 V and -2.5 V at each different pressure from 2 to 10
bar.
Fig. 7.8. Bode representation of EIS measurements performed on copper foam based cathode at pressures
varying from 2 to 10 bar and different applied potential: a) -1.75 V , b) -2 V, c) -2.5V. The gas mixture
present in the anode side was composed by N2, H2O (steam) and H2 while on the cathode was only CO2.
97
Table 7.1 reports the order and the type of measurements performed during Test 0. It is possible to
observe how the total cell resistance (Rtot = Rs + Rp), the polarization resistance (Rp, electrode, mass
transfer) and the serial resistance (Rs, ohmic resistance i.e. electrolyte and contact resistance)
changed for increasing applied potentials (from -1.75 V, -2 V to -2.5 V) and increasing pressure.
The highest values of Rp and therefore also Rtot were obtained for the EIS recorded at -1.75 V and -
2 V. For impedance spectra recorded at -1.75 V and -2 V, the Rp significantly decreased while
increasing the pressure from 2 to 10 bar, as it is possible to see in Fig. 7.8 a) and Fig. 7.8 b). Indeed,
when applied -1.75 V, Rtot decreased from ca. 450 Ω·cm2 at 3 bar to ca. 100 Ω·cm
2 at 10 bar. The
Rs, instead, gradually increased when increasing the pressure. In particular, as shown in Fig. 7.8 a)
and in Fig. 7.8 b) the Rs went from 2.5 Ω·cm2
at 2 bar to 10 Ω·cm2
at 10 bar when applied -1.75 and
-2V. Conversely, the impedance spectra registered at -2.5 V exhibited the lowest values of Rtot, but
it increased from 17 Ω·cm2 at 2 bar to ca. 40 Ω·cm
2 at 4 bar, as shown in Fig. 7.8 c). Then the EIS
measurements started to be unstable at 5 bar only when the cell was polarized to -2.5 V (Fig. 7.8
c)). However, the following EIS spectra acquired at 10 bar pressure and polarization of -1.75 and -2
V were still stable. The last EIS spectra at 10 bar and -2.5 V was totally unstable (Fig. 7.8 c).
The OCV measured at 2 bar, before polarizing the cell, was around + 450 ± 10 mV. The OCV
acquired after the cell was polarized dropped to negative values as – 1100 ± 10 mV at 2 bar
pressure (step #12 of the first cycle). During the OCV measurements at 3, 4 bar and up to 5 bar, the
values recorded oscillated around – 1000 mV, except for the last OCV acquisition at 5 bar where
the voltage decreased to less negative values, as ca. – 35 ± 5 mV. Along the OCV measurements at
10 bar the voltage went from -20 mV at step #1 to ca. -5 mV at step # 12.
Fig. 7.9 a), b) and c) show the current density vs. time profile of the different chronoamperometric
measurements at the three polarization of -1.75, -2 and -2.5 V, respectively. The current remained
stable when the applied voltage was -1.75 V and -2 V. The current density registered at -2.5 V at 5
and 10 bar increased significantly during the ninety minutes of chronoamperometric measurements.
In particular, at 10 bar the current density varied from -30 mA/ cm2 to -500 mA/ cm
2 when applying
-2.5 V, but also for the other two values of voltages the current density increased. However, the
high current density registered did not lead to an increase of production of hydrocarbons at the
cathode electrode. The gas chromatograms reported CO production only during the last hour of
chronoamperometry measurement at 2 bar and only when applying -2.5 V. H2 evolution was always
detected when applying -2 V and -2.5 V as electrolysis voltage and its highest concentration was
obtained during the measurement at 2 bar and -2.5 V. The calculated faradaic efficiency at 2 bar and
-2.5 V was: 9 % for CO production and 91% for H2 evolution. At higher pressures (up to 10 bar) it
was not possible to detect the production of any hydrocarbons, even if the current density was high.
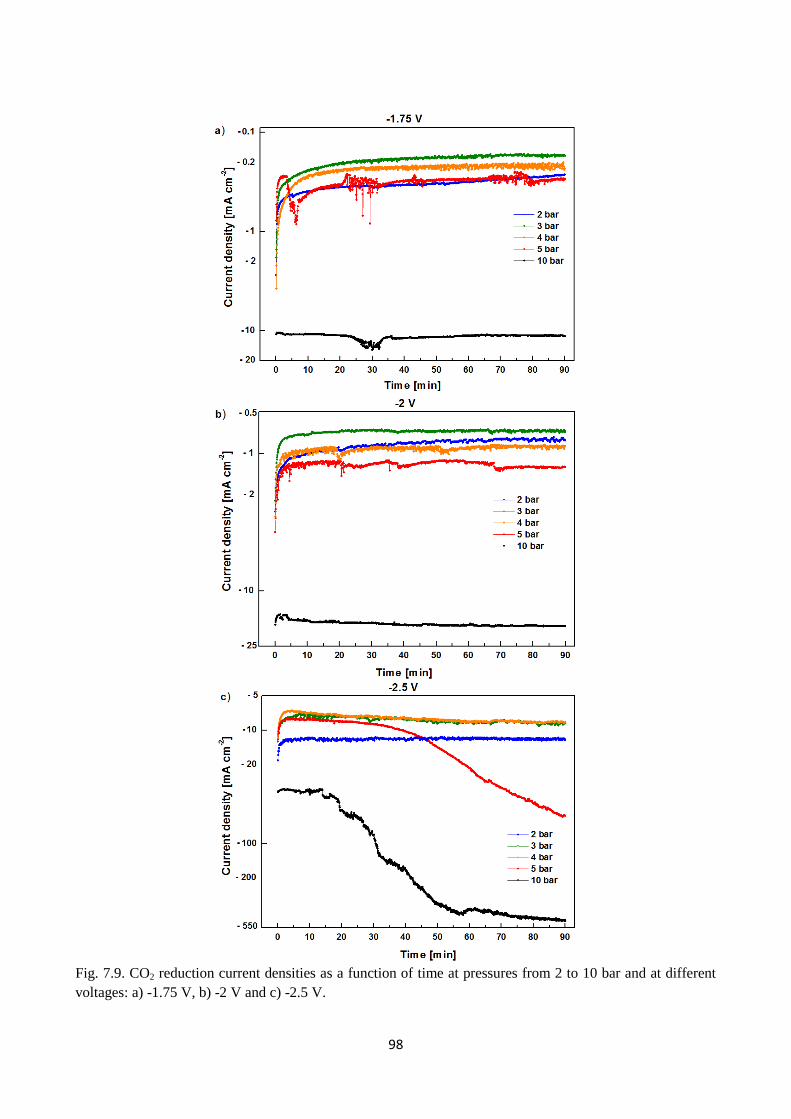
98
Fig. 7.9. CO2 reduction current densities as a function of time at pressures from 2 to 10 bar and at different
voltages: a) -1.75 V, b) -2 V and c) -2.5 V.
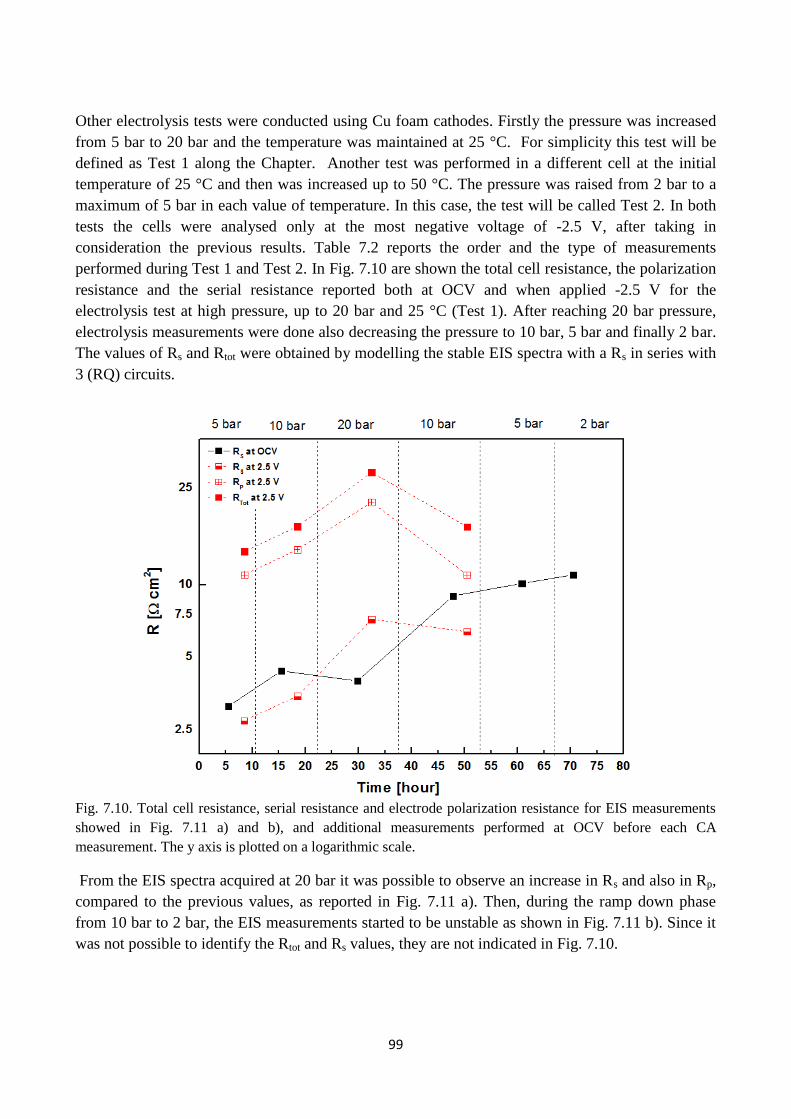
99
Other electrolysis tests were conducted using Cu foam cathodes. Firstly the pressure was increased
from 5 bar to 20 bar and the temperature was maintained at 25 °C. For simplicity this test will be
defined as Test 1 along the Chapter. Another test was performed in a different cell at the initial
temperature of 25 °C and then was increased up to 50 °C. The pressure was raised from 2 bar to a
maximum of 5 bar in each value of temperature. In this case, the test will be called Test 2. In both
tests the cells were analysed only at the most negative voltage of -2.5 V, after taking in
consideration the previous results. Table 7.2 reports the order and the type of measurements
performed during Test 1 and Test 2. In Fig. 7.10 are shown the total cell resistance, the polarization
resistance and the serial resistance reported both at OCV and when applied -2.5 V for the
electrolysis test at high pressure, up to 20 bar and 25 °C (Test 1). After reaching 20 bar pressure,
electrolysis measurements were done also decreasing the pressure to 10 bar, 5 bar and finally 2 bar.
The values of Rs and Rtot were obtained by modelling the stable EIS spectra with a Rs in series with
3 (RQ) circuits.
Fig. 7.10. Total cell resistance, serial resistance and electrode polarization resistance for EIS measurements
showed in Fig. 7.11 a) and b), and additional measurements performed at OCV before each CA
measurement. The y axis is plotted on a logarithmic scale.
From the EIS spectra acquired at 20 bar it was possible to observe an increase in Rs and also in Rp,
compared to the previous values, as reported in Fig. 7.11 a). Then, during the ramp down phase
from 10 bar to 2 bar, the EIS measurements started to be unstable as shown in Fig. 7.11 b). Since it
was not possible to identify the Rtot and Rs values, they are not indicated in Fig. 7.10.
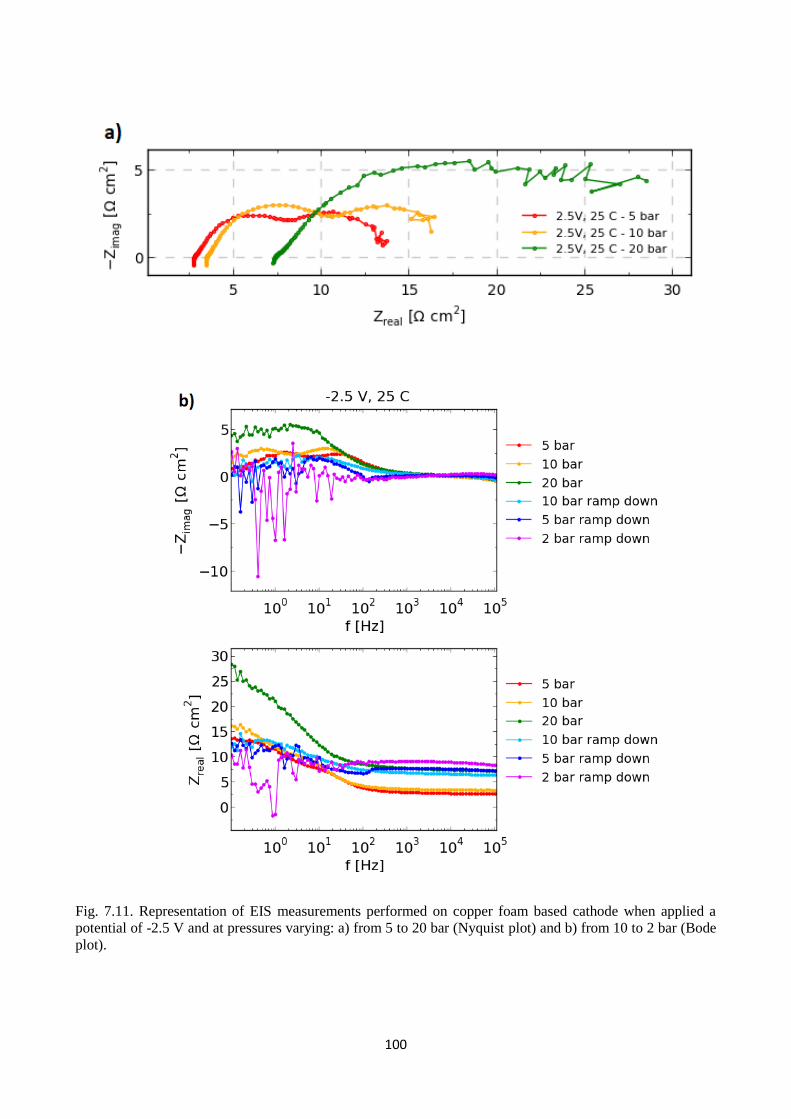
100
Fig. 7.11. Representation of EIS measurements performed on copper foam based cathode when applied a
potential of -2.5 V and at pressures varying: a) from 5 to 20 bar (Nyquist plot) and b) from 10 to 2 bar (Bode
plot).
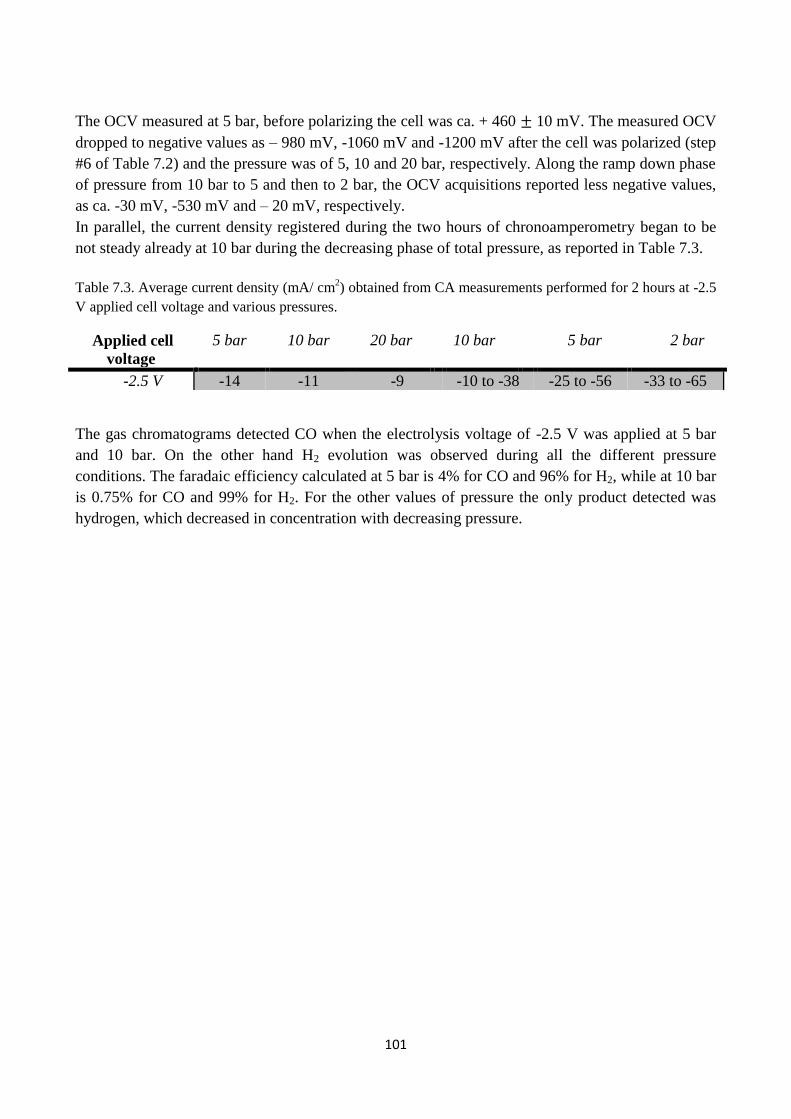
101
The OCV measured at 5 bar, before polarizing the cell was ca. + 460 ± 10 mV. The measured OCV
dropped to negative values as – 980 mV, -1060 mV and -1200 mV after the cell was polarized (step
#6 of Table 7.2) and the pressure was of 5, 10 and 20 bar, respectively. Along the ramp down phase
of pressure from 10 bar to 5 and then to 2 bar, the OCV acquisitions reported less negative values,
as ca. -30 mV, -530 mV and – 20 mV, respectively.
In parallel, the current density registered during the two hours of chronoamperometry began to be
not steady already at 10 bar during the decreasing phase of total pressure, as reported in Table 7.3.
Table 7.3. Average current density (mA/ cm2) obtained from CA measurements performed for 2 hours at -2.5
V applied cell voltage and various pressures.
Applied cell
voltage
5 bar 10 bar 20 bar 10 bar 5 bar 2 bar
-2.5 V -14 -11 -9 -10 to -38 -25 to -56 -33 to -65
The gas chromatograms detected CO when the electrolysis voltage of -2.5 V was applied at 5 bar
and 10 bar. On the other hand H2 evolution was observed during all the different pressure
conditions. The faradaic efficiency calculated at 5 bar is 4% for CO and 96% for H2, while at 10 bar
is 0.75% for CO and 99% for H2. For the other values of pressure the only product detected was
hydrogen, which decreased in concentration with decreasing pressure.
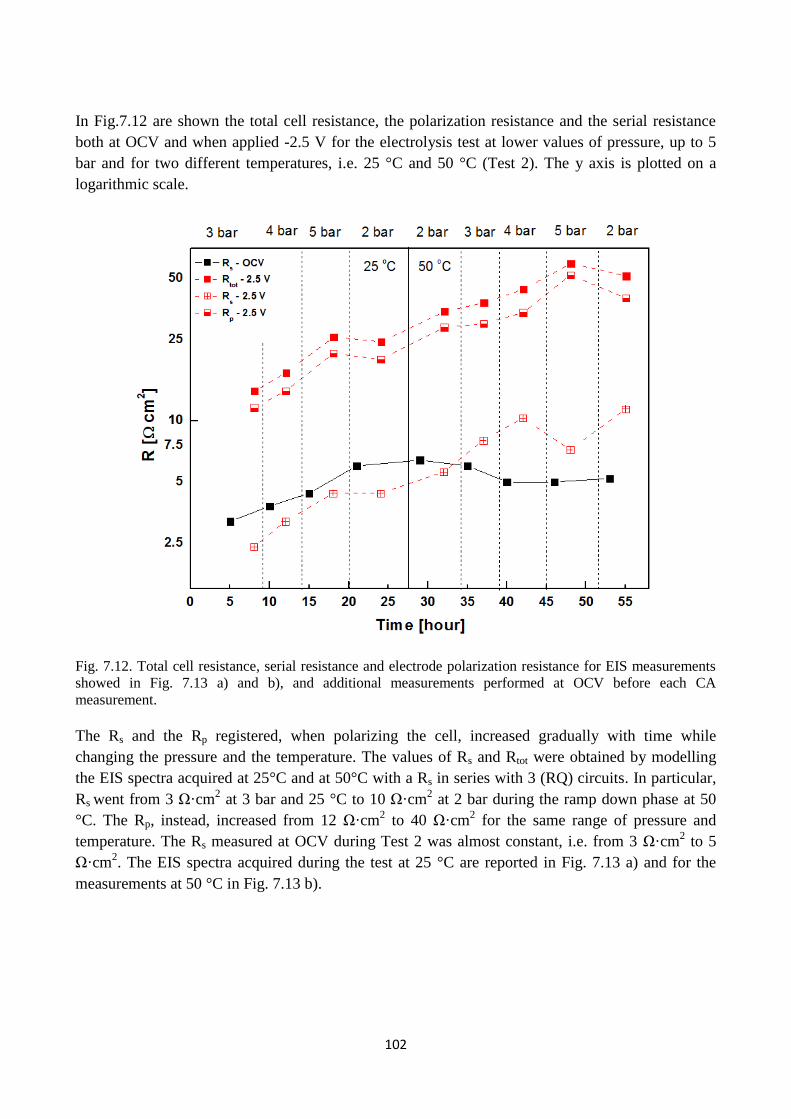
102
In Fig.7.12 are shown the total cell resistance, the polarization resistance and the serial resistance
both at OCV and when applied -2.5 V for the electrolysis test at lower values of pressure, up to 5
bar and for two different temperatures, i.e. 25 °C and 50 °C (Test 2). The y axis is plotted on a
logarithmic scale.
Fig. 7.12. Total cell resistance, serial resistance and electrode polarization resistance for EIS measurements
showed in Fig. 7.13 a) and b), and additional measurements performed at OCV before each CA
measurement.
The Rs and the Rp registered, when polarizing the cell, increased gradually with time while
changing the pressure and the temperature. The values of Rs and Rtot were obtained by modelling
the EIS spectra acquired at 25°C and at 50°C with a Rs in series with 3 (RQ) circuits. In particular,
Rs went from 3 Ω·cm2 at 3 bar and 25 °C to 10 Ω·cm
2 at 2 bar during the ramp down phase at 50
°C. The Rp, instead, increased from 12 Ω·cm2 to 40 Ω·cm
2 for the same range of pressure and
temperature. The Rs measured at OCV during Test 2 was almost constant, i.e. from 3 Ω·cm2 to 5
Ω·cm2. The EIS spectra acquired during the test at 25 °C are reported in Fig. 7.13 a) and for the
measurements at 50 °C in Fig. 7.13 b).
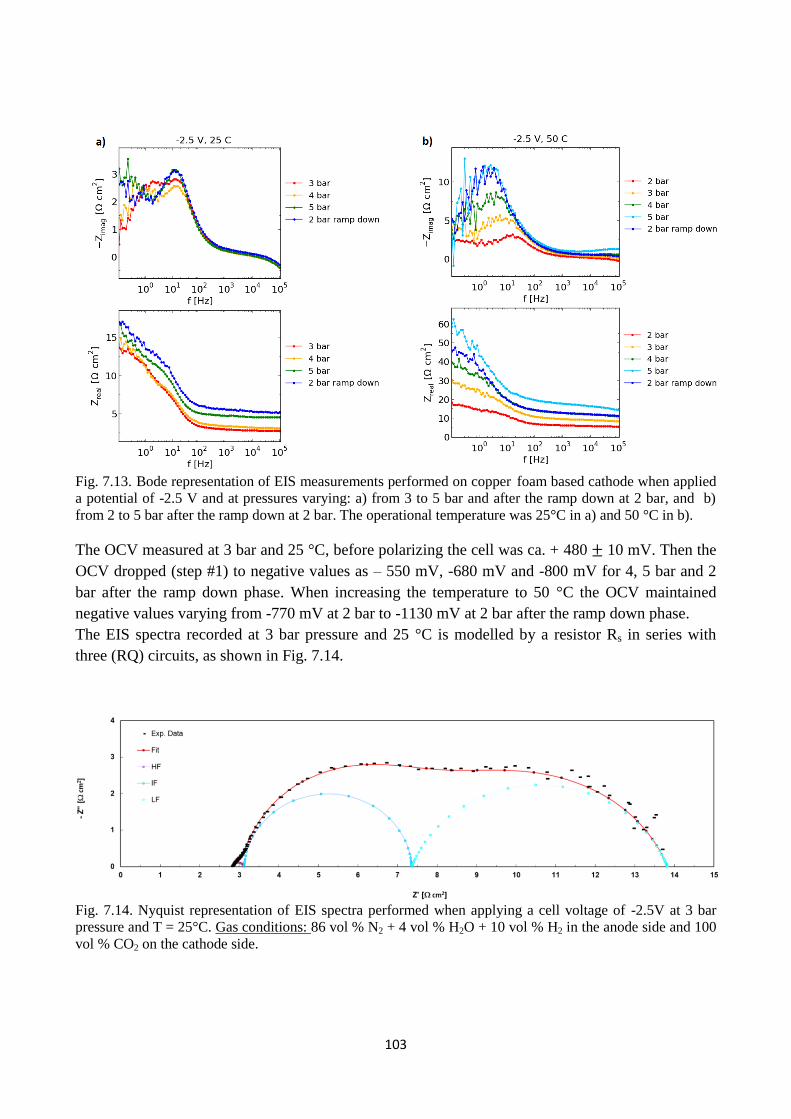
103
Fig. 7.13. Bode representation of EIS measurements performed on copper foam based cathode when applied
a potential of -2.5 V and at pressures varying: a) from 3 to 5 bar and after the ramp down at 2 bar, and b)
from 2 to 5 bar after the ramp down at 2 bar. The operational temperature was 25°C in a) and 50 °C in b).
The OCV measured at 3 bar and 25 °C, before polarizing the cell was ca. + 480 ± 10 mV. Then the
OCV dropped (step #1) to negative values as – 550 mV, -680 mV and -800 mV for 4, 5 bar and 2
bar after the ramp down phase. When increasing the temperature to 50 °C the OCV maintained
negative values varying from -770 mV at 2 bar to -1130 mV at 2 bar after the ramp down phase.
The EIS spectra recorded at 3 bar pressure and 25 °C is modelled by a resistor Rs in series with
three (RQ) circuits, as shown in Fig. 7.14.
Fig. 7.14. Nyquist representation of EIS spectra performed when applying a cell voltage of -2.5V at 3 bar
pressure and T = 25°C. Gas conditions: 86 vol % N2 + 4 vol % H2O + 10 vol % H2 in the anode side and 100
vol % CO2 on the cathode side.
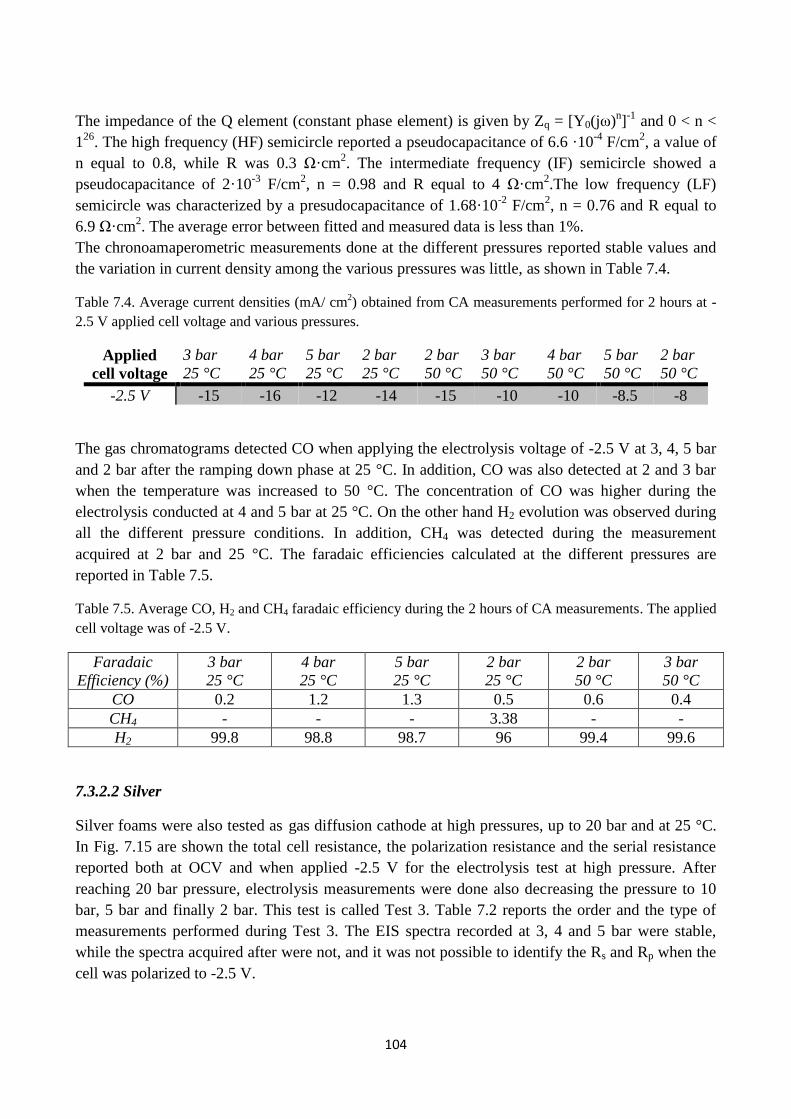
104
The impedance of the Q element (constant phase element) is given by Zq = [Y0(jω)n]
-1 and 0 < n <
126
. The high frequency (HF) semicircle reported a pseudocapacitance of 6.6 ·10-4
F/cm2, a value of
n equal to 0.8, while R was 0.3 Ω·cm2. The intermediate frequency (IF) semicircle showed a
pseudocapacitance of 2·10-3
F/cm2, n = 0.98 and R equal to 4 Ω·cm
2.The low frequency (LF)
semicircle was characterized by a presudocapacitance of 1.68·10-2
F/cm2, n = 0.76 and R equal to
6.9 Ω·cm2. The average error between fitted and measured data is less than 1%.
The chronoamaperometric measurements done at the different pressures reported stable values and
the variation in current density among the various pressures was little, as shown in Table 7.4.
Table 7.4. Average current densities (mA/ cm2) obtained from CA measurements performed for 2 hours at -
2.5 V applied cell voltage and various pressures.
Applied
cell voltage
3 bar
25 °C
4 bar
25 °C
5 bar
25 °C
2 bar
25 °C
2 bar
50 °C
3 bar
50 °C
4 bar
50 °C
5 bar
50 °C
2 bar
50 °C
-2.5 V -15 -16 -12 -14 -15 -10 -10 -8.5 -8
The gas chromatograms detected CO when applying the electrolysis voltage of -2.5 V at 3, 4, 5 bar
and 2 bar after the ramping down phase at 25 °C. In addition, CO was also detected at 2 and 3 bar
when the temperature was increased to 50 °C. The concentration of CO was higher during the
electrolysis conducted at 4 and 5 bar at 25 °C. On the other hand H2 evolution was observed during
all the different pressure conditions. In addition, CH4 was detected during the measurement
acquired at 2 bar and 25 °C. The faradaic efficiencies calculated at the different pressures are
reported in Table 7.5.
Table 7.5. Average CO, H2 and CH4 faradaic efficiency during the 2 hours of CA measurements. The applied
cell voltage was of -2.5 V.
Faradaic
Efficiency (%)
3 bar
25 °C
4 bar
25 °C
5 bar
25 °C
2 bar
25 °C
2 bar
50 °C
3 bar
50 °C
CO 0.2 1.2 1.3 0.5 0.6 0.4
CH4 - - - 3.38 - -
H2 99.8 98.8 98.7 96 99.4 99.6
7.3.2.2 Silver
Silver foams were also tested as gas diffusion cathode at high pressures, up to 20 bar and at 25 °C.
In Fig. 7.15 are shown the total cell resistance, the polarization resistance and the serial resistance
reported both at OCV and when applied -2.5 V for the electrolysis test at high pressure. After
reaching 20 bar pressure, electrolysis measurements were done also decreasing the pressure to 10
bar, 5 bar and finally 2 bar. This test is called Test 3. Table 7.2 reports the order and the type of
measurements performed during Test 3. The EIS spectra recorded at 3, 4 and 5 bar were stable,
while the spectra acquired after were not, and it was not possible to identify the Rs and Rp when the
cell was polarized to -2.5 V.
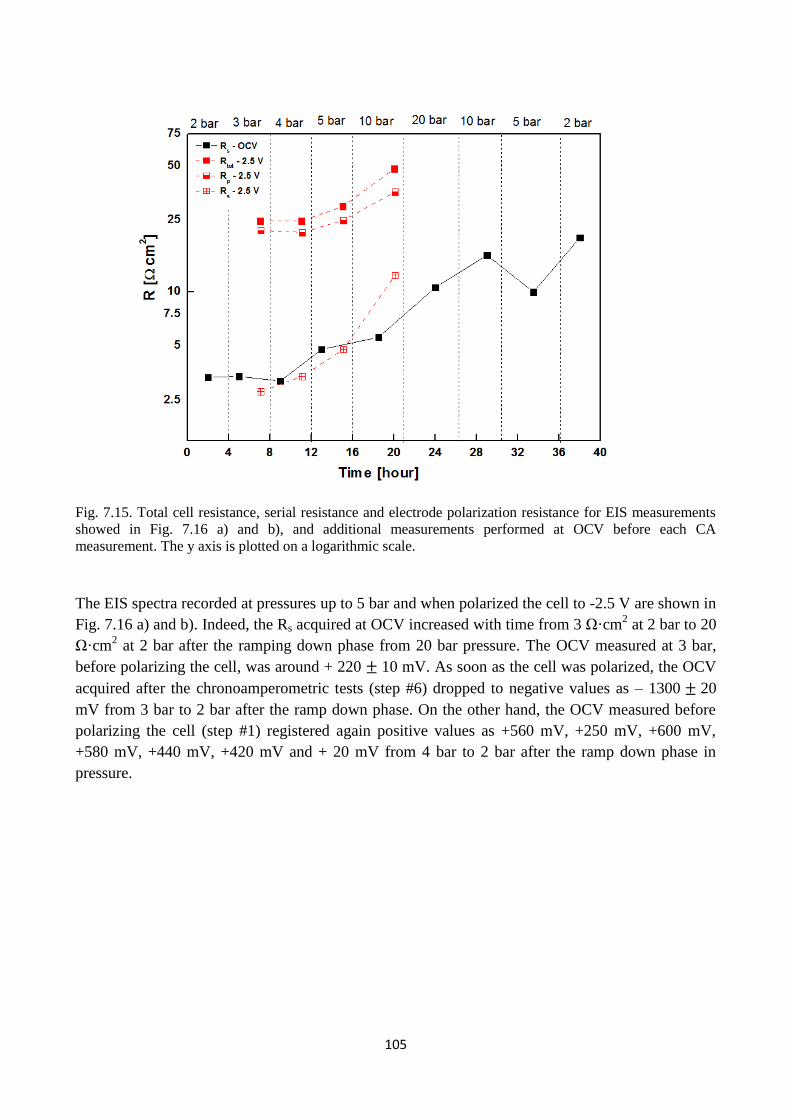
105
Fig. 7.15. Total cell resistance, serial resistance and electrode polarization resistance for EIS measurements
showed in Fig. 7.16 a) and b), and additional measurements performed at OCV before each CA
measurement. The y axis is plotted on a logarithmic scale.
The EIS spectra recorded at pressures up to 5 bar and when polarized the cell to -2.5 V are shown in
Fig. 7.16 a) and b). Indeed, the Rs acquired at OCV increased with time from 3 Ω·cm2 at 2 bar to 20
Ω·cm2 at 2 bar after the ramping down phase from 20 bar pressure. The OCV measured at 3 bar,
before polarizing the cell, was around + 220 ± 10 mV. As soon as the cell was polarized, the OCV
acquired after the chronoamperometric tests (step #6) dropped to negative values as – 1300 ± 20
mV from 3 bar to 2 bar after the ramp down phase. On the other hand, the OCV measured before
polarizing the cell (step #1) registered again positive values as +560 mV, +250 mV, +600 mV,
+580 mV, +440 mV, +420 mV and + 20 mV from 4 bar to 2 bar after the ramp down phase in
pressure.
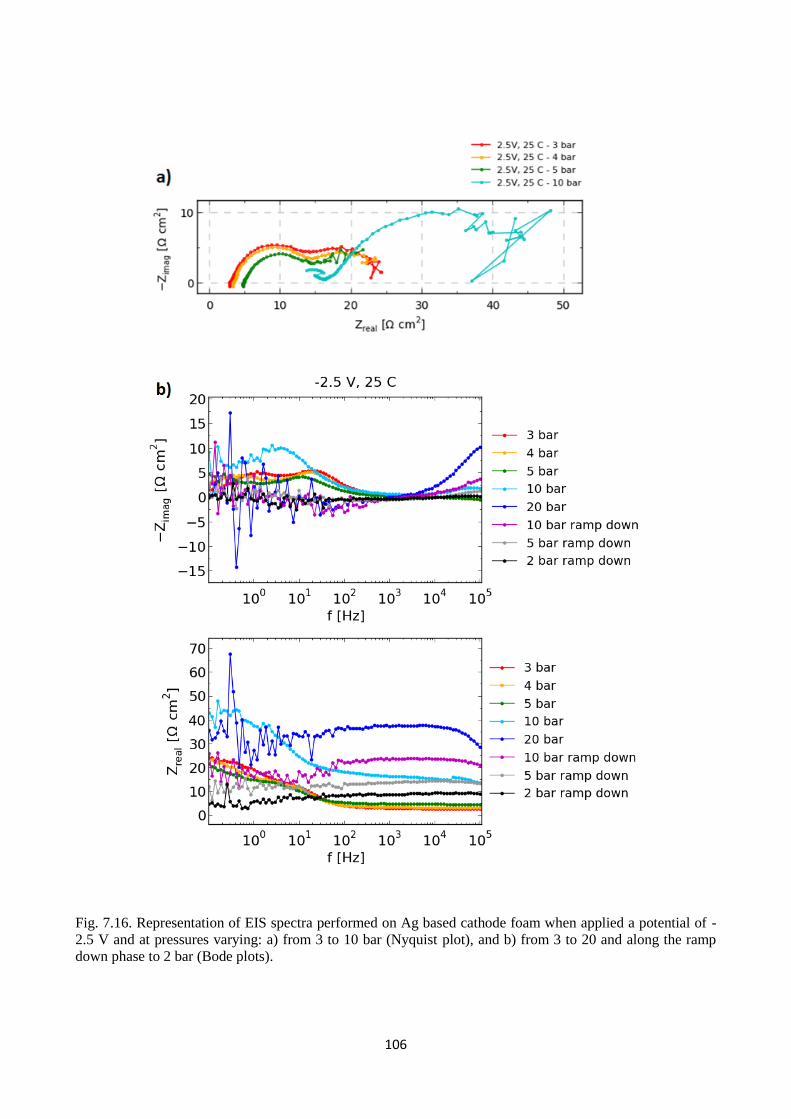
106
Fig. 7.16. Representation of EIS spectra performed on Ag based cathode foam when applied a potential of -
2.5 V and at pressures varying: a) from 3 to 10 bar (Nyquist plot), and b) from 3 to 20 and along the ramp
down phase to 2 bar (Bode plots).
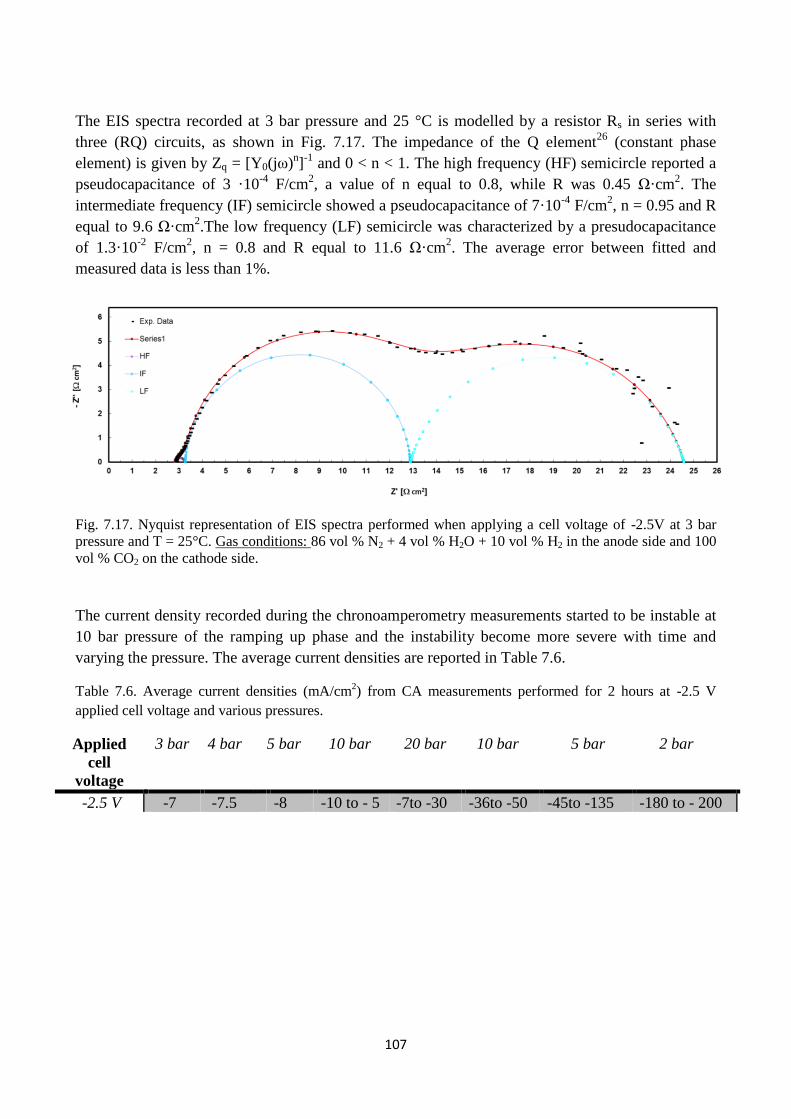
107
The EIS spectra recorded at 3 bar pressure and 25 °C is modelled by a resistor Rs in series with
three (RQ) circuits, as shown in Fig. 7.17. The impedance of the Q element26
(constant phase
element) is given by Zq = [Y0(jω)n]
-1 and 0 < n < 1. The high frequency (HF) semicircle reported a
pseudocapacitance of 3 ·10-4
F/cm2, a value of n equal to 0.8, while R was 0.45 Ω·cm
2. The
intermediate frequency (IF) semicircle showed a pseudocapacitance of 7·10-4
F/cm2, n = 0.95 and R
equal to 9.6 Ω·cm2.The low frequency (LF) semicircle was characterized by a presudocapacitance
of 1.3·10-2
F/cm2, n = 0.8 and R equal to 11.6 Ω·cm
2. The average error between fitted and
measured data is less than 1%.
Fig. 7.17. Nyquist representation of EIS spectra performed when applying a cell voltage of -2.5V at 3 bar
pressure and T = 25°C. Gas conditions: 86 vol % N2 + 4 vol % H2O + 10 vol % H2 in the anode side and 100
vol % CO2 on the cathode side.
The current density recorded during the chronoamperometry measurements started to be instable at
10 bar pressure of the ramping up phase and the instability become more severe with time and
varying the pressure. The average current densities are reported in Table 7.6.
Table 7.6. Average current densities (mA/cm2) from CA measurements performed for 2 hours at -2.5 V
applied cell voltage and various pressures.
Applied
cell
voltage
3 bar 4 bar 5 bar 10 bar 20 bar 10 bar 5 bar 2 bar
-2.5 V -7 -7.5 -8 -10 to - 5 -7to -30 -36to -50 -45to -135 -180 to - 200
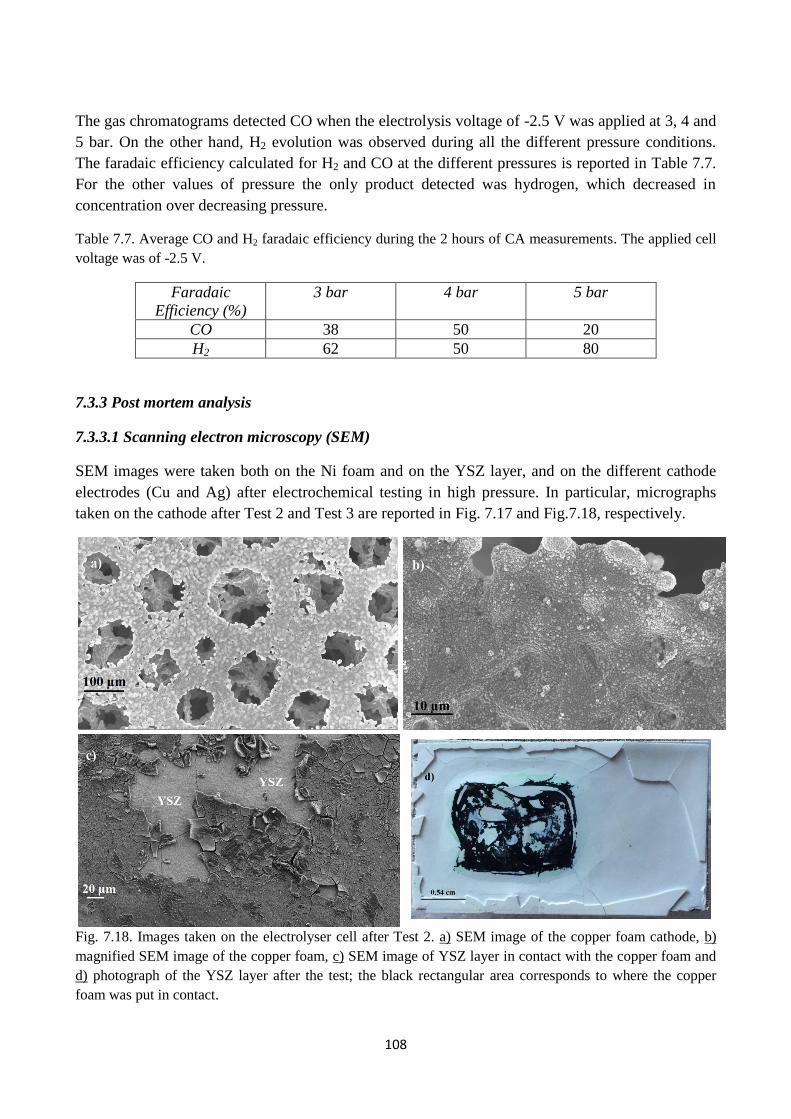
108
The gas chromatograms detected CO when the electrolysis voltage of -2.5 V was applied at 3, 4 and
5 bar. On the other hand, H2 evolution was observed during all the different pressure conditions.
The faradaic efficiency calculated for H2 and CO at the different pressures is reported in Table 7.7.
For the other values of pressure the only product detected was hydrogen, which decreased in
concentration over decreasing pressure.
Table 7.7. Average CO and H2 faradaic efficiency during the 2 hours of CA measurements. The applied cell
voltage was of -2.5 V.
Faradaic
Efficiency (%)
3 bar 4 bar 5 bar
CO 38 50 20
H2 62 50 80
7.3.3 Post mortem analysis
7.3.3.1 Scanning electron microscopy (SEM)
SEM images were taken both on the Ni foam and on the YSZ layer, and on the different cathode
electrodes (Cu and Ag) after electrochemical testing in high pressure. In particular, micrographs
taken on the cathode after Test 2 and Test 3 are reported in Fig. 7.17 and Fig.7.18, respectively.
Fig. 7.18. Images taken on the electrolyser cell after Test 2. a) SEM image of the copper foam cathode, b)
magnified SEM image of the copper foam, c) SEM image of YSZ layer in contact with the copper foam and
d) photograph of the YSZ layer after the test; the black rectangular area corresponds to where the copper
foam was put in contact.
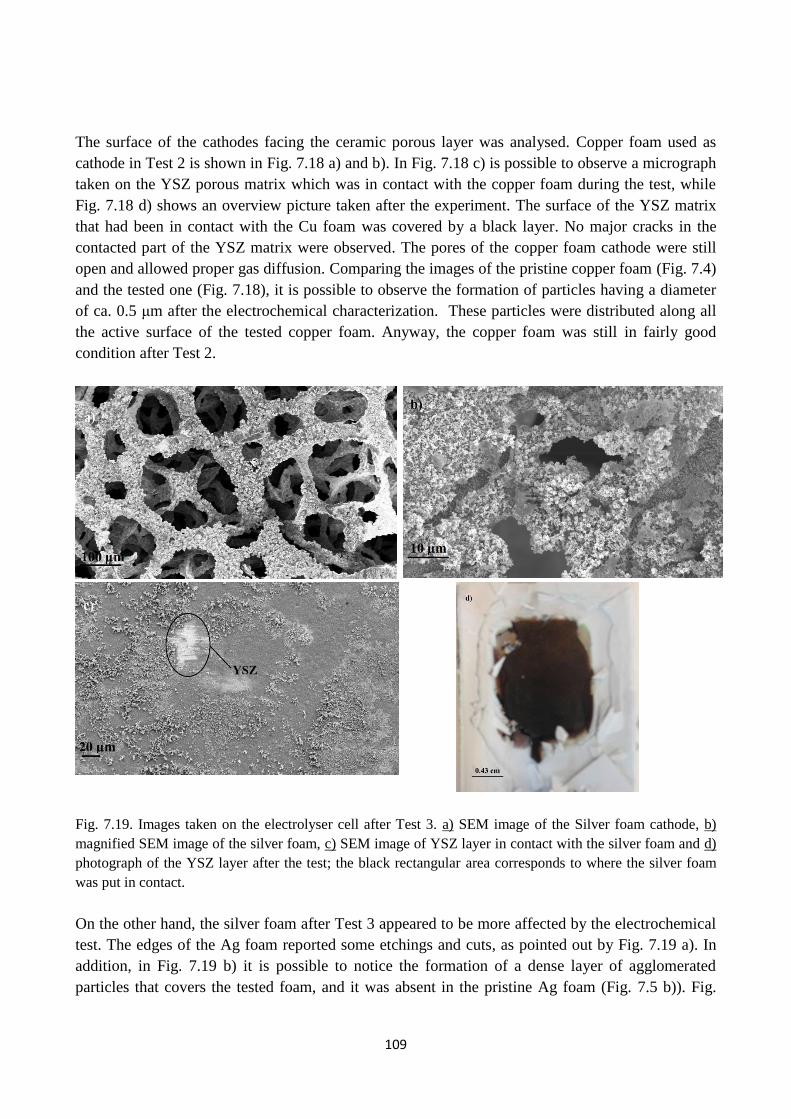
109
The surface of the cathodes facing the ceramic porous layer was analysed. Copper foam used as
cathode in Test 2 is shown in Fig. 7.18 a) and b). In Fig. 7.18 c) is possible to observe a micrograph
taken on the YSZ porous matrix which was in contact with the copper foam during the test, while
Fig. 7.18 d) shows an overview picture taken after the experiment. The surface of the YSZ matrix
that had been in contact with the Cu foam was covered by a black layer. No major cracks in the
contacted part of the YSZ matrix were observed. The pores of the copper foam cathode were still
open and allowed proper gas diffusion. Comparing the images of the pristine copper foam (Fig. 7.4)
and the tested one (Fig. 7.18), it is possible to observe the formation of particles having a diameter
of ca. 0.5 μm after the electrochemical characterization. These particles were distributed along all
the active surface of the tested copper foam. Anyway, the copper foam was still in fairly good
condition after Test 2.
Fig. 7.19. Images taken on the electrolyser cell after Test 3. a) SEM image of the Silver foam cathode, b)
magnified SEM image of the silver foam, c) SEM image of YSZ layer in contact with the silver foam and d)
photograph of the YSZ layer after the test; the black rectangular area corresponds to where the silver foam
was put in contact.
On the other hand, the silver foam after Test 3 appeared to be more affected by the electrochemical
test. The edges of the Ag foam reported some etchings and cuts, as pointed out by Fig. 7.19 a). In
addition, in Fig. 7.19 b) it is possible to notice the formation of a dense layer of agglomerated
particles that covers the tested foam, and it was absent in the pristine Ag foam (Fig. 7.5 b)). Fig.
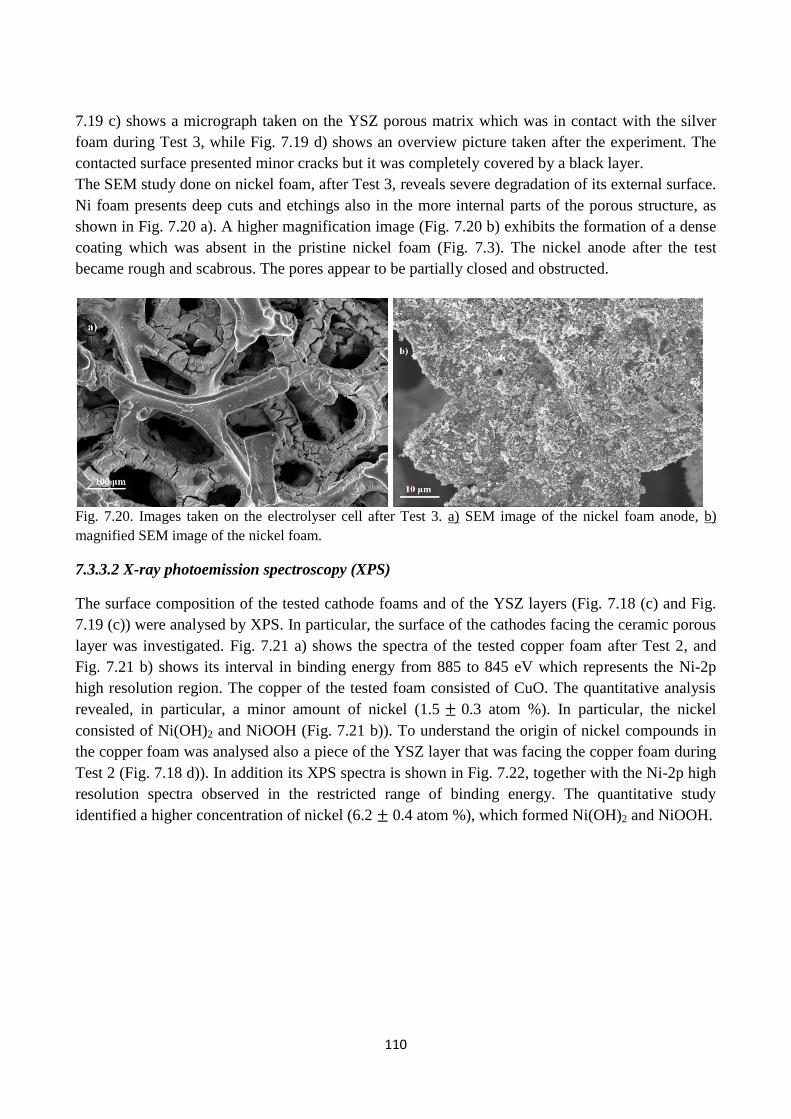
110
7.19 c) shows a micrograph taken on the YSZ porous matrix which was in contact with the silver
foam during Test 3, while Fig. 7.19 d) shows an overview picture taken after the experiment. The
contacted surface presented minor cracks but it was completely covered by a black layer.
The SEM study done on nickel foam, after Test 3, reveals severe degradation of its external surface.
Ni foam presents deep cuts and etchings also in the more internal parts of the porous structure, as
shown in Fig. 7.20 a). A higher magnification image (Fig. 7.20 b) exhibits the formation of a dense
coating which was absent in the pristine nickel foam (Fig. 7.3). The nickel anode after the test
became rough and scabrous. The pores appear to be partially closed and obstructed.
Fig. 7.20. Images taken on the electrolyser cell after Test 3. a) SEM image of the nickel foam anode, b)
magnified SEM image of the nickel foam.
7.3.3.2 X-ray photoemission spectroscopy (XPS)
The surface composition of the tested cathode foams and of the YSZ layers (Fig. 7.18 (c) and Fig.
7.19 (c)) were analysed by XPS. In particular, the surface of the cathodes facing the ceramic porous
layer was investigated. Fig. 7.21 a) shows the spectra of the tested copper foam after Test 2, and
Fig. 7.21 b) shows its interval in binding energy from 885 to 845 eV which represents the Ni-2p
high resolution region. The copper of the tested foam consisted of CuO. The quantitative analysis
revealed, in particular, a minor amount of nickel (1.5 ± 0.3 atom %). In particular, the nickel
consisted of Ni(OH)2 and NiOOH (Fig. 7.21 b)). To understand the origin of nickel compounds in
the copper foam was analysed also a piece of the YSZ layer that was facing the copper foam during
Test 2 (Fig. 7.18 d)). In addition its XPS spectra is shown in Fig. 7.22, together with the Ni-2p high
resolution spectra observed in the restricted range of binding energy. The quantitative study
identified a higher concentration of nickel (6.2 ± 0.4 atom %), which formed Ni(OH)2 and NiOOH.
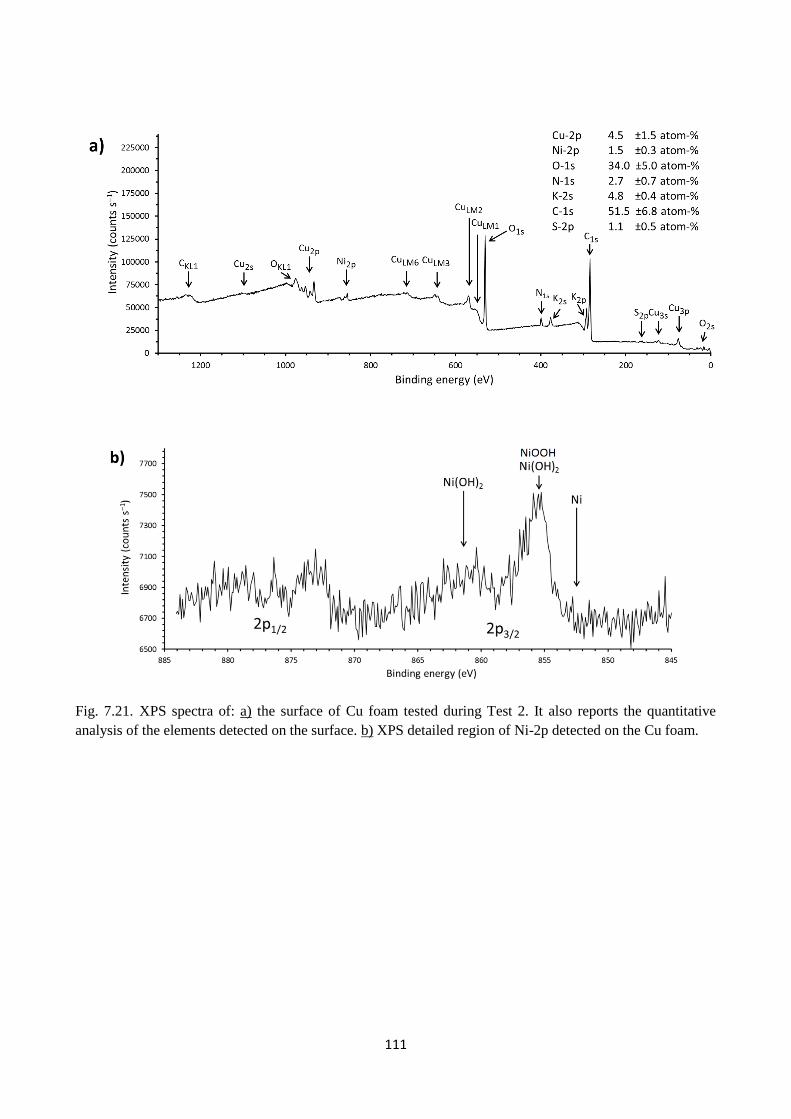
111
Fig. 7.21. XPS spectra of: a) the surface of Cu foam tested during Test 2. It also reports the quantitative
analysis of the elements detected on the surface. b) XPS detailed region of Ni-2p detected on the Cu foam.
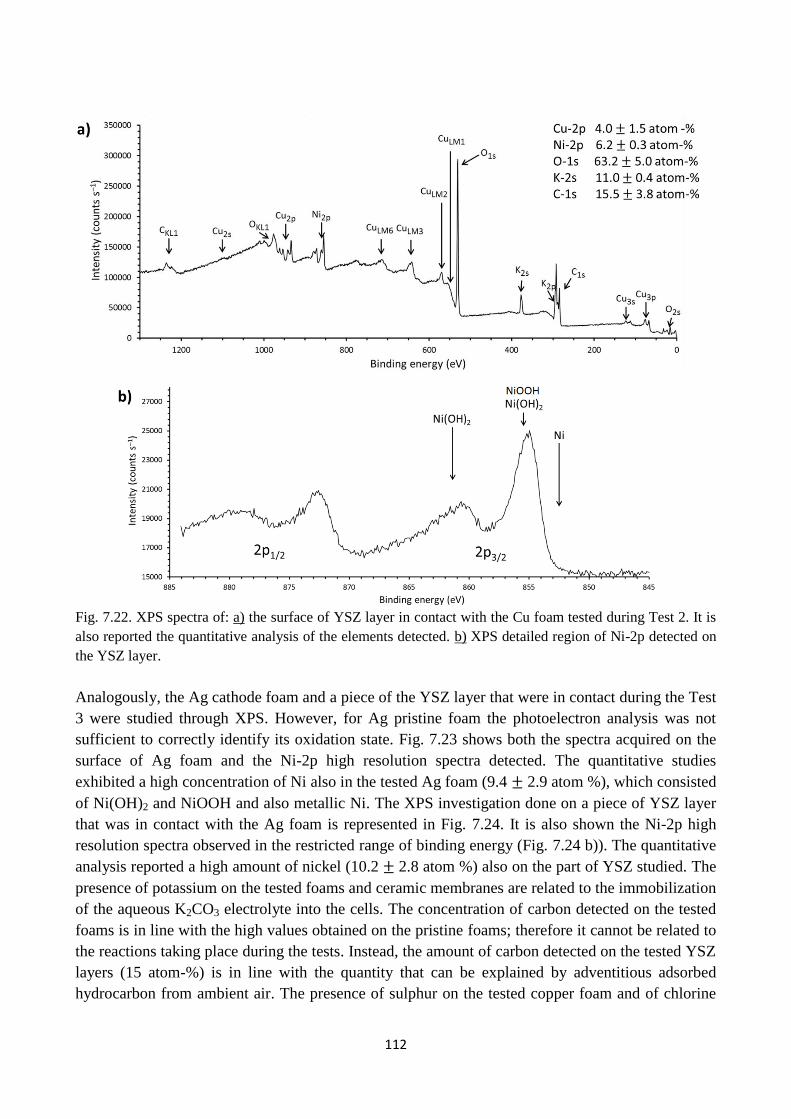
112
Fig. 7.22. XPS spectra of: a) the surface of YSZ layer in contact with the Cu foam tested during Test 2. It is
also reported the quantitative analysis of the elements detected. b) XPS detailed region of Ni-2p detected on
the YSZ layer.
Analogously, the Ag cathode foam and a piece of the YSZ layer that were in contact during the Test
3 were studied through XPS. However, for Ag pristine foam the photoelectron analysis was not
sufficient to correctly identify its oxidation state. Fig. 7.23 shows both the spectra acquired on the
surface of Ag foam and the Ni-2p high resolution spectra detected. The quantitative studies
exhibited a high concentration of Ni also in the tested Ag foam (9.4 ± 2.9 atom %), which consisted
of Ni(OH)2 and NiOOH and also metallic Ni. The XPS investigation done on a piece of YSZ layer
that was in contact with the Ag foam is represented in Fig. 7.24. It is also shown the Ni-2p high
resolution spectra observed in the restricted range of binding energy (Fig. 7.24 b)). The quantitative
analysis reported a high amount of nickel (10.2 ± 2.8 atom %) also on the part of YSZ studied. The
presence of potassium on the tested foams and ceramic membranes are related to the immobilization
of the aqueous K2CO3 electrolyte into the cells. The concentration of carbon detected on the tested
foams is in line with the high values obtained on the pristine foams; therefore it cannot be related to
the reactions taking place during the tests. Instead, the amount of carbon detected on the tested YSZ
layers (15 atom-%) is in line with the quantity that can be explained by adventitious adsorbed
hydrocarbon from ambient air. The presence of sulphur on the tested copper foam and of chlorine
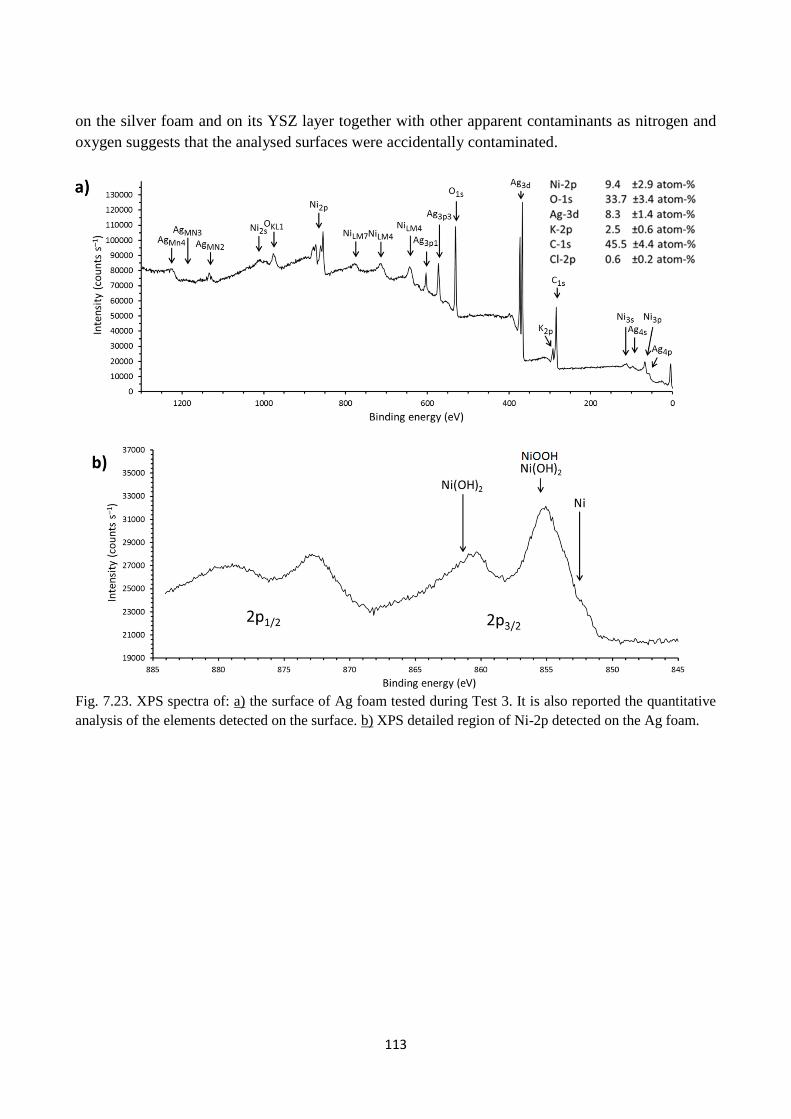
113
on the silver foam and on its YSZ layer together with other apparent contaminants as nitrogen and
oxygen suggests that the analysed surfaces were accidentally contaminated.
Fig. 7.23. XPS spectra of: a) the surface of Ag foam tested during Test 3. It is also reported the quantitative
analysis of the elements detected on the surface. b) XPS detailed region of Ni-2p detected on the Ag foam.
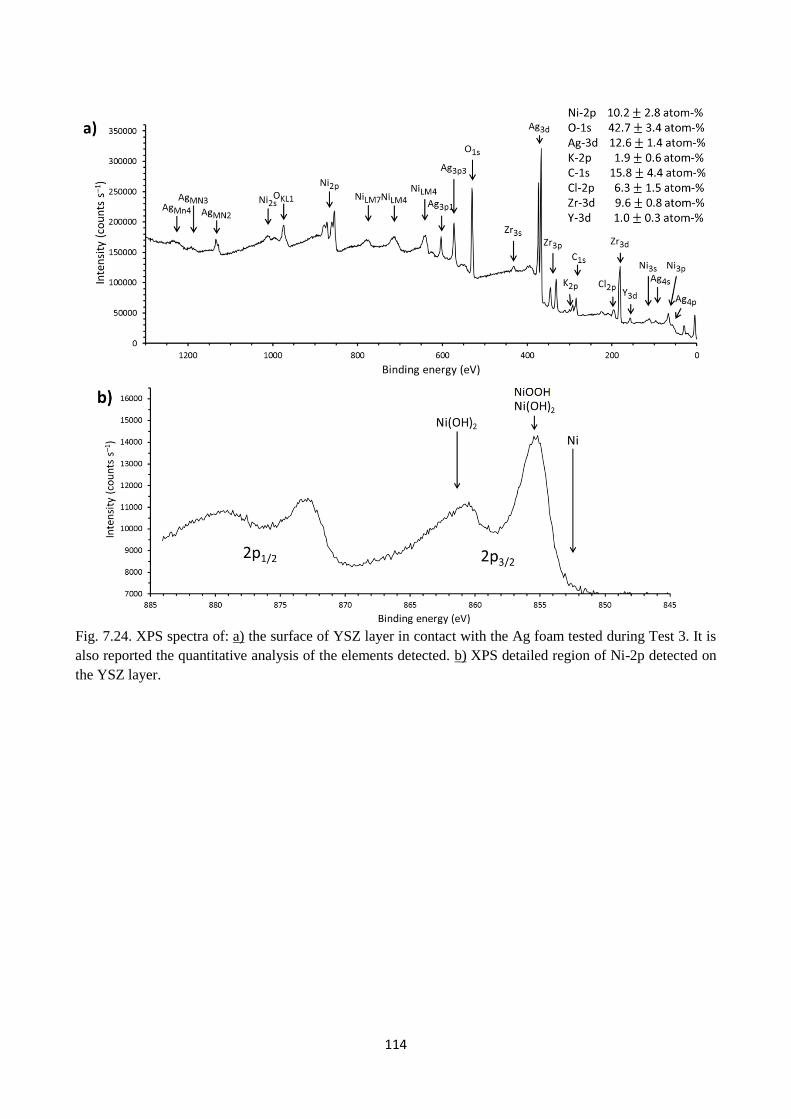
114
Fig. 7.24. XPS spectra of: a) the surface of YSZ layer in contact with the Ag foam tested during Test 3. It is
also reported the quantitative analysis of the elements detected. b) XPS detailed region of Ni-2p detected on
the YSZ layer.
115
7.4 Discussion
7.4.1 Electrochemical performance and microstructure
The tested cells were prepared to be identical, i.e. to have the same electrolyte matrix tape thickness
and to be immobilized with the same aqueous electrolyte. Nonetheless a minor variation could be
expected due to the usage of fabrication techniques as hot pressing of the nickel foam electrodes
and lamination of the ceramic tapes which might not ensure identical cells. In addition, minor
fractures of the YSZ tape could occur while setting the cell to the sample holder prior to be tested.
Thus as expected, the initial values of the serial resistance, Rs, were similar for the different cells
tested at a given temperature as reported above. Indeed the first recorded Rs was ca. 2.5 Ω·cm2 from
the EIS spectra, when the cells were polarized at -2.5 V and at pressures of 3 bar and 5 bar. The
following parameters were taken into account to estimate the value of the serial resistance:
electrolyte matrix tape thickness of ca. 400 μm and a porosity of 45 %, conductivity (σ) of 0.5 M
K2CO3 immobilized in similarly porous ceramic matrix of ca. 0.025 S/cm 27
as well as electrode
thickness of ca. 500 μm both for the anode and for the cathode. Based on this Rs was calculated to
be ca. 1 Ω·cm2, according to the equation:
Rs = (1
𝜎) · (
𝑑
𝐴𝑐𝑒𝑙𝑙), in which d represents the thickness of the tape, σ the conductivity and Acell the
nominal are of the electrode (2 cm2). The measured Rs were higher than the calculated value, as
seen in Fig. 7.10, 7.12 and Fig. 7.15. One possible explanation could be poor percolation for the
ionic and the electronic phases in the electrodes. Another reason could be related to a resistive
contribution from the interface between the electrodes and the meshes used for current collection,
i.e. contact resistance. In addition, the interface between the copper or silver foam electrodes and
the ceramic matrix could represent another explanation, since the two parts were not sintered
together. Indeed, ideally the foam electrodes should have been embedded in the YSZ matrix and
then sintered together. Therefore, the ohmic losses can be reduced by improving the design and the
fabrication of the cell and also by reducing the thickness of the porous structure. The evaluation of
the conductivity of similar immobilized structures is relevant and was accomplished with the van
der Pauw technique by F. Allebrod et al.28
testing different concentration of KOH. EIS
measurements showed that the serial resistance increased already during the first hours of all the
tests at operating conditions. Indeed, during Test 0 the Rs increased gradually with time while
increasing the pressure, until the EIS spectra started to be unstable at 5 bar and -2.5 V of applied
voltage. The following EIS measurements at 10 bar and lower polarization of -1.75 V and -2 V
were again stable, and it was still possible to quantify both Rs (ca. 15 Ω·cm2) and the Rp.
Conversely the last EIS spectra recorded at 10 bar and -2.5 V was unstable and no analysis was
possible (Fig. 7.8 c)). A similar behaviour was observed in the EIS spectra recorded during Test 1
(Fig. 7.11 b)) and Test 3 (Fig. 7.16), in which only the highest polarization voltage was applied (-
2.5 V). Only during Test 2 it was possible to quantify the Rs for polarized cell at -2.5 V until the end
of the test, and it increased from ca. 2.5 Ω·cm2
to approximately 10 Ω·cm2 (Fig.7.12). Furthermore,
the Rs measured at OCV both for Test 1 and Test 3 increased when the EIS spectra started to be
unstable (Fig. 7.10 and Fig. 7.15). Also the polarization resistance was affected along the duration
of the tests both by the high applied voltages and by the consequent deterioration of the electrodes.
116
As reported by the EIS acquired during Test 0 at -1.75 V (Fig. 7.8 a) and at -2 V (Fig. 7.8 b), the
polarization resistance decreased with increasing pressure as it should. As mentioned in the
introduction, at elevated pressure the electrode kinetics were expected to be enhanced due to the
increased collision frequency of the reacting gas molecules at the triple phase boundary. This trend
was not observed when the cells were polarized to -2.5 V (Fig. 7.8 c)), conversely to what expected
by the Rp of gas diffusion electrodes12,29
. The CA measurements carried out before the EIS spectra
showed steady values for applied voltages of -1.75 V and -2 V (Fig. 7.10 a) and b)). The current
densities registered at -2.5 V were higher, but at 5 bar and in particular at 10 bar it increased from
30 mA/cm2 to 500 mA/cm
2 in two hours. Similarly, it occurred also during Test 1 (Table 7.3) and
Test 3 (Table 7.6). Only during Test 2 the current densities were almost steady until the end of the
test. The investigations of the tested foam electrodes and of the electrolyte porous matrix surfaces
together with the analysis of possible reactions at the electrodes may help rationalize the
electrochemical performances of the different tested cells in high pressure.
XPS analysis of the cells investigated during Test 2 and Test 3 indicated the presence of Ni(OH)2
and NiOOH on the YSZ porous layers facing the copper and the silver foam. Also the SEM images
confirmed the presence of an adjunctive black layer covering the YSZ surface (Fig. 7.18 c) and Fig.
7.19 c)). The mobility of nickel through the porous ceramic structure could be a consequence of
formation of Ni(OH)2 that would be dragged toward the interface when polarizing the cell30
. In
general, when a nickel metallic electrode is immersed in a aqueous alkaline solution, a film of the
hydrous Ni(II) oxide species, α-Ni(OH)2, is spontaneously formed31
. By electrochemical means or
by ageing (especially in more concentrated alkali solution) the α-Ni(OH)2 can dehydrate and
recrystallize as a largely anhydrous phase, denoted as β-Ni(OH)2 32
. According to B. Berverskog et
al.32
strong alkaline solutions corrode nickel by forming Ni(𝑂𝐻)3−, which is one of the hydrolysis
products of Ni (II). The nickel foam anode looked heavily oxidized after the test. The SEM analysis
could support the hypothesis of corrosion of the anodic nickel foam electrode, as shown in Fig.
7.20. It shows cuts and etchings on the frame even in the inner layers. The pores were partly
blocked by grown oxide layers, affecting the ability of the electrode to work as a gas diffusion
electrode. In addition the aluminum plate, used to improve the gas tightness, was in direct contact
with the nickel foam and it showed corrosion due to the interaction with the liquid K2CO3
immobilized along the foam33
. This aspect most likely worsened the contact in between the
electrode and the current collector; the constant growth of the serial resistance supports this
hypothesis. XPS investigations performed on the tested silver foam (Test 3) and on the YSZ surface
facing the electrode itself showed a similar concentration of Ni based compounds, i.e. 9.4 atom %
and 10 atom %, respectively. The binding energy registered for the Ni-2p peaks were associated to
Ni(OH)2 and NiOOH compounds. This result may help to justify the high current density observed
during the CA measurements from 20 bar until the end of the Test 3 and the corresponding instable
EIS spectra (Fig. 7.16 b)). Indeed, the presence of nickel based compounds from the anode side
through the interface between the cathode and the electrolyte matrix layer and to the cathode
surface itself could create a short circuit when polarizing the cell. This explanation can be valid also
for the Test 0 and Test 1, in which copper was used as cathode and high current density and instable
EIS spectra were recorded. In addition, for Test 0 and Test 1 the voltages recorded during the last
OCV measurements were low and oscillating around -5 mV and -20 mV, respectively.
117
The Ni-2p high resolution XPS spectra carried out on the tested silver foam reported the presence of
metallic nickel at 853 eV of binding energy (Fig. 7.23 b)), as expected after a cathodic reduction.
On the other hand, the cathodic reduction did not completely reduce Ni(OH)2 to Ni and after
reduction Ni(OH)2 was still present on the surface. This phenomenon was also observed and studied
by W. Visscher et al.34
who claimed that the conversion (recrystallization) from α-Ni(OH)2 to β-
Ni(OH)2 might alter the reducibility of the passive Ni(OH)2 film.
Conversely, XPS investigations on the copper foam used during Test 2 showed lower concentration
(1.5 atom %) of Ni based compound compared to what recorded on the YSZ surface that was facing
the electrode itself (6.2 atom %), as shown in Fig. 7.21 and Fig. 7.22 respectively. The binding
energy registered for the Ni-2p peaks were associated to Ni(OH)2 and NiOOH compounds. This
observation indicated that the majority of nickel percolation through the cell stopped at the YSZ
porous layer. Indeed, the current densities recorded during the CA measurements decreased
moderately throughout the test and showed stable values. Also the OCV measured during Test 2
reported more negative values compared to the other tests, varying around ca. -800 mV to -1100
mV at 2 bar after the ramp down phase at 25 °C and at 50 °C, respectively.
The slow degradation of the cell was also observed by EIS spectra, which exhibited increasing
values of serial and polarization resistance (Fig. 7.12). The formation and the gradual growth of the
oxide layer from the nickel foam towards the ceramic matrix, which might be aggravated by the
application of high voltages as -2.5 V, represent the main cause of degradation of the cell.
Using K2CO3 (aq) as electrolyte leads to the following equilibrium reactions in the electrochemical
cell:
𝐻2𝑂 + 𝐶𝑂32− ↔ 𝑂𝐻− + 𝐻𝐶𝑂3
−
𝐶𝑂2 + 𝑂𝐻− ↔ 𝐻𝐶𝑂3−
These equilibrium reactions can also be written as:
𝐶𝑂2 + 𝐻2𝑂 + 𝐶𝑂32− ↔ 2 𝐻𝐶𝑂3
−
This indicates that increasing the partial pressure of 𝐶𝑂2the equilibrium will be shifted to the right
and therefore the amount of 𝐻𝐶𝑂3− ions will also increase. This also suggests that the 𝐶𝑂2 partial
pressure can influence the possible charge carriers in the aqueous electrolyte.
The anode reaction (water oxidation) taking place on the Ni surface can be written as:
2𝐻2𝑂 ↔ 𝑂2 + 4 𝑒− + 4𝐻+
Or
4 𝑂𝐻− ↔ 𝑂2 + 4 𝑒− + 2𝐻2𝑂
While at the cathode 𝐶𝑂2 is reduced and 𝐻2𝑂 is involved as proton donor ( 𝑂𝐻− ) since the
electrochemical reactions occur in an aqueous solution. If the products are CO or methane the
reactions are as follows:
𝐶𝑂2 + 𝐻2𝑂 + 2𝑒− ↔ 𝐶𝑂 + 2 𝑂𝐻−
𝐶𝑂2 + 6𝐻2𝑂 + 8𝑒− ↔ 𝐶𝐻4 + 8 𝑂𝐻−
At the same potential as 𝐶𝑂2 reduction reaction occurs, it is also possible for water to be reduced to
make hydrogen, which is a concurrent reaction:
2𝐻2𝑂 + 2𝑒− ↔ 𝐻2 + 2 𝑂𝐻− .
Electrochemical impedance spectroscopy was used as a sensitive tool in studying these possible
reactions taking place on the gas diffusion electrodes. The most stable EIS spectra for both copper
118
and silver foams were recorded at 3 bar and 25 °C and were modelled by a resistor Rs in series with
three (RQ) circuits, as shown in Fig. 7.14 and Fig. 7.17, respectively. In particular, the main focus
was to rationalize the low frequency part of the EIS spectra, because it was affected first during the
experiments. Post characterization of the nickel anode by SEM revealed that it had degraded
significantly. This might have had an impact on the oxygen evolution reaction, which most
probably takes place at the anode at high cell voltage/current densities. The oxidation reaction at the
anode at lower current densities is oxidation of H2 to H2O. Therefore, it is possible to hypothesize
that the low frequency semicircle of the EIS spectra could be related to oxidation/reduction
reactions of the Ni oxidation products. On suitable polarization Ni(OH)2 is oxidised to β-NiOOH35
which is an electrocatalyst for the OER36
.
The pseudocapacitance describing the low frequency semicircle is estimated to be 4.8 ·10-2
F/cm2
for the copper foam tested during Test 2, and 4.3 ·10-2
F/cm2 for the silver foam of Test 3, using the
method described by T. Jacobsen et al37
. The nominal area of the electrode was of 2 cm2. However,
it is reasonable to consider that the effective area was significantly smaller, since the cathode foam
was not embedded in the ceramic matrix. Here, due to different average pore size, 0.7 cm2
and 0.6
cm2
are assumed for copper and silver foams, respectively.
The estimated charge density involved in the Ni(OH)2 oxidation is 41 C/cm3, knowing that its cell
unit has a volume of 39 Å3
and assuming that with a 20 mV peak to peak amplitude only 1% of
Ni(II) is available for charge transfer to Ni(III). With these assumptions, it is calculated that the
thickness (t) of the passive oxide film formed by the oxidation of nickel hydroxides was 235 nm
and 210 nm for copper and silver, respectively. Nickel passive layers have p-semiconductive
properties38
. It results from the high number of defects constituted by vacancies or inserted species
as protons which can move in the lattice thanks to the ionic conduction of the layer. According to
literature39,40
, the conductivity (σ) of Ni oxyhydroxide is ca. 10-5
S/cm at 25 °C. Therefore it is
possible to calculate the passive layer resistances (Rl) on copper and silver electrodes according to
the equation: 𝑅𝑙 = (1
𝜎) · (
𝑡
𝐴𝑒𝑓𝑓) , in which t represent the thickness of the layers and Aeff the
effective area of the electrodes. The 𝑅𝑙 of the passive oxide films are 3.3 Ω on copper foam and 3.5
Ω on silver foam electrodes. These 𝑅𝑙 values are in agreement with the measured resistances
associated to the low frequency semicircles, which are 3.4 Ω and 5.8 Ω for copper and silver as
shown in Fig. 7.14 and Fig. 7.17, respectively.
7.4.2 CO2 reduction products
Measurements with a gas chromatograph connected to the sample holder inside the test rig were
performed, in order to identify gaseous products at the cathode as the cells were operated under
applied cell voltages of -1.75 V, - 2 V and most of all at -2.5 V. Throughout the whole series of
measurements acquired during Test 0 when applying a potential of -1.75 V no concentration
changes or new compounds were detected with the gas chromatograph. In addition, only small
concentrations of H2 were detected when the applied voltage was changed to -2 V. A possible
explanation to these results is that the cell was tested at relatively low applied cell voltages giving
low overpotentials at the cathode. It has been reported in several scientific studies that low
overpotentials favour hydrogen evolution41
. Another reason could be that a product as formate ion
119
might have been produced in small concentration at low overpotentials, but not detected by the gas
chromatograph. Only when polarizing the cell at -2.5 V it was possible to detect CO on copper
cathode metal foams. The CO faradaic efficiency was the highest during the first electrolysis
measurements as observed both for Test 0 and Test 1. Indeed, along Test 1 the FE of CO went from
4 % to 0.75 %, even if the pressure increased from 5 to 10 bar. According to the results obtained by
K. Hara et al.42
increasing the CO2 pressure should increase the production efficiency of CO and/ or
HCOOH. The cell tested along Test 1 degraded prior to have the possibility of observing this trend
for the faradaic efficiency. Similarly it happened to the cell of Test 0. On the other hand, when the
cell was more stable, as it happened during Test 2, the CO faradaic efficiency started to increase
when increasing the pressure from 3 bar to 5 bar. In addition, CH4 was detected at 2 bar and 25 °C,
when the pressure was decreased from 5 bar. Increasing the temperature from 25 °C to 50 °C did
not affect the faradaic efficiency of the products obtained. This might be explained by the too low
difference in temperature and by the decreasing current density registered along the test conducted
at 50 °C, due to degradation of the cell. On the other hand the main product obtained during the
electrolysis test done on copper foam was H2 produced by reduction of water at the cathode.
The performance of Ag cathode metal foam confirmed its higher selectivity for CO2 reduction to
CO. The highest CO faradaic efficiency (up to 50 %) was obtained at the beginning of the Test 3
during the chronoamperometric measurements at 3 and 4 bar of pressure and 25 °C, when the cell
was stable. A further evaluation of this type of cell design is possible by considering the overall
performance of the cell. To this end, it is relevant to calculate the energy efficiency ε, which is
defined as the thermal energy obtained by the combustion of CO and H2 over the electrical energy
consumed during electrolysis.
The energy efficiency is defined as 10
ε = (∆𝑟𝐻𝐶𝑂0 · 𝐹𝐸𝐶𝑂 + ∆𝑟𝐻H2
0 · 𝐹𝐸𝐻2)/2𝐹 · 𝑉 ,
where Δr𝐻𝐶𝑂0 and Δr𝐻𝐻2
0 are the enthalpy changes of the following reaction:
CO2 ↔ CO + ½ O2 with a Δr𝐻𝐶𝑂0 = 283 kJ/mol
H2O ↔ H2 + ½ O2 with a Δr𝐻𝐻20 = 286 kJ/mol
FECO and FEH2 is the faradaic efficiency of CO and H2, while F is the Faraday constant and V the
total cell voltage. During the initial chronoamperometric measurements at 3, 4 and 5 bar the energy
efficiency was almost constant, ca. 0.58. Then it started to decrease as the current densities
increased along the duration of the test.
The presence of impurities as silicon, sodium, nitrogen in pristine copper foam and of chlorine and
sulfur in pristine silver foam might hinder and affect the selectivity for CO2 reduction. Indeed, CO2
reduction is highly surface sensitive reaction7. Therefore, this is pointing out the need for more
specific precautions and attentions while handling the metal foams.
The formation of nickel based compounds on the surface of the cathode foam, as observed by XPS
measurements, might influence the selectivity towards H2 evolution. Nickel is a metal catalyst that
binds strongly CO and therefore hydrogen from competing water reduction is the main product
observed7.
120
Unfortunately, it is not possible to correlate the present results with those reported in the literature
for analogous catalysts and aqueous alkaline electrolytes, since the voltages applied in this study
cannot be directly compared to the overpotentials measured in other work. Here, the correlation
between the cathode and the anode overpotential is unknown and also the correlation between the
cathode overpotential and the standard hydrogen electrode is unknown. This suggests the need for
additional measurements using a three-electrode setup, which permits for individual
characterization of the anode and the cathode overpotentials, respectively.
7.4.3 CO2 reduction on copper foam electrodes: a comparison
Unfortunately it is not possible to do an accurate comparison between the performances obtained on
the copper foam electrode in aqueous media at ambient condition and in the immobilized cell at
high pressure. The electrochemical device, custom made by K. Kuhl et al.43
, allowed to carry out
experiments with a three electrode cell setup, fundamental to determine the overpotential at which
the different products of the CO2 fixation were reduced. The tests in the immobilized cell at high
pressure, instead, were conducted in a two electrode cell setup so it was unknown the correlation
between the cathode overpotential and the reference electrode. Therefore it is not possible to
compare the onset potentials of the different reduction products. In addition, the experimental
method implemented by K. Kuhl et al.43
for the identification and quantification of the gaseous and
liquid products was highly sensitive. It allowed to detect sixteen different products on the copper
foil electrode. This method, indeed, permitted to identify seven products on the copper foam
electrode tested up to -0.98 V vs RHE. H2, formate and CO were the main products observed and in
particular the faradaic efficiency of H2 was ca. 90 %. Similarly, the gas analysis performed during
the tests on the immobilized cell at high pressure indicated a high faradaic efficiency for the
evolution of H2, i.e. between 92 to 99 %. The other products detected were CO and during one test
also methane was identified. On the other hand it was not possible to analyse the aqueous
electrolyte after the tests, therefore no information about formation of liquid products is available.
Both testing methods utilized resulted in an elevated hydrogen faradaic efficiency, even though the
experimental conditions were different. This might be explained by the porous structure of the
copper foams utilized in both setups. The applied potential is not well defined throughout the
thickness of the electrode, as already described in Chapter 6.
121
7.5 Conclusions
Electrochemical cells were realized by assembling metal foam based electrodes to a porous YSZ
matrix. The cathode foams were not sintered together and therefore not embedded with the ceramic
matrix. Potassium carbonate with a concentration of 0.5 M was immobilized in the porous YSZ
layers to form the electrolyte matrix. Tests were conducted using copper and silver-foam cathodes
and nickel-foam anodes and were performed generally at room temperature and at total pressures up
to 20 bar in two distinct gas atmospheres on the cathode and anode side. The aim of the tests was
not only to reduce CO2/H2O into syngas, hydrocarbons and alcohols, but also to collect results on
the electrochemical performance of cells made by a new fabrication method. One test was carried
out on copper foam cathode at three different voltages, i.e. -1.75 V, -2 V and -2.5 V, at ambient
temperature and at pressure up to 10 bar (Test 0). The best performance in terms of current densities
was obtained at the most negative voltage, but in parallel the degradation of the nickel foam anode
occurred. SEM images support the hypothesis of corrosion of the anodic nickel foam electrode.
Furthermore, with XPS spectroscopy it was possible to detect Ni based compounds, such as
Ni(OH)2 and NiOOH, from the anode side through the interface between the cathode and the
electrolyte matrix layer and to the cathode surface itself. This could potentially create a short circuit
when polarizing the cell. The gradual growth of this passive oxide film formed by the oxidation of
nickel hydroxide had an effect both on serial resistance and on polarization resistance of the cells.
For example, along Test 1 the Rs increased from 2.5 Ω·cm2 to 7.5 Ω·cm
2 in ca. 50 hours, while
increasing the pressure from 5 to 20 bar and then decreasing it to 10 bar and applying a potential of
-2.5 V. Afterwards, the cell started to be unstable and it was not possible to identify both the Rs and
the Rp. The test which gave the best performance in terms of cell stability was Test 2, since the cell
was stable for more than 55 hours along the different pressures and also when increasing the
temperature from 25 ⁰C to 50 ⁰C. In addition, also the average current density registered when
polarizing the cell at -2.5 V was stable during the two hours of chronoamperometry.
Gas chromatography, electrochemical impedance spectroscopy and chronoamperometry were
conducted in order to evaluate the cell performance with respect to the reduction of CO2, and the
evidence of it was found in all the tests when the most negative voltage was applied, i.e. -2.5 V.
When copper was used as electrocatalyst, a high faradaic efficiency for the evolution of H2, i.e.
between 92 to 99 % was registered. The other products detected were CO and during one test (Test
2) also methane was identified. The performance of Ag cathode metal foam confirmed its higher
selectivity for CO2 reduction to CO. The highest CO faradaic efficiency (up to 50 %) was obtained
at the beginning of the Test 3 at 3 and 4 bar of pressure and 25 °C, when the cell was stable.
The formation of passive oxide layers and the subsequent degradation of nickel foam electrodes,
already at room temperature and after few hours of testing, clearly show the need for other
electrodes materials suitable for oxygen evolution reactions.
122
References
1 C. Graves, S.D. Ebbesen, M. Mogensen, K.S. Lackner, Renewable and Sustainable Energy
Reviews, 15 (2011) 1-23. 2 Y. Hori, K. Kikuchi, S. Suzuki, Chemistry Letters, 14 (1985), 1695-1698.
3 M. Gattrell, N. Gupta, A. Co, Journal of Electroanalytical Chemistry, 594 (2006), 1-19.
4 Handbook of Fuel Cells: Fundamentals, Technology and Application; Hori, Y., Ed.; VHC-Wiley:
Chichester, 2003; Vol. 2. 5 M. Jitaru, D.A.Lowy, M. Toma, B. C. Toma, L. Oniciu, Journal of Applied Electrochemistry 27
(1997), 875. 6 K. Watanabe, U. Nagashima, and H. Hosoya, Chemical Physics letters, 209 (1993) 109-110.
7 Y. Hori, in Modern aspects of electrochemistry, ed. C. Vayenas, R. White, and M. Gamboa-
Aldeco, Springer, New York, 2008, vol. 42, pp. 89-189. 8 M. Mogensen, ECS Transactions. 41 (2012) 3-11.
9 E. J. Dufek, T. E. Lister, and M. E. McIlwain, Journal of Applied Electrochemistry, 41, 623
(2011). 10
C. Delacourt, P. L. Ridgway, J. B. Kerr, and J. Newman, Journal of Electrochemical Society, 155,
B42 (2008). 11
D.T. Whipple, E.C. Finke, P.J. Kenis, Electrochemical and Solid-State Letters. 13 (2010) B109-
B111. 12
A. Momma, K. Takano, Y. Tanaka, T. Kato, A. Yamamoto, ECS Transaction, 57 (2013) 699. 13
K. Hara, T. Sakata, Bull. Chem. Soc. Jpn. 70 (1997) 571-576. 14
K. Hara, A. Kudo, T. Sakata, Journal of Electroanalytical Chemistry. 391 (1995) 141-147. 15
K. Hara, A. Kudo, T. Sakata, M. Watanabe, Journal of Electrochemical Society, 142 (1995) L57-
L59. 16
S. Nakagawa, A. Kudo, M. Azuma, and T. Sakata, Journal of Electroanalytical chemistry, 308
(1991) 339. 17
K. Hara, A. Kudo, and T. Sakata, Journal Electroanalytical Chemistry, 421(1–2), 1 (1997). 18
E. J. Dufek, T. E. Lister, S. G. Stone, M. E. McIlwain, Journal of the Electrochemical Society,
159 (2012) F514-F517. 19
F. Allebrod, C. Chatzichristodoulou, M.B. Mogensen, Journal of Power Sources, 229 (2013) 22-
31. 20
J. Banhart, Progress in Materials science, 46 (2001) 559-632. 21
F. Bidault, D. J. L. Brett, P. H. Middleton, N. Abson, N. P. Brandon, International Journal of
Hydrogen Energy, 34 (2009) 6799-6808. 22
F. Allebrod, C. Chatzichristodoulou, M.B. Mogensen, Journal of Power Sources, 229 (2013) 22-
31. 23
F. Allebrod, C. Chatzichristodoulou, M. B. Mogensen, ECS Transactions, 64 (3) (2014) 1029-
1038. 24
C. Chatzichristodoulou, F. Allebrod, and M. Mogensen, Review of Scientific Instruments, 84
(2013) 054101. 25
ref. http://xpssimplified.com/elements/copper.php 26
J.R. MacDonald, E. Barsoukov, Impedance Spectroscopy, J. R. MacDonald, Wiley and Sons,
Second Edition, New York, 2005. 27
Pia Lolk Mollerup, “New Electrolytes for CO2 Electrolysis cells”, Department of Energy
Conversion and Storage, Technical University of Denmark, December 2012.
123
28
F. Allebrod, C. Chatzichristodoulou, P. L. Mollerup, M. B. Mogensen, International Journal of
Hydrogen Energy, 37 (21) (2012) 16505 – 16514. 29
J. Nielsen, T. Jacobsen, M. Wandel, Electrochimica Acta 56 (2011) 7963–7974. 30
A. Hauch, S. D. Ebbesen, S. H. Jensen, M. Mogensen, Journal of Electrochemical Society, 2008,
155, B1184. 31
A. Seghiouer, J. Chevalet, A. Barhoun and F. Lantelme, Journal of Electroanalytical Chemistry,
442 (1998) 113. 32
B. Beverskog, I. Puigdomenech, Corrosion Science, (1997) 39,5, 969-980. 33
O. R. Brown, J. S. Whitley, Electrochimica Acta, 32 (1987), 545-556. 34
W. Visscher, E. Barendrecht, Electrochimica Acta, (1979) , 25, 651-655. 35
Miles, M. H., Kissel, G., Lu, P. W. T. and Srinivasan, S., Journal of the Electrochemical Society,
1976, 123, 332. 36
Kibria, M. F. and Mridha, M. S. H., International Journal of Hydrogen Energy, 1996, 21, 179. 37
T. Jacobsen, B. Zachau-Christiansen, L. Bay and S. Skaarup, Proceedings of the 17th Risø
International Symposium on Materials Science — 1996, pp. 29 - 40. 38
G. Barral, F. Njanjo-Eyoke and S. Maximovitch, Electrochimica Acta 40, 28 15 (1995). 39
A. Motori, F. Sandrolini and G. Davolio, Journal of Power Sources, 48 (1994) 361-370. 40
Ref. [8] in G. Barral, S. Maximovitch and F. Njanjo-Eyoke, Electrochimica Acta, 41 (1996)
1305-1311. 41
Y. Hori, A. Murata, R. Takahashi, Journal of the Chemical Society, Faraday Transactions 1:
Physical Chemistry in Condensed Phases, 85 (1989) 2309 – 2326. 42
K. Hara, A. Tsuneta, A. Kudo, T. Sakata, Journal of Electrochemical Society, 141, (1994) 2097 –
2103 43
K. P. Kuhl, E. R. Cave, D. N. Abram and T. F. Jaramillo, Energy & Environmental Science, 5
(2012) 7050 – 7059.

124

125
Part IV
OVERALL DISCUSSION, CONCLUSION
AND FUTURE OUTLOOK
126
Chapter 8
Overall Discussion and Conclusions The purpose of this exploratory thesis work was to develop and investigate electrolyte materials and
electrodes for production of hydrocarbons and alcohols via electrochemical reduction of CO2 at
elevated pressure and temperatures below 300 ⁰C.
8.1 Overall Discussion and Outlook
Two types of electrolytes were tried in this study. First, it was attempted to find a solid electrolyte
with a conductivity of minimum 10-3
S/cm at the operation temperature below 300 C. The reason
for wishing a solid electrolyte is the simplicity solid – gas system with no need to handle a liquid,
e.g. the demand to the gas diffusion electrode of being able to keep gas diffusion pathways free of
liquid under all circumstance is removed. Next, as the work of developing a proper solid electrolyte
was not successful, an immobilised liquid electrolyte was selected.
The solid electrolytes studied were BaCe1-x-yZryYxO3-δ (x; y) = (0.1; 0.9) – (0.1; 0.4) – (0.2; 0.6)
electrolytes sintered by solid state reactive sintering and Ba0.92K0.08Zr0.9Y0.1O3-δ electrolyte
synthesized by hydrothermal method. The conductivity of these compounds was studied in wet
H2/N2 and in CO2/H2/N2 gas mixtures at a total pressure of up to 50 bar and temperature of 240 °C
for the first time. The highest conductivity values were found for the compound with the highest Ce
content (BCZY541), reaching a value of 10-3
S/cm at pH2O = 25 bar. Increasing pH2O from 10 to
25 bar resulted in almost one order of magnitude increase in the conductivity of BCZY541. On the
contrary, the conductivity of BCZY262 dropped irreversibly by one order of magnitude for pH2O >
5 bar. These changes are most probably associated with the formation of Ba(OH)2 at the grain
boundaries, which enhances the conducting properties of the BCZY541 cell, but decreases the
conductivity of the BCZY262 cell due to the formation of micro-cracks. The resistivity of BZY91
and BKZY91 gradually decreased by increasing pH2O, which was found to arise from a positive
influence of increasing pH2O on the grain boundary conductivity of both electrolytes. The total
conductivity of BKZY91 measured at high steam partial pressures was slightly higher compared to
the values obtained with BZY91. It went from 5.8·10-6
S/cm to 2·10-5
S/cm and from 7·10-6
S/cm to
3·10-5
S/cm for BZY91 and BKZY91 respectively, when increasing the pH2O from 2.5 bar to pH2O
= 25 bar. BKZY91 showed higher conductivity compared to BZY91 also in ambient pressure. At
temperature below 300 °C the highest conductivity was 8.3 ·10-6
S/cm for BKZY91 and 5·10-6
S/cm for BZY91, both at pH2O of 0.1 bar. BKZY91 and BZY91 could represent a suitable
electrolyte for CO2 reduction thanks to their stability during conductivity measurements (comparing
XRD before and after conductivity testing). However, in order to be considered for implementation
in full cells, the electrolyte should have showed a total conductivity of ca. 10-3
S/cm at intermediate
temperature (below ~ 300 °C) and in high steam partial pressure. This value in conductivity was
reached by these electrolytes only at temperatures above 440 °C and at a pH2O of 0.1 bar. On the
other hand, conductivities above 10-3
S/cm for temperature below ~ 300 °C were obtained only in
grain boundary – free Y doped barium zirconate films grown by pulsed laser deposition (PLD) on
127
single-crystal (100) - oriented MgO1. The non-conductive grain boundary region dominated the
conductivity in both electrolytes, even if it was observed a better performance for BKZY91.
Investigations of the grain boundary chemical composition of the different tested electrolytes need
to be performed with TEM imaging2 and/or atom-probe tomography
3, in order to achieve a better
understanding of the highly resistive grain boundary region. Hydrothermal synthesis has proven to
be a valid process to synthesize microcrystalline K- doped BaZr0.9Y0.1O3-δ powder. The motivation
behind the decision to synthesize this compound was related to the fact that an alkali oxide should
have been an effective dopant due to its high basicity4, which is reported to enhance the water
uptake capacity. Further studies should be performed to confirm this hypothesis via
thermogravimetric analysis and also on the synthesis method varying the hydrothermal treatment
temperature and time in order to observe possible variation in the particle sizes of the as synthesized
powders. The concentration of the potassium hydroxide solution should be varied to investigate the
relation between the concentration of the solution and the mol% of potassium in the A-site of the
perovskite.
BCZY541 would have been the best electrolyte candidate because of its low resistivity in high
pH2O even at temperatures as low as 240 °C. However, the instability in the acidic CO2 gas
atmosphere hinders practical application for carbon dioxide reduction at high pressure.
The study of proton conducting Y-doped BaCeO3-BaZrO3 solid solutions did not provide a clear
electrolyte candidate. Therefore a known aqueous alkaline based electrolyte was considered in order
to make a full cell. Thus, the focus was moved to the selection of electrode materials and
electrochemical characterization of cells and analysis of the CO2 reduction products formed.
Aqueous 0.1 M KHCO3 is a common electrolyte used for reduction of CO2 in ambient conditions. It
was also utilized as electrolyte in the highly sensitive experimental setup developed by K. Kuhl et
al.5
, during the investigation of copper foams as electrocatalysts for CO2 conversion. The
identification and quantification of the reduction products as a function of the applied potential was
the main focus of this study. The comparison between a copper foam and a smooth electropolished
copper electrode revealed that the different roughness of the two electrode surfaces affected the
current densities registered during the one hour long potentiostatic experiments. The current
densities achieved on copper foams are ca. 5 times higher than the values obtained at the same
potentials with smooth copper foil electrodes. Accurate Brunauer–Emmett–Teller (BET)
measurements of the effective surface area of copper foams are necessary to establish a fundamental
comparison, i.e. is this a pure effect of surface area or is it also due to differences in surface
structures.
The products detected with a higher faradaic efficiency on the copper foam electrode tested to -0.98
V vs. RHE were H2, formate and CO. In particular, the faradaic efficiency of H2 was ca. 90 %. The
comparison with K. Kuhl results suggested that the porous electrodes facilitate reaction pathways
that are different from those that take place on smooth electrodes, due to graded potentials in the
electrolyte through the Cu foam perpendicular to the electrode/electrolyte interface, and to possible
differences in surface structure and purity. The products formed during the electrochemical
reduction of CO2 are affected by the electrode structure and design. Further studies that investigate
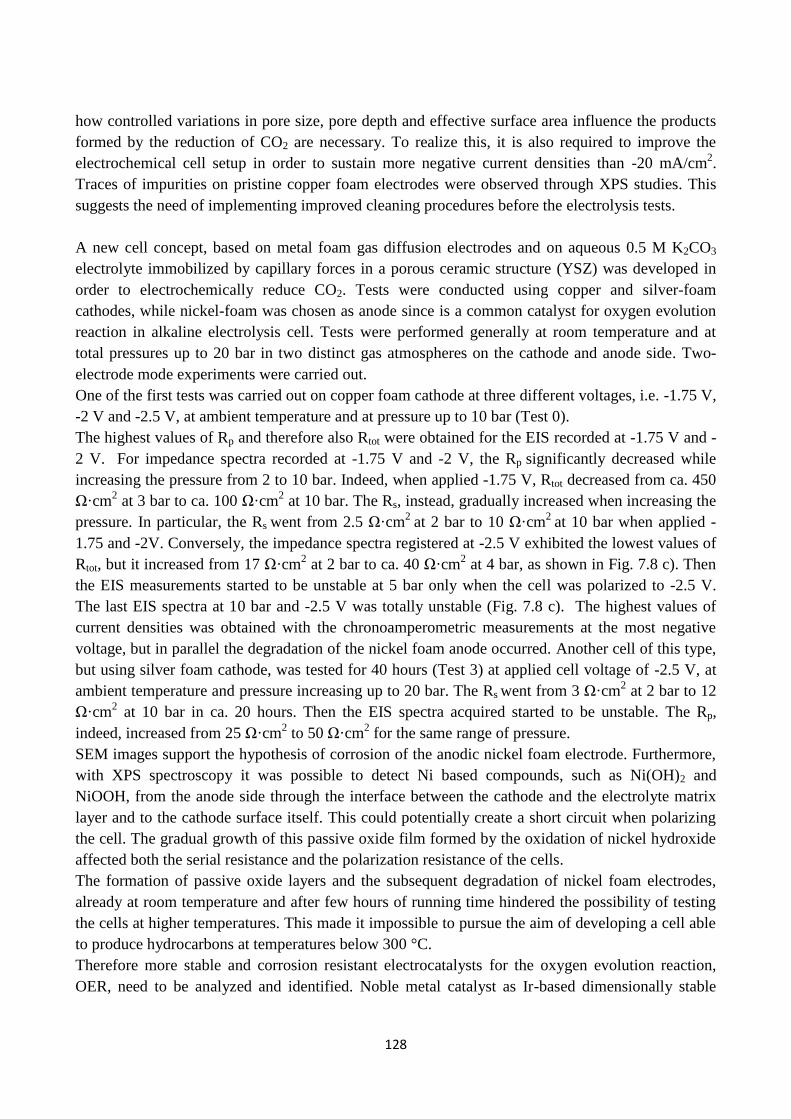
128
how controlled variations in pore size, pore depth and effective surface area influence the products
formed by the reduction of CO2 are necessary. To realize this, it is also required to improve the
electrochemical cell setup in order to sustain more negative current densities than -20 mA/cm2.
Traces of impurities on pristine copper foam electrodes were observed through XPS studies. This
suggests the need of implementing improved cleaning procedures before the electrolysis tests.
A new cell concept, based on metal foam gas diffusion electrodes and on aqueous 0.5 M K2CO3
electrolyte immobilized by capillary forces in a porous ceramic structure (YSZ) was developed in
order to electrochemically reduce CO2. Tests were conducted using copper and silver-foam
cathodes, while nickel-foam was chosen as anode since is a common catalyst for oxygen evolution
reaction in alkaline electrolysis cell. Tests were performed generally at room temperature and at
total pressures up to 20 bar in two distinct gas atmospheres on the cathode and anode side. Two-
electrode mode experiments were carried out.
One of the first tests was carried out on copper foam cathode at three different voltages, i.e. -1.75 V,
-2 V and -2.5 V, at ambient temperature and at pressure up to 10 bar (Test 0).
The highest values of Rp and therefore also Rtot were obtained for the EIS recorded at -1.75 V and -
2 V. For impedance spectra recorded at -1.75 V and -2 V, the Rp significantly decreased while
increasing the pressure from 2 to 10 bar. Indeed, when applied -1.75 V, Rtot decreased from ca. 450
Ω·cm2 at 3 bar to ca. 100 Ω·cm
2 at 10 bar. The Rs, instead, gradually increased when increasing the
pressure. In particular, the Rs went from 2.5 Ω·cm2
at 2 bar to 10 Ω·cm2
at 10 bar when applied -
1.75 and -2V. Conversely, the impedance spectra registered at -2.5 V exhibited the lowest values of
Rtot, but it increased from 17 Ω·cm2 at 2 bar to ca. 40 Ω·cm
2 at 4 bar, as shown in Fig. 7.8 c). Then
the EIS measurements started to be unstable at 5 bar only when the cell was polarized to -2.5 V.
The last EIS spectra at 10 bar and -2.5 V was totally unstable (Fig. 7.8 c). The highest values of
current densities was obtained with the chronoamperometric measurements at the most negative
voltage, but in parallel the degradation of the nickel foam anode occurred. Another cell of this type,
but using silver foam cathode, was tested for 40 hours (Test 3) at applied cell voltage of -2.5 V, at
ambient temperature and pressure increasing up to 20 bar. The Rs went from 3 Ω·cm2 at 2 bar to 12
Ω·cm2 at 10 bar in ca. 20 hours. Then the EIS spectra acquired started to be unstable. The Rp,
indeed, increased from 25 Ω·cm2 to 50 Ω·cm
2 for the same range of pressure.
SEM images support the hypothesis of corrosion of the anodic nickel foam electrode. Furthermore,
with XPS spectroscopy it was possible to detect Ni based compounds, such as Ni(OH)2 and
NiOOH, from the anode side through the interface between the cathode and the electrolyte matrix
layer and to the cathode surface itself. This could potentially create a short circuit when polarizing
the cell. The gradual growth of this passive oxide film formed by the oxidation of nickel hydroxide
affected both the serial resistance and the polarization resistance of the cells.
The formation of passive oxide layers and the subsequent degradation of nickel foam electrodes,
already at room temperature and after few hours of running time hindered the possibility of testing
the cells at higher temperatures. This made it impossible to pursue the aim of developing a cell able
to produce hydrocarbons at temperatures below 300 °C.
Therefore more stable and corrosion resistant electrocatalysts for the oxygen evolution reaction,
OER, need to be analyzed and identified. Noble metal catalyst as Ir-based dimensionally stable
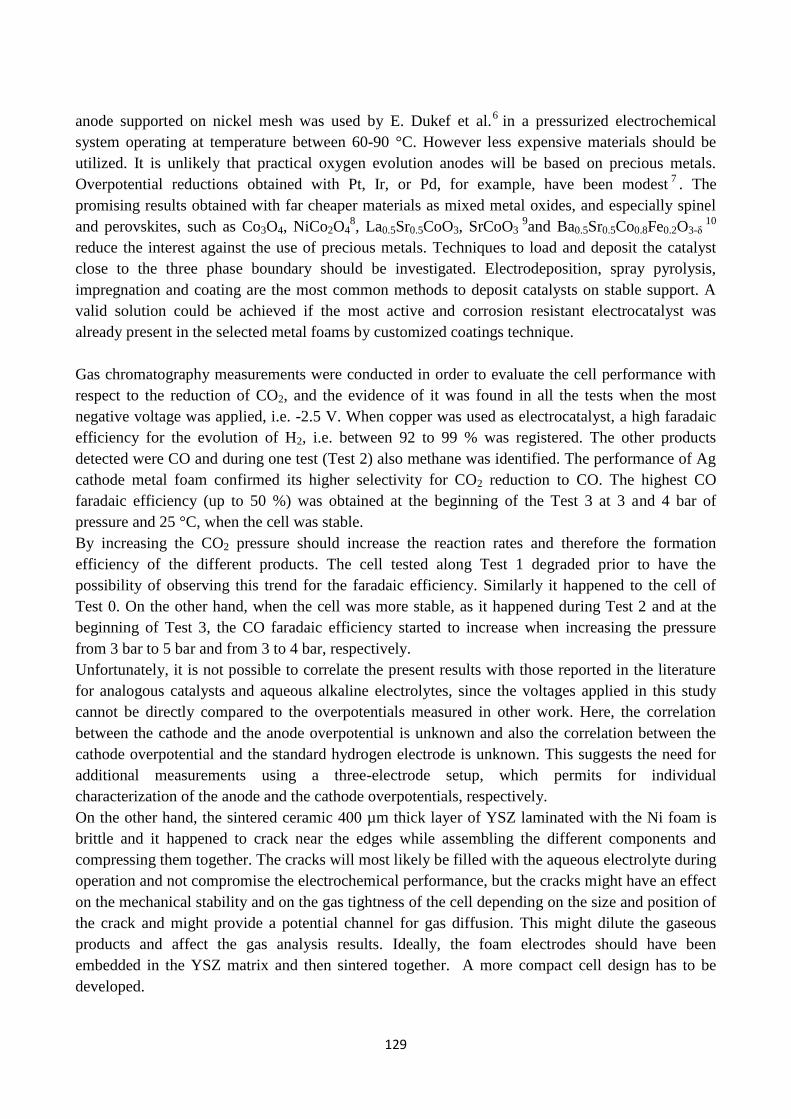
129
anode supported on nickel mesh was used by E. Dukef et al.6 in a pressurized electrochemical
system operating at temperature between 60-90 °C. However less expensive materials should be
utilized. It is unlikely that practical oxygen evolution anodes will be based on precious metals.
Overpotential reductions obtained with Pt, Ir, or Pd, for example, have been modest7. The
promising results obtained with far cheaper materials as mixed metal oxides, and especially spinel
and perovskites, such as Co3O4, NiCo2O48, La0.5Sr0.5CoO3, SrCoO3
9and Ba0.5Sr0.5Co0.8Fe0.2O3-δ
10
reduce the interest against the use of precious metals. Techniques to load and deposit the catalyst
close to the three phase boundary should be investigated. Electrodeposition, spray pyrolysis,
impregnation and coating are the most common methods to deposit catalysts on stable support. A
valid solution could be achieved if the most active and corrosion resistant electrocatalyst was
already present in the selected metal foams by customized coatings technique.
Gas chromatography measurements were conducted in order to evaluate the cell performance with
respect to the reduction of CO2, and the evidence of it was found in all the tests when the most
negative voltage was applied, i.e. -2.5 V. When copper was used as electrocatalyst, a high faradaic
efficiency for the evolution of H2, i.e. between 92 to 99 % was registered. The other products
detected were CO and during one test (Test 2) also methane was identified. The performance of Ag
cathode metal foam confirmed its higher selectivity for CO2 reduction to CO. The highest CO
faradaic efficiency (up to 50 %) was obtained at the beginning of the Test 3 at 3 and 4 bar of
pressure and 25 °C, when the cell was stable.
By increasing the CO2 pressure should increase the reaction rates and therefore the formation
efficiency of the different products. The cell tested along Test 1 degraded prior to have the
possibility of observing this trend for the faradaic efficiency. Similarly it happened to the cell of
Test 0. On the other hand, when the cell was more stable, as it happened during Test 2 and at the
beginning of Test 3, the CO faradaic efficiency started to increase when increasing the pressure
from 3 bar to 5 bar and from 3 to 4 bar, respectively.
Unfortunately, it is not possible to correlate the present results with those reported in the literature
for analogous catalysts and aqueous alkaline electrolytes, since the voltages applied in this study
cannot be directly compared to the overpotentials measured in other work. Here, the correlation
between the cathode and the anode overpotential is unknown and also the correlation between the
cathode overpotential and the standard hydrogen electrode is unknown. This suggests the need for
additional measurements using a three-electrode setup, which permits for individual
characterization of the anode and the cathode overpotentials, respectively.
On the other hand, the sintered ceramic 400 µm thick layer of YSZ laminated with the Ni foam is
brittle and it happened to crack near the edges while assembling the different components and
compressing them together. The cracks will most likely be filled with the aqueous electrolyte during
operation and not compromise the electrochemical performance, but the cracks might have an effect
on the mechanical stability and on the gas tightness of the cell depending on the size and position of
the crack and might provide a potential channel for gas diffusion. This might dilute the gaseous
products and affect the gas analysis results. Ideally, the foam electrodes should have been
embedded in the YSZ matrix and then sintered together. A more compact cell design has to be
developed.
130
8.2 Conclusions
The main purpose of this thesis was to search for materials necessary for making a cell, in which it
is possible to electrochemically reduce CO2 into hydrocarbons at elevated pressures and at
temperatures below ~300 °C. The long term goal is to make a basis for manufacturing of
commercially viable cells. This has been done by investigating and developing both electrolyte
materials and electrodes.
The investigations on proton conducting Y-doped BaCeO3-BaZrO3 solid solutions did not give a
clear electrolyte candidate, therefore aqueous alkaline based electrolytes were considered.
By testing copper foam as CO2 reduction catalyst in a highly sensitive experimental setup it was
possible to conclude that porous electrodes facilitate reaction pathways that are different from those
that take place on smooth electrodes, due to graded electrical potential in the electrolyte through the
Cu foam perpendicular to the electrode/electrolyte interface. The overpotential drops in the
electrolyte in the pores when moving away from the main electrolyte causing a gradient in the local
electrode overpotential11
. The main part of the reaction takes place on the copper surface near the
main electrolyte because that is giving the least loss in electrolyte resistance.
In addition, the impurities present on the catalyst surface might affect the product selectivity;
therefore implementing improved cleaning procedures before the electrolysis tests is necessary.
Newly developed and fabricated cells based on aqueous K2CO3 electrolyte immobilized in a
ceramic porous structure were tested during the study.
Gas diffusion electrodes as copper and silver foams were analysed as CO2 reduction catalysts, while
nickel foam was investigated as oxygen evolution reaction catalyst. The SEM analysis together with
XPS results showed significant corrosion of the anodic nickel foam electrode. Degradation of the
nickel foam anode compromised the electrochemical performance of the cells. The gradual growth
of a passive oxide film formed by the oxidation of nickel hydroxide had an effect both on serial
resistance and on polarization resistance of the cells.
The formation of CO during all the tests, when -2.5 V was the applied cell voltage, is the evidence
for reduction of CO2 on both copper and silver foams. In particular, methane was also detected on
copper foam at 2 bar and 25 °C, after the ramp down phase in pressure. The degradation of the
nickel electrode did not allow to study the effects of increasing operating pressures and temperature.
The fast corrosion of the Ni anode and the migration of Ni-ions through the electrolyte remain the
main problem to be solved and investigated.
131
References
1 D. Pergolesi, E. Fabbri, A. D’Epifanio, E. Di Bartolomeo, A. Tebano, S. Sanna, S. Licoccia, G.
Balestrino and E. Traversa, Nature Materials, 9 (2010) 846-852. 2 F. Iguchi, T. Tsurui, N. Sata, Y. Nagao and H. Yugami, Solid State Ionics, 180 (2009) 563.
3 S. Ricote, N. Bonanos, A. Manerbino, N.P. Sullivan and W. G. Coors, Journal of Materials
Chemistry A, 2 (2014) 16107-16115. 4 A. S. Patnaik, A. V Virkar, Journal of the Electrochemical Society, 153 (7) 1397-1405.
5 K. P. Kuhl, E. R. Cave, D. N. Abram and T. F. Jaramillo, Energy & Environmental Science, 5
(2012) 7050 – 7059. 6 E.J. Dufek, T.E. Lister, S.G. Stone, M.E. McIlwain, Journal of Electrochemical Society, 159
(2012) 514-517. 7 D.E. Hall, Journal of Electrochemical Society, 132 (1985) C41-C48.
8 M. Hamdani, R.N. Singh and P. Chartier, International Journal of Electrochemical Science, 5(4)
(2010) 556-577. 9 I.C. Man, H-Y. Su, F. Calle-Vallejo, H.A. Hansen, J.I. Martinez, N.J. Inoglu, J. Kitchin, T.F.
Jaramillo, J.K. Nørskov, J. Rossmeisl, ChemCatChem, 3 (2011) 1355. 10
J. Suntivich, K.J. May, H. Gasteiger, J.B. Goodenough, Y. Shao-Horn, Sicence, 334 (2011) 1383. 11
A. Lasia, Modeling of impedances of porous electrodes, in Modern Aspects of Electrochemistry,
ed. by M. Schlesinger, vol. 43 (Springer, New York, 2009), pp. 67–138.