Embed Size (px)
Citation preview
I. Objective Search datasets based on arbitrary conditions Reduce the development time for finding datasets of interest and focus
more on the scientific pursuits Enable queries as :
SELECT DAYS between 2008-01 to 2008-06 AT sgp-C1 WHERE clear sky samples > K (constant) AND zenith angle was between 0-20 deg. SELECT DAYS between 2008-01 to 2008-12 AT twp-C1 WHERE rain rate was between 1-10mm/hr.
III. Histogram based Index Generation • The goal is to compute a signature of data using small time windows (3/4 hours)
over the history of an entire datastream, for every variable of interest. • Factors favoring histograms
• When the goal is to find “time ranges” of interest, a summarization technique helps to avoid storing information about every record
• Inherent information available from a statistical distribution can help improving the quality of search results
Acknowledgements The authors sincerely thank Jim Mather and Krista Gaustad for helping with case studies and Nathaniel Beagley and Chad Scherrer for thoughtful discussions on index compression techniques.
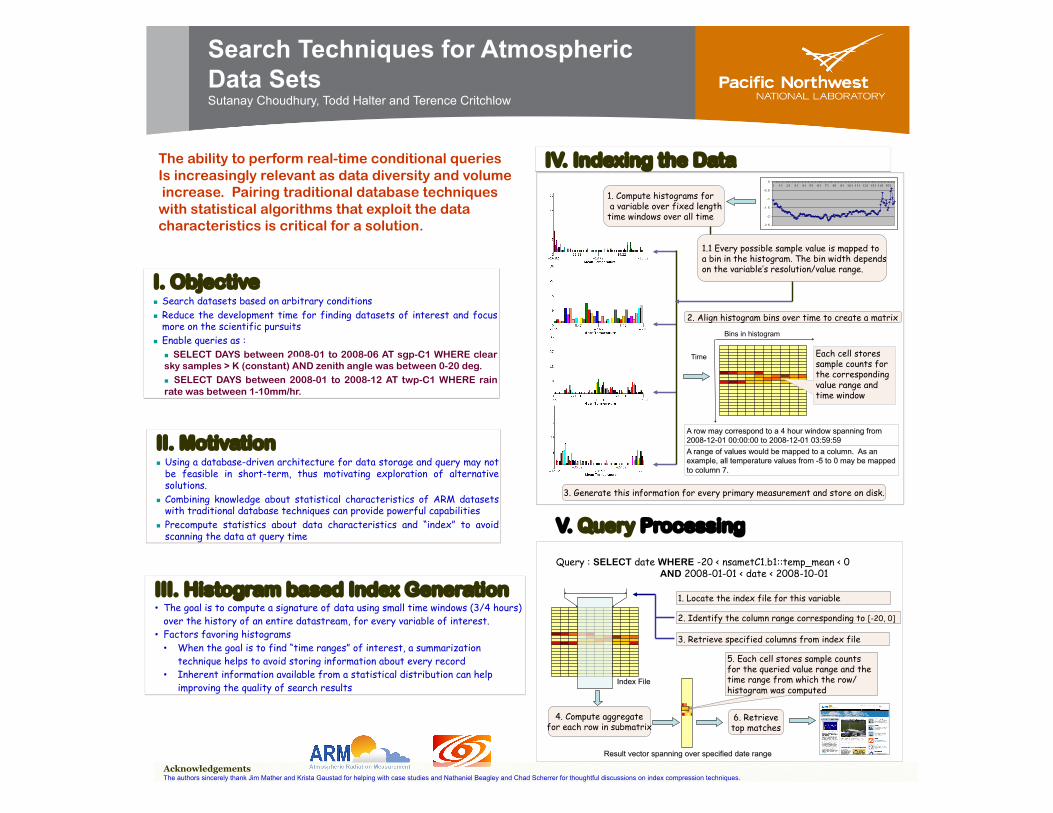
Time
Bins in histogram
Each cell stores sample counts for the corresponding value range and time window
II. Motivation Using a database-driven architecture for data storage and query may not
be feasible in short-term, thus motivating exploration of alternative solutions.
Combining knowledge about statistical characteristics of ARM datasets with traditional database techniques can provide powerful capabilities
Precompute statistics about data characteristics and “index” to avoid scanning the data at query time
2. Identify the column range corresponding to [-20, 0]
4. Compute aggregate for each row in submatrix
Query : SELECT date WHERE -20 < nsametC1.b1::temp_mean < 0 AND 2008-01-01 < date < 2008-10-01
1. Locate the index file for this variable
3. Retrieve specified columns from index file
5. Each cell stores sample counts for the queried value range and the time range from which the row/histogram was computed
6. Retrieve top matches
1. Compute histograms for a variable over fixed length time windows over all time
2. Align histogram bins over time to create a matrix
1.1 Every possible sample value is mapped to a bin in the histogram. The bin width depends on the variable’s resolution/value range.
3. Generate this information for every primary measurement and store on disk.
IV. Indexing the Data
V. Query Processing
Search Techniques for Atmospheric Data Sets Sutanay Choudhury, Todd Halter and Terence Critchlow
The ability to perform real-time conditional queries Is increasingly relevant as data diversity and volume increase. Pairing traditional database techniques with statistical algorithms that exploit the data characteristics is critical for a solution.