Embed Size (px)
Citation preview
SEAN O’CASEY BRIDGE: COMPARISON OF OPERATIONAL
& TRADITIONAL MODAL ANALYSIS TEST RESULTS
Paul Fanning, School of Architecture, Landscape & Civil
Engineering, UCD Dublin,
Ireland
Paul Healy, O’Connor Sutton Cronin Consulting Engineers, Ireland
Aleksandar Pavic, Department of Civil & Structural Engineering,
University of Sheffield,
England
Paul Reynolds, Department of Civil & Structural Engineering,
University of Sheffield,
England
James Brownjohn, Department of Civil & Structural Engineering,
University of Sheffield,
England
Abstract
Sean O’Casey Bridge is a recently constructed footbridge spanning the River Liffey in the centre of
Dublin. Prior to its opening to the general public, during the summer of 2005, operational modal
analysis and traditional modal analysis tests were undertaken on successive days. Following a brief
description of the structural form this paper concentrates on the set-up for both test regimes and
compares the results of each test in terms of the natural frequencies, modes of vibration and
damping levels identified. The relative merits of ambient and forced excitation test procedures are
also discussed in the context of these particular test results.
1 Introduction
Any dynamic response of a linear structural system can be reduced to a set of mode shapes and
associated modal frequencies and damping. These three entities constitute the modal parameters of
a linear structure. Modal testing is the experimental process of determining these characteristics by
measurement and subsequent measurement data post-processing. There are two types of modal test
regimes; traditional, or classical, modal testing and operational, or output only, modal testing.
In traditional modal analysis, (Refs [1],[2]), an excitation force and vibration responses, all
measured, are used to produce frequency response functions (FRFs). Mathematical models fitted to
these FRFs are subsequently used to extract the modal parameters. Multiple measurement points
enable mode shapes to be constructed. Clearly a means of providing sufficient excitation, over the
frequency range of interest, is required. Whilst this is not difficult to achieve for laboratory scale
test specimens it can quickly become logistically prohibitive and very expensive when testing large
structures, in open space environments, such as bridges and buildings.
Operational modal analysis, (Ref [3]), procedures are based on the premise that a random noise
excitation to a system excites all modes of vibration of that system. It requires measurement of the
response of the structure only – no excitation devices or measurements are used. This makes it
particularly attractive when testing large civil and mechanical structures that are otherwise difficult

to test. Furthermore large civil structures – such as buildings and bridges – are usually continuously
loaded by ambient forces, such as wind or surrounding traffic noise, which cannot be controlled or
avoided during traditional modal testing.
During the summer of 2005 a new pedestrian bridge, Sean O’Casey Bridge, over the River Liffey
in Dublin, was opened to the public. Prior to opening traditional and operation modal analysis tests
were undertaken. This paper introduces Sean O’Casey Bridge and presents the results of both sets
of modal tests along with a brief discussion of the relative advantages and disadvantages of each
test regime in the context of this test structure.
2 Sean O’Casey Bridge
The Dublin Docklands Development Authority (DDDA) held an International Competition in late
2002 for a new pedestrian bridge, capable of opening, across the River Liffey in Dublin. The width
of the river crossing, approximately 100m, and the competition requirements for maximising head
room and an opening bridge to accommodate marine navigation were some of the key structural
design criteria which led to a solution comprising two leaves of an opening swing bridge.
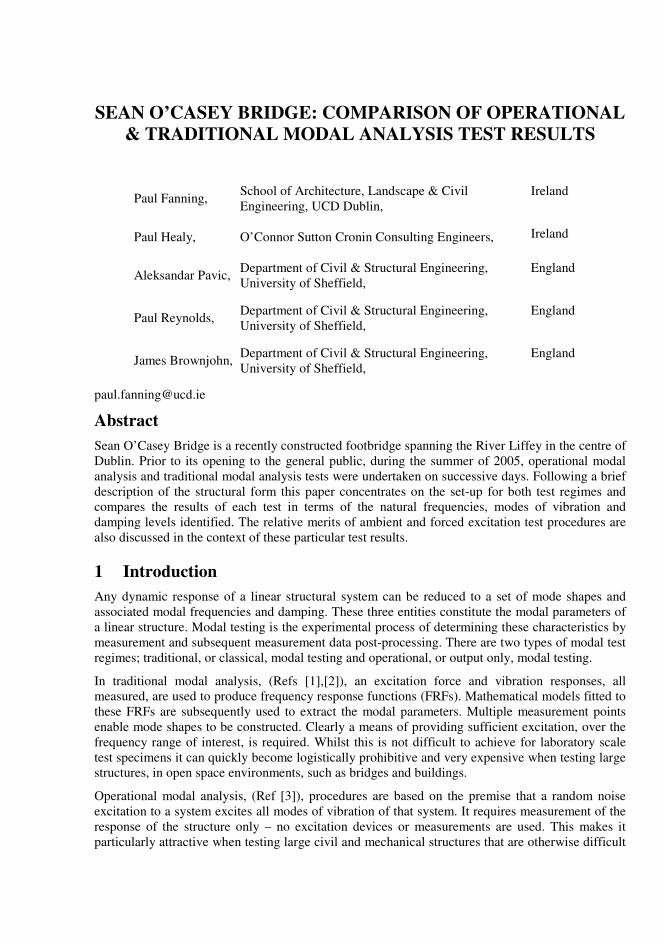
The winning entry, Figure 1, and resulting structural design evolved on the basic principle of a
‘balanced cantilever’ which is to function both in the in use condition whilst remaining stable in the
bridge open or out of use condition. Each bridge leaf is 44m long, rotates about a bearing
mechanism over the river piers and closes onto a cantilever abutment to complete the transition
with the river quay walls.
Figure 1 Sean O’Casey Bridge
The balanced cantilever approach, combining many structural materials, provides both an
inherently efficient and transparent structural arrangement. The primary supporting cradle
elements comprise four tapering steel fabricated box sections which merge at their base to form a
circular drum containing a slew ring (or rotating) mechanism. The 4.5m wide aluminium bridge
deck is supported on two 600mm diameter longitudinal tubes which are subsequently supported at
their extreme ends via 100mm diameter Macalloy tension rods. Separate rods extend continuously
on each side, articulated at the cradle tips via special continuity connectors, which are in turn
tensioned down to the central cradle base.
When closed, each bridge leaf is both locked together and to the cantilever abutments via hydraulic
locking pins. The out of balance structural load conditions are resisted by these locking pins,
suitably arranged to restrain vertical, lateral and torsional deck forces whilst allowing and
accommodating bridge rotation at its ends.
The cradle base and slew ring bearing is supported via cast-in holding down bolts on stone clad
elliptical concrete piers located approximately 27m from each quay wall. The pier configurations
were geometrically designed to minimise their impact on hydraulic river flows. The concrete piers,
supported on four large diameter bored piles were cast within a prefabricated steel caisson
temporarily dropped into the river during construction.
The operation of the bridge is controlled by a remote radio transmitted hand held pendant key. The
bridge is opened by releasing the locking pins in a pre-determined sequence via a radio controlled
signal to the “hydraulic rams” at each slew ring bearing. The electrical distribution panels,
hydraulic motors and pumps are suspended in the zone of main structure beneath the bridge deck.
Readily accessible electrical switch cabinets, downloading sockets and navigation lights are
integrated within the balustrade panels at the tips of each bridge leaf.
Dublin Port Company requested the bridge to be protected against collision from a pleasure boat or
errant ship in the navigable channel. A bespoke system evolved during the design process
incorporating a floating series of horizontal tubes with buoyancy boxes, supported and guided on
vertical piles driven to refusal in the boulder clays. This system conceals the V-fenders at water
level, rising and falling with the tide.
The bridge was designed and delivered, complete within a 30 month programme commencing with
appointment of the design team Team in December 2002, obtaining statutory consents and
foreshore licence, preparation of E.I.S., construction on site culminating with the official opening
in July 2005.
3 Test Procedures
3.1 Operational Modal Analysis
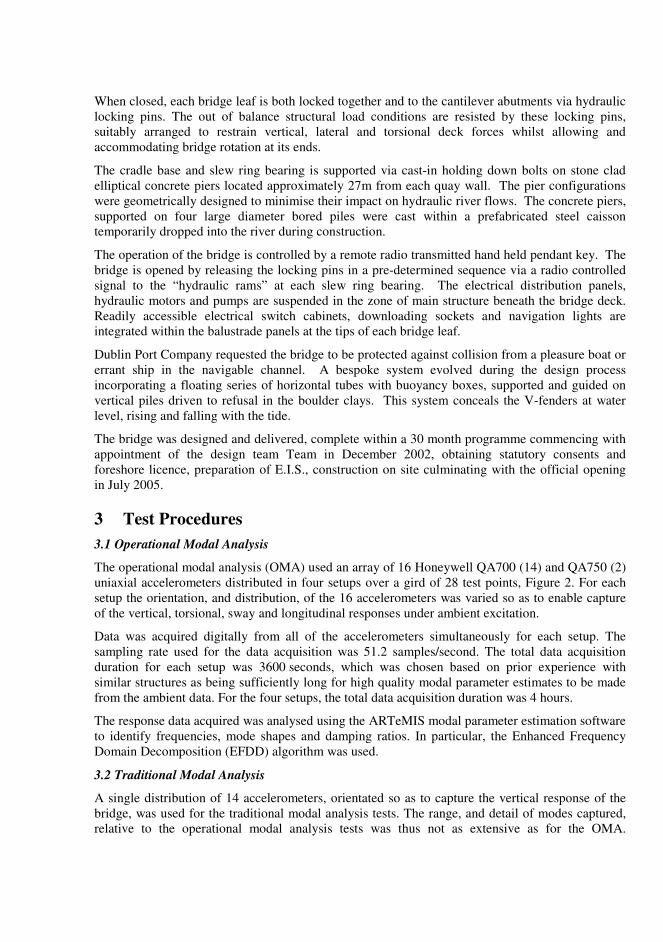
The operational modal analysis (OMA) used an array of 16 Honeywell QA700 (14) and QA750 (2)
uniaxial accelerometers distributed in four setups over a gird of 28 test points, Figure 2. For each
setup the orientation, and distribution, of the 16 accelerometers was varied so as to enable capture
of the vertical, torsional, sway and longitudinal responses under ambient excitation.
Data was acquired digitally from all of the accelerometers simultaneously for each setup. The
sampling rate used for the data acquisition was 51.2 samples/second. The total data acquisition
duration for each setup was 3600 seconds, which was chosen based on prior experience with
similar structures as being sufficiently long for high quality modal parameter estimates to be made
from the ambient data. For the four setups, the total data acquisition duration was 4 hours.
The response data acquired was analysed using the ARTeMIS modal parameter estimation software
to identify frequencies, mode shapes and damping ratios. In particular, the Enhanced Frequency
Domain Decomposition (EFDD) algorithm was used.
3.2 Traditional Modal Analysis
A single distribution of 14 accelerometers, orientated so as to capture the vertical response of the
bridge, was used for the traditional modal analysis tests. The range, and detail of modes captured,
relative to the operational modal analysis tests was thus not as extensive as for the OMA.
Excitation was provided by two electrodynamic shakers, APS Dynamics Model 400 shakers,
Figure 3, positioned at test points 5 and 10 respectively, Figure 2.
The measurements were carried out by driving the shakers using uncorrelated continuous random
excitation. The force provided by the shakers and the corresponding structural responses were
sampled and used to calculate frequency response functions (FRFs). The sampling rate used was
31.25 samples/second. For each set of FRF measurements a total of 20 blocks of 65.526 s of data
were acquired using a 75% overlap and a Hanning window to reduce signal ‘leakage. The resulting
point mobility FRF at test point 5 is plotted in Figure 4.
Figure 3 Shaker at Test Point 5
1 2 3 4 5 6 7 8 9 10 11 120
0.1
0.2
0.3
0.4
Frequency [Hz]
FR
F M
od
ulu
s [
m/s
2/N
]
Figure 2
Test Grid Figure 4 Point Mobility FRF at Test Point 5
4 Modal Analysis Test Results
The objective of both test regimes, which were commissioned by O’Connor Sutton Cronin,
consulting engineers for the bridge design, on behalf of Mowlem Construction, the Contractor, was
to establish with confidence the fundamental frequency of the as built bridge, and to assist them in
future modeling of similar structures.
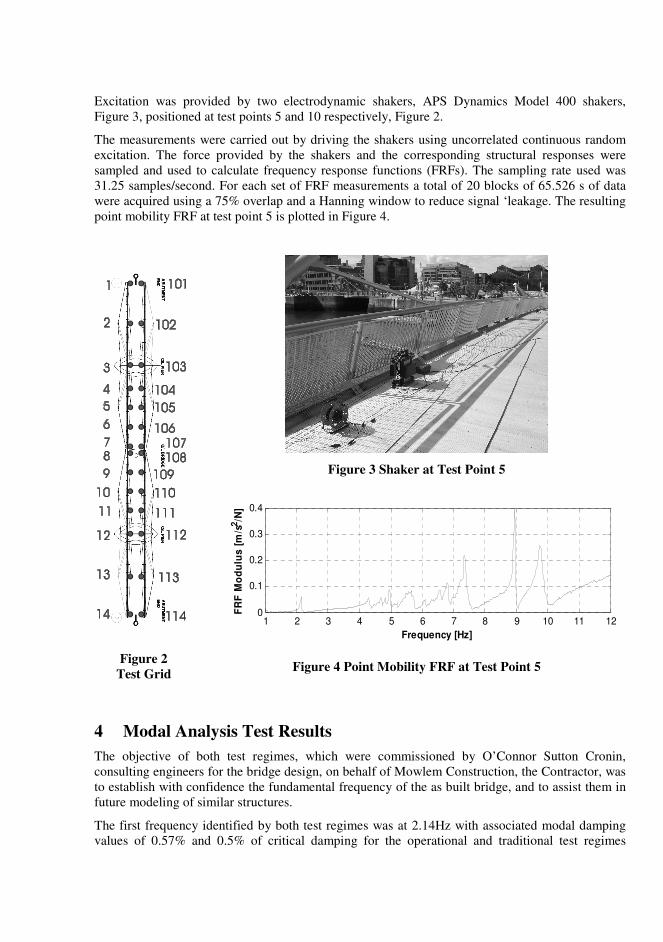
The first frequency identified by both test regimes was at 2.14Hz with associated modal damping
values of 0.57% and 0.5% of critical damping for the operational and traditional test regimes
respectively. The associated mode shape, identified under each test regime, is plotted in Figure 5. It
is noted also that the maximum amplitudes of response, in the vertical direction at test point 5,
during operational and traditional modal testing were approximately 0.01m/s2 and 0.075m/s
2 for the
operational and traditional modal tests respectively.
OMT, Mode 1, fv1 = 2.14Hz, Damp =0.57% TMT, Mode 1, fv1 = 21.4Hz, Damp =0.50%
Figure 5 Mode 1 Operational & Traditional Modal Tests
Modal data for the lower modes of vibration identified using each test regime are listed in Table 1.
The second mode of vibration captured using operational modal analysis is a longitudinal sway
mode characterized by in phase swaying of the bridge piers in the span direction – there is little
contribution from the deck, and no discernible vertical response, in this mode. The measurement of
only vertical responses, with only vertical excitation, resulted in this mode not being captured
during traditional modal testing. Otherwise the sequence of modes shapes identified across both
test regimes, for these lower modes, is consistent.
Operational Modal Tests Traditional Modal Tests
Mode Freq
(Hz)
Damp
(%)
Description Mode Freq
(Hz)
Damp
(%)
Description
1 2.14 0.57 Bending span between piers 1 2.14 0.50 Bending span between piers
2 3.10 1.44 Longitudinal sway of piers
3 4.21 0.94 Second bending mode 2 4.31 0.97 Second bending mode
4 4.36 0.38 Torsion 3 4.69 0.34 Torsion
Table 1 Frequencies & Damping for Both Test Regimes
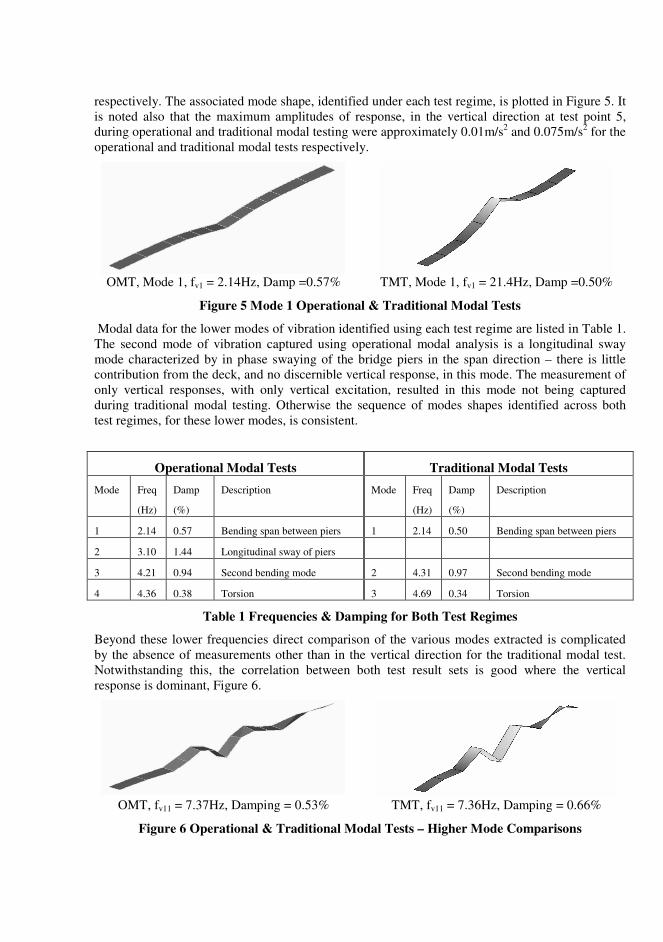
Beyond these lower frequencies direct comparison of the various modes extracted is complicated
by the absence of measurements other than in the vertical direction for the traditional modal test.
Notwithstanding this, the correlation between both test result sets is good where the vertical
response is dominant, Figure 6.
OMT, fv11 = 7.37Hz, Damping = 0.53% TMT, fv11 = 7.36Hz, Damping = 0.66%
Figure 6 Operational & Traditional Modal Tests – Higher Mode Comparisons
5 Discussion of Tests
The primary objective of the test programme was to identify with confidence the first natural
frequency of the bridge structure. This was identified as 2.14Hz in both tests. In the context of the
ease of which this is established the operational modal tests were the more efficient and more
economical in terms of the set-up, hardware, instrumentation and manpower required on site.
The frequencies predicted using both traditional FRF based parameter extraction techniques and the
EFDD algorithm, used in post-processing the ambient response data, were comparable. Over the
range of frequencies studied the difference varied between 0 and 10%. Given the difficulty in
reliably estimating values of damping, which were strongly amplitude dependent, the levels
predicted are also considered consistent across the result sets. All frequencies identifiable in the
FRF point mobility in Figure 5 were captured during the operational modal test regime.
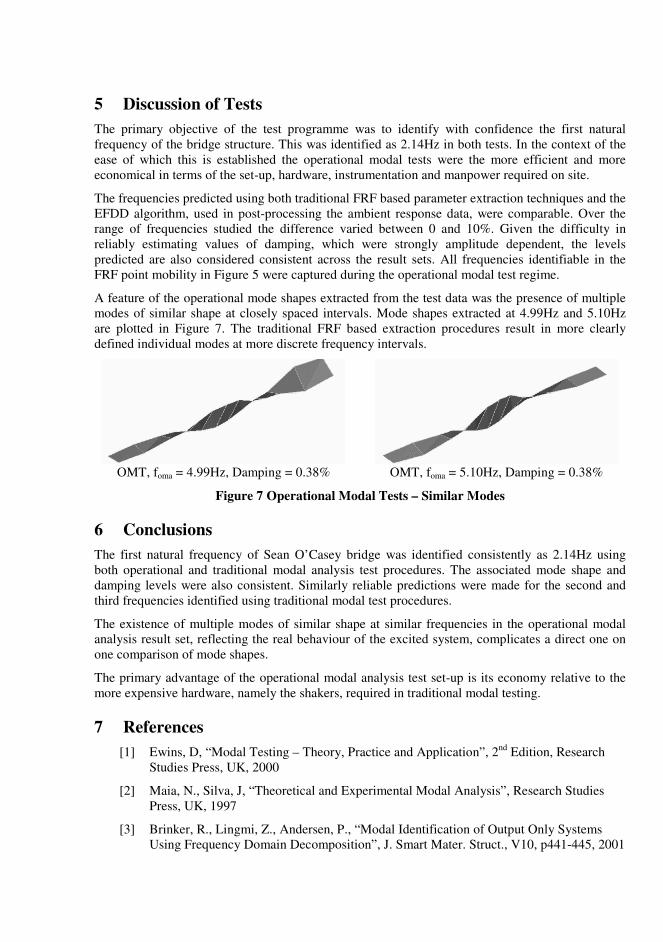
A feature of the operational mode shapes extracted from the test data was the presence of multiple
modes of similar shape at closely spaced intervals. Mode shapes extracted at 4.99Hz and 5.10Hz
are plotted in Figure 7. The traditional FRF based extraction procedures result in more clearly
defined individual modes at more discrete frequency intervals.
OMT, foma = 4.99Hz, Damping = 0.38% OMT, foma = 5.10Hz, Damping = 0.38%
Figure 7 Operational Modal Tests – Similar Modes
6 Conclusions
The first natural frequency of Sean O’Casey bridge was identified consistently as 2.14Hz using
both operational and traditional modal analysis test procedures. The associated mode shape and
damping levels were also consistent. Similarly reliable predictions were made for the second and
third frequencies identified using traditional modal test procedures.
The existence of multiple modes of similar shape at similar frequencies in the operational modal
analysis result set, reflecting the real behaviour of the excited system, complicates a direct one on
one comparison of mode shapes.
The primary advantage of the operational modal analysis test set-up is its economy relative to the
more expensive hardware, namely the shakers, required in traditional modal testing.
7 References
[1] Ewins, D, “Modal Testing – Theory, Practice and Application”, 2nd
Edition, Research
Studies Press, UK, 2000
[2] Maia, N., Silva, J, “Theoretical and Experimental Modal Analysis”, Research Studies
Press, UK, 1997
[3] Brinker, R., Lingmi, Z., Andersen, P., “Modal Identification of Output Only Systems
Using Frequency Domain Decomposition”, J. Smart Mater. Struct., V10, p441-445, 2001