Embed Size (px)
Citation preview

Seamless Prediction of Air Pollution in Africa
Seamless Prediction of Air Pollution in Africa, Nairobi,Kenya, 7-12 Obtober2019
A. S. Zakey&
The RegCM Egyptian Team-work
The Egyptian Meteorological Authority


A grid cell view of atmospheric chemistry
Advection/Diffusion
Advection/Diffusion
Advection/Diffusion
EmissionsWet & Dry Deposition
Cloud ProcessesChemistry
• What are the key processes for atmospheric chemistry?• Physical processes: advection, diffusion, deposition, clouds & precip• Chemical processes: emissions, gas-phase reactions, gas-to-particle conversion, aqueous chemistry, heterogeneous chemistry

RegCM-CHEM Gas-phase chemistry
- Chemical mechanism (list of chemical reactions and species to include)
- Solver (numerical method to solve the chemical differential equations)
• Mechanism: CBMZ (Zaveri and Peters, 1999)- 53 species, 132 reactions- Developed for long-term
simulations• Solver: Radical Balance
Method (RBM), Sillman
RegCM-CHEM
Solver
Gas Phase Chemical
Mechanism
• Incorporation of gas-phase chemistry requires:

Lateral Boundary Conditions (LBC)
• Limited area runs require information provided to the lateral boundaries
• Meteorological: ERA-Interim global data, updated 6-hourly
• Chemical: MOZART monthly climatology (Emmons et al., 2010) LBC variables

• Dynamics:MM5 Hydrostatic (Grell et al 1994)Non-hydrostatic (MM5 or WRF, in progress)
• Radiation:CCM3.6.6 (Kiehl 1996)RRTM
• Large-Scale Clouds & Precipitation:SUBEX (Pal et al 2000)
• Cumulus Convection:Grell (1993) + FC80 ClosureAnthes-Kuo (1977)MIT/Emanuel (1991)Betts-Miller (1993)STRACO (in progress)
• Boundary Layer:Holtslag (1990)
• Nesting:Numerous GCM/Reanalysis InterfacesOne-way nesting
• Biogenic Emiss:MEGANE (Twffic, 2010)
• Tracers/Aerosols:Qian et al (2001) – sulfur chem.Solmon et al (2005) – BC/OC chem.Zakey(2006,2008) – dust/ sea saltShalaby (2010) – gas-phase chem. (vectoizedvers. By Ashraf Zakey)
• Land Surface:BATS1e (Dickinson et al., 1993)SUB-BATS (Giorgi et al., 2003)CLM (Dai et al., 2003, Dai & Bi, in progress)IBIS (Foley; Winter in progress)
• Ocean Fluxes:BATS1e (Dickinson et al., 1993)Zeng et al (1998)Air-Sea Coupling (MITogcm, OASIS coupler, in progress)
• Computations:User-FriendlyMultiple PlatformsParallel Code


The Main Products
Gases: such as CO, O3, NOx, SO2
Aerosols: such as SO4, BC, OC, ANH4, ANO3, Sea Salt and Dust
Optical properties of Aerosols: such as Aerosol optical Depth, asymmetry parameter, and Radiative forcing.
Radiation: such as short and long wave net radiation.
Indices related to air quality and health: Air Quality Health Index and Ventilation index.
Common Meteorological parameters: Air temperatures, precipitation, Relative humidity, wind, and mean sea level pressure, in addition to other many different variables.

Parameter
Meteorological field: Initial and Boundary conditions (ICBC)
ERA-entrim (with 1.5 degree resolution)
Dynamical Core MM4 Hydrostatic (Giorgi et al., 1993a,b)
Radiation scheme CCM3 (Kiehl, 1996)
Large-Scale Clouds & Precipitation scheme
SUBEX (Pal et al., 2000)
Cumulus convection scheme Emanuel (1991) over Ocean & Land
Boundary Layer scheme Modified Holtslag (Holtslag, 1990)
Land Surface model BATS (Dickinson et al., 1993)
Interactive Aerosols Organic and black carbon, SO4 (Solmon et al. 2006)Dust (Zakey et al. 2006)Sea salt (Zakey et al. 2008)(with feedback interactions)
GAS phase chemistry CBMZ (Shalaby et al. 2011)
Configuration of RegCM4-Africa

Parameter
Center latitudeCenter longitudeNumber of points in x-axis & y-axisProjectionHorizontal resolutionVertical resolution
00.00 17.00 E192 & 167ROTMER (Rotated Mercator)50 km x 50 km 18 sigma-layers
Area Configuration

Chemistry:Condensed CBM-Z gas-phase chemistry (Zaveriand Peters, 1999).
Solver:Radical balance method (RBM) by (Sillman et al., 1991) and (Barth et al., 2002)
Photolysis rates:Tropospheric Ultraviolet-Visible Model (Madronich and Flocke, 1999) with cloud cover correction by (Chang et al., 1987)
Dry deposition: • “big leaf” multiple resistance model with
aerodynamic, quasi-laminar layer, andsurface resistance for 31 gaseous species.
• uptake resistance for vegetation, soil, water,snow and ice (20 land-use types).
• stomata and non-stomata resistances

Atmospheric Dust Cycle
[www.geo.cornell.edu ]
Emission
Transport
Deposition

Aerosol dust modeling in ( Zakey et al., 2006 ACP)
Soil texture (12 types, USDA)
Soil erodible dry aggregates
distribution (Shao et al. ,2002)
Land surface properties (BATS)
( roughness, soil humidity, cover
fractions)
RegCM atmospheric variables
( surface wind, air temperature, air
density)
DUST emission scheme
Zakey et al., 2006
Suspension Sand-blasting (Alfaro et
al., 1997, 2001)
Saltation (Marticorena et al. 1995)
Dust flux distribution
(3 log-normal emission modes)
Transport bins (up to 12), usually 4
Size dependent settling and surface déposition
Roughness and humidity correction
AOP / radiation
Input parameters

Regional climate modelling approach 0.01 – 20 µm
Surface properties
(roughness, humidity, vegetation)
10 µm – 10000 µm
Sand-blasting
Saltation
wind
Soil granulometry
Transport and removal
Zakey et al., 2006

Vis5D
RegCM-CHEM
ICBC
ICBCyyyymmddhh……
DEHM,MOZART
CHEM ECMWF, ERA40,NNRP1, NNRP2,EH5OM, FVGCM,
HadAMH, REGCM,……
CLIM
GlobalTerrestrial
Data
Terrain
ATM.yyyymmddhhRAD.yyyymmddhhSRF.yyyymmddhhSPC.yyyymmddhh
netCDF output
IPCC RCP, GFED, POET, RETRO,
EDGAR,……
EMISSIONS
Global 1x1SST Data
SST
GrADS SIGMAtoP
NCL
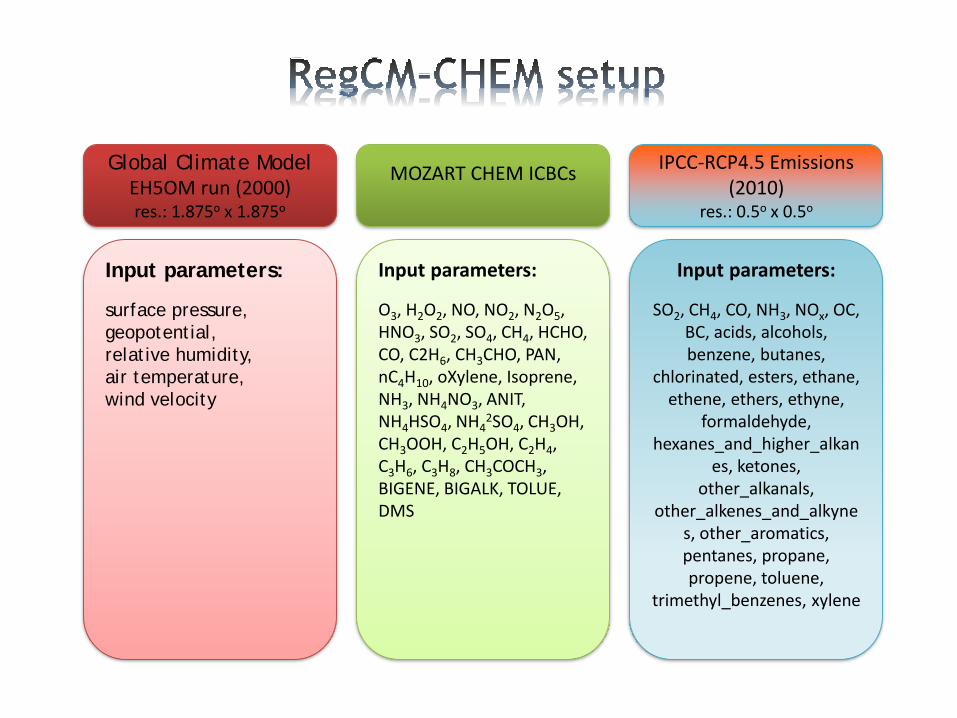
Global Climate ModelEH5OM run (2000)res.: 1.875o x 1.875o
IPCC-RCP4.5 Emissions(2010)
res.: 0.5o x 0.5o
MOZART CHEM ICBCs
Input parameters:
O3, H2O2, NO, NO2, N2O5, HNO3, SO2, SO4, CH4, HCHO, CO, C2H6, CH3CHO, PAN, nC4H10, oXylene, Isoprene, NH3, NH4NO3, ANIT, NH4HSO4, NH4
2SO4, CH3OH, CH3OOH, C2H5OH, C2H4, C3H6, C3H8, CH3COCH3, BIGENE, BIGALK, TOLUE, DMS
Input parameters:
SO2, CH4, CO, NH3, NOx, OC, BC, acids, alcohols, benzene, butanes,
chlorinated, esters, ethane, ethene, ethers, ethyne,
formaldehyde, hexanes_and_higher_alkan
es, ketones, other_alkanals,
other_alkenes_and_alkynes, other_aromatics, pentanes, propane, propene, toluene,
trimethyl_benzenes, xylene
Input parameters:
surface pressure,
geopotential,
relative humidity,
air temperature,
wind velocity


RegCM-CHEM Emissions Preproc tool:
ACCENT
VOCs On-lineMEGAN
Grid ModelDistribution
Grid Concentrations ofChemical Species
Splitting and speciation
Data
IPCC RCP


Summer (JJA) emissions in the Mediterranean, Middle East and northern Africaaveraged over 1998−2006 for (A) anthropogenic NOx, (B) anthropogenic alkanes(including butanes, ethane and propane), (C) anthropogenic sulfate, (D)anthropogenic black carbon, (E) anthropogenic organic carbon, and (F) isopreneemissions. Panels (A) to (E) are based on the MACCity inventory and panel (F) onthe online MEGAN-CLM emissions model

Emissions: Biogenic
• MEGAN - Isoprene Emission Factor Map ()•Baseline isoprene emission fluxes (g m-2
hr-1) • Modified for temperature, light, soil moisture, LAI, etc… (Ahmed T’s talk Weds)
3000 6000 9000 12000

A grid cell view of atmospheric chemistry in
Advection/Diffusion
Advection/Diffusion
Advection/Diffusion
EmissionsWet & Dry Deposition
Cloud ProcessesChemistry
• Representing this with the continuity equation
¶c
¶t= -v×Ñc+Fh +Fv +S - Rdry - Rwet +chem
• Large set of differential equations• Varying lifetimes of chemical compounds makes this a “stiff” system

Cloud-Aerosol Interaction in RegCM4: Indirect effects of aerosols over Africa

These three autoconversion schemes differ in their dependence on the total aerosolmixing ratio (xtot), which relates to the effective radius (re), and on the liquid watercontent (wL),
1. The first parameterization depends on Beheng (1994) (or hereinafter the "BH" scheme),which based on Lohmann and Feichter (1997)
2. The second parameterization depends on Tripoli and Cotton (1980) (hereinafter,referred here as "TC" scheme).
3. The third parameterization of autoconversion parameterization (R6 scheme) of Liu andDaum (2004), which accounts for the dispersion effect of the cloud droplets (Liu andDaum, 2004; Liu et al., 2004; Liu et al., 2007)
Parameterization of autoconversion
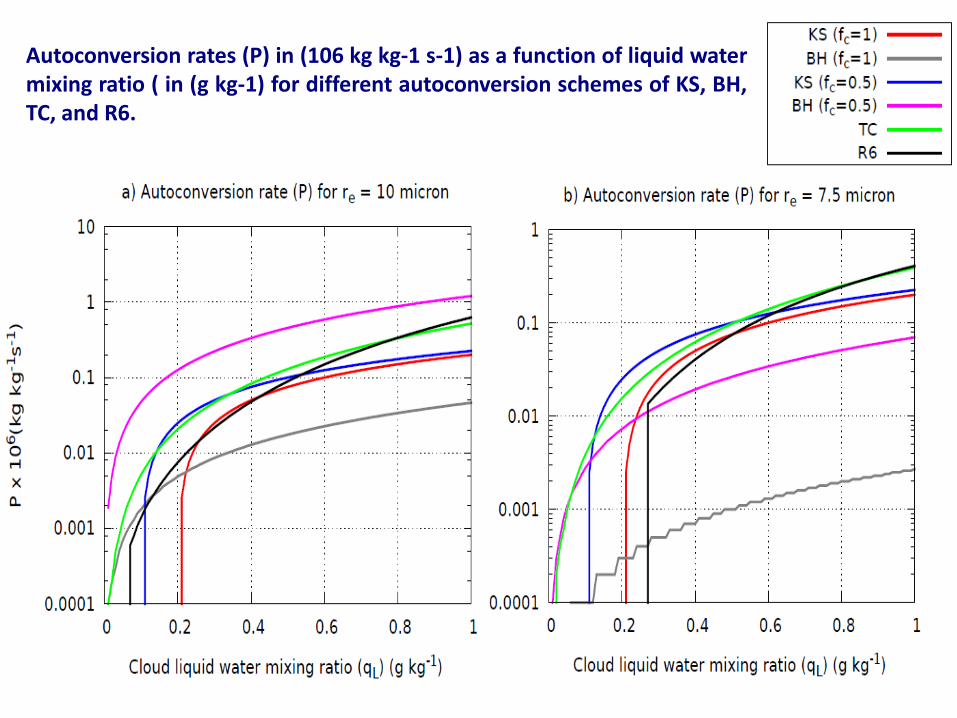
Autoconversion rates (P) in (106 kg kg-1 s-1) as a function of liquid watermixing ratio ( in (g kg-1) for different autoconversion schemes of KS, BH,TC, and R6.

¹ All means (SO42- + hydrophobic and hydrophilic OC and BC + 4 size bins of dust)² The direct effects include all simulated aerosols³ The 1st and 2nd indirect effects include only SO42- + hydrophilic OC and BC

Changes in temperature (K) due to the experiments of a) direct, b) Indir1, c) all_BH, d) all_TC, and e) all_R6 relative to the experiment of ctrl, during JJA 20065

Changes in precipitation (mm month-1) due to the experiments of a) direct, b) Indir1, c) all_BH, d) all_TC, and e) all_R6 relative to the experiment of ctrl, during JJA
2006

Taylor diagram for a) temperature and b) precipitation, over the West Africa (red points), and Central Africa (blue points) during JJA 2006.
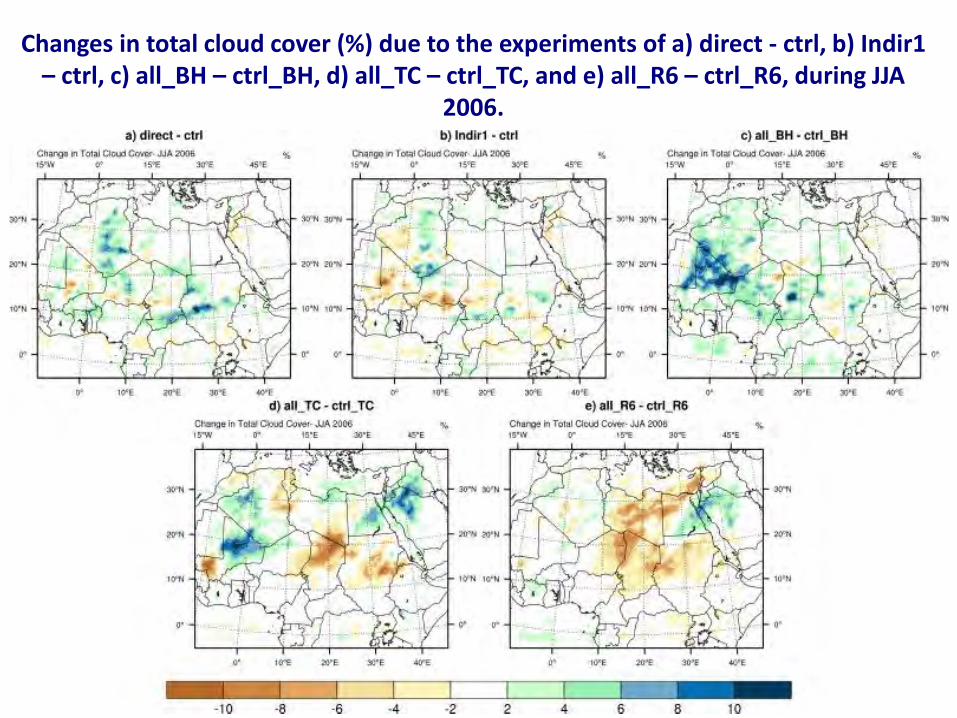
Changes in total cloud cover (%) due to the experiments of a) direct - ctrl, b) Indir1 – ctrl, c) all_BH – ctrl_BH, d) all_TC – ctrl_TC, and e) all_R6 – ctrl_R6, during JJA
2006.

Changes in Aerosol optical depth (AOD) induced by a) direct, b) Indir1, c) all_BH, d) all_TC, and e) all_R6 relative to the AOD from Terra/MODIS at 550 nm, during JJA
2006

Simulated net radiative forcing (RF) at the surface (SRF) (W m-2) induced by a) direct, b) Indir1, c) all_BH, d) all_TC, and e) all_R6
relative to their control runs, during JJA 2006.

Simulated net radiative forcing (RF) at the top of atmosphere (TOA) (W m-2) induced by a) direct, b) Indir1, c) all_BH, d) all_TC, and e) all_R6 relative to their
control runs, during JJA 2006.

-40-35-30-25-20-15-10-505
direct Indir1 all_BH all_TC all_R6
Ra
d.
Fo
rcin
g (
Wm
-2)
a) Surface and TOA net RF over West Africaduring JJA 2006
NRF_SRF NRF_TOA-35-30-25-20-15-10
-505
direct Indir1 all_BH all_TC all_R6
Ra
d.
Fo
rcin
g (
Wm
-2)
b) Surface and TOA net RF over Central Africaduring JJA 2006
NRF_SRF NRF_TOA

direct Indir1 all_BH all_TC all_R6
ΔCLWP(g/m2) -04.37 -23.65 05.36 278.89 835.46 ΔTCLD (%) 00.53 -01.51 09.64 21.16 19.97 ΔLCLD (%) 03.15 00.18 06.81 -20.21 -58.51 ΔPALB (%) 04.02 05.27 12.14 41.84 49.62 ΔT (K) -00.49 -00.48 -01.03 -01.21 -00.92 ΔLHF(W/m2) -00.29 -00.54 -00.39 -03.67 -05.61 ΔP(mm/month) -0.07(-0.04%) -17.59(-10.02%) -1.95(-01.11%) -103.24(-58.83%) -149.61(-85.25)
Central Africa
direct Indir1 all_BH all_TC all_R6
ΔCLWP(g/m2) 06.02 -11.66 39.58 04.36 -16.68 ΔTCLD (%) 01.47 -0.43 05.12 12.95 10.98 ΔLCLD (%) 06.17 01.47 05.22 -13.76 -41.73 ΔPALB (%) 02.37 03.84 04.50 25.68 33.64 ΔT (K) -0.53 -00.48 -00.74 -01.20 -00.34 ΔLHF(W/m2) 00.11 -00.09 00.18 -01.43 -03.03 ΔP(mm/month) 09.09(5.74%) -06.04(-3.82%) 08.26(05.22%) -47.31(-29.00%) -90.38(-57.13%)
Seasonal means over West Africa and Central Africa for changing in cloud liquid waterpath (ΔCLWP), total cloud cover ΔTCLD, low cloud cover ΔLCLD, planetary albedo(ΔPALB), temperature (ΔT), total precipitation (ΔP), and latent heat flux (ΔLHF) due todirect, Indir1, all_BH, all_TC, and all_R6, relative to the control run (ctrl), averagingover the land only, during JJA 2006. The relative change in total cloud cover, planetaryalbedo, and precipitation is given in percent.

CODJFMAM
JJA SON

O3DJF
MAM
JJASON

AODDJF MAM
JJA SON

DJF MAM
JJA SON
BC
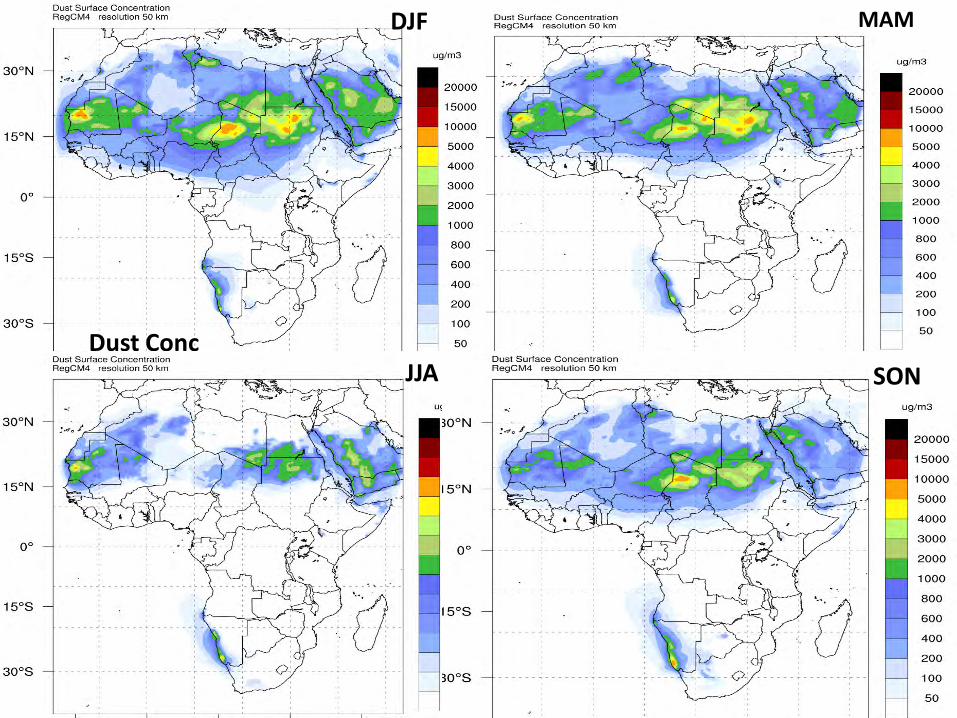
Dust Conc
DJF MAM
JJA SON

DJF MAMNH3
JJA SON

Aerosol: Dust (RegCM-dust)PM2.5
JJA
DJF
PM10

DJF MAMNOx
JJA SON
R
U/R
Rs/URs/U
R
Rs/U
R
R
R
R
R
Rs/U
Rs/U
I
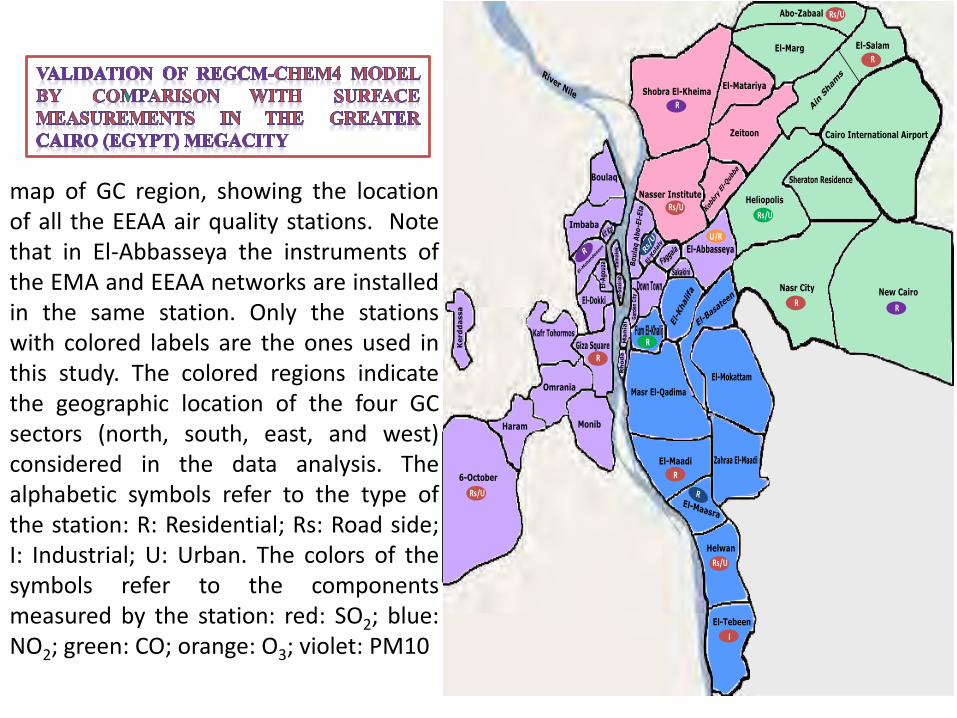
map of GC region, showing the locationof all the EEAA air quality stations. Notethat in El-Abbasseya the instruments ofthe EMA and EEAA networks are installedin the same station. Only the stationswith colored labels are the ones used inthis study. The colored regions indicatethe geographic location of the four GCsectors (north, south, east, and west)considered in the data analysis. Thealphabetic symbols refer to the type ofthe station: R: Residential; Rs: Road side;I: Industrial; U: Urban. The colors of thesymbols refer to the componentsmeasured by the station: red: SO2; blue:NO2; green: CO; orange: O3; violet: PM10

Site No. Station Name Measured pollutantsCoordinates
Station TypebLocation
Lon. Lat.
1 El-Abbasseyaa O3 31°17' 30°04' U/RW
2 El-Kolaly SO2, NO2, PM10 31°14'' 30°03' Rs/UW
3 Nasr City SO2, NO2, PM10 31°19' 30°03' R E
4 El-Maadi SO2 31°16' 29°57' R S
5 El-Tebeen SO2, NO2, PM10 31°17' 30°10' I S
6 Abo-Zabaal SO2 31°24' 30°14' Rs/U E
7 Helioplis PM10, CO 31°21' 30°5' Rs/UE
8 Helwan SO2, PM10 31°20' 29°50' Rs/U S
9 Nasser Institute SO2, NO2, PM10 31°15' 30°6' Rs/U N
10 New Cairo NO2, PM10 31°21' 30°2' R E
11 El-Maasra SO2, NO2, PM10 31°17' 29°55' R S
12 6-October SO2, PM10 31°14' 30°03' Rs/U W
13 El-Mohandeseen SO2, PM10 31°12'' 30°5' R W
14 El-Salam SO2, PM10 31°16' 30°7' R S
15 Giza Square SO2, NO2, CO, PM10 31°12' 30°01' RW
16 Fum El-Khalij CO 31°13' 30°1' R S
17 Shobra El-Kheima PM10 31°14' 30°07' RN
Measuring Stations with Their Coordinates, Monitoring Type, and Measured Pollutants Available for the Period of Study (Mostafa et al. 2018)

MAM
Seasonal variation of lowest model level of nitrogen dioxide, surface ozone, carbon monoxide,sulfur dioxide, and PM10 over Egypt

1 3 5 7 9 11 13 15 17 19 21 23
Hours
1 3 5 7 9 11 13 15 17 19 21 23
Hours
(a) Site14 (N) (b) Site03 (E)
(c) Site13 (W) (d) Site04 (S)
Mod
el bi
as fo
r SO
2(µ
gm/m
3 )
-40.0
-30.0
-20.0
-10.0
0.0
10.0
20.0
1 3 5 7 9 11 13 15 17 19 21 23
Hours
-40.0
-30.0
-20.0
-10.0
0.0
10.0
20.0
1 3 5 7 9 11 13 15 17 19 21 23
Hours
RegCM-CHEM4 Model bias (µg/m3) for 3-year seasonally averaged daily concentrations of SO2 in (a) Site 14 (N), (b)Site 3 (E), (c) Site 13 (W), and (d) Site 4 (S)
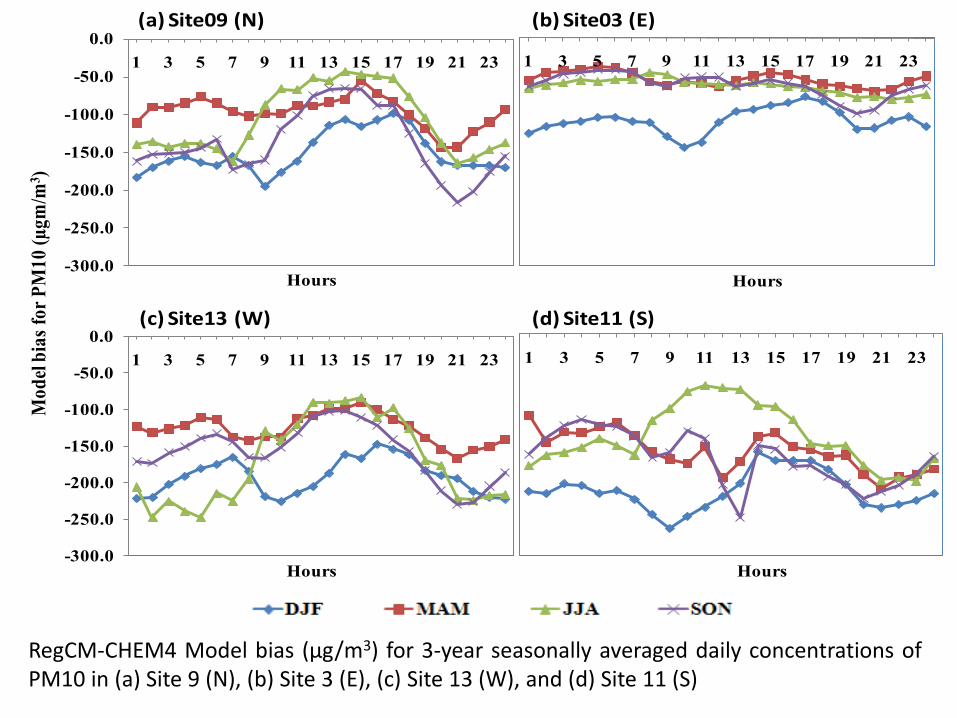
(a) Site09 (N) (b) Site03 (E)
(c) Site13 (W) (d) Site11 (S)
Mod
el bi
as fo
r PM
10 (µ
gm/m
3 )
-300.0
-250.0
-200.0
-150.0
-100.0
-50.0
0.01 3 5 7 9 11 13 15 17 19 21 23
Hours
1 3 5 7 9 11 13 15 17 19 21 23
Hours
-300.0
-250.0
-200.0
-150.0
-100.0
-50.0
0.01 3 5 7 9 11 13 15 17 19 21 23
Hours
1 3 5 7 9 11 13 15 17 19 21 23
Hours
RegCM-CHEM4 Model bias (µg/m3) for 3-year seasonally averaged daily concentrations ofPM10 in (a) Site 9 (N), (b) Site 3 (E), (c) Site 13 (W), and (d) Site 11 (S)

-40.0
-30.0
-20.0
-10.0
0.0
10.0
20.0
1 2 3 4 5 6 7 8 9 10 11 12 13 14 15 16 17 18 19 20 21 22 23 24
Hours
-20.0
-15.0
-10.0
-5.0
0.0
5.0
10.0
15.0
20.0
1 3 5 7 9 11 13 15 17 19 21 23
Hours
1 3 5 7 9 11 13 15 17 19 21 23
Hours
(a) Site07 (E)
(b) Site15 (W)
(c) Site16 (S)
Mod
el bi
as fo
r CO
(µgm
/m3 )
RegCM-CHEM4 Model bias (µg/m3) for 3-year seasonally averaged daily concentrations of COin (a) Site 7 (E), (b) Site 15 (W), and (c) Site 16 (S)

-60.0-50.0-40.0-30.0-20.0-10.0
0.010.020.030.040.0
1 3 5 7 9 11 13 15 17 19 21 23
Hours
1 3 5 7 9 11 13 15 17 19 21 23
Hours
1 3 5 7 9 11 13 15 17 19 21 23
Hours-60.0-50.0-40.0-30.0-20.0-10.0
0.010.020.030.040.0
1 3 5 7 9 11 13 15 17 19 21 23
Hours
(a) Site09 (N) (b) Site03 (E)
(c) Site15 (W) (d) Site11 (S)
Mod
el bi
as fo
r NO
2(µ
gm/m
3 )
RegCM-CHEM4 Model bias (µg/m3) for 3-year seasonally averaged daily concentrations of NO2 in (a) Site 9, (b) Site 11, (c) Site 15, and (d) Site 3

(e) PM10 Model Bias
-255.0
-205.0
-155.0
-105.0
-55.0
-5.01 2 3 4 5 6 7 8 9 10 11 12
Site09 (N) Site10 (E) Site13 (W) Site11 (S)
(a) SO2 Model Bias
(d) O3 Model Bias
(b) NO2 Model Bias
(c) CO Model Bias
Mo
del
bia
s (µ
gm
/m3)
-30.0
-20.0
-10.0
0.0
10.0
20.0
30.0
1 2 3 4 5 6 7 8 9 10 11 12
Site09 (N) Site03 (E) Site02 (W) Site04 (S)
-70.0
-60.0
-50.0
-40.0
-30.0
-20.0
-10.0
0.0
10.0
20.0
1 2 3 4 5 6 7 8 9 10 11 12
Site09 (N) Site10 (E) Site15 (W) Site05 (S)
-20.0-18.0-16.0-14.0-12.0-10.0
-8.0-6.0-4.0-2.00.0
1 2 3 4 5 6 7 8 9 10 11 12
Site07 (E) Site15 (W) Site16 (S) 0.0
10.0
20.0
30.0
40.0
50.0
60.0
1 2 3 4 5 6 7 8 9 10 11 12
Site01 (W)
RegCM-CHEM4 Model bias (µg/m3) for 3-year monthly averaged concentrations of SO2, NO2, CO,O3, and PM10 at the available stations

SummaryThe densely populated Greater Cairo (GC) region suffers from severe air
quality issues caused by high levels of anthropogenic activities, such asmotorized traffic, industries, and agricultural biomass burning events,along with natural sources of particulate matter, such as wind erosion ofarid surfaces. Surface measured concentrations of particulate matter(PM10), sulfur dioxide (SO2), and ozone (O3) and its precursor’s gases(nitrogen dioxide, NO2; carbon monoxide, CO) were obtained for the GCregion. The PM10 concentrations were found to exceed remarkably theEgyptian Guidelines (150 µg/m3). These high levels of PM10 wererecorded throughout 68% of the period of measurement in someindustrial areas (El-Kolaly). The measured data of pollutants were used forboth the evaluation of environmental pollution levels and the validation ofthe online integrated regional climate chemistry model “RegCM-CHEM4”.Calculation of the bias between the model results and the measured datawas used to evaluate the model performance in order to assess its abilityin reproducing the chemical species over the area. The model was foundto reproduce the seasonal cycle of the pollutants successfully, but with alarge underestimation of the PM10 values. Validation of the RegCM-CHEM4 indicated that the emissions inventories of mobile sources andanthropogenic activities need to be improved especially with respect tolocal and regional activities in order to enhance air quality simulationsover GC region.

1. At low cloud liquid water mixing ratio with large size of cloud droplets (re = 10 µm)or low aerosol concentrations, the autoconversion rate will be accelerated by BHscheme more than TC, R6, and KS, respectively.
2. At low in-cloud liquid water ( ≤ 0.1 g kg-1) with smaller cloud droplets (re = 7.5µm) orhigh aerosol concentrations, the BH scheme will act faster than the other schemes,and as a consequence, the scheme of BH resulted in more precipitation than theothers.
3. The inclusion of the direct and 1st indirect effects increased the cooling at thesurface and TOA, which suppressed the precipitations over the west and centralAfrica.
4. With respect to precipitation, the simulations of all_R6 and all_TC had the minimumbias compared to the other simulations over the two domains.
5. With respect to temperature, all simulations have similar skills (RMS, correlation andnormalized standard deviation), with the simulations of all_BH and ctrl resulted inthe minimum bias (< 75%) over west and central domains, respectively, but all_R6and all_TC had the lowest skills.
Summary and Conclusion

References
1. A. S. Zakey, F. Solmon, and F. Giorgi, “Implementation and testing of a desert dustmodule in a regional climate model”, Atmos. Chem. Phys., 6, 4687-4704.
2. DF Zhang, XJ Gao, A Zakey, F Giorgi (2016), Effects of climate changes on dustaerosol over East Asia from RegCM3, Advances in Climate Change Research 7 (3),145-153
3. M. Santese, M.R. Perrone, A.S. Zakey , F.De Tomasi and F. Giorgi “Modeling ofSaharn dust outbreaks over the Mediterranean by RegCM3: Case studies”, Atmos.Chem. Phys., 10, 133-156.
4. Fabien Solmon, Marc Mallet, Nellie Elguindi, Filippo Giorgi, Ashraf Zakey, andAbdourahamane Konare, “Dust aerosol impact on regional preciptaion overwestern Africa, mechanisms and sensitivity to absortion properties”, GeophysicalResearch, Letter Vol. 35, L24705, doi:10.1029/2008GL035900.
5. A. Konare, A. S. Zakey, F. Solmon, F. Giorgi, S. Rauscher, S. Ibrah and X. Bi “ Aregional climate modeling study of the effect of desert dust on the West Africanmonsoon”, Research, Vol. 113, D12206, doi:10.1029/2007JD009322. A. S. Zakey, F.Giorgi, and X. Bi, “Modeling of sea salt in a regional climate model: Fluxes andradiative forcing”,Journal of Grophysical Research, Vol. 113, D14221,doi:10.1029/2007JD009209.
,

1. Shalaby A., A.S. Zakey, A.B. Tawfik, F. Solmon, F. Giorgi, F. Stordal, S. Sillman, R.Zaveri, and A.L. Steiner (2012) "Implementation and evaluation of online gasphasechemistry within a regional climate model (RegCMCHEM4)." Geoscientific ModelDevelopment, DOI: 10.5194/gmdd51492012.
2. Zeinab SALAH, Ahmed SHALABY, Allison L. STEINER, Ashraf S. ZAKEY, RiteshGAUTAM, and Mohamed M. ABDEL WAHAB (2018), Study of Aerosol Direct andIndirect Effects and Auto-conversion Processes over the West African MonsoonRegion Using a Regional Climate Model , ADVANCES IN ATMOSPHERIC SCIENCES,VOL. 35, FEBRUARY 2018, 1–13
3. A.L. Steiner, A.B. Tawfik, A.Shalaby, A.S. Zakey, M.M. Abdel Wahab, Z. Salah, F.Solmon, S. Sillman and R.A. Zaveri (2014) Climatological simulations of ozoneand atmospheric aerosols in the Greater Cairo region, Climate Research,doi:10.3354/cr01211.
4. Langner,J., Engardt,M., Baklanov,A., Christensen,J.H., Gauss,M., Geels,C.,Hedegaard,G.B., Nuterman,R., Simpson,D., Soares,J., Sofiev,M., Wind,P., andZakey,A .: A multimodel study of impacts of climate change on surface ozone inEurope, Atmos. Chem. Phys., 12, 10423–10440, 2012 www.atmoschemphys.net/12/10423/2012/ doi:10.5194/acp12104232012.


Any Questions
Thank You


![Intent-Aware Pedestrian Prediction for Adaptive Crowd ... · prior research exploring robot navigation in human crowds (e.g., [1]) and drew insights from seamless human navigation](https://img.pdfslide.us/doc/110x75/5fc0f7182de8f610aa28cf74/intent-aware-pedestrian-prediction-for-adaptive-crowd-prior-research-exploring.jpg)