Embed Size (px)
Citation preview
Sea Level Rise at East Asia Coasts based on Tide Gauge Analysis
Dong-Jiing Doong[1] Tai-Wen Hsu[2] Li-Chung Wu[2] Chia Chuen Kao[2]
[1] Department of Marine Environmental Informatics, National Taiwan Ocean University, Keelung, TAIWAN, China [2] Department of Hydraulic and Ocean Engineering, National Cheng Kung University, Tainan, TAIWAN, China
ABSTRACT Sea level rise will bring very high impacts to coastal area, including increased coastal erosion, increased flooding risk, more extensive coastal inundation, changes in surface water quality and groundwater characteristics and potential loss of life. IPCC (2007) announced the global average rate is 1.7±0.5 mm/yr for the 20th century. However, this rate is highly non-uniform in the world ocean. The purpose of this study is to know the regional value in the East Asia area. Long-term and qualified records from fifty-eight tide stations collected by PSMSL are used in this study. The linear trend of the sea level changes by least square approach is applied. We confirm the high variation on the sea level rising rates in the study area. At China Bohai Sea, the sea level change is steady within the past few decades. However at the Yangtze River mouth, the rate is large. It is 6.2 mm/yr which is several times of the global average value. A turning trend of the sea level fluctuation is found at the tide stations in Taiwan Island. The average rate of sea level rise of all the fifty-eight tide stations is 2.77 mm/yr for the East Asia area. This is 1.6 times higher than global average. In addition, we find the high rising rates happen at the band of Festoon Islands. This verifies the vertical land movement may contribute to some percentage to the sea level rise. To know the quantitative value of the sea level rise for coastal zone management, all causes should be take into account to have the equivalent value of sea level rise. However, to understand the component of sea level rise induced from global warming of the earth, the vertical land movement should be considered. KEY WORDS: Sea level rise; tide gauge INTRODUCTION Sea-level rise is an increase in sea level. Multiple complex factors may influence this change. In most populated regions in the world, sea level is increasing at a rate of only a few millimeters per year (Church et al., 2004), even the expected accelerated future sea level rise is in average normally less than 1 cm/year. However, over time, this gradual developing process has a high potential to alter ecosystems and habitability in coastal regions and many cause bring very high impacts to humanity, particularly on coastal systems (Mcinnes et al., 2003). Such impacts include increased coastal erosion, higher storm-surge flooding, inhibition of primary production processes, more extensive coastal inundation, changes in surface water quality and groundwater
characteristics, increased loss of property and coastal habitats, increased flood risk and potential loss of life, loss of nonmonetary cultural resources and values, impacts on agriculture and aquaculture through decline in soil and water quality, and loss of tourism, recreation, and transportation functions, especially for the river delta area or for island countries, such as Singapore and Taiwan in the East Asia Area. (Huang et al., 2004; Ng and Mendelsohn, 2005) Global sea level has risen about 130 meters since the peak of the last ice age about 18000 years ago. Since 1900 the sea level has risen at 1 to 2 mm/yr; since 1993 satellite altimetry from TOPEX/Poseidon indicates a rate of rise of 3.1 ± 0.7 mm/yr. IPCC (2007) announced Fourth Assessment Report (AR4) showing that the average 20th century rate of sea-level rise is 1.7 ± 0.5 mm/yr. It also clearly indicated that the reasons for sea level rise have been due to thermal expansion, melting glaciers and ice caps and the polar ice sheets. State Oceanic Administration (SOA) of China announced the report of sea level rise situation at Chinese coasts, showing the average rate of sea level rise is 2.5 mm/yr in the past thirty years. The rate will increase to 3.2 mm/yr in the next ten years at Chinese coasts (SOA, 2008). Hong Kong Observatory (HKO) also announced the average rate of sea level rise around Hong Kong’s coasts is 2.3 mm/yr in the past fifty years (1954-2003) and it had been increased to 7 mm/yr since 1993 (Wong et al., 2003). From above reports, we found the rate of sea level rise is around 1.47 times than the global average rate at Chinese coasts. This identified clearly that non-uniform rate of sea level rise in the world’s ocean. Future sea level rise, like the recent rise, is not expected to be globally uniform. Some regions show a sea-level rise substantially more than the global average, and others a sea level fall. To understand the local value of the sea level rise (or fall) is worthy to provide information for strategies development such as for the coastal zone management to against the natural impacts in the future. The purpose of this paper is to study the regional values of sea level rise at the East Asia coasts. SEA LEVEL DATABASE Tide measurement A tide gauge is used to measure the sea level fluctuations. Since mechanical devices for recording sea level are still in use, but these are
Proceedings of the Nineteenth (2009) International Offshore and Polar Engineering ConferenceOsaka, Japan, June 21-26, 2009Copyright © 2009 by The International Society of Offshore and Polar Engineers (ISOPE)ISBN 978-1-880653-53-1 (Set); ISSN 1098-618
513
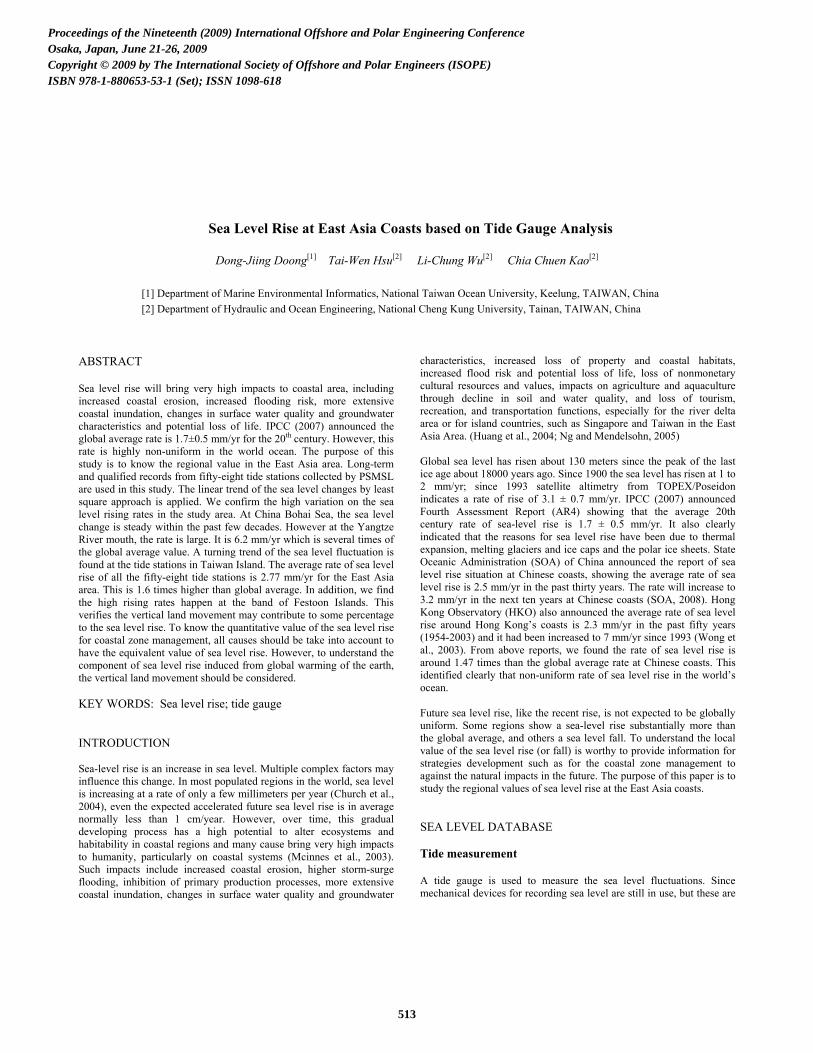
mostly being replaced by acoustic water level meters that measure and record data electronically. Nowadays, the sea level data can be transmitted to the database by cell phone or even satellite. Unlike the mechanical gauge that featured a spring-loaded pulley and wire leading down to a cylindrical float inside a vertical stilling well, the acoustic devices utilize an acoustic “shock-wave” sent down a vertical wave-guide. After striking the water surface, the wave is reflected back to a transducer and microcomputer that converts travel time to distance based on the speed of sound in air. While acoustic instruments don’t have moving parts to jam or become fouled, they do require compensation for the effects of temperature change on sound speed to maintain their high standard of accuracy such as the NOAA’s next generation tide gauge. Figure 1 shows a photo of NOAA-like next generation tide gauge which is installed at Taiwanese coast. The accuracy is in millimeter level which can be used to study the sea level problem.
Figure 1 The NOAA-like next generation tide gauge at Taiwanese coast PSMSL sea level database Since 1933, the Permanent Service for Mean Sea Level (PSMSL) has been responsible for the collection, publication, analysis and interpretation of sea level data from the global network of tide gauges. It is based at the Proudman Oceanographic Laboratory (POL), Bidston Observatory which is a component of the UK Natural Environment Research Council (NERC). The database of the PSMSL contains over 55000 station-years of monthly and annual values of mean sea level (MSL) from over 2000 tide gauge stations around the world received from almost 200 national authorities. The database is used extensively throughout the sciences of climate change, oceanography, geodesy and geology, and is the main source of information for international study groups such as the IPCC. Data for all stations are included in the PSMSL METRIC data set. The METRIC monthly and annual means for any one station-year are necessary required to be measured to a common datum, although, at this stage, datum continuity between years is not essential. The ‘Revised Local Reference (RLR)’ dataset of the PSMSL contains records for which time series analysis of sea level changes can be performed. Long records from this database have been the basis of all analyses of secular changes in global sea level during the last century. Long-term tide stations at East Asia Coasts This study is interested in the analysis of sea level fluctuations at East Asia coasts. We found 255 tide stations are collected in PSMSL sea level database in the East Asia area (105oE-145oE; 15oN-42oN). We use the following criteria to select tide data. First, the length of tide
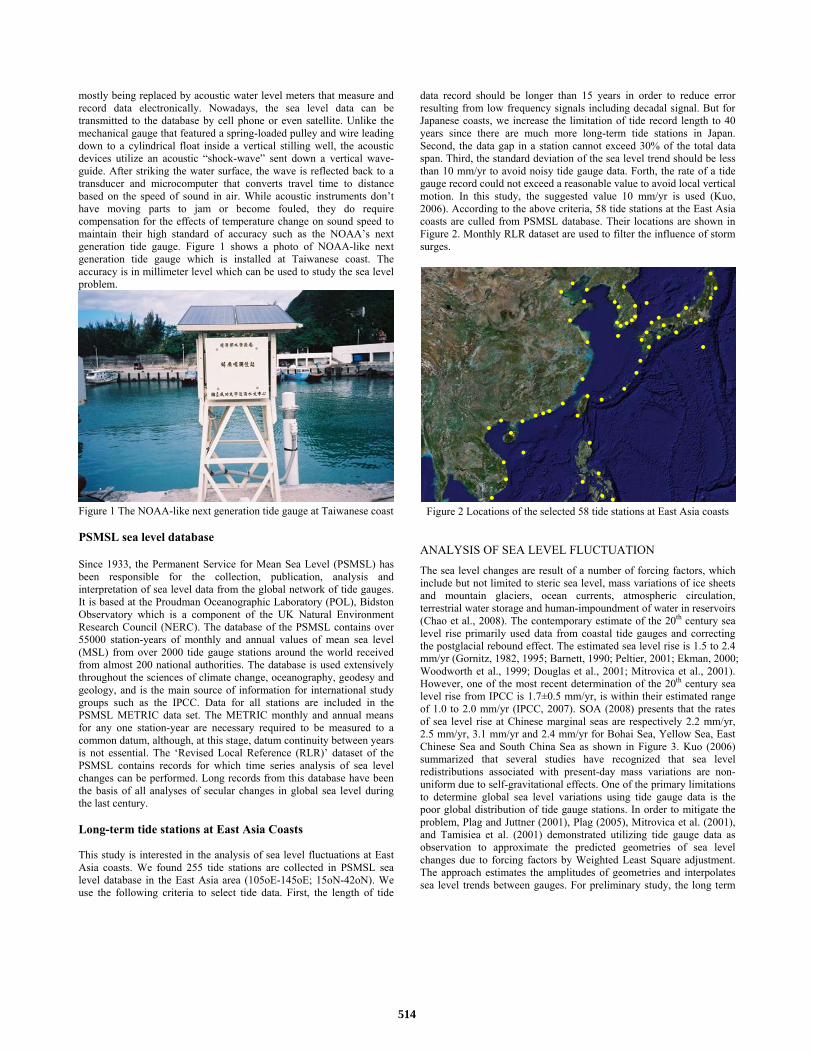
data record should be longer than 15 years in order to reduce error resulting from low frequency signals including decadal signal. But for Japanese coasts, we increase the limitation of tide record length to 40 years since there are much more long-term tide stations in Japan. Second, the data gap in a station cannot exceed 30% of the total data span. Third, the standard deviation of the sea level trend should be less than 10 mm/yr to avoid noisy tide gauge data. Forth, the rate of a tide gauge record could not exceed a reasonable value to avoid local vertical motion. In this study, the suggested value 10 mm/yr is used (Kuo, 2006). According to the above criteria, 58 tide stations at the East Asia coasts are culled from PSMSL database. Their locations are shown in Figure 2. Monthly RLR dataset are used to filter the influence of storm surges.
Figure 2 Locations of the selected 58 tide stations at East Asia coasts
ANALYSIS OF SEA LEVEL FLUCTUATION
The sea level changes are result of a number of forcing factors, which include but not limited to steric sea level, mass variations of ice sheets and mountain glaciers, ocean currents, atmospheric circulation, terrestrial water storage and human-impoundment of water in reservoirs (Chao et al., 2008). The contemporary estimate of the 20th century sea level rise primarily used data from coastal tide gauges and correcting the postglacial rebound effect. The estimated sea level rise is 1.5 to 2.4 mm/yr (Gornitz, 1982, 1995; Barnett, 1990; Peltier, 2001; Ekman, 2000; Woodworth et al., 1999; Douglas et al., 2001; Mitrovica et al., 2001). However, one of the most recent determination of the 20th century sea level rise from IPCC is 1.7±0.5 mm/yr, is within their estimated range of 1.0 to 2.0 mm/yr (IPCC, 2007). SOA (2008) presents that the rates of sea level rise at Chinese marginal seas are respectively 2.2 mm/yr, 2.5 mm/yr, 3.1 mm/yr and 2.4 mm/yr for Bohai Sea, Yellow Sea, East Chinese Sea and South China Sea as shown in Figure 3. Kuo (2006) summarized that several studies have recognized that sea level redistributions associated with present-day mass variations are non-uniform due to self-gravitational effects. One of the primary limitations to determine global sea level variations using tide gauge data is the poor global distribution of tide gauge stations. In order to mitigate the problem, Plag and Juttner (2001), Plag (2005), Mitrovica et al. (2001), and Tamisiea et al. (2001) demonstrated utilizing tide gauge data as observation to approximate the predicted geometries of sea level changes due to forcing factors by Weighted Least Square adjustment. The approach estimates the amplitudes of geometries and interpolates sea level trends between gauges. For preliminary study, the long term
514
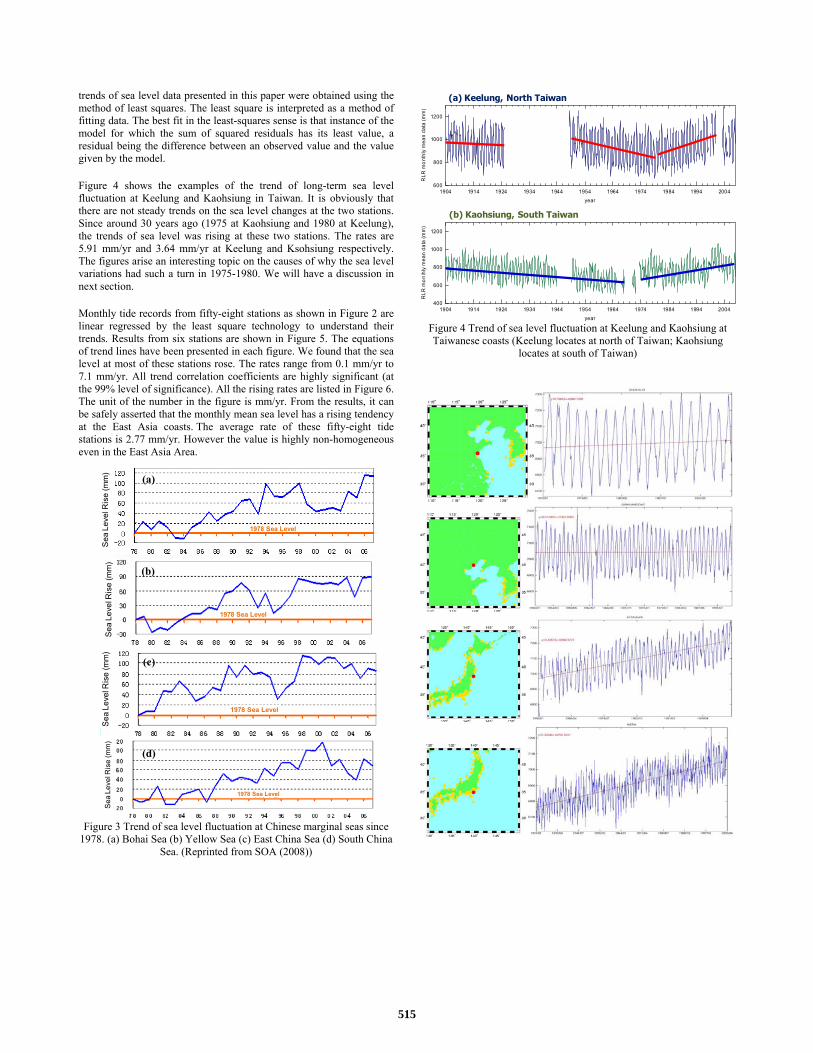
trends of sea level data presented in this paper were obtained using the method of least squares. The least square is interpreted as a method of fitting data. The best fit in the least-squares sense is that instance of the model for which the sum of squared residuals has its least value, a residual being the difference between an observed value and the value given by the model.
Figure 4 shows the examples of the trend of long-term sea level fluctuation at Keelung and Kaohsiung in Taiwan. It is obviously that there are not steady trends on the sea level changes at the two stations. Since around 30 years ago (1975 at Kaohsiung and 1980 at Keelung), the trends of sea level was rising at these two stations. The rates are 5.91 mm/yr and 3.64 mm/yr at Keelung and Ksohsiung respectively. The figures arise an interesting topic on the causes of why the sea level variations had such a turn in 1975-1980. We will have a discussion in next section.
Monthly tide records from fifty-eight stations as shown in Figure 2 are linear regressed by the least square technology to understand their trends. Results from six stations are shown in Figure 5. The equations of trend lines have been presented in each figure. We found that the sea level at most of these stations rose. The rates range from 0.1 mm/yr to 7.1 mm/yr. All trend correlation coefficients are highly significant (at the 99% level of significance). All the rising rates are listed in Figure 6. The unit of the number in the figure is mm/yr. From the results, it can be safely asserted that the monthly mean sea level has a rising tendency at the East Asia coasts. The average rate of these fifty-eight tide stations is 2.77 mm/yr. However the value is highly non-homogeneous even in the East Asia Area.
1978 Sea Level
Sea
Lev
el R
ise
(mm
)
1978 Sea Level
Sea
Lev
el R
ise
(mm
)
1978 Sea Level
Sea
Leve
l Ris
e (m
m)
1978 Sea Level
Sea
Lev
el R
ise
(mm
)
Figure 3 Trend of sea level fluctuation at Chinese marginal seas since
1978. (a) Bohai Sea (b) Yellow Sea (c) East China Sea (d) South China Sea. (Reprinted from SOA (2008))
1904 1914 1924 1934 1944 1954 1964 1974 1984 1994 2004year
400
600
800
1000
1200
RLR
mo
nthl
y m
ean
data
(mm
)
1904 1914 1924 1934 1944 1954 1964 1974 1984 1994 2004
year
600
800
1000
1200
RLR
mon
thly
mea
n da
ta (m
m)
(a) Keelung, North Taiwan
(b) Kaohsiung, South Taiwan
Figure 4 Trend of sea level fluctuation at Keelung and Kaohsiung at Taiwanese coasts (Keelung locates at north of Taiwan; Kaohsiung
locates at south of Taiwan)
(a)
(b)
(c)
(d)
515
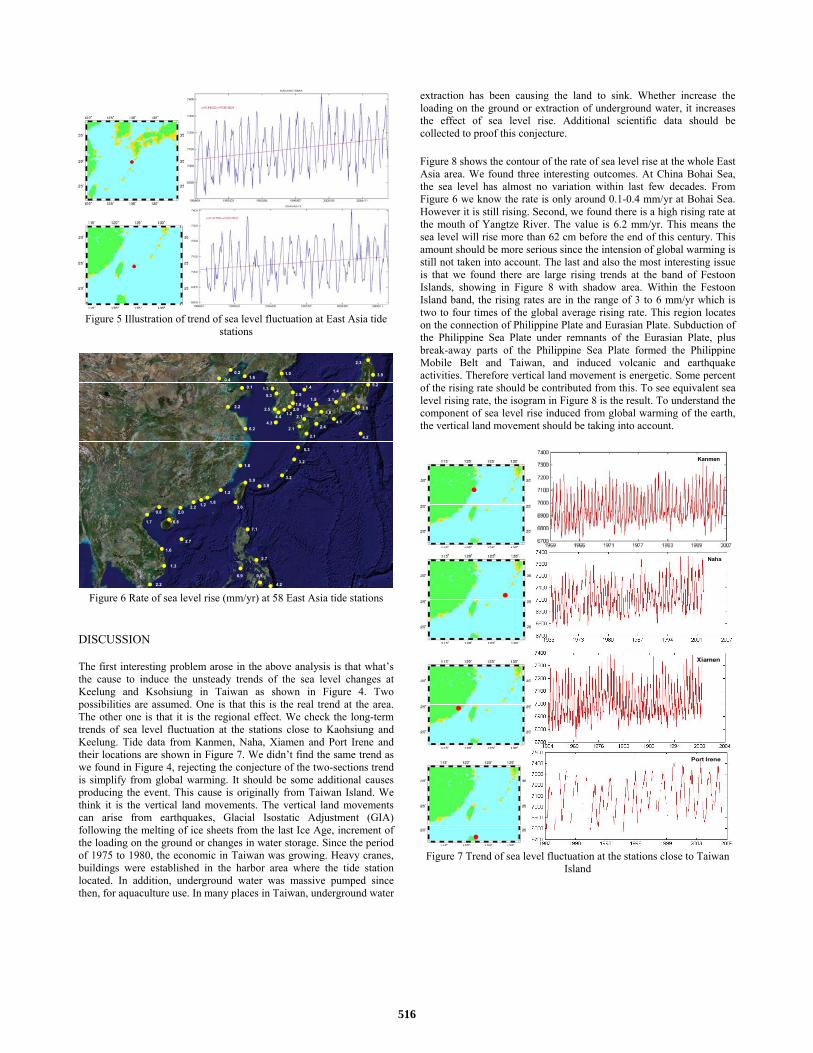
Figure 5 Illustration of trend of sea level fluctuation at East Asia tide
stations
3.8
1.35.3
2.5
4.34.4
1.22.0
1.8
2.5
1.4
1.0 3.9
5.2
3.84.0
2.2
1.3
1.6
1.7
6.9
7.1
2.7
0.9
4.2
0.8 2.0
2.7
1.2
1.8
6.8
1.8
6.2
2.2
0.10.4
0.21.6
1.22.2 3.6
5.9
4.1
5.6
2.4
2.1
2.1
2.1
3.2
5.3
3.2
0.41.5 3.1
1.4
2.3
4.2
Figure 6 Rate of sea level rise (mm/yr) at 58 East Asia tide stations
DISCUSSION The first interesting problem arose in the above analysis is that what’s the cause to induce the unsteady trends of the sea level changes at Keelung and Ksohsiung in Taiwan as shown in Figure 4. Two possibilities are assumed. One is that this is the real trend at the area. The other one is that it is the regional effect. We check the long-term trends of sea level fluctuation at the stations close to Kaohsiung and Keelung. Tide data from Kanmen, Naha, Xiamen and Port Irene and their locations are shown in Figure 7. We didn’t find the same trend as we found in Figure 4, rejecting the conjecture of the two-sections trend is simplify from global warming. It should be some additional causes producing the event. This cause is originally from Taiwan Island. We think it is the vertical land movements. The vertical land movements can arise from earthquakes, Glacial Isostatic Adjustment (GIA) following the melting of ice sheets from the last Ice Age, increment of the loading on the ground or changes in water storage. Since the period of 1975 to 1980, the economic in Taiwan was growing. Heavy cranes, buildings were established in the harbor area where the tide station located. In addition, underground water was massive pumped since then, for aquaculture use. In many places in Taiwan, underground water
extraction has been causing the land to sink. Whether increase the loading on the ground or extraction of underground water, it increases the effect of sea level rise. Additional scientific data should be collected to proof this conjecture. Figure 8 shows the contour of the rate of sea level rise at the whole East Asia area. We found three interesting outcomes. At China Bohai Sea, the sea level has almost no variation within last few decades. From Figure 6 we know the rate is only around 0.1-0.4 mm/yr at Bohai Sea. However it is still rising. Second, we found there is a high rising rate at the mouth of Yangtze River. The value is 6.2 mm/yr. This means the sea level will rise more than 62 cm before the end of this century. This amount should be more serious since the intension of global warming is still not taken into account. The last and also the most interesting issue is that we found there are large rising trends at the band of Festoon Islands, showing in Figure 8 with shadow area. Within the Festoon Island band, the rising rates are in the range of 3 to 6 mm/yr which is two to four times of the global average rising rate. This region locates on the connection of Philippine Plate and Eurasian Plate. Subduction of the Philippine Sea Plate under remnants of the Eurasian Plate, plus break-away parts of the Philippine Sea Plate formed the Philippine Mobile Belt and Taiwan, and induced volcanic and earthquake activities. Therefore vertical land movement is energetic. Some percent of the rising rate should be contributed from this. To see equivalent sea level rising rate, the isogram in Figure 8 is the result. To understand the component of sea level rise induced from global warming of the earth, the vertical land movement should be taking into account.
Kanmen
Naha
Xiamen
Port Irene
Figure 7 Trend of sea level fluctuation at the stations close to Taiwan
Island
516
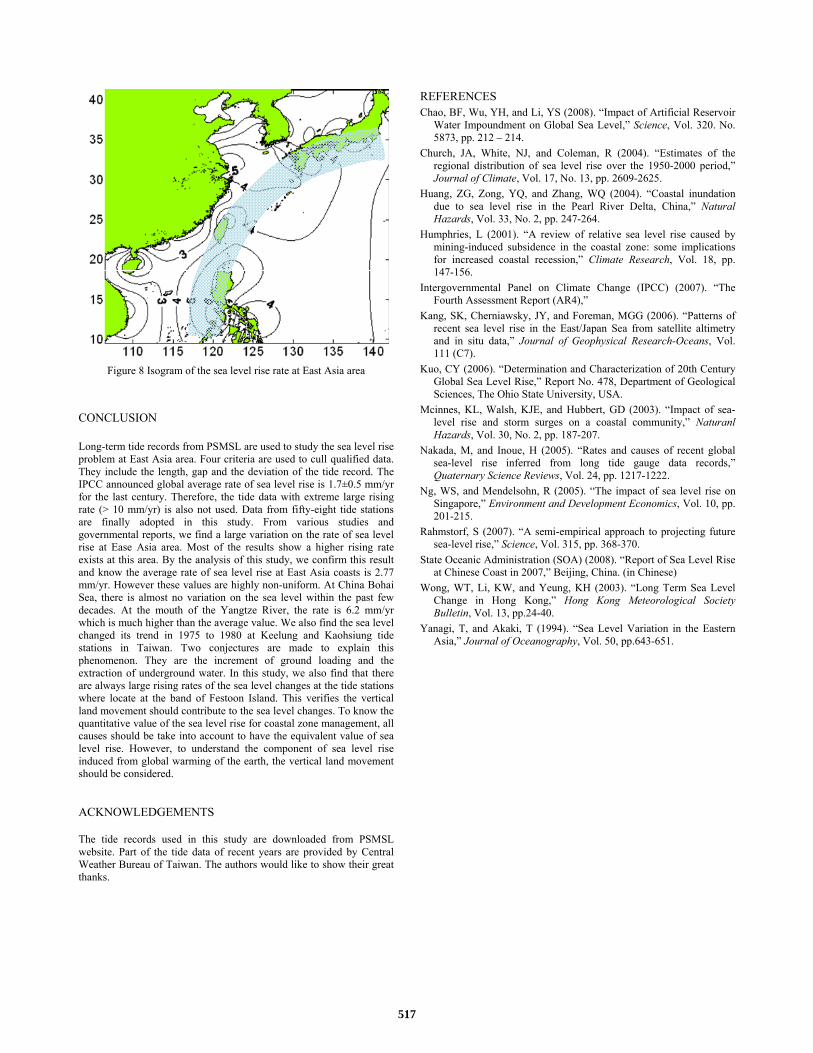
Figure 8 Isogram of the sea level rise rate at East Asia area
CONCLUSION Long-term tide records from PSMSL are used to study the sea level rise problem at East Asia area. Four criteria are used to cull qualified data. They include the length, gap and the deviation of the tide record. The IPCC announced global average rate of sea level rise is 1.7±0.5 mm/yr for the last century. Therefore, the tide data with extreme large rising rate (> 10 mm/yr) is also not used. Data from fifty-eight tide stations are finally adopted in this study. From various studies and governmental reports, we find a large variation on the rate of sea level rise at Ease Asia area. Most of the results show a higher rising rate exists at this area. By the analysis of this study, we confirm this result and know the average rate of sea level rise at East Asia coasts is 2.77 mm/yr. However these values are highly non-uniform. At China Bohai Sea, there is almost no variation on the sea level within the past few decades. At the mouth of the Yangtze River, the rate is 6.2 mm/yr which is much higher than the average value. We also find the sea level changed its trend in 1975 to 1980 at Keelung and Kaohsiung tide stations in Taiwan. Two conjectures are made to explain this phenomenon. They are the increment of ground loading and the extraction of underground water. In this study, we also find that there are always large rising rates of the sea level changes at the tide stations where locate at the band of Festoon Island. This verifies the vertical land movement should contribute to the sea level changes. To know the quantitative value of the sea level rise for coastal zone management, all causes should be take into account to have the equivalent value of sea level rise. However, to understand the component of sea level rise induced from global warming of the earth, the vertical land movement should be considered. ACKNOWLEDGEMENTS The tide records used in this study are downloaded from PSMSL website. Part of the tide data of recent years are provided by Central Weather Bureau of Taiwan. The authors would like to show their great thanks.
REFERENCES Chao, BF, Wu, YH, and Li, YS (2008). “Impact of Artificial Reservoir
Water Impoundment on Global Sea Level,” Science, Vol. 320. No. 5873, pp. 212 – 214.
Church, JA, White, NJ, and Coleman, R (2004). “Estimates of the regional distribution of sea level rise over the 1950-2000 period,” Journal of Climate, Vol. 17, No. 13, pp. 2609-2625.
Huang, ZG, Zong, YQ, and Zhang, WQ (2004). “Coastal inundation due to sea level rise in the Pearl River Delta, China,” Natural Hazards, Vol. 33, No. 2, pp. 247-264.
Humphries, L (2001). “A review of relative sea level rise caused by mining-induced subsidence in the coastal zone: some implications for increased coastal recession,” Climate Research, Vol. 18, pp. 147-156.
Intergovernmental Panel on Climate Change (IPCC) (2007). “The Fourth Assessment Report (AR4),”
Kang, SK, Cherniawsky, JY, and Foreman, MGG (2006). “Patterns of recent sea level rise in the East/Japan Sea from satellite altimetry and in situ data,” Journal of Geophysical Research-Oceans, Vol. 111 (C7).
Kuo, CY (2006). “Determination and Characterization of 20th Century Global Sea Level Rise,” Report No. 478, Department of Geological Sciences, The Ohio State University, USA.
Mcinnes, KL, Walsh, KJE, and Hubbert, GD (2003). “Impact of sea-level rise and storm surges on a coastal community,” Naturanl Hazards, Vol. 30, No. 2, pp. 187-207.
Nakada, M, and Inoue, H (2005). “Rates and causes of recent global sea-level rise inferred from long tide gauge data records,” Quaternary Science Reviews, Vol. 24, pp. 1217-1222.
Ng, WS, and Mendelsohn, R (2005). “The impact of sea level rise on Singapore,” Environment and Development Economics, Vol. 10, pp. 201-215.
Rahmstorf, S (2007). “A semi-empirical approach to projecting future sea-level rise,” Science, Vol. 315, pp. 368-370.
State Oceanic Administration (SOA) (2008). “Report of Sea Level Rise at Chinese Coast in 2007,” Beijing, China. (in Chinese)
Wong, WT, Li, KW, and Yeung, KH (2003). “Long Term Sea Level Change in Hong Kong,” Hong Kong Meteorological Society Bulletin, Vol. 13, pp.24-40.
Yanagi, T, and Akaki, T (1994). “Sea Level Variation in the Eastern Asia,” Journal of Oceanography, Vol. 50, pp.643-651.
517