Embed Size (px)
Citation preview
Climatic Change (2011) 107:81–108DOI 10.1007/s10584-011-0082-0
Sea level rise and South Florida coastal forests
Amartya K. Saha · Sonali Saha · Jimi Sadle ·Jiang Jiang · Michael S. Ross · René M. Price ·Leonel S. L. O. Sternberg · Kristie S. Wendelberger
Received: 2 August 2010 / Accepted: 31 March 2011 / Published online: 10 May 2011© Springer Science+Business Media B.V. 2011
Abstract Coastal ecosystems lie at the forefront of sea level rise. We posit thatbefore the onset of actual inundation, sea level rise will influence the speciescomposition of coastal hardwood hammocks and buttonwood (Conocarpus erectusL.) forests of the Everglades National Park based on tolerance to drought andsalinity. Precipitation is the major water source in coastal hammocks and is storedin the soil vadose zone, but vadose water will diminish with the rising water tableas a consequence of sea level rise, thereby subjecting plants to salt water stress. Amodel is used to demonstrate that the constraining effect of salinity on transpirationlimits the distribution of freshwater-dependent communities. Field data collectedin hardwood hammocks and coastal buttonwood forests over 11 years show thathalophytes have replaced glycophytes. We establish that sea level rise threatens 21rare coastal species in Everglades National Park and estimate the relative risk to each
A. K. SahaSoutheast Environmental Research Center, Florida International University,11200 SW 8th Street, Miami, FL 33199, USA
S. Saha (B)The Institute for Regional Conservation, 22601 SW 152nd Ave., Miami, FL 33170, USAe-mail: [email protected]
J. SadleEverglades National Park, 40001 State Rd. 9336, Homestead, FL 33034-6733, USA
J. Jiang · L. S. L. O. SternbergDept. of Biology, University of Miami, 1301 Memorial Drive, Coral Gables, FL 33124, USA
M. S. Ross · R. M. PriceSoutheast Environmental Research Center and Dept. of Earth and Environment,Florida International University, OE 148, Miami, FL 33199, USA
K. S. WendelbergerCurriculum for the Environment and Ecology, University of North Carolina, Chapel Hill,207 Coates Building CB# 3275, Chapel Hill, NC 27599-3275, USA
82 Climatic Change (2011) 107:81–108
species using basic life history and population traits. We review salinity conditions inthe estuarine region over 1999–2009 and associate wide variability in the extent of theannual seawater intrusion to variation in freshwater inflows and precipitation. Wealso examine species composition in coastal and inland hammocks in connection withdistance from the coast, depth to water table, and groundwater salinity. Though thisstudy focuses on coastal forests and rare species of South Florida, it has implicationsfor coastal forests threatened by saltwater intrusion across the globe.
1 Introduction
Sea level rise of 1 to 2 m by 2100 (Allison et al. 2009) threatens South Florida’slow-lying coasts where plant communities are organized along a mild gradientin elevation, from mangroves at sea level to salinity-intolerant coastal hardwoodhammocks on localized elevations generally less than 2 m above sea level (Olmstedand Loope 1980, 1984). A 30 cm increase in sea level is expected to render coastalsystems erosional, preceding the complete collapse with a breach of coastal marlridges resulting from a 60 cm rise in sea level (Wanless et al. 1994). However, evenbefore the onset of sustained inundation there can be irreversible changes in coastalforest composition, which is the focus of this paper. While studies in southeasternUnited States have looked at the role of sea level rise-induced increases in floodingfrequency and groundwater salinity in coastal hydric hammocks of Florida (DeSantiset al. 2007; Williams et al. 1999), pine rocklands on oceanic islands off Florida’scoast (Ross et al. 1994, 2009), coastal marshes of Florida and Louisiana (Donnellyand Bertress 2001; Reed 2002), deltaic coasts of Mississippi (Blum and Roberts2009), and tidal swamps in South Carolina (Krauss et al. 2009), coastal forests ofEverglades National Park (ENP) provide a novel setting because the wide range ofplant communities present differ in their salinity tolerances. Additionally, reducedfreshwater inflows due to upstream water management have hastened salt-waterintrusion in ENP’s coastal ecosystems (Nuttle et al. 2000; Sklar and Browder 1998).Though Florida’s coast lines have always been in flux, the recent acceleration in therate of increase in sea level in conjunction with human alteration of Evergladeshydrology imparts an urgency to the documentation and scientific study of theprocesses governing ecosystem change and the loss of rare species (Pearlstine et al.2009).
Saltwater intrusion increases the extent of halophyte-dominated plant commu-nities in the world’s coastal tropical and subtropical ecosystems (e.g. India: Blasco1977, Australia: Knighton et al. 1991; Lucas et al. 2002; Florida: Alexander 1974;Ross et al. 1994, 2009; Williams et al. 2007). This is also true in the southernEverglades where the coastline is dominated by mangroves (Avicennia germinans L.,Rhizophora mangle L. and Laguncularia racemosa (L.) C.F. Gaertn.). While sea levelincreased by approximately 30 cm over the last century as measured in Key West, FL,seawater intrusion into the Biscayne aquifer along the Everglades coastline extendedat a faster than expected rate due to the diversion of surface water flow away fromthe ENP with the construction of canals and levees between Lake Okeechobee andENP (Klein and Waller 1985; Sonenshein and Koszalka 1996). By the late 1990s,saltwater intrusion extended approximately 30 km inland in the Shark River Sloughregion of ENP and about 10 and 15 km inland in the regions of C-111 Basin and
Climatic Change (2011) 107:81–108 83
Taylor Slough, respectively (Fitterman et al. 1999). The boundary between fresh andsaline groundwater in the region was determined to be diffuse as opposed to a sharptransition (Price et al. 2006).
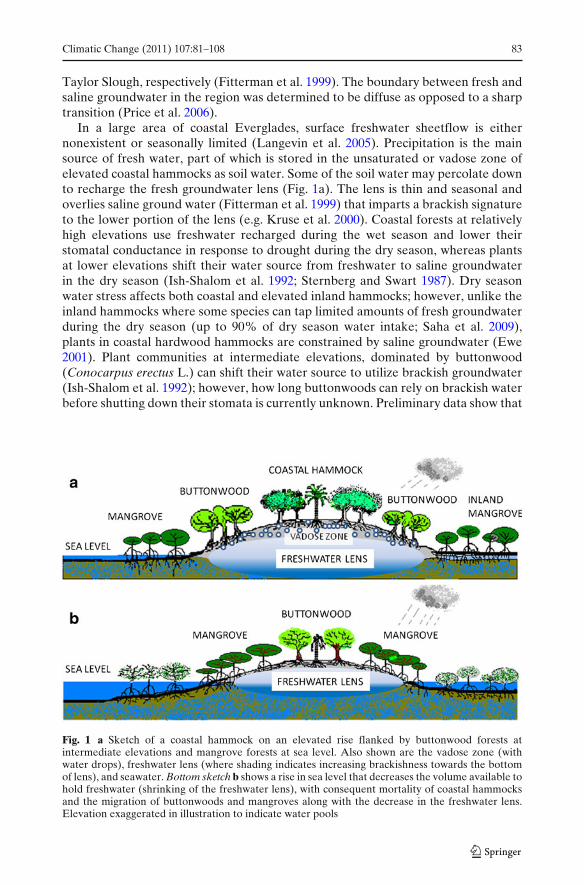
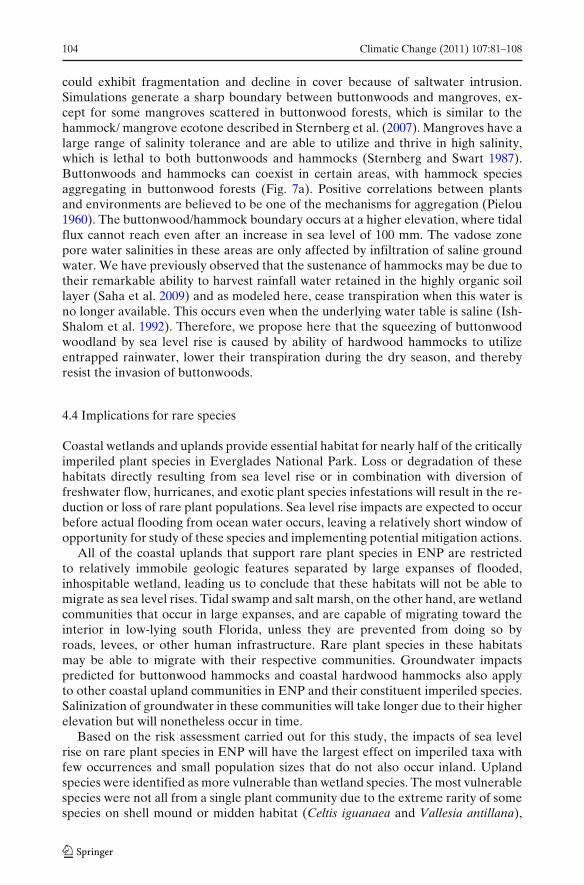
In a large area of coastal Everglades, surface freshwater sheetflow is eithernonexistent or seasonally limited (Langevin et al. 2005). Precipitation is the mainsource of fresh water, part of which is stored in the unsaturated or vadose zone ofelevated coastal hammocks as soil water. Some of the soil water may percolate downto recharge the fresh groundwater lens (Fig. 1a). The lens is thin and seasonal andoverlies saline ground water (Fitterman et al. 1999) that imparts a brackish signatureto the lower portion of the lens (e.g. Kruse et al. 2000). Coastal forests at relativelyhigh elevations use freshwater recharged during the wet season and lower theirstomatal conductance in response to drought during the dry season, whereas plantsat lower elevations shift their water source from freshwater to saline groundwaterin the dry season (Ish-Shalom et al. 1992; Sternberg and Swart 1987). Dry seasonwater stress affects both coastal and elevated inland hammocks; however, unlike theinland hammocks where some species can tap limited amounts of fresh groundwaterduring the dry season (up to 90% of dry season water intake; Saha et al. 2009),plants in coastal hardwood hammocks are constrained by saline groundwater (Ewe2001). Plant communities at intermediate elevations, dominated by buttonwood(Conocarpus erectus L.) can shift their water source to utilize brackish groundwater(Ish-Shalom et al. 1992); however, how long buttonwoods can rely on brackish waterbefore shutting down their stomata is currently unknown. Preliminary data show that
Fig. 1 a Sketch of a coastal hammock on an elevated rise flanked by buttonwood forests atintermediate elevations and mangrove forests at sea level. Also shown are the vadose zone (withwater drops), freshwater lens (where shading indicates increasing brackishness towards the bottomof lens), and seawater. Bottom sketch b shows a rise in sea level that decreases the volume available tohold freshwater (shrinking of the freshwater lens), with consequent mortality of coastal hammocksand the migration of buttonwoods and mangroves along with the decrease in the freshwater lens.Elevation exaggerated in illustration to indicate water pools
84 Climatic Change (2011) 107:81–108
the stomatal conductance of buttonwoods is lower in mangrove forests comparedto mixed hardwood hammocks (L. Sternberg and S. Saha unpublished data) and isinversely related to salinity (S. Saha unpublished data).
Using insights from water budgets of inland hardwood hammocks where ground-water is fresh (Saha et al. 2009; Sullivan et al. 2010; Villalobos 2010) and from dataon patterns of water source utilization by hardwood species in coastal hammocks,we conceptualize how sea level rise will affect freshwater availability in coastalhardwood hammocks. We suggest that the rising water table accompanying sea levelrise will lead to shrinking of the vadose zone as well as increase salinity in thebottom portion of the freshwater lens (Fig. 1b), subsequently increasing brackishnessof plant-available water. This will influence tree species composition of coastalhardwood hammocks and buttonwood forests based upon species-level toleranceto salinity and/or drought and may also lead to the disappearance or decline ofcritically imperiled coastal plant species. Such conditions already arise over thedry season, when upon shrinking of the freshwater lens, plants are exposed to theunderlying saline groundwater. We thus examine the existing species compositionon coastal and inland hammocks across ENP in connection with the underlyingsalinity gradient. With the central premise that salinity has differential impacts ontranspiration of plant communities in the coastal Everglades (Sternberg et al. 2007;Teh et al. 2008) we model the change in buttonwood forests with rise in sea level. Wevalidate the model using data on groundwater salinity (1999 to 2010) to examinethe rate of seawater intrusion in coastal Everglades, and use data from coastalplant communities along the gradient in elevation to compare species abundancesof glycophytes (salt-sensitive) and halophytes (salt-tolerant, sensu Glenn et al. 1999)between 1998 and 2009. Finally, using basic life history and population traits, weestimate the relative risk posed by sea level rise and habitat change to rare andendemic species.
2 Methods
2.1 Species composition and seawater intrusion
2.1.1 Study location and species composition
We sample forests/hammocks/tree islands in the ENP, which vary in their distancesfrom the coast and the freshwater/saltwater interface (FWSWI). Our objective is toinvestigate if there are distinctions in species composition based on distance from thecoast and FWSWI. The closer a site is to the coast, the greater would be the salinityof groundwater. Species composition of hardwood hammocks dominated by tropicalspecies (forests and hammocks are used interchangeably) and buttonwood forestslocated in ENP are determined and then examined in relation to the underlyingsalinity gradient.
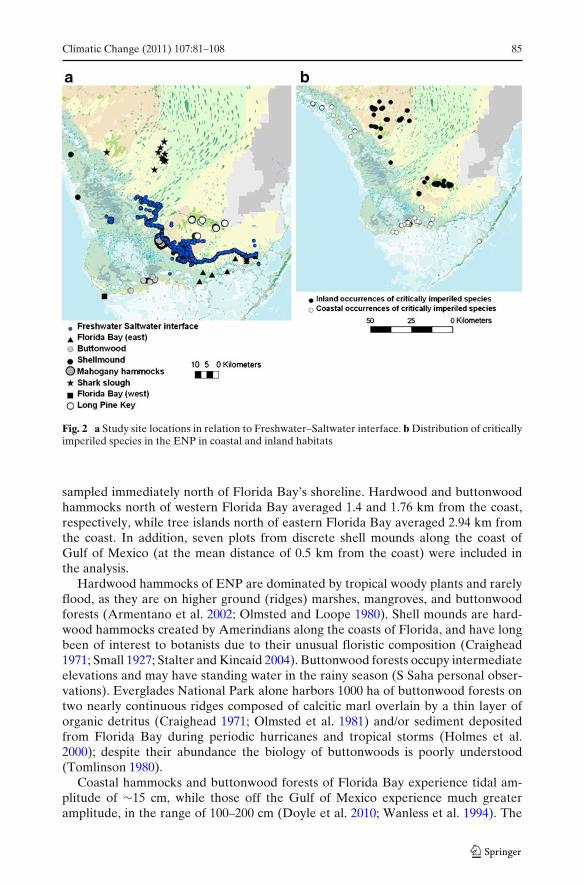
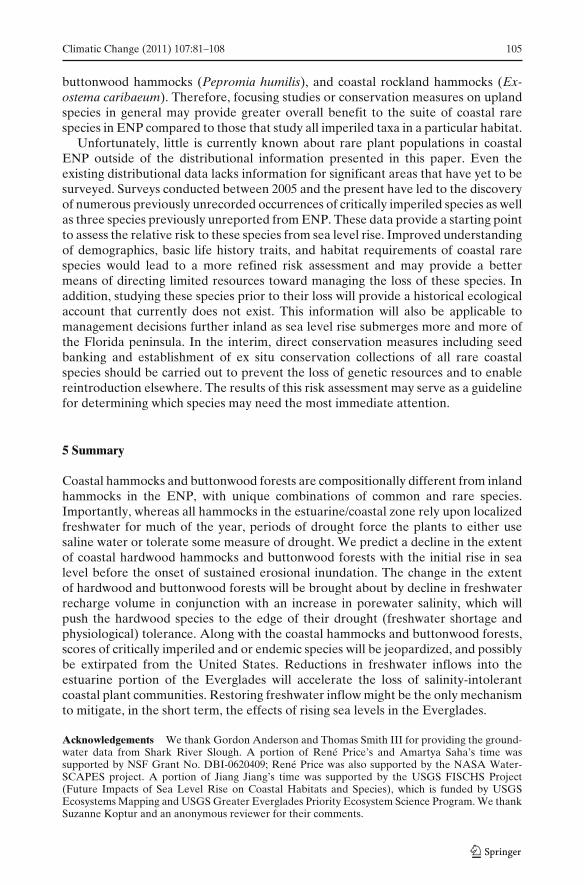
Sampled hammocks occurred at different distances from the coast; hammocks inLong Pine Key (an elevated ridge of limestone that separates the Taylor Slough andShark River Slough, the two main drainages of ENP) averaged 22 km from the coast;plots located in mahogany (Swietenia mahagoni (L.) Jacq.)- dominated hammockssouthwest of LPK averaged 17 km; and tree islands in Shark River Slough basinaveraged 29 km (Fig. 2a). Hammocks, buttonwood forests and tree islands were
Climatic Change (2011) 107:81–108 85
Fig. 2 a Study site locations in relation to Freshwater–Saltwater interface. b Distribution of criticallyimperiled species in the ENP in coastal and inland habitats
sampled immediately north of Florida Bay’s shoreline. Hardwood and buttonwoodhammocks north of western Florida Bay averaged 1.4 and 1.76 km from the coast,respectively, while tree islands north of eastern Florida Bay averaged 2.94 km fromthe coast. In addition, seven plots from discrete shell mounds along the coast ofGulf of Mexico (at the mean distance of 0.5 km from the coast) were included inthe analysis.
Hardwood hammocks of ENP are dominated by tropical woody plants and rarelyflood, as they are on higher ground (ridges) marshes, mangroves, and buttonwoodforests (Armentano et al. 2002; Olmsted and Loope 1980). Shell mounds are hard-wood hammocks created by Amerindians along the coasts of Florida, and have longbeen of interest to botanists due to their unusual floristic composition (Craighead1971; Small 1927; Stalter and Kincaid 2004). Buttonwood forests occupy intermediateelevations and may have standing water in the rainy season (S Saha personal obser-vations). Everglades National Park alone harbors 1000 ha of buttonwood forests ontwo nearly continuous ridges composed of calcitic marl overlain by a thin layer oforganic detritus (Craighead 1971; Olmsted et al. 1981) and/or sediment depositedfrom Florida Bay during periodic hurricanes and tropical storms (Holmes et al.2000); despite their abundance the biology of buttonwoods is poorly understood(Tomlinson 1980).
Coastal hammocks and buttonwood forests of Florida Bay experience tidal am-plitude of !15 cm, while those off the Gulf of Mexico experience much greateramplitude, in the range of 100–200 cm (Doyle et al. 2010; Wanless et al. 1994). The
86 Climatic Change (2011) 107:81–108
lack of large tides along Florida Bay might be an important factor permitting theexistence of these salinity-intolerant communities on low marl berms in eastern ENP.
We obtained published data on presence–absence of woody plants in tree islandswithin coastal wetlands adjoining eastern Florida Bay (100 m2) from Meeder et al.(1996). For all other sites we used unpublished data collected by S. Saha and J. Sadle(Fig. 2a).
2.1.2 Seawater intrusion
We examined the groundwater salinity gradient created by saltwater intrusionfrom three independent sources—(1) Fitterman et al. (1999) resistivity studies, (2)salinity data from groundwater wells, and (3) reconstruction of groundwater salinityand depth to water table for all sampled plots based on the species-environmentrelationships derived from the Florida Keys (Ross et al. 1992).
The freshwater–saltwater interface (FWSWI) was defined by Fitterman et al.(1999) as values of formation resistivity of less than 10 ohm-m as obtained from aresistivity survey of the Biscayne Aquifer across ENP. They found that the depthof the FWSWI varied from near the ground surface along the coastline to a depthof greater than 20 m at its most inland extent. The position of the FWSWI asdetermined by Fitterman et al. (1999) was plotted on a map. We obtained the mapcoordinates for locations that had resistivity around 10 ohm-m at a depth of 5–10 m (U.S. Department of Interior 2007) corresponding to maximum plant wateruptake depth and plotted them to indicate the freshwater–saltwater transition zoneas of 1999. Sampled hammock locations were then plotted in relation to the FWSWIcontour (Fig. 2a).
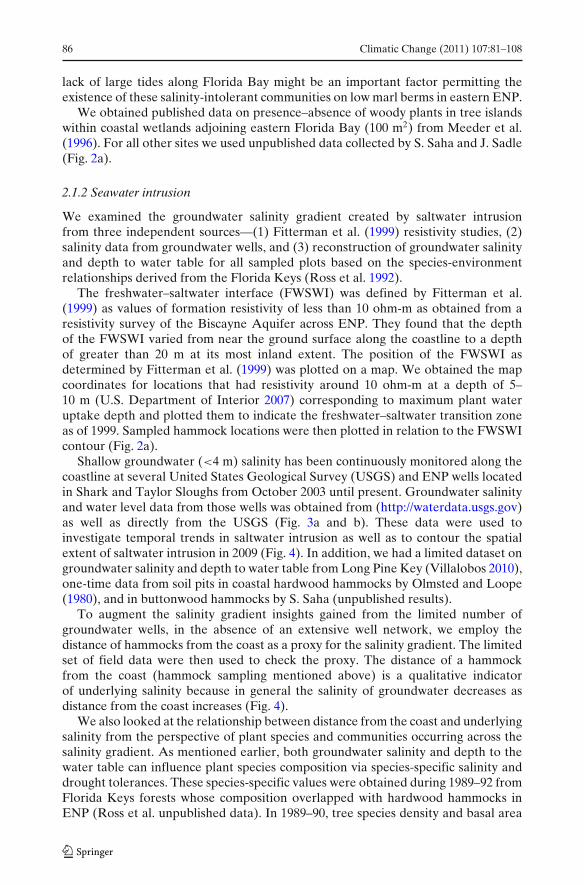
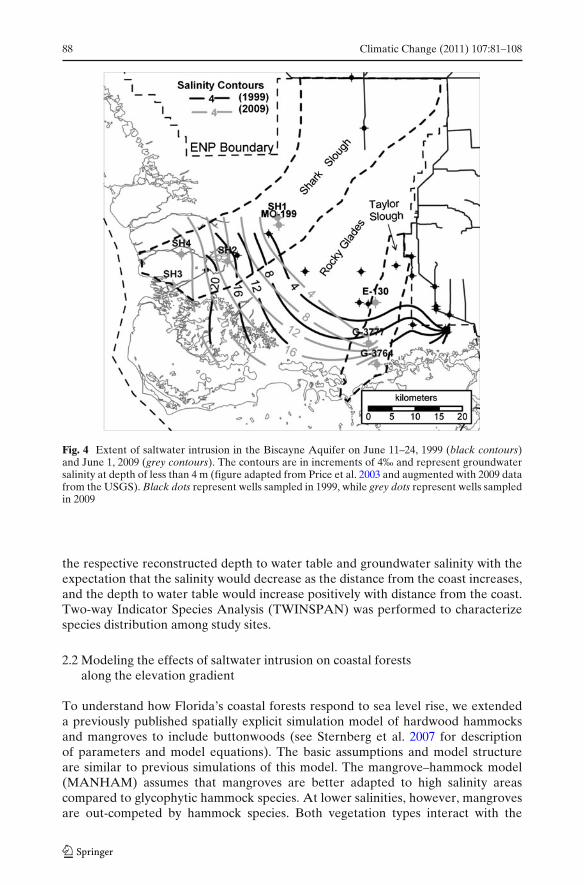
Shallow groundwater (<4 m) salinity has been continuously monitored along thecoastline at several United States Geological Survey (USGS) and ENP wells locatedin Shark and Taylor Sloughs from October 2003 until present. Groundwater salinityand water level data from those wells was obtained from (http://waterdata.usgs.gov)as well as directly from the USGS (Fig. 3a and b). These data were used toinvestigate temporal trends in saltwater intrusion as well as to contour the spatialextent of saltwater intrusion in 2009 (Fig. 4). In addition, we had a limited dataset ongroundwater salinity and depth to water table from Long Pine Key (Villalobos 2010),one-time data from soil pits in coastal hardwood hammocks by Olmsted and Loope(1980), and in buttonwood hammocks by S. Saha (unpublished results).
To augment the salinity gradient insights gained from the limited number ofgroundwater wells, in the absence of an extensive well network, we employ thedistance of hammocks from the coast as a proxy for the salinity gradient. The limitedset of field data were then used to check the proxy. The distance of a hammockfrom the coast (hammock sampling mentioned above) is a qualitative indicatorof underlying salinity because in general the salinity of groundwater decreases asdistance from the coast increases (Fig. 4).
We also looked at the relationship between distance from the coast and underlyingsalinity from the perspective of plant species and communities occurring across thesalinity gradient. As mentioned earlier, both groundwater salinity and depth to thewater table can influence plant species composition via species-specific salinity anddrought tolerances. These species-specific values were obtained during 1989–92 fromFlorida Keys forests whose composition overlapped with hardwood hammocks inENP (Ross et al. unpublished data). In 1989–90, tree species density and basal area
Climatic Change (2011) 107:81–108 87
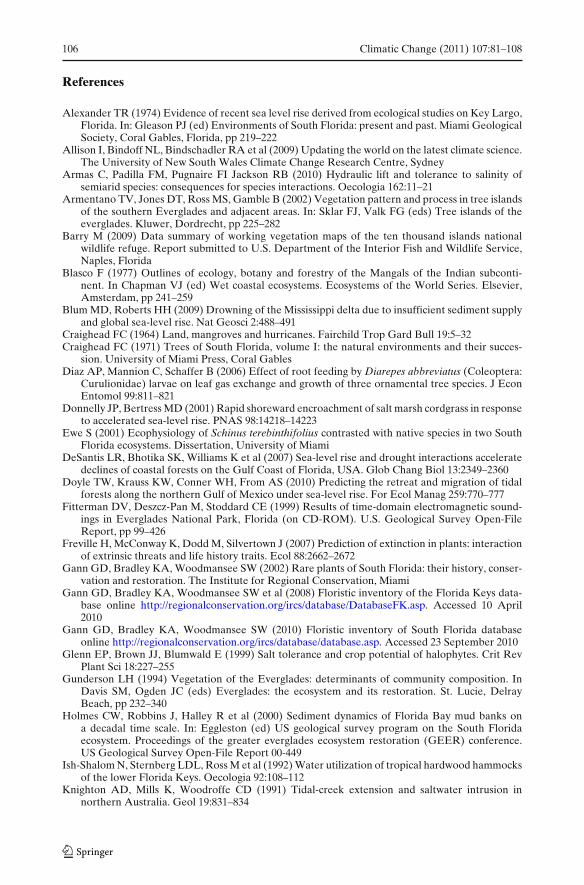
Fig. 3 a Groundwater salinity(black dots) along withgroundwater level (black line)at USGS site SH2 in SharkRiver Slough. b Groundwatersalinity in parts per thousand(black dots) along withgroundwater level (black line)at USGS site G-3337 in TaylorSlough
a
b
were determined in twenty-two 10 " 60 m plots, representing the broad spectrumof Keys forest vegetation. Ground water depth and salinity were sampled from thetop of the water table monthly for three years using a refractometer (Ross et al.1992). Abundance-weighted means for each species were calculated for both theseparameters, using the relative basal area of each species in each plot as the weightingfactor. We used these abundance-weighted salinity and depth to water table valuesfor the constituent species from Ross et al. (1992) to obtain a site or a plot value forsalinity and depth to water table for ENP plots by averaging across the constituentspecies per ENP site used in this study.
2.1.3 Data analysis
We performed detrended correspondence analysis (DCA) ordination to describespecies composition based on presence–absence on data collected in 100 m2 plotslocated all across ENP. Twelve plots each of Long Point Key, Mahogany andButtonwood hammocks; sixteen plots at Florida Bay (east); four plots at FloridaBay (west); and seven plots each in tree islands of Shark River Slough basin andcoastal shell mounds were sampled. Axis I of the DCA ordination was regressedagainst distance from the coast. Distance from the coast was also regressed against
88 Climatic Change (2011) 107:81–108
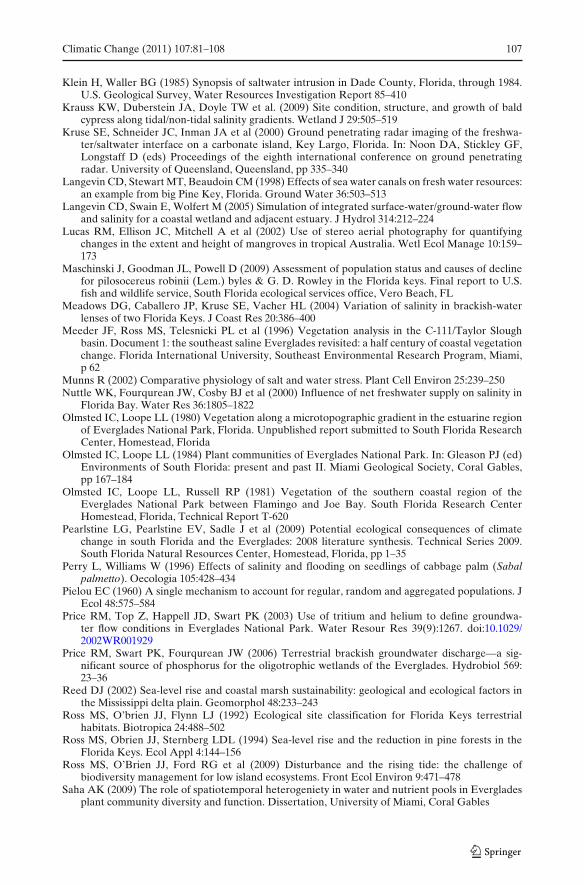
Fig. 4 Extent of saltwater intrusion in the Biscayne Aquifer on June 11–24, 1999 (black contours)and June 1, 2009 (grey contours). The contours are in increments of 4‰ and represent groundwatersalinity at depth of less than 4 m (figure adapted from Price et al. 2003 and augmented with 2009 datafrom the USGS). Black dots represent wells sampled in 1999, while grey dots represent wells sampledin 2009
the respective reconstructed depth to water table and groundwater salinity with theexpectation that the salinity would decrease as the distance from the coast increases,and the depth to water table would increase positively with distance from the coast.Two-way Indicator Species Analysis (TWINSPAN) was performed to characterizespecies distribution among study sites.
2.2 Modeling the effects of saltwater intrusion on coastal forestsalong the elevation gradient
To understand how Florida’s coastal forests respond to sea level rise, we extendeda previously published spatially explicit simulation model of hardwood hammocksand mangroves to include buttonwoods (see Sternberg et al. 2007 for descriptionof parameters and model equations). The basic assumptions and model structureare similar to previous simulations of this model. The mangrove–hammock model(MANHAM) assumes that mangroves are better adapted to high salinity areascompared to glycophytic hammock species. At lower salinities, however, mangrovesare out-competed by hammock species. Both vegetation types interact with the
Climatic Change (2011) 107:81–108 89
unsaturated soil (vadose zone) salinity by regulating their transpiration. Their re-spective transpiration and associated water uptake regimes have a feedback effectupon the vadose zone salinity, by driving different degrees of recharge of the vadosezone from the underlying saline water table to replenish the water absorbed by theplant. Thus, each vegetation type tends to promote local salinity conditions that favortheir own establishment and maintenance. We extend this model to include a thirdcommunity, buttonwood forests, with salinity tolerance intermediate to mangrovesand hammocks.
Uptake of water as a function of salinity by hammocks and mangroves weredescribed in detail in Sternberg et al. (2007). Here we add buttonwood to the modeland propose the following empirical relation between buttonwood transpiration (R)and vadose zone salinity (Sv):
R = 5.782 + e0.15(Sv#10)
The relationship between transpiration and salinity of buttonwoods is less sensitiveto salinity compared to hammocks, but more sensitive compared to mangroves.Buttonwood is dominant in brackish water areas, whereas few coexist with mangroveat higher salinity levels (Urrego et al. 2009). To check this relationship, buttonwoodleaf transpiration data measured with a porometer (Li-Cor 1600, Lincoln NE,USA) from two days in an on-going experiment growing buttonwood plants at fourdifferent salinity levels (0‰, 5‰, 15‰ and 30‰, S. Saha unpublished) were utilized.
In the model used by Sternberg et al. (2007), the rate of transpiration for bothmangroves and hammocks at the salinity of 0 parts per thousand (‰) was 2.6 mmday#1. For convenience, we use the same value of maximum transpiration forbuttonwoods. Buttonwoods are known to tolerate some salinity, and show a declinein growth rate when transpiration is lower than 0.78!0.97 mm/day (Diaz et al.2006), which corresponds to salinity around 20‰ in our empirical relation betweenbuttonwood transpiration and vadose zone salinity (Fig. 4). In the field, buttonwooddensity is very low if the salinity is higher than 20‰, at sites where mangroves aredominant (Urrego et al. 2009). We assume that mangroves will replace buttonwoodswhen the 2-year running average of transpiration is less than 0.89 mm/day at salinityof 20‰. On the other hand, if salinity is <20‰, buttonwoods are maintained and willreplace mangroves.
The revised MANHAM model was simulated in a grid-based system with 100 "100 cells. Each cell (or pixel) represents a 1 m2 segment within a landscape typical ofFlorida’s coastal topography that increases in elevation at an average of 10 mm permeter (Sternberg et al. 2007; Teh et al. 2008). Each cell can be populated either byhammock species, buttonwood, or mangrove species. Initial conditions are set suchthat the cells are randomly populated with one of the above species. We expect thatthese communities will self organize into a typical spatial pattern observed in coastalFlorida; i.e., hammocks species at the highest elevation, mangroves at the lowestelevation, and buttonwood forests ‘sandwiched’ between hammocks and mangroves.To investigate the effects of SLR, mean tidal heights and water table heights wereassumed to increase 3 mm/year until they reached 100 mm above initial conditions.SLR simulations were run only after the vegetation structure reached equilibriumunder initially constant sea level conditions.
90 Climatic Change (2011) 107:81–108
2.3 Changes in species composition along an elevation gradient in coastal forests
Changes in abundance of common woody plant species in coastal forests along anelevational gradient were monitored in ENP’s Coot Bay Hammock (25$12%24.13%%N,80$55%47.48%%W), which borders Coot Bay and whose salinity is influenced byWhitewater Bay, to which it is directly connected. The salinity data suggest anincreasing trend over time (data from hydrological station maintained by ENP).Coot Bay Hammock is an ideal study site because hardwood hammocks occur atthe highest, and mangroves and coastal prairies occur at the lowest end of thegradient in elevation, while buttonwood dominated forests and mixed hammockswith buttonwood, manchineel (Hippomane mancinella L.), and Spanish stopper(Eugenia foetida Pers.) occupy intermediate elevation. The baseline data in the CootBay community complex were established in 1980, when depth to groundwater,elevation, and groundwater salinity were determined. Additional censuses wereconducted in 1998 by Armentano et al. (2002) and in 2009 by K. Wendelberger andS. Saha.
We compare community composition across 1998–2009 for buttonwood forests,mixed-hammock, and hardwood hammock communities. Woody vegetation in but-tonwood (0.6–0.7 m above msl), mixed hardwood hammocks (elevations 0.7–0.9 m),and hardwood hammocks (elevation 0.9–1.5 m) was inventoried in rectangular plotsof 5 " 20 m. All plants <0.6 m tall were classified as seedlings, individuals >0.6 m and<2 cm diameter at breast height (DBH) were classified as saplings, and all individuals>2 cm DBH as adult trees. Three plots were established per community type. Wecompared the densities of dominant species in buttonwood, mixed hammocks, andhardwood hammocks between 1998 and 2009 to test if halophytes increased andglycophytes showed a decline, a pattern that would parallel the trend exhibited byincreasing salinity of Whitewater Bay.
2.4 Rare species in coastal ecosystems of South Florida
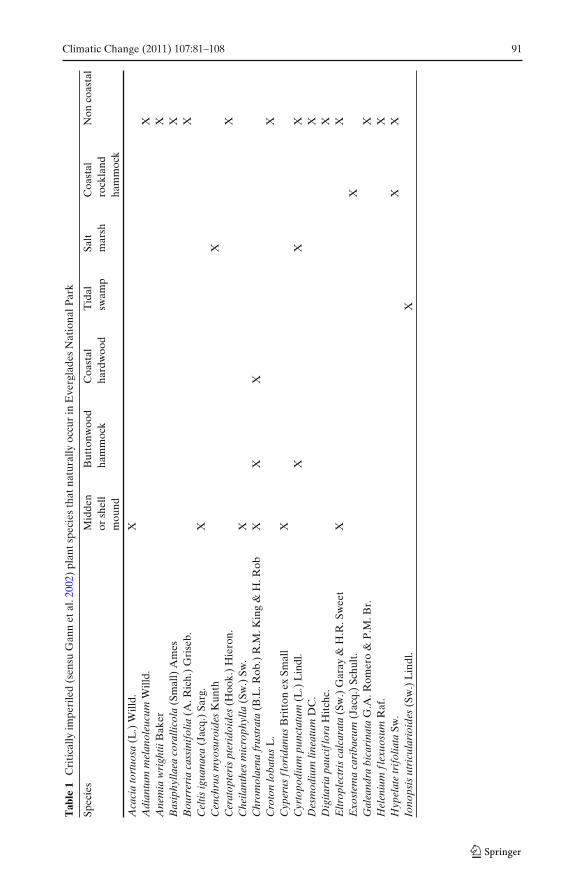
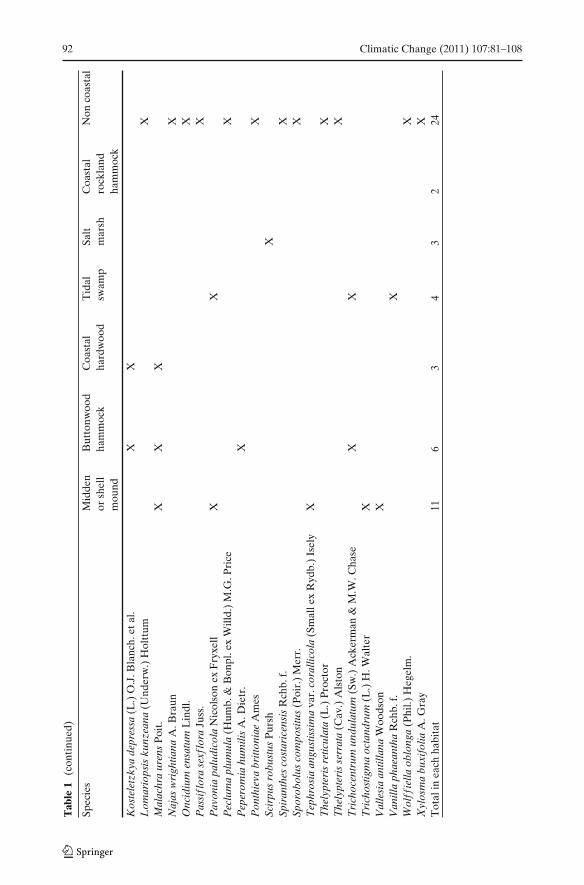
We compiled data on all plant species ranked as critically imperiled in South Floridaand known to be extant within different habitats of ENP (Table 1). Criticallyimperiled species were chosen as the suite of rare species for analysis becausethat ranking is based on quantitative information that considers both number ofoccurrences and number of total individuals in the South Florida floristic regiondefined by Gann et al. (2002). Occurrence data was obtained from Gann et al. (2010),herbarium specimens, and field observations (Sadle, unpublished data). Occurrenceswithin ENP were defined as discreet groupings of rare plants separated by unsuitablehabitat or by at least 1 km of suitable habitat. For example, observations of acritically imperiled plant species in two coastal hardwood hammocks separated bytidal swamp were considered two occurrences. Population estimates were compiledby combining estimates or counts recorded at each occurrence during field surveysbetween November 2005 and September 2010. Historical and extirpated species wereexcluded from the analysis. Life history traits of each species were included in theanalysis when relevant to impacts of sea level rise.
Coastal habitats were divided or grouped into units based on similarities in relativeelevation, soil type, and species composition. These habitats include beach dune,buttonwood hammock, coastal hardwood hammock, midden or shell mound, coastal
Climatic Change (2011) 107:81–108 91
Tab
le1
Cri
tical
lyim
peri
led
(sen
suG
ann
etal
.200
2)pl
ants
peci
esth
atna
tura
llyoc
cur
inE
verg
lade
sN
atio
nalP
ark
Spec
ies
Mid
den
But
tonw
ood
Coa
stal
Tid
alSa
ltC
oast
alN
onco
asta
lor
shel
lha
mm
ock
hard
woo
dsw
amp
mar
shro
ckla
ndm
ound
ham
moc
k
Aca
cia
tort
uosa
(L.)
Will
d.X
Adi
antu
mm
elan
oleu
cum
Will
d.X
Ane
mia
wri
ghtii
Bak
erX
Bas
iphy
llaea
cora
llico
la(S
mal
l)A
mes
XB
ourr
eria
cass
inif
olia
(A.R
ich.
)G
rise
b.X
Cel
tisig
uana
ea(J
acq.
)Sa
rg.
XC
ench
rus
myo
suro
ides
Kun
thX
Cer
atop
teri
spt
erid
oide
s(H
ook.
)H
iero
n.X
Che
ilant
hes
mic
roph
ylla
(Sw
.)Sw
.X
Chr
omol
aena
frus
trat
a(B
.L.R
ob.)
R.M
.Kin
g&
H.R
obX
XX
Cro
ton
loba
tus
L.
XC
yper
usfl
orid
anus
Bri
tton
exSm
all
XC
yrto
podi
umpu
ncta
tum
(L.)
Lin
dl.
XX
XD
esm
odiu
mlin
eatu
mD
C.
XD
igita
ria
pauc
iflo
raH
itchc
.X
Eltr
ople
ctri
sca
lcar
ata
(Sw
.)G
aray
&H
.R.S
wee
tX
XE
xost
ema
cari
baeu
m(J
acq.
)Sc
hult.
XG
alea
ndra
bica
rina
taG
.A.R
omer
o&
P.M
.Br.
XH
elen
ium
flex
uosu
mR
af.
XH
ypel
ate
trif
olia
taSw
.X
XIo
nops
isut
ricu
lari
oide
s(S
w.)
Lin
dl.
X
92 Climatic Change (2011) 107:81–108
Tab
le1
(con
tinue
d)
Spec
ies
Mid
den
But
tonw
ood
Coa
stal
Tid
alSa
ltC
oast
alN
onco
asta
lor
shel
lha
mm
ock
hard
woo
dsw
amp
mar
shro
ckla
ndm
ound
ham
moc
k
Kos
tele
tzky
ade
pres
sa(L
.)O
.J.B
lanc
h.et
al.
XX
Lom
ario
psis
kunz
eana
(Und
erw
.)H
oltt
umX
Mal
achr
aur
ens
Poit.
XX
XN
ajas
wri
ghtia
naA
.Bra
unX
Onc
idiu
men
satu
mL
indl
.X
Pas
sifl
ora
sexf
lora
Juss
.X
Pav
onia
palu
dico
laN
icol
son
exFr
yxel
lX
XP
eclu
ma
plum
ula
(Hum
b.&
Bon
pl.e
xW
illd.
)M
.G.P
rice
XP
eper
omia
hum
ilis
A.D
ietr
.X
Pon
thie
vabr
itton
iae
Am
esX
Scir
pus
robu
stus
Purs
hX
Spir
anth
esco
star
icen
sis
Rch
b.f.
XSp
orob
olus
com
posi
tus
(Poi
r.)
Mer
r.X
Tep
hros
iaan
gust
issi
ma
var.
cora
llico
la(S
mal
lex
Ryd
b.)
Isel
yX
The
lypt
eris
retic
ulat
a(L
.)Pr
octo
rX
The
lypt
eris
serr
ata
(Cav
.)A
lsto
nX
Tri
choc
entr
umun
dula
tum
(Sw
.)A
cker
man
&M
.W.C
hase
XX
Tri
chos
tigm
aoc
tand
rum
(L.)
H.W
alte
rX
Val
lesi
aan
tilla
naW
oods
onX
Van
illa
phae
anth
aR
chb.
f.X
Wol
ffie
llaob
long
a(P
hil.)
Heg
elm
.X
Xyl
osm
abu
xifo
liaA
.Gra
yX
Tot
alin
each
habi
tat
116
34
32
24
Climatic Change (2011) 107:81–108 93
rockland hammock, salt marsh, and tidal swamp (mixed mangrove). Buttonwoodand coastal hardwood hammock habitats occur on slightly elevated marl soils asa relatively linear band along the northern coast of Florida bay. Middens andshell mound habitats comprise of elevated anthropogenic landscape features foundsporadically along the entire Everglades coast and support mixed upland tropicalhardwood species. Coastal rockland hammock habitat is restricted in ENP to KeyLargo, occur on elevated limestone, and are comprised of mixed tropical hardwoodspecies. Salt marsh includes low elevation, open, saline habitats dominated bygrass species or shrubs such as Batis (Batis maritima P. Browne). Tidal swamphabitat includes single species or mixed mangrove forests on peat soils that arefound throughout the coastal Everglades. All non-coastal habitats were classified asother.
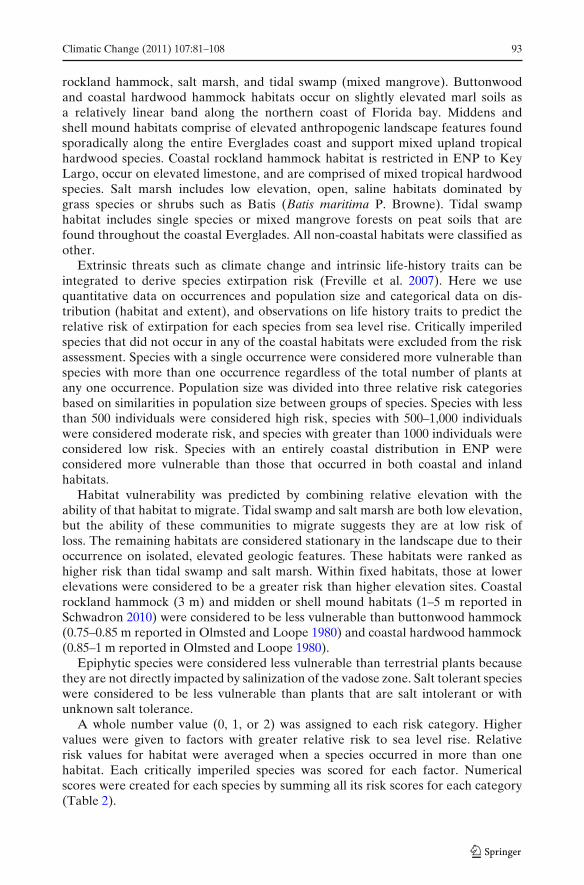
Extrinsic threats such as climate change and intrinsic life-history traits can beintegrated to derive species extirpation risk (Freville et al. 2007). Here we usequantitative data on occurrences and population size and categorical data on dis-tribution (habitat and extent), and observations on life history traits to predict therelative risk of extirpation for each species from sea level rise. Critically imperiledspecies that did not occur in any of the coastal habitats were excluded from the riskassessment. Species with a single occurrence were considered more vulnerable thanspecies with more than one occurrence regardless of the total number of plants atany one occurrence. Population size was divided into three relative risk categoriesbased on similarities in population size between groups of species. Species with lessthan 500 individuals were considered high risk, species with 500–1,000 individualswere considered moderate risk, and species with greater than 1000 individuals wereconsidered low risk. Species with an entirely coastal distribution in ENP wereconsidered more vulnerable than those that occurred in both coastal and inlandhabitats.
Habitat vulnerability was predicted by combining relative elevation with theability of that habitat to migrate. Tidal swamp and salt marsh are both low elevation,but the ability of these communities to migrate suggests they are at low risk ofloss. The remaining habitats are considered stationary in the landscape due to theiroccurrence on isolated, elevated geologic features. These habitats were ranked ashigher risk than tidal swamp and salt marsh. Within fixed habitats, those at lowerelevations were considered to be a greater risk than higher elevation sites. Coastalrockland hammock (3 m) and midden or shell mound habitats (1–5 m reported inSchwadron 2010) were considered to be less vulnerable than buttonwood hammock(0.75–0.85 m reported in Olmsted and Loope 1980) and coastal hardwood hammock(0.85–1 m reported in Olmsted and Loope 1980).
Epiphytic species were considered less vulnerable than terrestrial plants becausethey are not directly impacted by salinization of the vadose zone. Salt tolerant specieswere considered to be less vulnerable than plants that are salt intolerant or withunknown salt tolerance.
A whole number value (0, 1, or 2) was assigned to each risk category. Highervalues were given to factors with greater relative risk to sea level rise. Relativerisk values for habitat were averaged when a species occurred in more than onehabitat. Each critically imperiled species was scored for each factor. Numericalscores were created for each species by summing all its risk scores for each category(Table 2).
94 Climatic Change (2011) 107:81–108
Tab
le2
Rel
ativ
evu
lner
abili
tyof
rare
spec
ies
toim
pact
sof
sea
leve
lris
e
Spec
ies
Epi
phyt
eSa
ltH
abita
tN
umbe
rof
Num
ber
ofC
oast
alSu
mto
lera
nce
vuln
erab
ility
occu
rren
ces
indi
vidu
als
only
Cel
tisig
uana
ea(J
acq.
)Sa
rg.
11
11
21
7E
xost
ema
cari
baeu
m(J
acq.
)Sc
hult.
11
11
21
7P
eper
omia
hum
ilis
A.D
ietr
.0
12
12
17
Val
lesi
aan
tilla
naW
oods
on1
11
12
17
Aca
cia
tort
uosa
(L.)
Will
d.1
11
02
16
Che
ilant
hes
mic
roph
ylla
(Sw
.)Sw
.1
11
02
16
Eltr
ople
ctri
sca
lcar
ata
(Sw
.)G
aray
&H
.R.S
wee
t1
11
12
06
Hyp
elat
etr
ifol
iata
Sw.
11
11
20
6T
ephr
osia
angu
stis
sim
ava
r.co
ralli
cola
(Sm
alle
xR
ydb.
)Is
ely
11
11
11
6T
rich
ostig
ma
octa
ndru
m(L
.)H
.Wal
ter
11
10
21
6C
yper
usfl
orid
anus
Bri
tton
exSm
all
11
10
11
5Io
nops
isut
ricu
lari
oide
s(S
w.)
Lin
dl.
01
01
21
5V
anill
aph
aean
tha
Rch
b.f.
01
01
21
5C
hrom
olae
nafr
ustr
ata
(B.L
.Rob
.)R
.M.K
ing
&H
.Rob
11
1.67
00
14.
67C
ench
rus
myo
suro
ides
Kun
th1
00
02
14
Cyr
topo
dium
punc
tatu
m(L
.)L
indl
.0
11
02
04
Kos
tele
tzky
ade
pres
sa(L
.)O
.J.B
lanc
h.et
al.
10
20
01
4T
rich
ocen
trum
undu
latu
m(S
w.)
Ack
erm
an&
M.W
.Cha
se0
11
01
14
Mal
achr
aur
ens
Poit.
10
1.67
00
13.
67P
avon
iapa
ludi
cola
Nic
olso
nex
Fryx
ell
10
0.5
01
13.
5Sc
irpu
sro
bust
usPu
rsh
10
00
01
2
Hig
her
scor
esin
dica
tegr
eate
rri
sk.S
core
sw
ere
assi
gned
asfo
llow
s:ep
iphy
ticpl
ant=
0,te
rres
tria
l=1;
salt
tole
rant
=0,
salin
ityto
lera
nce
low
orun
know
n=
1;Sa
ltm
arsh
and
tidal
swam
p=
0,ha
rdw
ood
ham
moc
kan
dsh
ellm
ound
/mid
den
=1,
butt
onw
ood
ham
moc
k=
2;m
ore
than
1oc
curr
ence
=0,
sing
leoc
curr
ence
=1;
and
popu
latio
nsi
zegr
eate
rth
an10
00=
0,be
twee
n50
0an
d10
00=
1an
dle
ssth
an50
0=
2
Climatic Change (2011) 107:81–108 95
3 Results
3.1 Species composition
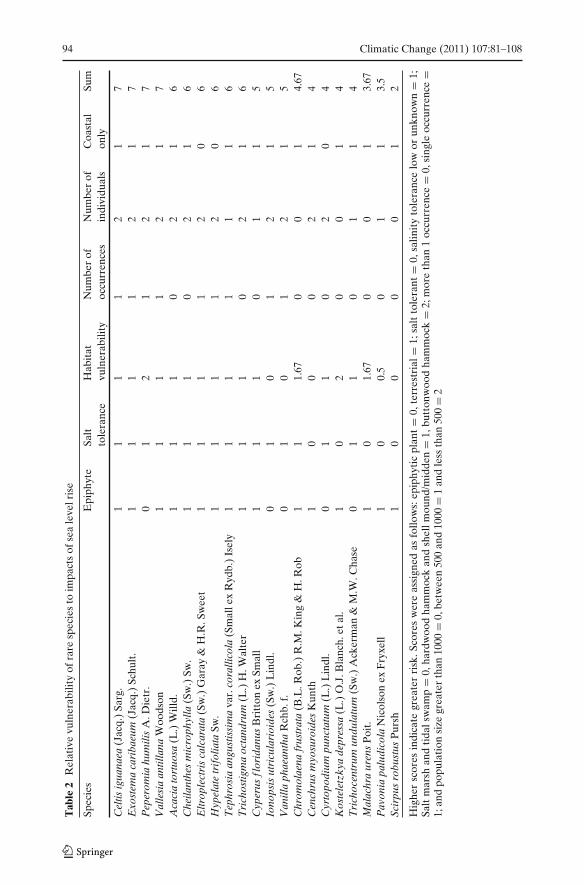
Distance from the coast explained the distribution of woody species based onpresence–absence data and also indicated whether the groundwater was fresh orbrackish. DCA Axes I and II explained 52% and 13% of variation in hammockspecies composition (Fig. 5a). DCA Axis I was significantly correlated with distancefrom the coast (r2 = 0.46, P < 0.05).
The significant variation in salinity across sites in the ENP was related to distancefrom the coast by a polynomial relationship (Fig. 5b) whereby salinity decreasedlinearly with distance from the coast up to a point (Salinity = 15.05 # 0.15 " x +0.0011 " x2 + 0.00005 " x3, r2 = 0.49, P < 0.001). Depth to groundwater (Fig. 5b)increased linearly with distance from the coast (Depth to water table = 79.43 +1.89 & x, r2 = 0.47, P < 0.001). Depth to water table per plot, derived by averagingspecies optima from the Florida Keys, closely resembled the actual depth to watertable measured by piezometer and by using soil pits. For example, we derived amean depth to water table of 81–147 cm for LPK hammocks, which resembled thepiezometer water depth measurement of 101–187 cm (Villalobos 2010). Similarly, thespecies weighted depth to water table ranging from 45–79 cm for buttonwood forests
DCA Axis I
-300 -200 -100 0 100 200 300
DC
A A
xis
II
-200
-150
-100
-50
0
50
100
150
200
ButtonwoodFlorida Bay (east)Florida Bay (west)Long Pine KeyMahogany hammocksShark River SloughShell mound
Distance to coast (km)
0 10 20 30 40 50
Sal
inity
(ppt
)
10
12
14
16
18
20
Dep
th to
wat
er ta
ble
(cm
)
20
40
60
80
100
120
140
160
180
Salinity (solid line)Depth to water table (dashed line)
ba
Fig. 5 a DCA ordination showing plots in species space. Buttonwood forests are the furthest fromLong Pine Key hammocks. Lower panel plots (distance from the coast against salinity and depthto water table. b As the distance from the coast increases, so does the depth to water table whilethe salinity decreases. The relation is polynomial for salinity and distance from the coast (Salinity =15.05 # 0.15 " x + 0.0011 " x2 + 0.00005 " x3, r2 = 0.49, P < 0.001), and linear for depth to watertable and distance from the coast (Depth to water table = 79.43 + 1.89 " x, r2 = 0.47, P < 0.001)
96 Climatic Change (2011) 107:81–108
resembled the water table depth of 23–70 cm obtained with soil pits at buttonwoodforests in early dry season.
The DCA ordination clearly separates two categories of plant communities. Tothe extreme right are the plots from LPK, Shark River Slough and mahogany ham-mocks, which are furthest from the coast, while plots in buttonwood forests, whichlie south of the FWSWI and are closest to the coast, constitute the other extremeof the continuum (Fig. 5a). Mahogany hammocks occur at the cusp of FWSWI, andare closest in species composition to the hammocks in LPK. Tree islands of SharkRiver Slough basin were intermediate in species composition between mahoganyhammocks and coastal hardwood hammocks of the shell mounds and of sites north ofFlorida Bay (east and west). Coastal forests occupying intermediate locations alongthe continuum in distance from the coast also showed two distinct groups. Hardwoodhammocks located in shell mounds and north of eastern and western Florida Baywere distinct from the tree islands located in eastern Florida Bay region (Fig. 5a).
Level 1 division of TWINSPAN separated hammocks into two categories: ham-mocks occurring south of FWSWI fell into one category, while the hammocks atthe cusp of FWSWI and north of the FWSWI, along with the shell mounds at theperiphery of the Shark River Slough basin, were classified into a freshwater category(eigenvalue = 0.53). The Level 1 division also discerned three groups of species basedon their distribution. Of 70 species, 14 occurred in sites exclusively south of FWSWI,16 were exclusively found in hammocks north of FWSWI, and 7 species occurredin the majority of sites both north and south of FWSWI. Species occurring in thehardwood hammocks north of FWSWI with fresh groundwater were: Calyptrantheszuzygium Griseb., Lysiloma latisiliquum (L.) Benth., Ocotea coriacea (Sw.) Britton,Prunus myrtifolia (L.) Urb., Quercus virginiana Mill., Sideroxylon salicifolium (L.)Lam., and Simarouba glauca DC. Species occurring only at locations south ofFWSWI with brackish to saline groundwater were: E. foetida, Capparis f lexuosa(L.) L., H. mancinella (Manchineel), Piscidia piscipula (L.) Sarge., Pithecellobiumkeyense Britton ex Britton & Rose, R. mangle, and Sideroxylon celastrinum (Kunth.)T.D. Penn. Examples of cosmopolitan species that occur at all sites including thenorth, south, and cusp of FWSWI, and in the buttonwood forests as well are:Coccoloba diversifolia Jacq., C. erectus, Erythrina herbacea L., Metopium toxiferum(L.) Krug & Urb., Randia aculeata L., Rapanea punctata (Lam.) Lundell, and Sabalpalmetto (Walter) Lodd ex Schult. & Schult. f. The FWSWI boundary does notextend northwards along the west coast of ENP where shell mounds are located;however, we assume that the water table in the shell mounds is saline due to theirintimate proximity with the coast and tidal inlets.
3.2 Extent of seawater intrusion
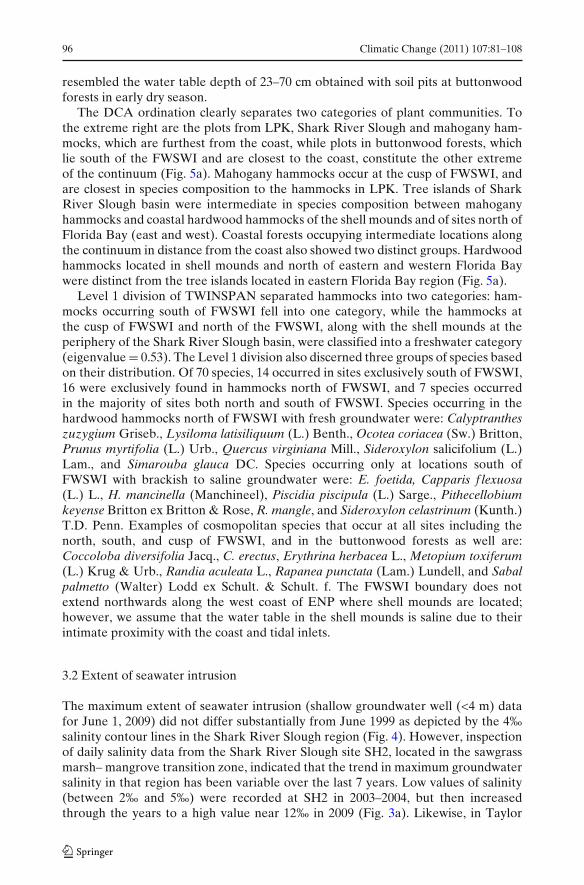
The maximum extent of seawater intrusion (shallow groundwater well (<4 m) datafor June 1, 2009) did not differ substantially from June 1999 as depicted by the 4‰salinity contour lines in the Shark River Slough region (Fig. 4). However, inspectionof daily salinity data from the Shark River Slough site SH2, located in the sawgrassmarsh– mangrove transition zone, indicated that the trend in maximum groundwatersalinity in that region has been variable over the last 7 years. Low values of salinity(between 2‰ and 5‰) were recorded at SH2 in 2003–2004, but then increasedthrough the years to a high value near 12‰ in 2009 (Fig. 3a). Likewise, in Taylor
Climatic Change (2011) 107:81–108 97
Slough, there appears to be no significant shift in the landward extent of seawaterintrusion between 1999 and 2009, as indicated by the 4‰ salinity contour lines(Fig. 4). However, a general increase in salinity from 3.9‰ to above 5‰ was observedin the Taylor Slough groundwater well G-3777 between 2003 and 2009 (Fig. 3b).
3.3 Transpiration, salinity and model simulations
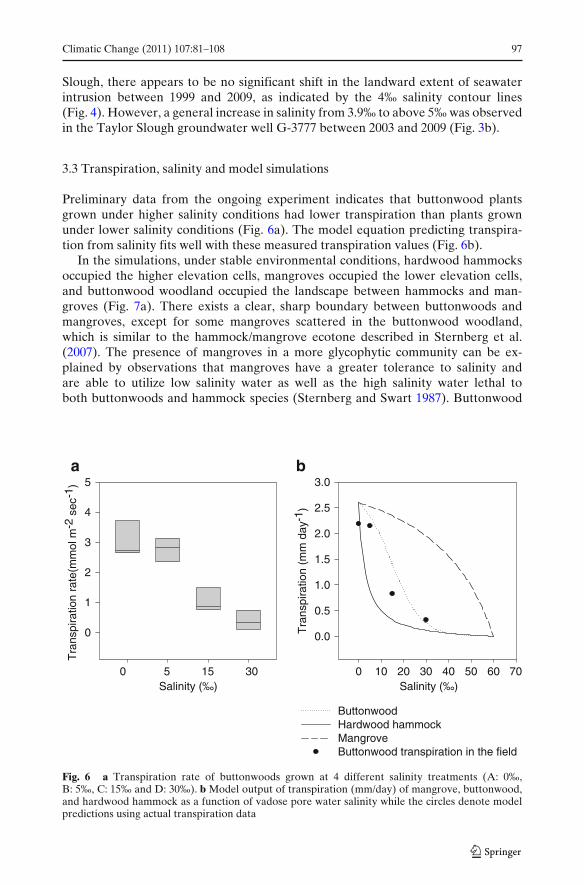
Preliminary data from the ongoing experiment indicates that buttonwood plantsgrown under higher salinity conditions had lower transpiration than plants grownunder lower salinity conditions (Fig. 6a). The model equation predicting transpira-tion from salinity fits well with these measured transpiration values (Fig. 6b).
In the simulations, under stable environmental conditions, hardwood hammocksoccupied the higher elevation cells, mangroves occupied the lower elevation cells,and buttonwood woodland occupied the landscape between hammocks and man-groves (Fig. 7a). There exists a clear, sharp boundary between buttonwoods andmangroves, except for some mangroves scattered in the buttonwood woodland,which is similar to the hammock/mangrove ecotone described in Sternberg et al.(2007). The presence of mangroves in a more glycophytic community can be ex-plained by observations that mangroves have a greater tolerance to salinity andare able to utilize low salinity water as well as the high salinity water lethal toboth buttonwoods and hammock species (Sternberg and Swart 1987). Buttonwood
Salinity (‰)0 10 20 30 40 50 60 70
Tra
nspi
ratio
n (m
m d
ay-1
)
0.0
0.5
1.0
1.5
2.0
2.5
3.0
ButtonwoodHardwood hammockMangroveButtonwood transpiration in the field
Salinity (‰)
Tra
nspi
ratio
n ra
te(m
mol
m-2
sec
-1)
0
1
2
3
4
5
0 5 15 30
ba
Fig. 6 a Transpiration rate of buttonwoods grown at 4 different salinity treatments (A: 0‰,B: 5‰, C: 15‰ and D: 30‰). b Model output of transpiration (mm/day) of mangrove, buttonwood,and hardwood hammock as a function of vadose pore water salinity while the circles denote modelpredictions using actual transpiration data
98 Climatic Change (2011) 107:81–108
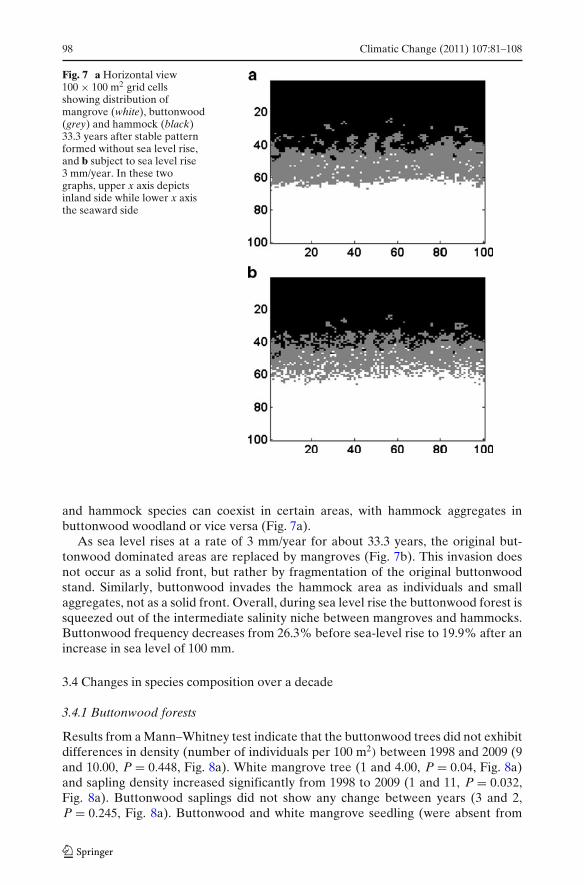
Fig. 7 a Horizontal view100 " 100 m2 grid cellsshowing distribution ofmangrove (white), buttonwood(grey) and hammock (black)33.3 years after stable patternformed without sea level rise,and b subject to sea level rise3 mm/year. In these twographs, upper x axis depictsinland side while lower x axisthe seaward side
and hammock species can coexist in certain areas, with hammock aggregates inbuttonwood woodland or vice versa (Fig. 7a).
As sea level rises at a rate of 3 mm/year for about 33.3 years, the original but-tonwood dominated areas are replaced by mangroves (Fig. 7b). This invasion doesnot occur as a solid front, but rather by fragmentation of the original buttonwoodstand. Similarly, buttonwood invades the hammock area as individuals and smallaggregates, not as a solid front. Overall, during sea level rise the buttonwood forest issqueezed out of the intermediate salinity niche between mangroves and hammocks.Buttonwood frequency decreases from 26.3% before sea-level rise to 19.9% after anincrease in sea level of 100 mm.
3.4 Changes in species composition over a decade
3.4.1 Buttonwood forests
Results from a Mann–Whitney test indicate that the buttonwood trees did not exhibitdifferences in density (number of individuals per 100 m2) between 1998 and 2009 (9and 10.00, P = 0.448, Fig. 8a). White mangrove tree (1 and 4.00, P = 0.04, Fig. 8a)and sapling density increased significantly from 1998 to 2009 (1 and 11, P = 0.032,Fig. 8a). Buttonwood saplings did not show any change between years (3 and 2,P = 0.245, Fig. 8a). Buttonwood and white mangrove seedling (were absent from
Climatic Change (2011) 107:81–108 99
Buttonwood forest
Med
ian
tree
(pl
ot-1
)
0
5
10
15
20
Conocarpus erectusLaguncularia racemosa
1998 2009
Med
ian
sapl
ing
(plo
t-1)
0
5
10
15
20
Mixed Hammock
0
5
10
15
20
1998 20090
20
40
60
80
Conocarpus erectusHippomane mancinellaEugenia foetida
Hardwood hammock
0
20
40
60
80
1998 20090
20
40
60
80
Coccoloba diversifoliaEugenia foetidaSideroxylon foetidissimumRandia aculeata
a b c
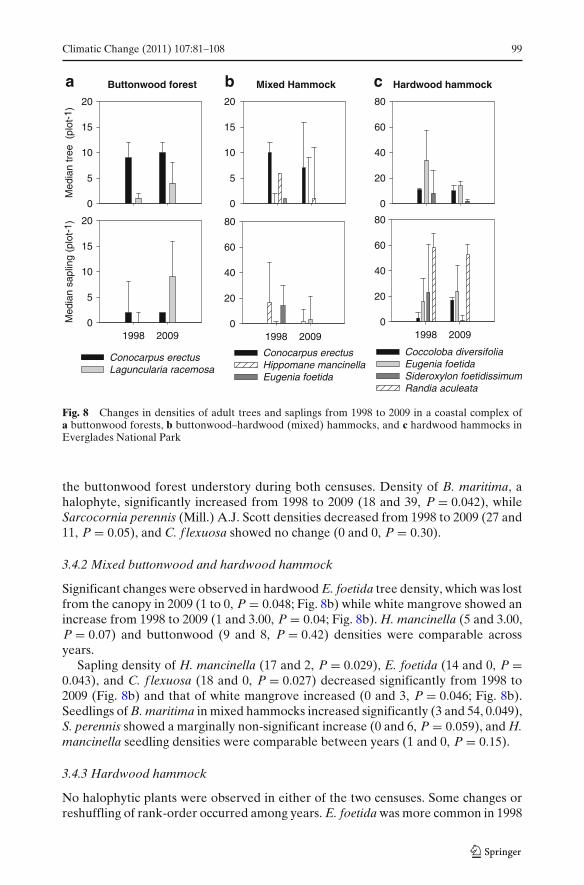
Fig. 8 Changes in densities of adult trees and saplings from 1998 to 2009 in a coastal complex ofa buttonwood forests, b buttonwood–hardwood (mixed) hammocks, and c hardwood hammocks inEverglades National Park
the buttonwood forest understory during both censuses. Density of B. maritima, ahalophyte, significantly increased from 1998 to 2009 (18 and 39, P = 0.042), whileSarcocornia perennis (Mill.) A.J. Scott densities decreased from 1998 to 2009 (27 and11, P = 0.05), and C. f lexuosa showed no change (0 and 0, P = 0.30).
3.4.2 Mixed buttonwood and hardwood hammock
Significant changes were observed in hardwood E. foetida tree density, which was lostfrom the canopy in 2009 (1 to 0, P = 0.048; Fig. 8b) while white mangrove showed anincrease from 1998 to 2009 (1 and 3.00, P = 0.04; Fig. 8b). H. mancinella (5 and 3.00,P = 0.07) and buttonwood (9 and 8, P = 0.42) densities were comparable acrossyears.
Sapling density of H. mancinella (17 and 2, P = 0.029), E. foetida (14 and 0, P =0.043), and C. f lexuosa (18 and 0, P = 0.027) decreased significantly from 1998 to2009 (Fig. 8b) and that of white mangrove increased (0 and 3, P = 0.046; Fig. 8b).Seedlings of B. maritima in mixed hammocks increased significantly (3 and 54, 0.049),S. perennis showed a marginally non-significant increase (0 and 6, P = 0.059), and H.mancinella seedling densities were comparable between years (1 and 0, P = 0.15).
3.4.3 Hardwood hammock
No halophytic plants were observed in either of the two censuses. Some changes orreshuffling of rank-order occurred among years. E. foetida was more common in 1998
100 Climatic Change (2011) 107:81–108
than 2009 (34 and 14, P = 0.048, Fig. 8c), density of C. diversifolia did not changesignificantly between 1998 and 2009 (11.00 and 10.00, P = 0.083, Fig. 8c). Sideroxylonfoetidissimum Jacq., the third most common tree in 1998, declined significantly in2009 (8 and 2, P = 0.038, Fig. 8c).
Common species in the sapling cohort showed reshuffling of ranks similar to adulttrees. Saplings of R. aculeata (58 and 53) and E. foetida (16 and 24) were comparableacross years, while S. foetidissimum densities were significantly lower in 2009 (23 and1, P = 0.011). Saplings of C. diversifolia showed a significant increase in density from1998 and 2009 (3 and 24, P = 0.02, Fig. 8c). Seedlings of E. foetida (59 and 42, P =0.037) and R. aculeata (5 and 1, P = 0.047) decreased from 1998 to 2009, and thoseof Ardisia escallonioides Schiede & Deppe ex Schltdl. & Cham. remained the same.
3.5 Rare species
Forty-three critically imperiled species are currently extant in ENP, 21 (49%) ofwhich occur in the coastal habitats defined in this paper (Table 1). Three of the21 coastal species are also found in inland habitats, whereas the remaining 18are found exclusively in coastal habitats. We report 54 occurrences of criticallyimperiled species in the coastal habitats of ENP (Fig. 2b). These are largely restrictedto buttonwood and coastal hardwood hammocks of central ENP, middens andshell mounds throughout the park, and coastal rockland hammocks on Key Largo(Fig. 2b).
Number of species per habitat ranged from 0 (beach dune) to 11 (midden andshell mound). Seven species are found only on shell mound or midden habitat andfour species are found only in buttonwood and coastal hardwood hammock habitats.Five species occur as epiphytes in coastal systems, 12 are herbs or shrubs, and 4 aretrees. Number of occurrences ranged from 1 to 9 and population size ranged from1–10,000.
Relative risk scores ranged from 2–7 with 4 of the 21 species ranked at the highestscore (Table 2). All four of the species with the highest score had population sizes ofless than 500 and were restricted to a single occurrence. Habitat for the species withthe highest calculated risk included shell mound or midden, buttonwood hammock,and coastal rockland hammock. Both epiphytic and terrestrial species were includedin this group. All of the highest ranked species were restricted to coastal habitatswithin ENP and were not also found in inland communities. Number of occurrenceswas the single factor common to the lowest ranked species. All species with a scoreof 4 or less (lowest 7 species) had more than one occurrence. Habitat for this groupof species includes buttonwood hammock, coastal hardwood hammock, shell moundor midden, salt marsh, and tidal swamp.
4 Discussion
4.1 Species composition and freshwater availability: coastal hardwood hammockson the brink
This study examines patterns of species composition in hardwood hammocksthroughout the coastal and inland ENP with respect to the underlying salinity
Climatic Change (2011) 107:81–108 101
gradient caused by saltwater intrusion. Studies describing patterns of species distribu-tion in tree islands and hardwood hammocks of ENP have invoked elevation-drivenflooding and disturbance, especially fire (Armentano et al. 2002; Gunderson 1994;Olmsted and Loope 1984) as a primary mechanism. Ours is a novel approach, whichhighlights the role of drought resulting from salinity stress in explaining distributionof woody plants in ENP.
Our ordination analysis indicated a distinction between two main habitats: onewith saline groundwater occurring to the south or seaward of the FWSWI (definedas the limit of the saltwater intrusion at <5 m depth), and the other with freshgroundwater lying to the north of the FWSWI. Although both habitats share severaltree and shrub species, 20% are exclusive to inland hammocks and 22% are exclusiveto coastal hammocks and buttonwood forests. Plots in Shark River Slough basinare an exception, harboring a few coastal species that are absent from locationsnorth of FWSWI. The presence of coastal species in Shark Slough is hypothesizedto be anthropogenic. Virtually all Shark River Slough tree islands contain aboriginalmiddens, and movement of plants may explain disjunct coastal species in this area(Schwadron 2010). Tidal seawater inflow along the rivers draining Shark RiverSlough increase salinity values inland, suggesting that the effective distance fromthe coast is actually less than the values used here. These two aspects of SharkRiver Slough tree islands may have resulted in the polynomial relationship betweendistance from the coast and salinity.
Similar patterns of species distribution in relation to groundwater and salinityoccur in coastal forests of the Florida Keys, albeit within a smaller area and morefragmented in relation to ENP. Distribution of tree species in the Florida Keys is nothomogeneous across all islands, and can be distinguished based upon the presenceor absence of freshwater lenses. For example, species like C. zuzygium, S. glauca,and O. coriacea, which are limited to freshwater hammocks in the Everglades, areabsent or rare in small low-lying islands of the Florida Keys (Gann et al. 2008) wherefreshwater lenses are poorly developed, such as Little Torch Key and Sugarloaf Key(Meadows et al. 2004). On the other hand, large islands like Key Largo, Big Pine Key,and Key West have deeper freshwater lenses, which may turn brackish but sustaintropical hammock vegetation (Kruse et al. 2000; Langevin et al. 1998), includingspecies restricted to sites where fresh groundwater occurs. Thus it was not surprisingto find that the same species occurring in ENP hammocks sort themselves in relationto distance from the coast, which is correlated to depth to water table and salinity ofwater table.
Distance from the coast explained the distinction between buttonwood forestsharboring salt-tolerant species from the inland hammocks and tree islands but didnot explain the entire pattern. Coastal plant communities such as coastal hardwoodhammocks, though closer to saline water of the Florida Bay and Gulf of Mexico,were comparable to buttonwood at intermediate locations along DCA Axis I. Herewe postulate that tolerance to drought generates the observed pattern of speciesdistribution in relation to distance from the coast, with species occurring on thecoast at higher elevation compared to buttonwood forests and mangroves, are bettercompetitors in an environment where seasonal droughts, caused by shortage offreshwater, or physiological drought, caused by brackish-saline water, are common.Cosmopolitan species, occurring in both coastal and inland sites, are able to tolerateseasonal and physiological drought, or alternatively, exhibit plasticity in rooting
102 Climatic Change (2011) 107:81–108
depths (Armas et al. 2010). Deep rooting among glycophytes is not an option incoastal sites, due to their intolerance of brackish-saline groundwater (Ewe 2001).
The degree of drought tolerance demonstrated by the trees of inland hardwoodhammocks reflects their location along a water availability gradient, from year-round (Shark River Slough) to seasonal (Long Pine Key). Accordingly, hardwoodhammocks in Shark River Slough have more evergreen species, while the hammocksin Long Pine Key experience significantly greater water stress and are more drought-deciduous, with greater regulation of stomatal conductance (Saha 2009). It is yet tobe documented how the hardwood species of coastal hammocks, especially thoserestricted to coastal sites, respond to drought. Trees in coastal uplands (such ashammocks) have the ability to access pockets of fresh water, and can tolerate onlymild salinities up to 5‰ (Sternberg and Swart 1987). S. palmetto, a common palmof coastal hammocks, tolerates salinity up to 8‰ without showing decline in photo-synthetic rates (Perry and Williams 1996). Initial responses to increase in salinitymight trigger responses similar to drought, while prolonged exposure may lead toirreversible toxicity caused by accumulation of salts (Munns 2002). For example,declines in the density of the hardwood obligate cactus Pilosocereus polygonus(Lam.) Byles & G.D. Rowley in the Florida Keys were linked to soil salinity in theFlorida Key’s hammocks (Maschinski et al. 2009). A comparison of ecological factorsthat may have contributed to mortality of plants in a Lower Keys population between1994 and 2007 revealed that salinity was 1.5 times greater near dying and dead plantsthan near live plants. One population that experienced 95% plant mortality hadsignificantly lower elevation (0.3 m) and 27% less canopy cover than an adjacentpopulation, which experienced only moderate mortality (20% plants; Maschinskiet al. 2009).
We predict that with rise in sea level the coastal hardwood communities, especiallythose on the coast of Florida Bay, will be pushed to the edge of their droughttolerance and eventually collapse (Fig. 2b). The pathway of hammock collapse will bevia the decrease in freshwater recharge volume or shrinking of the vadose zone dueto rising water table; this is different from the increases in tidal flooding documentedby Williams et al. (1999) in the hydric hammocks of Florida’s Gulf Coast. The resultsof this study are relevant for the hardwood hammocks of the Florida Keys as well,where decline in pines and pine ecosystems are already underway (Ross et al. 1994,2009).
4.2 Salinity gradient and changes in species composition
Groundwater salinity shows an increasing trend over time in both Shark and TaylorSloughs (Fig. 3a, b) between salinity in the tidally-influenced Shark River Slough donot correspond to the lowest water levels; this may signify that both groundwatersalinity and water levels are more affected by seawater intrusion. This differencein salinity regimes between Shark and Taylor sloughs, the major drainages of theEverglades, likely contributes to the differences in plant community types present.
The extent of seawater intrusion also varied interannually as suggested by long-term groundwater salinity records in the region. Between 1999 and 2003, the seawaterfront receded coastward, while from 2003 to 2009 the seawater front has migratedinland to a position similar to that observed in 1999. There may have been a slightseawater shift in the extent of seawater intrusion in Taylor Slough between 1999 and
Climatic Change (2011) 107:81–108 103
2009, as indicated by the 4‰ salinity contour lines (Fig. 4). However, the differencebetween the well depths used in 1999 (<25 m) and 2009 (<4 m) may explain theapparent shift as seawater intrudes into a coastal aquifer at an angle, with the extentof seawater intrusion occurring further inland, deeper in the aquifer.
Interannual variation in precipitation and water management is transmitted intoannually varying freshwater flows, which together with interannual variability insea level rise then lead to annually varying salinity. Thus, a plant community mayface different salinity regimes (both salinity levels and duration) in different years.The back-and-forth variation, however, will not necessarily induce an equivalentback-and-forth oscillation in distribution of plant communities based on salinity-intolerance, because a salinity-intolerant plant when faced with saline conditionsfor as little as a few weeks can become water stressed. Saline conditions persistingover an entire season can fatally stress the plants, permitting colonization by moresalinity-tolerant species, thereby leading to an irreversible composition change evenif the salinity is lower over the subsequent 2–3 years before increasing again.
Several Everglades wetlands have turned saline over time, including WhitewaterBay, as indicated by temporal increases in salinity. Results from observational studiesconducted in Coot Bay hammock show increases in halophyte densities at theexpense of glycophytes, and model simulations resonate with reports of saltwaterintrusion and erosion leading to changes in species composition among coastaluplands elsewhere. Mixed hammocks at higher elevation witnessed a significantincrease in halophytes such as white mangrove and B. maritima and a steep declinein H. mancinella (a glycophyte). In hardwood hammocks, S. foetidissimum declined,while the density of cosmopolitan C. diversifolia increased. Using historical aerialphotographs, Barry (2009) documented vegetation change between 1940 and 2007 inTen Thousand Islands National Wildlife Refuge (TTINWR). They reported a declinein shell mound habitat from 45 ha in 1940 to 39 ha in 2007 as a result of peripheralbuttonwood die-off and replacement by mangroves.
4.3 Buttonwood forest is a vulnerable ecosystem
Our findings suggest that buttonwood forests are vulnerable to sea level rise.Comparison of forest plots over a period of 11 years shows an increase in numbersand proportion of halophytes, while glycophyte adults have not increased, andin some cases decreased with no recruitment. The density of white mangroveincreased in buttonwood forests, while buttonwood tree density remained the same.Vast stands of buttonwood-dominated coastal forests occurred historically in SouthFlorida (Craighead 1964; Olmsted et al. 1981). Saltwater intrusion has implicationsfor continued existence of buttonwood-dominated plant communities and the rarespecies associated with these communities.
DeSantis et al. (2007) and Williams et al. (1999) documented rapid changes inunderstory in response to sea level rise, as the tree seedlings and saplings in hydrichammocks showed greater susceptibility to salinity than adults. Our data indicatethat such a change in the coastal forest complex of ENP may have already begun,and this situation warrants careful monitoring of species-specific responses to salinityand changes in flooding regime.
Using the framework outlined in a model (Sternberg et al. 2007; Teh et al.2008), we show that buttonwood forests at intermediate salinity and elevation
104 Climatic Change (2011) 107:81–108
could exhibit fragmentation and decline in cover because of saltwater intrusion.Simulations generate a sharp boundary between buttonwoods and mangroves, ex-cept for some mangroves scattered in buttonwood forests, which is similar to thehammock/ mangrove ecotone described in Sternberg et al. (2007). Mangroves have alarge range of salinity tolerance and are able to utilize and thrive in high salinity,which is lethal to both buttonwoods and hammocks (Sternberg and Swart 1987).Buttonwoods and hammocks can coexist in certain areas, with hammock speciesaggregating in buttonwood forests (Fig. 7a). Positive correlations between plantsand environments are believed to be one of the mechanisms for aggregation (Pielou1960). The buttonwood/hammock boundary occurs at a higher elevation, where tidalflux cannot reach even after an increase in sea level of 100 mm. The vadose zonepore water salinities in these areas are only affected by infiltration of saline groundwater. We have previously observed that the sustenance of hammocks may be due totheir remarkable ability to harvest rainfall water retained in the highly organic soillayer (Saha et al. 2009) and as modeled here, cease transpiration when this water isno longer available. This occurs even when the underlying water table is saline (Ish-Shalom et al. 1992). Therefore, we propose here that the squeezing of buttonwoodwoodland by sea level rise is caused by ability of hardwood hammocks to utilizeentrapped rainwater, lower their transpiration during the dry season, and therebyresist the invasion of buttonwoods.
4.4 Implications for rare species
Coastal wetlands and uplands provide essential habitat for nearly half of the criticallyimperiled plant species in Everglades National Park. Loss or degradation of thesehabitats directly resulting from sea level rise or in combination with diversion offreshwater flow, hurricanes, and exotic plant species infestations will result in the re-duction or loss of rare plant populations. Sea level rise impacts are expected to occurbefore actual flooding from ocean water occurs, leaving a relatively short window ofopportunity for study of these species and implementing potential mitigation actions.
All of the coastal uplands that support rare plant species in ENP are restrictedto relatively immobile geologic features separated by large expanses of flooded,inhospitable wetland, leading us to conclude that these habitats will not be able tomigrate as sea level rises. Tidal swamp and salt marsh, on the other hand, are wetlandcommunities that occur in large expanses, and are capable of migrating toward theinterior in low-lying south Florida, unless they are prevented from doing so byroads, levees, or other human infrastructure. Rare plant species in these habitatsmay be able to migrate with their respective communities. Groundwater impactspredicted for buttonwood hammocks and coastal hardwood hammocks also applyto other coastal upland communities in ENP and their constituent imperiled species.Salinization of groundwater in these communities will take longer due to their higherelevation but will nonetheless occur in time.
Based on the risk assessment carried out for this study, the impacts of sea levelrise on rare plant species in ENP will have the largest effect on imperiled taxa withfew occurrences and small population sizes that do not also occur inland. Uplandspecies were identified as more vulnerable than wetland species. The most vulnerablespecies were not all from a single plant community due to the extreme rarity of somespecies on shell mound or midden habitat (Celtis iguanaea and Vallesia antillana),
Climatic Change (2011) 107:81–108 105
buttonwood hammocks (Pepromia humilis), and coastal rockland hammocks (Ex-ostema caribaeum). Therefore, focusing studies or conservation measures on uplandspecies in general may provide greater overall benefit to the suite of coastal rarespecies in ENP compared to those that study all imperiled taxa in a particular habitat.
Unfortunately, little is currently known about rare plant populations in coastalENP outside of the distributional information presented in this paper. Even theexisting distributional data lacks information for significant areas that have yet to besurveyed. Surveys conducted between 2005 and the present have led to the discoveryof numerous previously unrecorded occurrences of critically imperiled species as wellas three species previously unreported from ENP. These data provide a starting pointto assess the relative risk to these species from sea level rise. Improved understandingof demographics, basic life history traits, and habitat requirements of coastal rarespecies would lead to a more refined risk assessment and may provide a bettermeans of directing limited resources toward managing the loss of these species. Inaddition, studying these species prior to their loss will provide a historical ecologicalaccount that currently does not exist. This information will also be applicable tomanagement decisions further inland as sea level rise submerges more and more ofthe Florida peninsula. In the interim, direct conservation measures including seedbanking and establishment of ex situ conservation collections of all rare coastalspecies should be carried out to prevent the loss of genetic resources and to enablereintroduction elsewhere. The results of this risk assessment may serve as a guidelinefor determining which species may need the most immediate attention.
5 Summary
Coastal hammocks and buttonwood forests are compositionally different from inlandhammocks in the ENP, with unique combinations of common and rare species.Importantly, whereas all hammocks in the estuarine/coastal zone rely upon localizedfreshwater for much of the year, periods of drought force the plants to either usesaline water or tolerate some measure of drought. We predict a decline in the extentof coastal hardwood hammocks and buttonwood forests with the initial rise in sealevel before the onset of sustained erosional inundation. The change in the extentof hardwood and buttonwood forests will be brought about by decline in freshwaterrecharge volume in conjunction with an increase in porewater salinity, which willpush the hardwood species to the edge of their drought (freshwater shortage andphysiological) tolerance. Along with the coastal hammocks and buttonwood forests,scores of critically imperiled and or endemic species will be jeopardized, and possiblybe extirpated from the United States. Reductions in freshwater inflows into theestuarine portion of the Everglades will accelerate the loss of salinity-intolerantcoastal plant communities. Restoring freshwater inflow might be the only mechanismto mitigate, in the short term, the effects of rising sea levels in the Everglades.
Acknowledgements We thank Gordon Anderson and Thomas Smith III for providing the ground-water data from Shark River Slough. A portion of René Price’s and Amartya Saha’s time wassupported by NSF Grant No. DBI-0620409; René Price was also supported by the NASA Water-SCAPES project. A portion of Jiang Jiang’s time was supported by the USGS FISCHS Project(Future Impacts of Sea Level Rise on Coastal Habitats and Species), which is funded by USGSEcosystems Mapping and USGS Greater Everglades Priority Ecosystem Science Program. We thankSuzanne Koptur and an anonymous reviewer for their comments.
106 Climatic Change (2011) 107:81–108
References
Alexander TR (1974) Evidence of recent sea level rise derived from ecological studies on Key Largo,Florida. In: Gleason PJ (ed) Environments of South Florida: present and past. Miami GeologicalSociety, Coral Gables, Florida, pp 219–222
Allison I, Bindoff NL, Bindschadler RA et al (2009) Updating the world on the latest climate science.The University of New South Wales Climate Change Research Centre, Sydney
Armas C, Padilla FM, Pugnaire FI Jackson RB (2010) Hydraulic lift and tolerance to salinity ofsemiarid species: consequences for species interactions. Oecologia 162:11–21
Armentano TV, Jones DT, Ross MS, Gamble B (2002) Vegetation pattern and process in tree islandsof the southern Everglades and adjacent areas. In: Sklar FJ, Valk FG (eds) Tree islands of theeverglades. Kluwer, Dordrecht, pp 225–282
Barry M (2009) Data summary of working vegetation maps of the ten thousand islands nationalwildlife refuge. Report submitted to U.S. Department of the Interior Fish and Wildlife Service,Naples, Florida
Blasco F (1977) Outlines of ecology, botany and forestry of the Mangals of the Indian subconti-nent. In Chapman VJ (ed) Wet coastal ecosystems. Ecosystems of the World Series. Elsevier,Amsterdam, pp 241–259
Blum MD, Roberts HH (2009) Drowning of the Mississippi delta due to insufficient sediment supplyand global sea-level rise. Nat Geosci 2:488–491
Craighead FC (1964) Land, mangroves and hurricanes. Fairchild Trop Gard Bull 19:5–32Craighead FC (1971) Trees of South Florida, volume I: the natural environments and their succes-
sion. University of Miami Press, Coral GablesDiaz AP, Mannion C, Schaffer B (2006) Effect of root feeding by Diarepes abbreviatus (Coleoptera:
Curulionidae) larvae on leaf gas exchange and growth of three ornamental tree species. J EconEntomol 99:811–821
Donnelly JP, Bertress MD (2001) Rapid shoreward encroachment of salt marsh cordgrass in responseto accelerated sea-level rise. PNAS 98:14218–14223
Ewe S (2001) Ecophysiology of Schinus terebinthifolius contrasted with native species in two SouthFlorida ecosystems. Dissertation, University of Miami
DeSantis LR, Bhotika SK, Williams K et al (2007) Sea-level rise and drought interactions acceleratedeclines of coastal forests on the Gulf Coast of Florida, USA. Glob Chang Biol 13:2349–2360
Doyle TW, Krauss KW, Conner WH, From AS (2010) Predicting the retreat and migration of tidalforests along the northern Gulf of Mexico under sea-level rise. For Ecol Manag 259:770–777
Fitterman DV, Deszcz-Pan M, Stoddard CE (1999) Results of time-domain electromagnetic sound-ings in Everglades National Park, Florida (on CD-ROM). U.S. Geological Survey Open-FileReport, pp 99–426
Freville H, McConway K, Dodd M, Silvertown J (2007) Prediction of extinction in plants: interactionof extrinsic threats and life history traits. Ecol 88:2662–2672
Gann GD, Bradley KA, Woodmansee SW (2002) Rare plants of South Florida: their history, conser-vation and restoration. The Institute for Regional Conservation, Miami
Gann GD, Bradley KA, Woodmansee SW et al (2008) Floristic inventory of the Florida Keys data-base online http://regionalconservation.org/ircs/database/DatabaseFK.asp. Accessed 10 April2010
Gann GD, Bradley KA, Woodmansee SW (2010) Floristic inventory of South Florida databaseonline http://regionalconservation.org/ircs/database/database.asp. Accessed 23 September 2010
Glenn EP, Brown JJ, Blumwald E (1999) Salt tolerance and crop potential of halophytes. Crit RevPlant Sci 18:227–255
Gunderson LH (1994) Vegetation of the Everglades: determinants of community composition. InDavis SM, Ogden JC (eds) Everglades: the ecosystem and its restoration. St. Lucie, DelrayBeach, pp 232–340
Holmes CW, Robbins J, Halley R et al (2000) Sediment dynamics of Florida Bay mud banks ona decadal time scale. In: Eggleston (ed) US geological survey program on the South Floridaecosystem. Proceedings of the greater everglades ecosystem restoration (GEER) conference.US Geological Survey Open-File Report 00-449
Ish-Shalom N, Sternberg LDL, Ross M et al (1992) Water utilization of tropical hardwood hammocksof the lower Florida Keys. Oecologia 92:108–112
Knighton AD, Mills K, Woodroffe CD (1991) Tidal-creek extension and saltwater intrusion innorthern Australia. Geol 19:831–834
Climatic Change (2011) 107:81–108 107
Klein H, Waller BG (1985) Synopsis of saltwater intrusion in Dade County, Florida, through 1984.U.S. Geological Survey, Water Resources Investigation Report 85–410
Krauss KW, Duberstein JA, Doyle TW et al. (2009) Site condition, structure, and growth of baldcypress along tidal/non-tidal salinity gradients. Wetland J 29:505–519
Kruse SE, Schneider JC, Inman JA et al (2000) Ground penetrating radar imaging of the freshwa-ter/saltwater interface on a carbonate island, Key Largo, Florida. In: Noon DA, Stickley GF,Longstaff D (eds) Proceedings of the eighth international conference on ground penetratingradar. University of Queensland, Queensland, pp 335–340
Langevin CD, Stewart MT, Beaudoin CM (1998) Effects of sea water canals on fresh water resources:an example from big Pine Key, Florida. Ground Water 36:503–513
Langevin CD, Swain E, Wolfert M (2005) Simulation of integrated surface-water/ground-water flowand salinity for a coastal wetland and adjacent estuary. J Hydrol 314:212–224
Lucas RM, Ellison JC, Mitchell A et al (2002) Use of stereo aerial photography for quantifyingchanges in the extent and height of mangroves in tropical Australia. Wetl Ecol Manage 10:159–173
Maschinski J, Goodman JL, Powell D (2009) Assessment of population status and causes of declinefor pilosocereus robinii (Lem.) byles & G. D. Rowley in the Florida keys. Final report to U.S.fish and wildlife service, South Florida ecological services office, Vero Beach, FL
Meadows DG, Caballero JP, Kruse SE, Vacher HL (2004) Variation of salinity in brackish-waterlenses of two Florida Keys. J Coast Res 20:386–400
Meeder JF, Ross MS, Telesnicki PL et al (1996) Vegetation analysis in the C-111/Taylor Sloughbasin. Document 1: the southeast saline Everglades revisited: a half century of coastal vegetationchange. Florida International University, Southeast Environmental Research Program, Miami,p 62
Munns R (2002) Comparative physiology of salt and water stress. Plant Cell Environ 25:239–250Nuttle WK, Fourqurean JW, Cosby BJ et al (2000) Influence of net freshwater supply on salinity in
Florida Bay. Water Res 36:1805–1822Olmsted IC, Loope LL (1980) Vegetation along a microtopographic gradient in the estuarine region
of Everglades National Park, Florida. Unpublished report submitted to South Florida ResearchCenter, Homestead, Florida
Olmsted IC, Loope LL (1984) Plant communities of Everglades National Park. In: Gleason PJ (ed)Environments of South Florida: present and past II. Miami Geological Society, Coral Gables,pp 167–184
Olmsted IC, Loope LL, Russell RP (1981) Vegetation of the southern coastal region of theEverglades National Park between Flamingo and Joe Bay. South Florida Research CenterHomestead, Florida, Technical Report T-620
Pearlstine LG, Pearlstine EV, Sadle J et al (2009) Potential ecological consequences of climatechange in south Florida and the Everglades: 2008 literature synthesis. Technical Series 2009.South Florida Natural Resources Center, Homestead, Florida, pp 1–35
Perry L, Williams W (1996) Effects of salinity and flooding on seedlings of cabbage palm (Sabalpalmetto). Oecologia 105:428–434
Pielou EC (1960) A single mechanism to account for regular, random and aggregated populations. JEcol 48:575–584
Price RM, Top Z, Happell JD, Swart PK (2003) Use of tritium and helium to define groundwa-ter flow conditions in Everglades National Park. Water Resour Res 39(9):1267. doi:10.1029/2002WR001929
Price RM, Swart PK, Fourqurean JW (2006) Terrestrial brackish groundwater discharge—a sig-nificant source of phosphorus for the oligotrophic wetlands of the Everglades. Hydrobiol 569:23–36
Reed DJ (2002) Sea-level rise and coastal marsh sustainability: geological and ecological factors inthe Mississippi delta plain. Geomorphol 48:233–243
Ross MS, O’brien JJ, Flynn LJ (1992) Ecological site classification for Florida Keys terrestrialhabitats. Biotropica 24:488–502
Ross MS, Obrien JJ, Sternberg LDL (1994) Sea-level rise and the reduction in pine forests in theFlorida Keys. Ecol Appl 4:144–156
Ross MS, O’Brien JJ, Ford RG et al (2009) Disturbance and the rising tide: the challenge ofbiodiversity management for low island ecosystems. Front Ecol Environ 9:471–478
Saha AK (2009) The role of spatiotemporal heterogeniety in water and nutrient pools in Evergladesplant community diversity and function. Dissertation, University of Miami, Coral Gables
108 Climatic Change (2011) 107:81–108
Saha AK, Sternberg LS, Miralles-Wilhelm F (2009) Linking water sources with foliar nutrient statusin upland plant communities in the Everglades National Park, USA. Ecohydrol 1:42–54
Schwadron M (2010) Landscapes of maritime complexity: prehistoric shell work sites of the TenThousand Islands, Florida. Dissertation, University of Leicester, Leicester
Sklar F, Browder J (1998) Coastal environmental impacts brought about by alteration of freshwaterflow into the Gulf of Mexico. J Environ Manag 22:547–562
Small JK (1927) Among floral aborigines: a record of exploration in Florida in the winter of 1922. JNew York Bot Garden 28:1–20
Sonenshein RS, Koszalka EJ (1996) Trends in water table altitude (1984–93) and saltwater intrusion(1974–93) in the Biscayne aquifer, Dade County, Florida: 2 sheets. U.S. Geological Survey Open-File Report 95-705
Stalter R, Kincaid D (2004) The vascular flora of five Florida shell middens. J Torrey Bot Soc 131:93–103
Sternberg LDL, Swart PK (1987) Utilization of freshwater and ocean water by coastal plants ofSouthern Florida. Ecology 68:1898–1905
Sternberg LDL, Teh SY, Ewe S et al (2007) Competition between hardwood hammocks and man-groves. Ecosystem 10:648–660
Sullivan P, Price R, Ross M et al (2010) Hydrologic processes of tree islands in the Everglades: track-ing the effects of tree establishment and growth. Hydrogeol J. doi:10.1007/s10010-010-0691-0.doi:10.1007/s10040-010-0691-0
Teh SY, DeAngelis DL, Sternberg L et al (2008) A simulation model for projecting changes insalinity concentrations and species dominance in the coastal margin habitats of the Everglades.Ecol Model 213:245–256
Tomlinson PB (1980) The biology of trees native to tropical Florida. Harvard University Press,Alston
Urrego LE, Polania J, Buitrago MF et al (2009) Distribution of mangroves along environmentalgradients on San Andres Island (Colombian Caribbean). Bull Mar Sci 85:27–43
U.S. Department of the Interior (2007) http://sofia.usgs.gov/publications/ofr/02-101/data.html. U.S.Geological Survey. Accessed 1 October 2010
Villalobos R (2010) Water table and nutrient dynamics in neotropical savannas and wetland ecosys-tems. Dissertation, University of Miami
Wanless HR, Parkinson RW, Tedesco LP (1994) Sea level control on stability of Everglades wet-lands. In: Davis SM, Davis Ogden JC (eds) Everglades: the ecosystem and its restoration.St. Lucie, Boca Raton, pp 198–224
Williams K, Ewel KC, Stumpf RP et al (1999) Sea-level rise and coastal forest retreat on the westcoast of Florida, USA. Ecology 80:2045–2063
Williams K, MacDonald M, McPherson K et al (2007) Ecology of the coastal edge of hydric ham-mocks on the gulf coast of Florida. In: Conner WH, Doyle TW, Krauss K (eds) Ecology of tidalfreshwater forested wetlands of the southeastern United States. Springer, Netherlands, pp 255–289