Embed Size (px)
Citation preview
i
NATIONAL WILDLIFE FEDERATION
Sea-level Rise and Coastal Habitats in the Pacific Northwest
An Analysis for Puget Sound, Southwestern Washington, and Northwestern Oregon
Sea-level Rise and Coastal Habitats in the Pacific Northwest An Analysis for Puget Sound, Southwestern Washington, and Northwestern Oregon July 2007 Prepared by:
Patty Glick, Senior Global Warming Specialist, National Wildlife Federation Jonathan Clough, Environmental/Computer Consultant, Warren Pinnacle Consulting, Inc. Brad Nunley, GIS Specialist, National Wildlife Federation
© 2007 by the National Wildlife Federation All rights reserved. Larry J. Schweiger President and Chief Executive Officer National Wildlife Federation Acknowledgements This report is the culmination of the efforts of numerous individuals at the National Wildlife Federation. Special thanks to Dr. Amanda Staudt, James Schroeder, Joelle Robinson, and Tim Warman for shepherding this report through its final edits and coordinating its release. We also sincerely thank Dr. Doug Canning of the School of Marine Affairs and Climate Impacts Group at the University of Washington and Dr. Dick Park of Eco Modeling in Diamondhead, Mississippi, for providing invaluable conceptual and technical guidance throughout this project. Thank you, as well, to Dr. Mary Ruckelshaus, research biologist with the National Oceanic and Atmospheric Administration’s (NOAA) Northwest Fisheries Science Center, for reviewing this report. Finally, we are enormously grateful to King County Executive Ron Sims, Elizabeth Willmott, and the King County Executive Action Group on Climate Change for contributing the foreword remarks. Cover photo: Bald eagle at Padilla Bay (NOAA)
Sea-level Rise and Coastal Habitats in the Pacific Northwest
TABLE OF CONTENTS FOREWORD ....................................................................................................................................................... i EXECUTIVE SUMMARY ..............................................................................................................................ii INTRODUCTION............................................................................................................................................ 1 CLIMATE CHANGE AND SEA-LEVEL RISE....................................................................................... 3 SEA-LEVEL RISE AND PACIFIC NORTHWEST COASTAL HABITATS ............................... 6 Projected Habitat Changes................................................................................................................................. 8 Fish and Wildlife at Risk ................................................................................................................................. 13 Additional Climate and Non-climate Stressors............................................................................................ 16 IMPLICATIONS FOR COASTAL MANAGEMENT AND RESTORATION ............................ 17 Changing the Forecast for Coastal Habitats: A Plan of Action ................................................................. 17 MODEL DESCRIPTION AND DETAILED RESULTS..................................................................... 22
Project Background/Model Summary .................................................................................................... 22 Study Sites.................................................................................................................................................... 26 Sea-level Rise Scenarios............................................................................................................................. 28 Model Results by Study Site ..................................................................................................................... 30
Site 1: Nooksack Delta, Lummi Bay, and Bellingham Bay......................................................... 30 Site 2: Padilla Bay, Skagit Bay, and Port Susan Bay ..................................................................... 36 Site 3: Whidbey Island, Port Townsend, and Admiralty Inlet ................................................... 42 Site 4: Snohomish Estuary and Everett ........................................................................................... 45 Site 5: Ediz Hook, Dungeness Spit, and Sequim Bay................................................................... 50 Site 6: Dyes Inlet, Sinclair Inlet, and Bainbridge Island............................................................... 54 Site 7: Elliott Bay to the Duwamish Estuary.................................................................................. 57 Site 8: Annas Bay and Skokomish Estuary..................................................................................... 60 Site 9: Commencement Bay, Tacoma, and Gig Harbor............................................................... 63 Site 10: Olympia, Budd Inlet, and Nisqually Delta....................................................................... 66 Site 11: Willapa Bay, Columbia River Estuary, and Tillamook Bay ......................................... 72
CONCLUDING REMARKS ........................................................................................................................ 76 APPENDIX ....................................................................................................................................................... 77 REFERENCES ................................................................................................................................................. 90
i
Sea-level Rise and Coastal Habitats in the Pacific Northwest
FOREWORD
Global climate change is a reality. Human emissions are driving unprecedented and dangerous climate change, with coastal regions on the front lines of its effects. If we allow climate change to continue unabated, it will have significant effects across the world. Here in the Pacific Northwest, it will jeopardize the health of our most valued natural companions: shellfish, salmon, shorebirds, and waterfowl. As this important report shows, it will also fundamentally alter the way our human community lives on this beautiful coastline, how we get our food, how we interact with nature, and how we live as neighbors to Puget Sound. We can and must change this forecast through aggressive greenhouse gas emissions reductions, while at the same time preparing for its effects on our region. We must set policies that are based on science and data, such as those outlined in the 2007 King County Climate Plan, instead of wishful thinking. We must embed climate change assumptions into our natural resource management plans and strategies to enable the most effective environmental restoration and protection possible. Accounting for climate change projections in these plans is important from both a cost perspective and a natural resource perspective, especially for our future generations. As a public official making decisions that impact not only our community today, but also millions of future Puget Sound’s residents and their natural environment, I refuse to let future generations pay for the consequences of our current lifestyles. By taking steps today to limit climate change, we can save money, natural resources and the quality of life we all value for our region’s future residents tomorrow. This is an imperative. With this report, the National Wildlife Federation reinforces its position of leadership on the most pressing issue facing our human and natural communities today: global climate change. Although the scenarios described in this report may sound gloomy, I am inspired by this honest presentation of one possible future of the Pacific Northwest. Only with such sound science and reason clearly illuminating the problem can we as community leaders and citizens be motivated, empowered and wise enough to cope with and limit the negative consequences of climate change to our beloved coastline. This report advances our collective understanding of that shared future, and I encourage you to read it with that same sense of purpose. — RON SIMS, King County Executive
ii
Sea-level Rise and Coastal Habitats in the Pacific Northwest
EXECUTIVE SUMMARY The Pacific Northwest is blessed with an amazing diversity of coastal habitats, from rocky
bluffs and sandy beaches along the Pacific Coast to the tidal flats, marshes, mixed sediment beaches, and eelgrass beds of Puget Sound. Together, these habitats support thousands of species of fish and wildlife, and they are a linchpin for the regional economy, culture, and quality of life.
Despite its pristine image, however, the region’s coastal habitats and the ecological systems they support face serious problems due to human activities, which have prompted numerous local and regional restoration and protection efforts. Whether our significant conservation investments will endure for the future depends on how well the region is able to promote more sustainable use of its coastal resources in the face of continued population growth, pressures for development, and now, the very real threat of global warming.
Climate Change and Sea-level Rise Scientists have widely and conclusively determined that global warming is happening and that burning fossil fuels is largely to blame. Global warming is disrupting the planet’s climate system, and it is already having an impact on the Pacific Northwest. Left unchecked, the region will face higher average air and water temperatures, shifts in precipitation patterns, and a significant decline in average snowpack, all of which will put coastal habitats and the fish and wildlife that depend on them at great risk.
In addition, global warming is contributing to a significant increase in the rate of sea-level rise due to the thermal expansion of ocean waters and melting of glaciers and ice fields. Given the vast expanse of coastline along the Pacific Ocean and in Puget Sound and the critical role that vulnerable coastal habitats such as marshes, tidal flats, and beaches play in the region’s ecology and economy, sea-level rise is likely to have a profound impact on the Pacific Northwest.
Of particular concern is the fact that most of the region’s important coastal habitats have already been damaged or destroyed by extensive dredging, coastal modifications, pollution, and other development. Not only does this make remaining habitat all the more important for fish and wildlife, but coastal modifications such as dikes and seawalls have significantly reduced the ability for habitats to migrate inland to accommodate for sea-level rise. Any further losses or changes in habitat composition will have devastating consequences for the region’s overall ecological and economic health.
Sea-level Rise and Pacific Northwest Coastal Habitats
This study investigates the potential impact of sea-level rise on key coastal habitats in the Pacific Northwest. In addition to raising awareness of the threat, the results of the study will assist coastal managers and other relevant decision-makers identify and implement strategies to minimize the risks. We used the Sea Level Affecting Marshes Model (SLAMM), which simulates the dominant processes involved in wetland conversions and shoreline modifications during long-term sea-level rise. This model was applied to 11 different sites in Puget Sound and along the Pacific Coast in southwestern Washington and northwestern Oregon.
iii
Sea-level Rise and Coastal Habitats in the Pacific Northwest
Our analysis looked at a range of Intergovernmental Panel on Climate Change (IPCC) sea-level rise scenarios, from a 0.08 meter (3.0 inch) rise in global average sea level by 2025 to a 0.69 meter (27.3 inch) rise by 2100. We also modeled a rise of up to 2 meters (78.7 inches) by 2100 to accommodate for recent studies that suggest sea-level rise will occur much more rapidly during this century than the IPCC models have projected. Results for each study site are based on relative sea-level rise for the given region, taking into consideration regional changes in land elevation due to geological factors, such as subsidence and uplift, and ecological factors such as sedimentation and marsh accretion. Full model results are available from the National Wildlife Federation.
Projected Habitat Changes Model results vary considerably by site (see Table 1), but overall the region is likely to face a dramatic shift in the extent and diversity of its coastal marshes, swamps, beaches, and other habitats due to sea-level rise. For example, if global average sea level increases by 0.69 meters (27.3 inches), the following impacts are predicted by 2100 for the sites investigated:
• Estuarine beaches will undergo inundation and erosion to the tune of a 65 percent loss.
• As much as 44 percent of tidal flat will disappear.
• 13 percent of inland fresh marsh and 25 percent of tidal fresh marsh will be lost.
• 11 percent of inland swamp will be inundated with salt water, while 61 percent of tidal swamp will be lost.
• 52 percent of brackish marsh will convert to tidal flats, transitional marsh and saltmarsh.
• 2 percent of undeveloped land will be inundated or eroded to other categories across all study areas.
iv
Sea-level Rise and Coastal Habitats in the Pacific Northwest
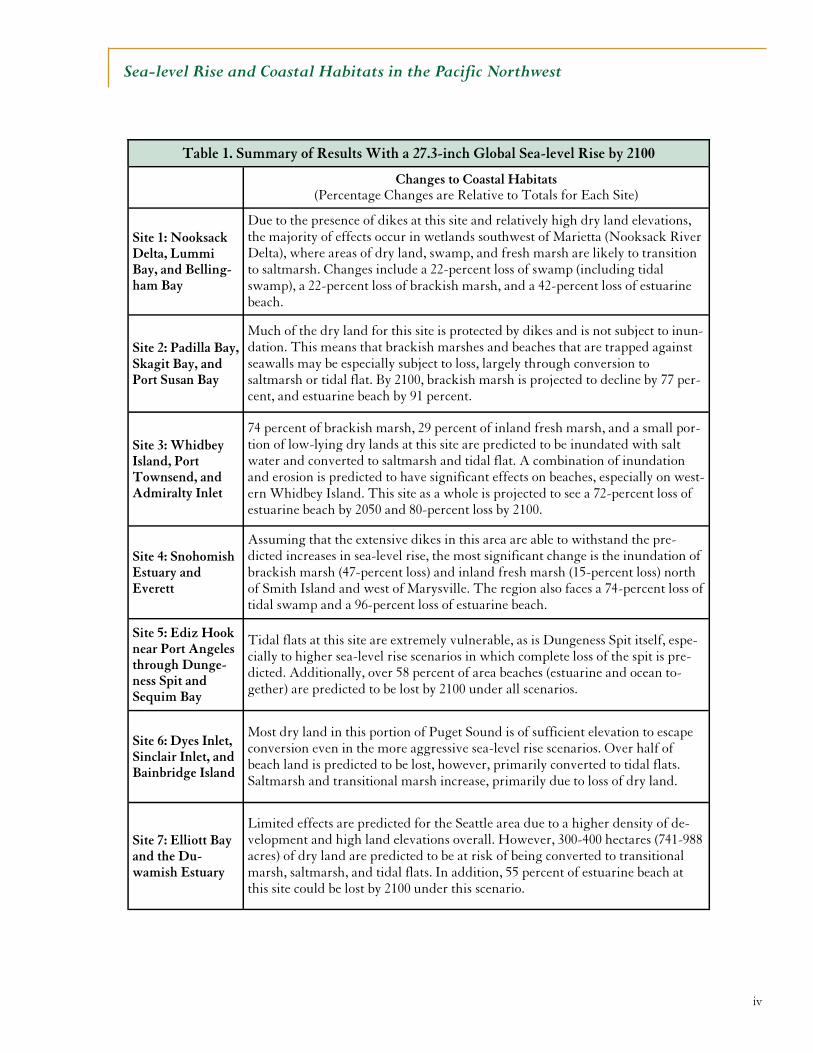
Table 1. Summary of Results With a 27.3-inch Global Sea-level Rise by 2100
Changes to Coastal Habitats
(Percentage Changes are Relative to Totals for Each Site)
Site 1: Nooksack Delta, Lummi Bay, and Belling-ham Bay
Due to the presence of dikes at this site and relatively high dry land elevations, the majority of effects occur in wetlands southwest of Marietta (Nooksack River Delta), where areas of dry land, swamp, and fresh marsh are likely to transition to saltmarsh. Changes include a 22-percent loss of swamp (including tidal swamp), a 22-percent loss of brackish marsh, and a 42-percent loss of estuarine beach.
Site 2: Padilla Bay, Skagit Bay, and Port Susan Bay
Much of the dry land for this site is protected by dikes and is not subject to inun-dation. This means that brackish marshes and beaches that are trapped against seawalls may be especially subject to loss, largely through conversion to saltmarsh or tidal flat. By 2100, brackish marsh is projected to decline by 77 per-cent, and estuarine beach by 91 percent.
Site 3: Whidbey Island, Port Townsend, and Admiralty Inlet
74 percent of brackish marsh, 29 percent of inland fresh marsh, and a small por-tion of low-lying dry lands at this site are predicted to be inundated with salt water and converted to saltmarsh and tidal flat. A combination of inundation and erosion is predicted to have significant effects on beaches, especially on west-ern Whidbey Island. This site as a whole is projected to see a 72-percent loss of estuarine beach by 2050 and 80-percent loss by 2100.
Site 4: Snohomish Estuary and Everett
Assuming that the extensive dikes in this area are able to withstand the pre-dicted increases in sea-level rise, the most significant change is the inundation of brackish marsh (47-percent loss) and inland fresh marsh (15-percent loss) north of Smith Island and west of Marysville. The region also faces a 74-percent loss of tidal swamp and a 96-percent loss of estuarine beach.
Site 5: Ediz Hook near Port Angeles through Dunge-ness Spit and Sequim Bay
Tidal flats at this site are extremely vulnerable, as is Dungeness Spit itself, espe-cially to higher sea-level rise scenarios in which complete loss of the spit is pre-dicted. Additionally, over 58 percent of area beaches (estuarine and ocean to-gether) are predicted to be lost by 2100 under all scenarios.
Site 6: Dyes Inlet, Sinclair Inlet, and Bainbridge Island
Most dry land in this portion of Puget Sound is of sufficient elevation to escape conversion even in the more aggressive sea-level rise scenarios. Over half of beach land is predicted to be lost, however, primarily converted to tidal flats. Saltmarsh and transitional marsh increase, primarily due to loss of dry land.
Site 7: Elliott Bay and the Du-wamish Estuary
Limited effects are predicted for the Seattle area due to a higher density of de-velopment and high land elevations overall. However, 300-400 hectares (741-988 acres) of dry land are predicted to be at risk of being converted to transitional marsh, saltmarsh, and tidal flats. In addition, 55 percent of estuarine beach at this site could be lost by 2100 under this scenario.
v
Impacts on Fish and Wildlife Given the complexity of the Pacific Northwest’s coastal and marine systems and the multitude of factors affecting them, it is impossible to know exactly what sea-level rise will mean for the region’s fish and wildlife in the decades to come. However, there is no question that these projected changes would fundamentally alter the region’s coastal habitats and the species they support. Some species may be able to respond to changes by finding alternative habitats or food sources, but others will not. Furthermore, the larger the changes and rate of change, the harder it will be for most fish and wildlife species to adapt to the impacts of global warming (Inkley, 2004). For example, a significant reduction in the area of estuarine beaches would affect important spawning habitat for forage fish, which make up a critical part of the marine food web. Unless species are able to find alternative spawning areas, their populations could decline. Inundation of tidal flats in some areas would reduce stopover and wintering habitat for migratory shorebirds. It could also have a major impact on the region’s economically-important shellfish industry. Loss of coastal marshes would affect habitat for thousands of wintering waterfowl that visit the region each year. And changes in the composition of tidal wetlands could significantly diminish the capacity for those habitats to support salmonids, especially juvenile Chinook and chum salmon.
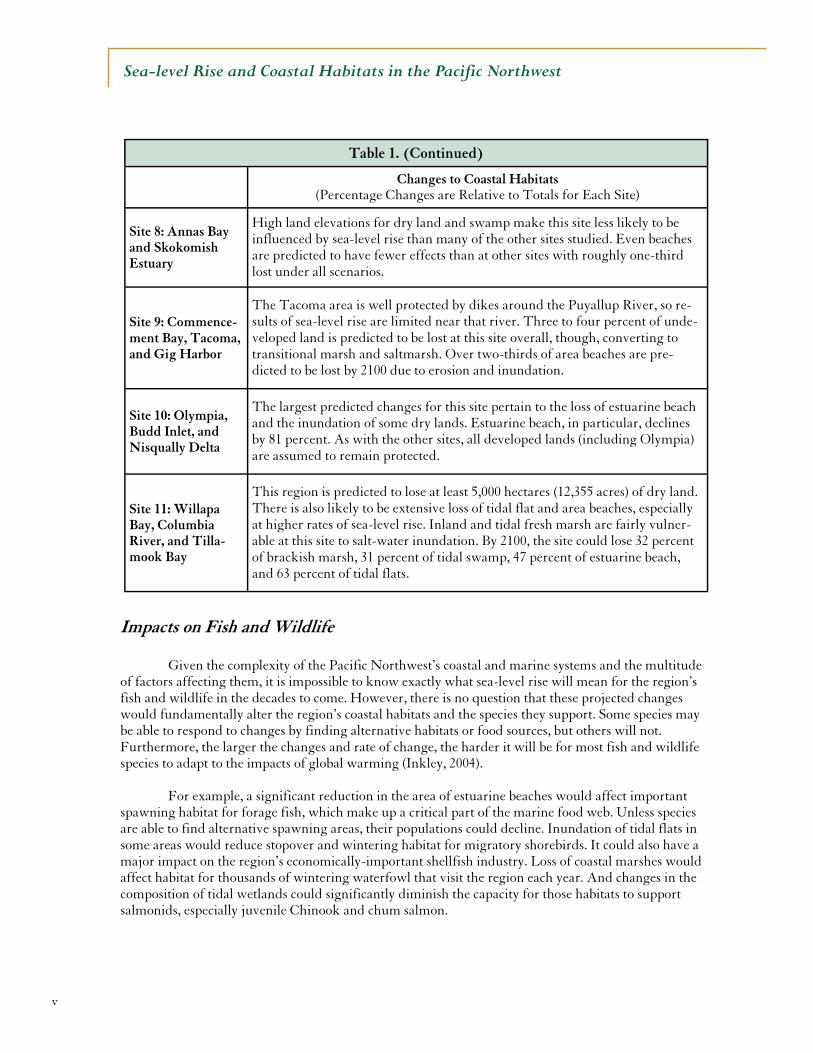
Table 1. (Continued)
Changes to Coastal Habitats
(Percentage Changes are Relative to Totals for Each Site)
Site 8: Annas Bay and Skokomish Estuary
High land elevations for dry land and swamp make this site less likely to be influenced by sea-level rise than many of the other sites studied. Even beaches are predicted to have fewer effects than at other sites with roughly one-third lost under all scenarios.
Site 9: Commence-ment Bay, Tacoma, and Gig Harbor
The Tacoma area is well protected by dikes around the Puyallup River, so re-sults of sea-level rise are limited near that river. Three to four percent of unde-veloped land is predicted to be lost at this site overall, though, converting to transitional marsh and saltmarsh. Over two-thirds of area beaches are pre-dicted to be lost by 2100 due to erosion and inundation.
Site 10: Olympia, Budd Inlet, and Nisqually Delta
The largest predicted changes for this site pertain to the loss of estuarine beach and the inundation of some dry lands. Estuarine beach, in particular, declines by 81 percent. As with the other sites, all developed lands (including Olympia) are assumed to remain protected.
Site 11: Willapa Bay, Columbia River, and Tilla-mook Bay
This region is predicted to lose at least 5,000 hectares (12,355 acres) of dry land. There is also likely to be extensive loss of tidal flat and area beaches, especially at higher rates of sea-level rise. Inland and tidal fresh marsh are fairly vulner-able at this site to salt-water inundation. By 2100, the site could lose 32 percent of brackish marsh, 31 percent of tidal swamp, 47 percent of estuarine beach, and 63 percent of tidal flats.
Sea-level Rise and Coastal Habitats in the Pacific Northwest
vi
Sea-level Rise and Coastal Habitats in the Pacific Northwest
Additional Climate and Non-climate Stressors Sea-level rise is just one of the ways in which global warming will affect the region’s coastal ecosystems. Other changes associated with global warming – including heavier rainfall events, lower average snowpack, and higher water temperatures – also will have a considerable impact on the region’s coastal habitats. For example, changes in freshwater flows into coastal waters are likely to alter salinity, water clarity, stratification, and oxygen levels. In addition, higher water temperatures in Puget Sound and the Pacific Ocean could exacerbate the impact of excess nutrient runoff into coastal waters, enhancing harmful algal blooms and hypoxia events.
Moreover, these impacts will fall on top of the numerous other stressors that threaten the region’s coastal resources as the human population grows. If our conservation goal is to restore and protect the ecological health of Puget Sound and coastal Washington and Oregon now and for the future, then we must take these potentially devastating problems associated with global warming into consideration in our conservation plans.
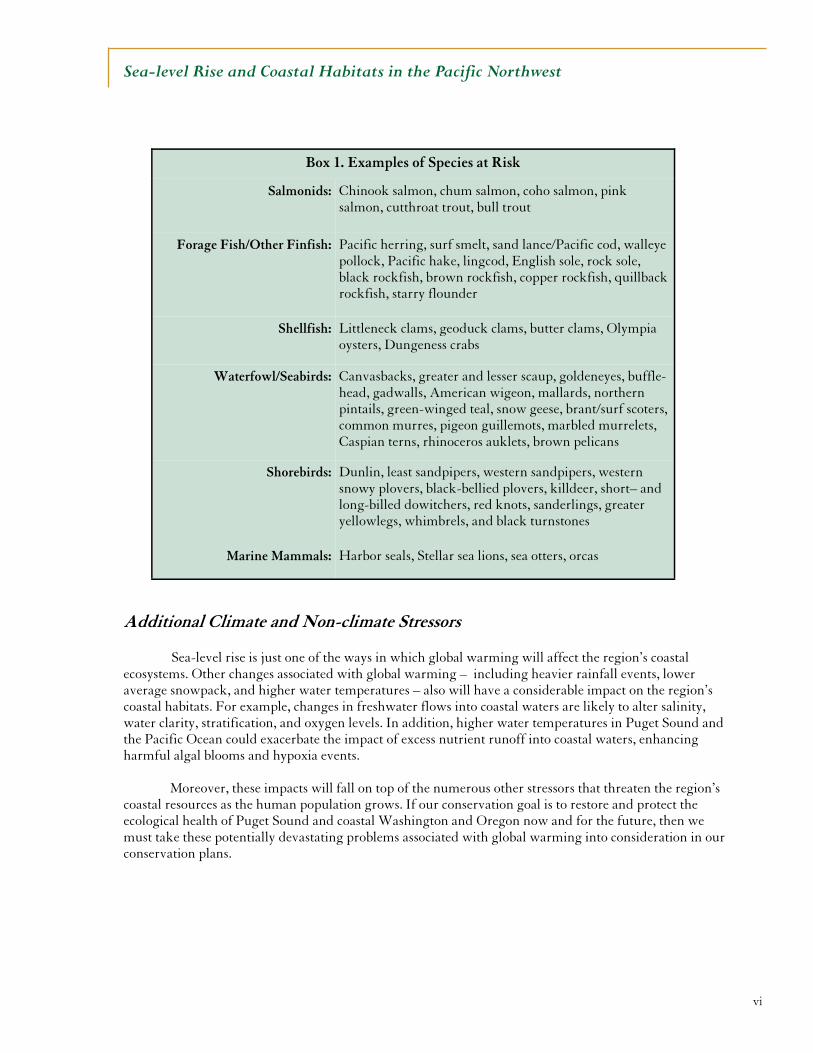
Salmonids: Chinook salmon, chum salmon, coho salmon, pink salmon, cutthroat trout, bull trout
Forage Fish/Other Finfish: Pacific herring, surf smelt, sand lance/Pacific cod, walleye pollock, Pacific hake, lingcod, English sole, rock sole, black rockfish, brown rockfish, copper rockfish, quillback rockfish, starry flounder
Shellfish: Littleneck clams, geoduck clams, butter clams, Olympia oysters, Dungeness crabs
Waterfowl/Seabirds: Canvasbacks, greater and lesser scaup, goldeneyes, buffle-head, gadwalls, American wigeon, mallards, northern pintails, green-winged teal, snow geese, brant/surf scoters, common murres, pigeon guillemots, marbled murrelets, Caspian terns, rhinoceros auklets, brown pelicans
Shorebirds: Dunlin, least sandpipers, western sandpipers, western snowy plovers, black-bellied plovers, killdeer, short– and long-billed dowitchers, red knots, sanderlings, greater yellowlegs, whimbrels, and black turnstones
Marine Mammals: Harbor seals, Stellar sea lions, sea otters, orcas
Box 1. Examples of Species at Risk
vii
Sea-level Rise and Coastal Habitats in the Pacific Northwest
Implications for Coastal Management and Restoration
The most important action the region and nation must take to prevent the possibly overwhelming loss of fish and wildlife due to unmitigated global warming is to reduce greenhouse gas emissions. However, there will be some more warming in the next century that we cannot avoid, and this warming will have a significant impact on local species and habitats. Thus, we must also develop adaptation strategies to help fish and wildlife cope with the expected changes to their habitats, including some sea-level rise, as we build in the flexibility to deal with unforeseen impacts.
Coastal managers must consider a multitude of factors in their planning efforts, including local ecology and geography, pollution inputs, climate variability and change, population growth, and development trends. By examining the intersection of two important pieces of the coastal management puzzle – sea-level rise and critical coastal habitats – it is our hope that this study will provide coastal resource managers and other relevant decision-makers with much-needed information about local impacts of sea-level rise on the wildlife of the Pacific Northwest. The results of this study, along with information about other critical stressors on coastal resources, can help decision-makers assess the risks to specific localities and identify reasonable steps to manage these risks. The potential for significant shifts in critical habitat due to sea-level rise illustrated in this report, as well as other likely global warming impacts on fish and wildlife, make it prudent to consider global warming in planning future use of coastal resources. This should include the following:
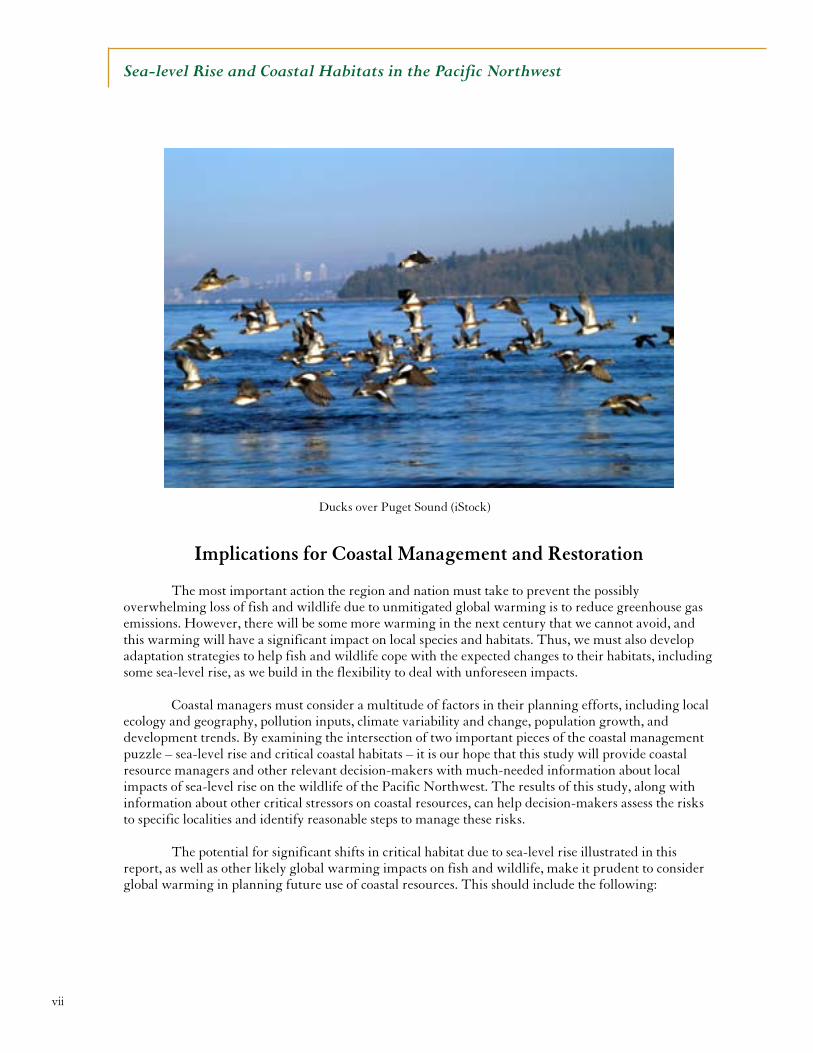
Ducks over Puget Sound (iStock)
viii
Sea-level Rise and Coastal Habitats in the Pacific Northwest
1. Account for global warming in habitat restoration efforts. Many efforts are already underway to restore and protect coastal habitats in the Pacific Northwest. Addressing non-climate stressors will help wildlife survive global warming, but explicit consideration of sea-level rise and other climate change impacts will be necessary to ensure that potentially devastating long-term threats do not become a foregone conclusion. There are several strategies that restoration managers should consider, including prioritizing projects based on ecological importance and vulnerability to sea-level rise; expanding the area of restoration to accommodate for habitat migration; restoring a diverse array of habitat types; and addressing upstream stressors that affect sedimentation and other factors that affect how estuarine habitats will respond to sea-level rise.
2. Explicitly consider climate uncertainties. Projections of future climate will always be accompanied
by some degree of uncertainty, but this should not be used as an excuse for inaction. In fact, the risk of irreversible damages due to global warming necessitates a precautionary approach to action, much like that applied to anticipating flood hazards.
3. Incorporate sea-level rise in coastal development plans. Sea-level rise and its impacts on habitats and
coastal communities should be a major consideration in future development plans. Many steps can be taken to anticipate sea-level rise, including discouraging development in coastal hazard areas, moving or abandoning shoreline infrastructure, preserving ecological buffers to allow inland habitat migration, and enhancing shoreline protection recognizing the negative consequences for shoreline habitat.
Ultimately, coastal management decisions must be made in a coordinated, collaborative way at both the local and regional levels. By taking a longer-term, more comprehensive approach to managing and protecting the coastal resources of the Pacific Northwest, we have a real opportunity to prevent the worst-case scenarios from occurring and ensure that the region’s treasured natural heritage will endure for generations to come.
1
Sea-level Rise and Coastal Habitats in the Pacific Northwest
INTRODUCTION
The Pacific Northwest is a place rich in history, culture, and natural beauty. Its mere mention evokes images of snow-capped mountains, stately evergreens, scenic rivers, and rugged coasts. The region is also blessed with an amazing diversity of coastal habitats, from rocky bluffs and sandy beaches along the Pacific Coast to the tidal flats, marshes, mixed sediment beaches, and eelgrass beds of Puget Sound. Together, these habitats support thousands of species of fish and wildlife, and they are important for the regional economy and quality of life.
Some of the region’s most important and productive habitats are in its low-lying river deltas
and estuaries – the places where rivers and streams meet the sea. Numerous species of shorebirds and migratory waterfowl rely on the shallow waters, tidal flats, and coastal fresh marsh and saltmarshes of estuaries to feed and rest. Estuarine beaches provide vital spawning areas for forage fish, including surf smelt and sand lance, which in turn provide food for birds, marine mammals, salmon, and other fish and wildlife. Thousands of invertebrates, including commercially important oysters and clams, thrive in the mud flats and gravel beds. In addition, estuaries provide critical habitat for juvenile salmon, which spend time there as they acclimate to ocean water.
Unfortunately, the majority of the region’s coastal wetlands and other estuarine and nearshore
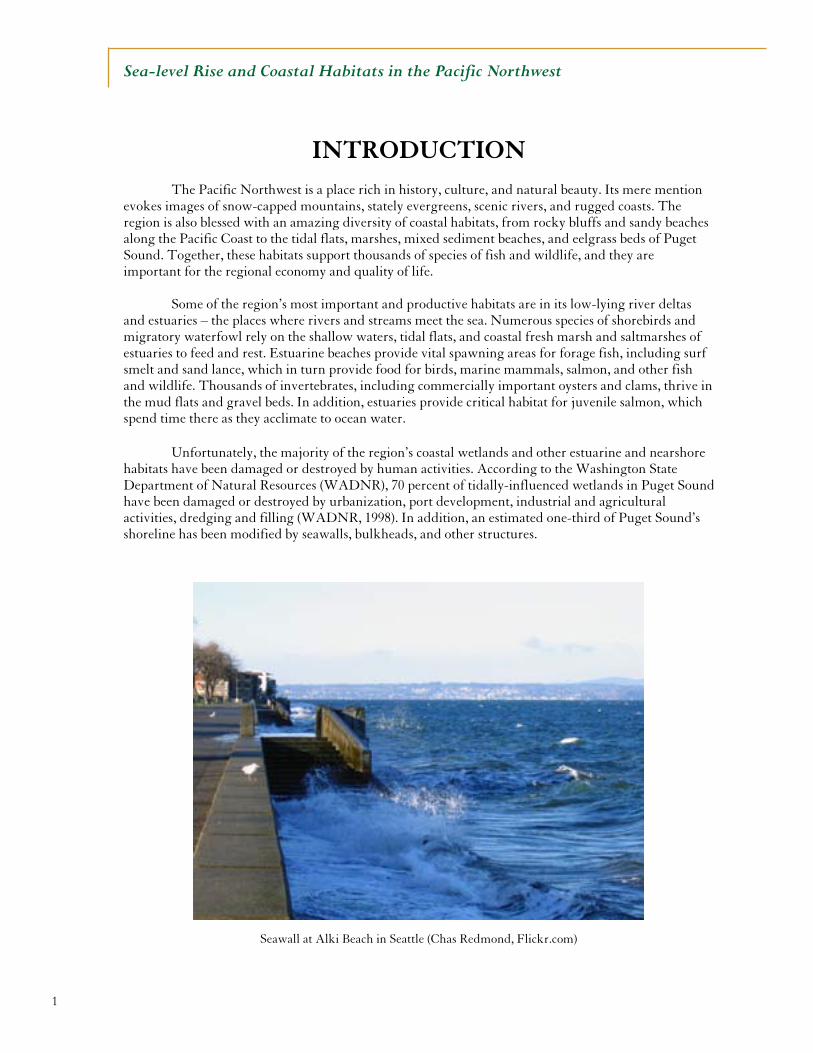
habitats have been damaged or destroyed by human activities. According to the Washington State Department of Natural Resources (WADNR), 70 percent of tidally-influenced wetlands in Puget Sound have been damaged or destroyed by urbanization, port development, industrial and agricultural activities, dredging and filling (WADNR, 1998). In addition, an estimated one-third of Puget Sound’s shoreline has been modified by seawalls, bulkheads, and other structures.
Seawall at Alki Beach in Seattle (Chas Redmond, Flickr.com)
2
Sea-level Rise and Coastal Habitats in the Pacific Northwest
Similar problems have affected Pacific Coast estuaries in both Washington and Oregon.
Habitats of the Columbia River estuary, in particular, have been significantly altered since the mid-1800s due to extensive dredging, construction of dikes, and other development (Independent Scientific Advisory Board, 2000). Furthermore, in many of these areas, upstream activities such as flood control and installation of dams for hydroelectric power have dramatically disrupted the natural flow of river sediments into deltas. And the loss of pollutant-filtering coastal wetlands has contributed to a considerable decline in regional water quality, especially in parts of Puget Sound.
In recent years, growing signs that the ecological health of the region is in serious decline have bolstered numerous efforts to better protect and restore these important coastal habitats and the fish and wildlife that depend on them, including localized community- and tribal-based projects as well as broad, collaborative government- and stakeholder-driven strategies. Increased investments in land acquisition and habitat restoration, improved watershed planning, and stronger shoreline management have offered considerable hope that, at least in some places, the situation may be turning around (Puget Sound Action Team, 2007).
For the region as a whole, however, there are still many indicators of a continuing
decline in the health of its coastal and marine systems, which underscores the need for a more concerted conservation strategy. In particular, success will strongly depend on how well the region is able to promote more-sustainable use of its coastal resources in the face of continued population growth, pressures for development and now, the very real threat of global warming.
3
Sea-level Rise and Coastal Habitats in the Pacific Northwest
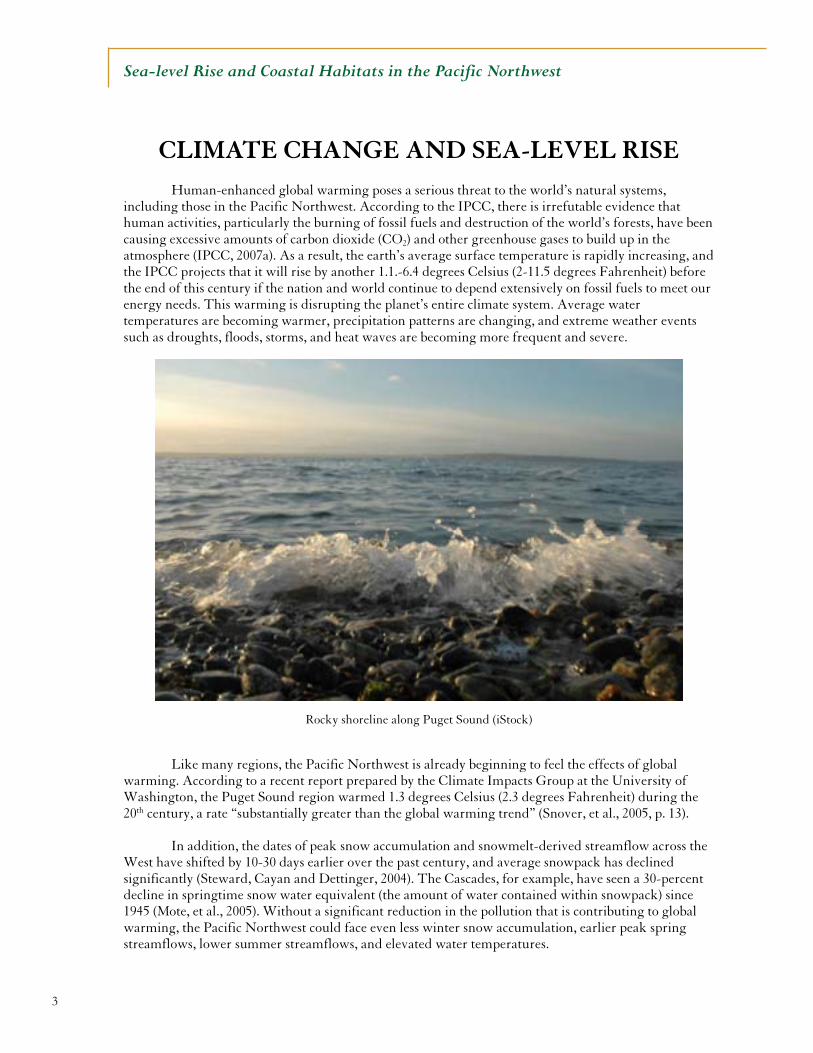
CLIMATE CHANGE AND SEA-LEVEL RISE Human-enhanced global warming poses a serious threat to the world’s natural systems, including those in the Pacific Northwest. According to the IPCC, there is irrefutable evidence that human activities, particularly the burning of fossil fuels and destruction of the world’s forests, have been causing excessive amounts of carbon dioxide (CO2) and other greenhouse gases to build up in the atmosphere (IPCC, 2007a). As a result, the earth’s average surface temperature is rapidly increasing, and the IPCC projects that it will rise by another 1.1.-6.4 degrees Celsius (2-11.5 degrees Fahrenheit) before the end of this century if the nation and world continue to depend extensively on fossil fuels to meet our energy needs. This warming is disrupting the planet’s entire climate system. Average water temperatures are becoming warmer, precipitation patterns are changing, and extreme weather events such as droughts, floods, storms, and heat waves are becoming more frequent and severe.
Like many regions, the Pacific Northwest is already beginning to feel the effects of global
warming. According to a recent report prepared by the Climate Impacts Group at the University of Washington, the Puget Sound region warmed 1.3 degrees Celsius (2.3 degrees Fahrenheit) during the 20th century, a rate “substantially greater than the global warming trend” (Snover, et al., 2005, p. 13).
In addition, the dates of peak snow accumulation and snowmelt-derived streamflow across the
West have shifted by 10-30 days earlier over the past century, and average snowpack has declined significantly (Steward, Cayan and Dettinger, 2004). The Cascades, for example, have seen a 30-percent decline in springtime snow water equivalent (the amount of water contained within snowpack) since 1945 (Mote, et al., 2005). Without a significant reduction in the pollution that is contributing to global warming, the Pacific Northwest could face even less winter snow accumulation, earlier peak spring streamflows, lower summer streamflows, and elevated water temperatures.
Rocky shoreline along Puget Sound (iStock)
4
Sea-level Rise and Coastal Habitats in the Pacific Northwest
In addition to disrupting the planet’s climate system, global warming is causing sea levels around the world to rise due to a combination of thermal expansion of the oceans and rapidly melting glaciers and polar ice sheets. The global average sea level has already risen about 0.17 meters (6.7 inches) over the past century, which is about 10-times faster than the rate of sea-level rise over the last 3,000 years (IPCC, 2007a). The rate of sea-level rise is expected to accelerate during this century. Projections vary, but the most recent projections from the IPCC report show an additional 0.18-0.59-meter (7-23-inch) rise in global average sea level by 2090-2099 relative to 1980-1999 (IPCC, 2007a).
At the localized level, the relative amount of sea-level rise depends on a number of factors that
contribute to vertical land movements, including tectonic processes (subsidence and uplift) as well as sedimentation and marsh accretion (discussed in the following section) (Park, Lee, and Canning, 1993). Uplift, deposition of sediments, and marsh accretion lessen the amount of localized sea-level rise, while subsidence exacerbates the amount of localized sea-level rise. Studies of vertical land movement based on changes in tide gage records show the Puget Sound basin subsiding at rates up to 2.0 millimeters (0.08 inches) per year, while the Pacific Ocean coast along the upper Olympic Peninsula in Washington is uplifting at rates up to 2.5 millimeters (0.1 inches) per year (Canning, 2006).
There are also apparent differences in vertical land movement within Puget Sound, with more
subsidence occurring in southern Puget Sound than further north. For example, at Friday Harbor in the San Juan Islands, vertical land movement is close to zero, which means that the rate of sea-level rise at this site (from 1935 to present) has been equal to the global average. In Seattle, on the other hand, land has been subsiding at a rate of about 1.4 millimeters (0.06 inches) per year, which makes the rate of sea-level rise for the area roughly double the global average.
It should be noted that there is currently some question about whether the local geological
subsidence and uplift rates are linear in space and time (i.e., whether they will continue on the current trend into the foreseeable future) (Canning, 2007). These new findings have emerged subsequent to our modeling effort, so this project includes the historic rates of vertical land movement in the relative sea-level rise scenarios. For most areas, however, the changes are small, so this factor will not likely have a significant impact on the overall implications of sea-level rise on coastal habitats and infrastructure over the longer-term, particularly under the more aggressive sea-level rise scenarios.
In fact, scientists are becoming increasingly concerned that the rate of global sea-level rise in the
future could actually be considerably greater than current projections. The latest literature indicates that the global rise in sea levels is progressing more rapidly than was previously assumed, perhaps due to the dynamic changes in ice flow ignored in the latest IPCC report’s calculations. Several studies suggest that the rate of ice-sheet decline in Greenland and Antarctica has been accelerating in recent years and that the amount of sea-level rise will be even more pronounced in the future (Chen, Wilson, and Tapley, 2006; Otto-Bliesner, et al., 2006; Overpeck, et al., 2006; Rignot and Kanagaratnam, 2006). A paper in the journal Science suggests that, taking into account possible model error, a feasible range by 2100 might be 0.51-1.4 meters (20-56 inches) under a 5 degree Celsius (9 degree Fahrenheit) warming relative to 1990 levels, which is within the range of projected warming during this century (Rahmstorf, 2007).
Indeed, sea-level rise of this magnitude would have enormous global consequences. With a
large portion of the world’s population living in low-lying coastal areas, millions of people will be displaced by sea-level rise before the end of this century. One study, for example, projects that as many as 80 million people will be at risk from coastal flooding (compared to 14 million in the absence of climate change) by 2080 with a 3.3 degrees Celsius (6 degrees Fahrenheit) global warming (Parry, et al., 2001; Nicholls, 2004). This is likely to be particularly devastating for poor countries, the consequences of which should be of utmost concern; but there are also considerable risks closer to home.
5
Sea-level Rise and Coastal Habitats in the Pacific Northwest
Sea stars (iStock)
6
Sea-level Rise and Coastal Habitats in the Pacific Northwest
SEA-LEVEL RISE AND PACIFIC NORTHWEST COASTAL HABITATS
Sea-level rise poses a significant threat to Puget Sound and the Pacific Coast given the sheer
extent of the region’s shoreline mileage and the fact that some of the most important habitats for fish and wildlife are concentrated in the region’s low-lying, tidally-influenced shores and estuaries. According to the 2005 report Regional Nearshore and Marine Aspects of Salmon Recovery, many factors determine the distribution pattern and composition of the region’s coastal wetlands, tidal flats, seagrass beds, and other nearshore habitats, including their elevation relative to average sea level, inundation, dessication, wave scour, substrate type, and light penetration (Redman, Myers, and Averill, 2005). Sea-level rise will affect most of these factors, both directly and indirectly.
One of the primary ways in which sea-level rise will affect the region’s coastal habitats is
through sea-water inundation, which can increase the salinity of the surface and groundwater. Many coastal plant and animal species are adapted to a certain level of salinity, so prolonged changes can make habitats more favorable for some species, less for others. Sea-level rise will also contribute to the expansion of open water in some areas – not just along the coasts but also inland, where dry land can become saturated by an increase in the height of the water table. Furthermore, sea-level rise will lead to significant beach erosion and make coastal areas more susceptible to storm surges.
Coastal habitats to at least some extent may be able to accommodate moderate changes in sea
level by migrating inland. However, the opportunity for inland migration throughout much of the region has been considerably reduced given the accelerating pace of sea-level rise and the fact that much of the region’s coasts have been modified by dikes, seawalls, and other armoring. Coastal armoring can also alter the extent of beach erosion associated with wave action. This may be beneficial in terms of protecting coastal property, but it also limits natural beach replenishment. Similarly, for the region’s river deltas, natural deposition of river sediments may enable at least some habitats to keep pace with sea-level rise. However, modifications such as dams and levees upstream in many of the region’s river basins have significantly limited this sedimentation (Redman, Myers, and Averill, 2005). Site–specific studies are necessary to supplement the findings of this study to help determine how changes in sedimentation rates associated with upstream activities might affect the localized impacts of sea-level rise.
In terms of tidal marsh accretion, a study by Thom, et al. (2001) found that most marshes in the
Pacific Northwest are generally keeping pace with the current rate of sea-level rise, although again, rates vary by location and the extent of coastal modifications such as diking, which can significantly limit the natural sedimentation and accretion processes. Site-specific factors such as soil types, vegetation types, and the amount of tidal influence are important in determining the potential for submergence of coastal wetlands. As with sedimentation, additional research on changes in accretion rates at the localized level will be important to inform on-the-ground management decisions to address the risks from sea-level rise (Cahoon, et al., 2006). It is also important to consider the likelihood that an accelerating rate of sea-level rise due to global warming will significantly limit the ability for marsh accretion in many areas to continue to keep pace with sea-level rise during this century (Morris, et al., 2002).
7
Sea-level Rise and Coastal Habitats in the Pacific Northwest
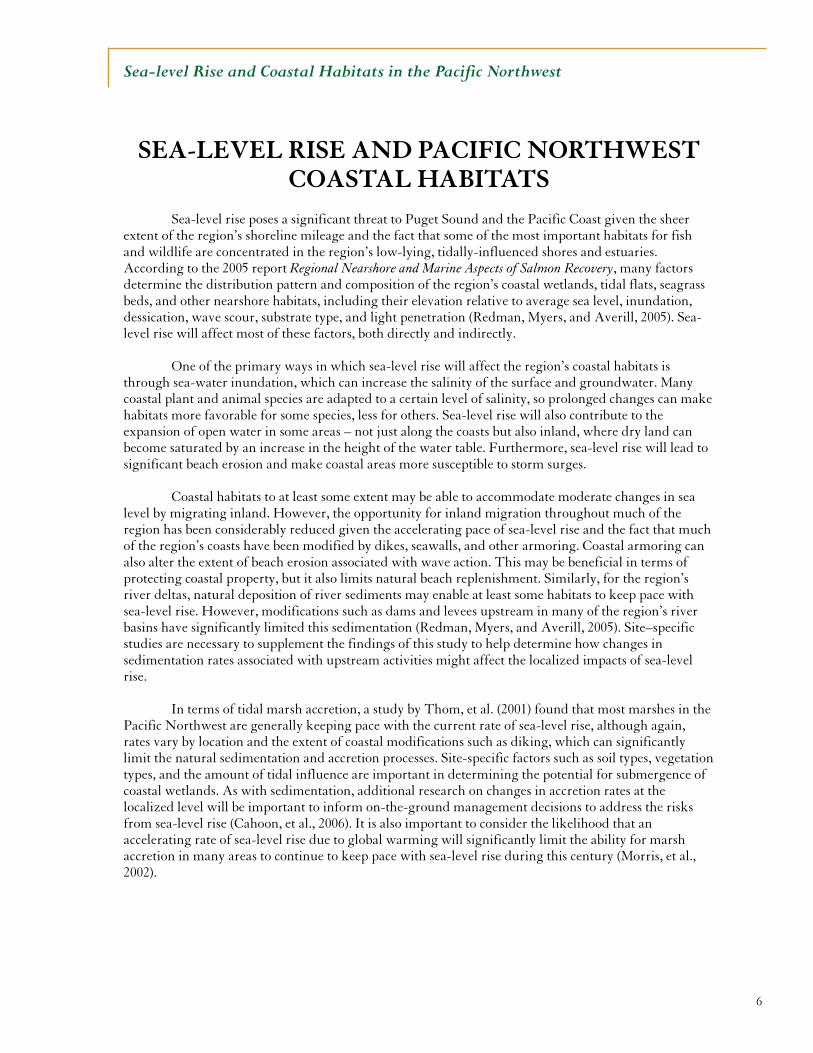
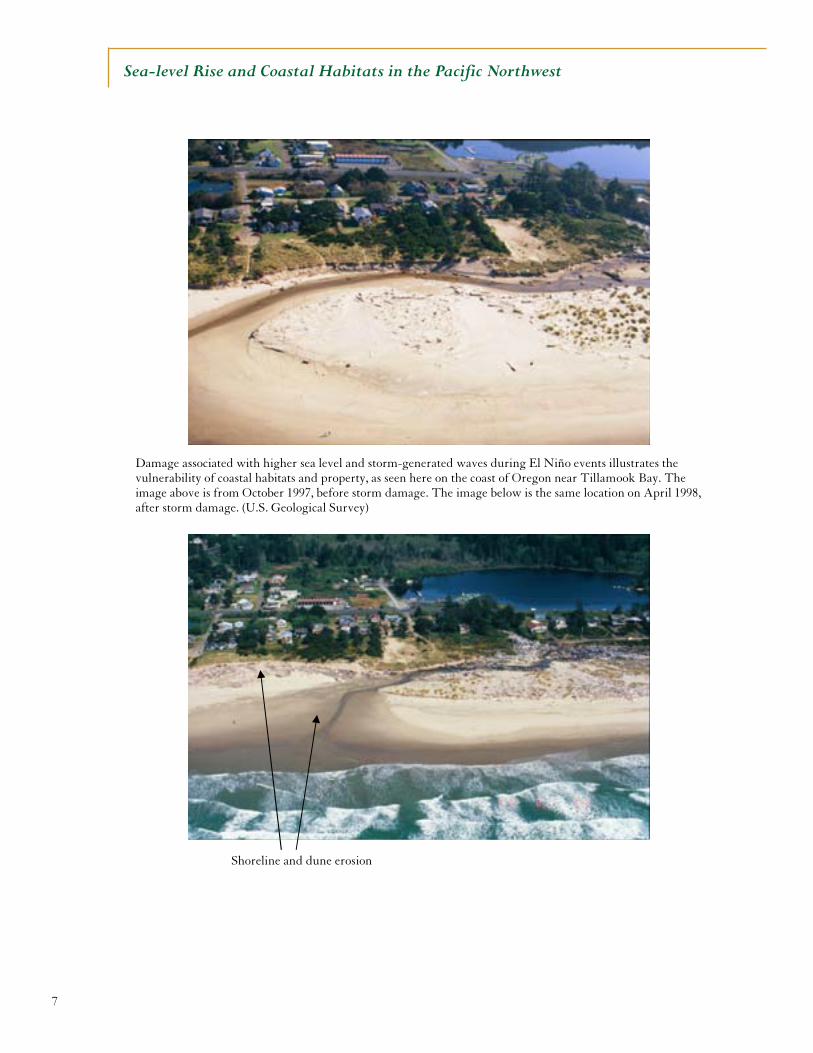
Damage associated with higher sea level and storm-generated waves during El Niño events illustrates the vulnerability of coastal habitats and property, as seen here on the coast of Oregon near Tillamook Bay. The image above is from October 1997, before storm damage. The image below is the same location on April 1998, after storm damage. (U.S. Geological Survey)
Shoreline and dune erosion
8
Sea-level Rise and Coastal Habitats in the Pacific Northwest
Projected Habitat Changes
This study provides the most comprehensive and detailed analysis to date of the potential impacts of sea-level rise on coastal habitats in the Pacific Northwest. We modeled how ten areas in Puget Sound, as well as the Pacific Coast from northeastern Oregon to southwestern Washington would respond to a variety of different sea-level rise scenarios. The model used for this study is called Sea Level Affecting Marshes Model, Version 5.0 (SLAMM 5.0), which was designed to simulate the dominant processes involved in wetland conversion and shoreline modification under long-term sea-level rise (Clough and Park, 2007). This model looks beyond the impacts based on coastal topography alone and assesses how sea-water inundation contributes to the conversion of one habitat type to another. It can also assess how much erosion may occur due to changes in wave action. For these reasons, it is an excellent tool for considering how sea-level rise will affect habitats important for the fish, birds, and other wildlife in the region.
The section of this report beginning on page 22 includes a more-detailed discussion of the
model and sea-level rise scenarios used in this analysis, as well as maps and tables illustrating how each of the 11 study sites is affected under several of the scenarios: an increase of global average sea level of 0.28 meters (11.2 inches) by 2050, 0.69 meters (27.3 inches) by 2100, and 1.5 meters (59.1 inches) by 2100. Model results for the additional scenarios considered in this study are available from the National Wildlife Federation. The projections for habitat changes at each of the study sites incorporate differences in the relative sea-level rise for the given region by taking into consideration regional changes in land elevation due to geological factors, such as subsidence and uplift, and ecological factors, such as sedimentation and marsh accretion (see the Appendix). For some of the less developed sites with extensive dikes protecting agricultural and other dry lands, the model was also run without the dikes in place to help inform decisions about removing dikes, which is already happening in some areas as part of coastal restoration efforts.
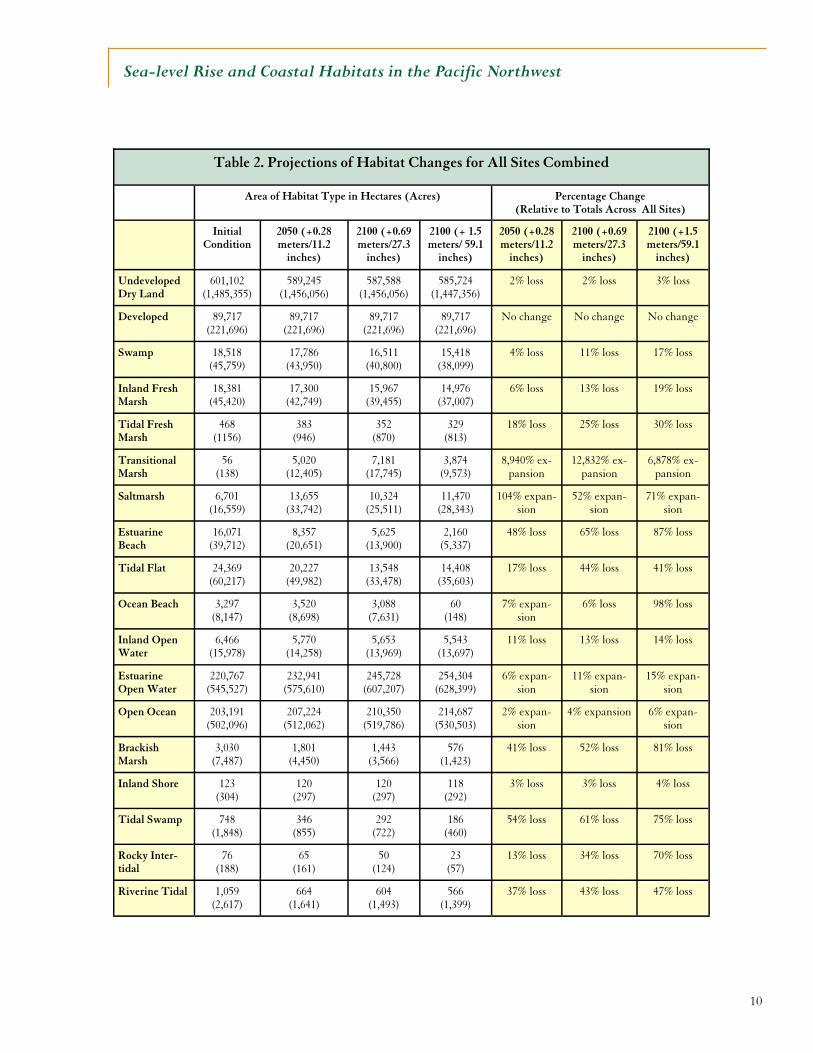
Nearshore habitats in the region are likely to face a dramatic shift in their composition due to
sea-level rise (see Table 2). Although there is considerable variability among different sites, the region’s coastal landscape is projected to change in significant ways as some habitat types are lost and others expand. Many freshwater marshes and swamps will be converted to saltmarshes or to transitional marshes that experience frequent saltwater inundation. At the same time, significant losses in estuarine beaches, tidal flats, and ocean beach are expected across all scenarios.
Furthermore, because all coastal habitats are biologically, chemically, and physically linked,
problems that affect even one habitat type is likely to affect the entire coastal system (Restore America’s Estuaries, 2002). For example, estuaries and bays that experience a net loss in coastal marsh habitat are more likely to face declining water quality because marshes play a critical role in regulating nutrients and filtering pollutants. Algal blooms and other problems associated with excess runoff of nutrients such as nitrogen and phosphorus in coastal waters can cause significant harm to seagrass beds and contribute to hypoxia (low oxygen) events. These and other ecosystem shifts will have major impacts on the overall food web and on individual species, such as Chinook salmon, in ways that are not yet completely understood.
Inundation of Freshwater Ecosystems with Saltwater As sea level rises, freshwater ecosystems will increasingly be vulnerable to saltwater intrusion and eventual conversion to saltwater ecosystems. Saltmarsh habitats are predicted to increase overall
9
Sea-level Rise and Coastal Habitats in the Pacific Northwest
under all scenarios run, due to the conversion of dry land and fresh marsh to saltmarsh. For a 27.3-inch increase in sea level, the area of swamp, and inland and tidal fresh marsh will decrease by over 4500 hectares (over 11,200 acres) across all the study sites. At the same time, the area of saltmarsh will increase by over 3600 hectares (over 9800 acres). Transitional marsh, which is shrub marsh that is now regularly inundated but has not yet converted fully into saltmarsh, will also expand by over 7100 hectares (over 19,500 acres).
Most coastal plant and animal species are adapted to different levels of salinity, so prolonged changes in salinity can make habitats more favorable for some species, less for others. Even those species that may not be directly sensitive to salinity may be affected if their food mainstays are affected. Because the various coastal habitats are all connected in one way or another, changes in their composition will no doubt have consequences for the coastal ecosystems of which they are a part.
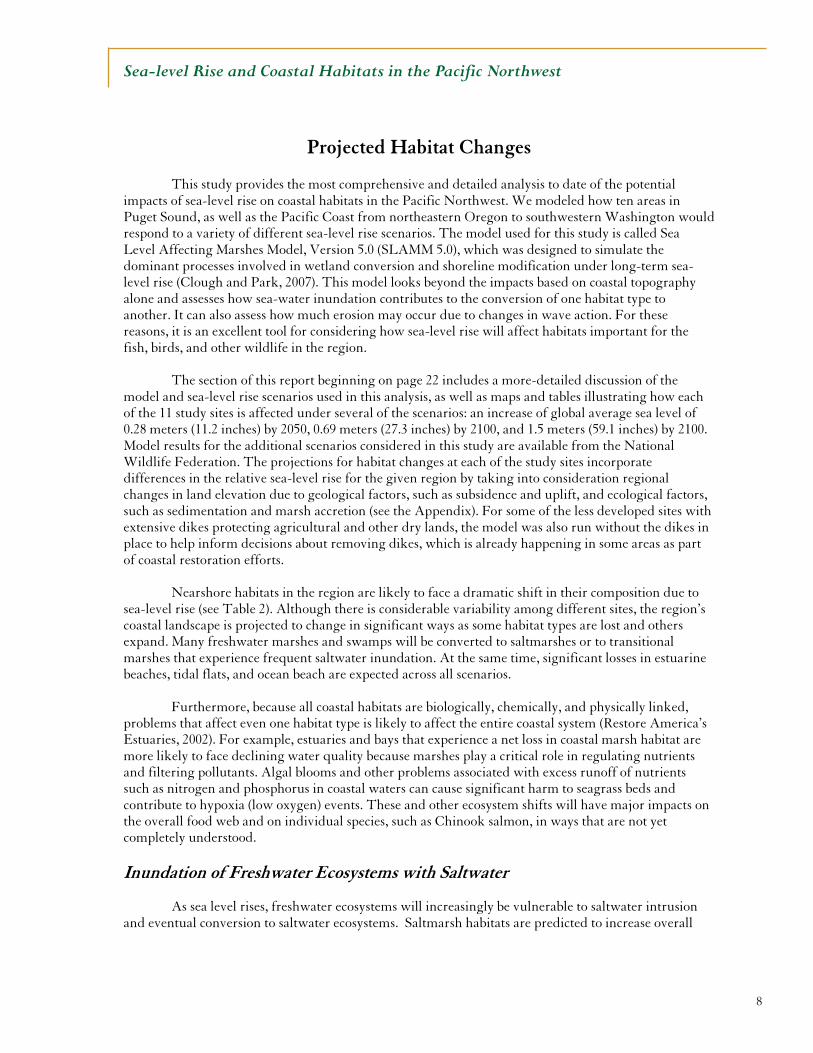
The Nisqually delta region, home to the Nisqually National Wildlife Refuge, is one place that is
especially susceptible to saltwater inundation, especially if the existing dike structures – some of which are protecting freshwater marsh habitat – are removed (see Figure 1). It is difficult to predict how this salt water intrusion would affect the salmon and other species that are important to the region. As dikes are already being removed to aid salmon recovery, it will be important to consider how the likely results of sea-level rise will affect these sorts of restoration and conservation efforts.
Loss of Beaches and Tidal Flats
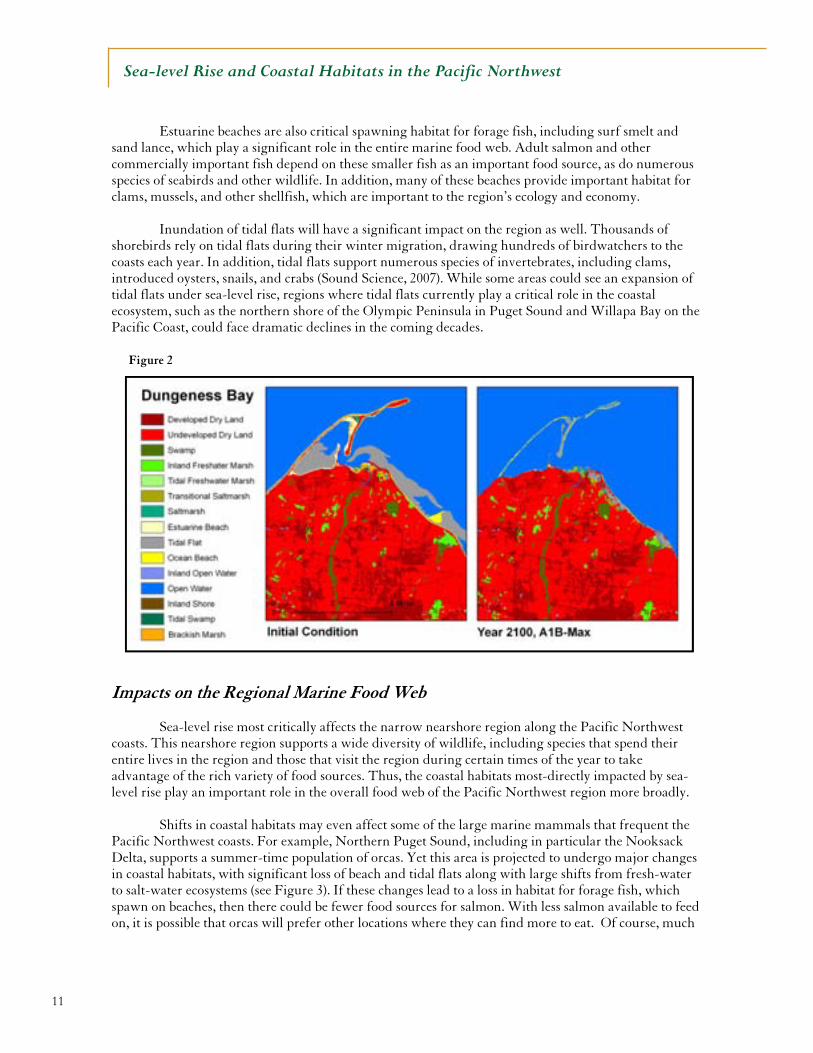
The beaches and tidal flats of the Pacific Northwest are especially vulnerable to rising sea-level over the next century. Under the 27.3-inch global average sea-level rise scenario, about 65 percent of estuarine beaches and 44 percent of tidal flats are lost across all study sites by 2100. In some locations, this will cause significant changes in the coastal landscape. For example, Dungeness Spit is predicted to be subject to inundation, erosion, and overwash due to storm events, leading to major losses of beach and tidal flat habitats (see Figure 2).
Figure 1
10
Sea-level Rise and Coastal Habitats in the Pacific Northwest
Table 2. Projections of Habitat Changes for All Sites Combined
Area of Habitat Type in Hectares (Acres)
Initial Condition
2050 (+0.28 meters/11.2
inches)
2100 (+0.69 meters/27.3
inches)
2100 (+ 1.5 meters/ 59.1
inches)
2050 (+0.28 meters/11.2
inches)
2100 (+0.69 meters/27.3
inches)
2100 (+1.5 meters/59.1
inches)
Undeveloped Dry Land
601,102 (1,485,355)
589,245 (1,456,056)
587,588 (1,456,056)
585,724 (1,447,356)
2% loss 2% loss 3% loss
Developed 89,717 (221,696)
89,717 (221,696)
89,717 (221,696)
89,717 (221,696)
No change No change No change
Swamp 18,518(45,759)
17,786 (43,950)
16,511 (40,800)
15,418 (38,099)
4% loss 11% loss 17% loss
Inland Fresh Marsh
18,381 (45,420)
17,300 (42,749)
15,967 (39,455)
14,976 (37,007)
6% loss 13% loss 19% loss
Tidal Fresh Marsh
468 (1156)
383 (946)
352 (870)
329 (813)
18% loss 25% loss 30% loss
Transitional Marsh
56 (138)
5,020 (12,405)
7,181 (17,745)
3,874 (9,573)
8,940% ex-pansion
12,832% ex-pansion
6,878% ex-pansion
Saltmarsh 6,701 (16,559)
13,655 (33,742)
10,324 (25,511)
11,470 (28,343)
104% expan-sion
52% expan-sion
71% expan-sion
Estuarine Beach
16,071 (39,712)
8,357 (20,651)
5,625 (13,900)
2,160 (5,337)
48% loss 65% loss 87% loss
Tidal Flat 24,369 (60,217)
20,227 (49,982)
13,548 (33,478)
14,408 (35,603)
17% loss 44% loss 41% loss
Ocean Beach 3,297 (8,147)
3,520 (8,698)
3,088 (7,631)
60 (148)
7% expan-sion
6% loss 98% loss
Inland Open Water
6,466 (15,978)
5,770 (14,258)
5,653 (13,969)
5,543 (13,697)
11% loss 13% loss 14% loss
Estuarine Open Water
220,767 (545,527)
232,941 (575,610)
245,728 (607,207)
254,304 (628,399)
6% expan-sion
11% expan-sion
15% expan-sion
Open Ocean 203,191 (502,096)
207,224 (512,062)
210,350 (519,786)
214,687 (530,503)
2% expan-sion
4% expansion 6% expan-sion
Brackish Marsh
3,030 (7,487)
1,801 (4,450)
1,443 (3,566)
576 (1,423)
41% loss 52% loss 81% loss
Inland Shore 123 (304)
120 (297)
120 (297)
118 (292)
3% loss 3% loss 4% loss
Tidal Swamp 748 (1,848)
346 (855)
292 (722)
186 (460)
54% loss 61% loss 75% loss
Rocky Inter-tidal
76 (188)
65 (161)
50 (124)
23 (57)
13% loss 34% loss 70% loss
Riverine Tidal 1,059 (2,617)
664 (1,641)
604 (1,493)
566 (1,399)
37% loss 43% loss 47% loss
Percentage Change (Relative to Totals Across All Sites)
11
Sea-level Rise and Coastal Habitats in the Pacific Northwest
Estuarine beaches are also critical spawning habitat for forage fish, including surf smelt and sand lance, which play a significant role in the entire marine food web. Adult salmon and other commercially important fish depend on these smaller fish as an important food source, as do numerous species of seabirds and other wildlife. In addition, many of these beaches provide important habitat for clams, mussels, and other shellfish, which are important to the region’s ecology and economy.
Inundation of tidal flats will have a significant impact on the region as well. Thousands of shorebirds rely on tidal flats during their winter migration, drawing hundreds of birdwatchers to the coasts each year. In addition, tidal flats support numerous species of invertebrates, including clams, introduced oysters, snails, and crabs (Sound Science, 2007). While some areas could see an expansion of tidal flats under sea-level rise, regions where tidal flats currently play a critical role in the coastal ecosystem, such as the northern shore of the Olympic Peninsula in Puget Sound and Willapa Bay on the Pacific Coast, could face dramatic declines in the coming decades.
Impacts on the Regional Marine Food Web
Sea-level rise most critically affects the narrow nearshore region along the Pacific Northwest coasts. This nearshore region supports a wide diversity of wildlife, including species that spend their entire lives in the region and those that visit the region during certain times of the year to take advantage of the rich variety of food sources. Thus, the coastal habitats most-directly impacted by sea-level rise play an important role in the overall food web of the Pacific Northwest region more broadly.
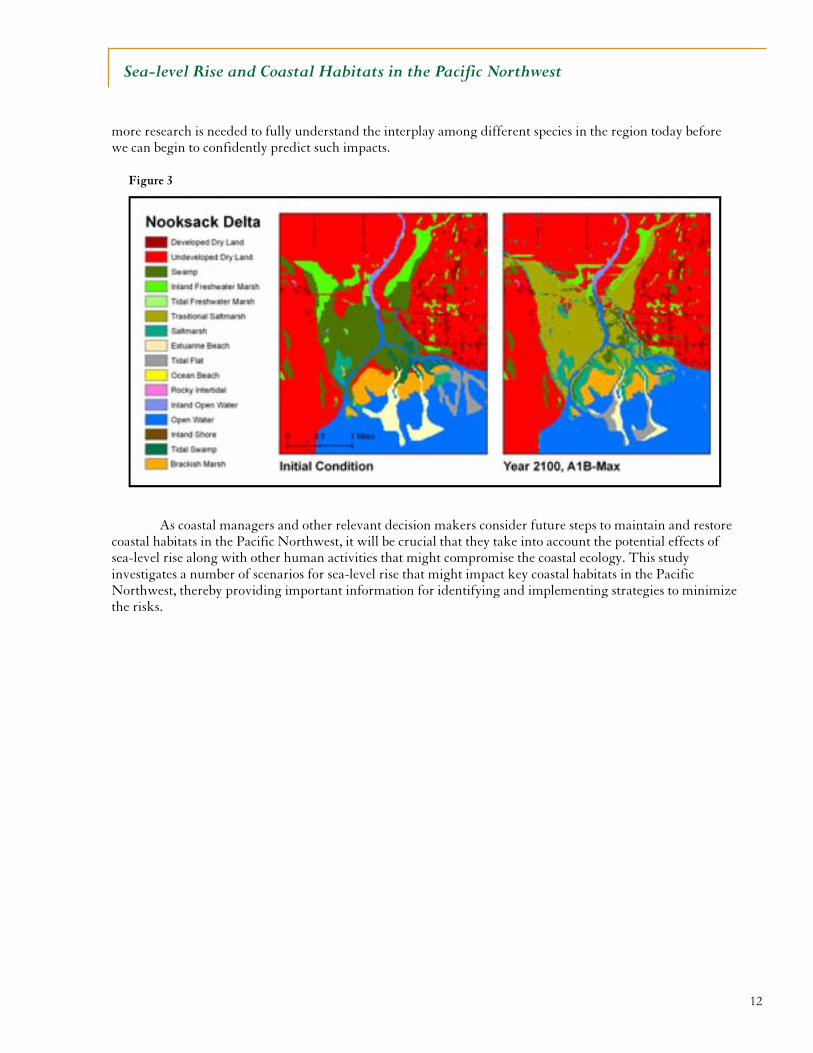
Shifts in coastal habitats may even affect some of the large marine mammals that frequent the
Pacific Northwest coasts. For example, Northern Puget Sound, including in particular the Nooksack Delta, supports a summer-time population of orcas. Yet this area is projected to undergo major changes in coastal habitats, with significant loss of beach and tidal flats along with large shifts from fresh-water to salt-water ecosystems (see Figure 3). If these changes lead to a loss in habitat for forage fish, which spawn on beaches, then there could be fewer food sources for salmon. With less salmon available to feed on, it is possible that orcas will prefer other locations where they can find more to eat. Of course, much
Figure 2
12
Sea-level Rise and Coastal Habitats in the Pacific Northwest
more research is needed to fully understand the interplay among different species in the region today before we can begin to confidently predict such impacts.
As coastal managers and other relevant decision makers consider future steps to maintain and restore
coastal habitats in the Pacific Northwest, it will be crucial that they take into account the potential effects of sea-level rise along with other human activities that might compromise the coastal ecology. This study investigates a number of scenarios for sea-level rise that might impact key coastal habitats in the Pacific Northwest, thereby providing important information for identifying and implementing strategies to minimize the risks.
Figure 3
13
Sea-level Rise and Coastal Habitats in the Pacific Northwest
Fish and Wildlife Species at Risk Changes in the Pacific Northwest’s coastal habitats due to sea-level rise will no doubt have a significant impact on the fish and wildlife species they support, although considerably more research is needed in the region to better understand the specific effects of climate change and sea-level rise on estuarine habitats, ecosystems, and species. Translating the potential habitat changes into impacts on specific species is difficult, as there are many combined factors at play. However, it is reasonable to develop a general sense of those species that are particularly vulnerable given their relative dependence on the most-threatened habitats. The following overview of species at risk is by no means comprehensive, nor is it a “prediction” of what is to come; but it does signify the extent to which sea-level rise could affect the region’s ecology.
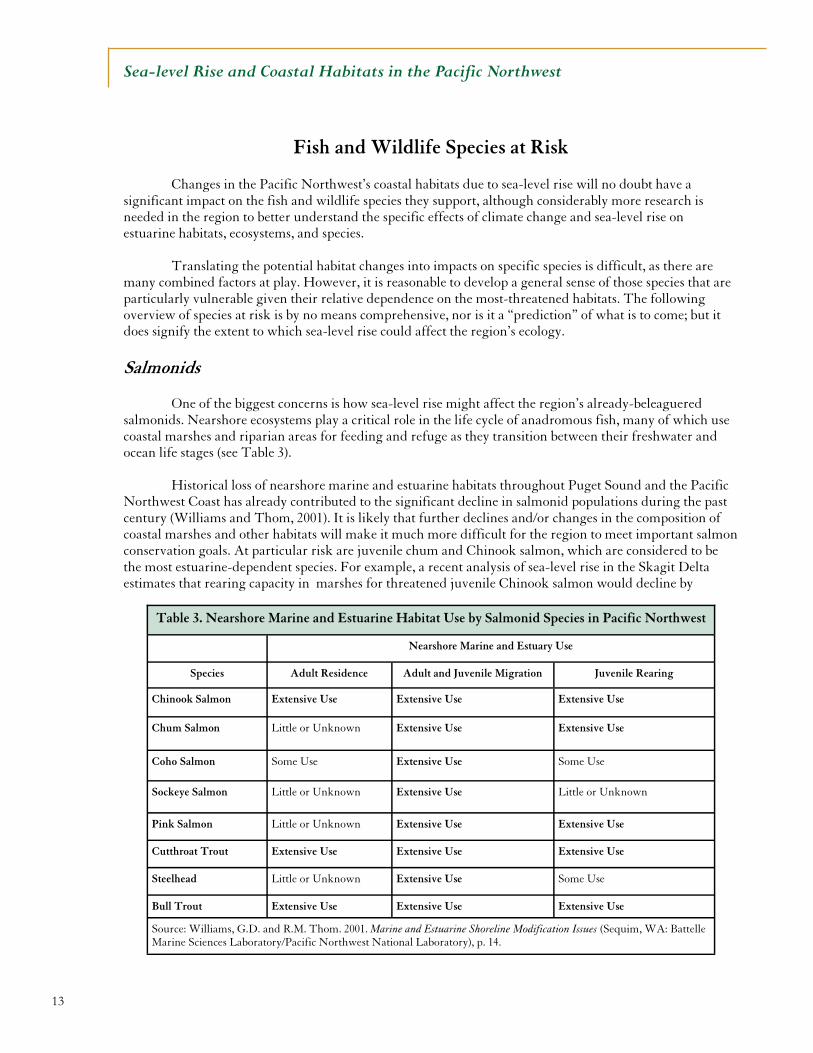
Salmonids One of the biggest concerns is how sea-level rise might affect the region’s already-beleaguered salmonids. Nearshore ecosystems play a critical role in the life cycle of anadromous fish, many of which use coastal marshes and riparian areas for feeding and refuge as they transition between their freshwater and ocean life stages (see Table 3). Historical loss of nearshore marine and estuarine habitats throughout Puget Sound and the Pacific Northwest Coast has already contributed to the significant decline in salmonid populations during the past century (Williams and Thom, 2001). It is likely that further declines and/or changes in the composition of coastal marshes and other habitats will make it much more difficult for the region to meet important salmon conservation goals. At particular risk are juvenile chum and Chinook salmon, which are considered to be the most estuarine-dependent species. For example, a recent analysis of sea-level rise in the Skagit Delta estimates that rearing capacity in marshes for threatened juvenile Chinook salmon would decline by
Table 3. Nearshore Marine and Estuarine Habitat Use by Salmonid Species in Pacific Northwest
Nearshore Marine and Estuary Use
Species Adult Residence Adult and Juvenile Migration Juvenile Rearing
Chinook Salmon Extensive Use Extensive Use Extensive Use
Chum Salmon Little or Unknown Extensive Use Extensive Use
Coho Salmon Some Use Extensive Use Some Use
Sockeye Salmon Little or Unknown Extensive Use Little or Unknown
Pink Salmon Little or Unknown Extensive Use Extensive Use
Cutthroat Trout Extensive Use Extensive Use Extensive Use
Steelhead Little or Unknown Extensive Use Some Use
Bull Trout Extensive Use Extensive Use Extensive Use
Source: Williams, G.D. and R.M. Thom. 2001. Marine and Estuarine Shoreline Modification Issues (Sequim, WA: Battelle Marine Sciences Laboratory/Pacific Northwest National Laboratory), p. 14.
14
Sea-level Rise and Coastal Habitats in the Pacific Northwest
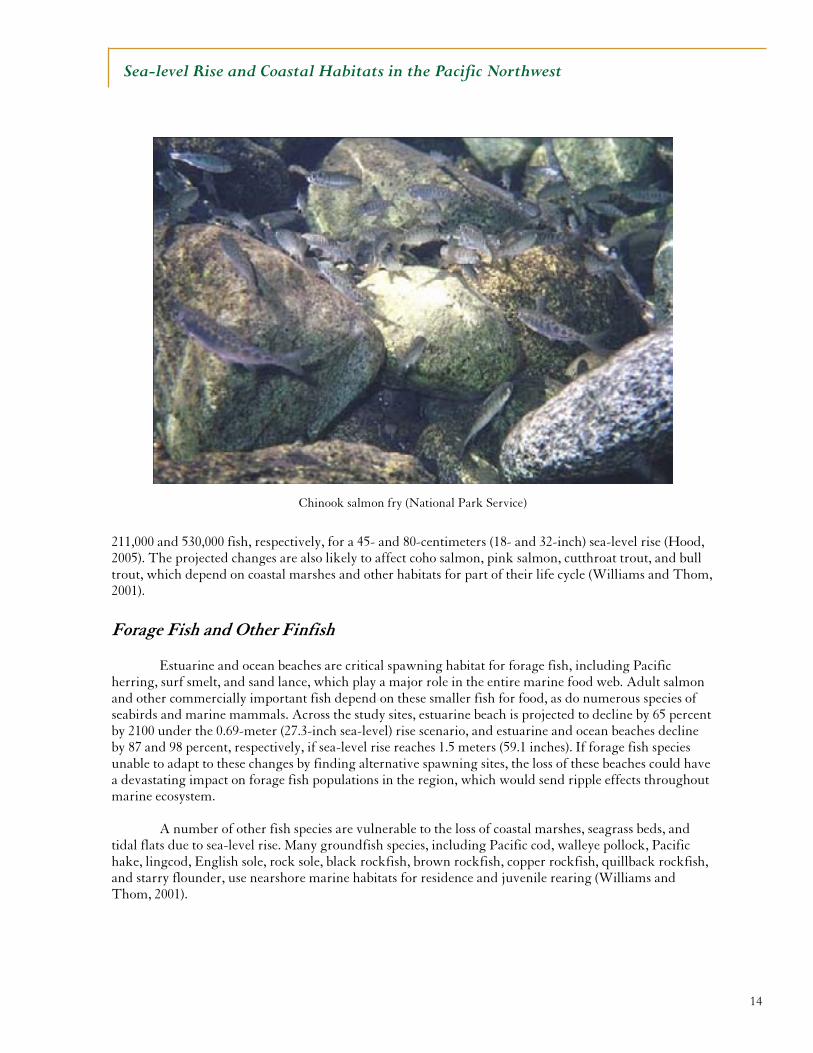
211,000 and 530,000 fish, respectively, for a 45- and 80-centimeters (18- and 32-inch) sea-level rise (Hood, 2005). The projected changes are also likely to affect coho salmon, pink salmon, cutthroat trout, and bull trout, which depend on coastal marshes and other habitats for part of their life cycle (Williams and Thom, 2001).
Forage Fish and Other Finfish Estuarine and ocean beaches are critical spawning habitat for forage fish, including Pacific herring, surf smelt, and sand lance, which play a major role in the entire marine food web. Adult salmon and other commercially important fish depend on these smaller fish for food, as do numerous species of seabirds and marine mammals. Across the study sites, estuarine beach is projected to decline by 65 percent by 2100 under the 0.69-meter (27.3-inch sea-level) rise scenario, and estuarine and ocean beaches decline by 87 and 98 percent, respectively, if sea-level rise reaches 1.5 meters (59.1 inches). If forage fish species unable to adapt to these changes by finding alternative spawning sites, the loss of these beaches could have a devastating impact on forage fish populations in the region, which would send ripple effects throughout marine ecosystem. A number of other fish species are vulnerable to the loss of coastal marshes, seagrass beds, and tidal flats due to sea-level rise. Many groundfish species, including Pacific cod, walleye pollock, Pacific hake, lingcod, English sole, rock sole, black rockfish, brown rockfish, copper rockfish, quillback rockfish, and starry flounder, use nearshore marine habitats for residence and juvenile rearing (Williams and Thom, 2001).
Chinook salmon fry (National Park Service)
15
Sea-level Rise and Coastal Habitats in the Pacific Northwest
Shellfish The Pacific Northwest’s coasts are home to a highly diverse array of native shellfish, including crabs, clams, oysters, mussels, shrimp, and abalone, which are important to the region’s economy and ecology (Dethier, 2006). Shellfish rely on a number of different coastal habitat types throughout the region, particularly in the low- and mid-intertidal zone protected bays and estuaries. Direct loss of beaches and tidal flats in some areas will likely have a significant impact on intertidal species such as littleneck clams, geoduck clams, butter clams, and Olympia oysters. Changes in habitat composition in the region’s estuaries may also contribute to a reduction in populations of Dungeness crabs, which depend on estuaries as nurseries.
Waterfowl/Seabirds
Changes in the extent and composition of marshes, beaches, and other estuarine and nearshore habitats are likely to have a significant impact on the region’s wintering waterfowl populations. The Pacific Northwest’s coasts support hundreds of thousands of migrating and wintering ducks, geese, and swans. According to the U.S. Fish & Wildlife Service (FWS), Tillamook Bay alone supports almost 25 percent of the northern- and central-coast wintering waterfowl population in Oregon (FWS, 2007). This area is projected to lose up to 500 hectares (1,235 acres) of inland fresh marsh and more than 4,100 hectares (10,131 acres) of estuarine beach by 2100 under the 0.69-meter (27.3-inch) sea-level rise scenario. The region’s diving ducks, including canvasbacks, greater and lesser scaup, goldeneyes, and bufflehead, are considered to be especially vulnerable to reductions in habitat quality due to sea-level rise and other global warming impacts (Inkley, et al., 2004).
Loss of tidal flats in some areas would also affect dabbling ducks and geese that use those habitats,
including gadwalls, American wigeon, mallards, northern pintails, green-winged teal, snow geese, and brant (Buchanan, 2006). In addition, reductions in forage fish and other food sources in the region due to sea-level rise could have a major impact on many seabirds, including surf scoters, common murres, pigeon guillemots, marbled murrelets, Caspian terns, rhinoceros auklets, and brown pelicans.
Shorebirds Inundation of tidal flats, sand beaches, and rocky shoreline could cause a dramatic decline in
populations of shorebirds that rely on these areas during their winter migration. While some areas are expected to see an expansion of tidal flats under sea-level rise, areas where tidal flats currently play a critical role in the coastal ecosystem, such as the northern shore of the Olympic Peninsula, Skagit Bay, Port Susan, and Padilla Bay in Puget Sound, and Willapa Bay and the Columbia River estuary on the Pacific Coast, are projected to face a significant reduction in important shorebird habitat in the coming decades (Drut and Buchanan, 2000). Some shorebird species at risk include dunlin, least sandpipers, western sandpipers, western snowy plovers, black-bellied plovers, killdeer, short– and long-billed dowitchers, red knots, sanderlings, greater yellowlegs, whimbrels, and black turnstones.
Marine Mammals
Many marine mammals in the Pacific Northwest are likely to be affected by sea-level rise both directly, through lost habitat, and indirectly, through reductions in important food sources. In particular, the loss of estuarine and ocean beaches would reduce important haul-out and pupping areas for harbor seals in Puget Sound. In addition, if sea-level rise contributes to significant declines in salmon, forage fish, and other critical foods, it could have a major impact on a number of marine mammals in the region, including otters, orcas, minke whales, and sea lions.
16
Sea-level Rise and Coastal Habitats in the Pacific Northwest
Additional Climate and Non-climate Stressors Complicating matters is the fact that sea-level rise is not the only consequence of global warming
that will affect the Pacific Northwest. The Climate Impacts Group at the University of Washington (Snover, 2005) has identified a number of other climate changes for the region that could have a significant impact on coastal habitats. For example:
• Decreased snowpack and earlier snowmelt are expected to contribute to lower summer streamflows, higher winter streamflows, and a change in the timing and extent of freshwater inputs into marine waters.
• An increase in the percentage of winter precipitation falling as rain rather than snow is likely to increase flooding in Puget Sound watersheds.
• Higher average water temperatures and changes in water and soil salinity could change the mix of plant species in coastal marshes and the viability of invertebrates that play a key role in the health of the marsh systems. Temperature-driven shifts in plankton could ripple throughout the food web, changing the composition of invertebrates, fish, and mammal communities.
• Increased algal productivity in surface waters and changes in coastal upwelling due to warmer ocean temperatures could exacerbate hypoxia events and lead to more-intense dead-zones off the Washington and Oregon coasts.
While it is beyond the scope of this study to address how these and other additional changes might affect coastal habitats and the fish and wildlife that depend on them, there is no question that they will have a profound impact on the region.
Moreover, these impacts will be experienced at the same time as the numerous other stressors that
threaten the region’s coastal resources as the human population grows. Without meaningful action to address these multiple threats the future of the region’s coastal habitats, the fish and wildlife they support, and the livelihoods and quality of life of the people who depend on them will be dramatically and irretrievably different from what they are today.
17
Sea-level Rise and Coastal Habitats in the Pacific Northwest
IMPLICATIONS FOR COASTAL MANAGEMENT AND RESTORATION
The year 2100 may seem like a long way off, but the reality is that we are making decisions
today that will ultimately affect our natural resources, land use, and even our climate well beyond that time. Fortunately, we also have an opportunity to anticipate, minimize, and sometimes prevent some serious problems in the future – including those related to global warming – by taking a longer-term, more comprehensive approach to managing our resources today (Bauman, et al., 2006). In devising strategies that balance competing demands for coastal resources now and in the future, relevant decision makers must consider how numerous factors will influence coastal habitats, water resources, and infrastructure. Effective coastal management requires the integration of diverse information, from projected climate change and ecological impacts to expected regional population growth and future development patterns. Recent advances in scientific understanding of the regional and localized consequences of global warming and the vulnerability of species and ecosystems will go far in helping people develop and promote appropriate solutions. By examining the intersection of two important pieces of the coastal management puzzle – sea-level rise and critical coastal habitats – this study provides resource managers and other relevant decision makers with much-needed information. The model results illustrating likely habitat conversions under probable sea-level rise scenarios can help individuals assess the risks to specific localities and identify reasonable steps to manage these risks. The appropriate response strategies will vary from region to region, taking into account results from this study along with other studies to identify more localized impacts of sea-level rise and examine the impacts of additional stressors on coastal resources.
Changing the Forecast for Coastal Habitats: A Plan of Action The most important action the region and nation must take to prevent the possibly overwhelming loss of fish and wildlife due to global warming is to reduce greenhouse gas emissions (see Box 2). However, there will be some more warming in the next century due to the greenhouse gases that are already in the atmosphere along with those that will inevitably be emitted in the next few decades as we transition to new greener technologies.
The unavoidable warming of the next century will have a significant impact on fish and wildlife, making it necessary to develop adaptation strategies to help species cope with those changes that are inevitable, including some sea-level rise, as well as to build in the flexibility to deal with some significant impacts that may be unforeseen. In particular, it will be critical to account for global warming in habitat restoration efforts, explicitly consider climate-related uncertainties in coastal management, and anticipate sea-level rise when planning for coastal development. The National Wildlife Federation recommends consideration of the following general principles for coastal management given the threat of sea-level rise:
18
Sea-level Rise and Coastal Habitats in the Pacific Northwest
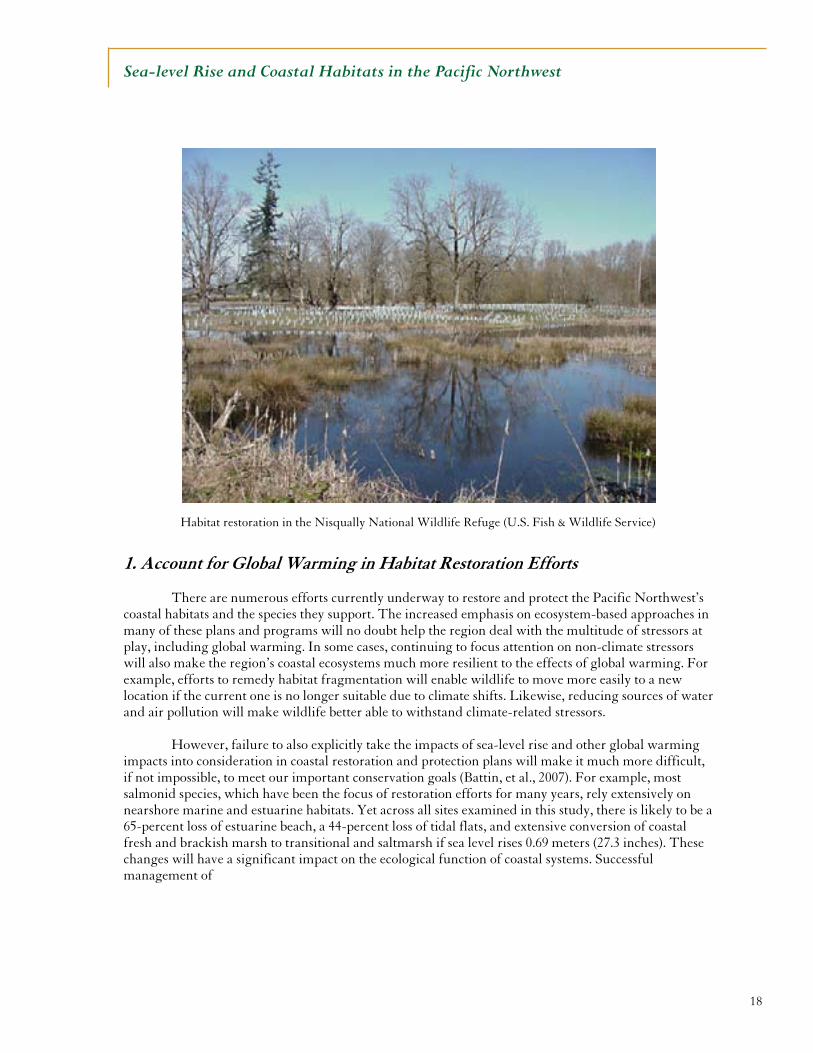
1. Account for Global Warming in Habitat Restoration Efforts There are numerous efforts currently underway to restore and protect the Pacific Northwest’s coastal habitats and the species they support. The increased emphasis on ecosystem-based approaches in many of these plans and programs will no doubt help the region deal with the multitude of stressors at play, including global warming. In some cases, continuing to focus attention on non-climate stressors will also make the region’s coastal ecosystems much more resilient to the effects of global warming. For example, efforts to remedy habitat fragmentation will enable wildlife to move more easily to a new location if the current one is no longer suitable due to climate shifts. Likewise, reducing sources of water and air pollution will make wildlife better able to withstand climate-related stressors. However, failure to also explicitly take the impacts of sea-level rise and other global warming impacts into consideration in coastal restoration and protection plans will make it much more difficult, if not impossible, to meet our important conservation goals (Battin, et al., 2007). For example, most salmonid species, which have been the focus of restoration efforts for many years, rely extensively on nearshore marine and estuarine habitats. Yet across all sites examined in this study, there is likely to be a 65-percent loss of estuarine beach, a 44-percent loss of tidal flats, and extensive conversion of coastal fresh and brackish marsh to transitional and saltmarsh if sea level rises 0.69 meters (27.3 inches). These changes will have a significant impact on the ecological function of coastal systems. Successful management of
Habitat restoration in the Nisqually National Wildlife Refuge (U.S. Fish & Wildlife Service)
19
Sea-level Rise and Coastal Habitats in the Pacific Northwest
Box 2. Minimizing the Threat: The Importance of Reducing Greenhouse Gas Emissions
Scientists are optimistic that the impacts of global warming can be lessened if significant ac-tion is taken within the next few decades to reduce the emissions of CO2 and other greenhouse gases to stabilize their concentrations in the earth’s atmosphere (IPCC, 2007b). However, it is important that we take meaningful steps to reduce global warming pollution as soon as possible. Once released, CO2 stays in the atmosphere for decades, and the more that its concentration builds up, the more global warming will occur. There is also a growing concern that the planet may well be nearing a tipping point in terms of the levels of greenhouse gases in the atmosphere, which will lead to extensive and irreparable changes to the planet’s climate system (Hansen, 2004). Furthermore, without strong policy signals soon, we are likely to see significant additional investments in carbon-intensive infrastructure, which will make it much less likely that we will be able to meet this stabilization goal in the decades to come. Scientists suggest that the worst-case scenario can only be avoided if we are able to keep addi-tional warming to less than 2 degrees Celsius (3.6 degrees Fahrenheit) above pre-industrial levels (Hansen, 2004; O’Neill and Oppenheimer, 2002). To date, temperatures have already increased by 0.7 degrees Celsius (1.3 degrees Fahrenheit). According to the latest assessment by the IPCC, keeping global warming to within 2 degrees Celsius (3.6 degrees Fahrenheit) would require stabilizing the con-centration of greenhouse gases in the atmosphere at 445-490 parts per million (ppm) of CO2 equivalent (IPCC, 2007b). To reach this level, the growth in global greenhouse gas emissions will need to be halted within the next ten years and overall emissions cut by 50-85 percent below current levels within the next 50 years. For industrialized nations, particularly the United States, this will mean a reduction of 80 percent by mid-century, followed by further reductions toward zero by 2100. Fortunately, the IPCC confirms that this target can be achieved “by deployment of a portfolio of technologies that are currently available and those that are expected to be commercialized in coming decades” (IPCC, 2007b, p. 25). If we start today, the United States can meet the goal of 80-percent re-ductions by 2050 by cutting our global warming pollution just 2 percent per year, but it will require significant policy action. An effective federal plan of action is needed to fundamentally shift the na-tion’s energy priorities to provide incentives for investments in energy efficiency and cleaner, renew-able energy technologies. The plan should include:
• Placing mandatory limits on the nation’s global warming pollution.
• Making bold investments in clean and efficient energy technologies and phasing out coal and oil subsidies.
• Enacting new standards that provide incentives for renewable energy sources.
• Encouraging market-based solutions. There are also a number of local, state, and regional actions that will make a difference. Washington and Oregon are taking an important step by setting goals to significantly reduce their greenhouse gas emissions within the next few decades and engaging with other western states to de-velop a regional climate change mitigation strategy. These actions establish an important foundation on which to build a meaningful strategy at the federal level.
20
Sea-level Rise and Coastal Habitats in the Pacific Northwest
the salmonid populations will clearly require a careful assessment of the impacts of sea-level rise and other climate changes. There are several things that restoration project managers should consider to improve the resiliency of habitats to withstand some sea-level rise, including:
• Prioritizing project sites based on ecological importance as well as vulnerability to sea-level rise.
• Expanding the area of restoration to accommodate for habitat migration.
• Restoring a diverse array of habitat types to better support ecosystem functions and improve the resiliency of fish and wildlife species.
• Considering upstream stressors that may affect sedimentation rates and other factors that affect how estuarine habitats respond to sea-level rise.
2. Explicitly Consider Climate Uncertainties By its very nature, there will always be a degree of uncertainty about how, when, and where global warming will affect natural systems. Increased monitoring and research on the known and potential impacts on species and habitats will help close the gap in knowledge, but we will never know exactly when and where we will experience the impacts. That does not mean we shouldn’t act. Rather, the very fact that there is risk – and the potential for global warming to lead to irreversible damages, such as the extinction of species – necessitates precautionary action. It is prudent to consider actions we can take now that will reduce our vulnerability as well as how to incorporate useful measures of uncertainty into our decision making.
One way to think about dealing with the risks from sea-level rise is to address the problem in a way similar to how we respond to flood hazards (Canning, 2001). When relatively little is at stake in the way of infrastructure investment, public inconvenience, or risk, we could choose to design for a conservative or low-end sea-level rise scenario. Where more is at stake, such as the decimation of habitats critical to the region’s ecological and economic well-being, we should design for a mid-range or aggressive sea-level rise scenario. It may also be possible to hedge against significant losses by creating coastal habitat buffers and restoring a diversity of habitat types – much like one would diversify an investment portfolio (Hood, 2005).
3. Incorporate Sea-level Rise in Coastal Development Plans Sea-level rise should be a major consideration in future coastal development plans, both in terms of the impacts on habitats and those on human settlements. The model simulations in this study can usefully inform decisions about coastal development. For example, by comparing the impacts of sea-level rise on habitats with and without dikes, it is possible to make a more informed decision about future shoreline protection strategies. Indeed, removing the dikes from the four sites tested in this study allows greater expansion of tidal flats at these sites. On the other hand, elimination of dikes allows significantly greater inundation of dry land. These are tradeoffs that coastal managers will need to consider. Many other steps can be taken to anticipate sea-level rise when planning for coastal development. A recent conference organized by King County, Washington, brought together government officials, business and tribal leaders, scientists, farmers, non-governmental organizations, and other relevant stakeholders from across the region, to engage in a dialogue about climate change impacts and ways in which different sectors can anticipate, mitigate, and adapt to those impacts (Kay,
21
Sea-level Rise and Coastal Habitats in the Pacific Northwest
2005). Participants in the Coastal Areas Breakout Session identified a number of possible strategies to protect coastal habitats and infrastructure from sea-level rise, including:
• Discouraging development in coastal hazard areas.
• Moving or abandoning shoreline infrastructure.
• Preserving ecological buffers to allow inland habitat migration.
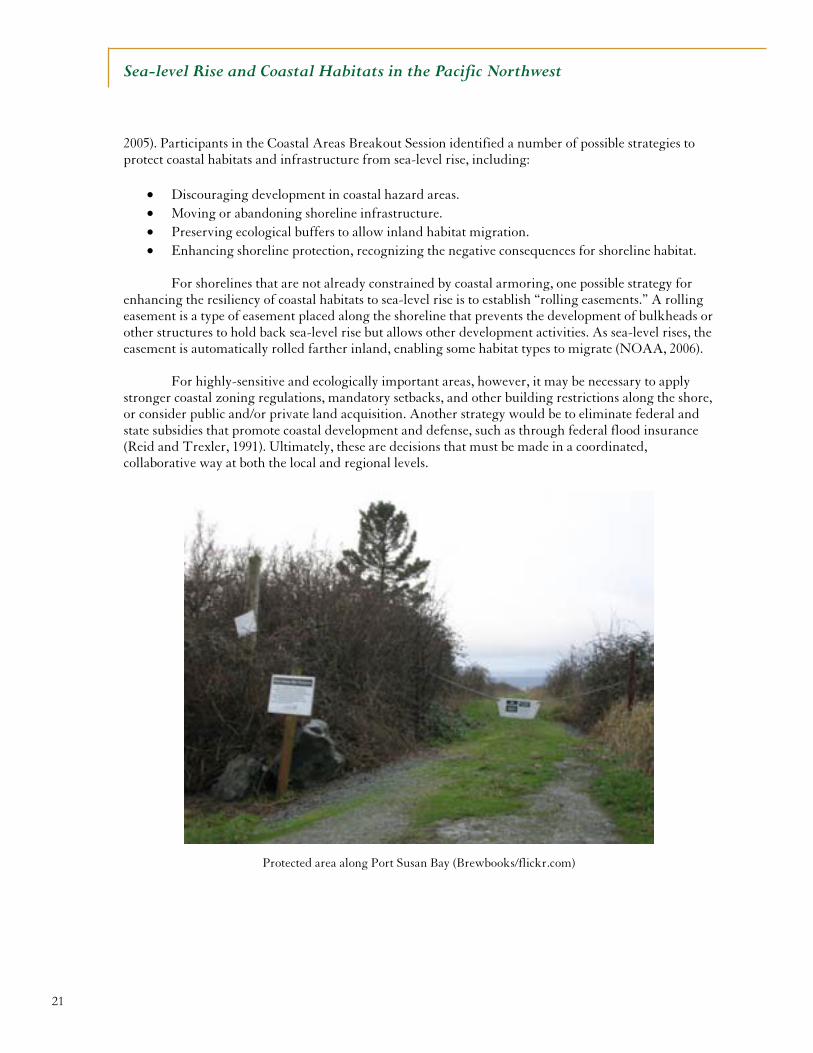
• Enhancing shoreline protection, recognizing the negative consequences for shoreline habitat. For shorelines that are not already constrained by coastal armoring, one possible strategy for enhancing the resiliency of coastal habitats to sea-level rise is to establish “rolling easements.” A rolling easement is a type of easement placed along the shoreline that prevents the development of bulkheads or other structures to hold back sea-level rise but allows other development activities. As sea-level rises, the easement is automatically rolled farther inland, enabling some habitat types to migrate (NOAA, 2006). For highly-sensitive and ecologically important areas, however, it may be necessary to apply stronger coastal zoning regulations, mandatory setbacks, and other building restrictions along the shore, or consider public and/or private land acquisition. Another strategy would be to eliminate federal and state subsidies that promote coastal development and defense, such as through federal flood insurance (Reid and Trexler, 1991). Ultimately, these are decisions that must be made in a coordinated, collaborative way at both the local and regional levels.
Protected area along Port Susan Bay (Brewbooks/flickr.com)
22
Sea-level Rise and Coastal Habitats in the Pacific Northwest
MODEL DESCRIPTION AND DETAILED RESULTS
The National Wildlife Federation engaged sea-level rise modeling expert Jonathan Clough, of
Warren Pinnacle Consulting, Inc., to simulate how sea-level rise during this century would affect coastal habitats in ten areas in Puget Sound as well as the Pacific Coast from northeastern Oregon to southwestern Washington (see Figures 4 and 5). While there have been several past studies of sea-level rise in the Pacific Northwest (see, for example, Shipman, 1989; Park, Lee and Canning, 1993; Craig, 1993; Galbraith, et al., 2005; and Hood, 2005), this study provides the most comprehensive and detailed analysis to date of the potential impacts of sea-level rise on the region’s coastal habitats.
Project Background
The model used for this analysis is called Sea Level Affecting Marshes Model, Version 5.0 (SLAMM 5.0), which was designed to simulate the dominant processes involved in wetland conversion and shoreline modification under long-term sea-level rise. The model integrates information about projected global sea-level rise with area-specific NOAA tidal data, detailed wetland information from the FWS National Wetlands Inventory, regional Light-imaging Detection and Ranging (LiDAR) data, and U.S. Geological Survey (USGS) Digital Elevation Maps to project habitat changes associated with sea-level rise. Table 5 lists the coastal habitats included in the model.
This model provides greater detail than by just looking at static coastal topography alone. For
example, it can assess the extent to which sea water inundation contributes to the conversion of one habitat type to another based on elevation, habitat type, slope, sedimentation and accretion and erosion rates, and the extent to which the affected area is protected by existing sea walls. It can also assess how much erosion may occur due to changes in wave action.
In addition, SLAMM 5.0 accounts for relative sea-level change for each study site. Relative sea-
level rise is calculated as the sum of the historic eustatic (global average) trend, the site specific rate of change of coastal elevation due to subsidence and isostatic adjustment, and the accelerated rise, depending on the future scenario chosen. Sea-level rise is also offset by sedimentation and accretion, again using site specific average values.
Model Summary
A thorough accounting of how SLAMM 5.0 works and the underlying assumptions and equations is available in the SLAMM 5.0 Technical Documentation (Clough and Park, 2007). Within SLAMM 5.0, five primary processes can affect wetland fate under different scenarios of sea level rise:
• Inundation: The rise of water levels and the salt boundary are tracked by reducing elevations of each modeled area as sea levels rise, thus keeping mean tide level (MTL) constant at zero. The effects on each cell are calculated based on the minimum elevation and slope of that cell [cell size is 30 meters (98
feet) by 30 meters for this study].
23
Sea-level Rise and Coastal Habitats in the Pacific Northwest
• Erosion: Erosion is triggered based on a threshold of maximum fetch (the distance a wave travels) and the proximity of the marsh to estuarine water or open ocean. When these conditions are met, horizontal erosion occurs at a rate
based on site-specific parameters.
• Overwash: Barrier islands of under 500 meters (1,640 feet) width are assumed to undergo overwash (the process by which sediments are carried over the crest of the barrier and deposited onto adjacent wetlands) during each 25-year time-step due to storms. Beach migration and transport of sediments
are calculated.
• Saturation: Coastal swamps and fresh marshes can migrate onto adjacent uplands if the
water table is affected by rising sea level close to the coast.
• Salinity: In a defined estuary, the effects of salinity progression up an estuary and the resultant effects on marsh type may be tracked. This optional submodel assumes an estuarine salt wedge and calculates the influence of the freshwater head vs. the saltwater head in a particular cell. (The salinity
feature was not used in the Puget Sound/Pacific Coast modeling.)
The SLAMM 5.0 model incorporates a simplifying assumption that all currently-developed
areas will remain protected by seawalls and other coastal armoring, so it does not project inundation of existing urban areas. This does not mean, however, that low-lying urban areas, such as parts of Olympia and Tacoma, are not also vulnerable to sea-level rise, only that the potential impacts are not captured here. For example, a 1993 study conducted for the City of Olympia, portions of which have been built on fill just a few feet above sea level, projected significant tidal flooding and inundation in the downtown area under a scenario of 4-foot relative sea-level rise by 2100 (Craig, 1993). While it is beyond the scope of this study to address impacts on the region’s vulnerable developed areas, the potential for sea-level rise to cause significant and costly damage to property and infrastructure should not be ignored.
In our initial model runs, we also assumed that agricultural areas and other dry land currently protected by dikes will remain protected. Because some of these dikes are being removed to assist in habitat restoration, however, we thought it would be useful to see how sea-level rise might affect the region’s coastal areas if the dikes were not there. So we conducted some simulations with no dikes protecting agricultural areas. Not surprisingly, there is a considerably greater loss of dry land at all of the modeled sites if the dikes are removed, although in several areas there is also greater expansion of some habitat types, such as saltmarsh and tidal flats.
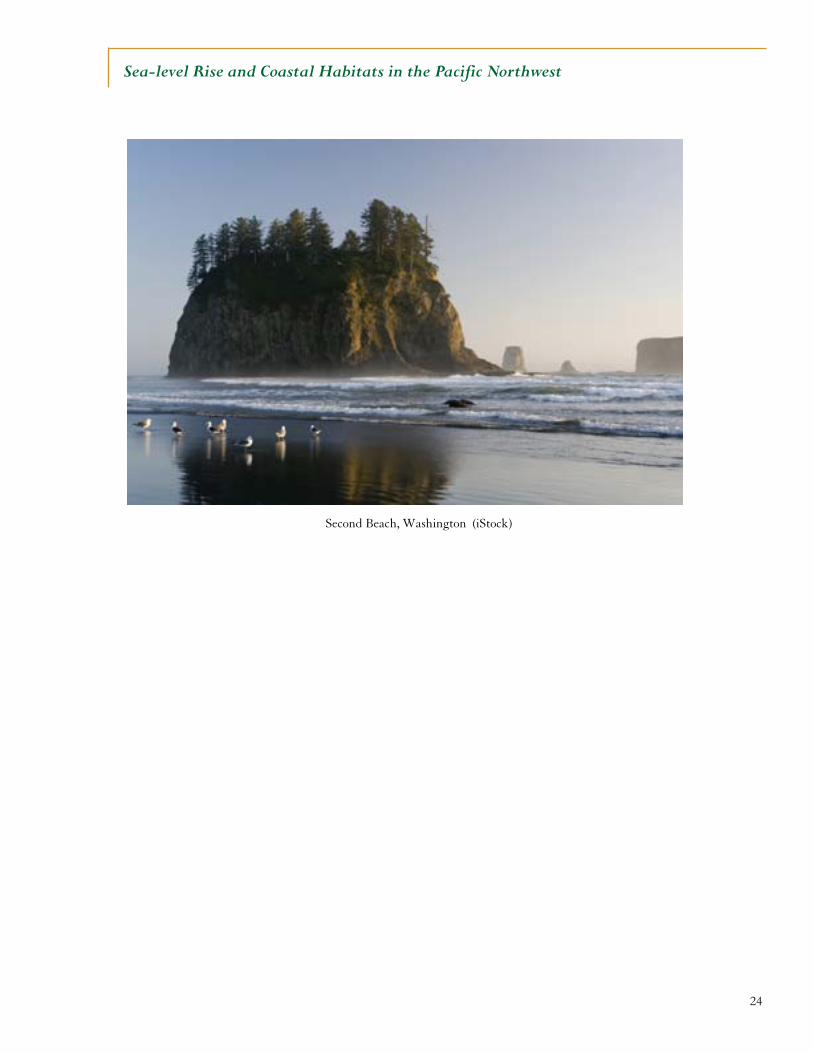
24
Sea-level Rise and Coastal Habitats in the Pacific Northwest
Second Beach, Washington (iStock)
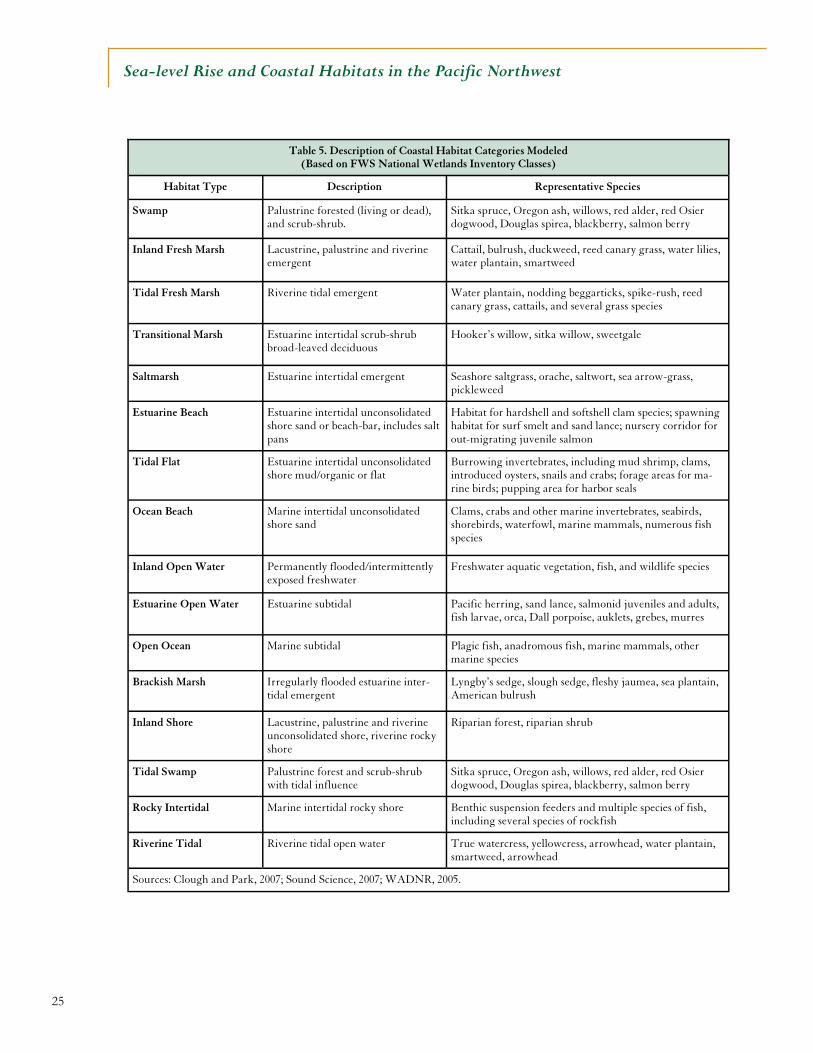
25
Sea-level Rise and Coastal Habitats in the Pacific Northwest
Table 5. Description of Coastal Habitat Categories Modeled (Based on FWS National Wetlands Inventory Classes)
Habitat Type Description Representative Species
Swamp Palustrine forested (living or dead), and scrub-shrub.
Sitka spruce, Oregon ash, willows, red alder, red Osier dogwood, Douglas spirea, blackberry, salmon berry
Inland Fresh Marsh Lacustrine, palustrine and riverine emergent
Cattail, bulrush, duckweed, reed canary grass, water lilies, water plantain, smartweed
Tidal Fresh Marsh Riverine tidal emergent Water plantain, nodding beggarticks, spike-rush, reed canary grass, cattails, and several grass species
Transitional Marsh Estuarine intertidal scrub-shrub broad-leaved deciduous
Hooker’s willow, sitka willow, sweetgale
Saltmarsh Estuarine intertidal emergent Seashore saltgrass, orache, saltwort, sea arrow-grass, pickleweed
Estuarine Beach Estuarine intertidal unconsolidated shore sand or beach-bar, includes salt pans
Habitat for hardshell and softshell clam species; spawning habitat for surf smelt and sand lance; nursery corridor for out-migrating juvenile salmon
Tidal Flat Estuarine intertidal unconsolidated shore mud/organic or flat
Burrowing invertebrates, including mud shrimp, clams, introduced oysters, snails and crabs; forage areas for ma-rine birds; pupping area for harbor seals
Ocean Beach Marine intertidal unconsolidated shore sand
Clams, crabs and other marine invertebrates, seabirds, shorebirds, waterfowl, marine mammals, numerous fish species
Inland Open Water Permanently flooded/intermittently exposed freshwater
Freshwater aquatic vegetation, fish, and wildlife species
Estuarine Open Water Estuarine subtidal Pacific herring, sand lance, salmonid juveniles and adults, fish larvae, orca, Dall porpoise, auklets, grebes, murres
Open Ocean Marine subtidal Plagic fish, anadromous fish, marine mammals, other marine species
Brackish Marsh Irregularly flooded estuarine inter-tidal emergent
Lyngby’s sedge, slough sedge, fleshy jaumea, sea plantain, American bulrush
Inland Shore Lacustrine, palustrine and riverine unconsolidated shore, riverine rocky shore
Riparian forest, riparian shrub
Tidal Swamp Palustrine forest and scrub-shrub with tidal influence
Sitka spruce, Oregon ash, willows, red alder, red Osier dogwood, Douglas spirea, blackberry, salmon berry
Rocky Intertidal Marine intertidal rocky shore Benthic suspension feeders and multiple species of fish, including several species of rockfish
Riverine Tidal Riverine tidal open water True watercress, yellowcress, arrowhead, water plantain, smartweed, arrowhead
Sources: Clough and Park, 2007; Sound Science, 2007; WADNR, 2005.
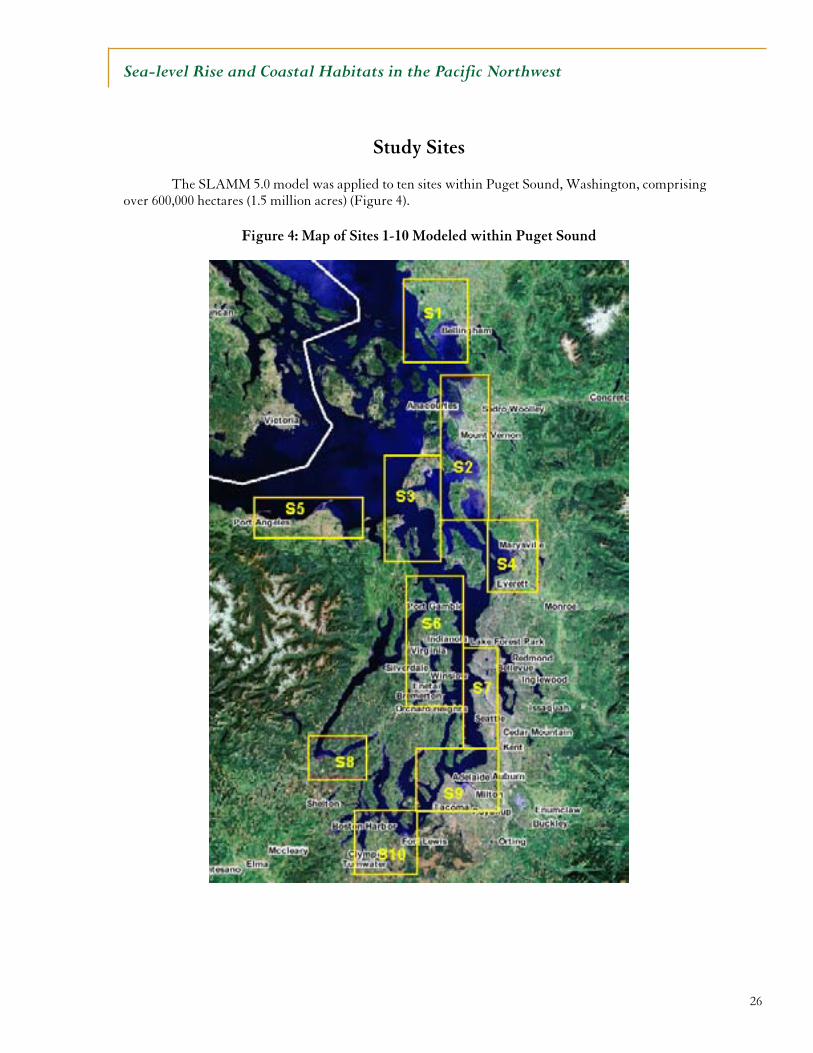
26
Sea-level Rise and Coastal Habitats in the Pacific Northwest
Study Sites
The SLAMM 5.0 model was applied to ten sites within Puget Sound, Washington, comprising over 600,000 hectares (1.5 million acres) (Figure 4).
Figure 4: Map of Sites 1-10 Modeled within Puget Sound
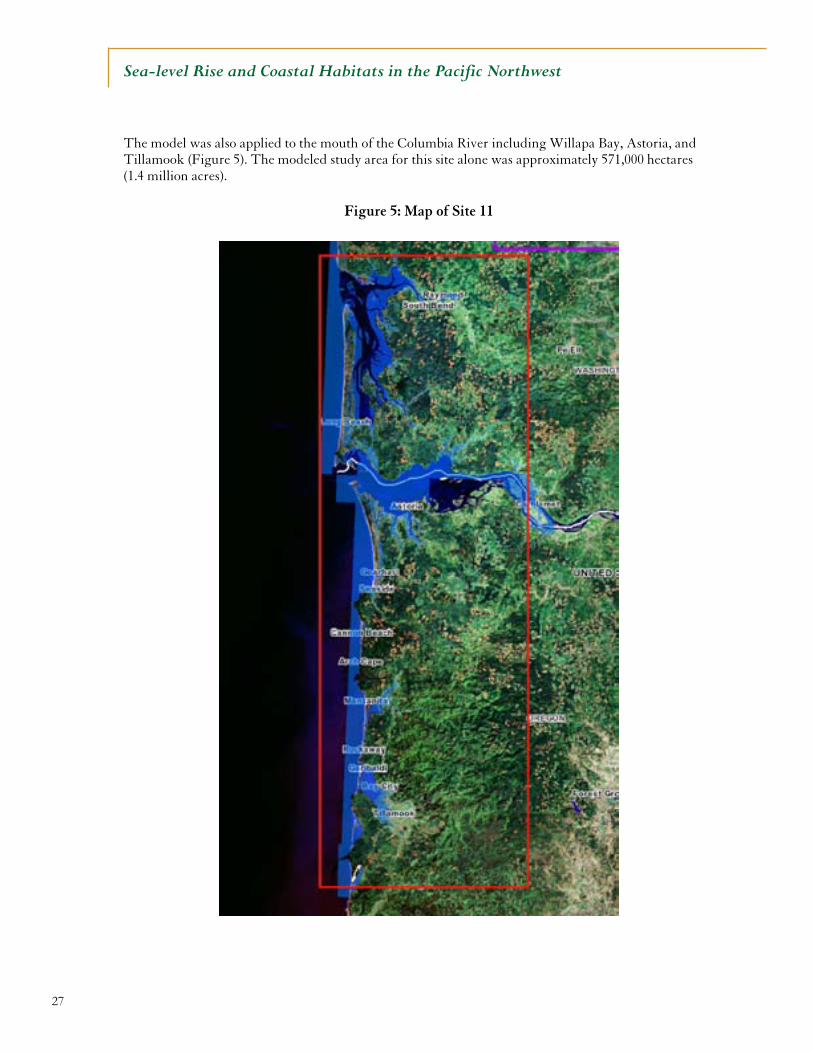
27
Sea-level Rise and Coastal Habitats in the Pacific Northwest
The model was also applied to the mouth of the Columbia River including Willapa Bay, Astoria, and Tillamook (Figure 5). The modeled study area for this site alone was approximately 571,000 hectares (1.4 million acres).
Figure 5: Map of Site 11
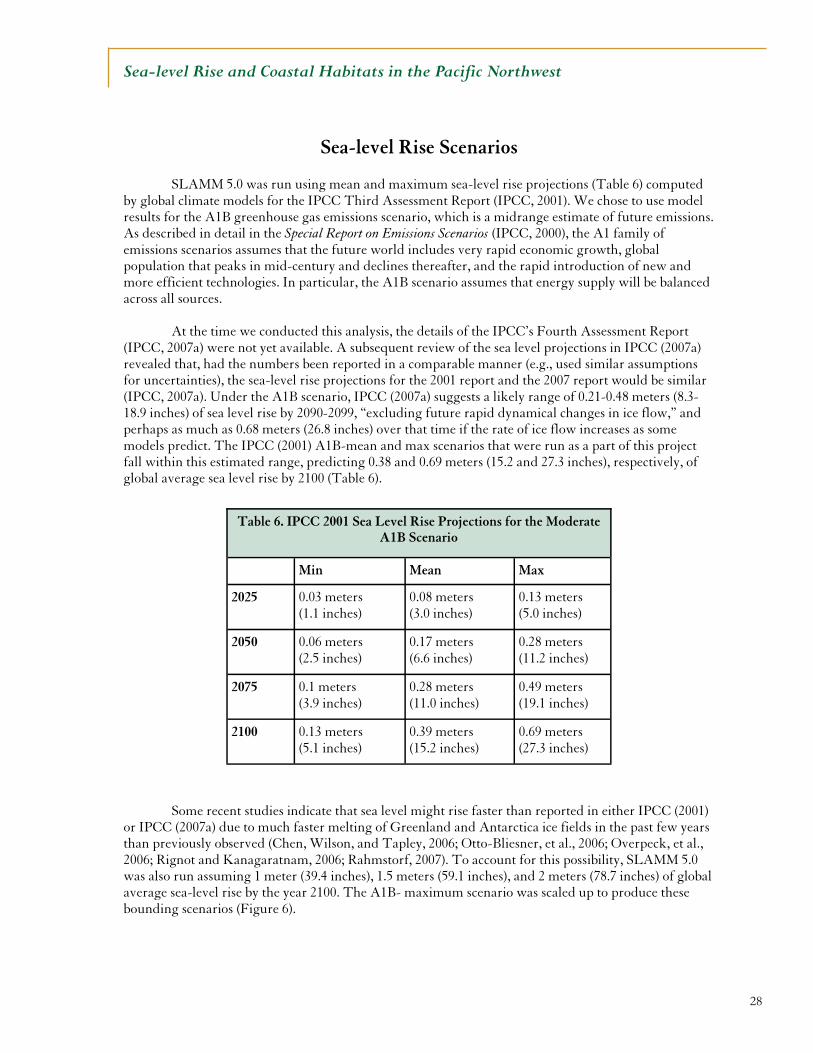
28
Sea-level Rise and Coastal Habitats in the Pacific Northwest
Sea-level Rise Scenarios SLAMM 5.0 was run using mean and maximum sea-level rise projections (Table 6) computed by global climate models for the IPCC Third Assessment Report (IPCC, 2001). We chose to use model results for the A1B greenhouse gas emissions scenario, which is a midrange estimate of future emissions. As described in detail in the Special Report on Emissions Scenarios (IPCC, 2000), the A1 family of emissions scenarios assumes that the future world includes very rapid economic growth, global population that peaks in mid-century and declines thereafter, and the rapid introduction of new and more efficient technologies. In particular, the A1B scenario assumes that energy supply will be balanced across all sources.
At the time we conducted this analysis, the details of the IPCC’s Fourth Assessment Report
(IPCC, 2007a) were not yet available. A subsequent review of the sea level projections in IPCC (2007a) revealed that, had the numbers been reported in a comparable manner (e.g., used similar assumptions for uncertainties), the sea-level rise projections for the 2001 report and the 2007 report would be similar (IPCC, 2007a). Under the A1B scenario, IPCC (2007a) suggests a likely range of 0.21-0.48 meters (8.3-18.9 inches) of sea level rise by 2090-2099, “excluding future rapid dynamical changes in ice flow,” and perhaps as much as 0.68 meters (26.8 inches) over that time if the rate of ice flow increases as some models predict. The IPCC (2001) A1B-mean and max scenarios that were run as a part of this project fall within this estimated range, predicting 0.38 and 0.69 meters (15.2 and 27.3 inches), respectively, of global average sea level rise by 2100 (Table 6).
Some recent studies indicate that sea level might rise faster than reported in either IPCC (2001) or IPCC (2007a) due to much faster melting of Greenland and Antarctica ice fields in the past few years than previously observed (Chen, Wilson, and Tapley, 2006; Otto-Bliesner, et al., 2006; Overpeck, et al., 2006; Rignot and Kanagaratnam, 2006; Rahmstorf, 2007). To account for this possibility, SLAMM 5.0 was also run assuming 1 meter (39.4 inches), 1.5 meters (59.1 inches), and 2 meters (78.7 inches) of global average sea-level rise by the year 2100. The A1B- maximum scenario was scaled up to produce these bounding scenarios (Figure 6).
Min Mean Max
2025 0.03 meters (1.1 inches)
0.08 meters (3.0 inches)
0.13 meters (5.0 inches)
2050 0.06 meters (2.5 inches)
0.17 meters (6.6 inches)
0.28 meters (11.2 inches)
2075 0.1 meters (3.9 inches)
0.28 meters (11.0 inches)
0.49 meters (19.1 inches)
2100 0.13 meters (5.1 inches)
0.39 meters (15.2 inches)
0.69 meters (27.3 inches)
Table 6. IPCC 2001 Sea Level Rise Projections for the Moderate A1B Scenario
29
Sea-level Rise and Coastal Habitats in the Pacific Northwest
Figure 6: Summary of Sea-level Rise Scenarios Utilized
For simplicity, this report will focus on the A1B-Max scenarios for 2050 and 2100 and the 1.5-meter (59.1 inch) scenario for 2100. Full model results are available from the National Wildlife Federation for all five scenarios discussed above. Table 7 shows the relative amount of sea-level rise by study site based on these scenarios and the relative land elevation changes discussed in the Appendix.
0
200
400
600
800
1000
1200
1400
1600
1800
2000
2000 2020 2040 2060 2080 2100
Sea Level Rise (mm)
A1B- Mean
A1B- Max
1 meter
1.5 meters
2 meters
2050 A1B Max (0.28 meters/11.2 inches)
2100 A1B Max (0.69 me-ters/27.3 inches)
2100 1.5 Meter (59.1 inches)
Site 1 0.28 meters (11.1inches) 0.68 meters (26.9 inches) 1.45 meters (58.6 inches)
Site 2 0.35 meters (13.6 inches) 0.78 meters (30.8 inches) 1.59 meters (62.5 inches)
Site 3 0.42 meters (16.4 inches) 0.89 meters (35.1 inches) 1.70 meters (66.8 inches)
Site 4 0.36 meters (14 inches) 0.80 meters (31.3 inches) 1.60 meters (63 inches)
Site 5 0.30 meters (11.8 inches) 0.71 meters (27.9 inches) 1.51 meters (59.6 inches)
Site 6 0.36 meters (14 inches) 0.80 meters (31.3 inches) 1.60 meters (63 inches)
Site 7 0.32 meters (12.6 inches) 0.76 meters (29.9 inches) 1.57 meters (61.7 inches)
Site 8 0.34 meters (13.3 inches) 0.77 meters (30.5 inches) 1.58 meters (62.2 inches)
Site 9 0.34 meters (13.2 inches) 0.77 meters (30.4 inches) 1.58 meters (62.1 inches)
Site 10 0.34 meters (13.3 inches) 0.77 meters (30.5 inches) 1.58 meters (62.2 inches)
Site 11 0.34 meters (13.2 inches) 0.77 meters (30.4 inches) 1.58 meters (62.1 inches)
Table 7. Relative Sea-level Rise by Study Site
30
Sea-level Rise and Coastal Habitats in the Pacific Northwest
Model Results by Study Site Site 1: Nooksack Delta, Lummi Bay, and Bellingham Bay
This site encompasses the Nooksack estuary, which enters Puget Sound at Bellingham Bay, and the Lummi delta at Lummi Bay. Nearshore habitats are characterized by estuarine marshes, coastal swamp, eelgrass, and kelp beds. Although there has been significant coastal development at Bellingham and much of nearshore habitat in the region has been altered by levees, roads, and other modifications, it remains a critical area for natal and non-natal Chinook, summer chum, and bull trout and is an important foraging site for numerous species of shorebirds and waterfowl. The region is also part of the core summer habitat for the endangered Southern Resident orca population (National Marine Fisheries Service, 2006).
Due to the presence of dikes at this site (see the section on dikes in the Appendix), and relatively high dry land elevations, the majority of effects occur in the wetlands southwest of Marietta (Nooksack River delta). Depending on the scenario chosen, these swamp lands and wetlands are either in the process of transitioning to saltmarsh or have completely transitioned to that category. Transitional marsh, in this case, refers to dry land, swamp, or fresh marsh that has been inundated by salt water but is still at too high of an elevation to have completely transformed into saltmarsh. Estuarine beach declines 42-84 percent by 2100 under the A1B Max and 1.5-meter (59.1 inch) scenarios respectively, as does one-fourth of swamp area.
Sunset over Bellingham Bay (iStock)
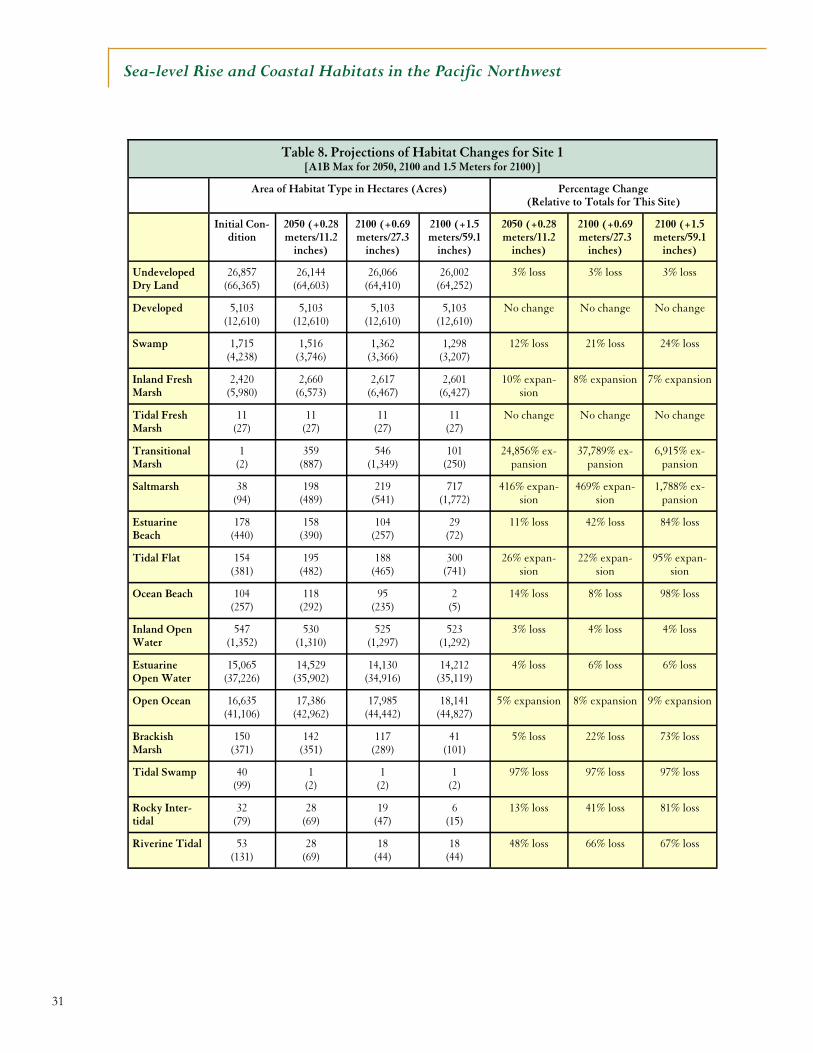
31
Sea-level Rise and Coastal Habitats in the Pacific Northwest
Table 8. Projections of Habitat Changes for Site 1 [A1B Max for 2050, 2100 and 1.5 Meters for 2100)]
Area of Habitat Type in Hectares (Acres) Percentage Change (Relative to Totals for This Site)
Initial Con-dition
2050 (+0.28 meters/11.2
inches)
2100 (+0.69 meters/27.3
inches)
2100 (+1.5 meters/59.1
inches)
2050 (+0.28 meters/11.2
inches)
2100 (+0.69 meters/27.3
inches)
2100 (+1.5 meters/59.1
inches)
Undeveloped Dry Land
26,857 (66,365)
26,144 (64,603)
26,066 (64,410)
26,002 (64,252)
3% loss 3% loss 3% loss
Developed 5,103 (12,610)
5,103 (12,610)
5,103 (12,610)
5,103 (12,610)
No change No change No change
Swamp 1,715 (4,238)
1,516 (3,746)
1,362 (3,366)
1,298 (3,207)
12% loss 21% loss 24% loss
Inland Fresh Marsh
2,420 (5,980)
2,660 (6,573)
2,617 (6,467)
2,601 (6,427)
10% expan-sion
8% expansion 7% expansion
Tidal Fresh Marsh
11 (27)
11 (27)
11 (27)
11 (27)
No change No change No change
Transitional Marsh
1 (2)
359 (887)
546 (1,349)
101 (250)
24,856% ex-pansion
37,789% ex-pansion
6,915% ex-pansion
Saltmarsh 38 (94)
198 (489)
219 (541)
717 (1,772)
416% expan-sion
469% expan-sion
1,788% ex-pansion
Estuarine Beach
178 (440)
158 (390)
104 (257)
29 (72)
11% loss 42% loss 84% loss
Tidal Flat 154 (381)
195 (482)
188 (465)
300 (741)
26% expan-sion
22% expan-sion
95% expan-sion
Ocean Beach 104 (257)
118 (292)
95 (235)
2 (5)
14% loss 8% loss 98% loss
Inland Open Water
547 (1,352)
530 (1,310)
525 (1,297)
523 (1,292)
3% loss 4% loss 4% loss
Estuarine Open Water
15,065 (37,226)
14,529 (35,902)
14,130 (34,916)
14,212 (35,119)
4% loss 6% loss 6% loss
Open Ocean 16,635 (41,106)
17,386 (42,962)
17,985 (44,442)
18,141 (44,827)
5% expansion 8% expansion 9% expansion
Brackish Marsh
150 (371)
142 (351)
117 (289)
41 (101)
5% loss 22% loss 73% loss
Tidal Swamp 40 (99)
1 (2)
1 (2)
1 (2)
97% loss 97% loss 97% loss
Rocky Inter-tidal
32 (79)
28 (69)
19 (47)
6 (15)
13% loss 41% loss 81% loss
Riverine Tidal 53 (131)
28 (69)
18 (44)
18 (44)
48% loss 66% loss 67% loss
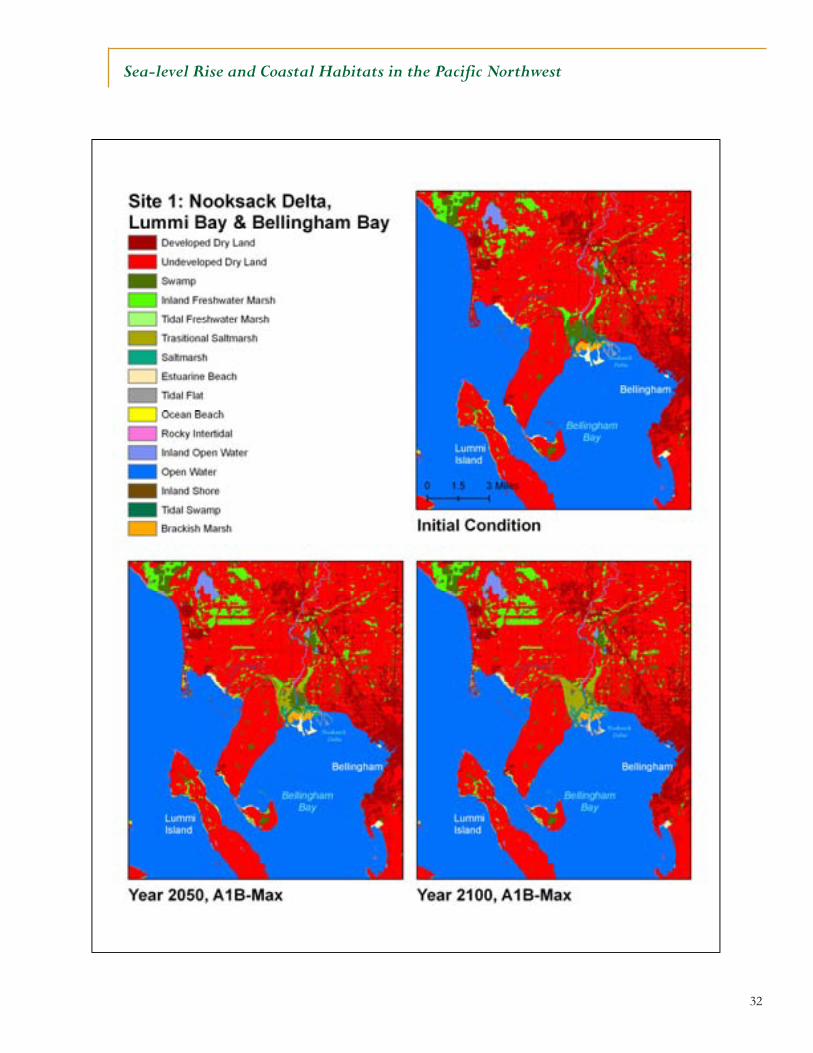
32
Sea-level Rise and Coastal Habitats in the Pacific Northwest
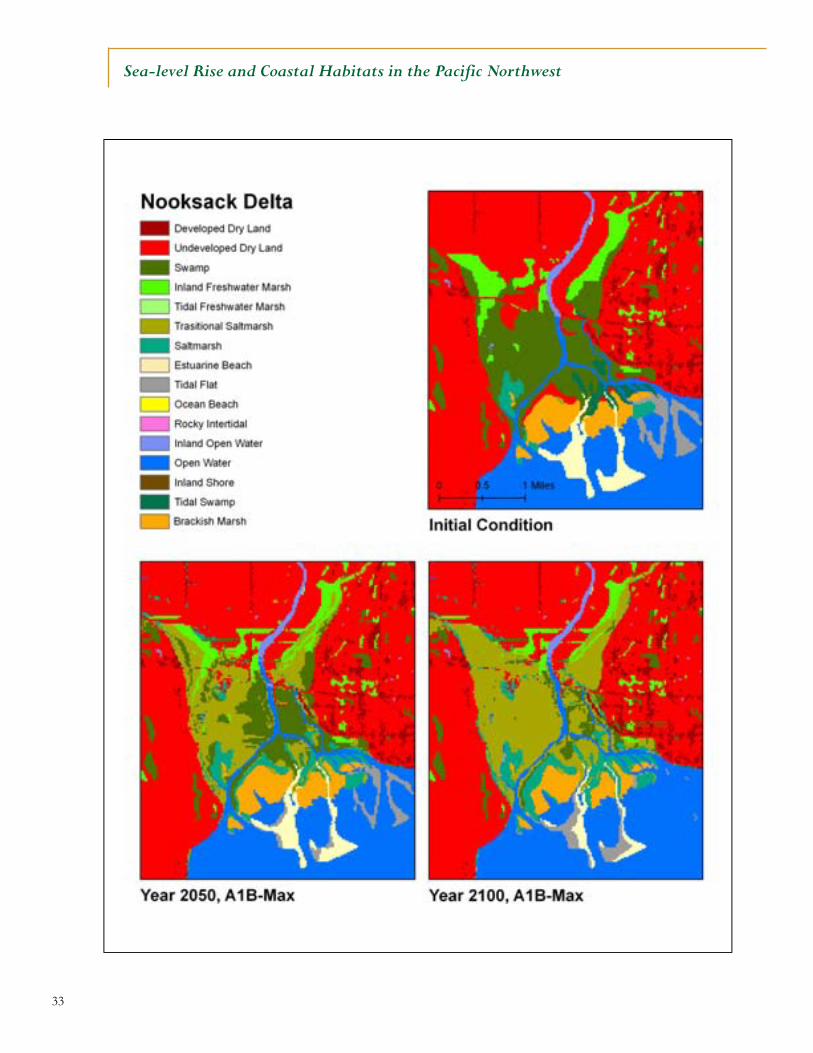
33
Sea-level Rise and Coastal Habitats in the Pacific Northwest
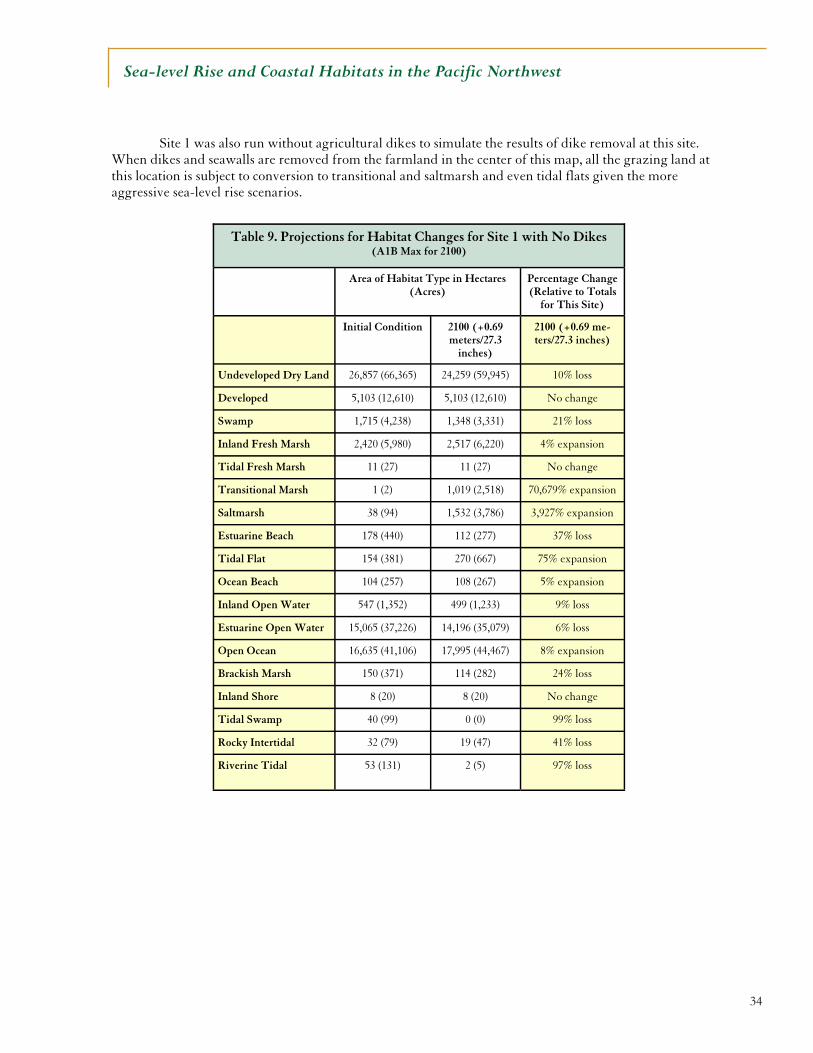
34
Sea-level Rise and Coastal Habitats in the Pacific Northwest
Site 1 was also run without agricultural dikes to simulate the results of dike removal at this site. When dikes and seawalls are removed from the farmland in the center of this map, all the grazing land at this location is subject to conversion to transitional and saltmarsh and even tidal flats given the more aggressive sea-level rise scenarios.
Table 9. Projections for Habitat Changes for Site 1 with No Dikes (A1B Max for 2100)
Percentage Change (Relative to Totals
for This Site)
Initial Condition 2100 (+0.69 meters/27.3
inches)
2100 (+0.69 me-ters/27.3 inches)
Undeveloped Dry Land 26,857 (66,365) 24,259 (59,945) 10% loss
Developed 5,103 (12,610) 5,103 (12,610) No change
Swamp 1,715 (4,238) 1,348 (3,331) 21% loss
Inland Fresh Marsh 2,420 (5,980) 2,517 (6,220) 4% expansion
Tidal Fresh Marsh 11 (27) 11 (27) No change
Transitional Marsh 1 (2) 1,019 (2,518) 70,679% expansion
Saltmarsh 38 (94) 1,532 (3,786) 3,927% expansion
Estuarine Beach 178 (440) 112 (277) 37% loss
Tidal Flat 154 (381) 270 (667) 75% expansion
Ocean Beach 104 (257) 108 (267) 5% expansion
Inland Open Water 547 (1,352) 499 (1,233) 9% loss
Estuarine Open Water 15,065 (37,226) 14,196 (35,079) 6% loss
Open Ocean 16,635 (41,106) 17,995 (44,467) 8% expansion
Brackish Marsh 150 (371) 114 (282) 24% loss
Inland Shore 8 (20) 8 (20) No change
Tidal Swamp 40 (99) 0 (0) 99% loss
Rocky Intertidal 32 (79) 19 (47) 41% loss
Riverine Tidal 53 (131) 2 (5) 97% loss
Area of Habitat Type in Hectares (Acres)
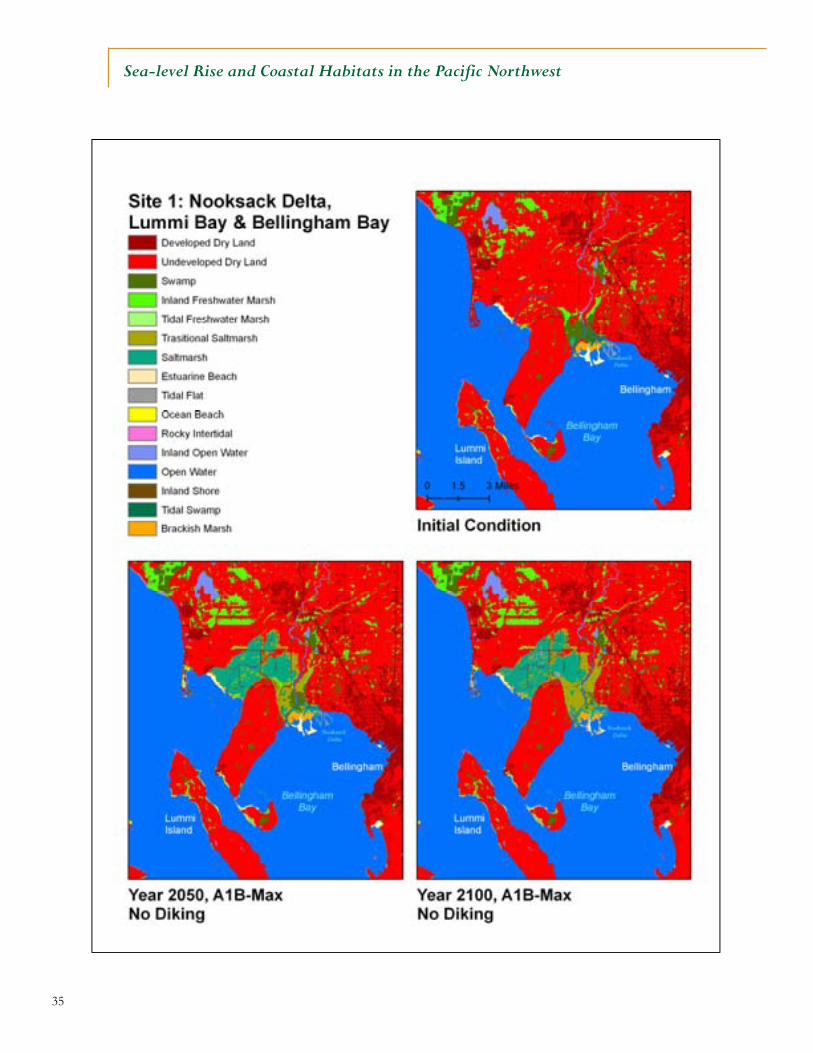
35
Sea-level Rise and Coastal Habitats in the Pacific Northwest
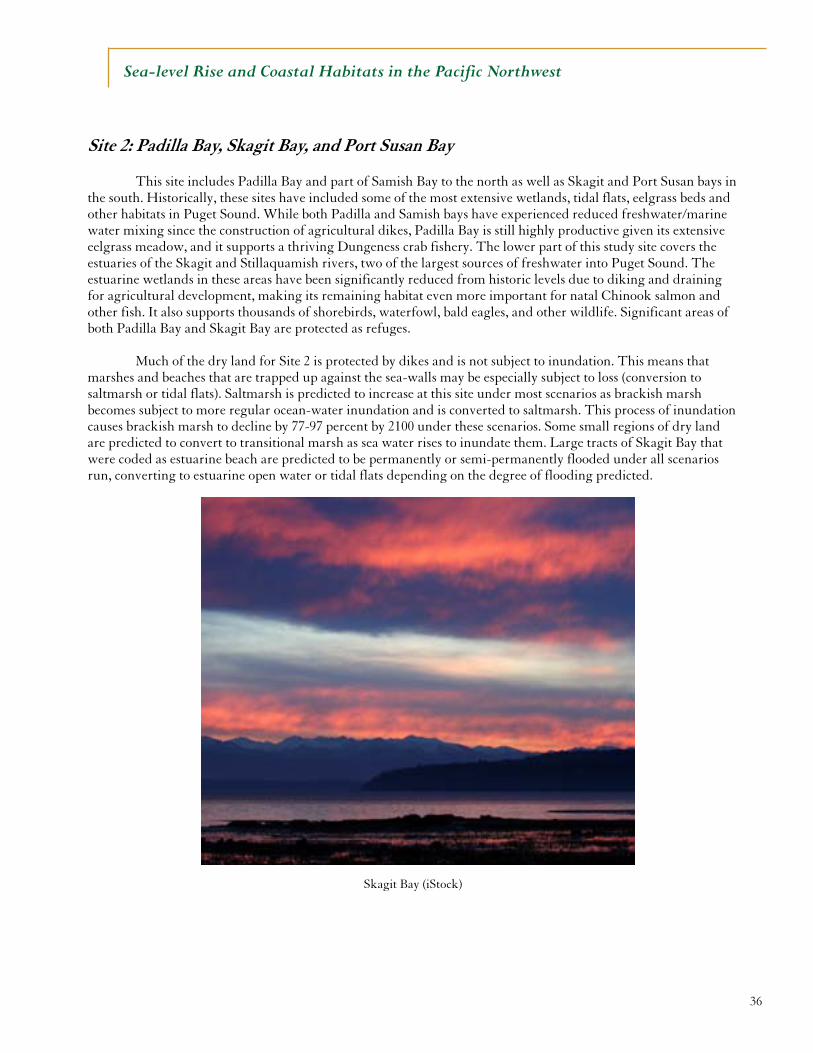
36
Sea-level Rise and Coastal Habitats in the Pacific Northwest
Site 2: Padilla Bay, Skagit Bay, and Port Susan Bay
This site includes Padilla Bay and part of Samish Bay to the north as well as Skagit and Port Susan bays in the south. Historically, these sites have included some of the most extensive wetlands, tidal flats, eelgrass beds and other habitats in Puget Sound. While both Padilla and Samish bays have experienced reduced freshwater/marine water mixing since the construction of agricultural dikes, Padilla Bay is still highly productive given its extensive eelgrass meadow, and it supports a thriving Dungeness crab fishery. The lower part of this study site covers the estuaries of the Skagit and Stillaquamish rivers, two of the largest sources of freshwater into Puget Sound. The estuarine wetlands in these areas have been significantly reduced from historic levels due to diking and draining for agricultural development, making its remaining habitat even more important for natal Chinook salmon and other fish. It also supports thousands of shorebirds, waterfowl, bald eagles, and other wildlife. Significant areas of both Padilla Bay and Skagit Bay are protected as refuges.
Much of the dry land for Site 2 is protected by dikes and is not subject to inundation. This means that marshes and beaches that are trapped up against the sea-walls may be especially subject to loss (conversion to saltmarsh or tidal flats). Saltmarsh is predicted to increase at this site under most scenarios as brackish marsh becomes subject to more regular ocean-water inundation and is converted to saltmarsh. This process of inundation causes brackish marsh to decline by 77-97 percent by 2100 under these scenarios. Some small regions of dry land are predicted to convert to transitional marsh as sea water rises to inundate them. Large tracts of Skagit Bay that were coded as estuarine beach are predicted to be permanently or semi-permanently flooded under all scenarios run, converting to estuarine open water or tidal flats depending on the degree of flooding predicted.
Skagit Bay (iStock)
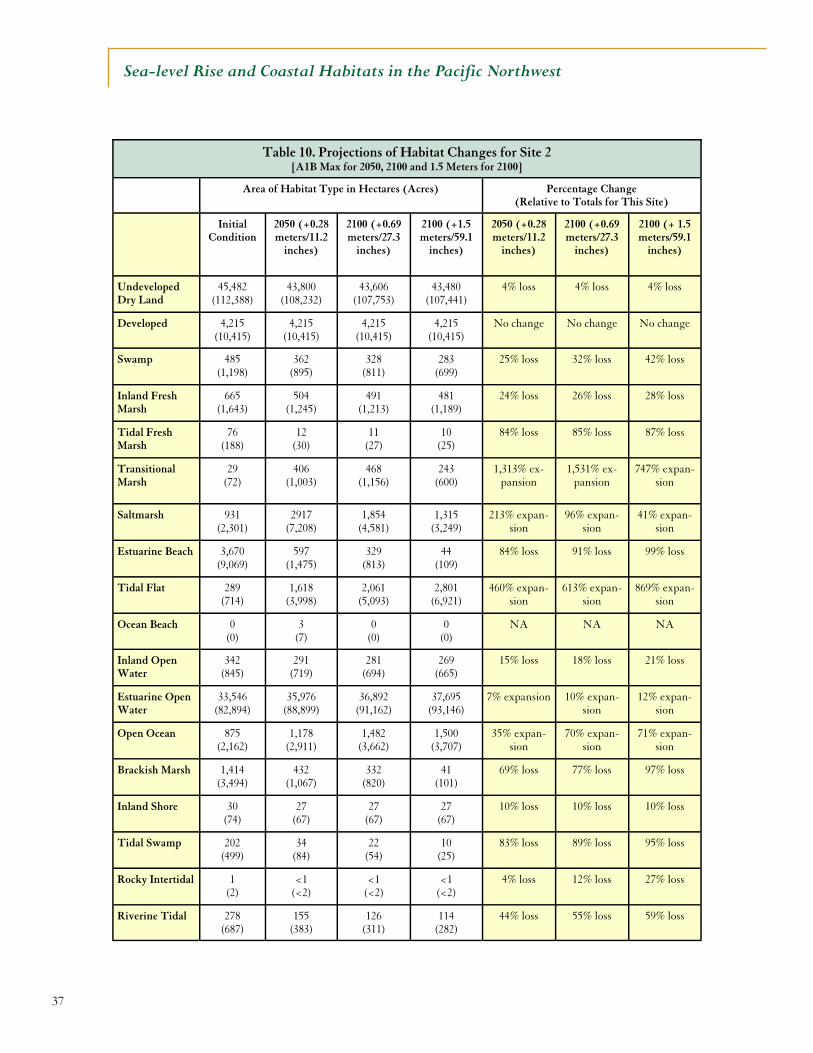
37
Sea-level Rise and Coastal Habitats in the Pacific Northwest
Table 10. Projections of Habitat Changes for Site 2 [A1B Max for 2050, 2100 and 1.5 Meters for 2100]
Area of Habitat Type in Hectares (Acres)
Initial Condition
2050 (+0.28 meters/11.2
inches)
2100 (+0.69 meters/27.3
inches)
2100 (+1.5 meters/59.1
inches)
2050 (+0.28 meters/11.2
inches)
2100 (+0.69 meters/27.3
inches)
2100 (+ 1.5 meters/59.1
inches)
Undeveloped Dry Land
45,482 (112,388)
43,800 (108,232)
43,606 (107,753)
43,480 (107,441)
4% loss 4% loss 4% loss
Developed 4,215 (10,415)
4,215 (10,415)
4,215 (10,415)
4,215 (10,415)
No change No change No change
Swamp 485 (1,198)
362 (895)
328 (811)
283 (699)
25% loss 32% loss 42% loss
Inland Fresh Marsh
665 (1,643)
504 (1,245)
491 (1,213)
481 (1,189)
24% loss 26% loss 28% loss
Tidal Fresh Marsh
76 (188)
12 (30)
11 (27)
10 (25)
84% loss 85% loss 87% loss
Transitional Marsh
29 (72)
406 (1,003)
468 (1,156)
243 (600)
1,313% ex-pansion
1,531% ex-pansion
747% expan-sion
Saltmarsh 931 (2,301)
2917 (7,208)
1,854 (4,581)
1,315 (3,249)
213% expan-sion
96% expan-sion
41% expan-sion
Estuarine Beach 3,670 (9,069)
597 (1,475)
329 (813)
44 (109)
84% loss 91% loss 99% loss
Tidal Flat 289 (714)
1,618 (3,998)
2,061 (5,093)
2,801 (6,921)
460% expan-sion
613% expan-sion
869% expan-sion
Ocean Beach 0 (0)
3 (7)
0 (0)
0 (0)
NA NA NA
Inland Open Water
342 (845)
291 (719)
281 (694)
269 (665)
15% loss 18% loss 21% loss
Estuarine Open Water
33,546 (82,894)
35,976 (88,899)
36,892 (91,162)
37,695 (93,146)
7% expansion 10% expan-sion
12% expan-sion
Open Ocean 875 (2,162)
1,178 (2,911)
1,482 (3,662)
1,500 (3,707)
35% expan-sion
70% expan-sion
71% expan-sion
Brackish Marsh 1,414 (3,494)
432 (1,067)
332 (820)
41 (101)
69% loss 77% loss 97% loss
Inland Shore 30 (74)
27 (67)
27 (67)
27 (67)
10% loss 10% loss 10% loss
Tidal Swamp 202 (499)
34 (84)
22 (54)
10 (25)
83% loss 89% loss 95% loss
Rocky Intertidal 1 (2)
<1 (<2)
<1 (<2)
<1 (<2)
4% loss 12% loss 27% loss
Riverine Tidal 278 (687)
155 (383)
126 (311)
114 (282)
44% loss 55% loss 59% loss
Percentage Change (Relative to Totals for This Site)
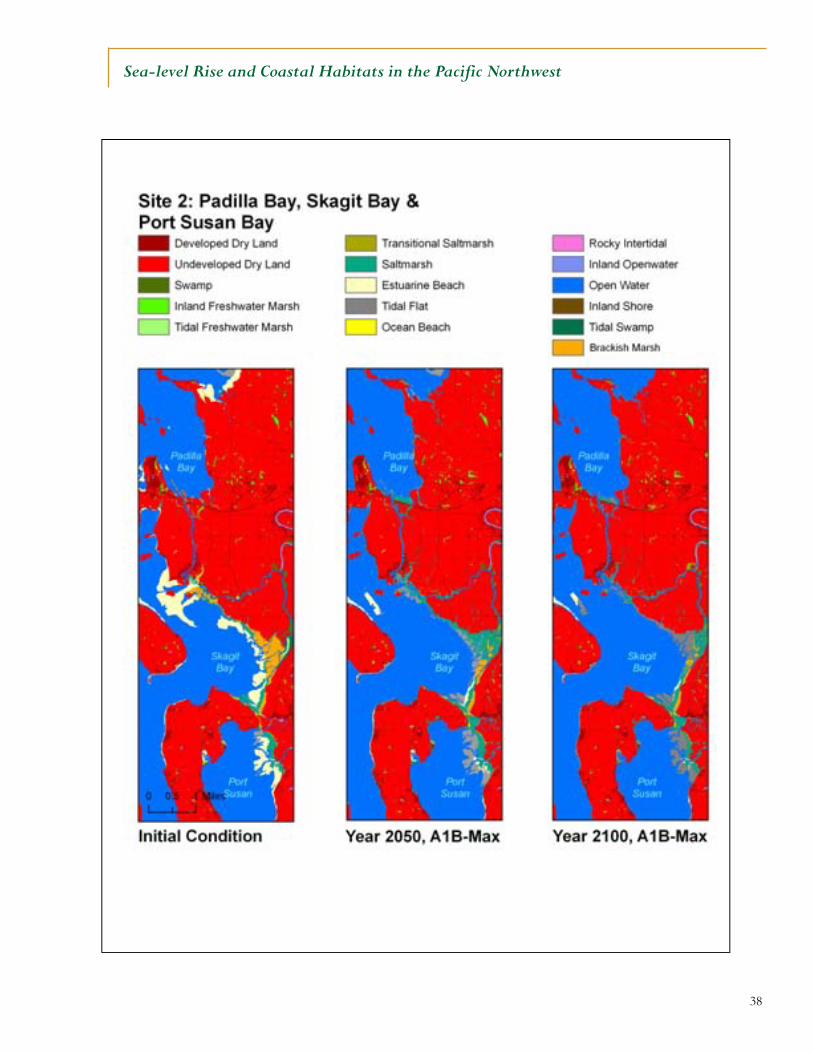
38
Sea-level Rise and Coastal Habitats in the Pacific Northwest
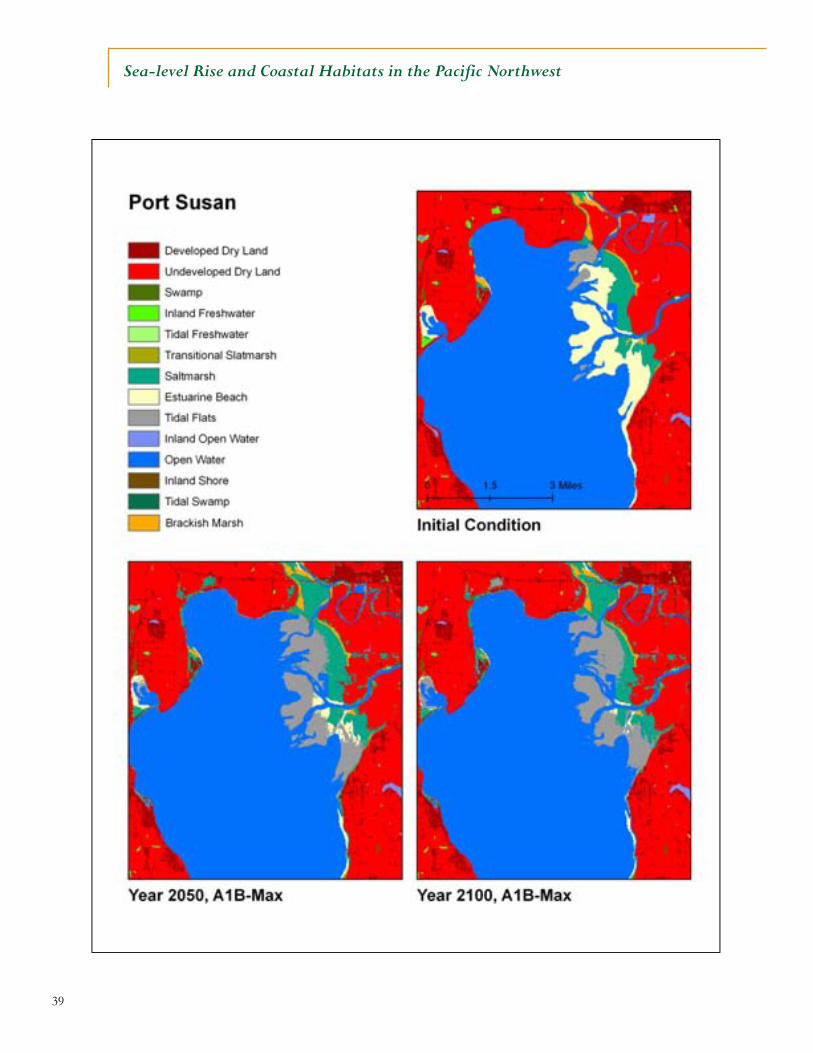
39
Sea-level Rise and Coastal Habitats in the Pacific Northwest
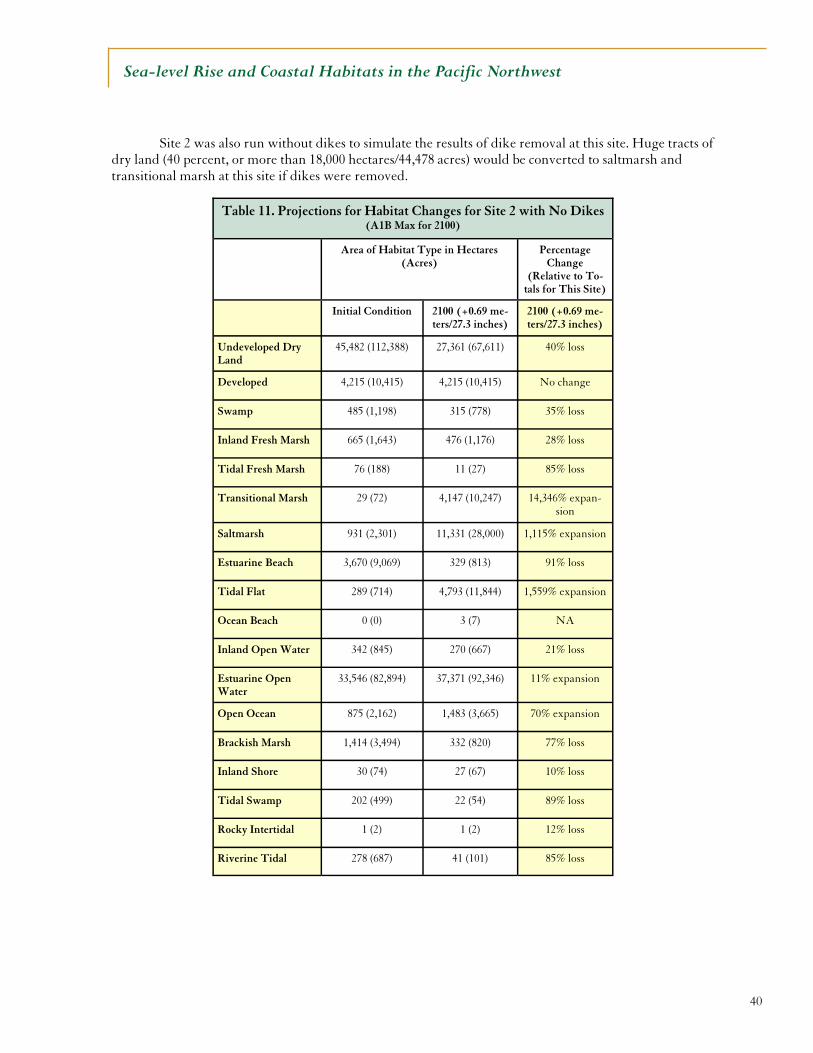
40
Sea-level Rise and Coastal Habitats in the Pacific Northwest
Site 2 was also run without dikes to simulate the results of dike removal at this site. Huge tracts of dry land (40 percent, or more than 18,000 hectares/44,478 acres) would be converted to saltmarsh and transitional marsh at this site if dikes were removed.
Table 11. Projections for Habitat Changes for Site 2 with No Dikes (A1B Max for 2100)
Percentage Change
(Relative to To-tals for This Site)
Initial Condition 2100 (+0.69 me-ters/27.3 inches)
2100 (+0.69 me-ters/27.3 inches)
Undeveloped Dry Land
45,482 (112,388) 27,361 (67,611) 40% loss
Developed 4,215 (10,415) 4,215 (10,415) No change
Swamp 485 (1,198) 315 (778) 35% loss
Inland Fresh Marsh 665 (1,643) 476 (1,176) 28% loss
Tidal Fresh Marsh 76 (188) 11 (27) 85% loss
Transitional Marsh 29 (72) 4,147 (10,247) 14,346% expan-sion
Saltmarsh 931 (2,301) 11,331 (28,000) 1,115% expansion
Estuarine Beach 3,670 (9,069) 329 (813) 91% loss
Tidal Flat 289 (714) 4,793 (11,844) 1,559% expansion
Ocean Beach 0 (0) 3 (7) NA
Inland Open Water 342 (845) 270 (667) 21% loss
Estuarine Open Water
33,546 (82,894) 37,371 (92,346) 11% expansion
Open Ocean 875 (2,162) 1,483 (3,665) 70% expansion
Brackish Marsh 1,414 (3,494) 332 (820) 77% loss
Inland Shore 30 (74) 27 (67) 10% loss
Tidal Swamp 202 (499) 22 (54) 89% loss
Rocky Intertidal 1 (2) 1 (2) 12% loss
Riverine Tidal 278 (687) 41 (101) 85% loss
Area of Habitat Type in Hectares(Acres)
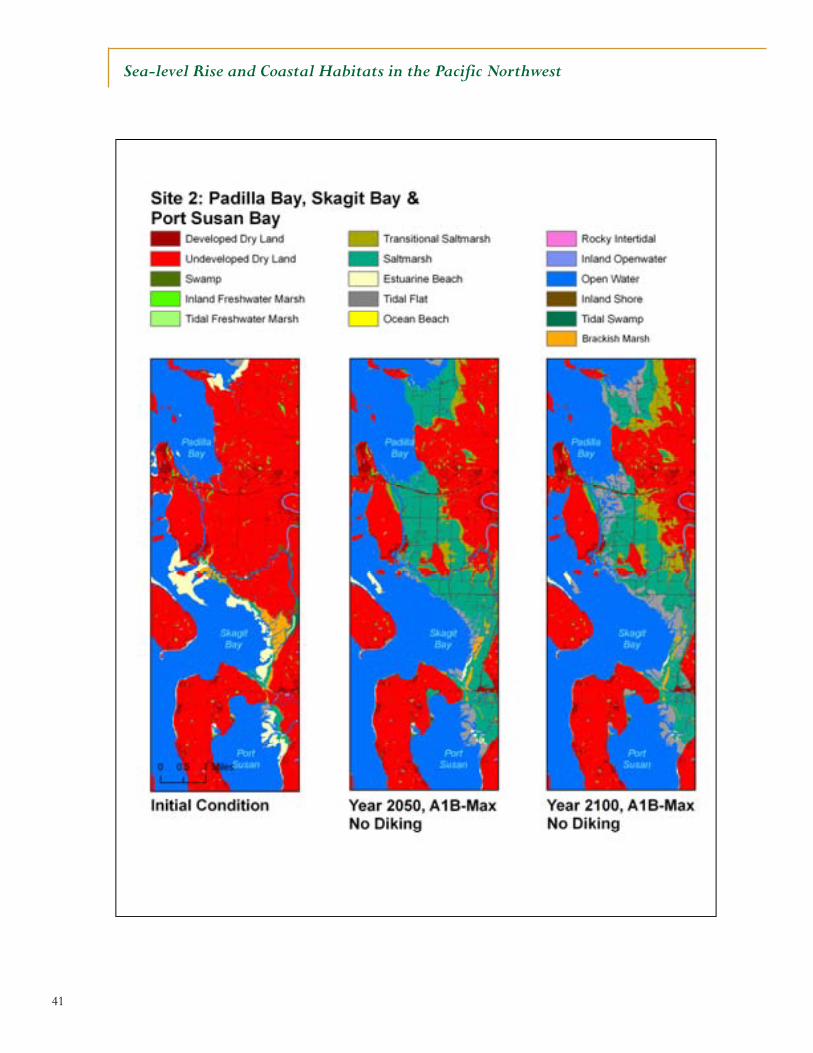
41
Sea-level Rise and Coastal Habitats in the Pacific Northwest
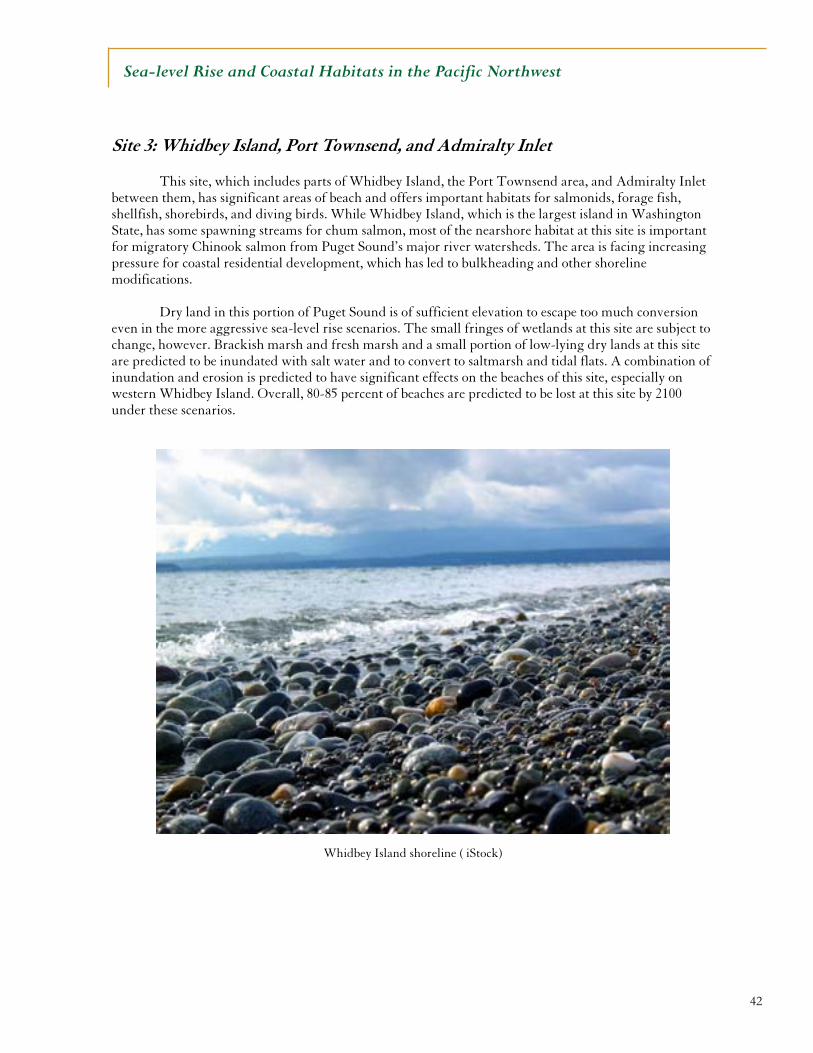
42
Sea-level Rise and Coastal Habitats in the Pacific Northwest
Site 3: Whidbey Island, Port Townsend, and Admiralty Inlet
This site, which includes parts of Whidbey Island, the Port Townsend area, and Admiralty Inlet between them, has significant areas of beach and offers important habitats for salmonids, forage fish, shellfish, shorebirds, and diving birds. While Whidbey Island, which is the largest island in Washington State, has some spawning streams for chum salmon, most of the nearshore habitat at this site is important for migratory Chinook salmon from Puget Sound’s major river watersheds. The area is facing increasing pressure for coastal residential development, which has led to bulkheading and other shoreline modifications.
Dry land in this portion of Puget Sound is of sufficient elevation to escape too much conversion even in the more aggressive sea-level rise scenarios. The small fringes of wetlands at this site are subject to change, however. Brackish marsh and fresh marsh and a small portion of low-lying dry lands at this site are predicted to be inundated with salt water and to convert to saltmarsh and tidal flats. A combination of inundation and erosion is predicted to have significant effects on the beaches of this site, especially on western Whidbey Island. Overall, 80-85 percent of beaches are predicted to be lost at this site by 2100 under these scenarios.
Whidbey Island shoreline ( iStock)
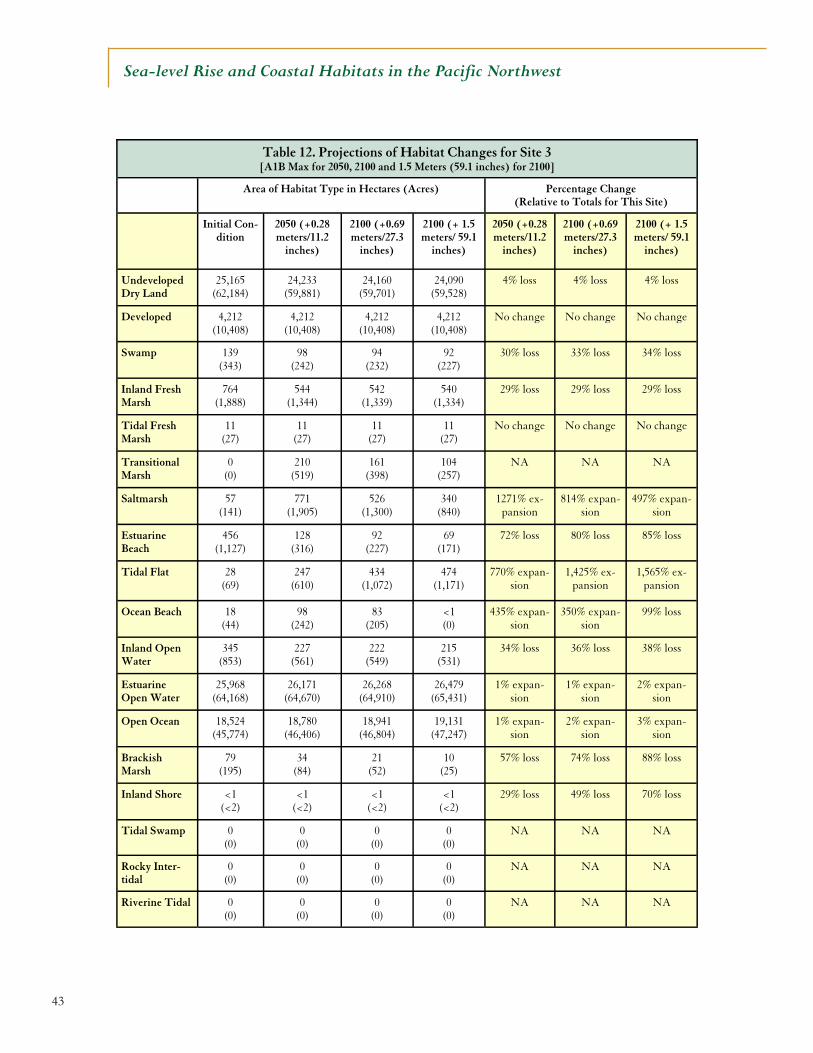
43
Sea-level Rise and Coastal Habitats in the Pacific Northwest
Table 12. Projections of Habitat Changes for Site 3 [A1B Max for 2050, 2100 and 1.5 Meters (59.1 inches) for 2100]
Area of Habitat Type in Hectares (Acres)
Initial Con-dition
2050 (+0.28 meters/11.2
inches)
2100 (+0.69 meters/27.3
inches)
2100 (+ 1.5 meters/ 59.1
inches)
2050 (+0.28 meters/11.2
inches)
2100 (+0.69 meters/27.3
inches)
2100 (+ 1.5 meters/ 59.1
inches)
Undeveloped Dry Land
25,165 (62,184)
24,233 (59,881)
24,160 (59,701)
24,090 (59,528)
4% loss 4% loss 4% loss
Developed 4,212 (10,408)
4,212 (10,408)
4,212 (10,408)
4,212 (10,408)
No change No change No change
Swamp 139 (343)
98 (242)
94 (232)
92 (227)
30% loss 33% loss 34% loss
Inland Fresh Marsh
764 (1,888)
544 (1,344)
542 (1,339)
540 (1,334)
29% loss 29% loss 29% loss
Tidal Fresh Marsh
11 (27)
11 (27)
11 (27)
11 (27)
No change No change No change
Transitional Marsh
0 (0)
210 (519)
161 (398)
104 (257)
NA NA NA
Saltmarsh 57 (141)
771 (1,905)
526 (1,300)
340 (840)
1271% ex-pansion
814% expan-sion
497% expan-sion
Estuarine Beach
456 (1,127)
128 (316)
92 (227)
69 (171)
72% loss 80% loss 85% loss
Tidal Flat 28 (69)
247 (610)
434 (1,072)
474 (1,171)
770% expan-sion
1,425% ex-pansion
1,565% ex-pansion
Ocean Beach 18 (44)
98 (242)
83 (205)
<1 (0)
435% expan-sion
350% expan-sion
99% loss
Inland Open Water
345 (853)
227 (561)
222 (549)
215 (531)
34% loss 36% loss 38% loss
Estuarine Open Water
25,968 (64,168)
26,171 (64,670)
26,268 (64,910)
26,479 (65,431)
1% expan-sion
1% expan-sion
2% expan-sion
Open Ocean 18,524 (45,774)
18,780 (46,406)
18,941 (46,804)
19,131 (47,247)
1% expan-sion
2% expan-sion
3% expan-sion
Brackish Marsh
79 (195)
34 (84)
21 (52)
10 (25)
57% loss 74% loss 88% loss
Inland Shore <1 (<2)
<1 (<2)
<1 (<2)
<1 (<2)
29% loss 49% loss 70% loss
Tidal Swamp 0 (0)
0 (0)
0 (0)
0 (0)
NA NA NA
Rocky Inter-tidal
0 (0)
0 (0)
0 (0)
0 (0)
NA NA NA
Riverine Tidal 0 (0)
0 (0)
0 (0)
0 (0)
NA NA NA
Percentage Change (Relative to Totals for This Site)
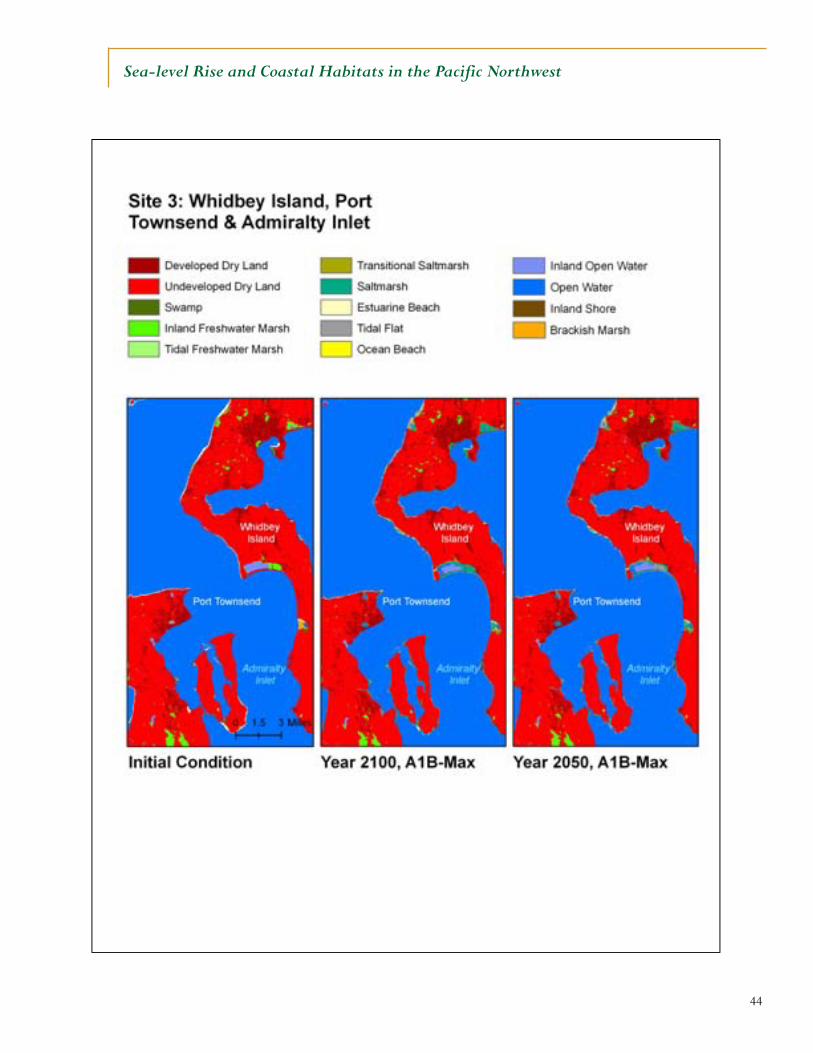
44
Sea-level Rise and Coastal Habitats in the Pacific Northwest
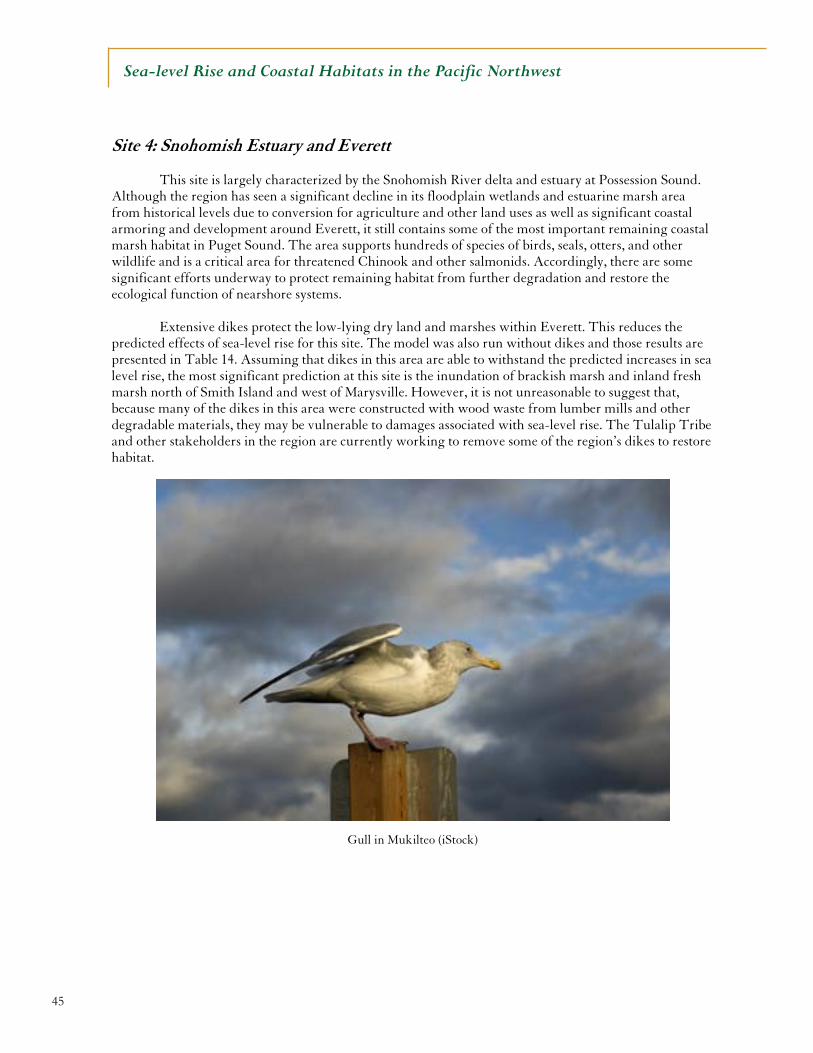
45
Sea-level Rise and Coastal Habitats in the Pacific Northwest
Site 4: Snohomish Estuary and Everett This site is largely characterized by the Snohomish River delta and estuary at Possession Sound. Although the region has seen a significant decline in its floodplain wetlands and estuarine marsh area from historical levels due to conversion for agriculture and other land uses as well as significant coastal armoring and development around Everett, it still contains some of the most important remaining coastal marsh habitat in Puget Sound. The area supports hundreds of species of birds, seals, otters, and other wildlife and is a critical area for threatened Chinook and other salmonids. Accordingly, there are some significant efforts underway to protect remaining habitat from further degradation and restore the ecological function of nearshore systems.
Extensive dikes protect the low-lying dry land and marshes within Everett. This reduces the
predicted effects of sea-level rise for this site. The model was also run without dikes and those results are presented in Table 14. Assuming that dikes in this area are able to withstand the predicted increases in sea level rise, the most significant prediction at this site is the inundation of brackish marsh and inland fresh marsh north of Smith Island and west of Marysville. However, it is not unreasonable to suggest that, because many of the dikes in this area were constructed with wood waste from lumber mills and other degradable materials, they may be vulnerable to damages associated with sea-level rise. The Tulalip Tribe and other stakeholders in the region are currently working to remove some of the region’s dikes to restore habitat.
Gull in Mukilteo (iStock)
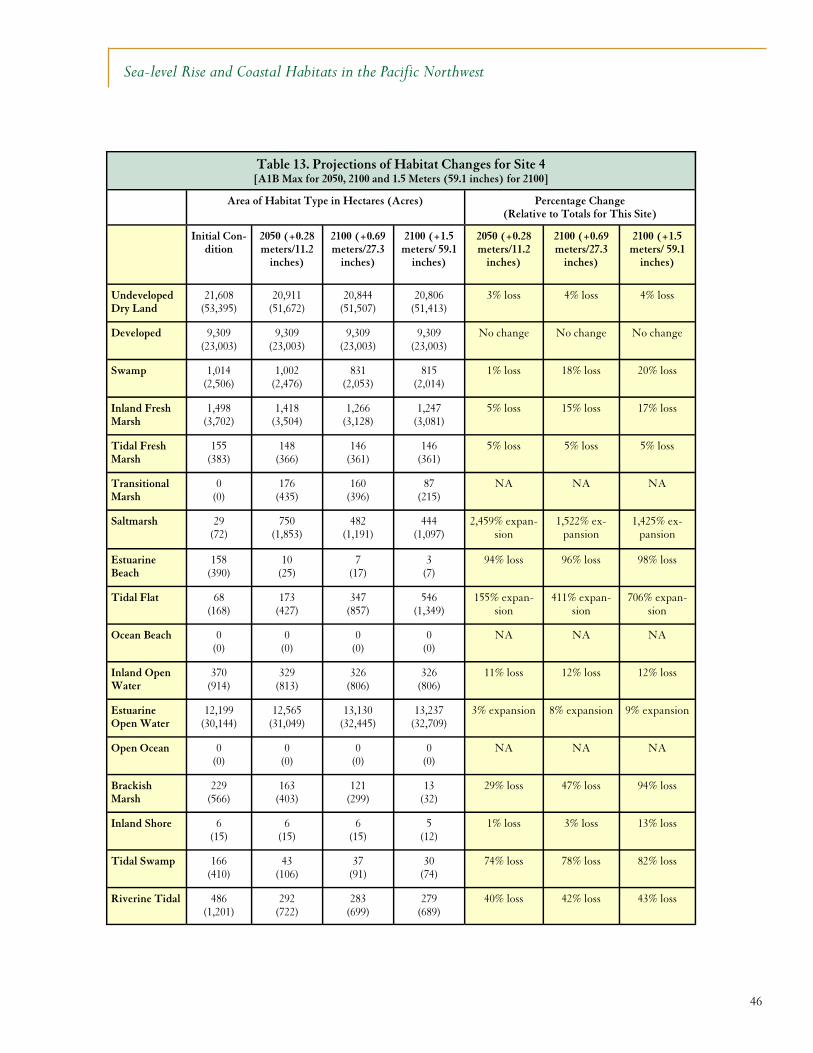
46
Sea-level Rise and Coastal Habitats in the Pacific Northwest
Table 13. Projections of Habitat Changes for Site 4 [A1B Max for 2050, 2100 and 1.5 Meters (59.1 inches) for 2100]
Area of Habitat Type in Hectares (Acres) Percentage Change (Relative to Totals for This Site)
Initial Con-dition
2050 (+0.28 meters/11.2
inches)
2100 (+0.69 meters/27.3
inches)
2100 (+1.5 meters/ 59.1
inches)
2050 (+0.28 meters/11.2
inches)
2100 (+0.69 meters/27.3
inches)
2100 (+1.5 meters/ 59.1
inches)
Undeveloped Dry Land
21,608 (53,395)
20,911 (51,672)
20,844 (51,507)
20,806 (51,413)
3% loss 4% loss 4% loss
Developed 9,309 (23,003)
9,309 (23,003)
9,309 (23,003)
9,309 (23,003)
No change No change No change
Swamp 1,014 (2,506)
1,002 (2,476)
831 (2,053)
815 (2,014)
1% loss 18% loss 20% loss
Inland Fresh Marsh
1,498 (3,702)
1,418 (3,504)
1,266 (3,128)
1,247 (3,081)
5% loss 15% loss 17% loss
Tidal Fresh Marsh
155 (383)
148 (366)
146 (361)
146 (361)
5% loss 5% loss 5% loss
Transitional Marsh
0 (0)
176 (435)
160 (396)
87 (215)
NA NA NA
Saltmarsh 29 (72)
750 (1,853)
482 (1,191)
444 (1,097)
2,459% expan-sion
1,522% ex-pansion
1,425% ex-pansion
Estuarine Beach
158 (390)
10 (25)
7 (17)
3 (7)
94% loss 96% loss 98% loss
Tidal Flat 68 (168)
173 (427)
347 (857)
546 (1,349)
155% expan-sion
411% expan-sion
706% expan-sion
Ocean Beach 0 (0)
0 (0)
0 (0)
0 (0)
NA NA NA
Inland Open Water
370 (914)
329 (813)
326 (806)
326 (806)
11% loss 12% loss 12% loss
Estuarine Open Water
12,199 (30,144)
12,565 (31,049)
13,130 (32,445)
13,237 (32,709)
3% expansion 8% expansion 9% expansion
Open Ocean 0 (0)
0 (0)
0 (0)
0 (0)
NA NA NA
Brackish Marsh
229 (566)
163 (403)
121 (299)
13 (32)
29% loss 47% loss 94% loss
Inland Shore 6 (15)
6 (15)
6 (15)
5 (12)
1% loss 3% loss 13% loss
Tidal Swamp 166 (410)
43 (106)
37 (91)
30 (74)
74% loss 78% loss 82% loss
Riverine Tidal 486 (1,201)
292 (722)
283 (699)
279 (689)
40% loss 42% loss 43% loss
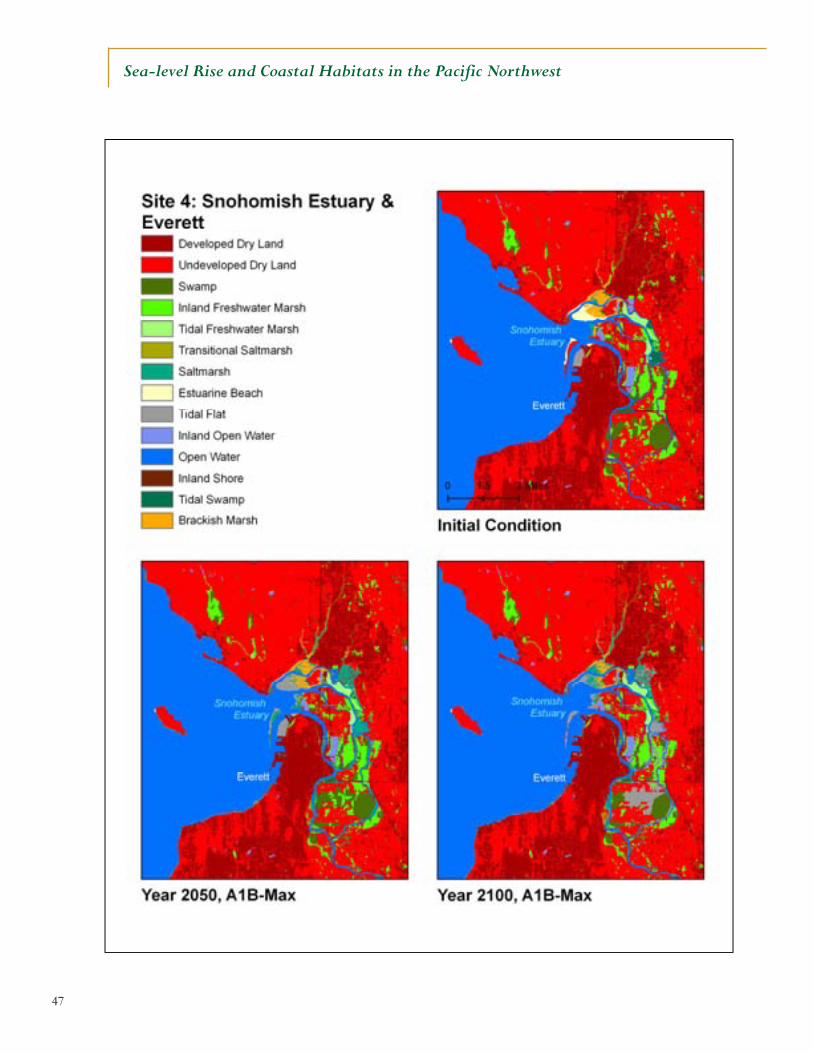
47
Sea-level Rise and Coastal Habitats in the Pacific Northwest
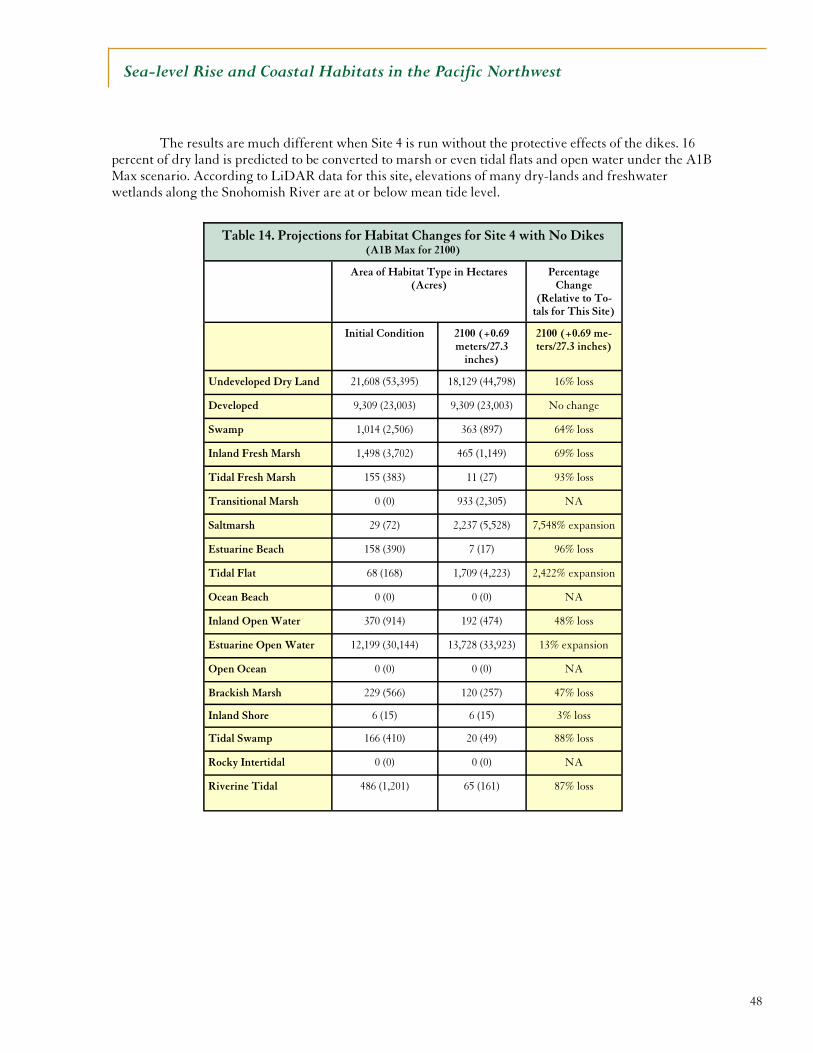
48
Sea-level Rise and Coastal Habitats in the Pacific Northwest
The results are much different when Site 4 is run without the protective effects of the dikes. 16 percent of dry land is predicted to be converted to marsh or even tidal flats and open water under the A1B Max scenario. According to LiDAR data for this site, elevations of many dry-lands and freshwater wetlands along the Snohomish River are at or below mean tide level.
Table 14. Projections for Habitat Changes for Site 4 with No Dikes (A1B Max for 2100)
Percentage Change
(Relative to To-tals for This Site)
Initial Condition 2100 (+0.69 meters/27.3
inches)
2100 (+0.69 me-ters/27.3 inches)
Undeveloped Dry Land 21,608 (53,395) 18,129 (44,798) 16% loss
Developed 9,309 (23,003) 9,309 (23,003) No change
Swamp 1,014 (2,506) 363 (897) 64% loss
Inland Fresh Marsh 1,498 (3,702) 465 (1,149) 69% loss
Tidal Fresh Marsh 155 (383) 11 (27) 93% loss
Transitional Marsh 0 (0) 933 (2,305) NA
Saltmarsh 29 (72) 2,237 (5,528) 7,548% expansion
Estuarine Beach 158 (390) 7 (17) 96% loss
Tidal Flat 68 (168) 1,709 (4,223) 2,422% expansion
Ocean Beach 0 (0) 0 (0) NA
Inland Open Water 370 (914) 192 (474) 48% loss
Estuarine Open Water 12,199 (30,144) 13,728 (33,923) 13% expansion
Open Ocean 0 (0) 0 (0) NA
Brackish Marsh 229 (566) 120 (257) 47% loss
Inland Shore 6 (15) 6 (15) 3% loss
Tidal Swamp 166 (410) 20 (49) 88% loss
Rocky Intertidal 0 (0) 0 (0) NA
Riverine Tidal 486 (1,201) 65 (161) 87% loss
Area of Habitat Type in Hectares (Acres)
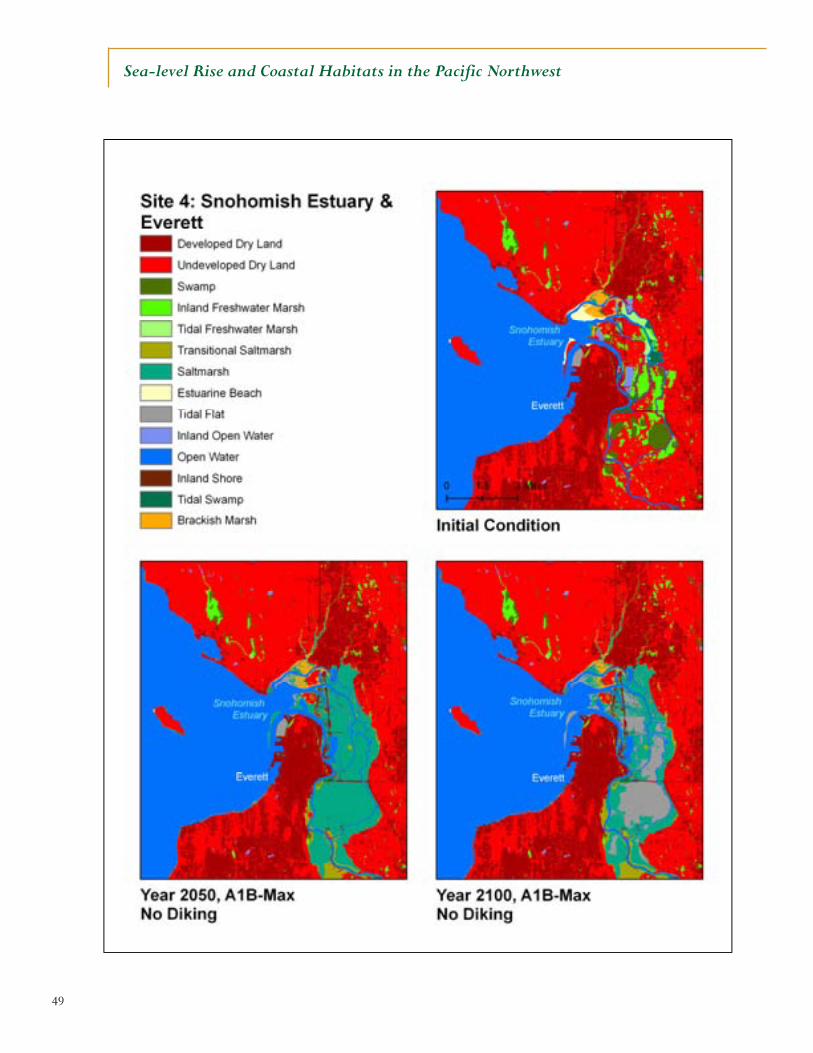
49
Sea-level Rise and Coastal Habitats in the Pacific Northwest
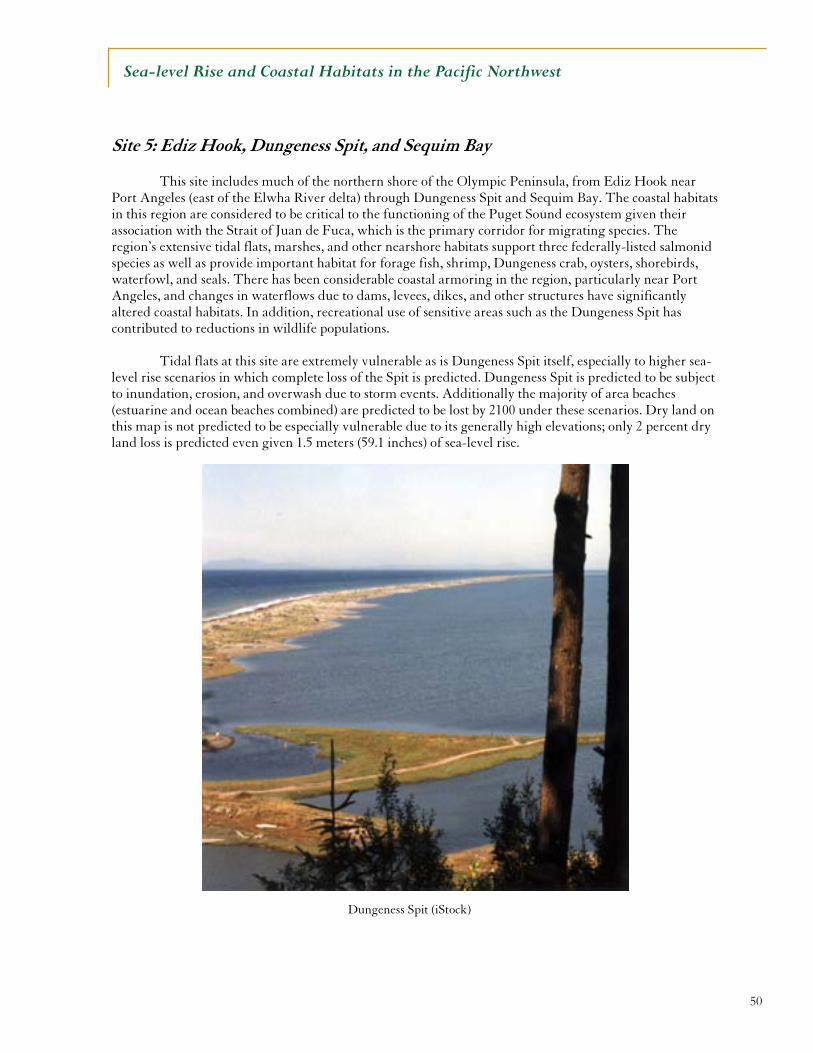
50
Sea-level Rise and Coastal Habitats in the Pacific Northwest
Site 5: Ediz Hook, Dungeness Spit, and Sequim Bay
This site includes much of the northern shore of the Olympic Peninsula, from Ediz Hook near Port Angeles (east of the Elwha River delta) through Dungeness Spit and Sequim Bay. The coastal habitats in this region are considered to be critical to the functioning of the Puget Sound ecosystem given their association with the Strait of Juan de Fuca, which is the primary corridor for migrating species. The region’s extensive tidal flats, marshes, and other nearshore habitats support three federally-listed salmonid species as well as provide important habitat for forage fish, shrimp, Dungeness crab, oysters, shorebirds, waterfowl, and seals. There has been considerable coastal armoring in the region, particularly near Port Angeles, and changes in waterflows due to dams, levees, dikes, and other structures have significantly altered coastal habitats. In addition, recreational use of sensitive areas such as the Dungeness Spit has contributed to reductions in wildlife populations.
Tidal flats at this site are extremely vulnerable as is Dungeness Spit itself, especially to higher sea-level rise scenarios in which complete loss of the Spit is predicted. Dungeness Spit is predicted to be subject to inundation, erosion, and overwash due to storm events. Additionally the majority of area beaches (estuarine and ocean beaches combined) are predicted to be lost by 2100 under these scenarios. Dry land on this map is not predicted to be especially vulnerable due to its generally high elevations; only 2 percent dry land loss is predicted even given 1.5 meters (59.1 inches) of sea-level rise.
Dungeness Spit (iStock)
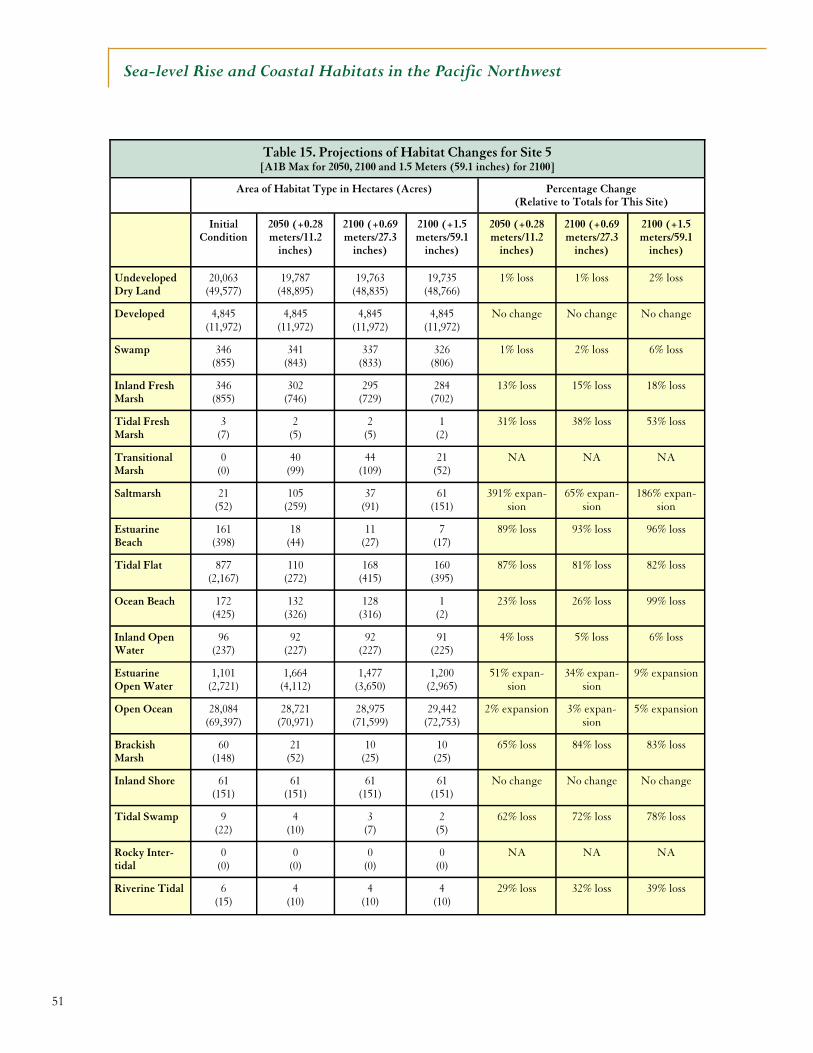
51
Sea-level Rise and Coastal Habitats in the Pacific Northwest
Table 15. Projections of Habitat Changes for Site 5 [A1B Max for 2050, 2100 and 1.5 Meters (59.1 inches) for 2100]
Area of Habitat Type in Hectares (Acres)
Initial Condition
2050 (+0.28 meters/11.2
inches)
2100 (+0.69 meters/27.3
inches)
2100 (+1.5 meters/59.1
inches)
2050 (+0.28 meters/11.2
inches)
2100 (+0.69 meters/27.3
inches)
2100 (+1.5 meters/59.1
inches)
Undeveloped Dry Land
20,063 (49,577)
19,787 (48,895)
19,763 (48,835)
19,735 (48,766)
1% loss 1% loss 2% loss
Developed 4,845 (11,972)
4,845 (11,972)
4,845 (11,972)
4,845 (11,972)
No change No change No change
Swamp 346 (855)
341 (843)
337 (833)
326 (806)
1% loss 2% loss 6% loss
Inland Fresh Marsh
346 (855)
302 (746)
295 (729)
284 (702)
13% loss 15% loss 18% loss
Tidal Fresh Marsh
3 (7)
2 (5)
2 (5)
1 (2)
31% loss 38% loss 53% loss
Transitional Marsh
0 (0)
40 (99)
44 (109)
21 (52)
NA NA NA
Saltmarsh 21 (52)
105 (259)
37 (91)
61 (151)
391% expan-sion
65% expan-sion
186% expan-sion
Estuarine Beach
161 (398)
18 (44)
11 (27)
7 (17)
89% loss 93% loss 96% loss
Tidal Flat 877 (2,167)
110 (272)
168 (415)
160 (395)
87% loss 81% loss 82% loss
Ocean Beach 172 (425)
132 (326)
128 (316)
1 (2)
23% loss 26% loss 99% loss
Inland Open Water
96 (237)
92 (227)
92 (227)
91 (225)
4% loss 5% loss 6% loss
Estuarine Open Water
1,101 (2,721)
1,664 (4,112)
1,477 (3,650)
1,200 (2,965)
51% expan-sion
34% expan-sion
9% expansion
Open Ocean 28,084 (69,397)
28,721 (70,971)
28,975 (71,599)
29,442 (72,753)
2% expansion 3% expan-sion
5% expansion
Brackish Marsh
60 (148)
21 (52)
10 (25)
10 (25)
65% loss 84% loss 83% loss
Inland Shore 61 (151)
61 (151)
61 (151)
61 (151)
No change No change No change
Tidal Swamp 9 (22)
4 (10)
3 (7)
2 (5)
62% loss 72% loss 78% loss
Rocky Inter-tidal
0 (0)
0 (0)
0 (0)
0 (0)
NA NA NA
Riverine Tidal 6 (15)
4 (10)
4 (10)
4 (10)
29% loss 32% loss 39% loss
Percentage Change (Relative to Totals for This Site)
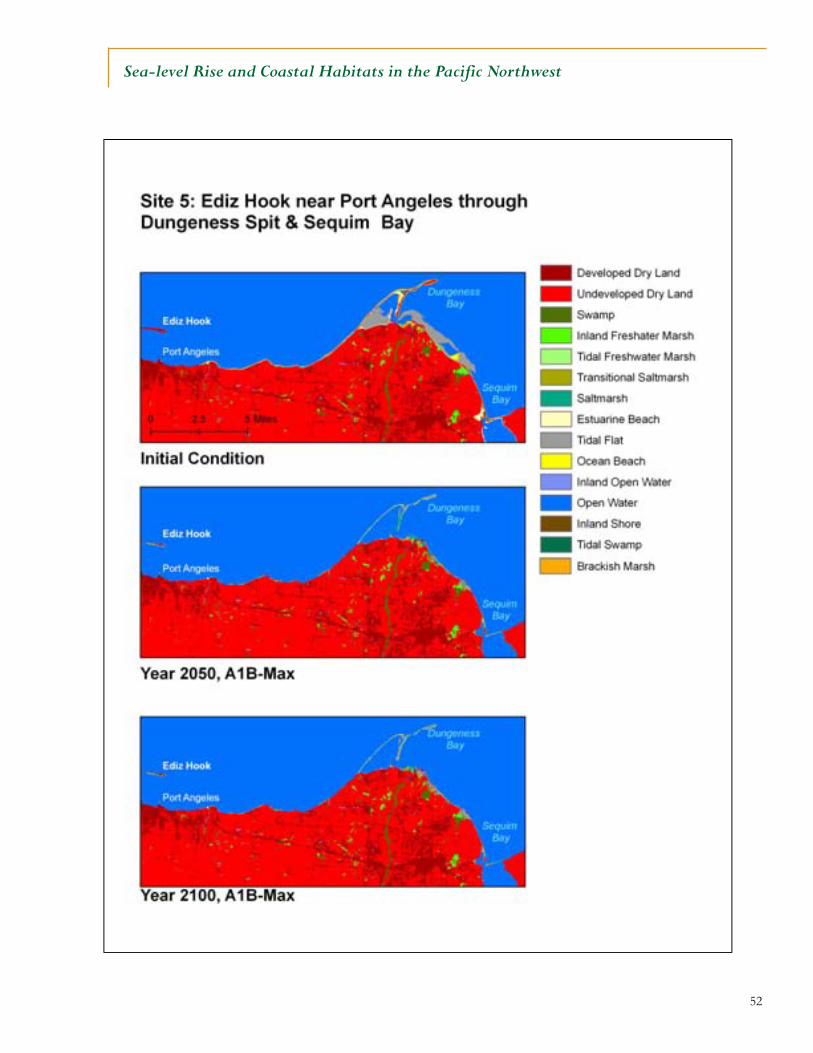
52
Sea-level Rise and Coastal Habitats in the Pacific Northwest
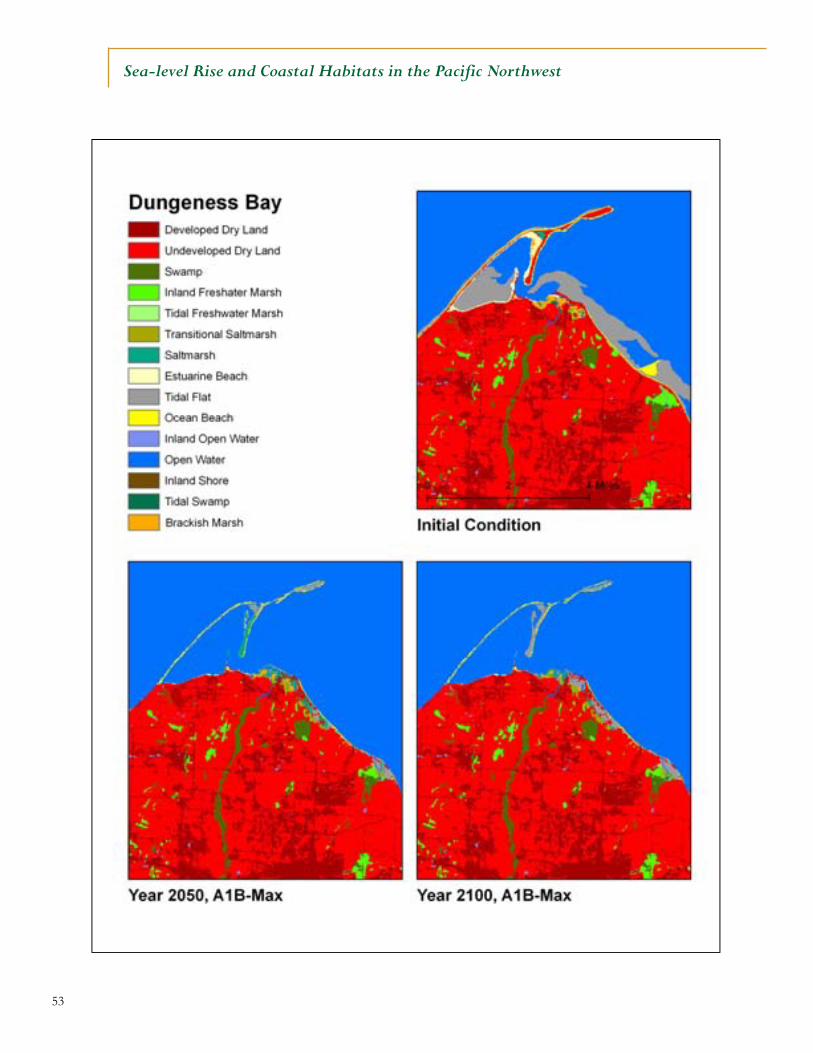
53
Sea-level Rise and Coastal Habitats in the Pacific Northwest
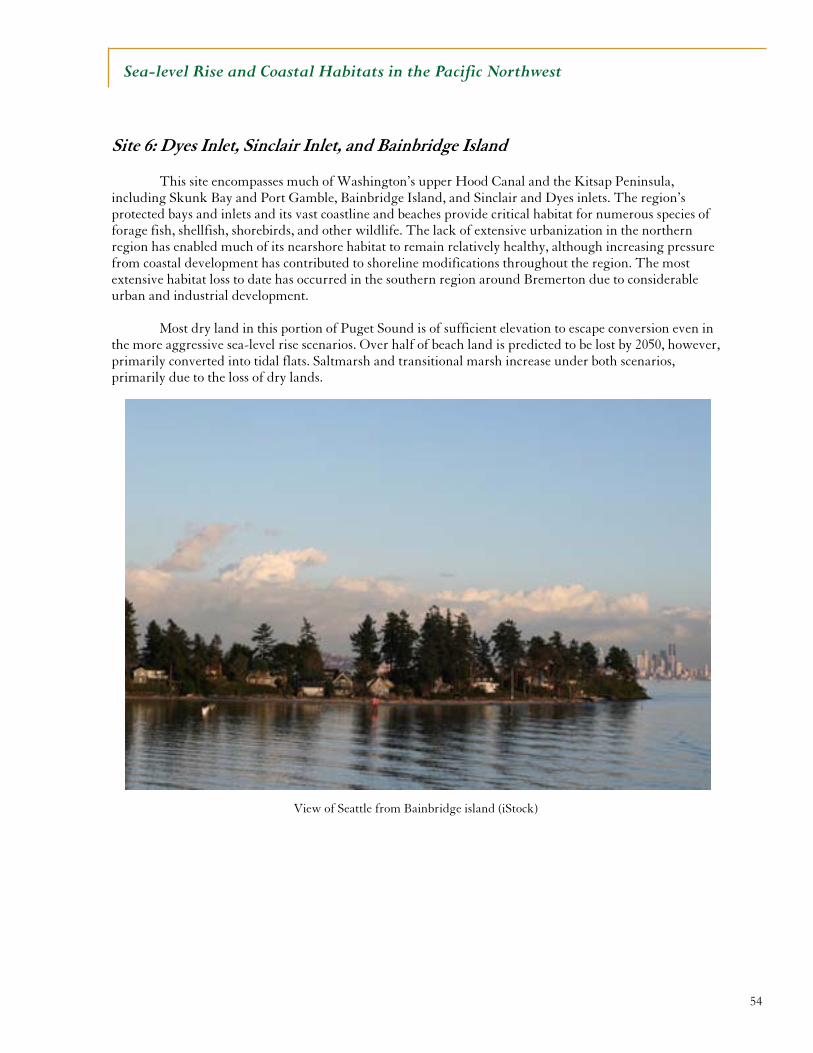
54
Sea-level Rise and Coastal Habitats in the Pacific Northwest
Site 6: Dyes Inlet, Sinclair Inlet, and Bainbridge Island
This site encompasses much of Washington’s upper Hood Canal and the Kitsap Peninsula, including Skunk Bay and Port Gamble, Bainbridge Island, and Sinclair and Dyes inlets. The region’s protected bays and inlets and its vast coastline and beaches provide critical habitat for numerous species of forage fish, shellfish, shorebirds, and other wildlife. The lack of extensive urbanization in the northern region has enabled much of its nearshore habitat to remain relatively healthy, although increasing pressure from coastal development has contributed to shoreline modifications throughout the region. The most extensive habitat loss to date has occurred in the southern region around Bremerton due to considerable urban and industrial development.
Most dry land in this portion of Puget Sound is of sufficient elevation to escape conversion even in the more aggressive sea-level rise scenarios. Over half of beach land is predicted to be lost by 2050, however, primarily converted into tidal flats. Saltmarsh and transitional marsh increase under both scenarios, primarily due to the loss of dry lands.
View of Seattle from Bainbridge island (iStock)
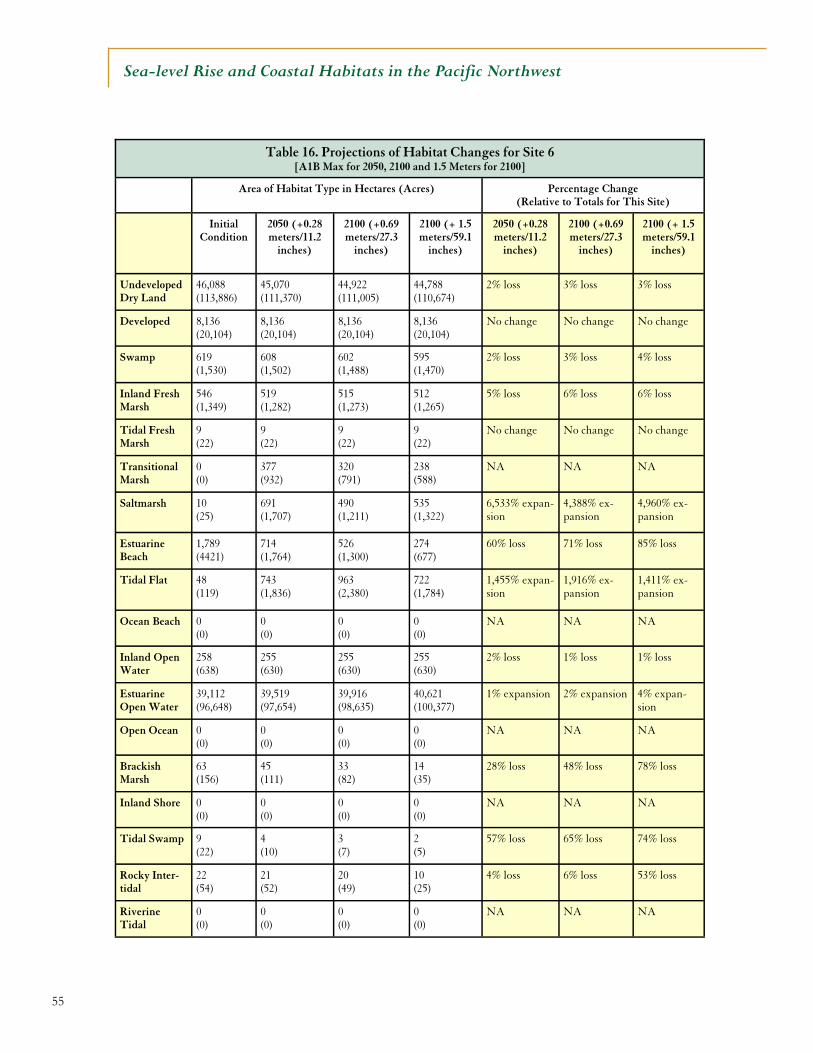
55
Sea-level Rise and Coastal Habitats in the Pacific Northwest
Table 16. Projections of Habitat Changes for Site 6 [A1B Max for 2050, 2100 and 1.5 Meters for 2100]
Percentage Change (Relative to Totals for This Site)
Initial Condition
2050 (+0.28 meters/11.2
inches)
2100 (+0.69 meters/27.3
inches)
2100 (+ 1.5 meters/59.1
inches)
2050 (+0.28 meters/11.2
inches)
2100 (+0.69 meters/27.3
inches)
2100 (+ 1.5 meters/59.1
inches)
Undeveloped Dry Land
46,088 (113,886)
45,070 (111,370)
44,922 (111,005)
44,788 (110,674)
2% loss 3% loss 3% loss
Developed 8,136 (20,104)
8,136 (20,104)
8,136 (20,104)
8,136 (20,104)
No change No change No change
Swamp 619 (1,530)
608 (1,502)
602 (1,488)
595 (1,470)
2% loss 3% loss 4% loss
Inland Fresh Marsh
546 (1,349)
519 (1,282)
515 (1,273)
512 (1,265)
5% loss 6% loss 6% loss
Tidal Fresh Marsh
9 (22)
9 (22)
9 (22)
9 (22)
No change No change No change
Transitional Marsh
0 (0)
377 (932)
320 (791)
238 (588)
NA NA NA
Saltmarsh 10 (25)
691 (1,707)
490 (1,211)
535 (1,322)
6,533% expan-sion
4,388% ex-pansion
4,960% ex-pansion
Estuarine Beach
1,789 (4421)
714 (1,764)
526 (1,300)
274 (677)
60% loss 71% loss 85% loss
Tidal Flat 48 (119)
743 (1,836)
963 (2,380)
722 (1,784)
1,455% expan-sion
1,916% ex-pansion
1,411% ex-pansion
Ocean Beach 0 (0)
0 (0)
0 (0)
0 (0)
NA NA NA
Inland Open Water
258 (638)
255 (630)
255 (630)
255 (630)
2% loss 1% loss 1% loss
Estuarine Open Water
39,112 (96,648)
39,519 (97,654)
39,916 (98,635)
40,621 (100,377)
1% expansion 2% expansion 4% expan-sion
Open Ocean 0 (0)
0 (0)
0 (0)
0 (0)
NA NA NA
Brackish Marsh
63 (156)
45 (111)
33 (82)
14 (35)
28% loss 48% loss 78% loss
Inland Shore 0 (0)
0 (0)
0 (0)
0 (0)
NA NA NA
Tidal Swamp 9 (22)
4 (10)
3 (7)
2 (5)
57% loss 65% loss 74% loss
Rocky Inter-tidal
22 (54)
21 (52)
20 (49)
10 (25)
4% loss 6% loss 53% loss
Riverine Tidal
0 (0)
0 (0)
0 (0)
0 (0)
NA NA NA
Area of Habitat Type in Hectares (Acres)
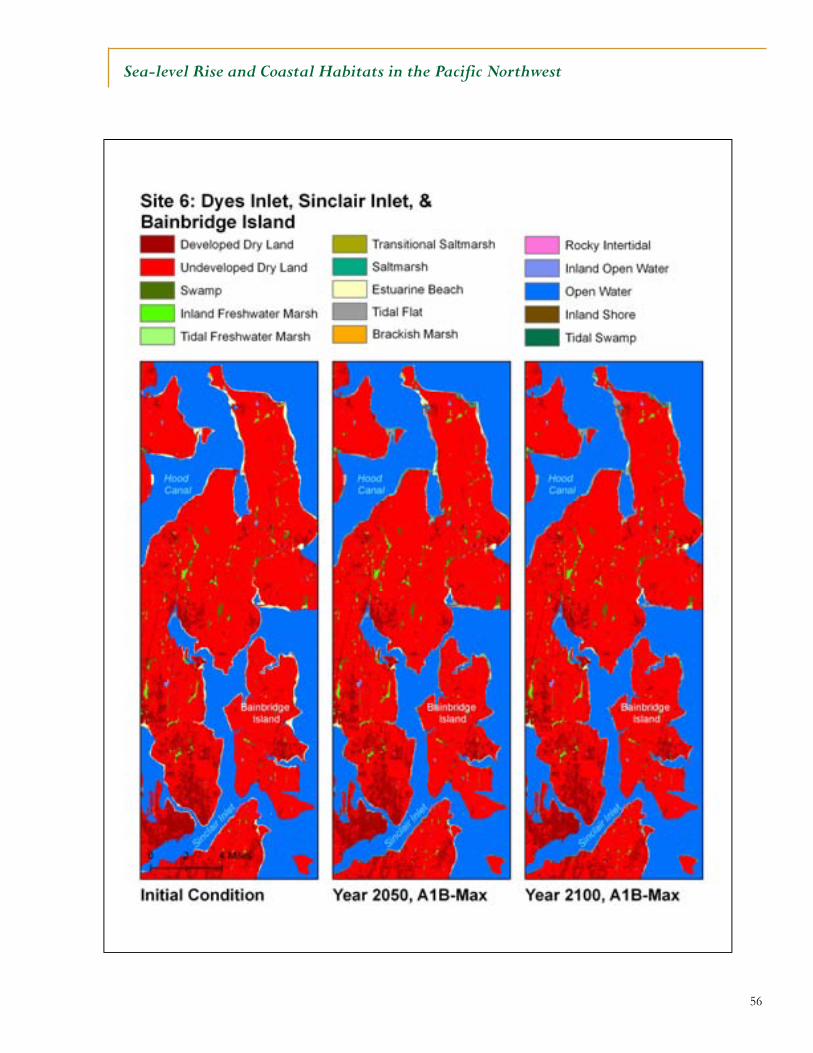
56
Sea-level Rise and Coastal Habitats in the Pacific Northwest
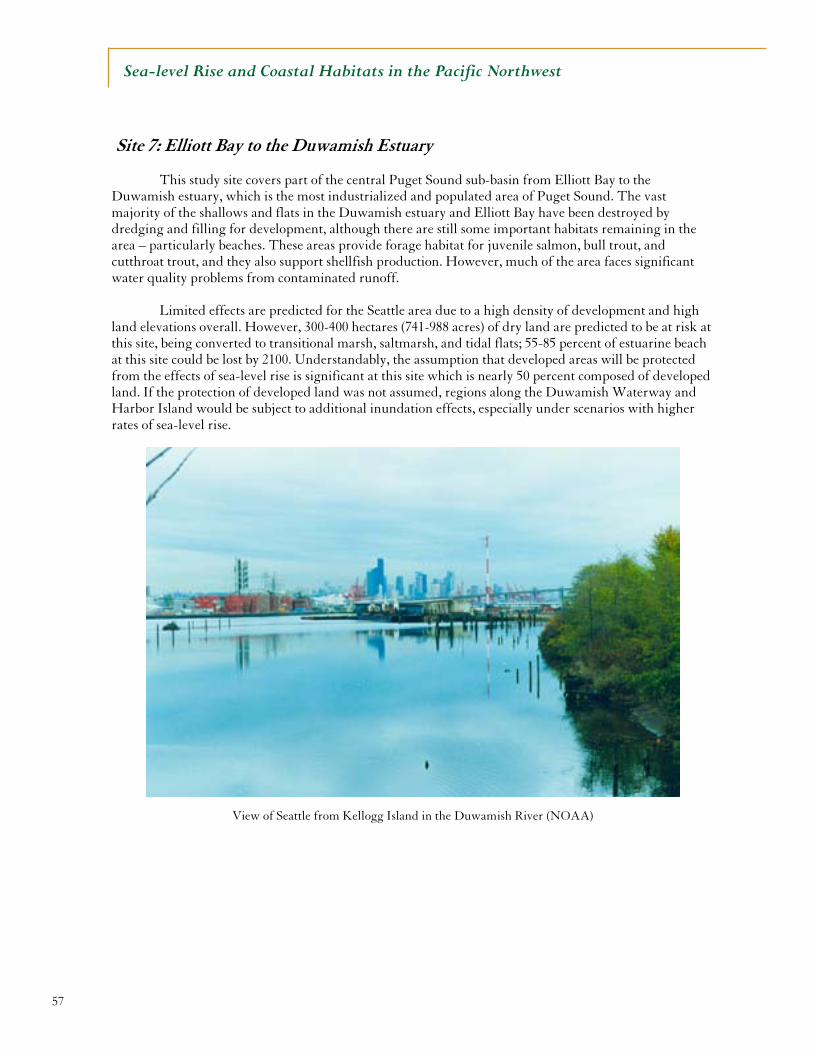
57
Sea-level Rise and Coastal Habitats in the Pacific Northwest
Site 7: Elliott Bay to the Duwamish Estuary
This study site covers part of the central Puget Sound sub-basin from Elliott Bay to the Duwamish estuary, which is the most industrialized and populated area of Puget Sound. The vast majority of the shallows and flats in the Duwamish estuary and Elliott Bay have been destroyed by dredging and filling for development, although there are still some important habitats remaining in the area – particularly beaches. These areas provide forage habitat for juvenile salmon, bull trout, and cutthroat trout, and they also support shellfish production. However, much of the area faces significant water quality problems from contaminated runoff. Limited effects are predicted for the Seattle area due to a high density of development and high land elevations overall. However, 300-400 hectares (741-988 acres) of dry land are predicted to be at risk at this site, being converted to transitional marsh, saltmarsh, and tidal flats; 55-85 percent of estuarine beach at this site could be lost by 2100. Understandably, the assumption that developed areas will be protected from the effects of sea-level rise is significant at this site which is nearly 50 percent composed of developed land. If the protection of developed land was not assumed, regions along the Duwamish Waterway and Harbor Island would be subject to additional inundation effects, especially under scenarios with higher rates of sea-level rise.
View of Seattle from Kellogg Island in the Duwamish River (NOAA)
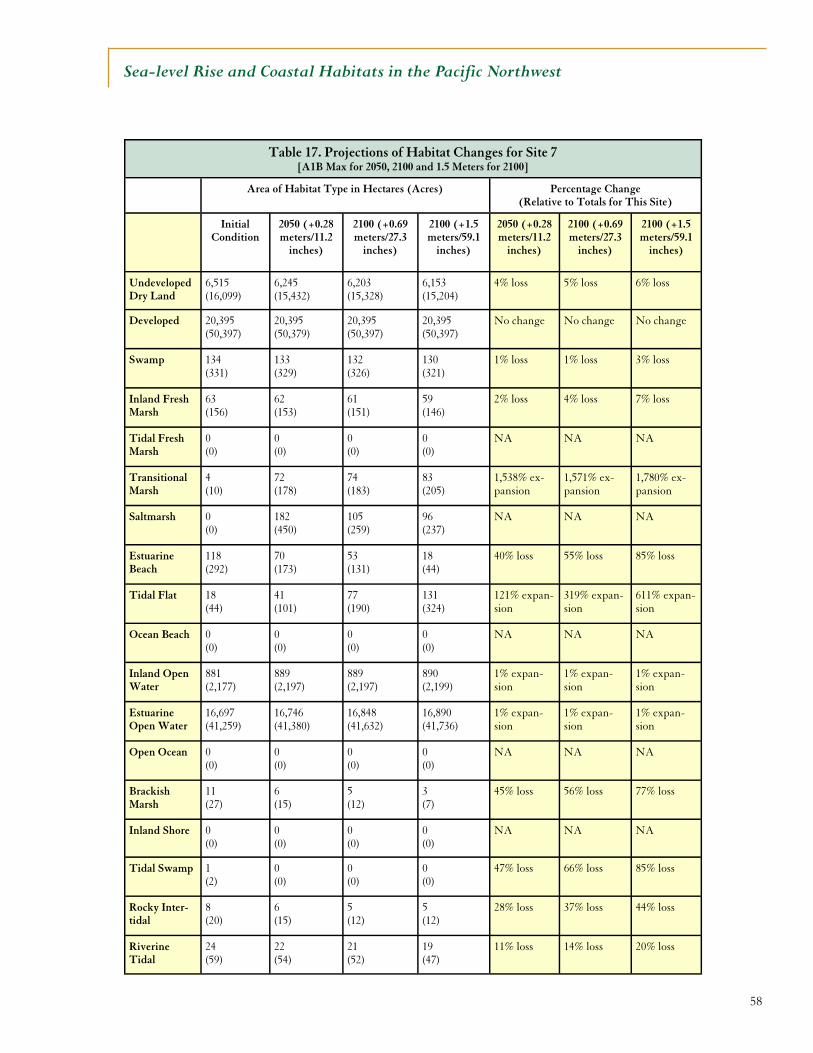
58
Sea-level Rise and Coastal Habitats in the Pacific Northwest
Table 17. Projections of Habitat Changes for Site 7 [A1B Max for 2050, 2100 and 1.5 Meters for 2100]
Percentage Change (Relative to Totals for This Site)
Initial Condition
2050 (+0.28 meters/11.2
inches)
2100 (+0.69 meters/27.3
inches)
2100 (+1.5 meters/59.1
inches)
2050 (+0.28 meters/11.2
inches)
2100 (+0.69 meters/27.3
inches)
2100 (+1.5 meters/59.1
inches)
Undeveloped Dry Land
6,515 (16,099)
6,245 (15,432)
6,203 (15,328)
6,153 (15,204)
4% loss 5% loss 6% loss
Developed 20,395 (50,397)
20,395 (50,379)
20,395 (50,397)
20,395 (50,397)
No change No change No change
Swamp 134 (331)
133 (329)
132 (326)
130 (321)
1% loss 1% loss 3% loss
Inland Fresh Marsh
63 (156)
62 (153)
61 (151)
59 (146)
2% loss 4% loss 7% loss
Tidal Fresh Marsh
0 (0)
0 (0)
0 (0)
0 (0)
NA NA NA
Transitional Marsh
4 (10)
72 (178)
74 (183)
83 (205)
1,538% ex-pansion
1,571% ex-pansion
1,780% ex-pansion
Saltmarsh 0 (0)
182 (450)
105 (259)
96 (237)
NA NA NA
Estuarine Beach
118 (292)
70 (173)
53 (131)
18 (44)
40% loss 55% loss 85% loss
Tidal Flat 18 (44)
41 (101)
77 (190)
131 (324)
121% expan-sion
319% expan-sion
611% expan-sion
Ocean Beach 0 (0)
0 (0)
0 (0)
0 (0)
NA NA NA
Inland Open Water
881 (2,177)
889 (2,197)
889 (2,197)
890 (2,199)
1% expan-sion
1% expan-sion
1% expan-sion
Estuarine Open Water
16,697 (41,259)
16,746 (41,380)
16,848 (41,632)
16,890 (41,736)
1% expan-sion
1% expan-sion
1% expan-sion
Open Ocean 0 (0)
0 (0)
0 (0)
0 (0)
NA NA NA
Brackish Marsh
11 (27)
6 (15)
5 (12)
3 (7)
45% loss 56% loss 77% loss
Inland Shore 0 (0)
0 (0)
0 (0)
0 (0)
NA NA NA
Tidal Swamp 1 (2)
0 (0)
0 (0)
0 (0)
47% loss 66% loss 85% loss
Rocky Inter-tidal
8 (20)
6 (15)
5 (12)
5 (12)
28% loss 37% loss 44% loss
Riverine Tidal
24 (59)
22 (54)
21 (52)
19 (47)
11% loss 14% loss 20% loss
Area of Habitat Type in Hectares (Acres)
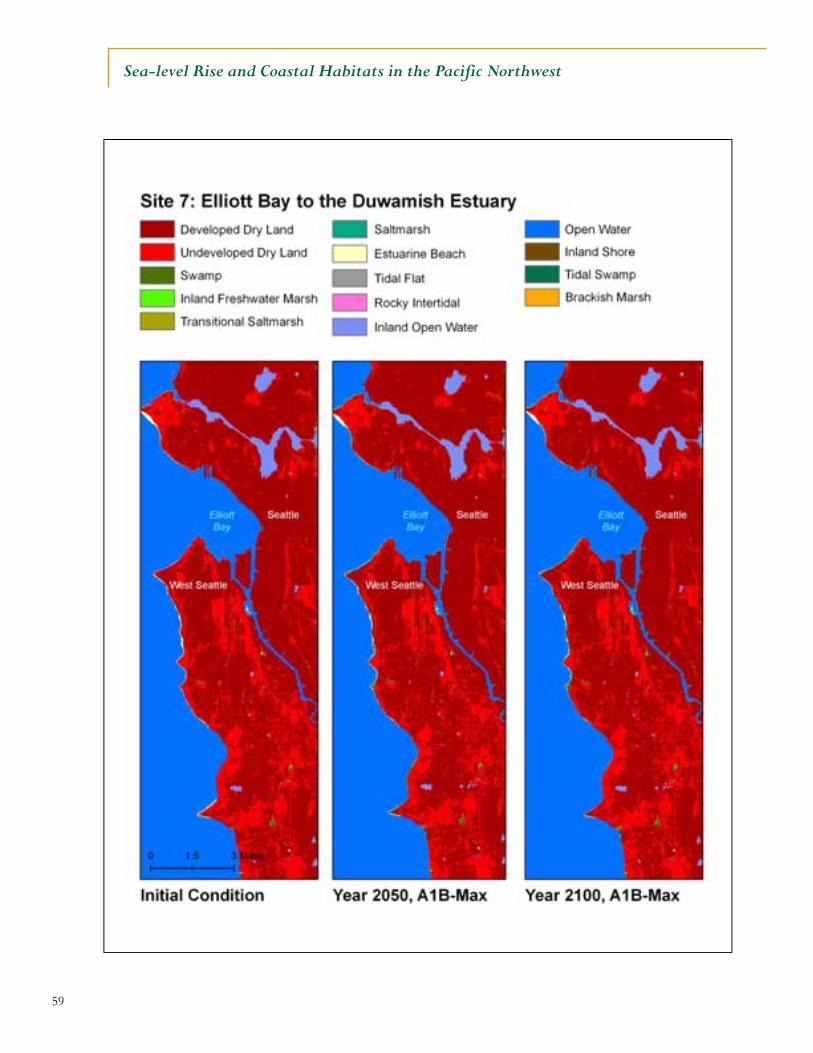
59
Sea-level Rise and Coastal Habitats in the Pacific Northwest
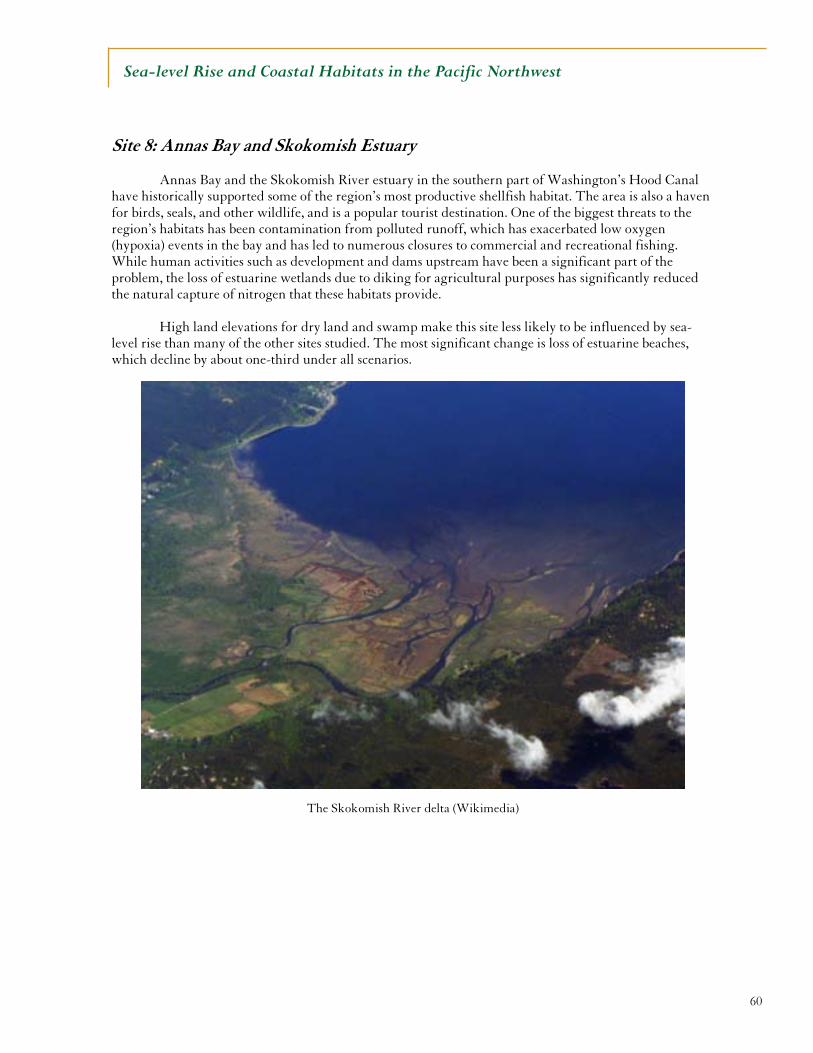
60
Sea-level Rise and Coastal Habitats in the Pacific Northwest
Site 8: Annas Bay and Skokomish Estuary
Annas Bay and the Skokomish River estuary in the southern part of Washington’s Hood Canal have historically supported some of the region’s most productive shellfish habitat. The area is also a haven for birds, seals, and other wildlife, and is a popular tourist destination. One of the biggest threats to the region’s habitats has been contamination from polluted runoff, which has exacerbated low oxygen (hypoxia) events in the bay and has led to numerous closures to commercial and recreational fishing. While human activities such as development and dams upstream have been a significant part of the problem, the loss of estuarine wetlands due to diking for agricultural purposes has significantly reduced the natural capture of nitrogen that these habitats provide.
High land elevations for dry land and swamp make this site less likely to be influenced by sea-
level rise than many of the other sites studied. The most significant change is loss of estuarine beaches, which decline by about one-third under all scenarios.
The Skokomish River delta (Wikimedia)
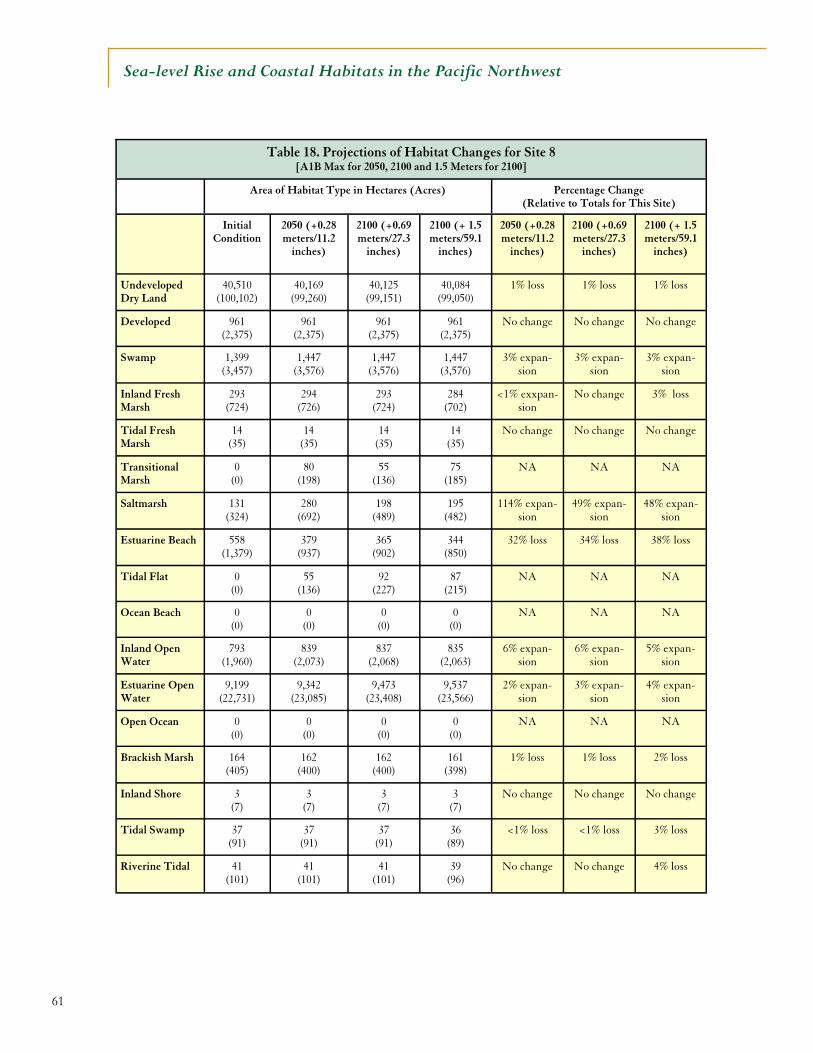
61
Sea-level Rise and Coastal Habitats in the Pacific Northwest
Table 18. Projections of Habitat Changes for Site 8 [A1B Max for 2050, 2100 and 1.5 Meters for 2100]
Area of Habitat Type in Hectares (Acres) Percentage Change (Relative to Totals for This Site)
Initial Condition
2050 (+0.28 meters/11.2
inches)
2100 (+0.69 meters/27.3
inches)
2100 (+ 1.5 meters/59.1
inches)
2050 (+0.28 meters/11.2
inches)
2100 (+0.69 meters/27.3
inches)
2100 (+ 1.5 meters/59.1
inches)
Undeveloped Dry Land
40,510 (100,102)
40,169 (99,260)
40,125 (99,151)
40,084 (99,050)
1% loss 1% loss 1% loss
Developed 961 (2,375)
961 (2,375)
961 (2,375)
961 (2,375)
No change No change No change
Swamp 1,399 (3,457)
1,447 (3,576)
1,447 (3,576)
1,447 (3,576)
3% expan-sion
3% expan-sion
3% expan-sion
Inland Fresh Marsh
293 (724)
294 (726)
293 (724)
284 (702)
<1% exxpan-sion
No change 3% loss
Tidal Fresh Marsh
14 (35)
14 (35)
14 (35)
14 (35)
No change No change No change
Transitional Marsh
0 (0)
80 (198)
55 (136)
75 (185)
NA NA NA
Saltmarsh 131 (324)
280 (692)
198 (489)
195 (482)
114% expan-sion
49% expan-sion
48% expan-sion
Estuarine Beach 558 (1,379)
379 (937)
365 (902)
344 (850)
32% loss 34% loss 38% loss
Tidal Flat 0 (0)
55 (136)
92 (227)
87 (215)
NA NA NA
Ocean Beach 0 (0)
0 (0)
0 (0)
0 (0)
NA NA NA
Inland Open Water
793 (1,960)
839 (2,073)
837 (2,068)
835 (2,063)
6% expan-sion
6% expan-sion
5% expan-sion
Estuarine Open Water
9,199 (22,731)
9,342 (23,085)
9,473 (23,408)
9,537 (23,566)
2% expan-sion
3% expan-sion
4% expan-sion
Open Ocean 0 (0)
0 (0)
0 (0)
0 (0)
NA NA NA
Brackish Marsh 164 (405)
162 (400)
162 (400)
161 (398)
1% loss 1% loss 2% loss
Inland Shore 3 (7)
3 (7)
3 (7)
3 (7)
No change No change No change
Tidal Swamp 37 (91)
37 (91)
37 (91)
36 (89)
<1% loss <1% loss 3% loss
Riverine Tidal 41 (101)
41 (101)
41 (101)
39 (96)
No change No change 4% loss
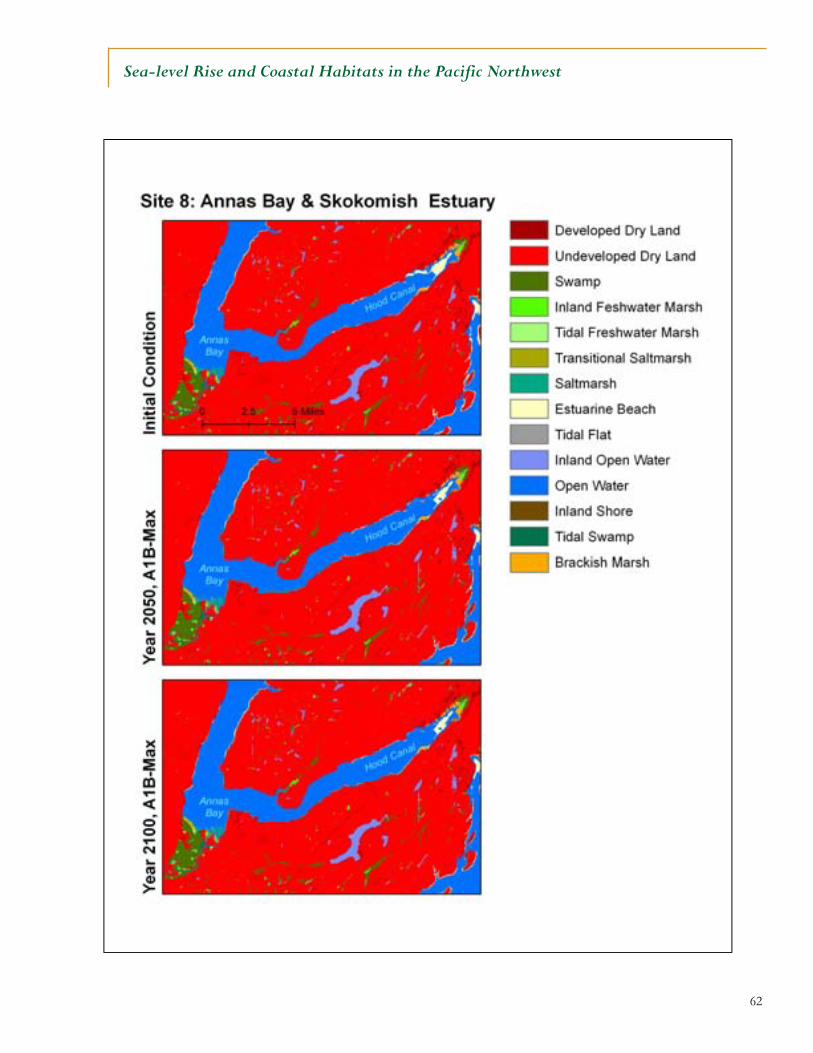
62
Sea-level Rise and Coastal Habitats in the Pacific Northwest
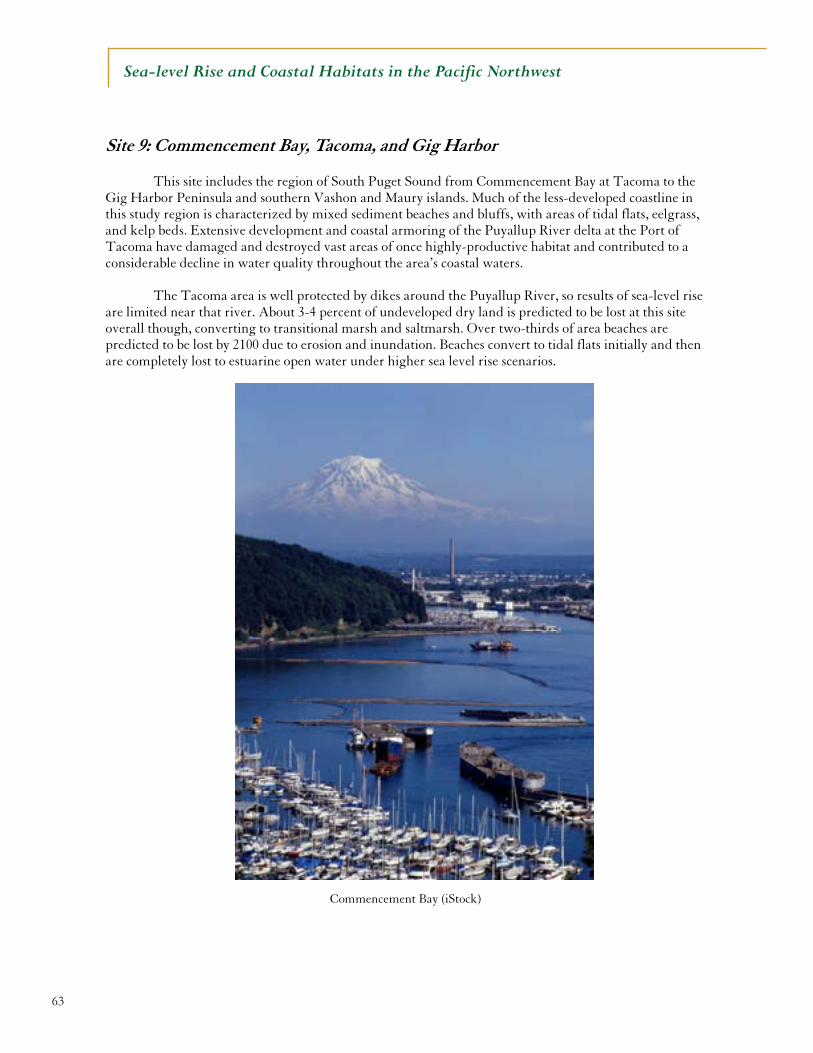
63
Sea-level Rise and Coastal Habitats in the Pacific Northwest
Site 9: Commencement Bay, Tacoma, and Gig Harbor
This site includes the region of South Puget Sound from Commencement Bay at Tacoma to the Gig Harbor Peninsula and southern Vashon and Maury islands. Much of the less-developed coastline in this study region is characterized by mixed sediment beaches and bluffs, with areas of tidal flats, eelgrass, and kelp beds. Extensive development and coastal armoring of the Puyallup River delta at the Port of Tacoma have damaged and destroyed vast areas of once highly-productive habitat and contributed to a considerable decline in water quality throughout the area’s coastal waters.
The Tacoma area is well protected by dikes around the Puyallup River, so results of sea-level rise are limited near that river. About 3-4 percent of undeveloped dry land is predicted to be lost at this site overall though, converting to transitional marsh and saltmarsh. Over two-thirds of area beaches are predicted to be lost by 2100 due to erosion and inundation. Beaches convert to tidal flats initially and then are completely lost to estuarine open water under higher sea level rise scenarios.
Commencement Bay (iStock)
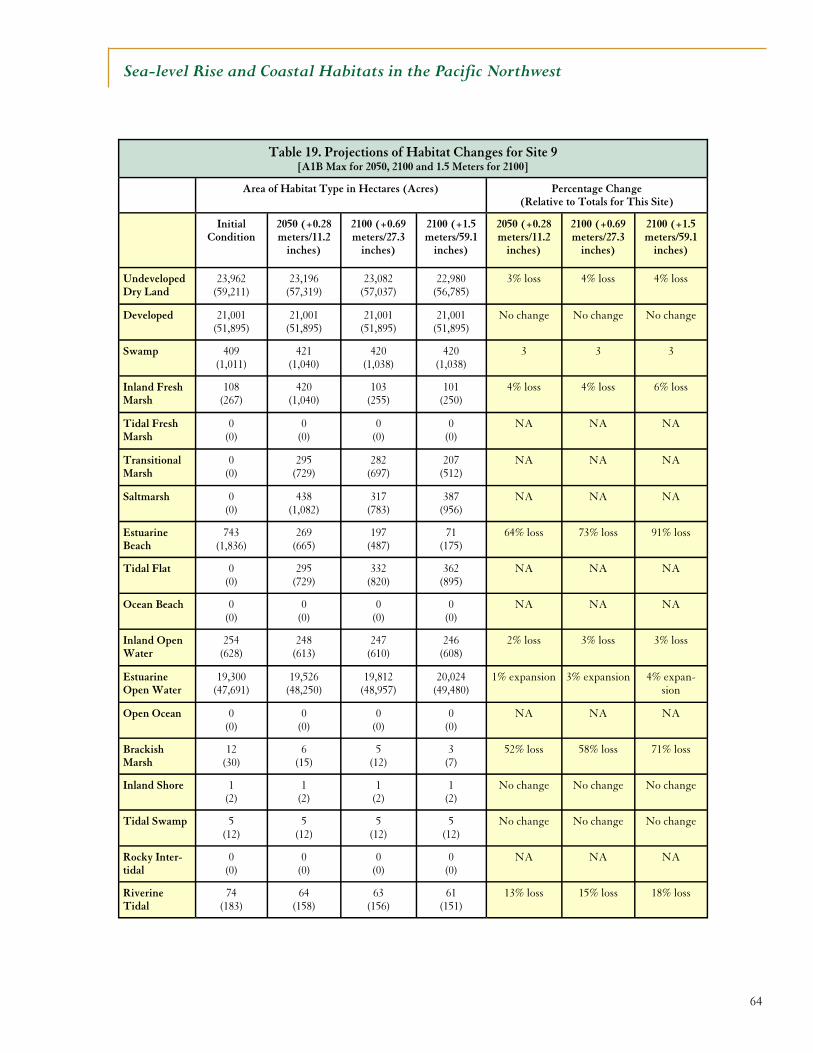
64
Sea-level Rise and Coastal Habitats in the Pacific Northwest
Table 19. Projections of Habitat Changes for Site 9 [A1B Max for 2050, 2100 and 1.5 Meters for 2100]
Area of Habitat Type in Hectares (Acres)
Initial Condition
2050 (+0.28 meters/11.2
inches)
2100 (+0.69 meters/27.3
inches)
2100 (+1.5 meters/59.1
inches)
2050 (+0.28 meters/11.2
inches)
2100 (+0.69 meters/27.3
inches)
2100 (+1.5 meters/59.1
inches)
Undeveloped Dry Land
23,962 (59,211)
23,196 (57,319)
23,082 (57,037)
22,980 (56,785)
3% loss 4% loss 4% loss
Developed 21,001 (51,895)
21,001 (51,895)
21,001 (51,895)
21,001 (51,895)
No change No change No change
Swamp 409 (1,011)
421 (1,040)
420 (1,038)
420 (1,038)
3 3 3
Inland Fresh Marsh
108 (267)
420 (1,040)
103 (255)
101 (250)
4% loss 4% loss 6% loss
Tidal Fresh Marsh
0 (0)
0 (0)
0 (0)
0 (0)
NA NA NA
Transitional Marsh
0 (0)
295 (729)
282 (697)
207 (512)
NA NA NA
Saltmarsh 0 (0)
438 (1,082)
317 (783)
387 (956)
NA NA NA
Estuarine Beach
743 (1,836)
269 (665)
197 (487)
71 (175)
64% loss 73% loss 91% loss
Tidal Flat 0 (0)
295 (729)
332 (820)
362 (895)
NA NA NA
Ocean Beach 0 (0)
0 (0)
0 (0)
0 (0)
NA NA NA
Inland Open Water
254 (628)
248 (613)
247 (610)
246 (608)
2% loss 3% loss 3% loss
Estuarine Open Water
19,300 (47,691)
19,526 (48,250)
19,812 (48,957)
20,024 (49,480)
1% expansion 3% expansion 4% expan-sion
Open Ocean 0 (0)
0 (0)
0 (0)
0 (0)
NA NA NA
Brackish Marsh
12 (30)
6 (15)
5 (12)
3 (7)
52% loss 58% loss 71% loss
Inland Shore 1 (2)
1 (2)
1 (2)
1 (2)
No change No change No change
Tidal Swamp 5 (12)
5 (12)
5 (12)
5 (12)
No change No change No change
Rocky Inter-tidal
0 (0)
0 (0)
0 (0)
0 (0)
NA NA NA
Riverine Tidal
74 (183)
64 (158)
63 (156)
61 (151)
13% loss 15% loss 18% loss
Percentage Change (Relative to Totals for This Site)
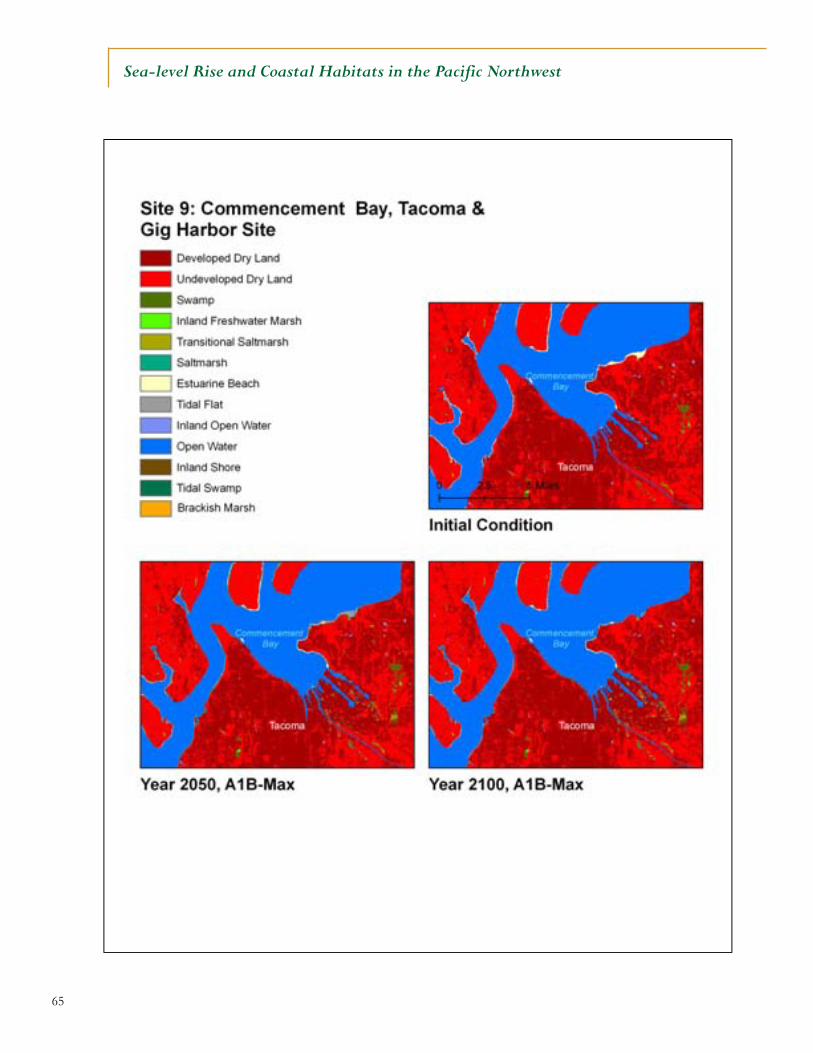
65
Sea-level Rise and Coastal Habitats in the Pacific Northwest
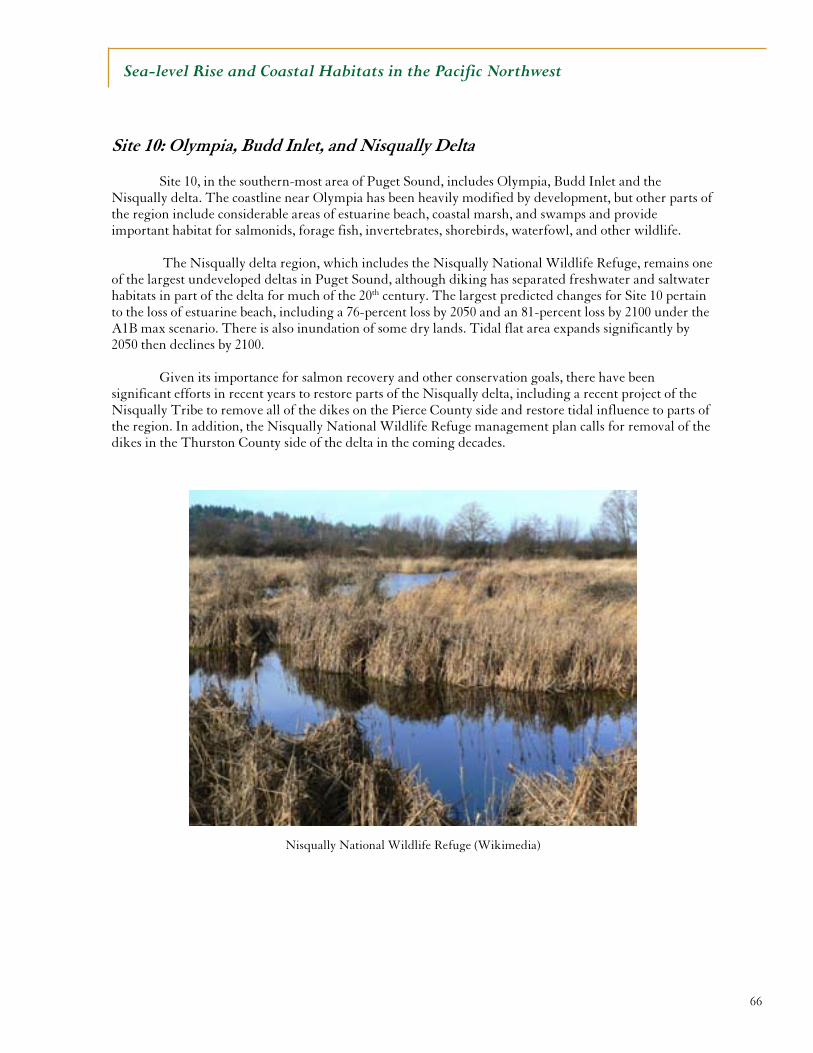
66
Sea-level Rise and Coastal Habitats in the Pacific Northwest
Site 10: Olympia, Budd Inlet, and Nisqually Delta
Site 10, in the southern-most area of Puget Sound, includes Olympia, Budd Inlet and the Nisqually delta. The coastline near Olympia has been heavily modified by development, but other parts of the region include considerable areas of estuarine beach, coastal marsh, and swamps and provide important habitat for salmonids, forage fish, invertebrates, shorebirds, waterfowl, and other wildlife.
The Nisqually delta region, which includes the Nisqually National Wildlife Refuge, remains one
of the largest undeveloped deltas in Puget Sound, although diking has separated freshwater and saltwater habitats in part of the delta for much of the 20th century. The largest predicted changes for Site 10 pertain to the loss of estuarine beach, including a 76-percent loss by 2050 and an 81-percent loss by 2100 under the A1B max scenario. There is also inundation of some dry lands. Tidal flat area expands significantly by 2050 then declines by 2100. Given its importance for salmon recovery and other conservation goals, there have been significant efforts in recent years to restore parts of the Nisqually delta, including a recent project of the Nisqually Tribe to remove all of the dikes on the Pierce County side and restore tidal influence to parts of the region. In addition, the Nisqually National Wildlife Refuge management plan calls for removal of the dikes in the Thurston County side of the delta in the coming decades.
Nisqually National Wildlife Refuge (Wikimedia)
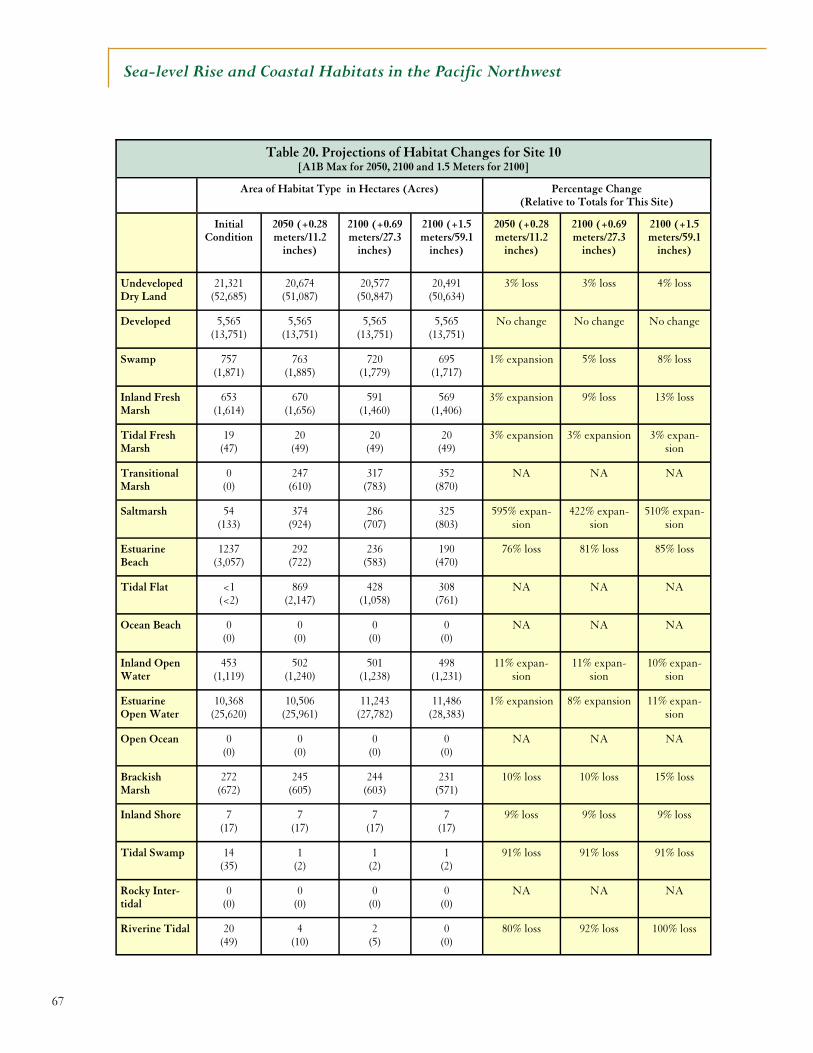
67
Sea-level Rise and Coastal Habitats in the Pacific Northwest
Table 20. Projections of Habitat Changes for Site 10 [A1B Max for 2050, 2100 and 1.5 Meters for 2100]
Percentage Change (Relative to Totals for This Site)
Initial Condition
2050 (+0.28 meters/11.2
inches)
2100 (+0.69 meters/27.3
inches)
2100 (+1.5 meters/59.1
inches)
2050 (+0.28 meters/11.2
inches)
2100 (+0.69 meters/27.3
inches)
2100 (+1.5 meters/59.1
inches)
Undeveloped Dry Land
21,321 (52,685)
20,674 (51,087)
20,577 (50,847)
20,491 (50,634)
3% loss 3% loss 4% loss
Developed 5,565 (13,751)
5,565 (13,751)
5,565 (13,751)
5,565 (13,751)
No change No change No change
Swamp 757 (1,871)
763 (1,885)
720 (1,779)
695 (1,717)
1% expansion 5% loss 8% loss
Inland Fresh Marsh
653 (1,614)
670 (1,656)
591 (1,460)
569 (1,406)
3% expansion 9% loss 13% loss
Tidal Fresh Marsh
19 (47)
20 (49)
20 (49)
20 (49)
3% expansion 3% expansion 3% expan-sion
Transitional Marsh
0 (0)
247 (610)
317 (783)
352 (870)
NA NA NA
Saltmarsh 54 (133)
374 (924)
286 (707)
325 (803)
595% expan-sion
422% expan-sion
510% expan-sion
Estuarine Beach
1237 (3,057)
292 (722)
236 (583)
190 (470)
76% loss 81% loss 85% loss
Tidal Flat <1 (<2)
869 (2,147)
428 (1,058)
308 (761)
NA NA NA
Ocean Beach 0 (0)
0 (0)
0 (0)
0 (0)
NA NA NA
Inland Open Water
453 (1,119)
502 (1,240)
501 (1,238)
498 (1,231)
11% expan-sion
11% expan-sion
10% expan-sion
Estuarine Open Water
10,368 (25,620)
10,506 (25,961)
11,243 (27,782)
11,486 (28,383)
1% expansion 8% expansion 11% expan-sion
Open Ocean 0 (0)
0 (0)
0 (0)
0 (0)
NA NA NA
Brackish Marsh
272 (672)
245 (605)
244 (603)
231 (571)
10% loss 10% loss 15% loss
Inland Shore 7 (17)
7 (17)
7 (17)
7 (17)
9% loss 9% loss 9% loss
Tidal Swamp 14 (35)
1 (2)
1 (2)
1 (2)
91% loss 91% loss 91% loss
Rocky Inter-tidal
0 (0)
0 (0)
0 (0)
0 (0)
NA NA NA
Riverine Tidal 20 (49)
4 (10)
2 (5)
0 (0)
80% loss 92% loss 100% loss
Area of Habitat Type in Hectares (Acres)
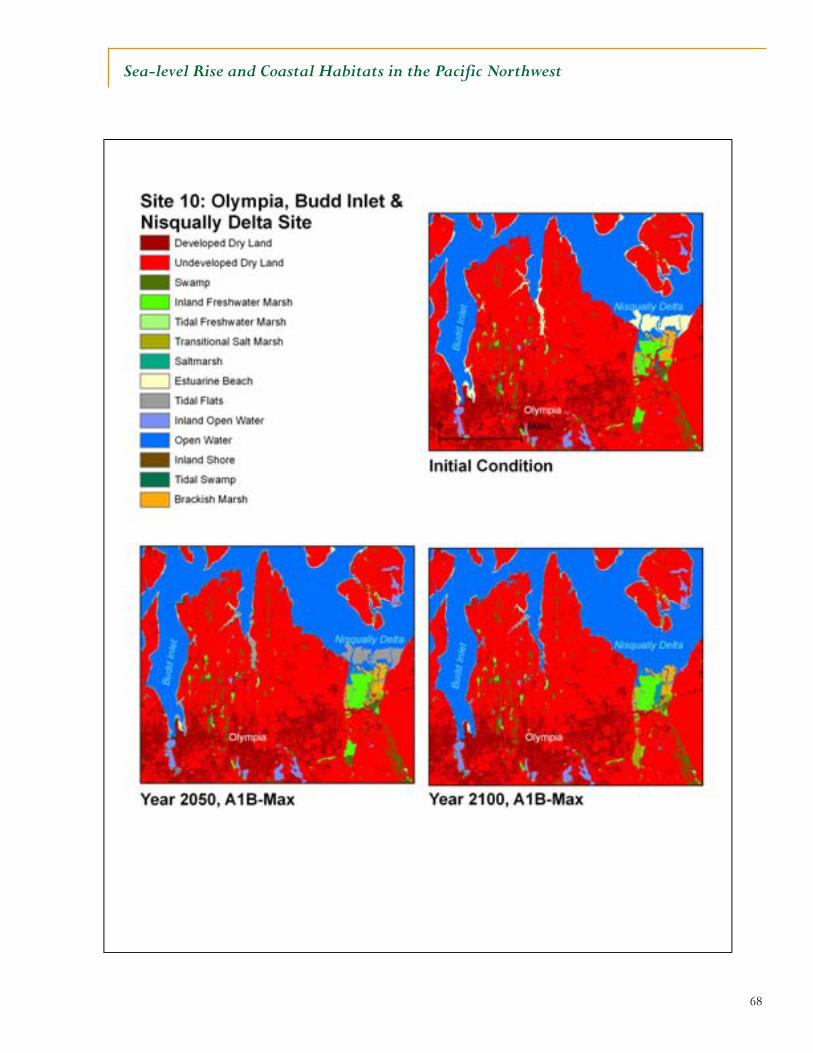
68
Sea-level Rise and Coastal Habitats in the Pacific Northwest
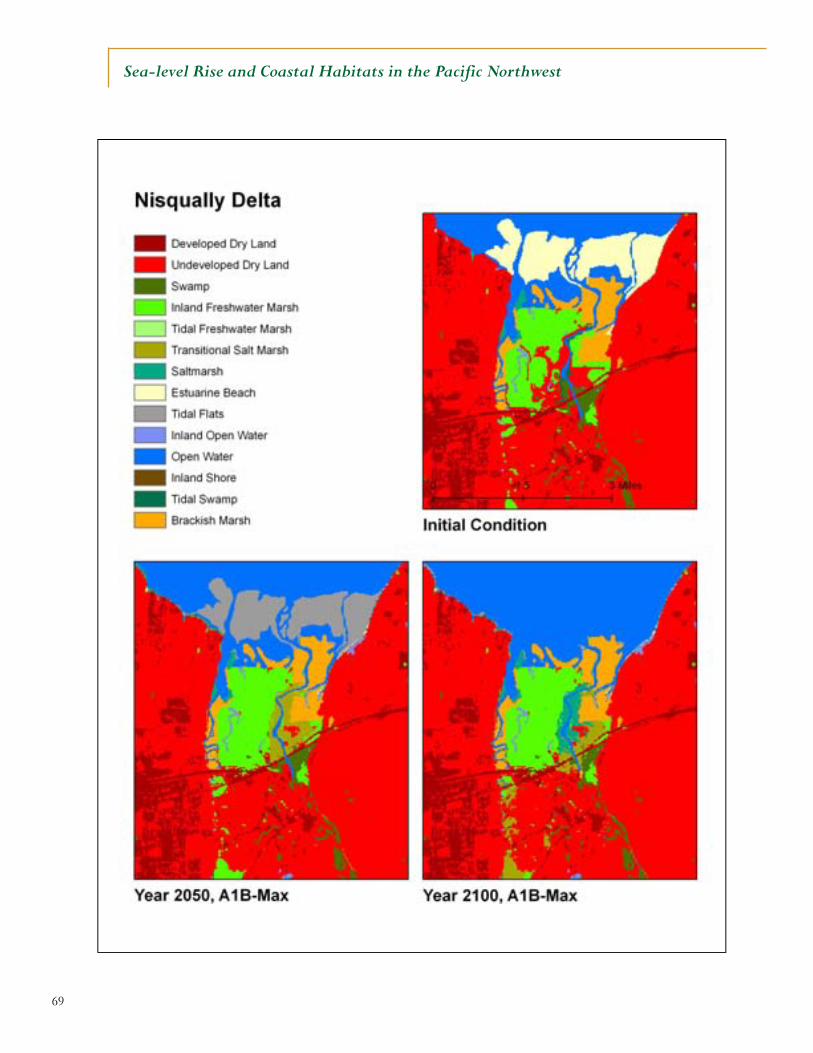
69
Sea-level Rise and Coastal Habitats in the Pacific Northwest
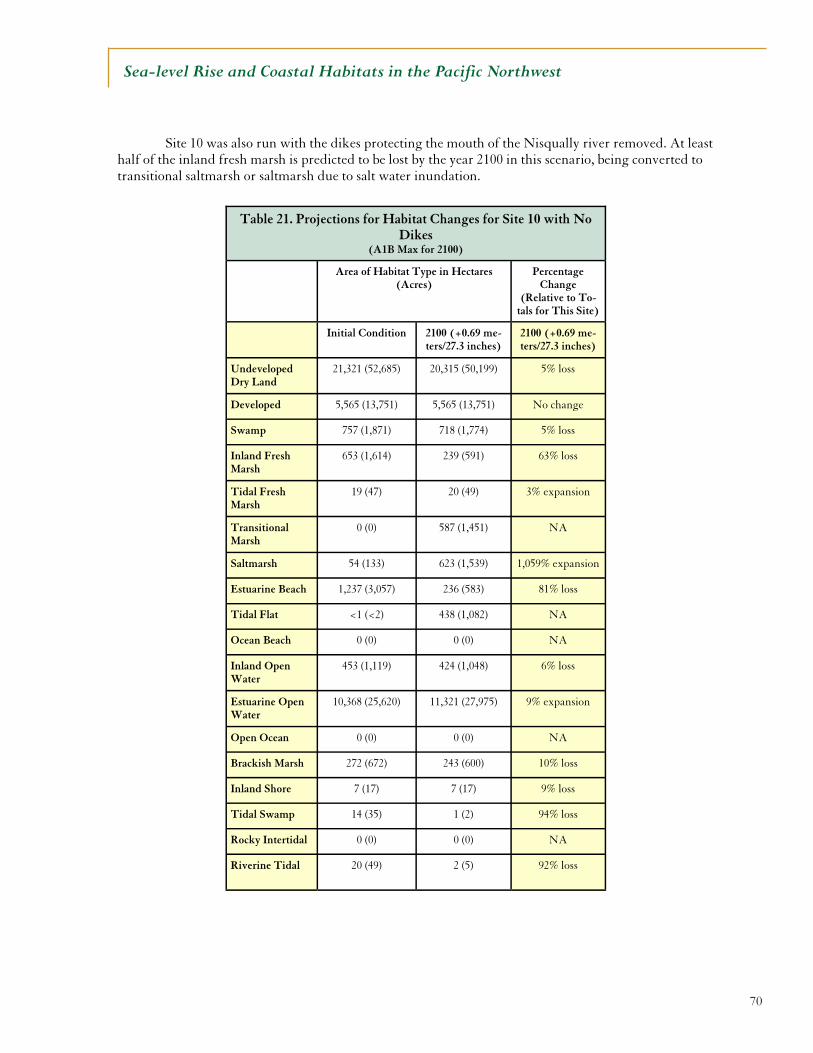
70
Sea-level Rise and Coastal Habitats in the Pacific Northwest
Site 10 was also run with the dikes protecting the mouth of the Nisqually river removed. At least half of the inland fresh marsh is predicted to be lost by the year 2100 in this scenario, being converted to transitional saltmarsh or saltmarsh due to salt water inundation.
Table 21. Projections for Habitat Changes for Site 10 with No Dikes
(A1B Max for 2100)
Percentage Change
(Relative to To-tals for This Site)
Initial Condition 2100 (+0.69 me-ters/27.3 inches)
2100 (+0.69 me-ters/27.3 inches)
Undeveloped Dry Land
21,321 (52,685) 20,315 (50,199) 5% loss
Developed 5,565 (13,751) 5,565 (13,751) No change
Swamp 757 (1,871) 718 (1,774) 5% loss
Inland Fresh Marsh
653 (1,614) 239 (591) 63% loss
Tidal Fresh Marsh
19 (47) 20 (49) 3% expansion
Transitional Marsh
0 (0) 587 (1,451) NA
Saltmarsh 54 (133) 623 (1,539) 1,059% expansion
Estuarine Beach 1,237 (3,057) 236 (583) 81% loss
Tidal Flat <1 (<2) 438 (1,082) NA
Ocean Beach 0 (0) 0 (0) NA
Inland Open Water
453 (1,119) 424 (1,048) 6% loss
Estuarine Open Water
10,368 (25,620) 11,321 (27,975) 9% expansion
Open Ocean 0 (0) 0 (0) NA
Brackish Marsh 272 (672) 243 (600) 10% loss
Inland Shore 7 (17) 7 (17) 9% loss
Tidal Swamp 14 (35) 1 (2) 94% loss
Rocky Intertidal 0 (0) 0 (0) NA
Riverine Tidal 20 (49) 2 (5) 92% loss
Area of Habitat Type in Hectares (Acres)
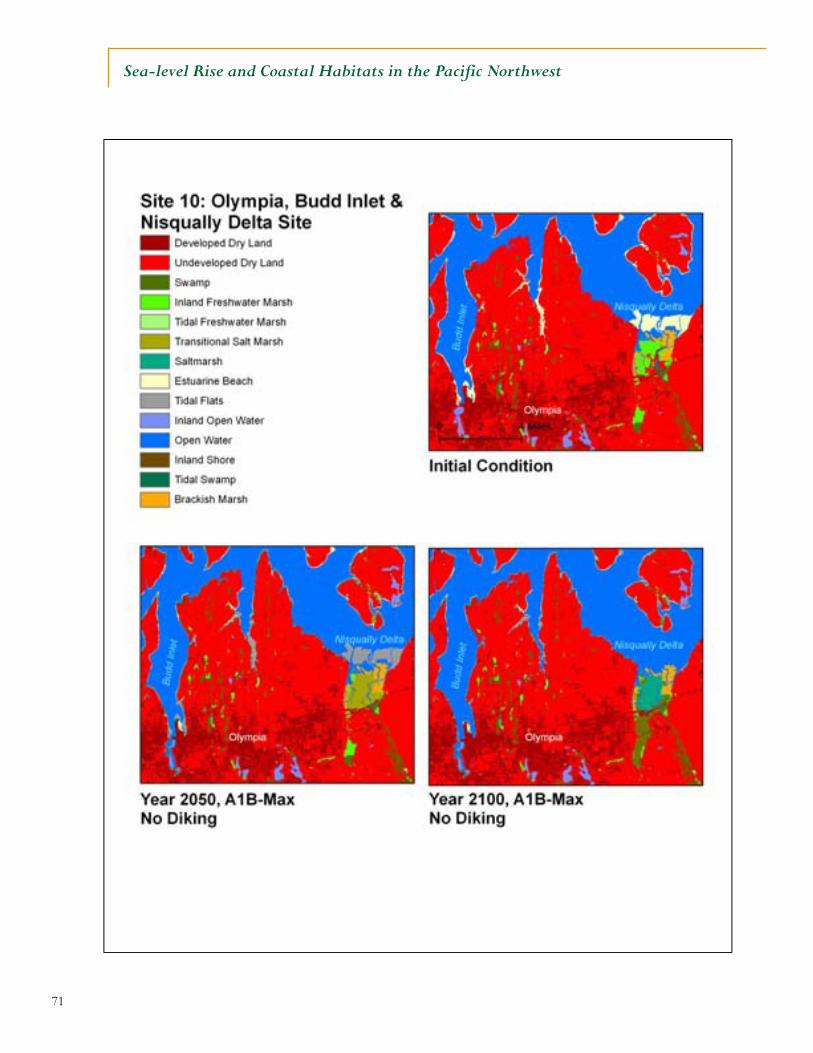
71
Sea-level Rise and Coastal Habitats in the Pacific Northwest
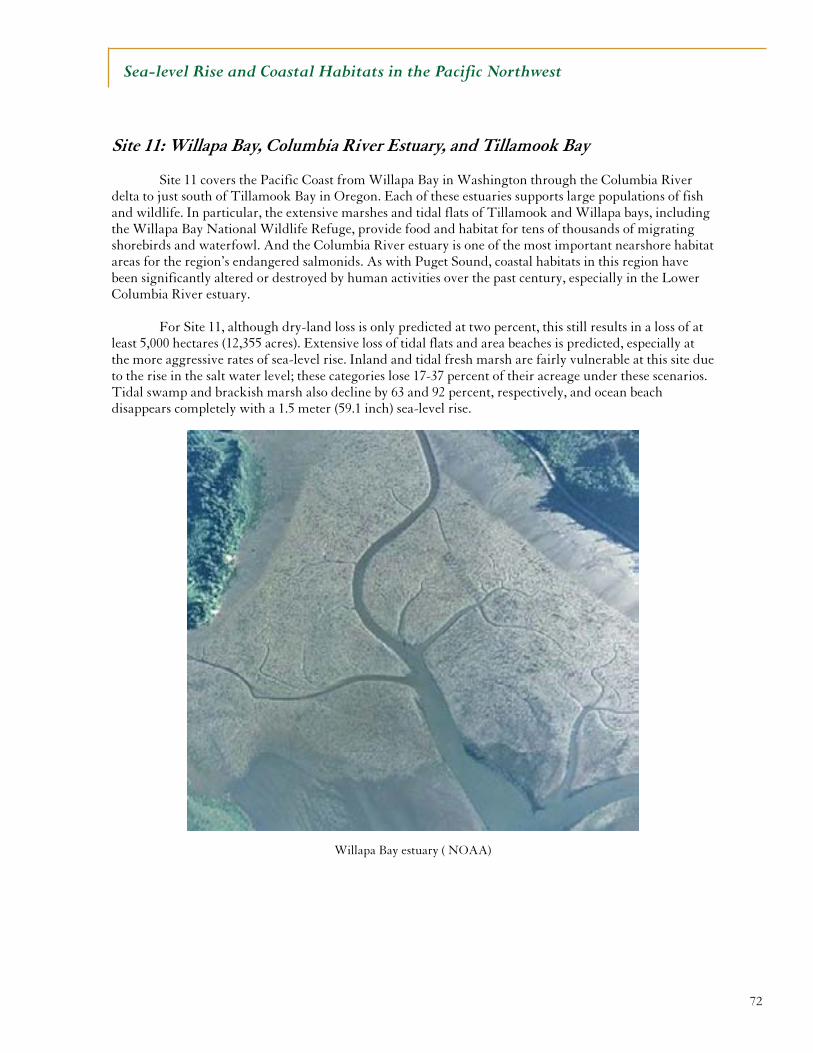
72
Sea-level Rise and Coastal Habitats in the Pacific Northwest
Site 11: Willapa Bay, Columbia River Estuary, and Tillamook Bay
Site 11 covers the Pacific Coast from Willapa Bay in Washington through the Columbia River delta to just south of Tillamook Bay in Oregon. Each of these estuaries supports large populations of fish and wildlife. In particular, the extensive marshes and tidal flats of Tillamook and Willapa bays, including the Willapa Bay National Wildlife Refuge, provide food and habitat for tens of thousands of migrating shorebirds and waterfowl. And the Columbia River estuary is one of the most important nearshore habitat areas for the region’s endangered salmonids. As with Puget Sound, coastal habitats in this region have been significantly altered or destroyed by human activities over the past century, especially in the Lower Columbia River estuary.
For Site 11, although dry-land loss is only predicted at two percent, this still results in a loss of at least 5,000 hectares (12,355 acres). Extensive loss of tidal flats and area beaches is predicted, especially at the more aggressive rates of sea-level rise. Inland and tidal fresh marsh are fairly vulnerable at this site due to the rise in the salt water level; these categories lose 17-37 percent of their acreage under these scenarios. Tidal swamp and brackish marsh also decline by 63 and 92 percent, respectively, and ocean beach disappears completely with a 1.5 meter (59.1 inch) sea-level rise.
Willapa Bay estuary ( NOAA)
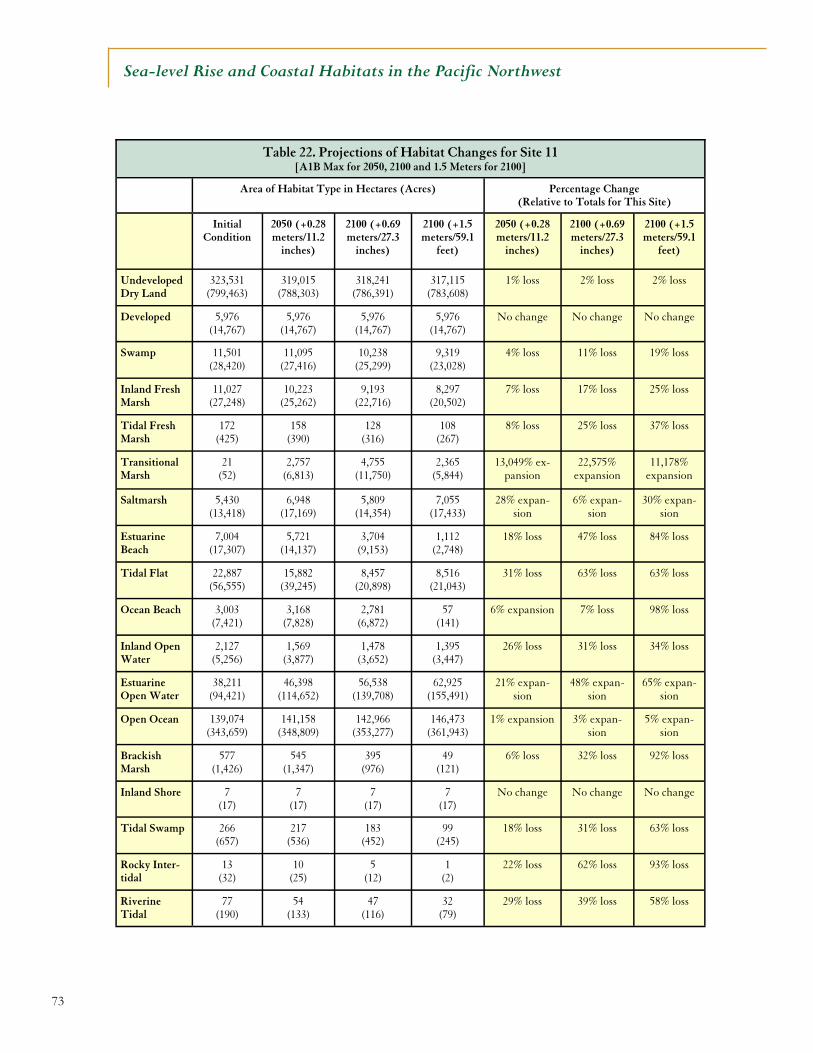
73
Sea-level Rise and Coastal Habitats in the Pacific Northwest
Table 22. Projections of Habitat Changes for Site 11 [A1B Max for 2050, 2100 and 1.5 Meters for 2100]
Percentage Change (Relative to Totals for This Site)
Initial Condition
2050 (+0.28 meters/11.2
inches)
2100 (+0.69 meters/27.3
inches)
2100 (+1.5 meters/59.1
feet)
2050 (+0.28 meters/11.2
inches)
2100 (+0.69 meters/27.3
inches)
2100 (+1.5 meters/59.1
feet)
Undeveloped Dry Land
323,531 (799,463)
319,015 (788,303)
318,241 (786,391)
317,115 (783,608)
1% loss 2% loss 2% loss
Developed 5,976 (14,767)
5,976 (14,767)
5,976 (14,767)
5,976 (14,767)
No change No change No change
Swamp 11,501 (28,420)
11,095 (27,416)
10,238 (25,299)
9,319 (23,028)
4% loss 11% loss 19% loss
Inland Fresh Marsh
11,027 (27,248)
10,223 (25,262)
9,193 (22,716)
8,297 (20,502)
7% loss 17% loss 25% loss
Tidal Fresh Marsh
172 (425)
158 (390)
128 (316)
108 (267)
8% loss 25% loss 37% loss
Transitional Marsh
21 (52)
2,757 (6,813)
4,755 (11,750)
2,365 (5,844)
13,049% ex-pansion
22,575% expansion
11,178% expansion
Saltmarsh 5,430 (13,418)
6,948 (17,169)
5,809 (14,354)
7,055 (17,433)
28% expan-sion
6% expan-sion
30% expan-sion
Estuarine Beach
7,004 (17,307)
5,721 (14,137)
3,704 (9,153)
1,112 (2,748)
18% loss 47% loss 84% loss
Tidal Flat 22,887 (56,555)
15,882 (39,245)
8,457 (20,898)
8,516 (21,043)
31% loss 63% loss 63% loss
Ocean Beach 3,003 (7,421)
3,168 (7,828)
2,781 (6,872)
57 (141)
6% expansion 7% loss 98% loss
Inland Open Water
2,127 (5,256)
1,569 (3,877)
1,478 (3,652)
1,395 (3,447)
26% loss 31% loss 34% loss
Estuarine Open Water
38,211 (94,421)
46,398 (114,652)
56,538 (139,708)
62,925 (155,491)
21% expan-sion
48% expan-sion
65% expan-sion
Open Ocean 139,074 (343,659)
141,158 (348,809)
142,966 (353,277)
146,473 (361,943)
1% expansion 3% expan-sion
5% expan-sion
Brackish Marsh
577 (1,426)
545 (1,347)
395 (976)
49 (121)
6% loss 32% loss 92% loss
Inland Shore 7 (17)
7 (17)
7 (17)
7 (17)
No change No change No change
Tidal Swamp 266 (657)
217 (536)
183 (452)
99 (245)
18% loss 31% loss 63% loss
Rocky Inter-tidal
13 (32)
10 (25)
5 (12)
1 (2)
22% loss 62% loss 93% loss
Riverine Tidal
77 (190)
54 (133)
47 (116)
32 (79)
29% loss 39% loss 58% loss
Area of Habitat Type in Hectares (Acres)
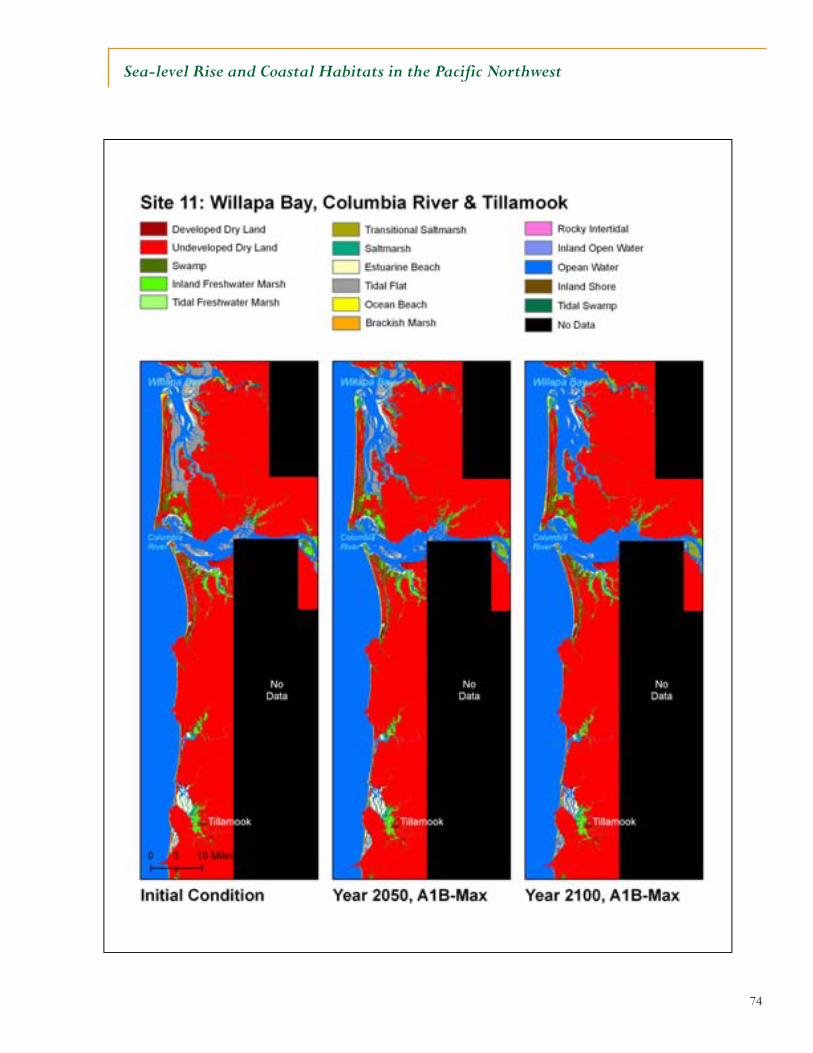
74
Sea-level Rise and Coastal Habitats in the Pacific Northwest
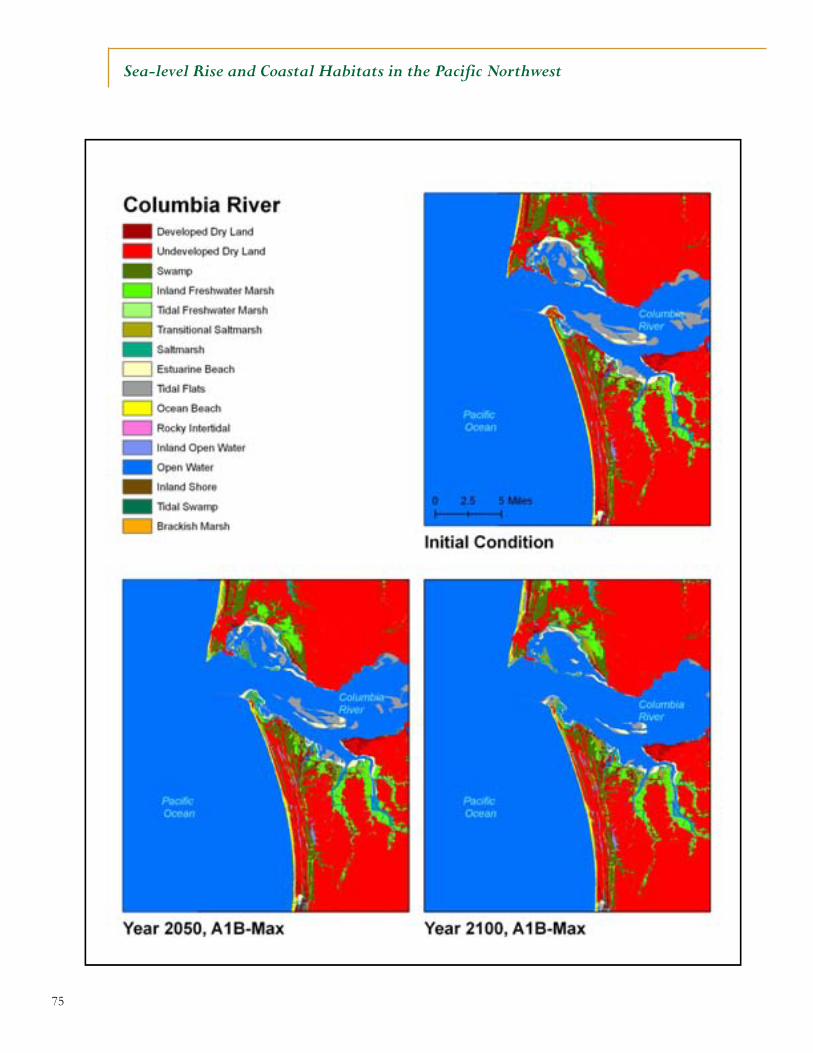
75
Sea-level Rise and Coastal Habitats in the Pacific Northwest
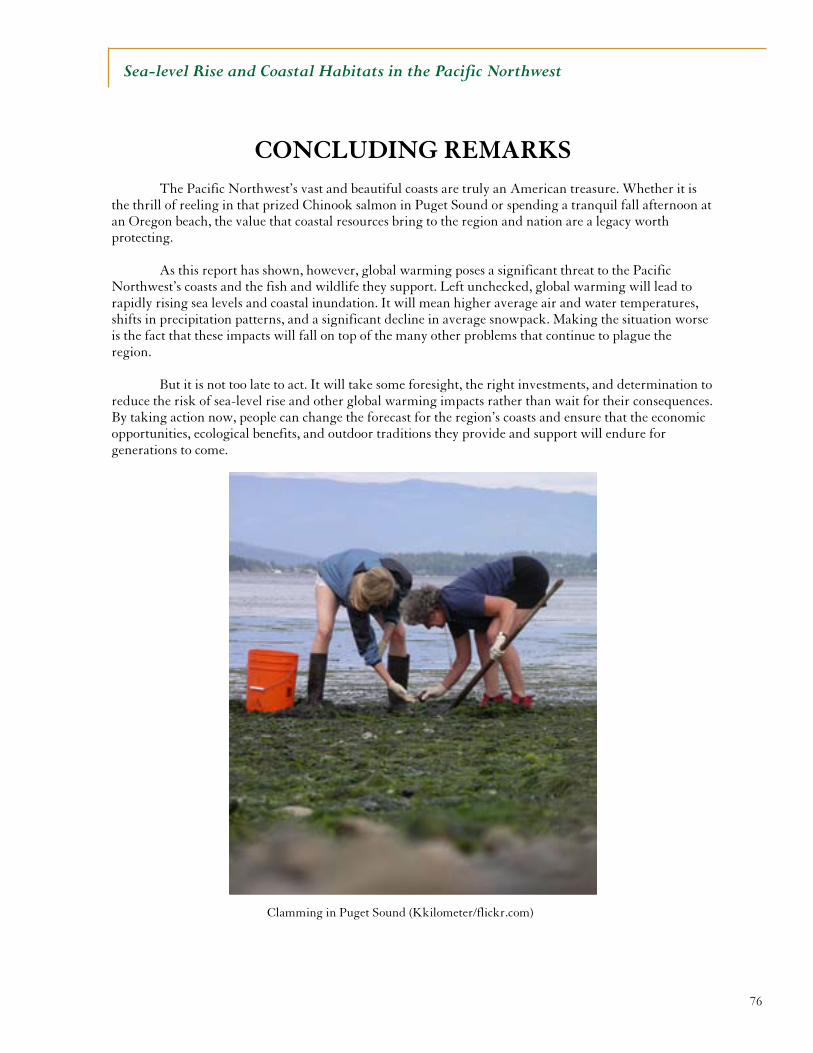
76
Sea-level Rise and Coastal Habitats in the Pacific Northwest
CONCLUDING REMARKS
The Pacific Northwest’s vast and beautiful coasts are truly an American treasure. Whether it is
the thrill of reeling in that prized Chinook salmon in Puget Sound or spending a tranquil fall afternoon at an Oregon beach, the value that coastal resources bring to the region and nation are a legacy worth protecting.
As this report has shown, however, global warming poses a significant threat to the Pacific
Northwest’s coasts and the fish and wildlife they support. Left unchecked, global warming will lead to rapidly rising sea levels and coastal inundation. It will mean higher average air and water temperatures, shifts in precipitation patterns, and a significant decline in average snowpack. Making the situation worse is the fact that these impacts will fall on top of the many other problems that continue to plague the region.
But it is not too late to act. It will take some foresight, the right investments, and determination to
reduce the risk of sea-level rise and other global warming impacts rather than wait for their consequences. By taking action now, people can change the forecast for the region’s coasts and ensure that the economic opportunities, ecological benefits, and outdoor traditions they provide and support will endure for generations to come.
Clamming in Puget Sound (Kkilometer/flickr.com)
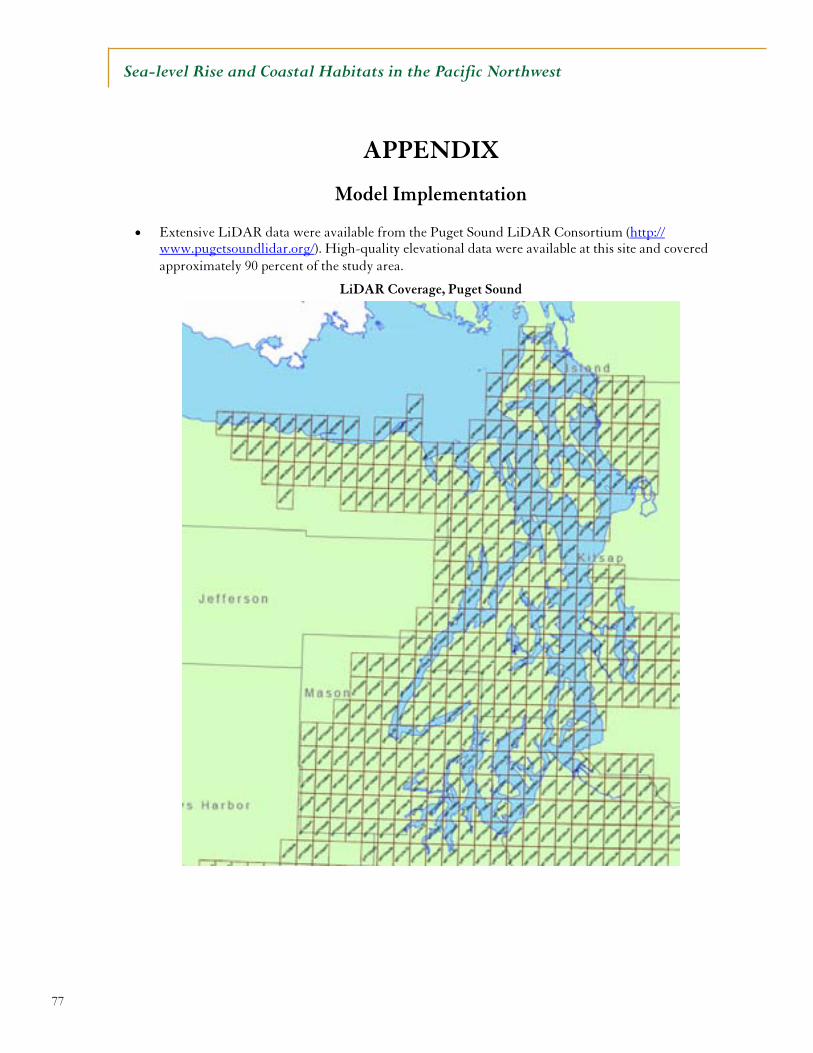
77
Sea-level Rise and Coastal Habitats in the Pacific Northwest
APPENDIX
Model Implementation
• Extensive LiDAR data were available from the Puget Sound LiDAR Consortium (http://www.pugetsoundlidar.org/). High-quality elevational data were available at this site and covered
approximately 90 percent of the study area.
LiDAR Coverage, Puget Sound
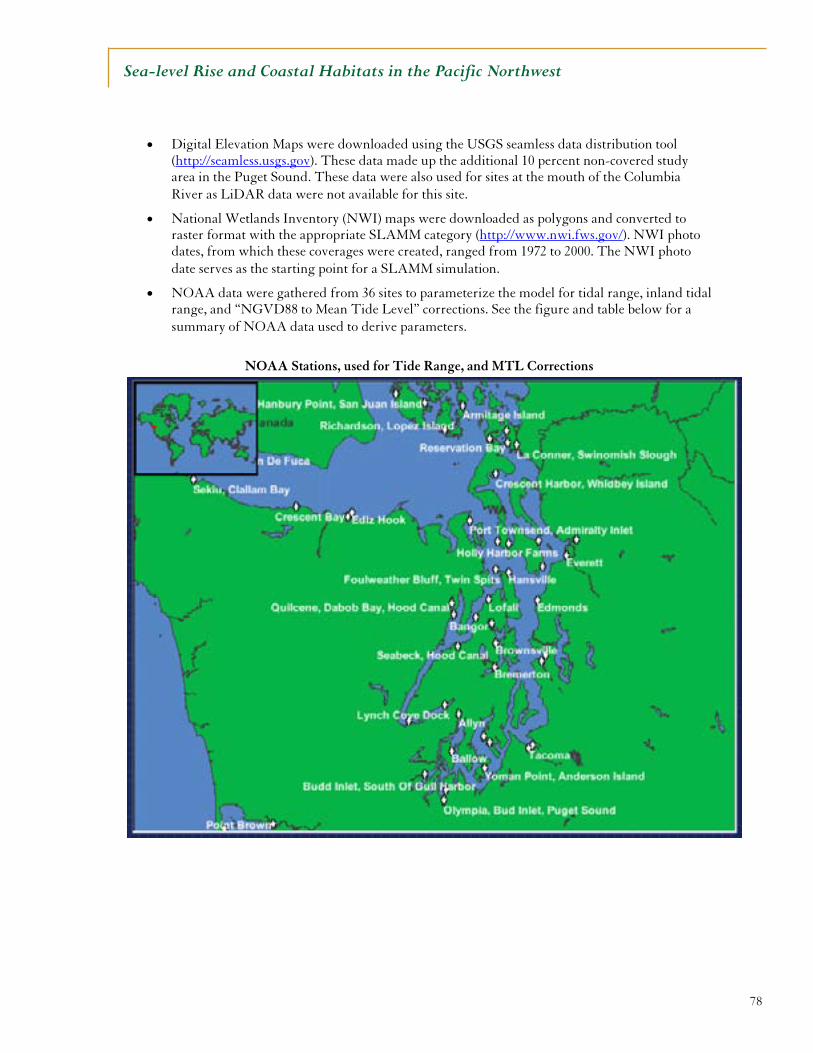
78
Sea-level Rise and Coastal Habitats in the Pacific Northwest
• Digital Elevation Maps were downloaded using the USGS seamless data distribution tool (http://seamless.usgs.gov). These data made up the additional 10 percent non-covered study area in the Puget Sound. These data were also used for sites at the mouth of the Columbia
River as LiDAR data were not available for this site.
• National Wetlands Inventory (NWI) maps were downloaded as polygons and converted to raster format with the appropriate SLAMM category (http://www.nwi.fws.gov/). NWI photo dates, from which these coverages were created, ranged from 1972 to 2000. The NWI photo
date serves as the starting point for a SLAMM simulation.
• NOAA data were gathered from 36 sites to parameterize the model for tidal range, inland tidal range, and “NGVD88 to Mean Tide Level” corrections. See the figure and table below for a
summary of NOAA data used to derive parameters.
NOAA Stations, used for Tide Range, and MTL Corrections
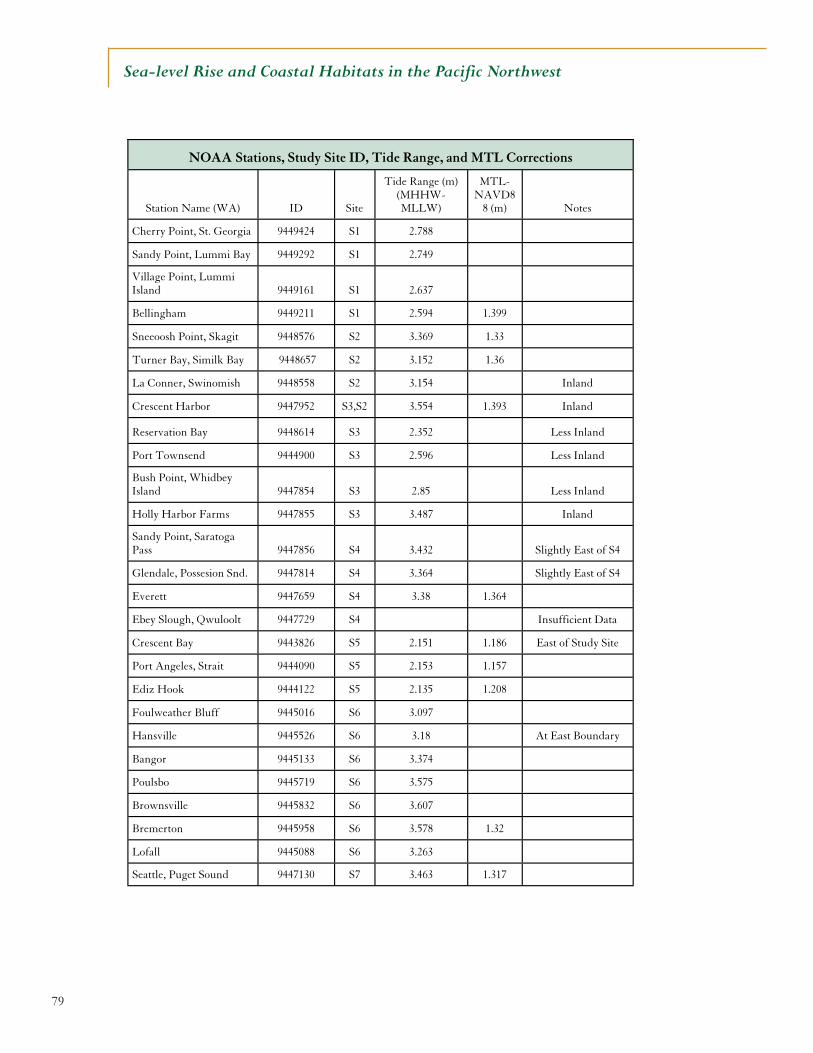
79
Sea-level Rise and Coastal Habitats in the Pacific Northwest
Station Name (WA) ID Site
Tide Range (m) (MHHW-MLLW)
MTL-NAVD8
8 (m) Notes
Cherry Point, St. Georgia 9449424 S1 2.788
Sandy Point, Lummi Bay 9449292 S1 2.749
Village Point, Lummi Island 9449161 S1 2.637
Bellingham 9449211 S1 2.594 1.399
Sneeoosh Point, Skagit 9448576 S2 3.369 1.33
Turner Bay, Similk Bay 9448657 S2 3.152 1.36
La Conner, Swinomish 9448558 S2 3.154 Inland
Crescent Harbor 9447952 S3,S2 3.554 1.393 Inland
Reservation Bay 9448614 S3 2.352 Less Inland
Port Townsend 9444900 S3 2.596 Less Inland
Bush Point, Whidbey Island 9447854 S3 2.85 Less Inland
Holly Harbor Farms 9447855 S3 3.487 Inland
Sandy Point, Saratoga Pass 9447856 S4 3.432 Slightly East of S4
Glendale, Possesion Snd. 9447814 S4 3.364 Slightly East of S4
Everett 9447659 S4 3.38 1.364
Ebey Slough, Qwuloolt 9447729 S4 Insufficient Data
Crescent Bay 9443826 S5 2.151 1.186 East of Study Site
Port Angeles, Strait 9444090 S5 2.153 1.157
Ediz Hook 9444122 S5 2.135 1.208
Foulweather Bluff 9445016 S6 3.097
Hansville 9445526 S6 3.18 At East Boundary
Bangor 9445133 S6 3.374
Poulsbo 9445719 S6 3.575
Brownsville 9445832 S6 3.607
Bremerton 9445958 S6 3.578 1.32
Lofall 9445088 S6 3.263
Seattle, Puget Sound 9447130 S7 3.463 1.317
NOAA Stations, Study Site ID, Tide Range, and MTL Corrections
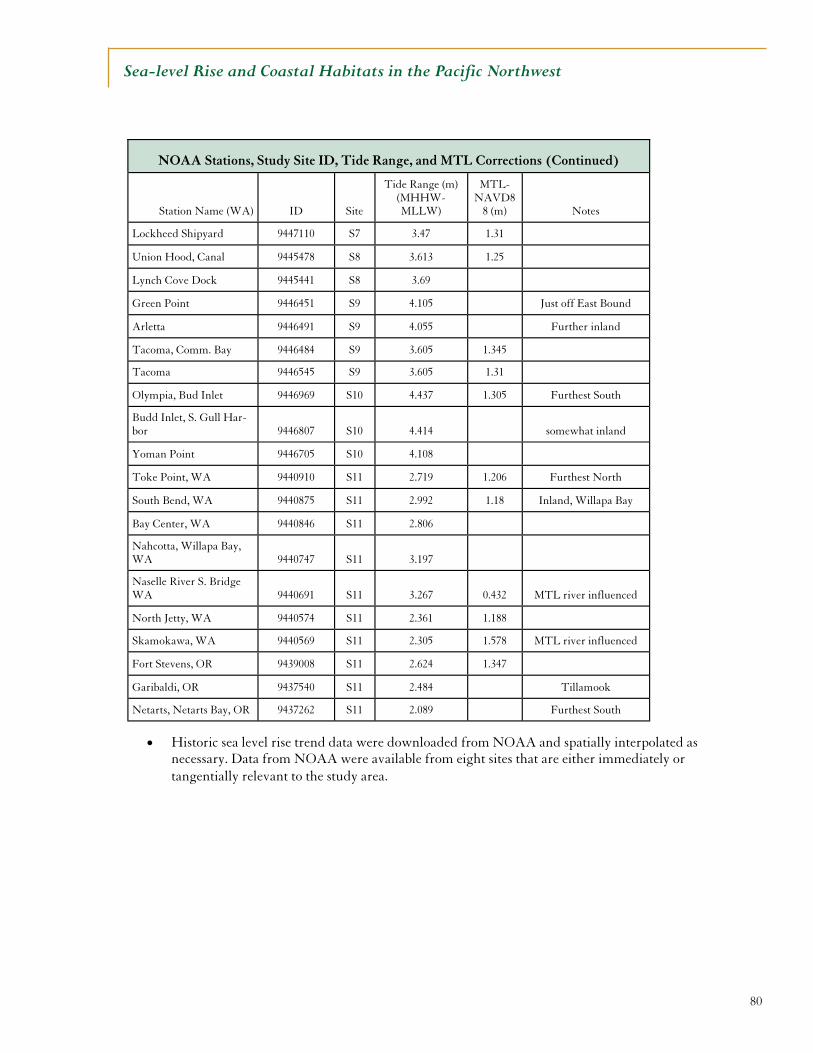
80
Sea-level Rise and Coastal Habitats in the Pacific Northwest
• Historic sea level rise trend data were downloaded from NOAA and spatially interpolated as necessary. Data from NOAA were available from eight sites that are either immediately or
tangentially relevant to the study area.
Station Name (WA) ID Site
Tide Range (m) (MHHW-MLLW)
MTL-NAVD8
8 (m) Notes
Lockheed Shipyard 9447110 S7 3.47 1.31
Union Hood, Canal 9445478 S8 3.613 1.25
Lynch Cove Dock 9445441 S8 3.69
Green Point 9446451 S9 4.105 Just off East Bound
Arletta 9446491 S9 4.055 Further inland
Tacoma, Comm. Bay 9446484 S9 3.605 1.345
Tacoma 9446545 S9 3.605 1.31
Olympia, Bud Inlet 9446969 S10 4.437 1.305 Furthest South
Budd Inlet, S. Gull Har-bor 9446807 S10 4.414 somewhat inland
Yoman Point 9446705 S10 4.108
Toke Point, WA 9440910 S11 2.719 1.206 Furthest North
South Bend, WA 9440875 S11 2.992 1.18 Inland, Willapa Bay
Bay Center, WA 9440846 S11 2.806
Nahcotta, Willapa Bay, WA 9440747 S11 3.197
Naselle River S. Bridge WA 9440691 S11 3.267 0.432 MTL river influenced
North Jetty, WA 9440574 S11 2.361 1.188
Skamokawa, WA 9440569 S11 2.305 1.578 MTL river influenced
Fort Stevens, OR 9439008 S11 2.624 1.347
Garibaldi, OR 9437540 S11 2.484 Tillamook
Netarts, Netarts Bay, OR 9437262 S11 2.089 Furthest South
NOAA Stations, Study Site ID, Tide Range, and MTL Corrections (Continued)
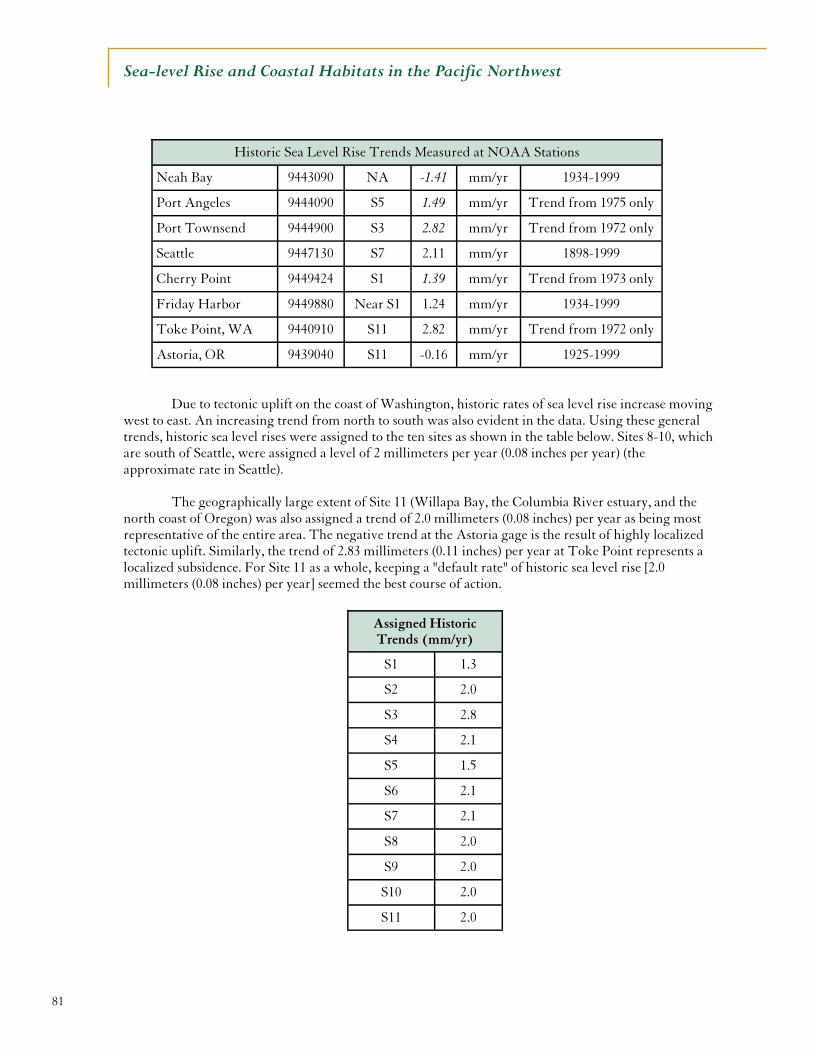
81
Sea-level Rise and Coastal Habitats in the Pacific Northwest
Due to tectonic uplift on the coast of Washington, historic rates of sea level rise increase moving
west to east. An increasing trend from north to south was also evident in the data. Using these general trends, historic sea level rises were assigned to the ten sites as shown in the table below. Sites 8-10, which are south of Seattle, were assigned a level of 2 millimeters per year (0.08 inches per year) (the approximate rate in Seattle).
The geographically large extent of Site 11 (Willapa Bay, the Columbia River estuary, and the north coast of Oregon) was also assigned a trend of 2.0 millimeters (0.08 inches) per year as being most representative of the entire area. The negative trend at the Astoria gage is the result of highly localized tectonic uplift. Similarly, the trend of 2.83 millimeters (0.11 inches) per year at Toke Point represents a localized subsidence. For Site 11 as a whole, keeping a "default rate" of historic sea level rise [2.0 millimeters (0.08 inches) per year] seemed the best course of action.
Neah Bay 9443090 NA -1.41 mm/yr 1934-1999
Port Angeles 9444090 S5 1.49 mm/yr Trend from 1975 only
Port Townsend 9444900 S3 2.82 mm/yr Trend from 1972 only
Seattle 9447130 S7 2.11 mm/yr 1898-1999
Cherry Point 9449424 S1 1.39 mm/yr Trend from 1973 only
Friday Harbor 9449880 Near S1 1.24 mm/yr 1934-1999
Toke Point, WA 9440910 S11 2.82 mm/yr Trend from 1972 only
Astoria, OR 9439040 S11 -0.16 mm/yr 1925-1999
Historic Sea Level Rise Trends Measured at NOAA Stations
S1 1.3
S2 2.0
S3 2.8
S4 2.1
S5 1.5
S6 2.1
S7 2.1
S8 2.0
S9 2.0
S10 2.0
S11 2.0
Assigned Historic Trends (mm/yr)
82
Sea-level Rise and Coastal Habitats in the Pacific Northwest
• Erosion rates for tidal flats and estuary beaches were set to 0.2 meters (7.9 inches) per year based on Keuler, 1988. Keuler’s map of erosion rates (within Puget Sound near Port Townsend, WA) shows short-term erosion rates ranging from 0-46 centimeters (18.1 inches) per year and includes one long-term recession rate of 15 centimeters per year (5.9 inches) per year. The rate used in modeling was set towards the high end of the range reported within Keuler’s findings because it pertains to both tidal flats and exposed beaches (with no tidal flat frontage). The rate
is also in line with the finding of Shipman (2004, p. 89) who is quoted below:
“The highest erosion rates measured on Puget Sound and in the Georgia Strait occur in poorly consolidated late Pleistocene sediments where wave exposure is high. Van Osch (1990) noted bluff recession rates of 60 centimeters per year (23.6 inches per year) at Cowichan Head north of Victoria and 30-50 centimeters (11.8-19.7 inches) per year at Point Grey near Vancouver, B.C. Galster and Schwartz (1990) found that erosion rates of bluffs west of Port Angeles were as much as one meter per year before the shoreline was armored. Keuler (1988) determined rates of over 30 centimeters (11.8 inches) per year on Smith Island, the western shore of Whidbey Island, and the northern side of Protection Island, all with
substantial exposures along the Strait of Juan de Fuca.
These rates are not typical, however, and recession rates appear more commonly to be on the order of a few centimeters a year, or less, in most areas. Rates vary temporally and at any given site, retreat is likely to occur as
a single mass-wasting event every few decades.”
This rate could be explored further, and perhaps a separate erosion rate for tidal
flats and estuarine beaches could be used in future modeling.
• Within the modeling, Bruun’s rule regarding the erosion rate of beaches (recession is roughly 100 times the change in sea level) was rarely utilized within Puget Sound. This rule only applies to “ocean beaches” that comprise just 0.05 percent (1/2000th) of the total “Puget Sound” study
area (Sites 1-10).
• Erosion rates for marshes and swamps were set to SLAMM defaults. Default erosion rates are 2.0 horizontal meters (78.7 inches) per year for marshes and 1.0 meter (39.4 inches) per year for swamps. These rates are based on a combination of professional judgment and a brief literature survey. (Note also that these erosion rates presume that a threshold of maximum fetch for wave setup has been exceeded prior to the incidence of horizontal erosion. See the technical
documentation for more information.)
• Accretion rates were set to 3.6 millimeters (0.14 inches) per year for saltmarshes based on Thom (1992) who measured accretion rates of low saltmarshes in the Pacific Northwest. The 95th percent confidence interval for these observations ranged from 2.4-4.8 millimeters ( .09-1.9
inches) per year.
• Accretion rates were set to 3.75 millimeters (0.15 inches) per year for brackish marsh, and 4.0 millimeters (0.16 inches) per year for tidal flats. These values were based on measurements from the Altamaha River in Georgia (Personal Communication, Dr. Christopher Craft). Additionally, these rates fall at the mid point of a comprehensive literature review of accretion rates (Cahoon, Reed, and Day, Jr., 1995 and Cahoon, Day, Jr., and Reed, 1999). These rates also conform to the site-specific measurements of Thom (1992) because accretion rates in brackish
marsh and tidal flats tend to exceed rates in low intertidal saltmarshes.
83
Sea-level Rise and Coastal Habitats in the Pacific Northwest
• In this project SLAMM 5.0 was parameterized to “protect developed” areas. That is, the model assumed that any areas that are already developed will be protected in the future through the construction of dikes or other protective measures. Developed areas were defined using percent impervious data available from the National Land Cover Database (http://www.mrlc.gov/index.asp). After testing several “percent impervious” thresholds, dry land that was at least 25 percent impervious was categorized as “developed dry land” and subsequently protected. The “percent impervious” data coverage was explicitly produced to screen out impervious areas that are not the result of human development (e.g. rocky intertidal locations). The metadata for the data coverage states that non-urban areas were eliminated manually and by using various
processing “masks.”
Dike Data Layer Large areas within Puget Sound are protected by dikes both for urban development and
agricultural purposes. SLAMM requires an accounting of wetlands and dry land areas that are protected by the existence of dikes and seawalls. If a cell is marked as protected by a dike or levee it is not permitted to change categorization. The existence of these dikes can severely affect the ability of wetlands to migrate onto adjacent shorelines. Traditionally, when applying the SLAMM model, relevant diked areas have been determined using the NWI data layer (http://www.nwi.fws.gov/). The NWI land-type codes include a “special modifier” for all lands that are “Diked/Impounded.” However, for the Puget Sound region, this approach was not feasible. The primary reason for this is that the downloaded digital NWI coverages excluded all dry lands. (These dry lands were not categorized and instead were returned as “no-data.”) Therefore there was no category included and the “special
modifier” could not be included either. To work around this problem, a multifaceted approach was taken to try to produce the most
complete and defensible dike layer possible. This approach included:
• An exhaustive search for GIS data layers that characterize dikes within Washington State was performed, but no data source was found to be completely satisfactory.
o Several data layers were found that indicated the lat-long location of existing dikes, but not their geographical extent.
o No data layer was available that indicated the land that was protected by these dikes, levees, or seawalls. Rather, data layers characterized the extent of these structures, and were often incomplete.
o None of the data layers encompassed the entire geographical extent of our study area (Figures 1 and 2).
o Available GIS data layers were used to determine where dikes were located and to confirm the results produced from the analyses described below.
• An elevational analysis was performed along with a consideration of land-use to determine which portions of the study area are likely subject to diking.
o Land use data were available from the 2001 National Land Cover Database (NLCD http://www.mrlc.gov/index.asp)
o Dikes and Levees are primarily agricultural in the Puget Sound regions so land-cover that was designated as “cultivated” or “grassland” that falls below a certain elevation was considered likely to be protected by dikes.
o Dry land that fit the above agricultural designations and that was at an elevation less
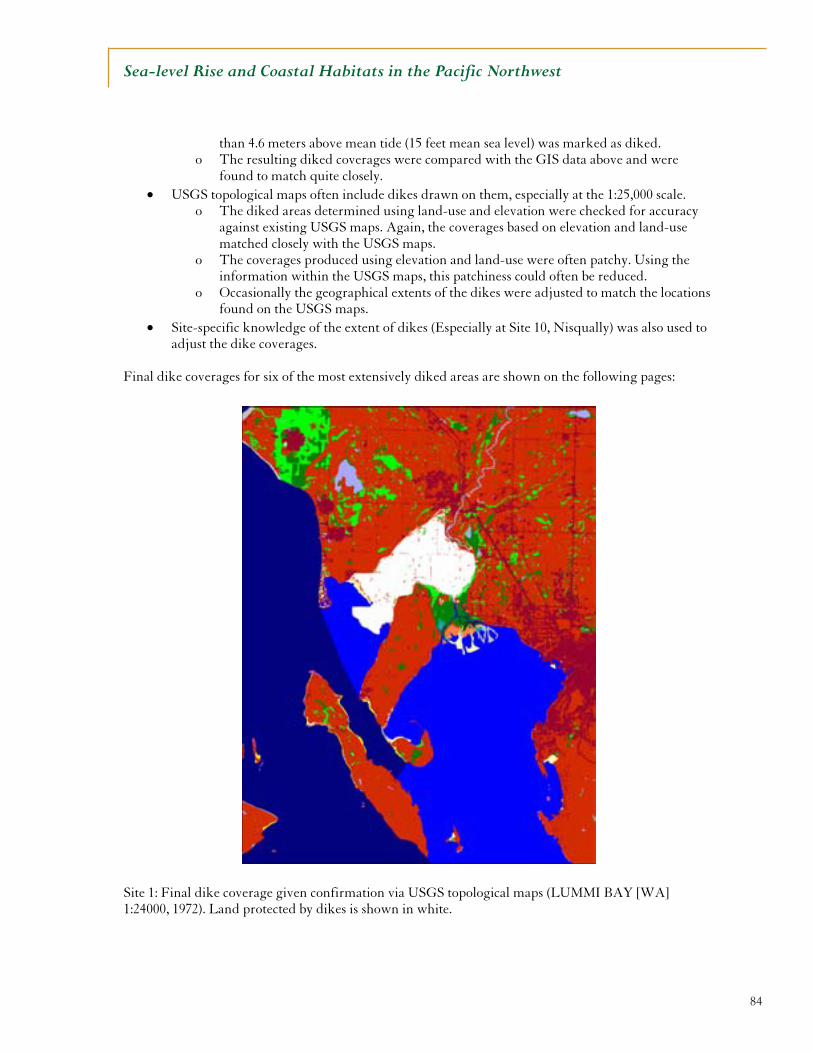
84
Sea-level Rise and Coastal Habitats in the Pacific Northwest
than 4.6 meters above mean tide (15 feet mean sea level) was marked as diked. o The resulting diked coverages were compared with the GIS data above and were
found to match quite closely.
• USGS topological maps often include dikes drawn on them, especially at the 1:25,000 scale. o The diked areas determined using land-use and elevation were checked for accuracy
against existing USGS maps. Again, the coverages based on elevation and land-use matched closely with the USGS maps.
o The coverages produced using elevation and land-use were often patchy. Using the information within the USGS maps, this patchiness could often be reduced.
o Occasionally the geographical extents of the dikes were adjusted to match the locations found on the USGS maps.
• Site-specific knowledge of the extent of dikes (Especially at Site 10, Nisqually) was also used to adjust the dike coverages.
Final dike coverages for six of the most extensively diked areas are shown on the following pages:
Site 1: Final dike coverage given confirmation via USGS topological maps (LUMMI BAY [WA] 1:24000, 1972). Land protected by dikes is shown in white.
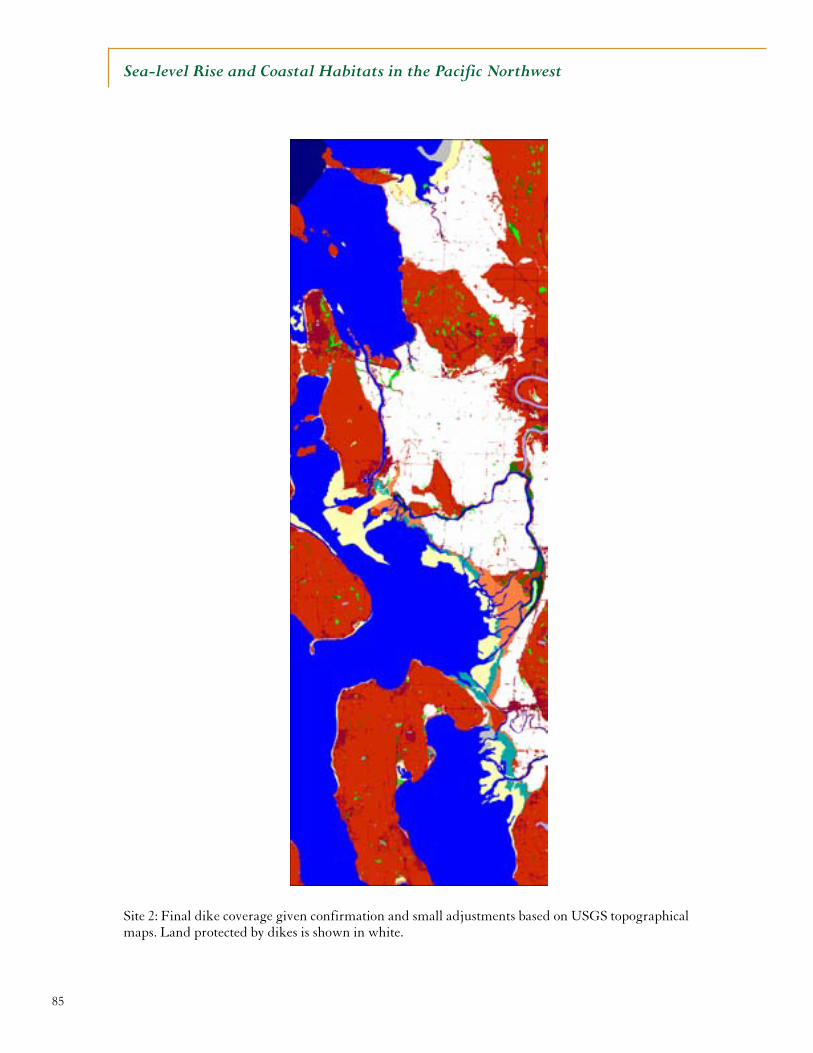
85
Sea-level Rise and Coastal Habitats in the Pacific Northwest
Site 2: Final dike coverage given confirmation and small adjustments based on USGS topographical maps. Land protected by dikes is shown in white.
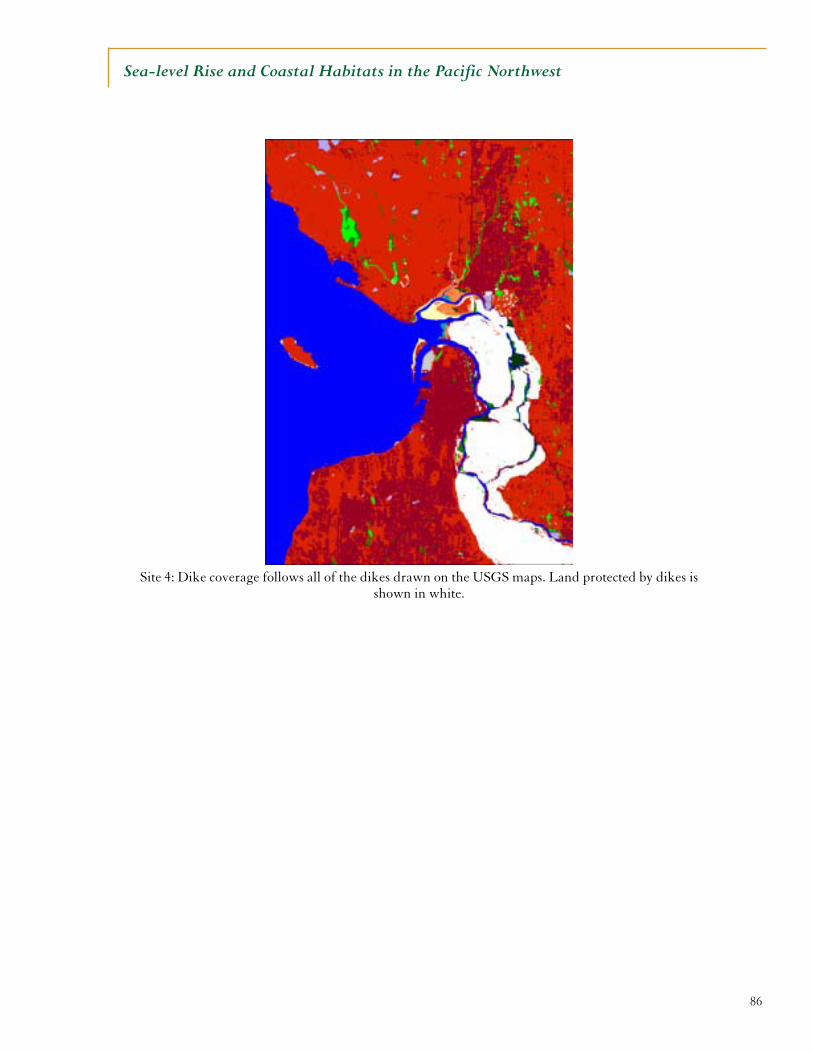
86
Sea-level Rise and Coastal Habitats in the Pacific Northwest
Site 4: Dike coverage follows all of the dikes drawn on the USGS maps. Land protected by dikes is
shown in white.
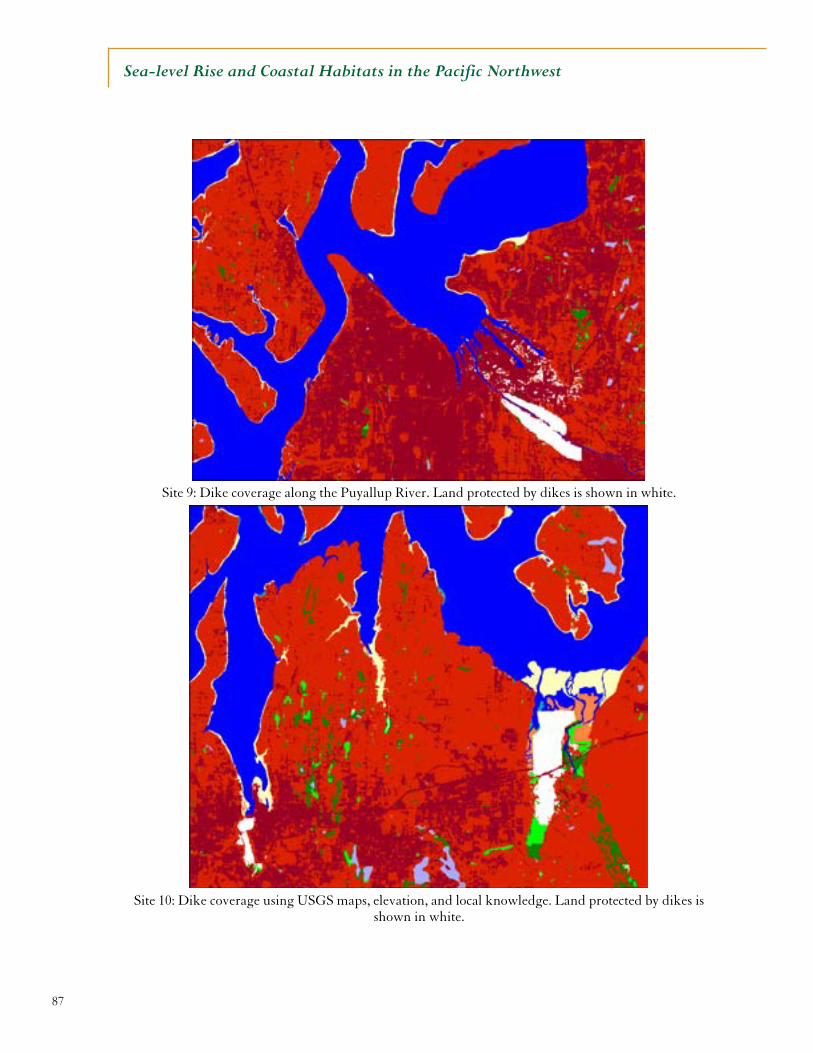
87
Sea-level Rise and Coastal Habitats in the Pacific Northwest
Site 9: Dike coverage along the Puyallup River. Land protected by dikes is shown in white.
Site 10: Dike coverage using USGS maps, elevation, and local knowledge. Land protected by dikes is
shown in white.
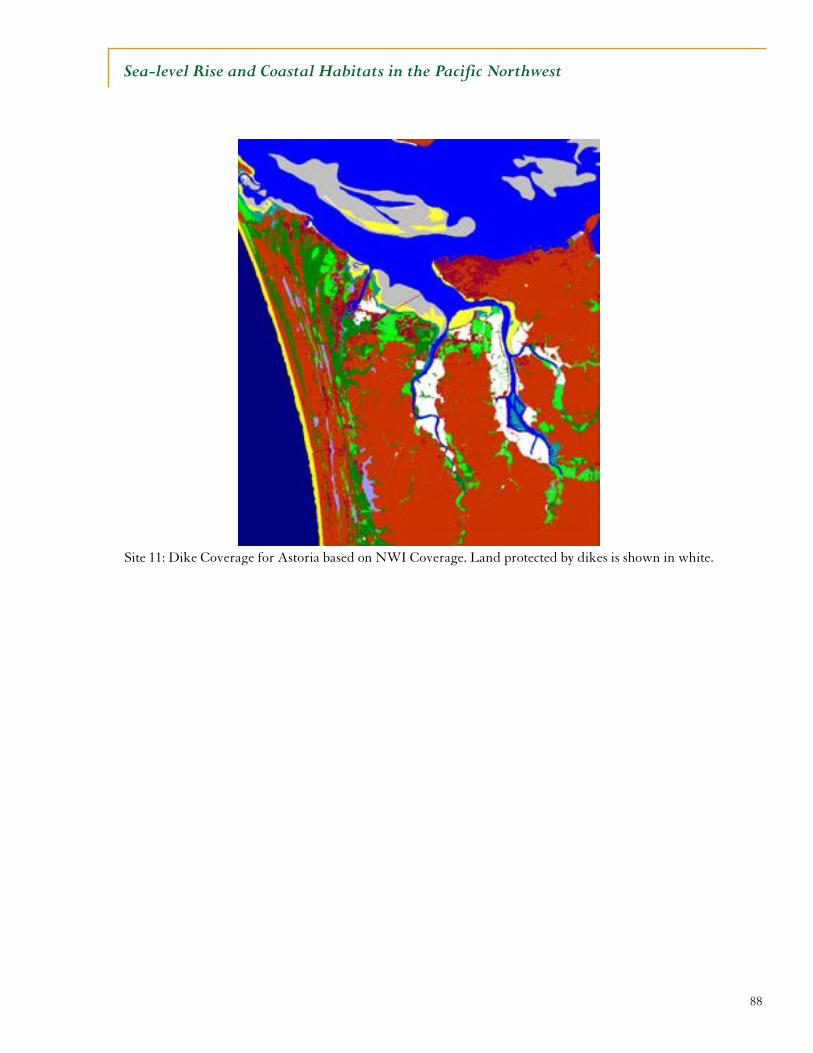
88
Sea-level Rise and Coastal Habitats in the Pacific Northwest
Site 11: Dike Coverage for Astoria based on NWI Coverage. Land protected by dikes is shown in white.
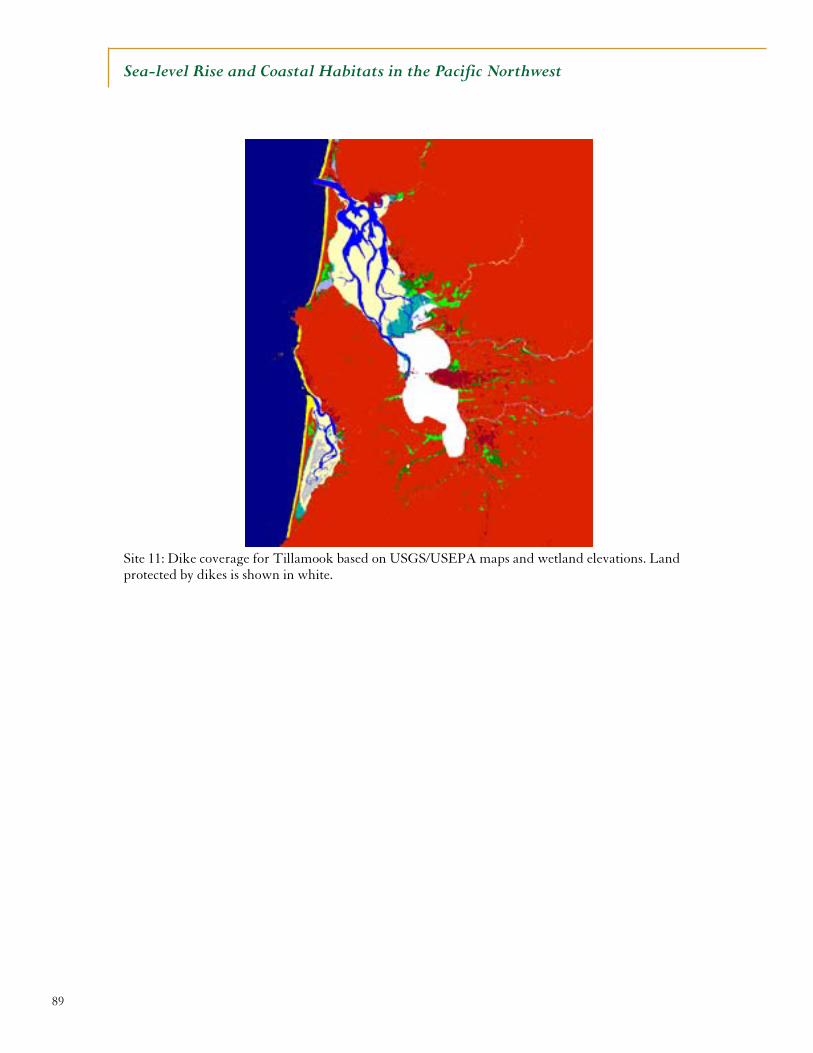
89
Sea-level Rise and Coastal Habitats in the Pacific Northwest
Site 11: Dike coverage for Tillamook based on USGS/USEPA maps and wetland elevations. Land protected by dikes is shown in white.
90
Sea-level Rise and Coastal Habitats in the Pacific Northwest
REFERENCES Battin, J., et al. 2007. “Projected Impacts of Climate Change on Salmon Habitat Restoration.” Proceedings of the National Academy of Sciences 104: 6720-25. Bauman, Y., et al. 2006. Impacts of Climate Change on Washington’s Economy: A Preliminary Assessment of
Risks and Opportunities. Washington Economic Steering Committee and the Climate Leadership Initiative Institute for a Sustainable Environment, University of Oregon.
Buchanan, J.B. 2006. Nearshore Birds in Puget Sound. Puget Sound Nearshore Partnership Report No.
2006-05. Seattle District, U.S. Army Corps of Engineers, Seattle, WA. Cahoon, D.R., D.J. Reed, and J.W. Day, Jr. 1995. “Estimating Shallow Subsidence in Microtidal Salt
Marshes of the Southeastern United States: Kaye and Barghoorn Revisited.” Marine Geology 128: 1-9.
Cahoon, D.R., J. W. Day, Jr., and D. J. Reed. 1999. “The Influence of Surface and Shallow Subsurface
Soil Processes on Wetland Elevation: A Synthesis.” Current Topics in Wetland Biogeochemistry 3: 72-88.
Cahoon, D.R., et al. 2006. “Coastal Wetland Vulnerability to Relative Sea-level Rise: Wetland Elevation
Trends and Process Controls.” Pages 271-292 in J.T.A. Verhoeven, et al., eds. Wetlands and Natural Resource Management. Springer Berlin Heidelberg.
Canning, D.J. 2007. “Vertical Land Movements in Western Washington and Adjacent Areas.” ( In
press). Canning, D.J. 2006. “Sea Level Rise and Coastal Hazards in Washington State.” A Presentation at the
Economic Effects of Climate Change in Washington Workshop, SeaTac Airport, 4 May 2006. Canning, D.J. 2001. “Climate Variability, Climate Change, and Sea-level Rise in Puget Sound:
Possibilities for the Future.” Washington State JISAO/SMA Climate Impacts Group. Chen, J. L., C.R. Wilson, and B.D. Tapley, 2006. “Satellite Gravity Measurements Confirm Accelerated
Melting of Greenland Ice Sheet” Science 313(5795): 1958-60. City of Seattle. 2005. Climate Change Will Impact the Seattle Department of Transportation. Office of the
City Auditor, Seattle, WA. Clough, J.S. and R.A. Park. 2007. Technical Documentation for SLAMM 5.0. Jonathan S. Clough,
Warren Pinnacle Consulting, Inc, Richard A. Park, Eco Modeling. Available on request. Craig, D. 1993. Preliminary Assessment of Sea-level Rise in Olympia, WA: Technical and Policy Implications.
Policy and Program Development Division, Olympia Public Works Department, Olympia, WA.
Dethier, M.N. 2006. Native Shellfish in Nearshore Ecosystems of Washington State. Puget Sound Nearshore
Partnership Report No. 2006-04. Seattle District, U.S. Army Corps of Engineers, Seattle, WA.
91
Sea-level Rise and Coastal Habitats in the Pacific Northwest
Drut, M. and J.B. Buchanan. 2000. U.S. National Shorebird Management Plan: Northern Pacific Coast Working Group Regional Management Plan. Portland, OR: Fish & Wildlife Service, U.S. Department of the Interior.
Galbraith, H., et al. 2005. “Global Climate Change and Sea Level Rise: Potential Losses of Intertidal
Habitat for Shorebirds.” USDA Forest Service General Technical Report PSW-GTR-191: 1119-22.
Galster, R.W. and M.L. Schwartz. 1990. “Ediz Hook—A Case History of Coastal Erosion and
Rehabilitation.” Journal of Coastal Research, Special Issue, no. 6: 103-13. Hansen, J. 2004. “Can We Defuse the Global Warming Time Bomb?” Scientific American 0036-8733,
290(3): 68-77. Hood, W.G. 2005. “Sea Level Rise in the Skagit Delta.” Skagit River Tidings. Skagit Watershed Council,
Mount Vernon, Washington. Independent Scientific Advisory Board. 2000. The Columbia River Estuary and the Columbia River Basin
Fish and Wildlife Program. Northwest Power Planning Council and National Marine Fisheries Service, Portland, OR.
Inkley, D.B., et al. 2004. Global Climate Change and Wildlife in North America. Wildlife Society
Technical Review 04-2. The Wildlife Society, Bethesda, MD. Intergovernmental Panel on Climate Change (IPCC). 2007a. Climate Change 2007: The Physical Science
Basis, Summary for Policymakers. Fourth Assessment Report, Intergovernmental Panel on Climactic Change, Geneva Switzerland.
IPCC, 2007b. Climate Change 2007: Mitigation of Climate Change. Fourth Assessment report,
Intergovernmental Panel on Climate Change, Geneva, Switzerland. IPCC. 2001. Climate Change 2001: The Scientific Basis. Contribution of Working Group I to the Third
Assessment Report of the Intergovernmental Panel on Climate Change. Cambridge University Press, Cambridge, United Kingdom and New York, NY.
IPCC, 2000. Special Report on Emissions Scenarios. Cambridge University Press, Cambridge. United
Kingdom and New York, NY. Johnson, Z.P. 1998. Sensitivity of the Coastal Management System in Washington State to the Incorporation
of Climate Forecasts and Projections. Master’s Thesis, School of Marine Affairs, University of Washington, Seattle, WA.
Kay, J.E. 2005. “Summary of Coastal Areas Breakout Session.” Conference Notes “The Future Ain’t What
it Used to Be: Planning for Climate Disruption.” October 27, 2005, Qwest Field Conference Center, Seattle, WA, Sponsored by King County.
Keuler, R.F. 1988. "Map Showing Coastal Erosion, Sediment Supply, and Longshore Transport in the
Port Townsend 30- by 60-minute Quadrangle, Puget Sound Region, Washington." USGS Misc. Investigations Series MAP I-1198-E.
92
Sea-level Rise and Coastal Habitats in the Pacific Northwest
Morris, J.T., et al. 2002. “Responses of Coastal Wetlands to Rising Sea Level.” Ecology 83(10): 2869-77. Mote, P.W., et al. 2005. “Declining Mountain Snowpack in Western North America.” Bulletin of the
American Meteorological Society 86(1): 39-49. National Oceanic and Atmospheric Administration (NOAA). 2006. “Erosion Control Easements.”
http://coastalmanagement/noaa.gov/initiatives/shoreline_ppr_easements.html (accessed June 18, 2007).
National Marine Fisheries Service (NMFS). 2006. Designation of Critical Habitat for Southern Resident
Killer Whales: Biological Report. NMFS Northwest Region, Seattle, WA. Nicholls, R.J. 2004 “Coastal Flooding and Wetland Loss in the 21st Century: Changes Under the SRES
Climate and Socio-economic Scenarios.” Global Environmental Change 14: 69-86. O’Neill, B.C. and M. Oppenheimer. 2002. “Dangerous Climate Impacts and the Kyoto Protocol.”
Science 14: 1971-2. Otto-Bliesner, B.L., et al. 2006. “Simulating Arctic Climate Warmth and Icefield Retreat in the Last
Interglaciation.” Science 311: 1751-3. Overpeck, J.T., et al. 2006. “Paleoclimatic Evidence for Future Ice-sheet Instability and Rapid Sea-level
Rise.” Science 311: 1747-50. Park, R.A., J.K. Lee, and D.J. Canning. 1993. “Potential Effects of Sea-level Rise on Puget Sound
Wetlands.” Geocarto International 4: 99-110. Parry, M., et al. 2001. “Millions at Risk: Defining Critical Climate Change Threats and Targets.”
Global Environmental Change 11: 181-3. Puget Sound Action Team. 2007. State of the Sound 2007. Office of the Governor, Olympia, WA. Rahmstorf, S. 2007. “A Semi-Empirical Approach to Projecting Future Sea-Level Rise” Science 315:
368-370. Redman, S., D. Myers, and D. Averill. 2005. Regional Nearshore and Marine Aspects of Salmon Recovery.
Puget Sound Action Team, Olympia, WA. Reid, W.V. and M.C. Trexler. 1991. Drowning the National Heritage: Climate Change and U.S. Coastal
Biodiversity. World Resources Institute, Washington, D.C. Restore America’s Estuaries (RAE). 2002. A National Strategy to Restore Coastal and Estuarine Habitat.
Arlington, VA: RAE. Rignot, E. and P. Kanagaratnam. 2006. “Changes in the Velocity Structure of the Greenland Ice Sheet.”
Science 311 (5763): 986-90.
93
Sea-level Rise and Coastal Habitats in the Pacific Northwest
Shipman, H. 2004. “Coastal Bluffs and Sea Cliffs on Puget Sound, Washington.” In: M.A. Hampton and G.B. Griggs (eds.), Formation, Evolution, and Stability of Coastal Cliffs–Status and Trends, Professional Paper 1693. U.S. Geological Survey: 81-94.
Shipman, H. 1989. Vertical Land Movements in Coastal Washington: Implications for Sea Level Change.
Shorelands and Coastal Zone Management Program, Washington Department of Ecology, Olympia.
Snover, A. K., et al. 2005. Uncertain Future: Climate Change and its Effects on Puget Sound. A report for
the Puget Sound Action Team by the Climate Impacts Group. Center for Science in the earth System, Joint Institute for the Study of the Atmosphere and Oceans, University of Washington, Seattle.
Sound Science: Synthesizing Ecological and Socioeconomic Information about the Puget Sound Ecosystem.
2007. M. Ruckelshaus and M. McClure (coordinators); prepared in collaboration with the Sound Science Collaborative Team. U.S. Department of Commerce, NOAA/National Marine Fisheries Service, Northwest Fisheries Science Center. Seattle, Washington. 93pp.
Thom, R. M., et al. 2001. “The Influence of Climate Variation and Change on Structure and Processes
in Nearshore Vegetated Communities of Puget Sound and Other Northwest Estuaries.” Puget Sound Action Team, T. Droscher (ed.) Proceedings of the 2001 Puget Sound Research Conference. Puget Sound Action Team. Olympia, WA.
Thom, R. M. 1992. “Accretion Rates of Low Intertidal Salt Marshes in the Pacific Northwest” Wetlands
12(3): 147-56. U.S. Fish & Wildlife Service. “Oregon’s Important Bird Areas: Tillamook Bay.” www.oregoniba.org/
tillamookbay.htm (accessed March 9, 2007). Van Osch, E. 1990. Coastal Bluff Erosion in the Strait of Georgia Region—Geomorphology and
Management. Vancouver, Simon Fraser University, Masters Thesis. Washington State Department of Natural Resources (WADNR). 2005. Aquatic Resources Program
Endangered Species Act Compliance Project: Covered Habitat Technical Paper. Olympia, WA. Williams, G.D. and R.M. Thom. 2001. Marine and Estuarine Shoreline Modification Issues (Sequim,
WA: Battelle Marine Sciences Laboratory/Pacific Northwest National Laboratory). WADNR. 1998. Our Changing Nature: Natural Resources Trends in Washington State. Olympia, WA.
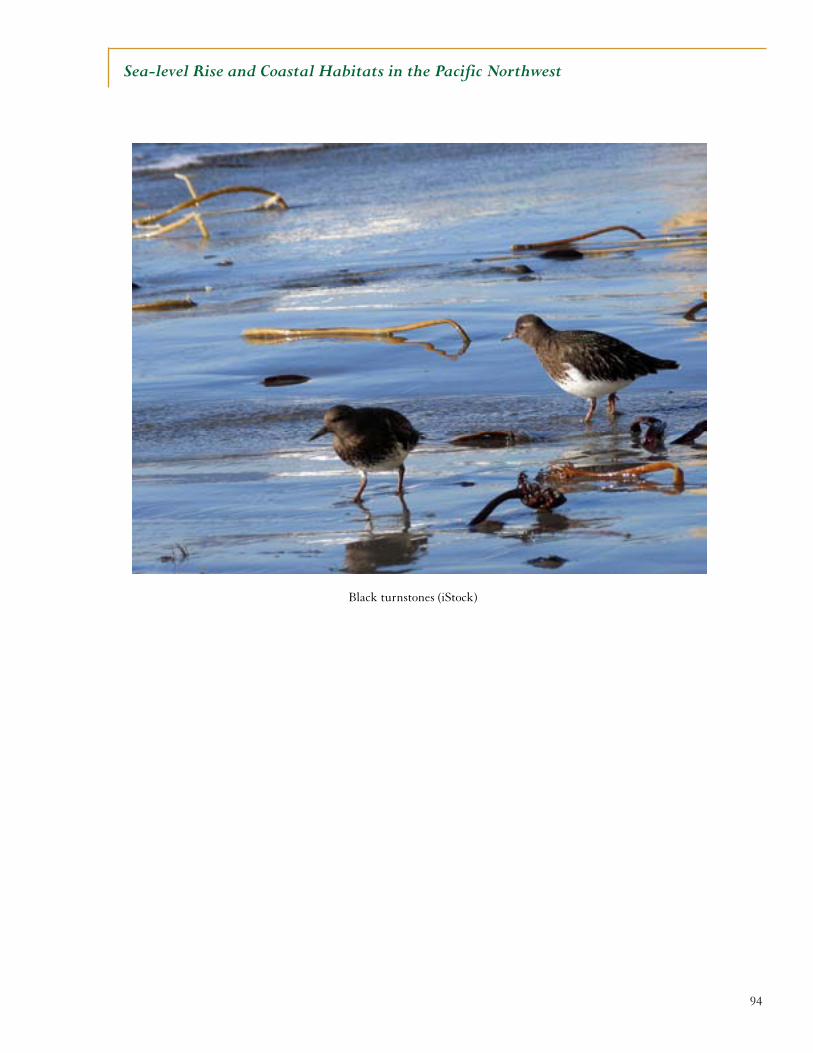
94
Sea-level Rise and Coastal Habitats in the Pacific Northwest
Black turnstones (iStock)
95
Sea-level Rise and Coastal Habitats in the Pacific Northwest
Western Natural Resource Center 6 Nickerson Street, Suite 200
Seattle, Washington 98109 (206) 285-8707