Embed Size (px)
Citation preview
Sea-Level Rise and Coastal Habitats in the Chesapeake Bay Region
NATIONAL WILDLIFE FEDERATION
Sea-Level Rise and Coastal Habitats in the Chesapeake Bay Region
Technical Report
Sea-Level Rise and Coastal Habitats in the Chesapeake Bay Region
Sea-Level Rise and Coastal Habitats in the Chesapeake Bay Region Technical Report May 2008 Prepared by: Patty Glick, Senior Global Warming Specialist, National Wildlife Federation Jonathan Clough, Environmental Consultant, Warren Pinnacle Consulting, Inc. Brad Nunley, GIS Specialist, National Wildlife Federation © 2008 by the National Wildlife Federation All rights reserved. Larry J. Schweiger President and Chief Executive Officer National Wildlife Federation This report was funded in part by a generous grant from the Keith Campbell Foundation for the Environment. Cover Photo: NOAA
Sea-Level Rise and Coastal Habitats in the Chesapeake Bay Region
Table of Contents
Introduction ...................................................................................................................................................................1
Global Warming and Rising Seas: A Matter of Degrees..................................................................................................2
Sea-Level Rise and Coastal Habitats ...............................................................................................................................4
Potential Impacts on Fish and Wildlife...........................................................................................................................7
Implications for Coastal Management and Restoration ...................................................................................................9
Project Background ......................................................................................................................................................12
Model Summary ...........................................................................................................................................................15
Model Results ...............................................................................................................................................................18
Entire Study Area ......................................................................................................................................................18
Site 1: Susquehanna River & Northern Chesapeake Bay................................................................................................25
Site 2: Delaware Bay .................................................................................................................................................31
Site 3: Baltimore........................................................................................................................................................37
Site 4: Annapolis ........................................................................................................................................................44
Site 5: Eastern Bay Region .........................................................................................................................................51
Site 6: Rehoboth Beach & Oceanic Delaware ...............................................................................................................57
Site 7: Cambridge MD & Surrounding Peninsula.........................................................................................................63
Site 8: Chincoteague Bay ............................................................................................................................................69
Site 9: Deal Island, N. Tangier Sound, Crisfield ...........................................................................................................75
Site 10: Pocomoke Sound, Hog Island Bay, Outlet Bay .................................................................................................79
Site 11: Mobjack Bay, Hampton .................................................................................................................................85
Site 12: VA Beach, Norfolk.........................................................................................................................................91
Model Parameterization ...............................................................................................................................................96
References ..................................................................................................................................................................117
Sea-Level Rise and Coastal Habitats in the Chesapeake Bay Region
1
Introduction The Chesapeake Bay region is blessed with an amazing diversity of coastal habitats, from
sandy beaches and barrier islands along the Atlantic Coast to coastal marshes, swamps, seagrass beds, and estuarine beaches in the bay itself. Together, these habitats support thousands of species of fish and wildlife, and they are a linchpin for the regional economy, culture, and quality of life (STAC, 2003).
The Chesapeake Bay provides critical stopover and wintering habitat for more than one million migratory waterfowl, including canvasback, mallard, redhead, American black duck, tundra swan, and Canada goose (Perry and Deller, 1995). They bay’s coastal marshes are home to great blue heron, snowy egret, and other familiar waterbirds, and they provide important food sources and nesting sites for numerous songbirds, mammals, reptiles, and amphibians. The region’s beaches support some of the largest populations of shorebirds such as red knot and piping plover in the western hemisphere and are a critical nest site for sea turtles (Najjar, et al., 2000). Coastal habitats also sustain regional recreational and commercial fisheries worth billions of dollars annually, including popular blue crab, rockfish, menhaden, and eastern oyster. Moreover, they play a critical role in protecting regional water quality and buffering communities from storms surges and waves.
Unfortunately, the region’s coastal habitats and the ecological systems they support face serious problems due to human activities, including wetland destruction from agricultural and urban and suburban development, excess nutrient input to the bay, deforestation, and overfishing (STAC, 2003). Numerous efforts are currently underway to try to restore the health of the Chesapeake Bay. While there have been some conservation successes, such as the return of populations of rockfish and Canada goose to healthy numbers, the bay still faces many problems. Today the daunting task before us is growing, as we also face the extraordinary challenges brought on by human-caused global warming.
Sea-Level Rise and Coastal Habitats in the Chesapeake Bay Region
2
Global Warming and Rising Seas: A Matter of Degrees
Scientists have widely and conclusively determined that global warming is happening and that burning fossil fuels is largely to blame (IPCC, 2007). Global warming is disrupting the planet’s climate system, and it is already having an impact on the Chesapeake Bay, including higher average air and water temperatures and more-extreme weather events (Hayhoe, et al., 2007; and Groisman, et al., 2004)). Left unchecked, global warming will mean higher average air and water temperatures and more-extreme weather events such as floods, droughts, and heat waves, all of which put the region’s coastal habitats and the fish and wildlife that depend on them at great risk (Fisher, et al., 2000).
In addition, global warming is contributing to a significant increase in the rate of sea-level rise due to the thermal expansion of ocean waters and melting of glaciers and ice fields. The average global (eustatic) sea level rose about 6.7 inches over the 20
th century, at an average rate of .07 inches
per year.1 This was 10-times faster than the average rate of sea-level rise during the last 3,000 years
(IPCC, 2007). In the coming decades, the rate of sea-level rise is expected to accelerate (in fact, it appears to have already accelerated to a rate of about 0.13 inch per year (or 13 inches per century) since 1993 (Church and White, 2006).
The most recent estimates from the 2007 Intergovernmental Panel on Climate Change (IPCC) assessment show an additional 7- to 23-inch rise in global average sea level by the 2090s, with an additional 4 to 8 inches possible by taking into consideration the current rate of ice flow from Greenland and Antarctica. There is compelling new evidence, however, that because these figures ignore the recent dynamic changes in Greenland and Antarctica ice flow, they significantly underestimate the rate of global sea-level rise that we will experience in the coming decades (Otto-Bliesner, et al., 2006; Overpeck, et al., 2006; and Rignot and Kanagaratnam, 2006).
Taking at least some of this accelerated melting into account, a recent study suggests that a
feasible range by 2100 might be 20 inches to 4 ½ feet with a 9 degree Fahrenheit warming relative to 1990 levels, which is within the range of projected warming during this century if global warming pollution continues unabated (Rahmstorf, 2007). Furthermore, according to Dr. James Hansen, Director of NASA’s Goddard Institute for Space Studies, if greenhouse gas emissions continue to increase on a “business as usual” trajectory, we could ultimately see a disintegration of the West Antarctica ice sheets. This has the potential to yield “a sea-level rise of the order of 5 meters this century” (Hansen, 2007). Indeed, a sea-level rise of this magnitude would have enormous global consequences. With a large portion of the world’s population living in low-lying coastal areas, millions of people will be displaced by sea-level rise before the end of this century. But there are considerable risks closer to home.
With its expansive coastline, low-lying topography, and growing coastal population, the Chesapeake Bay region is one of the most vulnerable places in the nation to the impacts of sea-level rise. Many places along the Chesapeake Bay have seen a one-foot increase in relative sea-level rise over the 20
th century, six inches due to global warming and other six inches due to naturally-
subsiding coastal lands – a factor that places the Chesapeake Bay region at particular risk (Zervas,
1 “Eustatic” sea-level rise refers to the changes in ocean volume due to thermal expansion and melting glaciers and ice sheets. At the localized level, the amount of relative sea-level rise can vary due to factors (both natural and human-influenced) that determine changes in vertical land elevation, such as land subsidence, sedimentation, and marsh accretion.
Sea-Level Rise and Coastal Habitats in the Chesapeake Bay Region
3
2001). Already, many of the bay’s coastal marshes and small islands have been inundated. At least 13 islands in the bay have disappeared entirely, and many more are at risk of being lost soon (U.S. EPA, 2008).
In an effort to restore some of the habitats lost with these islands, the U.S. Army Corps of
Engineers, the Port of Baltimore, and the Maryland Environmental Service launched a $400 million restoration program to “rebuild” Maryland’s Poplar Island using materials dredged from regional shipping channels (Burton, 2008). Today, marsh habitats are starting to become established on the “new” Poplar Island, and waterfowl, shorebirds, and diamondback terrapins are returning, as are some “undesirable” predator species such as gulls and great horned owls (Erwin, Bringer, and Fruh, 2003). Whether projects such as this will be effective or sustainable as the rate of sea-level rise continues to accelerate, however, is an important question for the region to begin to address.
Sea-Level Rise and Coastal Habitats in the Chesapeake Bay Region
4
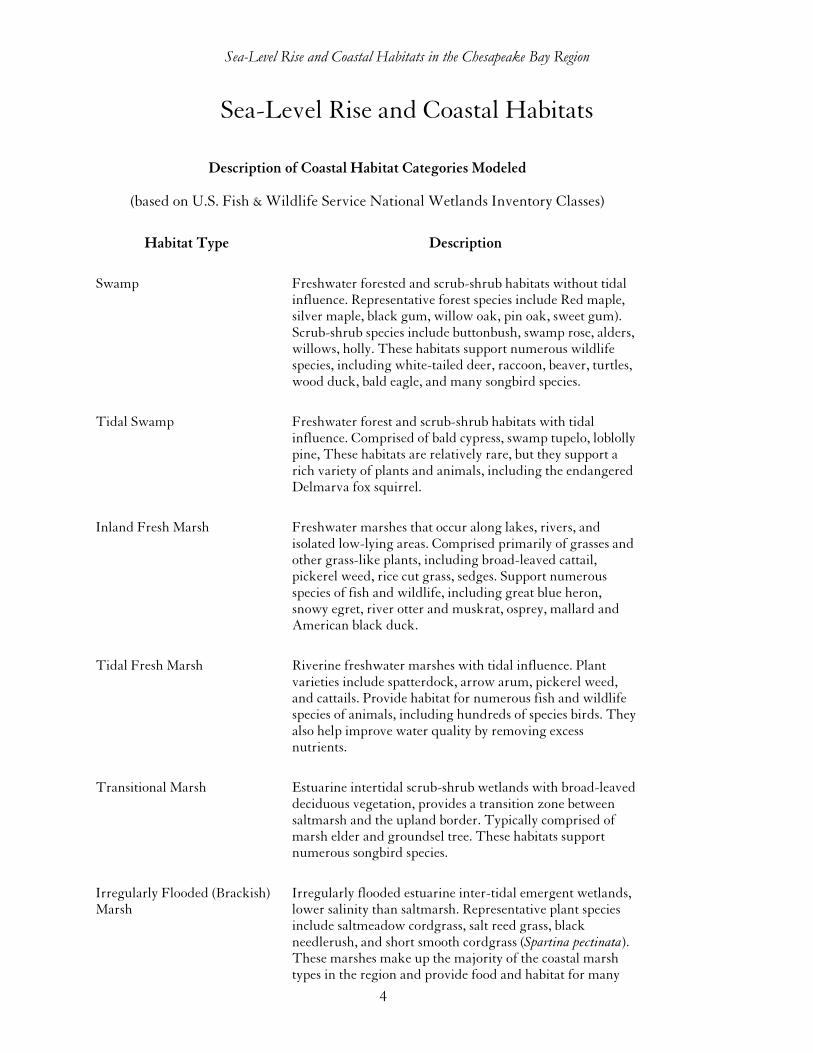
Sea-Level Rise and Coastal Habitats
Description of Coastal Habitat Categories Modeled
(based on U.S. Fish & Wildlife Service National Wetlands Inventory Classes)
Habitat Type Description
Swamp Freshwater forested and scrub-shrub habitats without tidal influence. Representative forest species include Red maple, silver maple, black gum, willow oak, pin oak, sweet gum). Scrub-shrub species include buttonbush, swamp rose, alders, willows, holly. These habitats support numerous wildlife species, including white-tailed deer, raccoon, beaver, turtles, wood duck, bald eagle, and many songbird species.
Tidal Swamp Freshwater forest and scrub-shrub habitats with tidal influence. Comprised of bald cypress, swamp tupelo, loblolly pine, These habitats are relatively rare, but they support a rich variety of plants and animals, including the endangered Delmarva fox squirrel.
Inland Fresh Marsh Freshwater marshes that occur along lakes, rivers, and isolated low-lying areas. Comprised primarily of grasses and other grass-like plants, including broad-leaved cattail, pickerel weed, rice cut grass, sedges. Support numerous species of fish and wildlife, including great blue heron, snowy egret, river otter and muskrat, osprey, mallard and American black duck.
Tidal Fresh Marsh Riverine freshwater marshes with tidal influence. Plant varieties include spatterdock, arrow arum, pickerel weed, and cattails. Provide habitat for numerous fish and wildlife species of animals, including hundreds of species birds. They also help improve water quality by removing excess nutrients.
Transitional Marsh Estuarine intertidal scrub-shrub wetlands with broad-leaved deciduous vegetation, provides a transition zone between saltmarsh and the upland border. Typically comprised of marsh elder and groundsel tree. These habitats support numerous songbird species.
Irregularly Flooded (Brackish) Marsh
Irregularly flooded estuarine inter-tidal emergent wetlands, lower salinity than saltmarsh. Representative plant species include saltmeadow cordgrass, salt reed grass, black needlerush, and short smooth cordgrass (Spartina pectinata). These marshes make up the majority of the coastal marsh types in the region and provide food and habitat for many
Sea-Level Rise and Coastal Habitats in the Chesapeake Bay Region
5
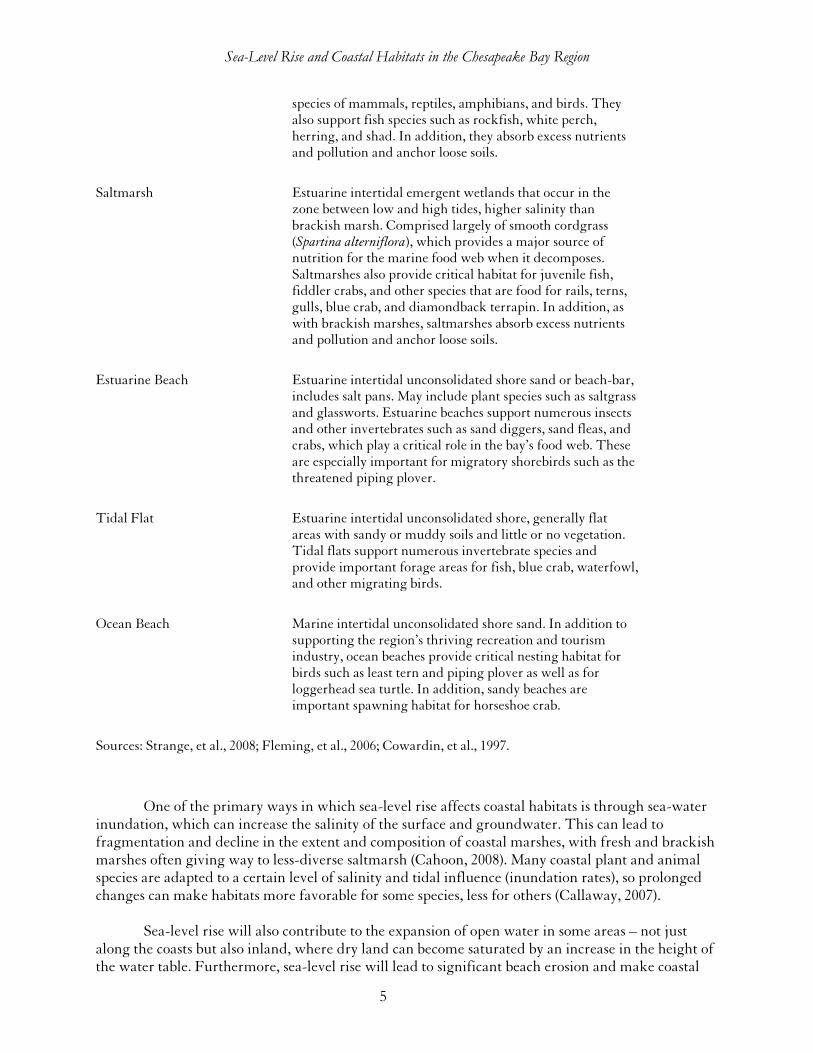
species of mammals, reptiles, amphibians, and birds. They also support fish species such as rockfish, white perch, herring, and shad. In addition, they absorb excess nutrients and pollution and anchor loose soils.
Saltmarsh Estuarine intertidal emergent wetlands that occur in the zone between low and high tides, higher salinity than brackish marsh. Comprised largely of smooth cordgrass (Spartina alterniflora), which provides a major source of nutrition for the marine food web when it decomposes. Saltmarshes also provide critical habitat for juvenile fish, fiddler crabs, and other species that are food for rails, terns, gulls, blue crab, and diamondback terrapin. In addition, as with brackish marshes, saltmarshes absorb excess nutrients and pollution and anchor loose soils.
Estuarine Beach Estuarine intertidal unconsolidated shore sand or beach-bar, includes salt pans. May include plant species such as saltgrass and glassworts. Estuarine beaches support numerous insects and other invertebrates such as sand diggers, sand fleas, and crabs, which play a critical role in the bay’s food web. These are especially important for migratory shorebirds such as the threatened piping plover.
Tidal Flat Estuarine intertidal unconsolidated shore, generally flat areas with sandy or muddy soils and little or no vegetation. Tidal flats support numerous invertebrate species and provide important forage areas for fish, blue crab, waterfowl, and other migrating birds.
Ocean Beach Marine intertidal unconsolidated shore sand. In addition to supporting the region’s thriving recreation and tourism industry, ocean beaches provide critical nesting habitat for birds such as least tern and piping plover as well as for loggerhead sea turtle. In addition, sandy beaches are important spawning habitat for horseshoe crab.
Sources: Strange, et al., 2008; Fleming, et al., 2006; Cowardin, et al., 1997.
One of the primary ways in which sea-level rise affects coastal habitats is through sea-water inundation, which can increase the salinity of the surface and groundwater. This can lead to fragmentation and decline in the extent and composition of coastal marshes, with fresh and brackish marshes often giving way to less-diverse saltmarsh (Cahoon, 2008). Many coastal plant and animal species are adapted to a certain level of salinity and tidal influence (inundation rates), so prolonged changes can make habitats more favorable for some species, less for others (Callaway, 2007).
Sea-level rise will also contribute to the expansion of open water in some areas – not just along the coasts but also inland, where dry land can become saturated by an increase in the height of the water table. Furthermore, sea-level rise will lead to significant beach erosion and make coastal
Sea-Level Rise and Coastal Habitats in the Chesapeake Bay Region
6
areas more susceptible to storm surges. The depth of water in estuaries has a significant influence on wave action during storms – the deeper the water, the larger and more destructive the waves (Kearney, 2006). And large storms can cause “overwash” of barrier islands, whereby sediments are carried over the crest of the barrier and deposited onto adjacent wetlands.
Coastal habitats such as marshes and beaches may to at least some extent be able to accommodate moderate changes in sea level by migrating inland or increasing elevation due to the build up of sediments (for wetlands, this is a process called “accretion.”) (Cahoon, et al., 1998). In some river deltas, for example, the deposition of sediments from upstream or upland sources can provide sufficient levels of soil for marshes to maintain elevation relative to sea level, such as is occurring in much of the western shore of the Chesapeake Bay (Stevenson and Kearney, 2008). In addition, marshes can build up their own organic matter through decomposition of roots and leaves. However, recent studies suggest that neither habitat migration nor accretion rates in many areas are currently sufficient enough to maintain elevation relative to sea level even at the current rate of sea-level rise, particularly on the eastern shore (Kearney, Grace, and Stevenson, 1988). Moreover, even where marshes are experiencing significant accretion today, there is no guarantee that the rate of accretion will remain linear (i.e., continue at the same pace) over the long term (Moorhead and Brinson, 1995). As the rate of sea-level rise continues to accelerate in the coming decades, the potential for coastal wetlands to naturally keep pace is likely to decline further (Najjar, et al., 2000).
In addition, the opportunity for inland migration in parts of the Chesapeake Bay region is becoming increasingly limited due to coastal development and associated armoring by seawalls, dikes, and other structures (Titus, 1998). Armoring of the shoreline essentially creates a barrier that prevents habitats such as beaches and coastal wetlands from moving upland toward protected property as sea-level rises. Essentially, these habitats become squeezed out. Coastal armoring can also alter the extent of beach erosion associated with wave action, which under natural conditions is an important process that replenishes beaches. Ultimately, coastal communities will be relegated to continual beach re-nourishment projects using dredged materials to maintain beaches, a process that is not only costly but can be harmful native fish and wildlife.
Sea-Level Rise and Coastal Habitats in the Chesapeake Bay Region
7
Potential Impacts on Fish and Wildlife
Changes in the Chesapeake Bay region’s coastal habitats due to sea-level rise will have a significant impact on the fish and wildlife they support. Given that all habitat types, from tidal freshwater marshes and swamps to saltmarsh and beach, are linked in one way or another, changes in their composition due to sea-level rise will have consequences for the coastal ecosystem (Rogers and McCarty, 2000). Translating the potential habitat changes into impacts on specific species is difficult, as there are many combined factors at play. However, it is reasonable to develop a general sense of those species that are particularly vulnerable given their relative dependence on the most-threatened habitats. According to a recent scientific review of sea level rise impacts in the Mid-Atlantic region conducted for the U.S. EPA’s Climate Change Science Program, hundreds of species of birds, fish, invertebrates, and mammals are at risk (Strange, et al., 2008).
Fish and Shellfish
The loss of coastal wetlands will have a significant impact on the fish and shellfish of the Chesapeake Bay. The projected changes in the extent and composition of the region’s tidal marshes, in particular, could have far-reaching effects on the Chesapeake Bay food web. Decomposing vegetation from these marshes provide an important source of nutrition for numerous invertebrates and small fish, which go on to feed many other fish and shellfish such as rockfish, menhaden, and blue crab. An estimated 66% of commercial fishes also depend on the region’s coastal marshes for nursery and spawning grounds, including Atlantic menhaden, bluefish, flounder, spot, mullet, croaker, and rockfish (WRC 4, 2008). The loss of irregularly flooded marsh could be particularly harmful to rockfish and white perch as well as anadromous species such as herring and shad (Strange, et al., 2008). Similarly, the loss of tidal fresh marshes could affect species that depend on those habitats, such as minnows, carp, sunfish, crappie, and bass (Strange, et al., 2008).
In addition to providing food, nesting and rearing habitat, tidal marshes also play an
important role in maintaining water quality in the bay by taking up excess nutrients that contribute to hypoxia events and dead zones, which have been an ongoing problem plaguing the bay (Hagy, et al., 2004). Loss of beaches and tidal flats also would have a significant impact on a number of Chesapeake Bay fish and shellfish species. Beaches are important spawning habitat for horseshoe crab, and fish species such as killfish, mummichog, rockfish, perch, herring, silversides, and bay anchovy rely on the region’s beaches to forage for food (Strange, et al., 2008). In addition, tidal flats support worms, clams, snails, and other species that are critical food sources for a plethora of fish and wildlife.
Waterbirds and Songbirds Changes in the extent and composition of marshes, beaches, and other coastal habitats are likely to have a significant impact on the numerous species of waterbirds and songbirds that depend on the for stopover, wintering, and breeding habitat. The Chesapeake Bay is one of the most important stopover and wintering sites for migratory waterfowl in the Atlantic Flyway, and it is an important nesting site for mallard and American black duck (Perry, 2008). A decline in tidal freshwater marshes in the region due to sea-level rise could be particularly harmful to American black duck, whose populations are already low (Erwin, et al., 2006). Seagrass losses associated in part with sea-level rise will be particularly devastating for those species that depend on submerged
Sea-Level Rise and Coastal Habitats in the Chesapeake Bay Region
8
aquatic vegetation for food, including redhead, northern pintail, American wigeon, American black duck, ruddy duck, and canvasback.
The Chesapeake Bay’s coastal marshes also provide important habitat for wading birds such as great blue herons and snowy egrets as well as a number of marsh-nesting species, including clapper rail, black rail, least bittern, Forster’s tern, and laughing gull (Erwin, et al., 2006). A reduction in coastal marsh habitat could limit the birds’ food sources and make them more vulnerable to predators (Strange, et al., 2008). In addition, the projected loss of beaches and tidal flats throughout the Chesapeake Bay region due to sea-level rise poses a serious threat to the region’s migratory shorebirds, which rely on these habitats for foraging and nesting (Galbraith, et al., 2005). Some of the species at risk include red knot, piping plover, American oystercatcher, ruddy turnstone, sanderling, and sandpipers (Strange, et al., 2008).
Numerous songbird species rely on the region’s coastal habitats as well. The southern tip of
Virginia’s eastern shore, for example, is a stopover site for literally millions of migrating songbirds, making it one of the most popular places in the country for birdwatchers (TNC, 2008). Popular species that migrate through the area include wood thrush, red-eyed vireo, American redstart, black-throated green warbler, ovenbird, and scarlet tanager (VDCR, 2008). And several “species of concern,” including the saltmarsh sharp-tailed sparrow and the seaside sparrow, rely on in-tact marshes for successful breeding. Many of these birds will lose critical habitat to sea-level rise.
Mammals and Reptiles
Several mammal and reptile species in the Chesapeake Bay also are vulnerable to habitat loss due to sea level rise. Several mammals, including the muskrat, beaver, and river otter, and even dolphins, depend on the region’s marshes and other aquatic habitats. In addition, the land to the east of the bay (called the Delmarva Peninsula) is the exclusive habitat for the Delmarva fox squirrel, which is listed as endangered (CBP, 2008). The projected changes in coastal habitats will likely affect these species both directly, through loss of habitat, and indirectly, through changes in the regional food web. Sea-level rise also poses a threat to some of the region’s already-imperiled reptile species, including the endangered loggerhead and Kemp’s ridley sea turtles, which rely on the region’s beaches as critical nesting habitat use the Chesapeake Bay waters as feeding grounds. In addition, the considerable loss of brackish marshes projected for the region could have a devastating impact on the diamondback terrapin, species that are endemic to these coastal habitats.
Sea-Level Rise and Coastal Habitats in the Chesapeake Bay Region
9
Implications for Coastal Management and Restoration
The most important action the region and nation must take to prevent the possibly catastrophic loss of fish and wildlife due to unmitigated global warming is to reduce greenhouse gas emissions. However, there will be some warming in the next century that we cannot avoid, and this warming will have a significant impact on local species and habitats. Thus, we must also develop adaptation strategies to help fish and wildlife cope with the expected changes to their habitats, including sea-level rise, as we build in the flexibility to deal with unforeseen impacts.
Fortunately, we have the opportunity to minimize the risks and ensure that the Chesapeake Bay’s precious coastal resources and the ecological and economic benefits they provide will endure for our children and grandchildren. But there is no time for delay. Many of the decisions we make today – from where and how we build our homes, businesses, and highways, to how much and what kinds of energy we use – will have a significant impact on our resources, land use, and even our climate for many decades to come. Failure to take sea-level rise into consideration in these decisions will not only place many of the Chesapeake Bay’s coastal communities at risk, but it would have costly and irreversible consequences for human and natural systems.
For example, while some new wetlands are likely to be created in low-lying upland coastal
zones as sea-level rises, efforts to minimize land loss and protect roads, buildings, and other structures will likely lead to more armoring of shorelines, precluding the development of new wetlands in those areas (Titus, et al., 1991). Unless major efforts are implemented to enable migration of wetland habitats as sea-level rises, the loss of these habitats will have a significant adverse impact on the region’s ecology and economy.
Now is the time for the region to develop a comprehensive strategy to confront sea-level rise
in a way that increases the resiliency of coastal habitats by steering away from structural armoring of shorelines and restoring and protecting natural buffers, and reduces the risks to communities by discouraging building in vulnerable areas. Maryland has taken an important first step by establishing a state-wide Sea-Level Rise Response Strategy, which has laid out a number of recommended actions (Johnson, 2000). To be successful, however, actions should be coordinated throughout the region. Indeed, many of state and federal procedures for planning and assessing conditions for coastal and shoreline development fail to incorporate effects of sea-level rise, climate change, and future development.
It is our hope that this report will provide coastal resource managers and other relevant decision-makers with much needed information about local impacts of sea-level rise on the Chesapeake Bay’s coastal habitats to help them assess the risks and identify reasonable steps to manage those risks. Ultimately, the appropriate response strategies will vary for different areas, and site-specific studies may be warranted to supplement these findings by identify factors that have not effectively characterized by the model or are uncertain. However, the results of this analysis can be used to inform a number of important decisions regarding coastal restoration and management. Recommended actions:
1. Prioritize project sites based on ecological importance as well as vulnerability to sea-level
rise.
Given limited conservation resources, it will be especially important for governmental and non-governmental decision makers to consider where and what coastal restoration and
Sea-Level Rise and Coastal Habitats in the Chesapeake Bay Region
10
management efforts will be most effective in supporting specific conservation goals, such as protecting important ecosystem services, rare species, iconic places, and human communities, given the added threat of sea-level rise. One approach might be to identify priority conservation areas on maps comparable to those in this study to indicate their relative vulnerability under various scenarios of sea-level rise.
2. Expand restoration areas and coastal protection strategies to accommodate for habitat migration.
This study can assist in the identification of areas where there is the greatest potential to
protect habitat “buffers” and enable upland migration, such as by capitalizing on opportunities to protect land where there is currently little or no development (e.g., marginal agricultural lands). Ultimately, the region should broaden consideration of and opportunities for targeted land acquisition, rolling easements, tax incentives, and other strategies to discourage additional development in vulnerable areas, which will protect people as well as habitats. For highly-sensitive and ecologically important areas, it may be necessary to apply stronger coastal zoning regulations, mandatory setbacks, and other building restrictions along the shore. Another strategy would be to eliminate federal and state subsidies that promote coastal development and armoring in high risk areas, such as through federal flood insurance. Ultimately, these are decisions that must be made in a coordinated, collaborative process at both the local and regional levels.
3. Restore and protect a diverse array of habitat types to better support ecosystem functions and improve the resiliency of fish and wildlife species.
We need to look at our coasts as functioning ecosystems with many different linkages
between habitats and species, rather than individual habitat types and species. We need to develop strategies to restore or maintain a diverse array of habitat types, as well as habitat connectivity, to better support ecosystem functions and improve the resiliency of fish and wildlife species. This study will help in this effort by identifying potentials changes in habitat composition and diversity as well as increased fragmentation due to sea-level rise.
4. Identify areas that may warrant specific adaptation strategies such as natural and/or artificial replenishment of sediments
We may be able to help habitats in some areas “adapt” by restoring natural processes that
supply sediments to estuaries, coastal marshes, and beaches. For example, removal of seawalls and other coastal armoring may facilitate beach replenishment through natural sand erosion and deposition. In some cases, however, it will be necessary to consider management strategies such as beach re-nourishment and “assisted accretion” (using dredged materials to replenish coastal marshes, such as with Poplar Island). Beach re-nourishment will likely continue to be used in many of the more popular recreational beach areas, but it will become increasingly costly. Moreover, it will be important to establish and enforce rigorous environmental standards to ensure that the projects are ecologically sound (e.g., that they avoid using dredged sediments that are “contaminated” with potentially harmful exotic organisms or that may erode quickly and cloud coastal waters).
5. Expand monitoring and adaptive management practices.
By its very nature, there will always be a degree of uncertainty about how, when, and where
global warming will affect natural systems. Increased monitoring and research on the known and potential consequences on species and habitats will help close the gap in knowledge, but we will
Sea-Level Rise and Coastal Habitats in the Chesapeake Bay Region
11
never know exactly when and where we will experience the impacts until they occur. That does not mean we shouldn’t act. Rather, the very fact that there is risk – and the potential for global warming to lead to irreversible damages, such as the displacement of coastal communities and extinction of species – necessitates precautionary action. It is prudent to consider actions we can take now that will reduce our vulnerability as well as how to incorporate useful measures of uncertainty into our decision making, while building in the flexibility to revise strategies as we learn more (a concept known as “adaptive management”).
Sea-Level Rise and Coastal Habitats in the Chesapeake Bay Region
12
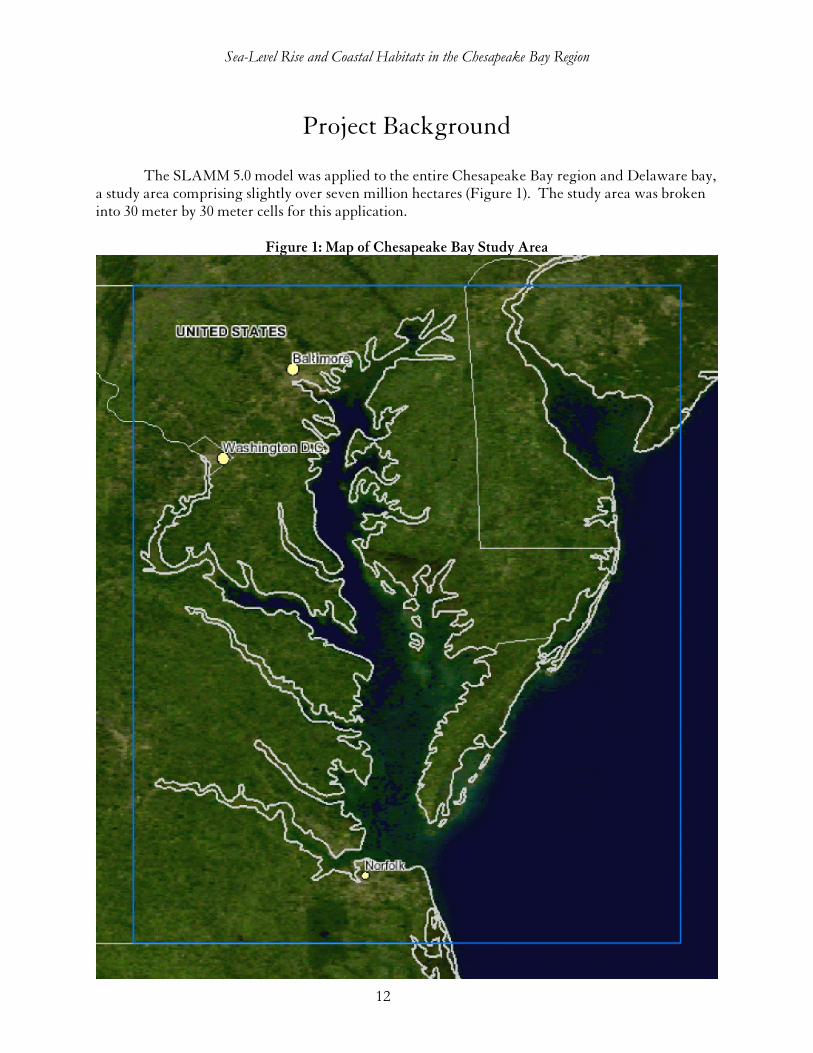
Project Background
The SLAMM 5.0 model was applied to the entire Chesapeake Bay region and Delaware bay, a study area comprising slightly over seven million hectares (Figure 1). The study area was broken into 30 meter by 30 meter cells for this application.
Figure 1: Map of Chesapeake Bay Study Area
Sea-Level Rise and Coastal Habitats in the Chesapeake Bay Region
13
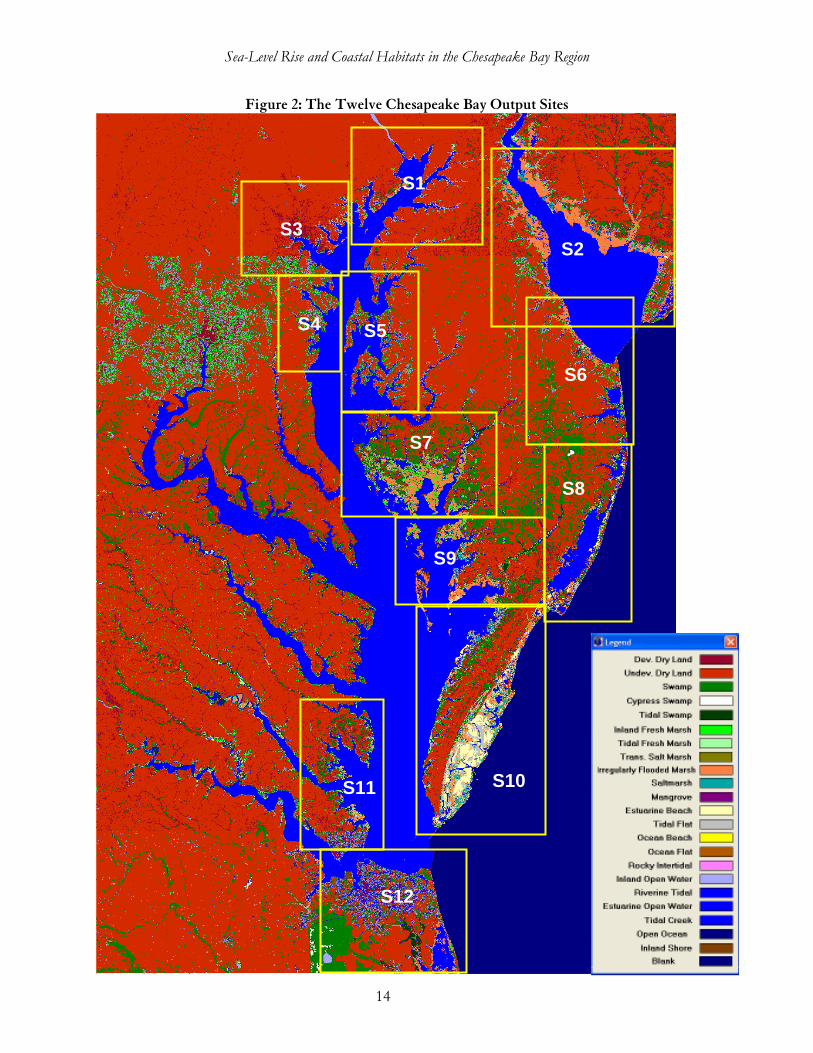
As it can be difficult to examine model output when presented on a scale as big as the study area, model results were broken into twelve output sites as shown in Figure 2.
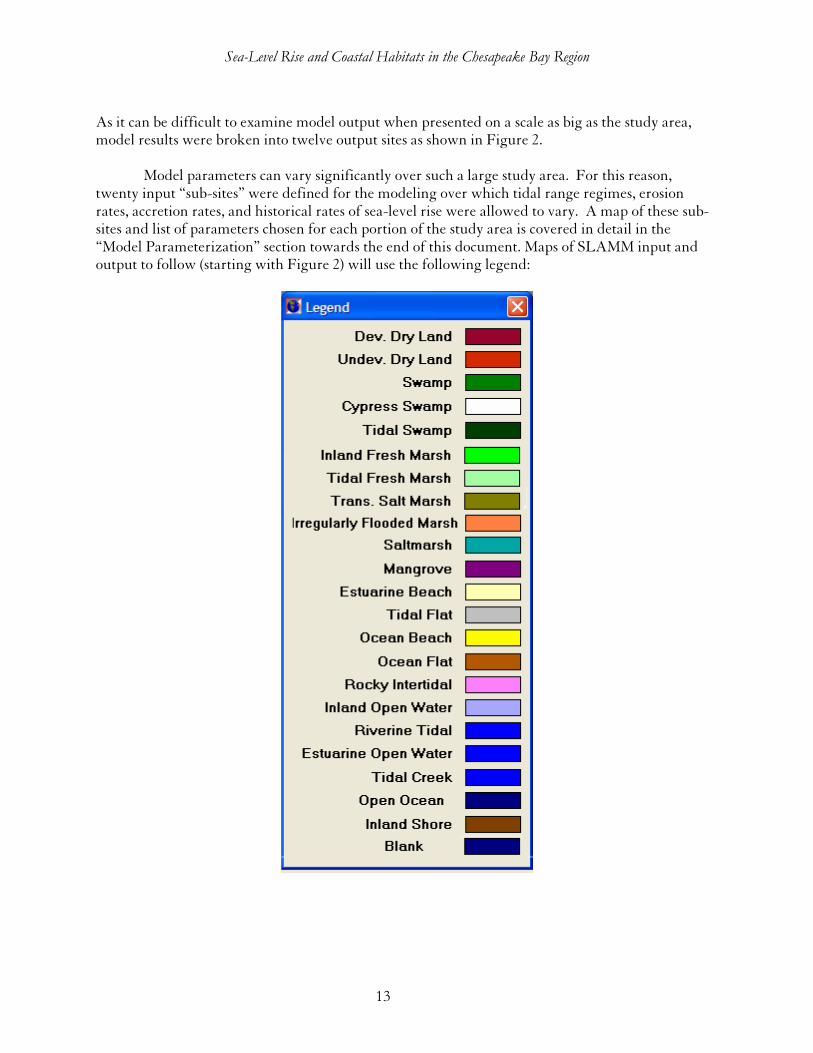
Model parameters can vary significantly over such a large study area. For this reason, twenty input “sub-sites” were defined for the modeling over which tidal range regimes, erosion rates, accretion rates, and historical rates of sea-level rise were allowed to vary. A map of these sub-sites and list of parameters chosen for each portion of the study area is covered in detail in the “Model Parameterization” section towards the end of this document. Maps of SLAMM input and output to follow (starting with Figure 2) will use the following legend:
Sea-Level Rise and Coastal Habitats in the Chesapeake Bay Region
14
Figure 2: The Twelve Chesapeake Bay Output Sites
S1
S2 S3
S4 S5
S6
S7
S8
S9
S10 S11
S12
Sea-Level Rise and Coastal Habitats in the Chesapeake Bay Region
15
Model Summary
Changes in tidal marsh area and habitat type in response to sea-level rise were modeled using the Sea Level Affecting Marshes Model (SLAMM) that simulates the dominant processes involved in wetland conversions and shoreline modifications during long-term sea level rise (Park et al. 1989; www.warrenpinnacle.com/prof/SLAMM). Successive versions of the model have been used to estimate the impacts of sea level rise on the coasts of the U.S. (Titus et al., 1991; Lee, Park, and Mausel, 1992; Park, Lee, and Canning, 1993; Galbraith, et al., 2002; Glick, 2006; Glick, Clough, and Nunley, 2007; Craft et al., in review).
Within SLAMM, there are five primary processes that affect wetland fate under different scenarios of sea-level rise:
• Inundation: The rise of water levels and the salt boundary are tracked by reducing elevations of each cell as sea levels rise, thus keeping mean tide level (MTL) constant at zero. The effects on each cell are calculated based on the minimum elevation and slope of that cell. Vertical accretion of wetlands is considered in these calculations based on wetland type and geographic location.
• Erosion: Erosion is triggered based on a threshold of maximum fetch and the proximity of the marsh to estuarine water or open ocean. When these conditions are met, horizontal erosion occurs at a rate based on site- specific data.
• Overwash: Barrier islands of under 500 meters width are assumed to undergo overwash during each 25-year time-step due to storms. Beach migration and transport of sediments are calculated.
• Saturation: Coastal swamps and fresh marshes can migrate onto adjacent uplands as a response of the water table to rising sea level close to the coast.
• Salinity: In a defined estuary, the effects of salinity progression up an estuary and the resultant effects on marsh type may be tracked. This optional sub-model assumes an estuarine salt-wedge and calculates the influence of the freshwater head vs. the saltwater head in a particular cell. This model was not used in the Chesapeake Bay modeling.
SLAMM Version 5.0 is the latest version of the SLAMM Model, developed in 2006/2007 and
based on SLAMM 4.0. SLAMM 5.0 provides the following refinements:
• The capability to simulate much larger sites by processing model runs on the computer’s hard-drive rather than the computer’s RAM;
• The capability to simulate fixed levels of sea-level rise by 2100 in case IPCC estimates of sea-level rise prove to be too conservative;
• The capability to work with high-precision LiDAR data;
• The inclusion of “Inland Shore,” “Irregularly Flooded (Brackish) Marsh,” “Tall Spartina,” and “Tidal Swamp” as model categories.
Sea-Level Rise and Coastal Habitats in the Chesapeake Bay Region
16
To optimize solution of model results, each 30 meter by 30 meter cell was limited to hold a maximum of two land categories. This allows for migration of wetlands at a gradual pace (incremental changes of less than 30 meters) but does not allow for thin strips of wetlands or dry lands to exist between two other land categories within a single cell. Such small strips are unlikely to occur and are certainly not important given the scale of this modeling project. Traditionally, the number of land categories in a cell is not limited within SLAMM, but given the scope of this project, this additional memory optimization was required.
Within SLAMM-produced maps, each 30x30 map pixel represents the dominant category of land cover for a given cell. Tabular output is more precise, taking into account the amount of each wetland category in each cell. Based on the percentage impervious from the National Land Cover Database (http://www.mrlc.gov/index.asp), developed land was identified within the model. After testing several “percent impervious” thresholds, dry land that was at least 25% impervious was categorized as “developed dry land.
2”
SLAMM was run using two different assumptions about developed land. For 4 of the 7
scenarios, developed land was assumed to be protected through the construction of dikes or other protective measures. However, for three of the scenarios this assumption was turned off and developed lands were allowed to be converted. By examining these model results, the user can see which developed lands would be subject to inundation or erosion under different sea-level rise (SLR) scenarios. For a thorough accounting of SLAMM model processes and the underlying assumptions and equations, please see the SLAMM 5.0 technical documentation (Clough and Park, 2007).
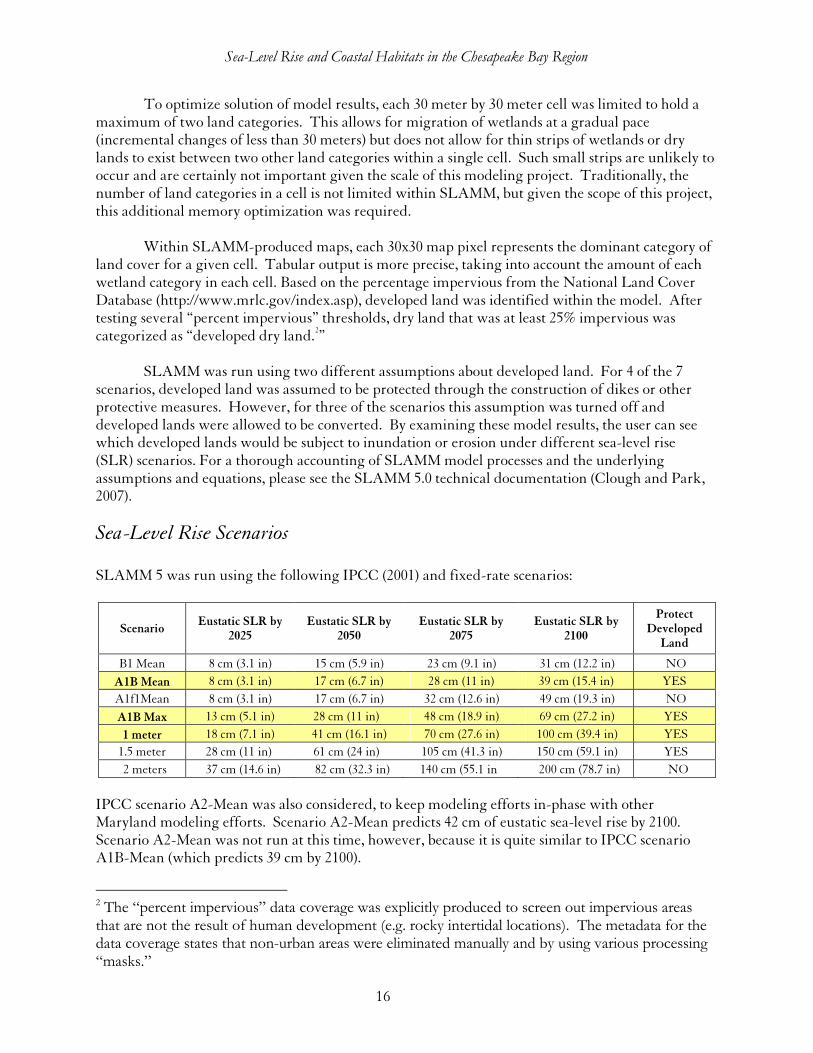
Sea-Level Rise Scenarios SLAMM 5 was run using the following IPCC (2001) and fixed-rate scenarios:
Scenario Eustatic SLR by
2025 Eustatic SLR by
2050 Eustatic SLR by
2075 Eustatic SLR by
2100
Protect Developed
Land
B1 Mean 8 cm (3.1 in) 15 cm (5.9 in) 23 cm (9.1 in) 31 cm (12.2 in) NO
A1B Mean 8 cm (3.1 in) 17 cm (6.7 in) 28 cm (11 in) 39 cm (15.4 in) YES
A1f1Mean 8 cm (3.1 in) 17 cm (6.7 in) 32 cm (12.6 in) 49 cm (19.3 in) NO
A1B Max
1 meter
IPCC scenario A2-Mean was also considered, to keep modeling efforts in-phase with other Maryland modeling efforts. Scenario A2-Mean predicts 42 cm of eustatic sea-level rise by 2100. Scenario A2-Mean was not run at this time, however, because it is quite similar to IPCC scenario A1B-Mean (which predicts 39 cm by 2100).
2 The “percent impervious” data coverage was explicitly produced to screen out impervious areas that are not the result of human development (e.g. rocky intertidal locations). The metadata for the data coverage states that non-urban areas were eliminated manually and by using various processing “masks.”
18 cm (7.1 in) 41 cm (16.1 in) 70 cm (27.6 in) 100 cm (39.4 in) YES
13 cm (5.1 in) 28 cm (11 in) 48 cm (18.9 in) 69 cm (27.2 in) YES
2 meters 37 cm (14.6 in) 82 cm (32.3 in) 140 cm (55.1 in 200 cm (78.7 in) NO
1.5 meter 28 cm (11 in) 61 cm (24 in) 105 cm (41.3 in) 150 cm (59.1 in) YES
Sea-Level Rise and Coastal Habitats in the Chesapeake Bay Region
17
For simplicity, this document focuses on scenarios A1B-Mean, A1B-Maximum, and the 1
meter simulations (highlighted in the above table). Tabular data, charts, and maps of results (as presented in this document) are available for all other simulations by request.
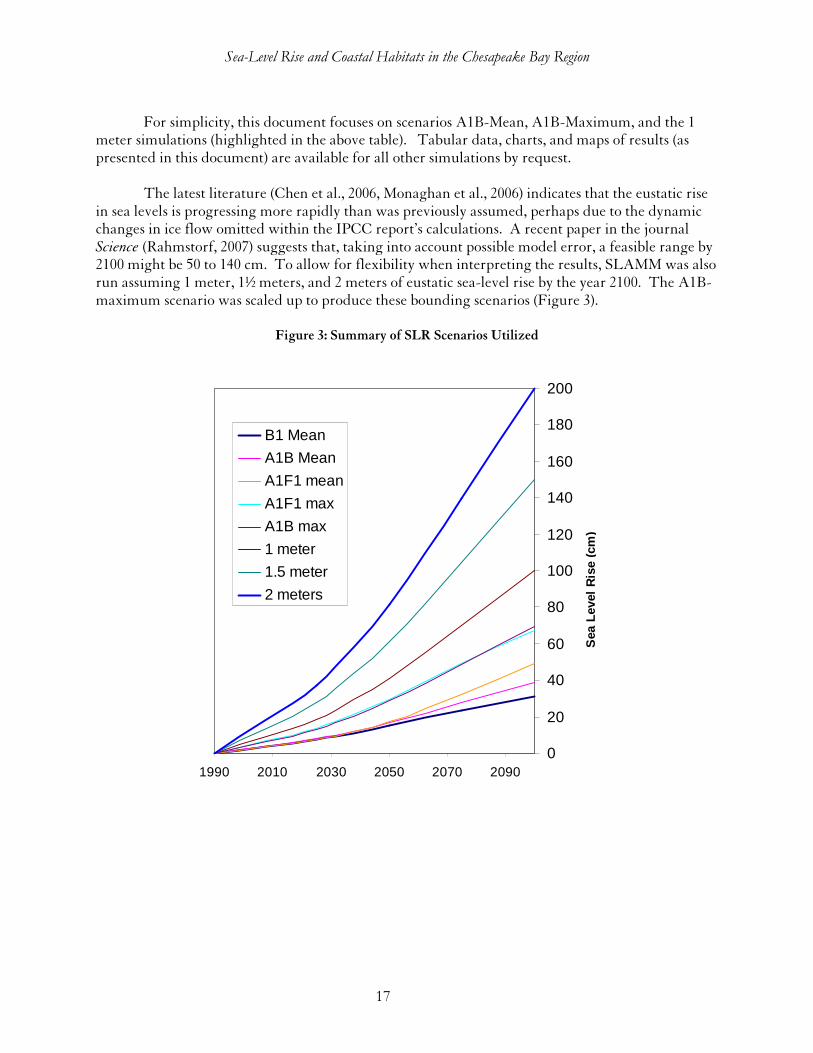
The latest literature (Chen et al., 2006, Monaghan et al., 2006) indicates that the eustatic rise in sea levels is progressing more rapidly than was previously assumed, perhaps due to the dynamic changes in ice flow omitted within the IPCC report’s calculations. A recent paper in the journal Science (Rahmstorf, 2007) suggests that, taking into account possible model error, a feasible range by 2100 might be 50 to 140 cm. To allow for flexibility when interpreting the results, SLAMM was also run assuming 1 meter, 1½ meters, and 2 meters of eustatic sea-level rise by the year 2100. The A1B- maximum scenario was scaled up to produce these bounding scenarios (Figure 3).
Figure 3: Summary of SLR Scenarios Utilized
0
20
40
60
80
100
120
140
160
180
200
1990 2010 2030 2050 2070 2090
Sea
Lev
el R
ise
(cm
)
B1 Mean
A1B Mean
A1F1 mean
A1F1 max
A1B max
1 meter
1.5 meter
2 meters
Sea-Level Rise and Coastal Habitats in the Chesapeake Bay Region
18
Results for each study site are based on relative sea-level rise for the given region, taking into consideration site-specific changes in land elevation due to factors such as land subsidence and marsh accretion, which can vary considerably. These factors are described in greater detail in the Model Parameterization section of this report. For this analysis we used a simplifying assumption that the localized rates of subsidence and accretion are linear (do not change) over time. However, this may or not be the case in actuality. Over time, both accretion and subsidence rates may change for a number of reasons, such as changes in vegetation types, sedimentation and erosion rates, and groundwater withdrawals. Ongoing monitoring and area-specific studies will be necessary to determine how different habitats ultimately respond to sea-level rise across the region. Nevertheless, this study provides a useful snapshot of the potential impacts, which will help inform critical on-the-ground coastal restoration and management decisions in the near term.
Model Results
Entire Study Area
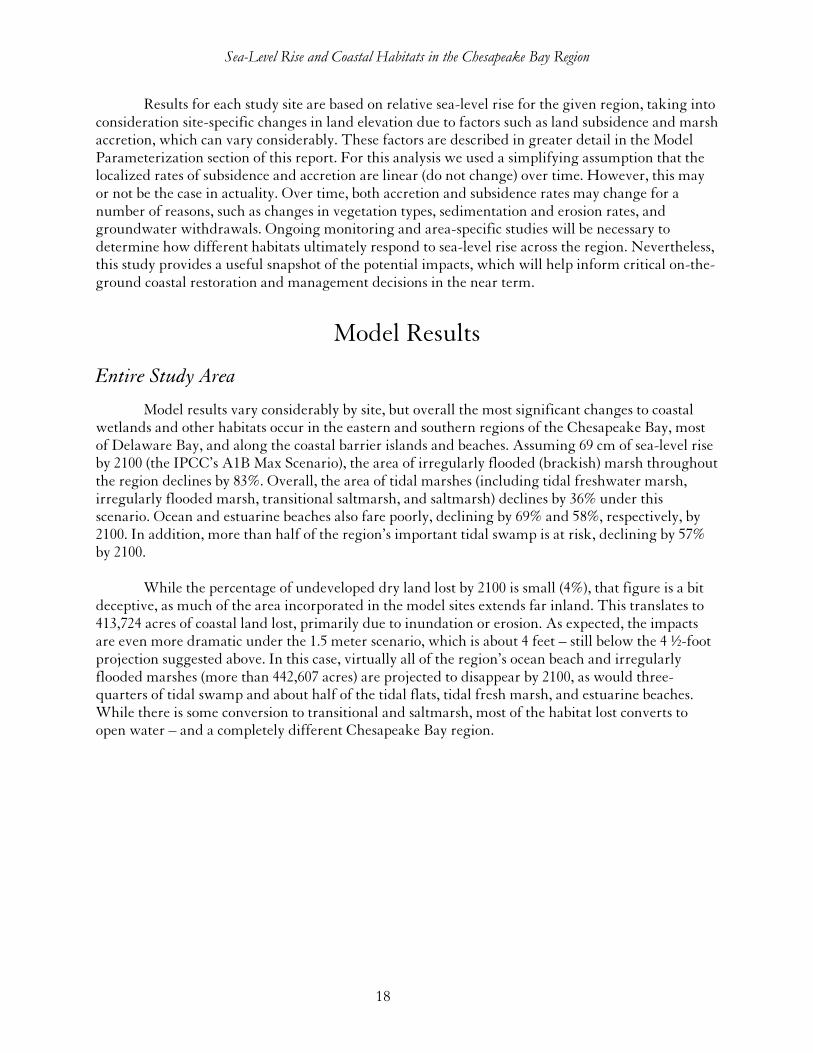
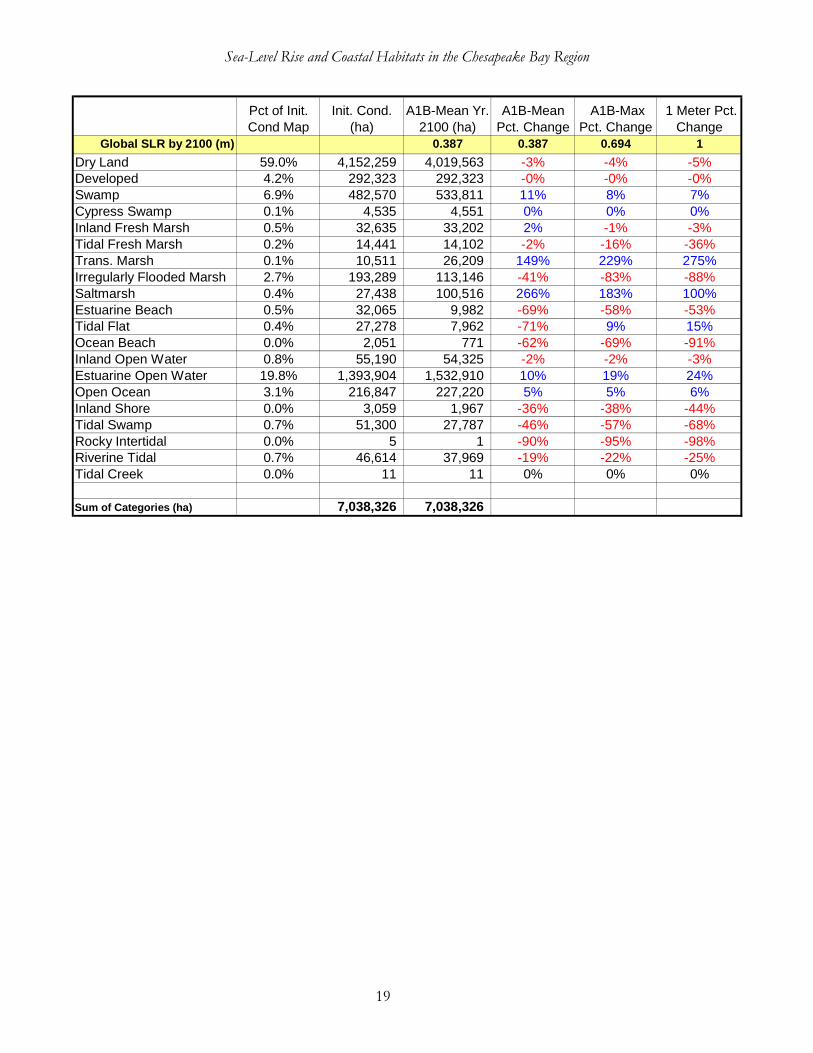
Model results vary considerably by site, but overall the most significant changes to coastal wetlands and other habitats occur in the eastern and southern regions of the Chesapeake Bay, most of Delaware Bay, and along the coastal barrier islands and beaches. Assuming 69 cm of sea-level rise by 2100 (the IPCC’s A1B Max Scenario), the area of irregularly flooded (brackish) marsh throughout the region declines by 83%. Overall, the area of tidal marshes (including tidal freshwater marsh, irregularly flooded marsh, transitional saltmarsh, and saltmarsh) declines by 36% under this scenario. Ocean and estuarine beaches also fare poorly, declining by 69% and 58%, respectively, by 2100. In addition, more than half of the region’s important tidal swamp is at risk, declining by 57% by 2100.
While the percentage of undeveloped dry land lost by 2100 is small (4%), that figure is a bit
deceptive, as much of the area incorporated in the model sites extends far inland. This translates to 413,724 acres of coastal land lost, primarily due to inundation or erosion. As expected, the impacts are even more dramatic under the 1.5 meter scenario, which is about 4 feet – still below the 4 ½-foot projection suggested above. In this case, virtually all of the region’s ocean beach and irregularly flooded marshes (more than 442,607 acres) are projected to disappear by 2100, as would three-quarters of tidal swamp and about half of the tidal flats, tidal fresh marsh, and estuarine beaches. While there is some conversion to transitional and saltmarsh, most of the habitat lost converts to open water – and a completely different Chesapeake Bay region.
Sea-Level Rise and Coastal Habitats in the Chesapeake Bay Region
19
Pct of Init. Cond Map
Init. Cond. (ha)
A1B-Mean Yr. 2100 (ha)
A1B-Mean Pct. Change
A1B-Max Pct. Change
1 Meter Pct. Change
Global SLR by 2100 (m) 0.387 0.387 0.694 1
Dry Land 59.0% 4,152,259 4,019,563 -3% -4% -5%Developed 4.2% 292,323 292,323 -0% -0% -0%Swamp 6.9% 482,570 533,811 11% 8% 7%Cypress Swamp 0.1% 4,535 4,551 0% 0% 0%Inland Fresh Marsh 0.5% 32,635 33,202 2% -1% -3%Tidal Fresh Marsh 0.2% 14,441 14,102 -2% -16% -36%Trans. Marsh 0.1% 10,511 26,209 149% 229% 275%Irregularly Flooded Marsh 2.7% 193,289 113,146 -41% -83% -88%Saltmarsh 0.4% 27,438 100,516 266% 183% 100%Estuarine Beach 0.5% 32,065 9,982 -69% -58% -53%Tidal Flat 0.4% 27,278 7,962 -71% 9% 15%Ocean Beach 0.0% 2,051 771 -62% -69% -91%Inland Open Water 0.8% 55,190 54,325 -2% -2% -3%Estuarine Open Water 19.8% 1,393,904 1,532,910 10% 19% 24%Open Ocean 3.1% 216,847 227,220 5% 5% 6%Inland Shore 0.0% 3,059 1,967 -36% -38% -44%Tidal Swamp 0.7% 51,300 27,787 -46% -57% -68%Rocky Intertidal 0.0% 5 1 -90% -95% -98%Riverine Tidal 0.7% 46,614 37,969 -19% -22% -25%Tidal Creek 0.0% 11 11 0% 0% 0%
Sum of Categories (ha) 7,038,326 7,038,326
Sea-Level Rise and Coastal Habitats in the Chesapeake Bay Region
20
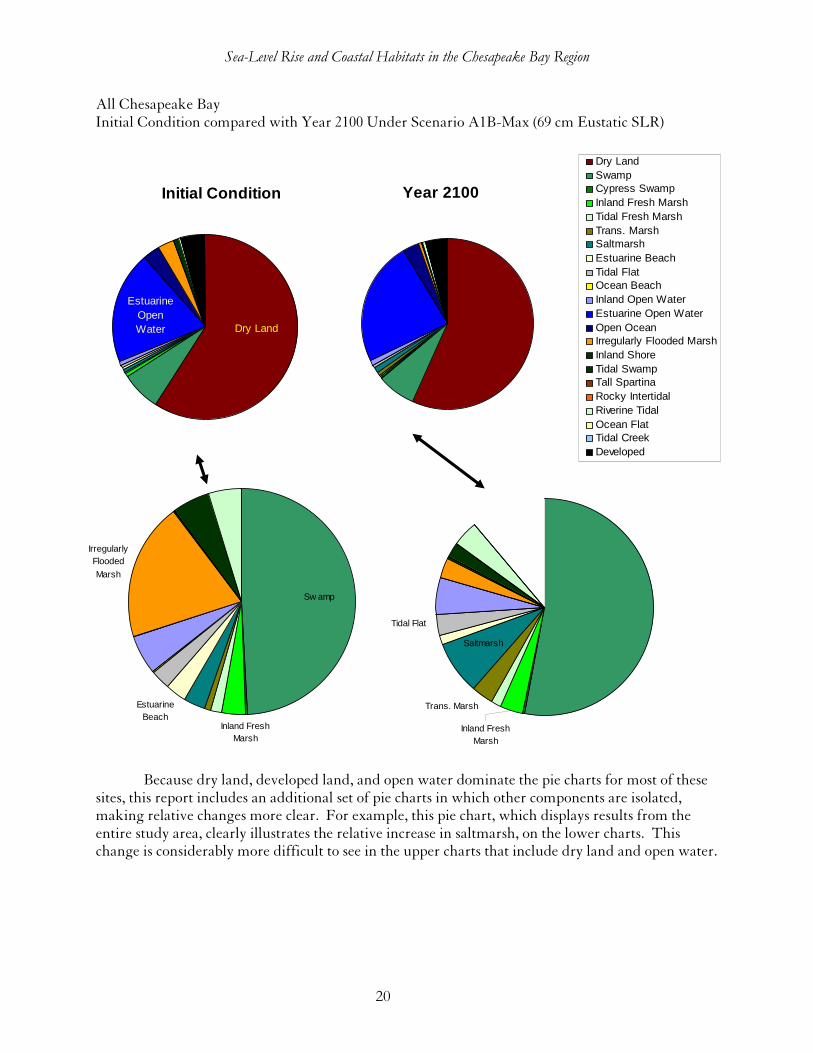
All Chesapeake Bay Initial Condition compared with Year 2100 Under Scenario A1B-Max (69 cm Eustatic SLR)
Initial Condition
Estuarine Open Water Dry Land
Year 2100
Dry LandSwampCypress SwampInland Fresh MarshTidal Fresh MarshTrans. MarshSaltmarshEstuarine BeachTidal FlatOcean BeachInland Open WaterEstuarine Open WaterOpen Ocean Irregularly Flooded MarshInland ShoreTidal SwampTall SpartinaRocky IntertidalRiverine TidalOcean FlatTidal CreekDeveloped
Saltmarsh
Trans. Marsh
Inland Fresh Marsh
Tidal Flat
Irregularly Flooded
Marsh
Inland Fresh Marsh
Sw amp
Estuarine Beach
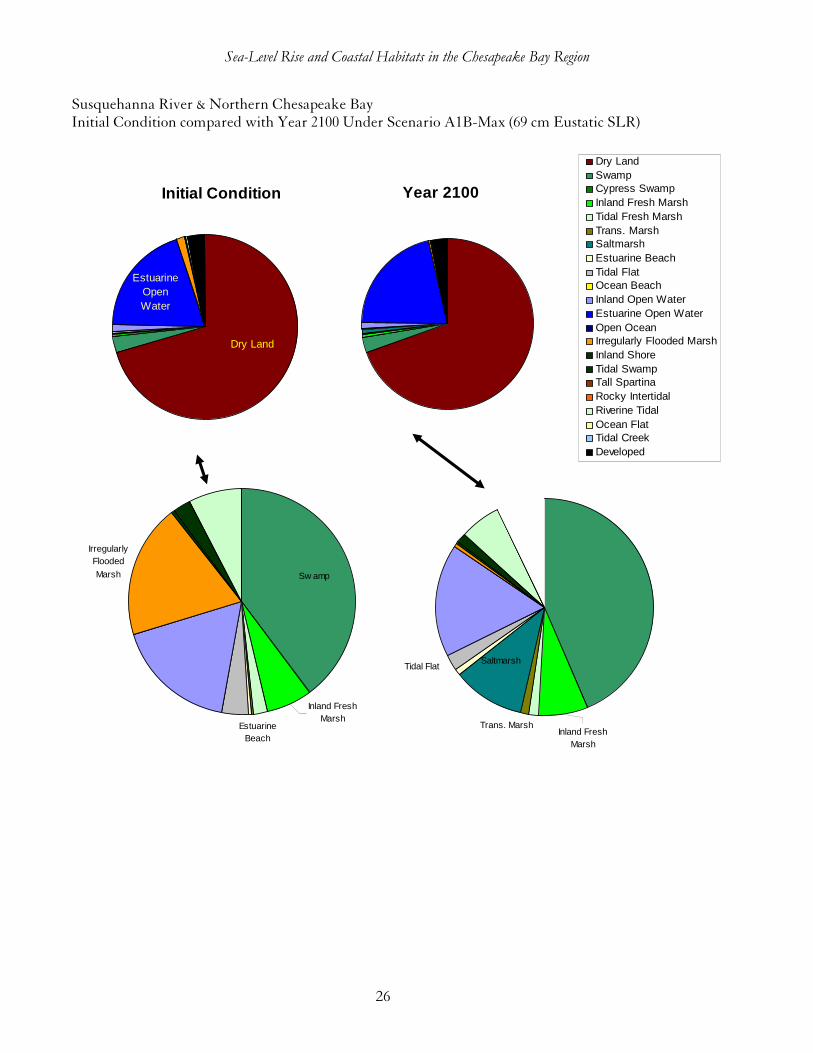
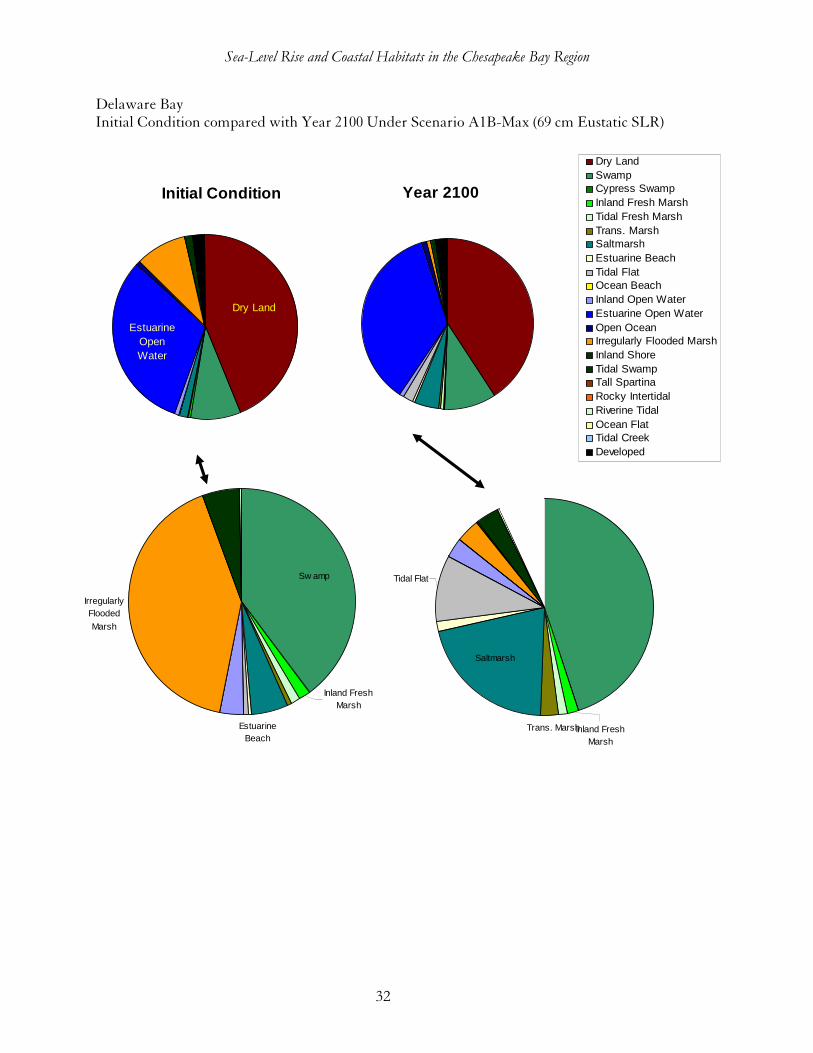
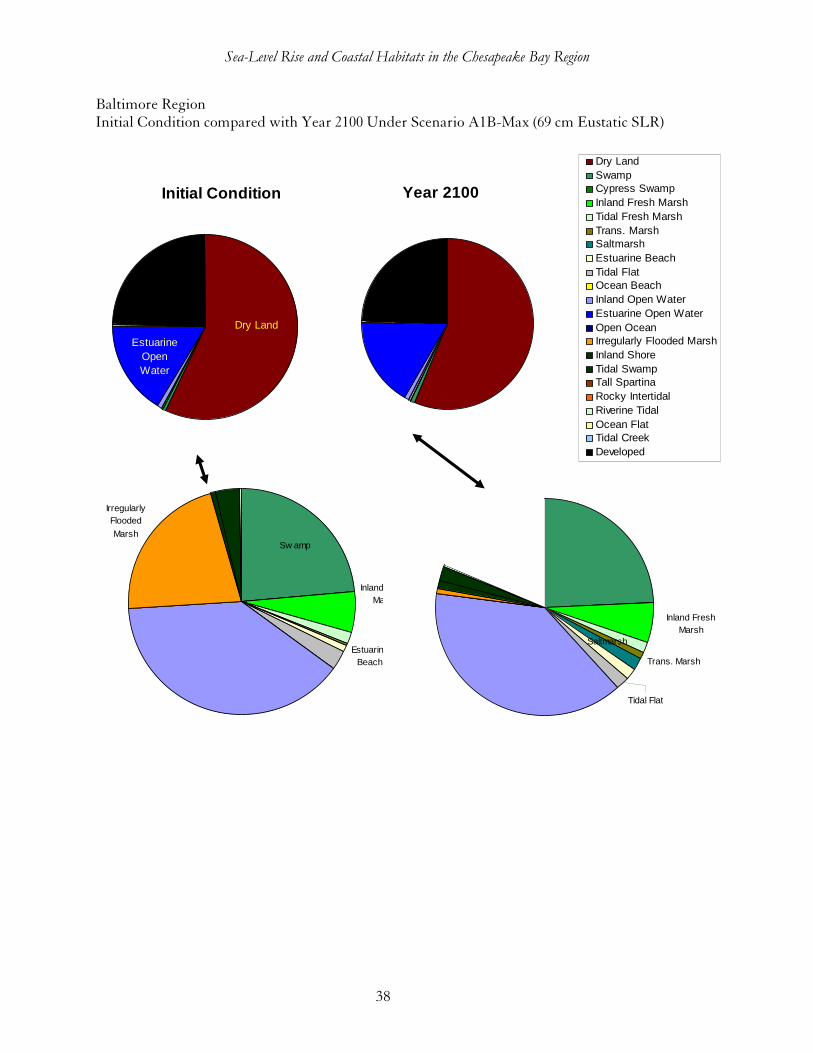
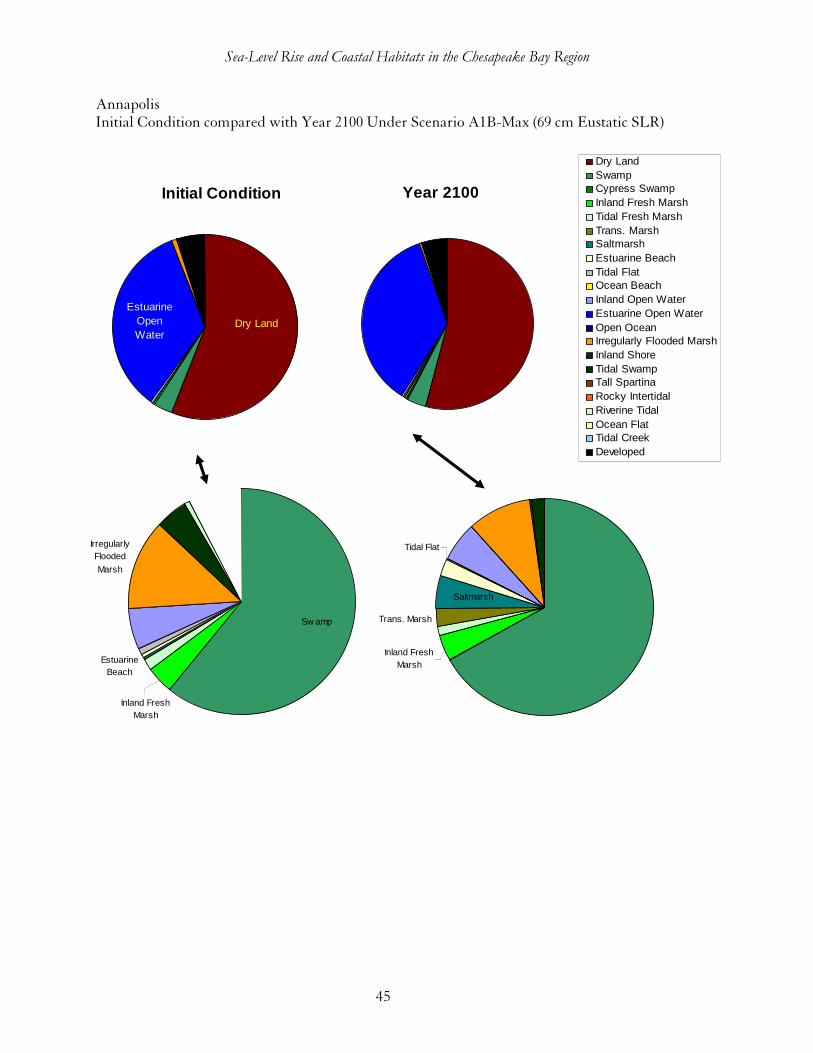
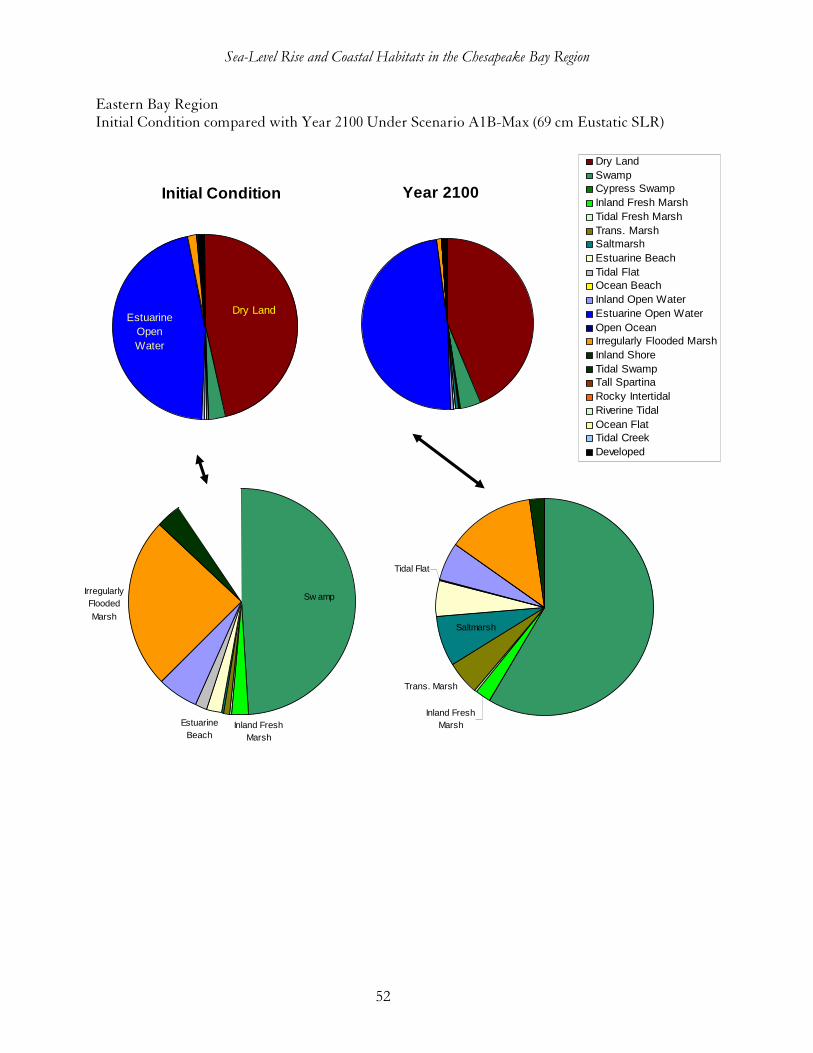
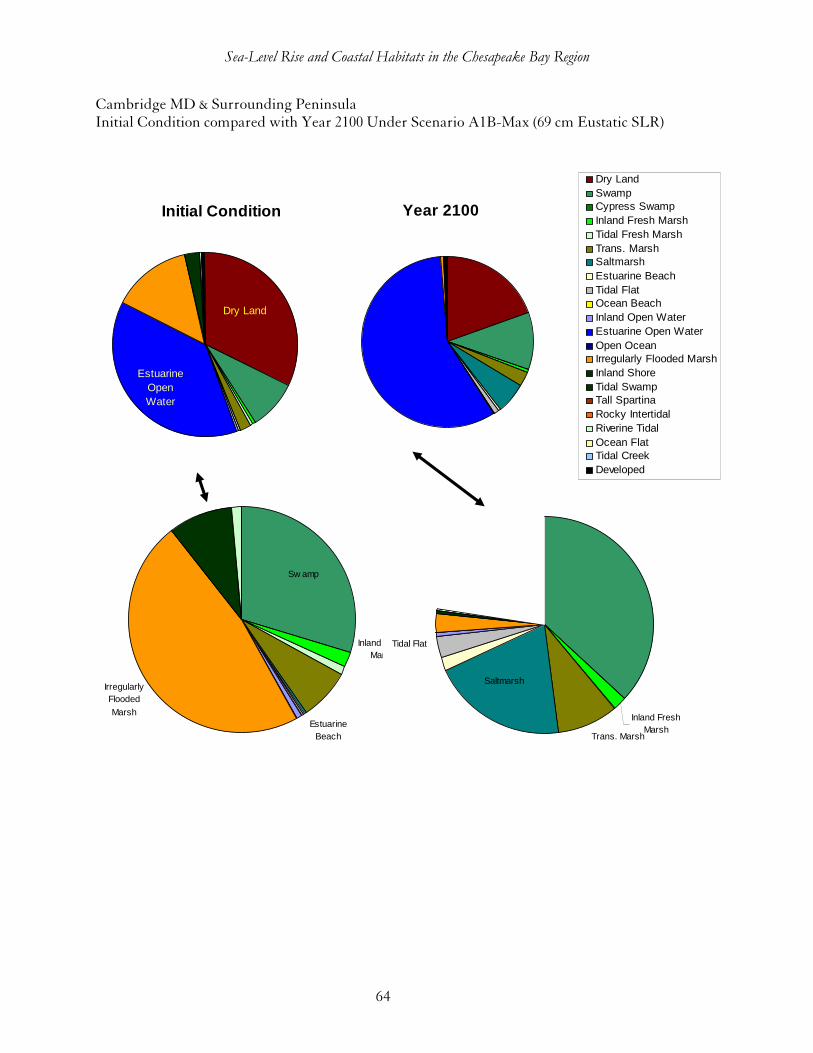
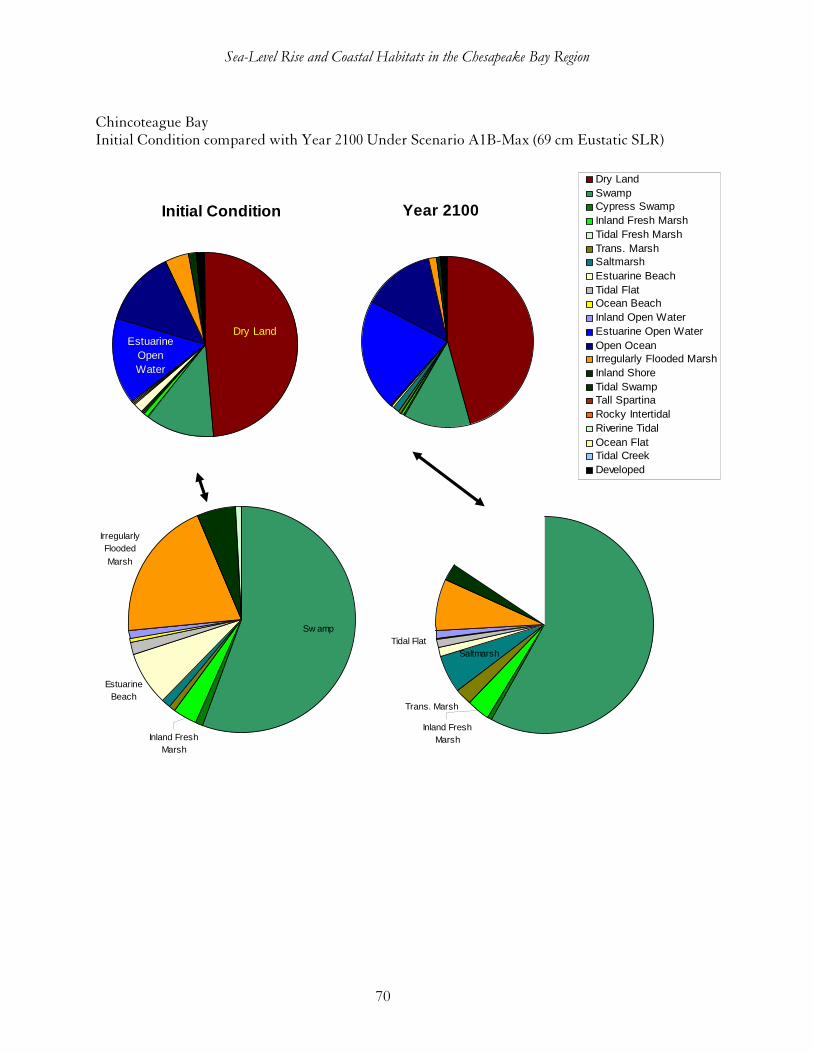
Because dry land, developed land, and open water dominate the pie charts for most of these sites, this report includes an additional set of pie charts in which other components are isolated, making relative changes more clear. For example, this pie chart, which displays results from the entire study area, clearly illustrates the relative increase in saltmarsh, on the lower charts. This change is considerably more difficult to see in the upper charts that include dry land and open water.
Sea-Level Rise and Coastal Habitats in the Chesapeake Bay Region
21
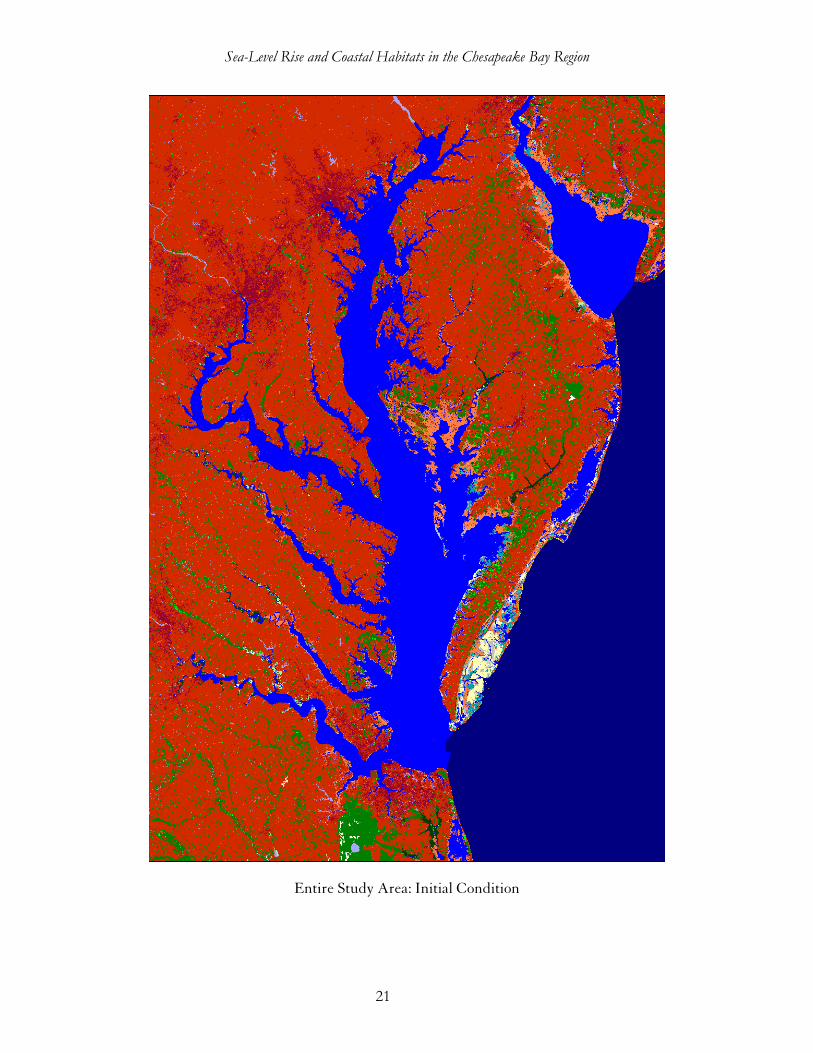
Entire Study Area: Initial Condition
Sea-Level Rise and Coastal Habitats in the Chesapeake Bay Region
22
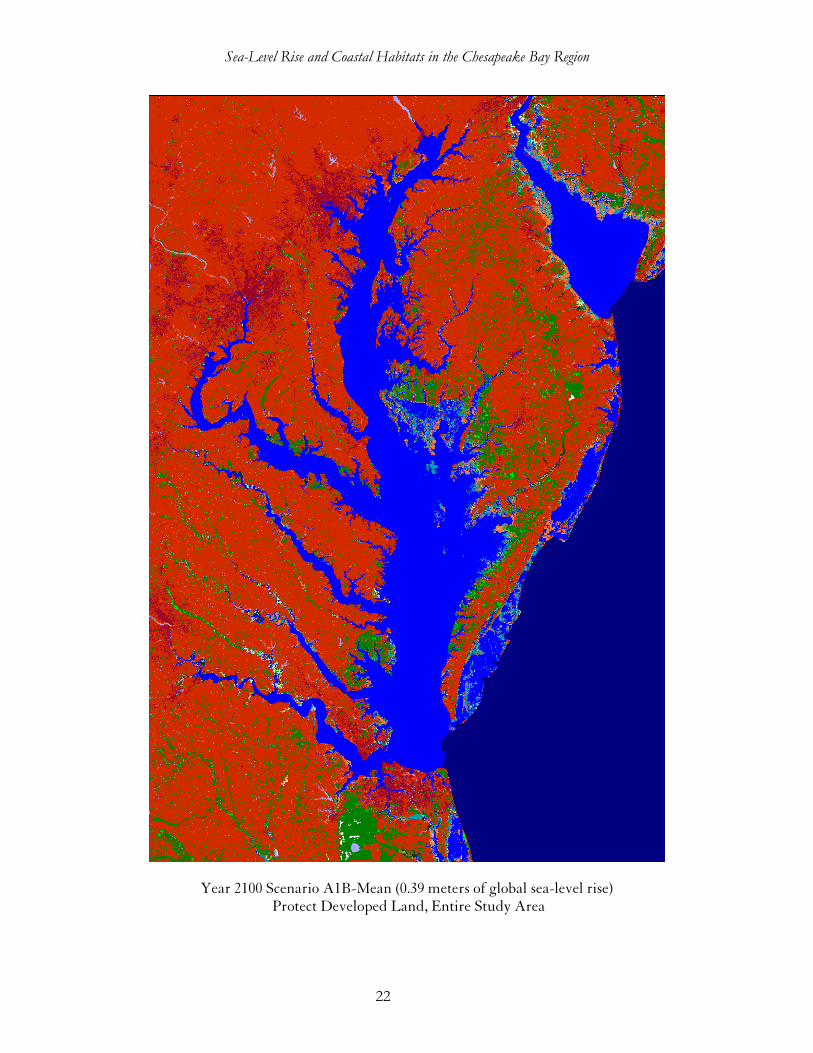
Year 2100 Scenario A1B-Mean (0.39 meters of global sea-level rise) Protect Developed Land, Entire Study Area
Sea-Level Rise and Coastal Habitats in the Chesapeake Bay Region
23
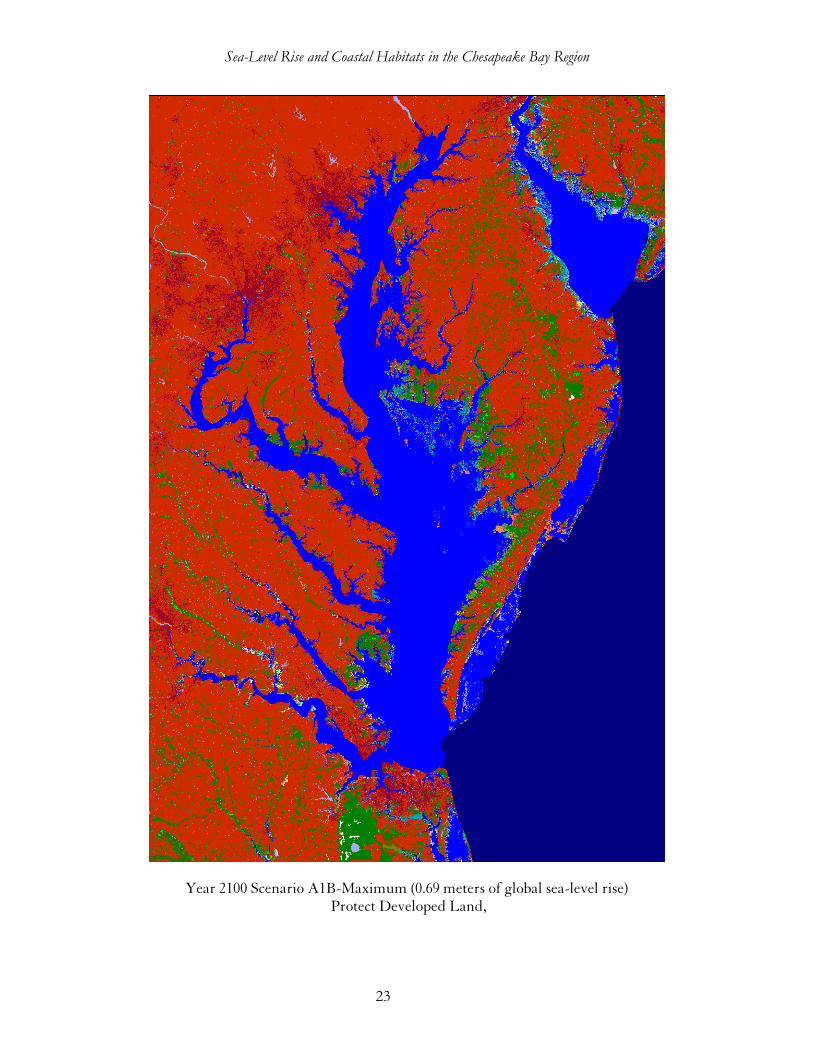
Year 2100 Scenario A1B-Maximum (0.69 meters of global sea-level rise) Protect Developed Land,

Sea-Level Rise and Coastal Habitats in the Chesapeake Bay Region
24
Year 2100, 1 meter of global sea-level rise, Protect Developed Land,
Sea-Level Rise and Coastal Habitats in the Chesapeake Bay Region
25
Site 1: Susquehanna River & Northern Chesapeake Bay
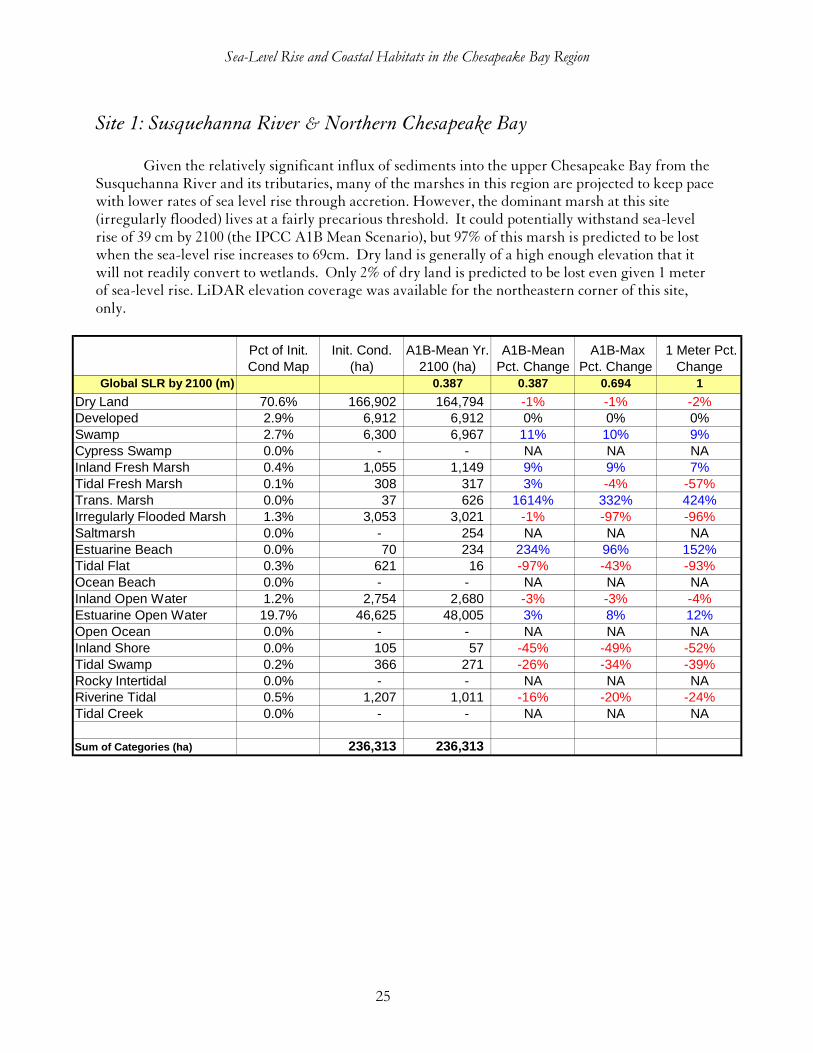
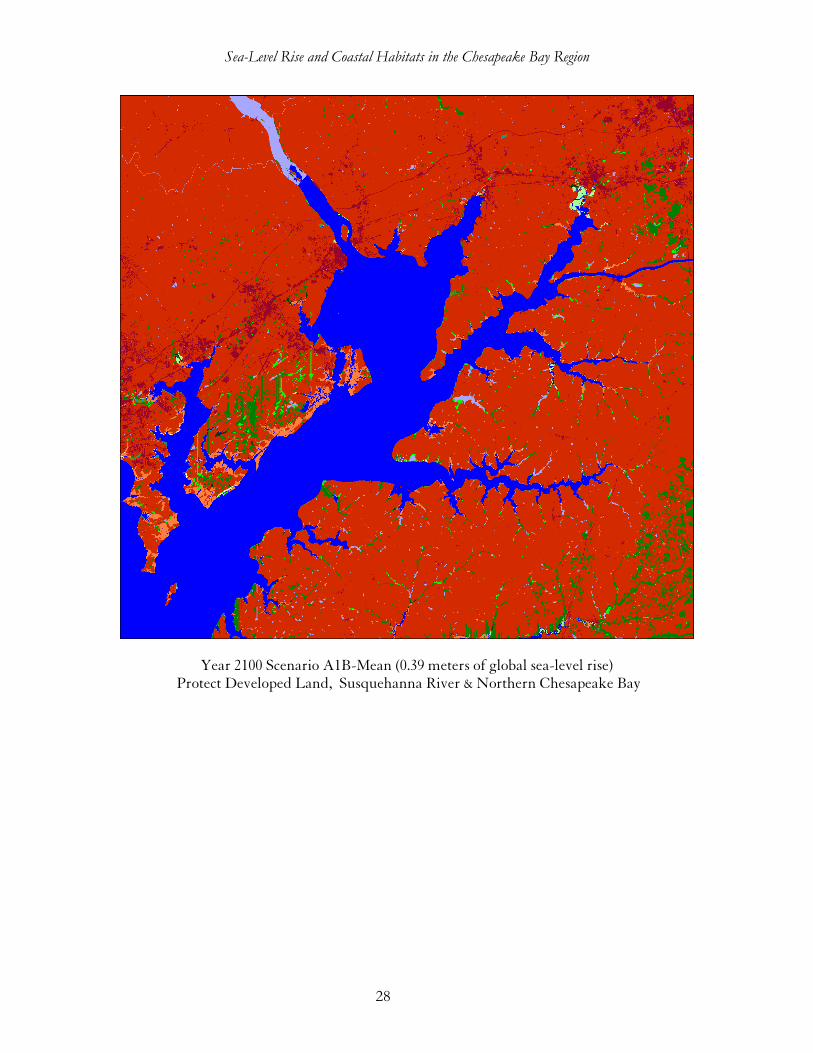
Given the relatively significant influx of sediments into the upper Chesapeake Bay from the Susquehanna River and its tributaries, many of the marshes in this region are projected to keep pace with lower rates of sea level rise through accretion. However, the dominant marsh at this site (irregularly flooded) lives at a fairly precarious threshold. It could potentially withstand sea-level rise of 39 cm by 2100 (the IPCC A1B Mean Scenario), but 97% of this marsh is predicted to be lost when the sea-level rise increases to 69cm. Dry land is generally of a high enough elevation that it will not readily convert to wetlands. Only 2% of dry land is predicted to be lost even given 1 meter of sea-level rise. LiDAR elevation coverage was available for the northeastern corner of this site, only.
Pct of Init. Cond Map
Init. Cond. (ha)
A1B-Mean Yr. 2100 (ha)
A1B-Mean Pct. Change
A1B-Max Pct. Change
1 Meter Pct. Change
Global SLR by 2100 (m) 0.387 0.387 0.694 1
Dry Land 70.6% 166,902 164,794 -1% -1% -2%Developed 2.9% 6,912 6,912 0% 0% 0%Swamp 2.7% 6,300 6,967 11% 10% 9%Cypress Swamp 0.0% - - NA NA NAInland Fresh Marsh 0.4% 1,055 1,149 9% 9% 7%Tidal Fresh Marsh 0.1% 308 317 3% -4% -57%Trans. Marsh 0.0% 37 626 1614% 332% 424%Irregularly Flooded Marsh 1.3% 3,053 3,021 -1% -97% -96%Saltmarsh 0.0% - 254 NA NA NAEstuarine Beach 0.0% 70 234 234% 96% 152%Tidal Flat 0.3% 621 16 -97% -43% -93%Ocean Beach 0.0% - - NA NA NAInland Open Water 1.2% 2,754 2,680 -3% -3% -4%Estuarine Open Water 19.7% 46,625 48,005 3% 8% 12%Open Ocean 0.0% - - NA NA NAInland Shore 0.0% 105 57 -45% -49% -52%Tidal Swamp 0.2% 366 271 -26% -34% -39%Rocky Intertidal 0.0% - - NA NA NARiverine Tidal 0.5% 1,207 1,011 -16% -20% -24%Tidal Creek 0.0% - - NA NA NA
Sum of Categories (ha) 236,313 236,313
Sea-Level Rise and Coastal Habitats in the Chesapeake Bay Region
26
Susquehanna River & Northern Chesapeake Bay Initial Condition compared with Year 2100 Under Scenario A1B-Max (69 cm Eustatic SLR)
Initial Condition
Estuarine Open Water
Dry Land
Year 2100
Dry LandSwampCypress SwampInland Fresh MarshTidal Fresh MarshTrans. MarshSaltmarshEstuarine BeachTidal FlatOcean BeachInland Open WaterEstuarine Open WaterOpen Ocean Irregularly Flooded MarshInland ShoreTidal SwampTall SpartinaRocky IntertidalRiverine TidalOcean FlatTidal CreekDeveloped
Saltmarsh
Trans. MarshInland Fresh
Marsh
Tidal Flat
Irregularly Flooded
Marsh
Inland Fresh Marsh
Sw amp
Estuarine Beach

Sea-Level Rise and Coastal Habitats in the Chesapeake Bay Region
27
Initial Condition Susquehanna River & Northern Chesapeake Bay
Sea-Level Rise and Coastal Habitats in the Chesapeake Bay Region
28
Year 2100 Scenario A1B-Mean (0.39 meters of global sea-level rise) Protect Developed Land, Susquehanna River & Northern Chesapeake Bay
Sea-Level Rise and Coastal Habitats in the Chesapeake Bay Region
29
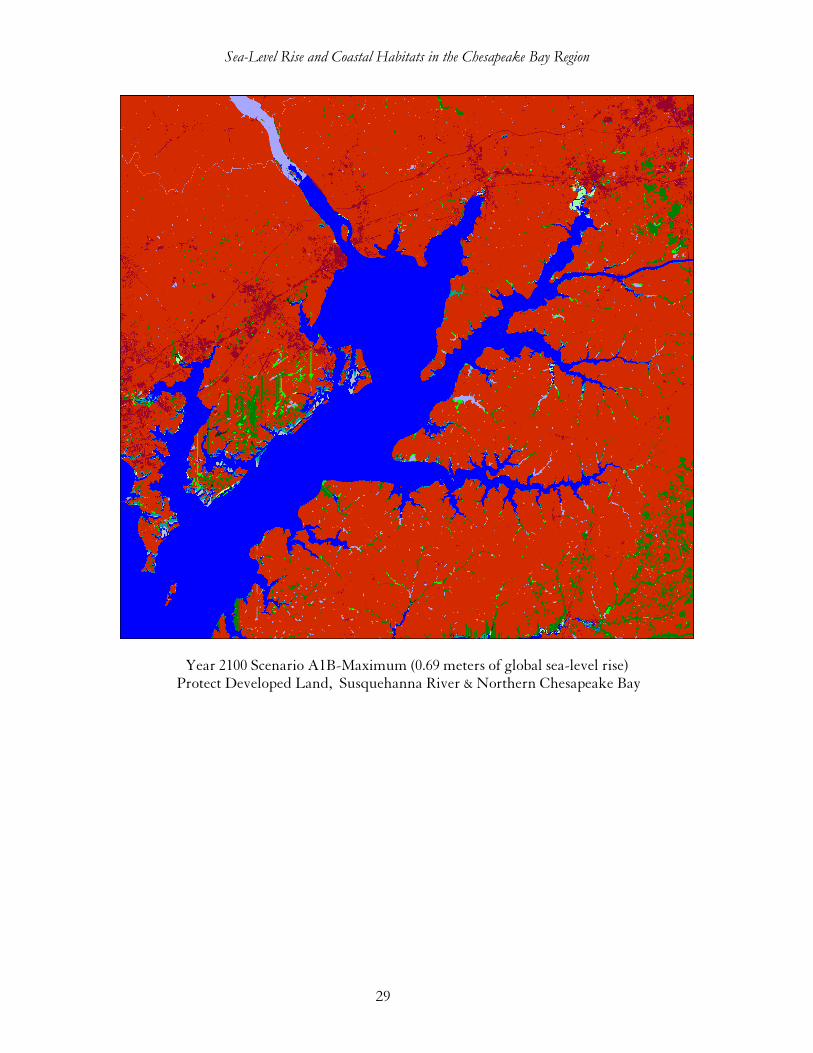
Year 2100 Scenario A1B-Maximum (0.69 meters of global sea-level rise) Protect Developed Land, Susquehanna River & Northern Chesapeake Bay
Sea-Level Rise and Coastal Habitats in the Chesapeake Bay Region
30
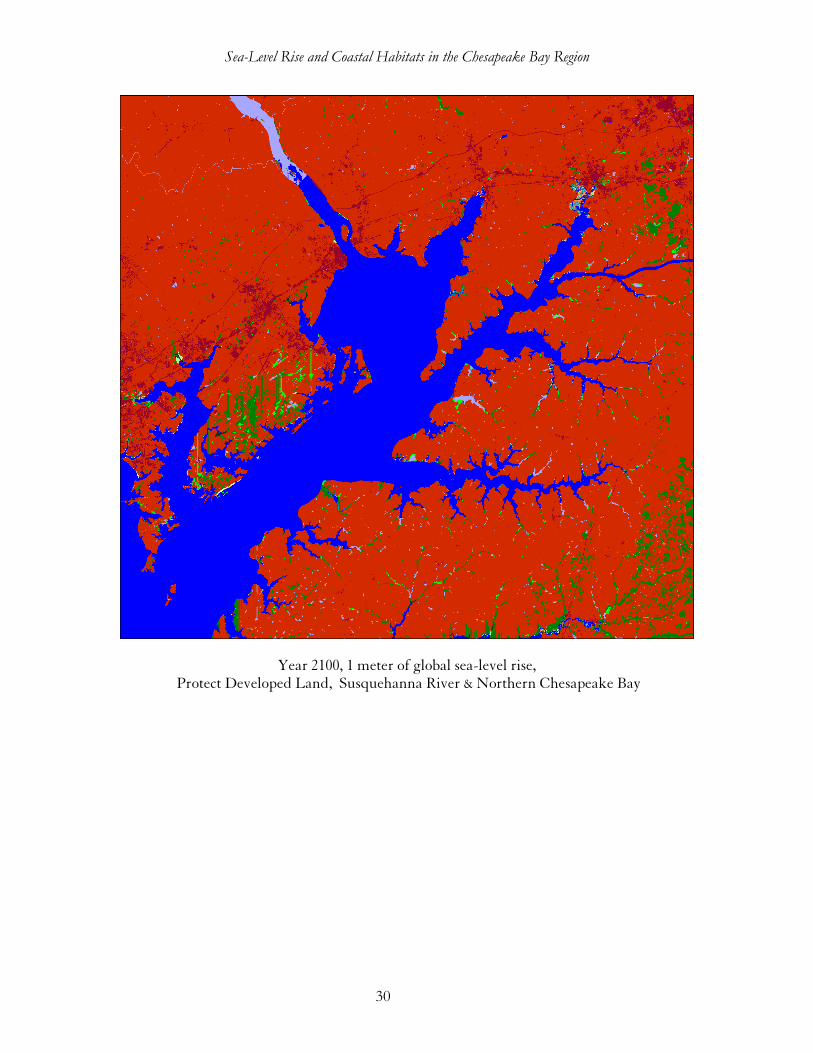
Year 2100, 1 meter of global sea-level rise, Protect Developed Land, Susquehanna River & Northern Chesapeake Bay
Sea-Level Rise and Coastal Habitats in the Chesapeake Bay Region
31
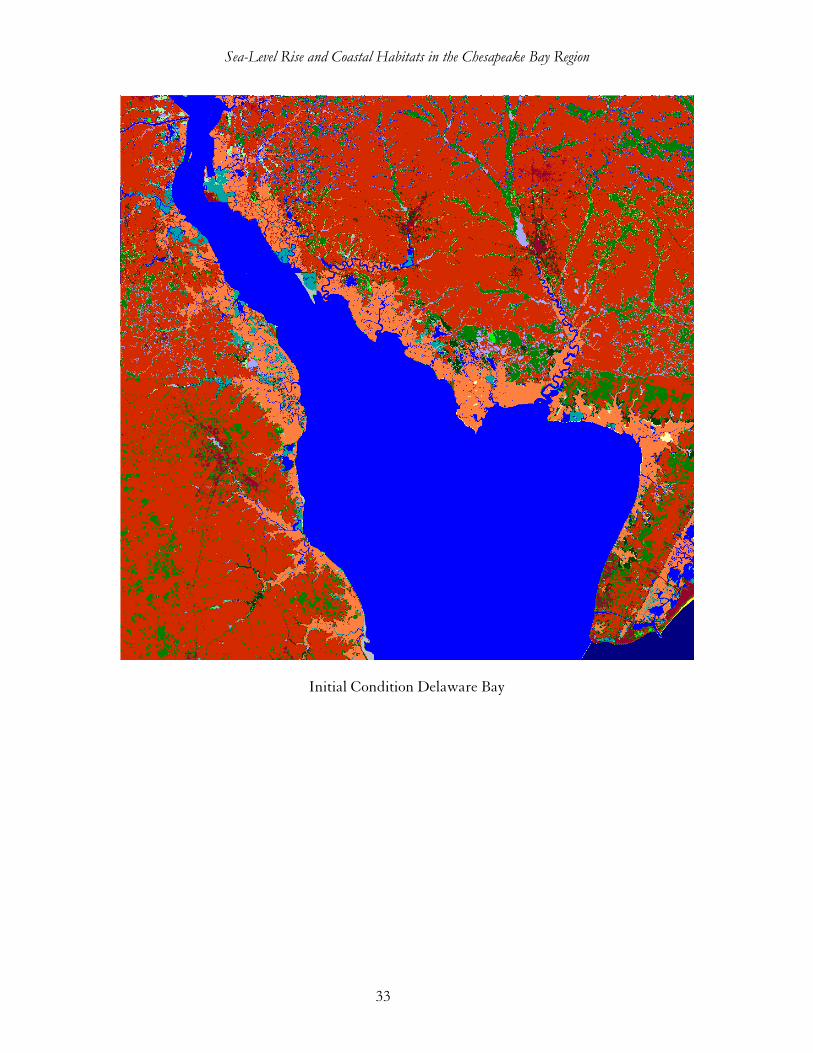
Site 2: Delaware Bay
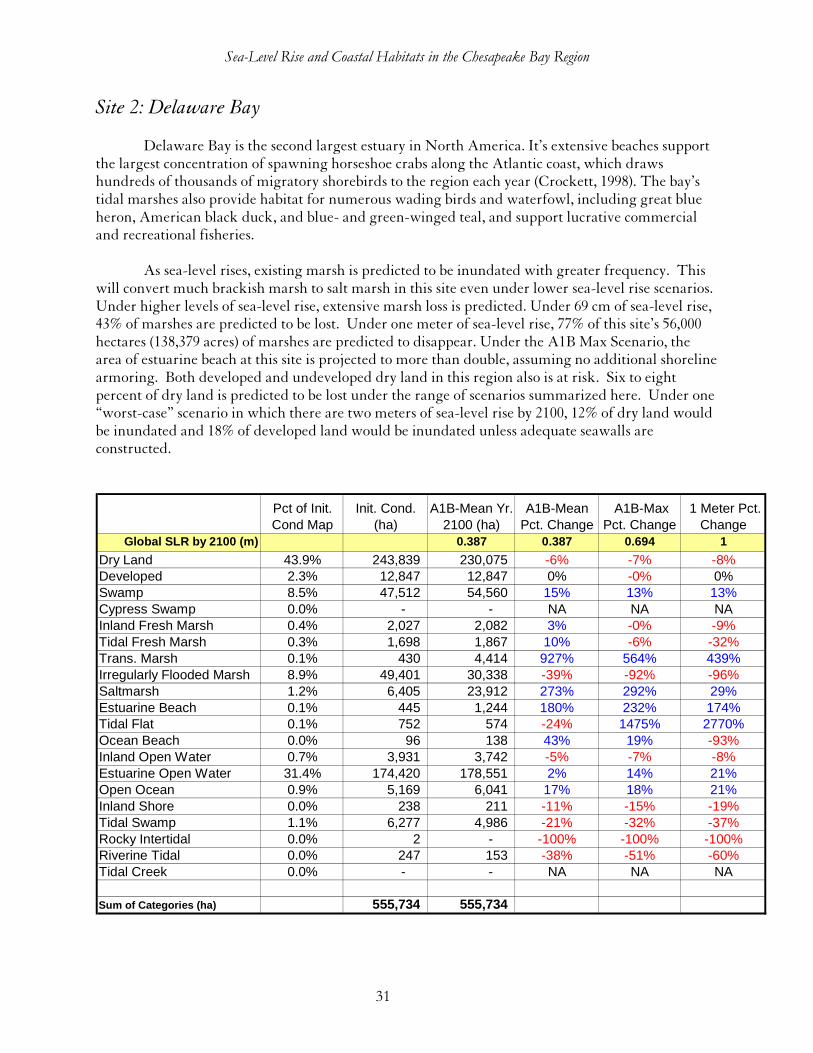
Delaware Bay is the second largest estuary in North America. It’s extensive beaches support the largest concentration of spawning horseshoe crabs along the Atlantic coast, which draws hundreds of thousands of migratory shorebirds to the region each year (Crockett, 1998). The bay’s tidal marshes also provide habitat for numerous wading birds and waterfowl, including great blue heron, American black duck, and blue- and green-winged teal, and support lucrative commercial and recreational fisheries.
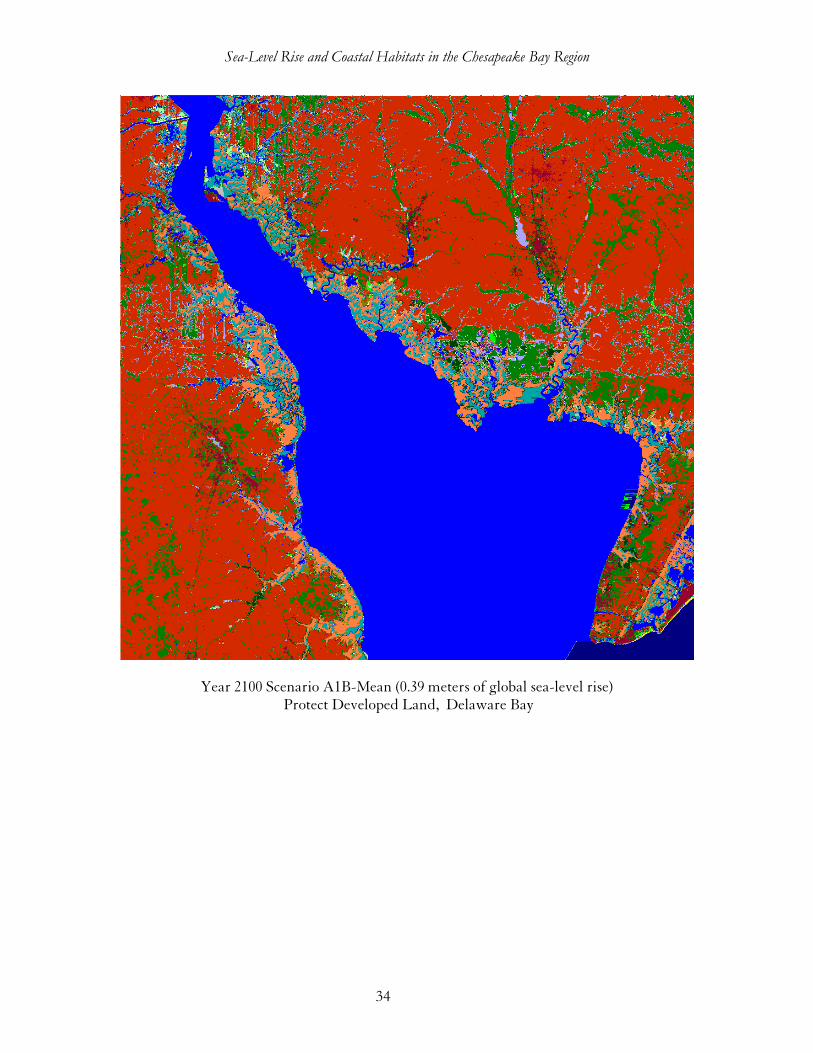
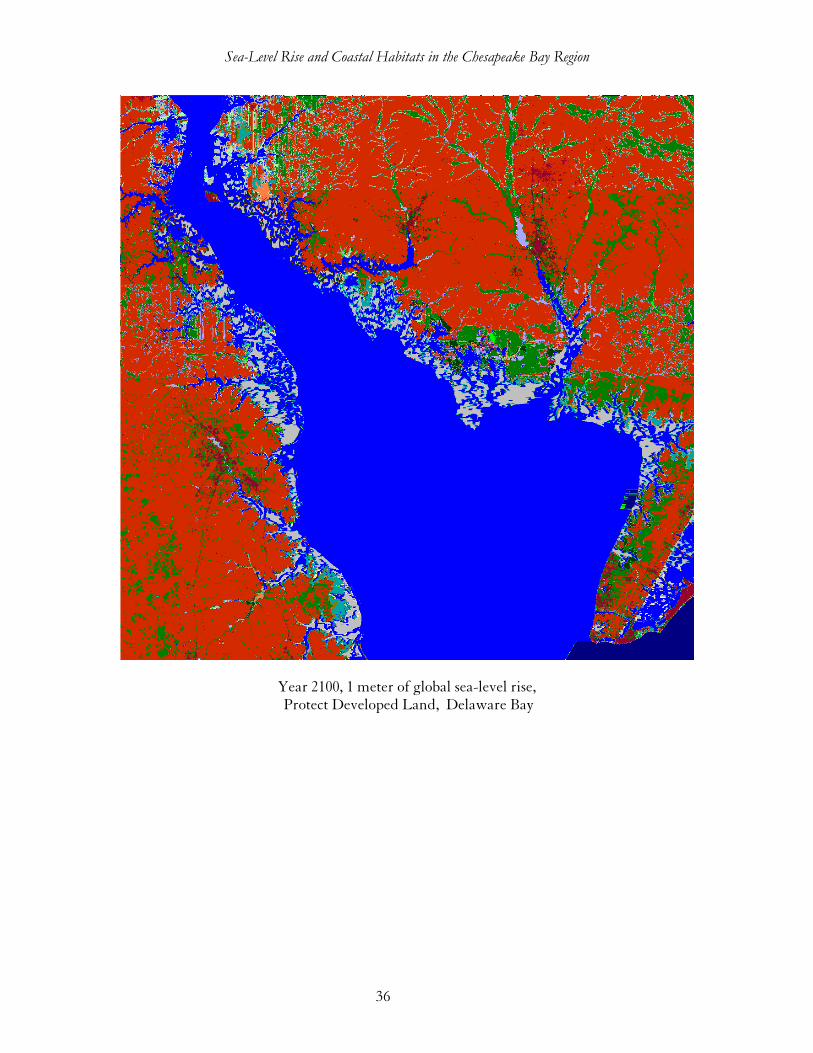
As sea-level rises, existing marsh is predicted to be inundated with greater frequency. This
will convert much brackish marsh to salt marsh in this site even under lower sea-level rise scenarios. Under higher levels of sea-level rise, extensive marsh loss is predicted. Under 69 cm of sea-level rise, 43% of marshes are predicted to be lost. Under one meter of sea-level rise, 77% of this site’s 56,000 hectares (138,379 acres) of marshes are predicted to disappear. Under the A1B Max Scenario, the area of estuarine beach at this site is projected to more than double, assuming no additional shoreline armoring. Both developed and undeveloped dry land in this region also is at risk. Six to eight percent of dry land is predicted to be lost under the range of scenarios summarized here. Under one “worst-case” scenario in which there are two meters of sea-level rise by 2100, 12% of dry land would be inundated and 18% of developed land would be inundated unless adequate seawalls are constructed.
Pct of Init. Cond Map
Init. Cond. (ha)
A1B-Mean Yr. 2100 (ha)
A1B-Mean Pct. Change
A1B-Max Pct. Change
1 Meter Pct. Change
Global SLR by 2100 (m) 0.387 0.387 0.694 1
Dry Land 43.9% 243,839 230,075 -6% -7% -8%Developed 2.3% 12,847 12,847 0% -0% 0%Swamp 8.5% 47,512 54,560 15% 13% 13%Cypress Swamp 0.0% - - NA NA NAInland Fresh Marsh 0.4% 2,027 2,082 3% -0% -9%Tidal Fresh Marsh 0.3% 1,698 1,867 10% -6% -32%Trans. Marsh 0.1% 430 4,414 927% 564% 439%Irregularly Flooded Marsh 8.9% 49,401 30,338 -39% -92% -96%Saltmarsh 1.2% 6,405 23,912 273% 292% 29%Estuarine Beach 0.1% 445 1,244 180% 232% 174%Tidal Flat 0.1% 752 574 -24% 1475% 2770%Ocean Beach 0.0% 96 138 43% 19% -93%Inland Open Water 0.7% 3,931 3,742 -5% -7% -8%Estuarine Open Water 31.4% 174,420 178,551 2% 14% 21%Open Ocean 0.9% 5,169 6,041 17% 18% 21%Inland Shore 0.0% 238 211 -11% -15% -19%Tidal Swamp 1.1% 6,277 4,986 -21% -32% -37%Rocky Intertidal 0.0% 2 - -100% -100% -100%Riverine Tidal 0.0% 247 153 -38% -51% -60%Tidal Creek 0.0% - - NA NA NA
Sum of Categories (ha) 555,734 555,734
Sea-Level Rise and Coastal Habitats in the Chesapeake Bay Region
32
Delaware Bay Initial Condition compared with Year 2100 Under Scenario A1B-Max (69 cm Eustatic SLR)
Initial Condition
Estuarine Open Water
Dry Land
Year 2100
Dry LandSwampCypress SwampInland Fresh MarshTidal Fresh MarshTrans. MarshSaltmarshEstuarine BeachTidal FlatOcean BeachInland Open WaterEstuarine Open WaterOpen Ocean Irregularly Flooded MarshInland ShoreTidal SwampTall SpartinaRocky IntertidalRiverine TidalOcean FlatTidal CreekDeveloped
Saltmarsh
Trans. MarshInland Fresh Marsh
Tidal Flat
Irregularly Flooded
Marsh
Inland Fresh Marsh
Sw amp
Estuarine Beach
Sea-Level Rise and Coastal Habitats in the Chesapeake Bay Region
33
Initial Condition Delaware Bay
Sea-Level Rise and Coastal Habitats in the Chesapeake Bay Region
34
Year 2100 Scenario A1B-Mean (0.39 meters of global sea-level rise) Protect Developed Land, Delaware Bay

Sea-Level Rise and Coastal Habitats in the Chesapeake Bay Region
35
Year 2100 Scenario A1B-Maximum (0.69 meters of global sea-level rise) Protect Developed Land, Delaware Bay
Sea-Level Rise and Coastal Habitats in the Chesapeake Bay Region
36
Year 2100, 1 meter of global sea-level rise, Protect Developed Land, Delaware Bay
Sea-Level Rise and Coastal Habitats in the Chesapeake Bay Region
37
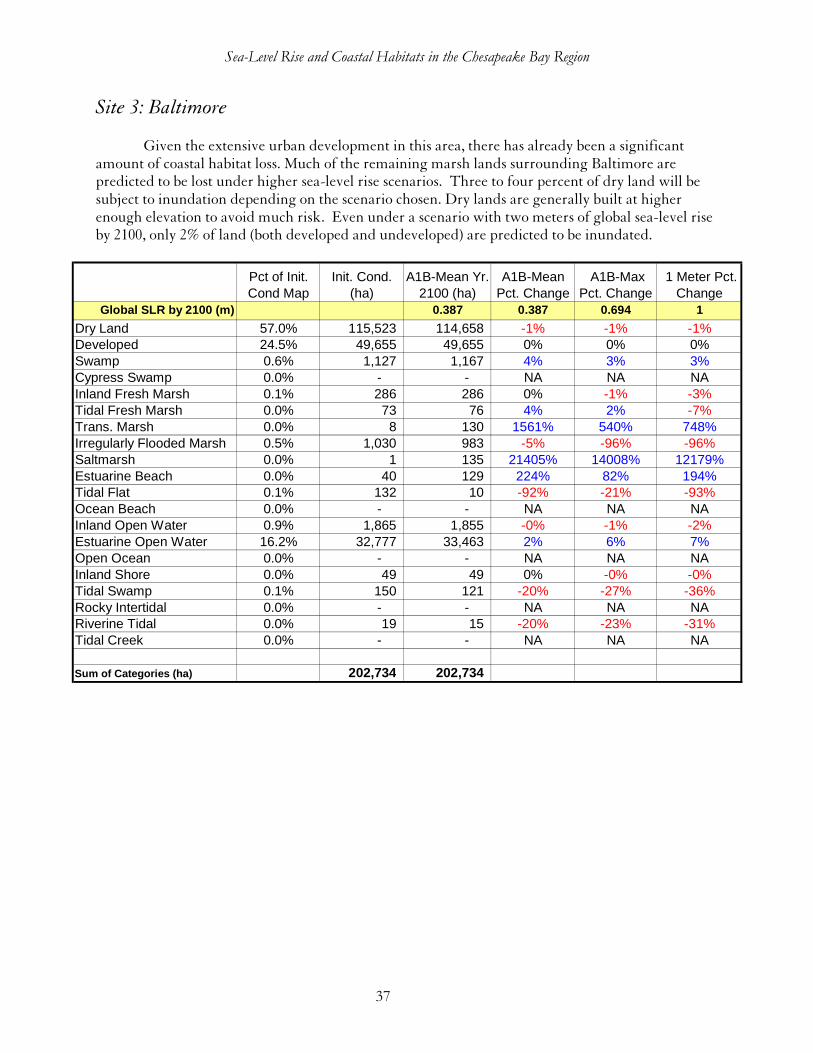
Site 3: Baltimore
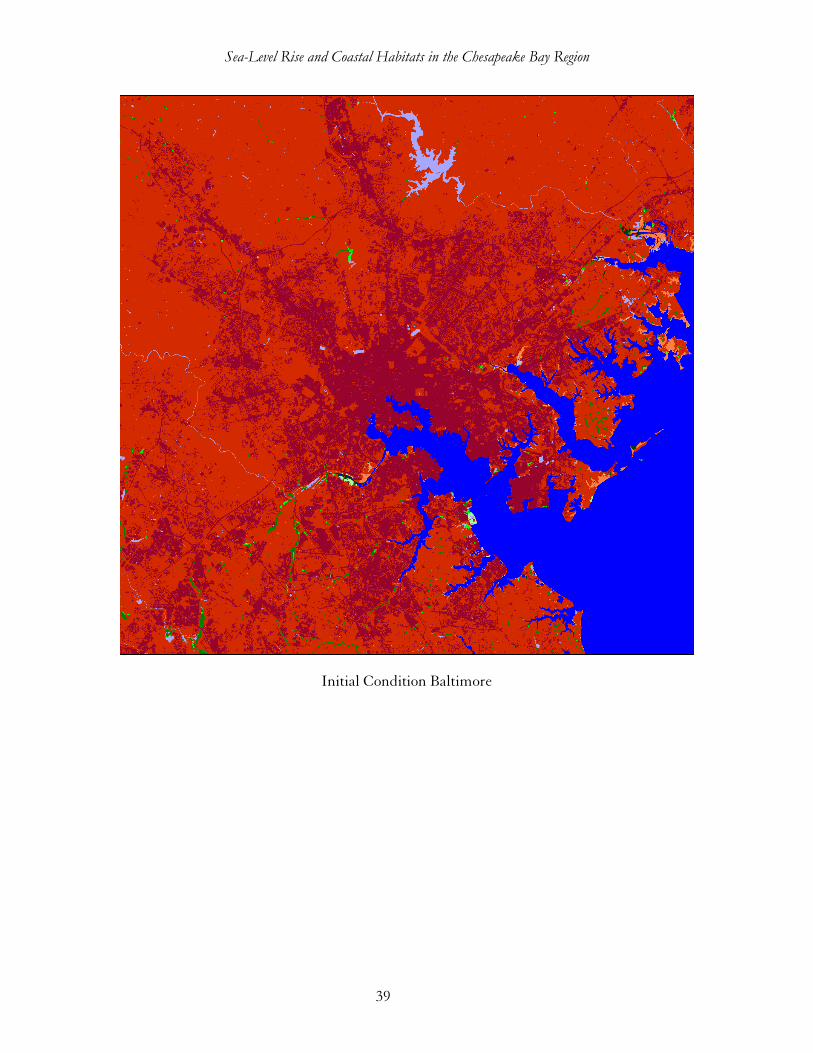
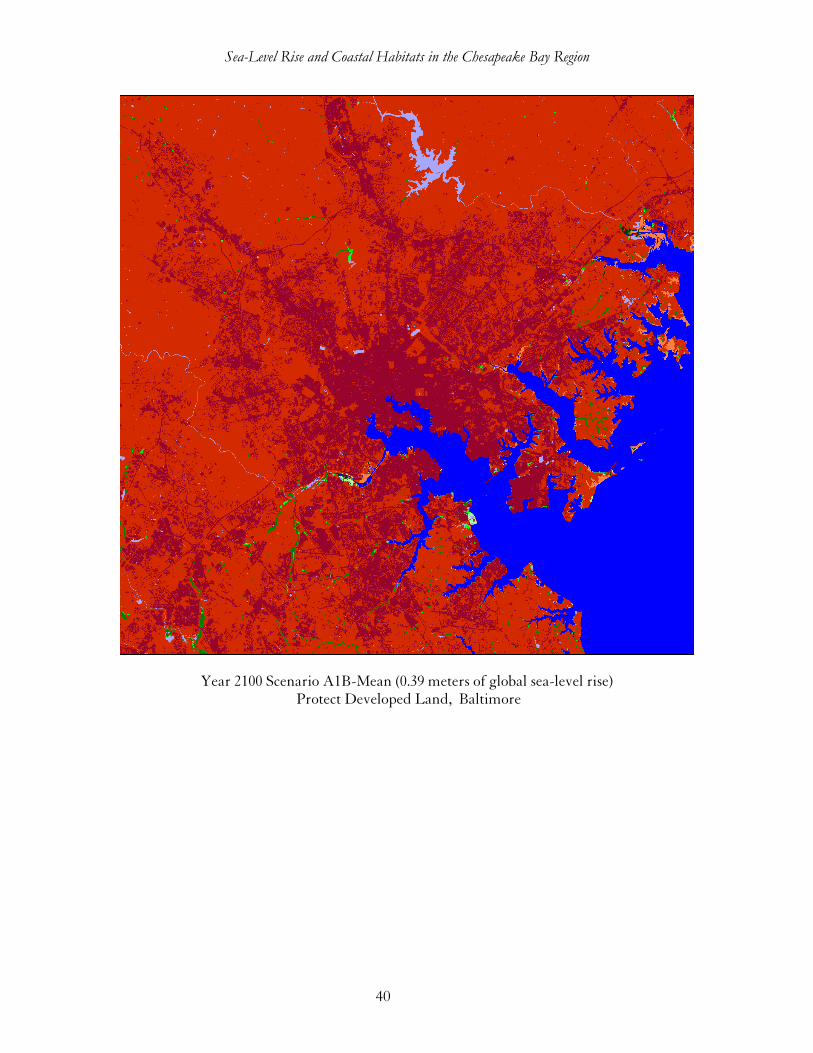
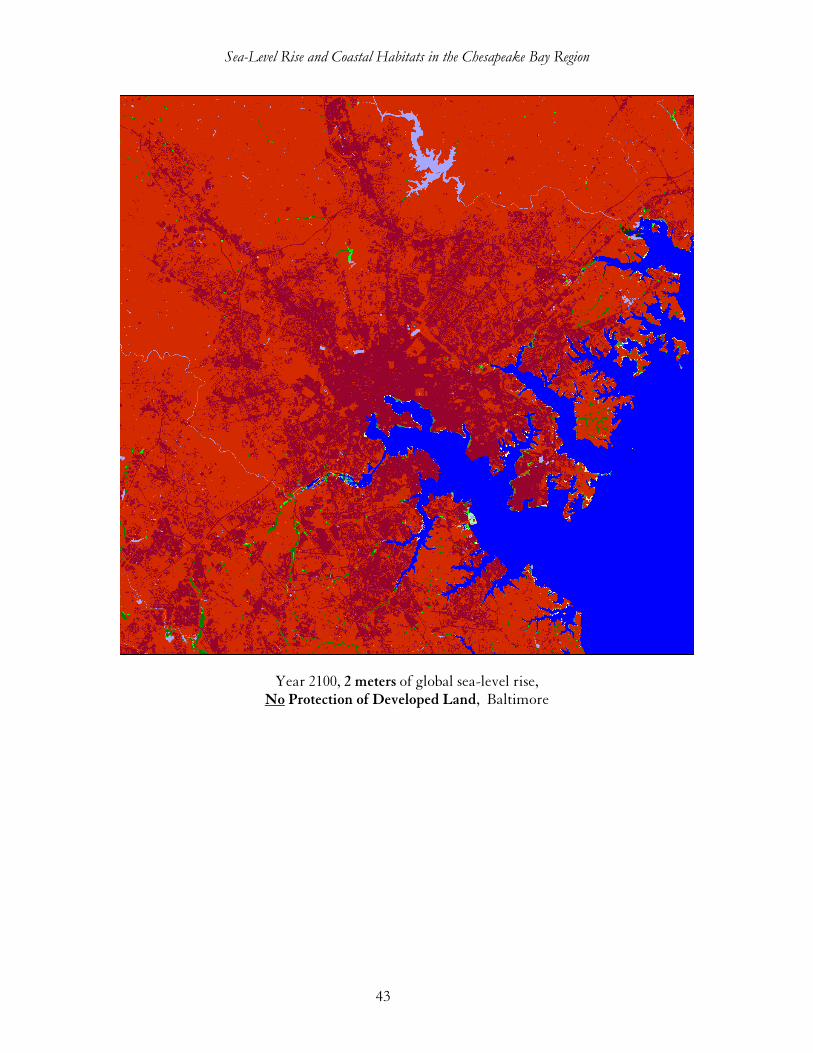
Given the extensive urban development in this area, there has already been a significant amount of coastal habitat loss. Much of the remaining marsh lands surrounding Baltimore are predicted to be lost under higher sea-level rise scenarios. Three to four percent of dry land will be subject to inundation depending on the scenario chosen. Dry lands are generally built at higher enough elevation to avoid much risk. Even under a scenario with two meters of global sea-level rise by 2100, only 2% of land (both developed and undeveloped) are predicted to be inundated.
Pct of Init. Cond Map
Init. Cond. (ha)
A1B-Mean Yr. 2100 (ha)
A1B-Mean Pct. Change
A1B-Max Pct. Change
1 Meter Pct. Change
Global SLR by 2100 (m) 0.387 0.387 0.694 1
Dry Land 57.0% 115,523 114,658 -1% -1% -1%Developed 24.5% 49,655 49,655 0% 0% 0%Swamp 0.6% 1,127 1,167 4% 3% 3%Cypress Swamp 0.0% - - NA NA NAInland Fresh Marsh 0.1% 286 286 0% -1% -3%Tidal Fresh Marsh 0.0% 73 76 4% 2% -7%Trans. Marsh 0.0% 8 130 1561% 540% 748%Irregularly Flooded Marsh 0.5% 1,030 983 -5% -96% -96%Saltmarsh 0.0% 1 135 21405% 14008% 12179%Estuarine Beach 0.0% 40 129 224% 82% 194%Tidal Flat 0.1% 132 10 -92% -21% -93%Ocean Beach 0.0% - - NA NA NAInland Open Water 0.9% 1,865 1,855 -0% -1% -2%Estuarine Open Water 16.2% 32,777 33,463 2% 6% 7%Open Ocean 0.0% - - NA NA NAInland Shore 0.0% 49 49 0% -0% -0%Tidal Swamp 0.1% 150 121 -20% -27% -36%Rocky Intertidal 0.0% - - NA NA NARiverine Tidal 0.0% 19 15 -20% -23% -31%Tidal Creek 0.0% - - NA NA NA
Sum of Categories (ha) 202,734 202,734
Sea-Level Rise and Coastal Habitats in the Chesapeake Bay Region
38
Baltimore Region Initial Condition compared with Year 2100 Under Scenario A1B-Max (69 cm Eustatic SLR)
Initial Condition
Estuarine Open Water
Dry Land
Year 2100
Dry LandSwampCypress SwampInland Fresh MarshTidal Fresh MarshTrans. MarshSaltmarshEstuarine BeachTidal FlatOcean BeachInland Open WaterEstuarine Open WaterOpen Ocean Irregularly Flooded MarshInland ShoreTidal SwampTall SpartinaRocky IntertidalRiverine TidalOcean FlatTidal CreekDeveloped
Saltmarsh
Trans. Marsh
Inland Fresh Marsh
Tidal Flat
Irregularly Flooded
Marsh
Inland Fresh Marsh
Sw amp
Estuarine Beach
Sea-Level Rise and Coastal Habitats in the Chesapeake Bay Region
39
Initial Condition Baltimore
Sea-Level Rise and Coastal Habitats in the Chesapeake Bay Region
40
Year 2100 Scenario A1B-Mean (0.39 meters of global sea-level rise) Protect Developed Land, Baltimore

Sea-Level Rise and Coastal Habitats in the Chesapeake Bay Region
41
Year 2100 Scenario A1B-Maximum (0.69 meters of global sea-level rise) Protect Developed Land, Baltimore

Sea-Level Rise and Coastal Habitats in the Chesapeake Bay Region
42
Year 2100, 1 meter of global sea-level rise, Protect Developed Land, Baltimore
Sea-Level Rise and Coastal Habitats in the Chesapeake Bay Region
43
Year 2100, 2 meters of global sea-level rise, No Protection of Developed Land, Baltimore
Sea-Level Rise and Coastal Habitats in the Chesapeake Bay Region
44
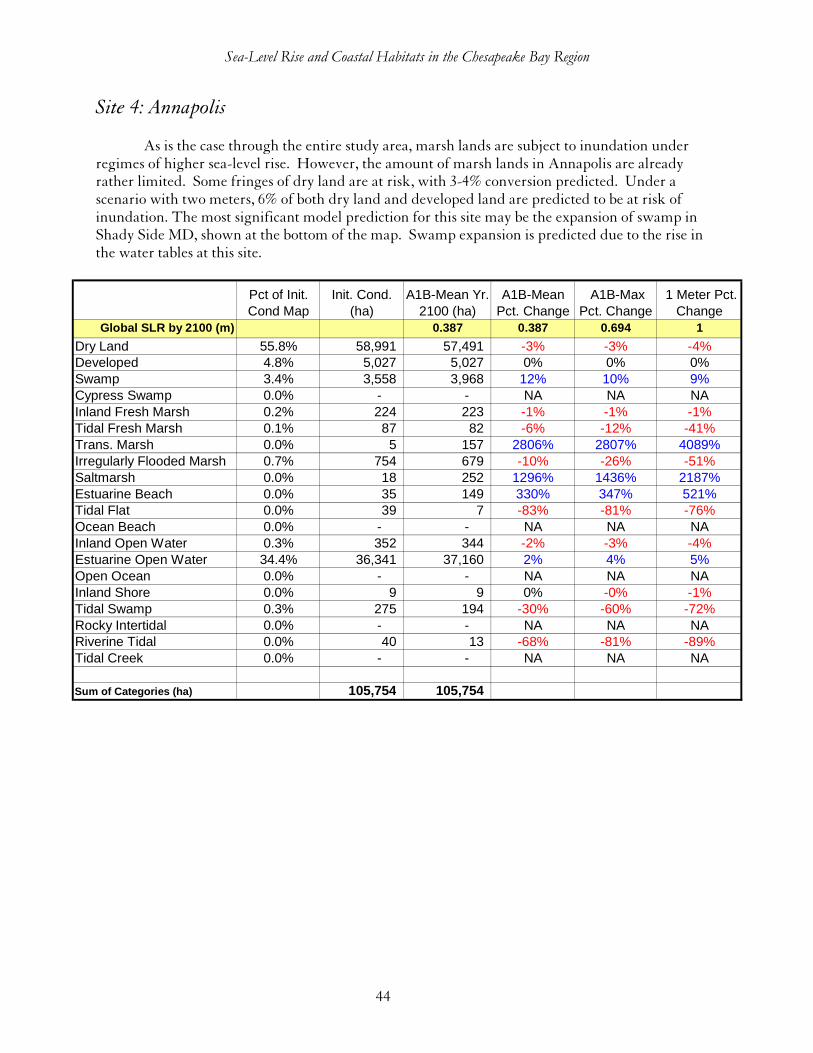
Site 4: Annapolis
As is the case through the entire study area, marsh lands are subject to inundation under regimes of higher sea-level rise. However, the amount of marsh lands in Annapolis are already rather limited. Some fringes of dry land are at risk, with 3-4% conversion predicted. Under a scenario with two meters, 6% of both dry land and developed land are predicted to be at risk of inundation. The most significant model prediction for this site may be the expansion of swamp in Shady Side MD, shown at the bottom of the map. Swamp expansion is predicted due to the rise in the water tables at this site.
Pct of Init. Cond Map
Init. Cond. (ha)
A1B-Mean Yr. 2100 (ha)
A1B-Mean Pct. Change
A1B-Max Pct. Change
1 Meter Pct. Change
Global SLR by 2100 (m) 0.387 0.387 0.694 1
Dry Land 55.8% 58,991 57,491 -3% -3% -4%Developed 4.8% 5,027 5,027 0% 0% 0%Swamp 3.4% 3,558 3,968 12% 10% 9%Cypress Swamp 0.0% - - NA NA NAInland Fresh Marsh 0.2% 224 223 -1% -1% -1%Tidal Fresh Marsh 0.1% 87 82 -6% -12% -41%Trans. Marsh 0.0% 5 157 2806% 2807% 4089%Irregularly Flooded Marsh 0.7% 754 679 -10% -26% -51%Saltmarsh 0.0% 18 252 1296% 1436% 2187%Estuarine Beach 0.0% 35 149 330% 347% 521%Tidal Flat 0.0% 39 7 -83% -81% -76%Ocean Beach 0.0% - - NA NA NAInland Open Water 0.3% 352 344 -2% -3% -4%Estuarine Open Water 34.4% 36,341 37,160 2% 4% 5%Open Ocean 0.0% - - NA NA NAInland Shore 0.0% 9 9 0% -0% -1%Tidal Swamp 0.3% 275 194 -30% -60% -72%Rocky Intertidal 0.0% - - NA NA NARiverine Tidal 0.0% 40 13 -68% -81% -89%Tidal Creek 0.0% - - NA NA NA
Sum of Categories (ha) 105,754 105,754
Sea-Level Rise and Coastal Habitats in the Chesapeake Bay Region
45
Annapolis Initial Condition compared with Year 2100 Under Scenario A1B-Max (69 cm Eustatic SLR)
Initial Condition
Estuarine Open Water
Dry Land
Year 2100
Dry LandSwampCypress SwampInland Fresh MarshTidal Fresh MarshTrans. MarshSaltmarshEstuarine BeachTidal FlatOcean BeachInland Open WaterEstuarine Open WaterOpen Ocean Irregularly Flooded MarshInland ShoreTidal SwampTall SpartinaRocky IntertidalRiverine TidalOcean FlatTidal CreekDeveloped
Saltmarsh
Trans. Marsh
Inland Fresh Marsh
Tidal FlatIrregularly Flooded
Marsh
Inland Fresh Marsh
Sw amp
Estuarine Beach
Sea-Level Rise and Coastal Habitats in the Chesapeake Bay Region
46
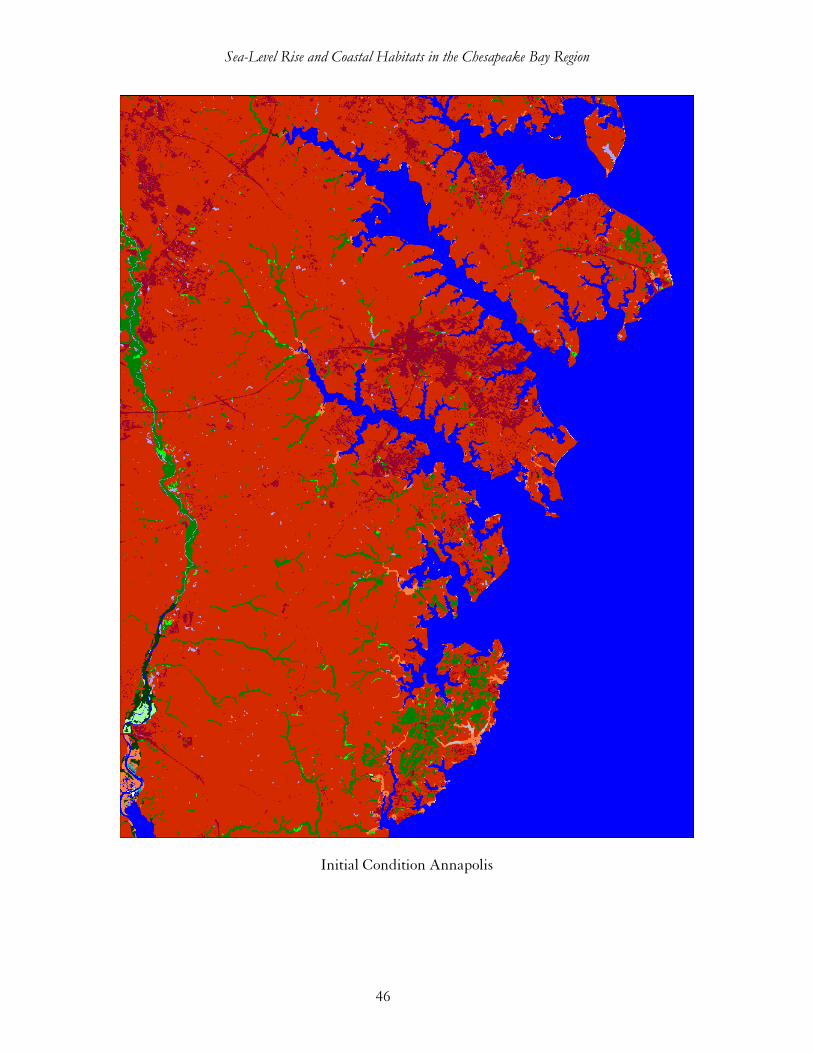
Initial Condition Annapolis
Sea-Level Rise and Coastal Habitats in the Chesapeake Bay Region
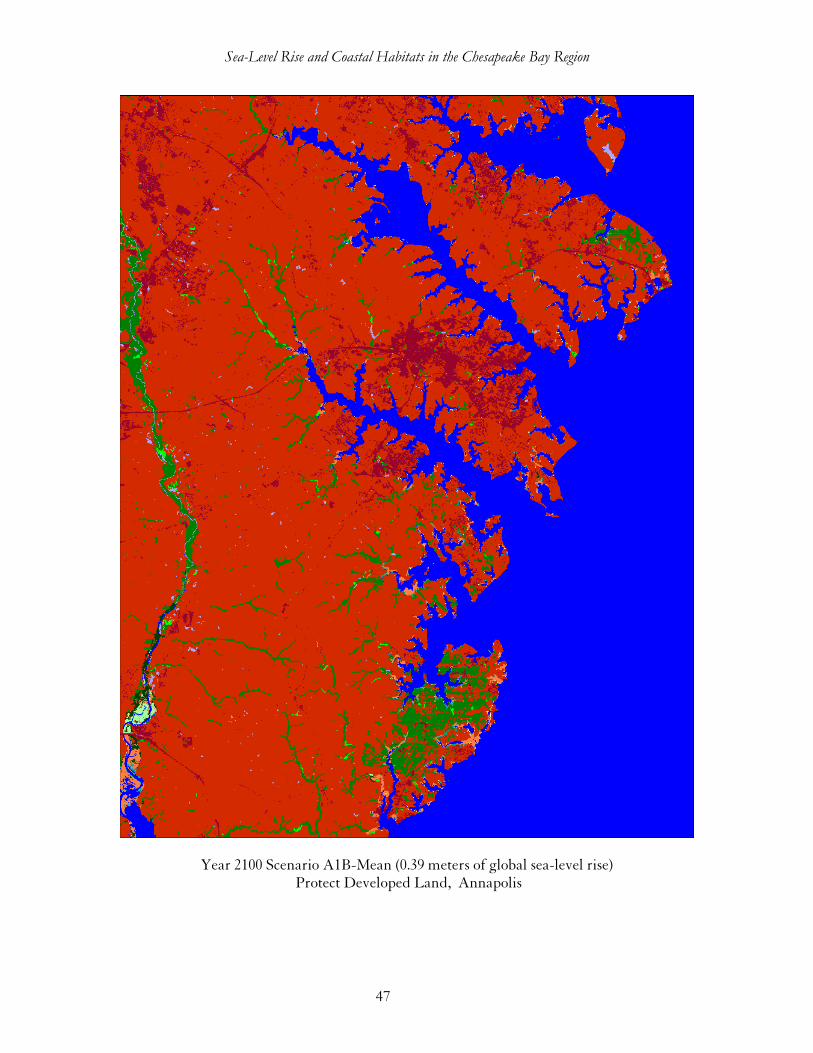
47
Year 2100 Scenario A1B-Mean (0.39 meters of global sea-level rise) Protect Developed Land, Annapolis

Sea-Level Rise and Coastal Habitats in the Chesapeake Bay Region
48
Year 2100 Scenario A1B-Maximum (0.69 meters of global sea-level rise) Protect Developed Land, Annapolis
Sea-Level Rise and Coastal Habitats in the Chesapeake Bay Region
49
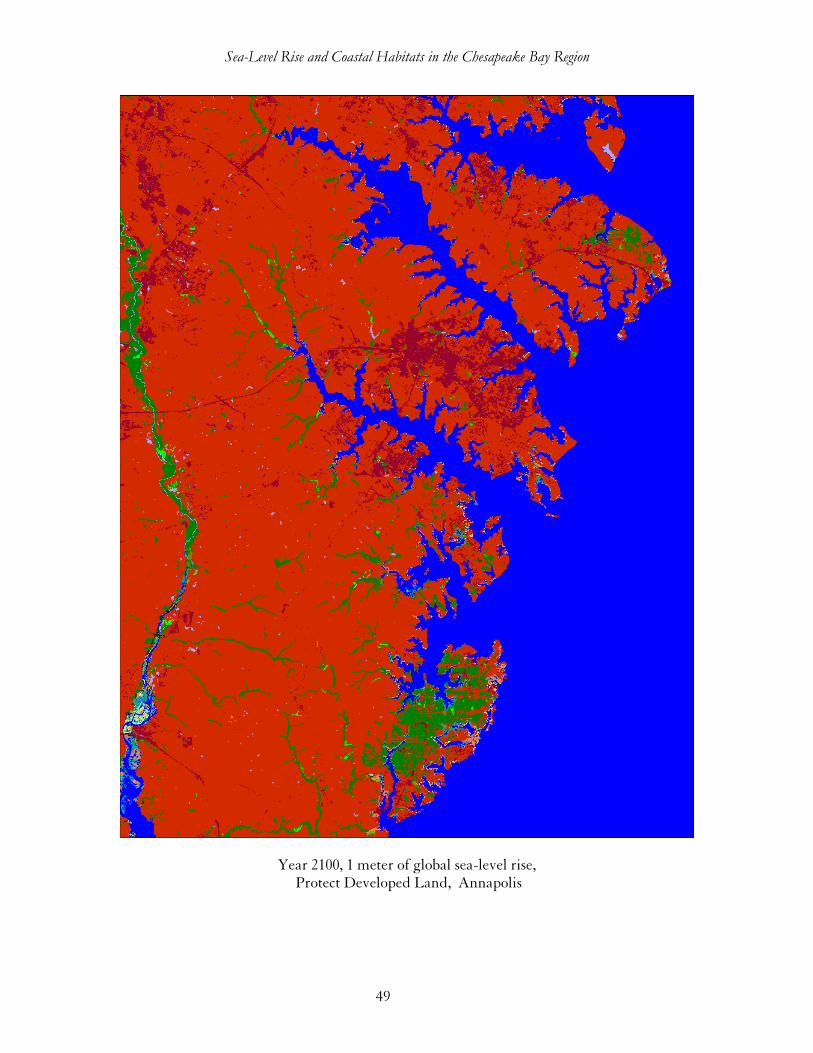
Year 2100, 1 meter of global sea-level rise, Protect Developed Land, Annapolis
Sea-Level Rise and Coastal Habitats in the Chesapeake Bay Region
50
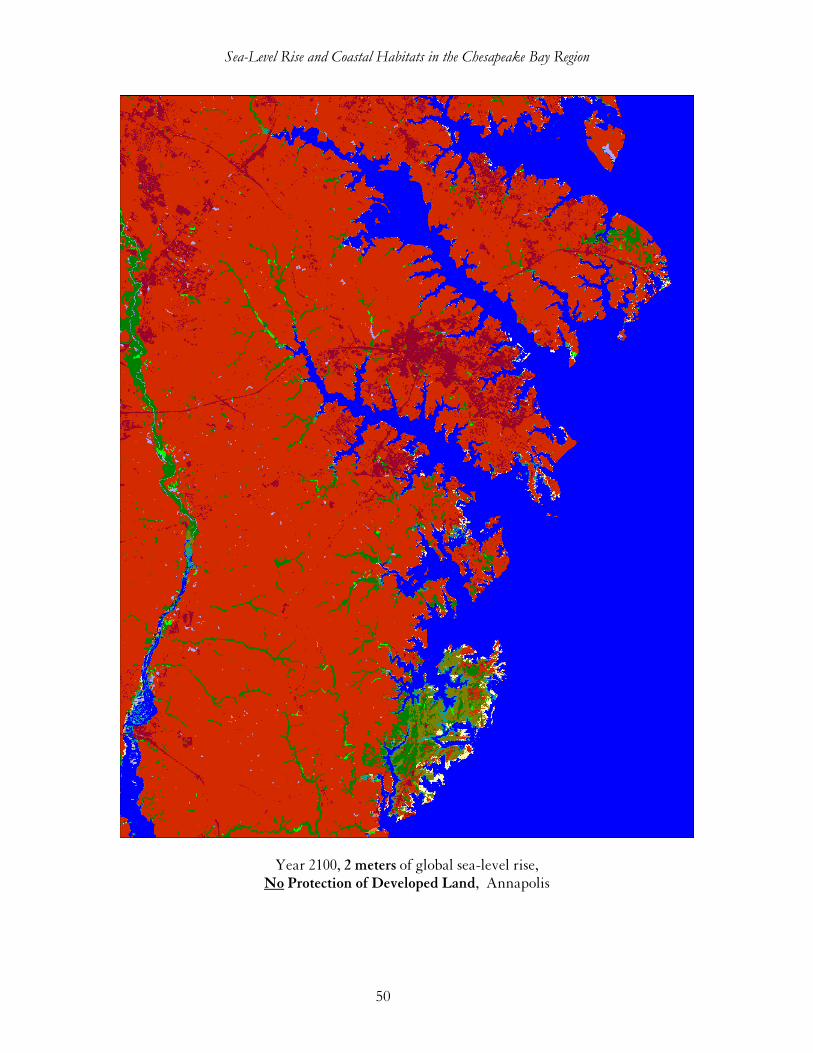
Year 2100, 2 meters of global sea-level rise, No Protection of Developed Land, Annapolis
Sea-Level Rise and Coastal Habitats in the Chesapeake Bay Region
51
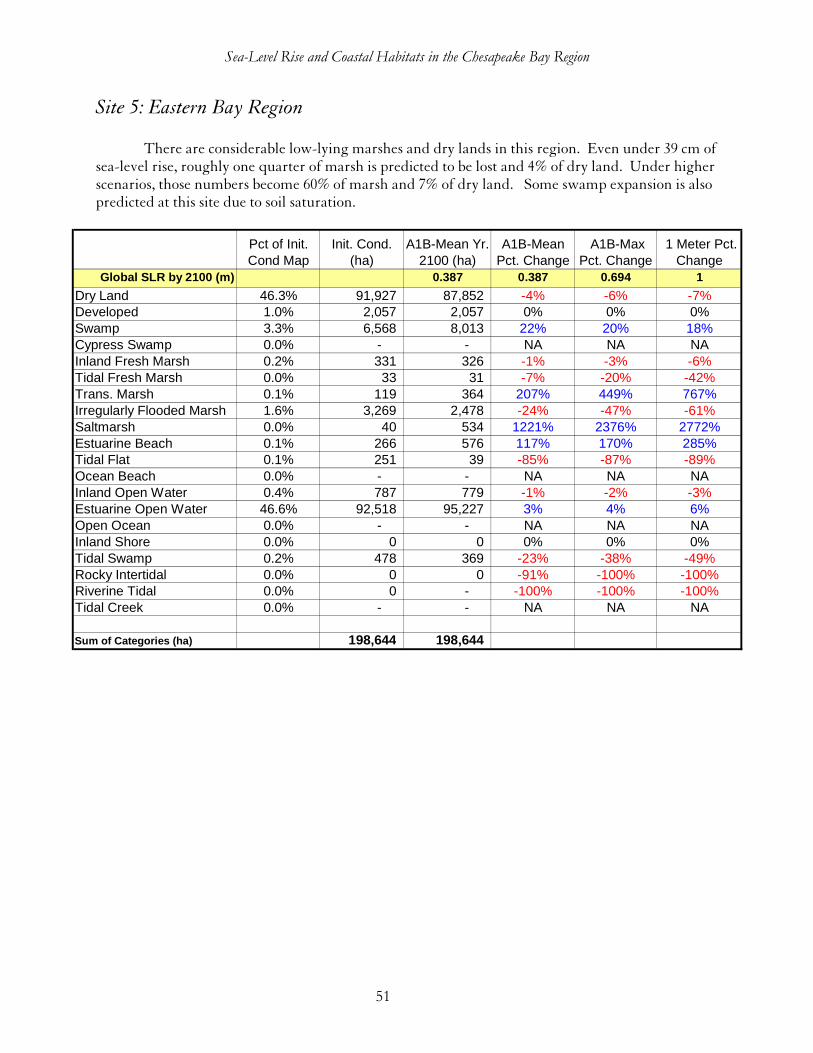
Site 5: Eastern Bay Region
There are considerable low-lying marshes and dry lands in this region. Even under 39 cm of sea-level rise, roughly one quarter of marsh is predicted to be lost and 4% of dry land. Under higher scenarios, those numbers become 60% of marsh and 7% of dry land. Some swamp expansion is also predicted at this site due to soil saturation.
Pct of Init. Cond Map
Init. Cond. (ha)
A1B-Mean Yr. 2100 (ha)
A1B-Mean Pct. Change
A1B-Max Pct. Change
1 Meter Pct. Change
Global SLR by 2100 (m) 0.387 0.387 0.694 1
Dry Land 46.3% 91,927 87,852 -4% -6% -7%Developed 1.0% 2,057 2,057 0% 0% 0%Swamp 3.3% 6,568 8,013 22% 20% 18%Cypress Swamp 0.0% - - NA NA NAInland Fresh Marsh 0.2% 331 326 -1% -3% -6%Tidal Fresh Marsh 0.0% 33 31 -7% -20% -42%Trans. Marsh 0.1% 119 364 207% 449% 767%Irregularly Flooded Marsh 1.6% 3,269 2,478 -24% -47% -61%Saltmarsh 0.0% 40 534 1221% 2376% 2772%Estuarine Beach 0.1% 266 576 117% 170% 285%Tidal Flat 0.1% 251 39 -85% -87% -89%Ocean Beach 0.0% - - NA NA NAInland Open Water 0.4% 787 779 -1% -2% -3%Estuarine Open Water 46.6% 92,518 95,227 3% 4% 6%Open Ocean 0.0% - - NA NA NAInland Shore 0.0% 0 0 0% 0% 0%Tidal Swamp 0.2% 478 369 -23% -38% -49%Rocky Intertidal 0.0% 0 0 -91% -100% -100%Riverine Tidal 0.0% 0 - -100% -100% -100%Tidal Creek 0.0% - - NA NA NA
Sum of Categories (ha) 198,644 198,644
Sea-Level Rise and Coastal Habitats in the Chesapeake Bay Region
52
Eastern Bay Region Initial Condition compared with Year 2100 Under Scenario A1B-Max (69 cm Eustatic SLR)
Initial Condition
Estuarine Open Water
Dry Land
Year 2100
Dry LandSwampCypress SwampInland Fresh MarshTidal Fresh MarshTrans. MarshSaltmarshEstuarine BeachTidal FlatOcean BeachInland Open WaterEstuarine Open WaterOpen Ocean Irregularly Flooded MarshInland ShoreTidal SwampTall SpartinaRocky IntertidalRiverine TidalOcean FlatTidal CreekDeveloped
Saltmarsh
Trans. Marsh
Inland Fresh Marsh
Tidal Flat
Irregularly Flooded
Marsh
Inland Fresh Marsh
Sw amp
Estuarine Beach

Sea-Level Rise and Coastal Habitats in the Chesapeake Bay Region
53
Initial Condition Eastern Bay Region
Sea-Level Rise and Coastal Habitats in the Chesapeake Bay Region
54
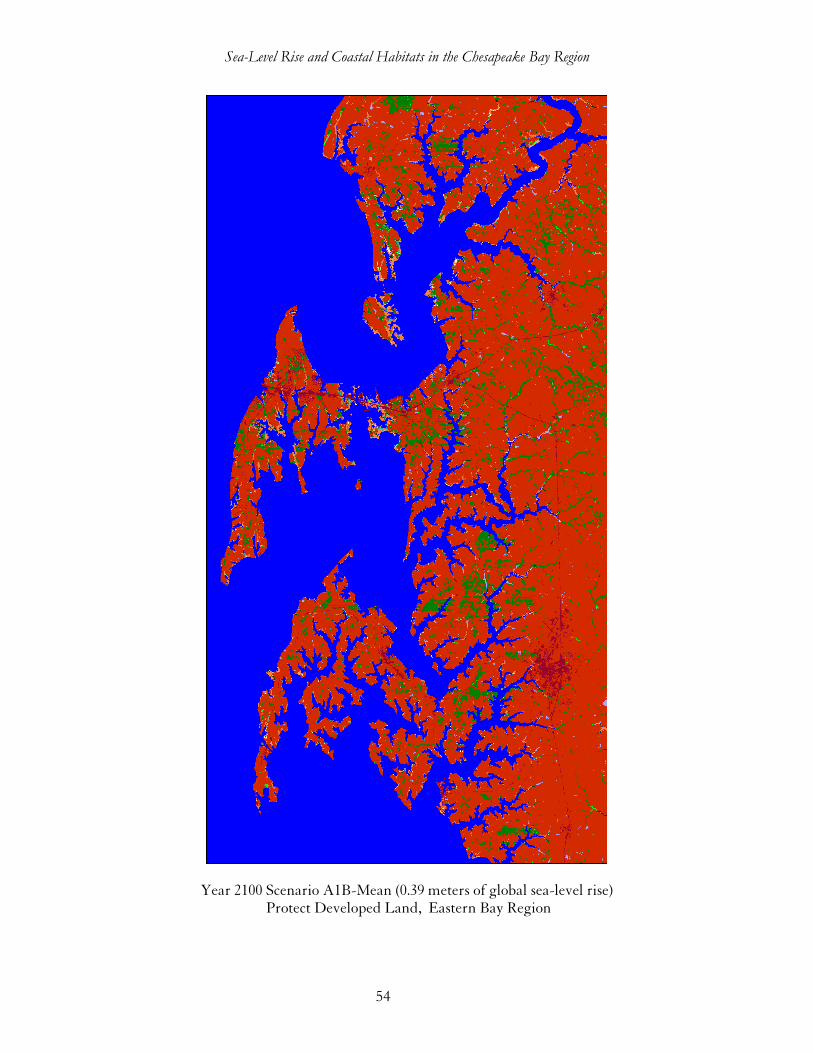
Year 2100 Scenario A1B-Mean (0.39 meters of global sea-level rise) Protect Developed Land, Eastern Bay Region

Sea-Level Rise and Coastal Habitats in the Chesapeake Bay Region
55
Year 2100 Scenario A1B-Maximum (0.69 meters of global sea-level rise) Protect Developed Land, Eastern Bay Region

Sea-Level Rise and Coastal Habitats in the Chesapeake Bay Region
56
Year 2100, 1 meter of global sea-level rise, Protect Developed Land, Eastern Bay Region
Sea-Level Rise and Coastal Habitats in the Chesapeake Bay Region
57
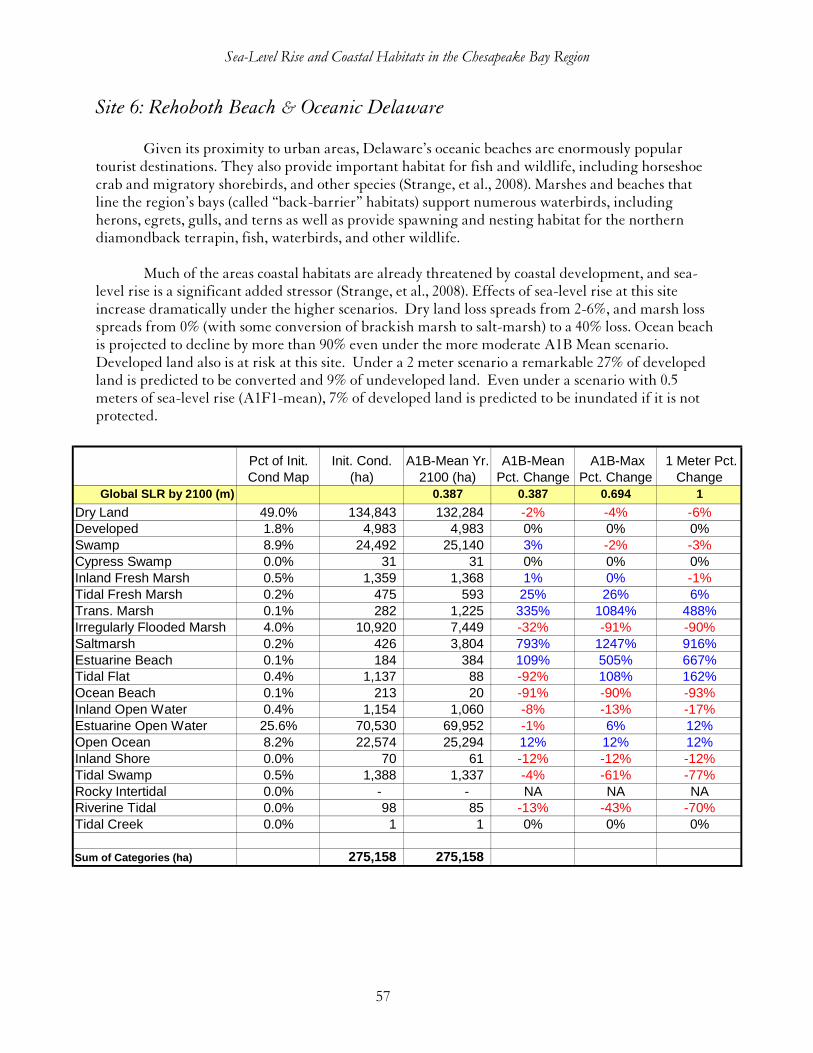
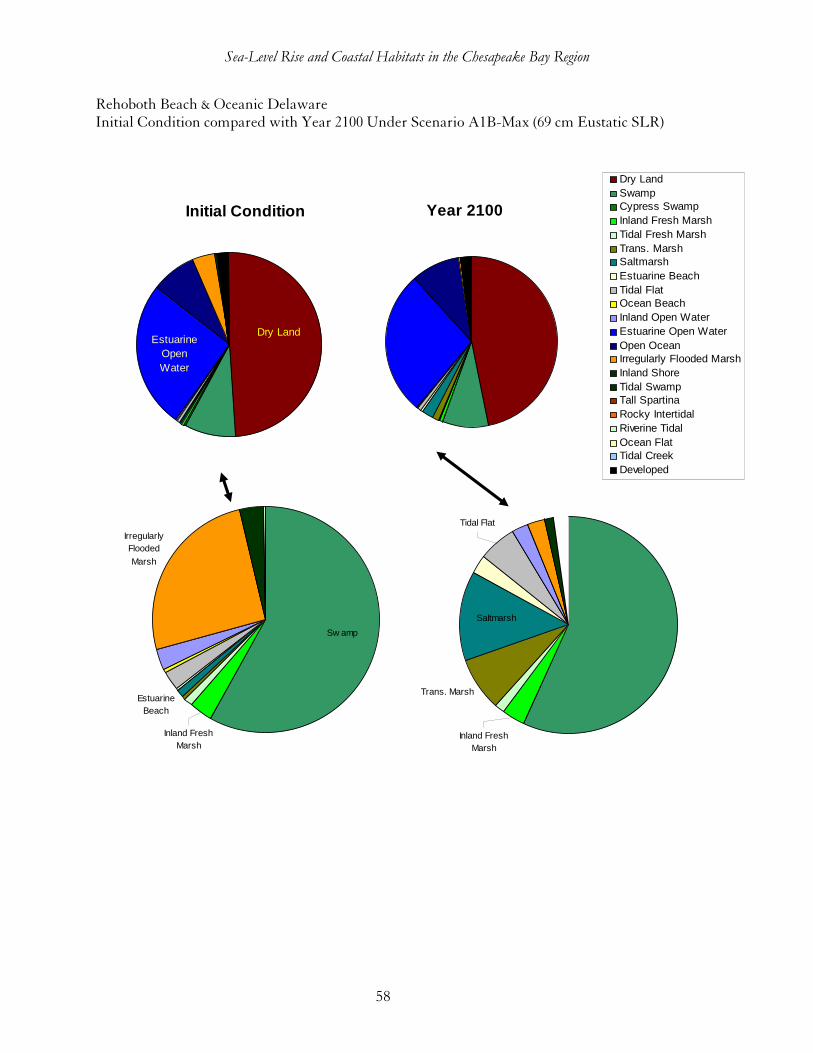
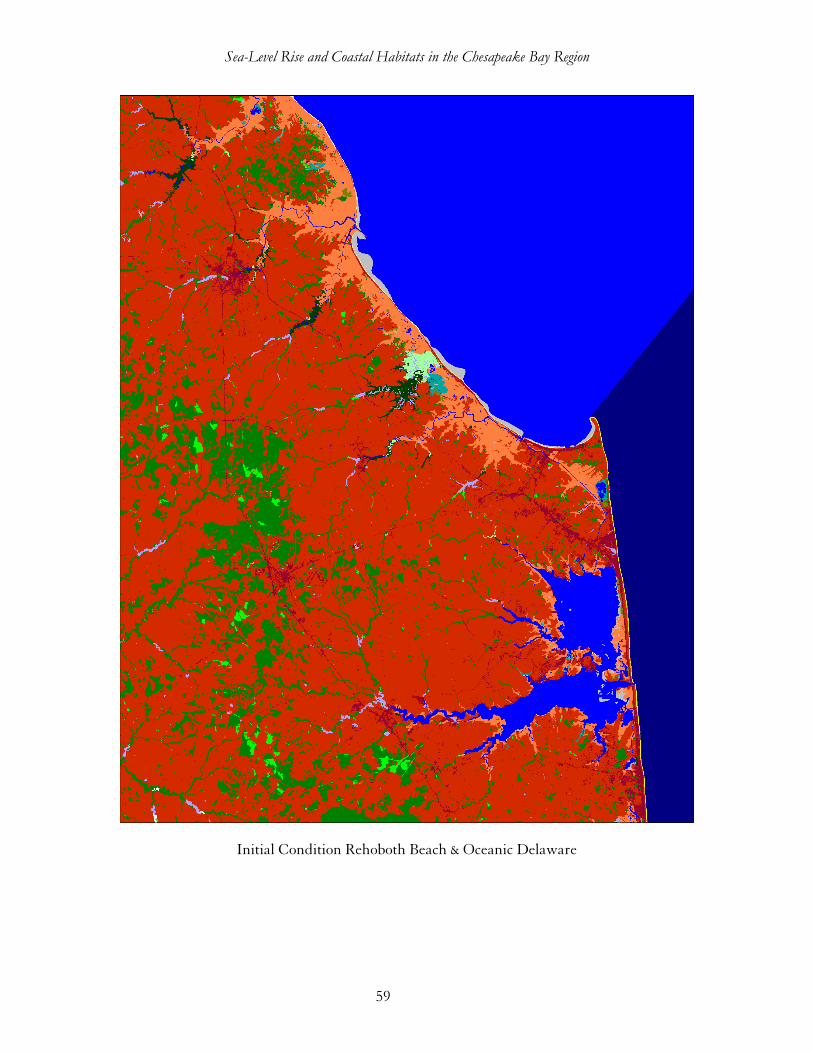
Site 6: Rehoboth Beach & Oceanic Delaware
Given its proximity to urban areas, Delaware’s oceanic beaches are enormously popular tourist destinations. They also provide important habitat for fish and wildlife, including horseshoe crab and migratory shorebirds, and other species (Strange, et al., 2008). Marshes and beaches that line the region’s bays (called “back-barrier” habitats) support numerous waterbirds, including herons, egrets, gulls, and terns as well as provide spawning and nesting habitat for the northern diamondback terrapin, fish, waterbirds, and other wildlife.
Much of the areas coastal habitats are already threatened by coastal development, and sea-
level rise is a significant added stressor (Strange, et al., 2008). Effects of sea-level rise at this site increase dramatically under the higher scenarios. Dry land loss spreads from 2-6%, and marsh loss spreads from 0% (with some conversion of brackish marsh to salt-marsh) to a 40% loss. Ocean beach is projected to decline by more than 90% even under the more moderate A1B Mean scenario. Developed land also is at risk at this site. Under a 2 meter scenario a remarkable 27% of developed land is predicted to be converted and 9% of undeveloped land. Even under a scenario with 0.5 meters of sea-level rise (A1F1-mean), 7% of developed land is predicted to be inundated if it is not protected.
Pct of Init. Cond Map
Init. Cond. (ha)
A1B-Mean Yr. 2100 (ha)
A1B-Mean Pct. Change
A1B-Max Pct. Change
1 Meter Pct. Change
Global SLR by 2100 (m) 0.387 0.387 0.694 1
Dry Land 49.0% 134,843 132,284 -2% -4% -6%Developed 1.8% 4,983 4,983 0% 0% 0%Swamp 8.9% 24,492 25,140 3% -2% -3%Cypress Swamp 0.0% 31 31 0% 0% 0%Inland Fresh Marsh 0.5% 1,359 1,368 1% 0% -1%Tidal Fresh Marsh 0.2% 475 593 25% 26% 6%Trans. Marsh 0.1% 282 1,225 335% 1084% 488%Irregularly Flooded Marsh 4.0% 10,920 7,449 -32% -91% -90%Saltmarsh 0.2% 426 3,804 793% 1247% 916%Estuarine Beach 0.1% 184 384 109% 505% 667%Tidal Flat 0.4% 1,137 88 -92% 108% 162%Ocean Beach 0.1% 213 20 -91% -90% -93%Inland Open Water 0.4% 1,154 1,060 -8% -13% -17%Estuarine Open Water 25.6% 70,530 69,952 -1% 6% 12%Open Ocean 8.2% 22,574 25,294 12% 12% 12%Inland Shore 0.0% 70 61 -12% -12% -12%Tidal Swamp 0.5% 1,388 1,337 -4% -61% -77%Rocky Intertidal 0.0% - - NA NA NARiverine Tidal 0.0% 98 85 -13% -43% -70%Tidal Creek 0.0% 1 1 0% 0% 0%
Sum of Categories (ha) 275,158 275,158
Sea-Level Rise and Coastal Habitats in the Chesapeake Bay Region
58
Rehoboth Beach & Oceanic Delaware Initial Condition compared with Year 2100 Under Scenario A1B-Max (69 cm Eustatic SLR)
Initial Condition
Estuarine Open Water
Dry Land
Year 2100
Dry LandSwampCypress SwampInland Fresh MarshTidal Fresh MarshTrans. MarshSaltmarshEstuarine BeachTidal FlatOcean BeachInland Open WaterEstuarine Open WaterOpen Ocean Irregularly Flooded MarshInland ShoreTidal SwampTall SpartinaRocky IntertidalRiverine TidalOcean FlatTidal CreekDeveloped
Saltmarsh
Trans. Marsh
Inland Fresh Marsh
Tidal Flat
Irregularly Flooded
Marsh
Inland Fresh Marsh
Sw amp
Estuarine Beach
Sea-Level Rise and Coastal Habitats in the Chesapeake Bay Region
59
Initial Condition Rehoboth Beach & Oceanic Delaware
Sea-Level Rise and Coastal Habitats in the Chesapeake Bay Region
60
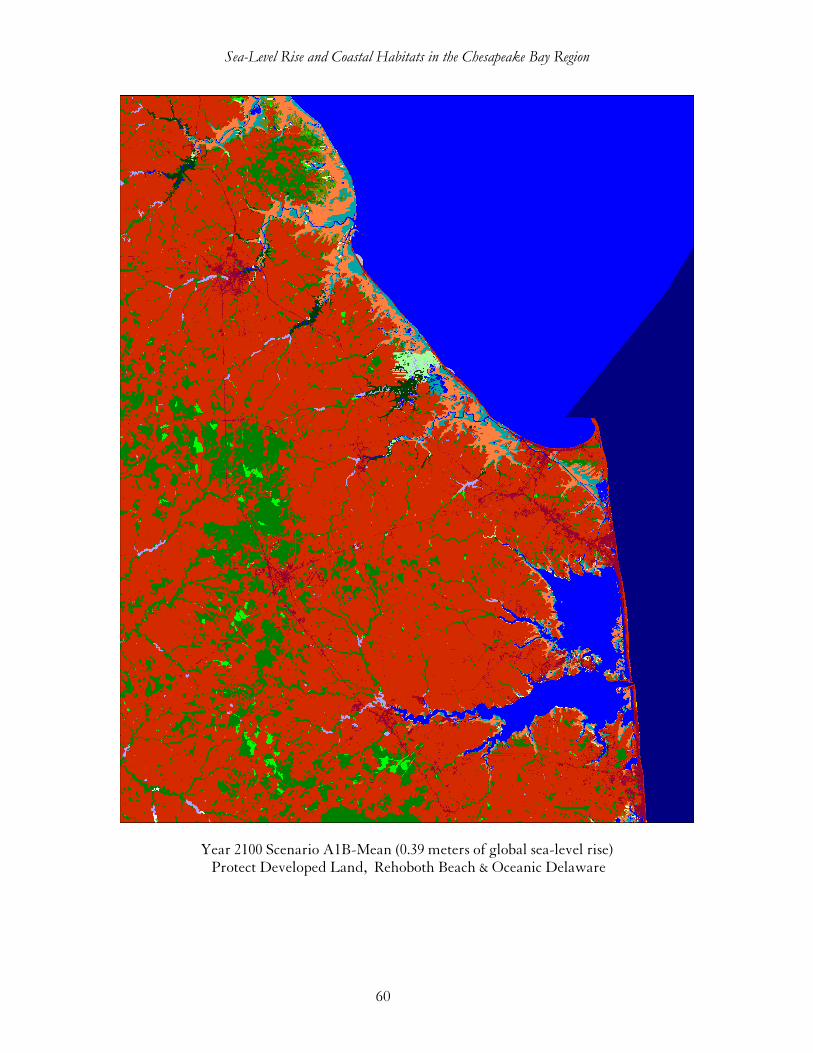
Year 2100 Scenario A1B-Mean (0.39 meters of global sea-level rise) Protect Developed Land, Rehoboth Beach & Oceanic Delaware
Sea-Level Rise and Coastal Habitats in the Chesapeake Bay Region
61
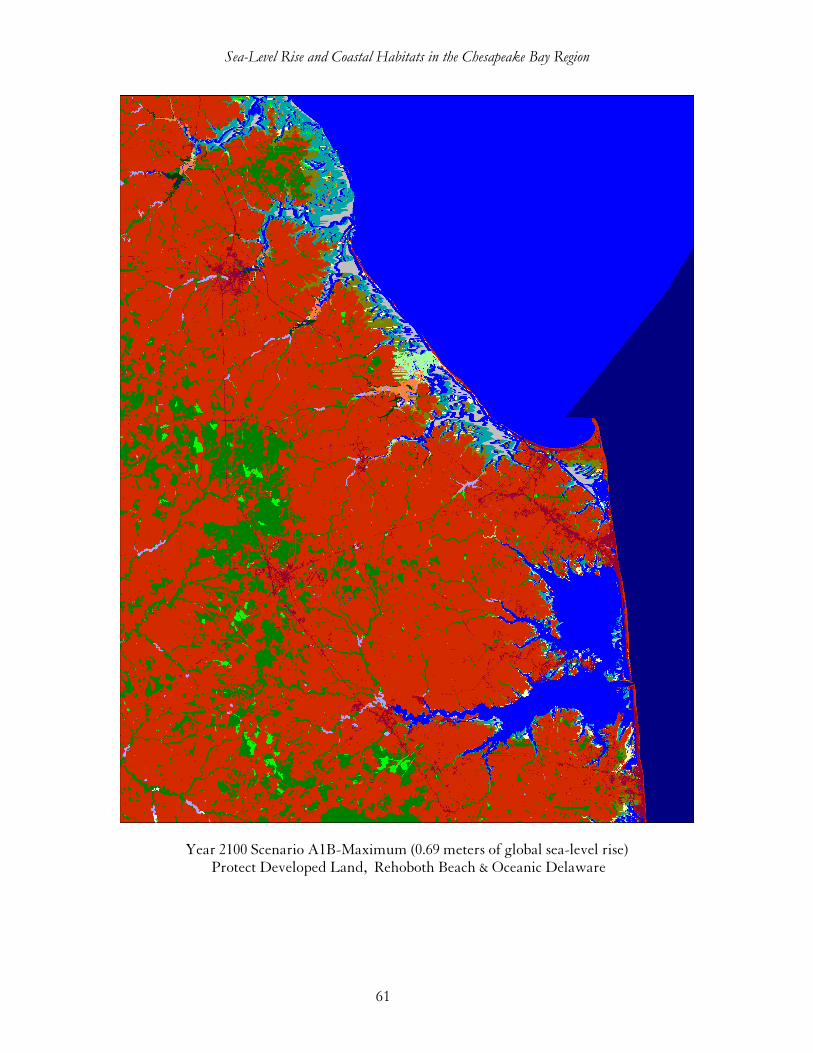
Year 2100 Scenario A1B-Maximum (0.69 meters of global sea-level rise) Protect Developed Land, Rehoboth Beach & Oceanic Delaware
Sea-Level Rise and Coastal Habitats in the Chesapeake Bay Region
62
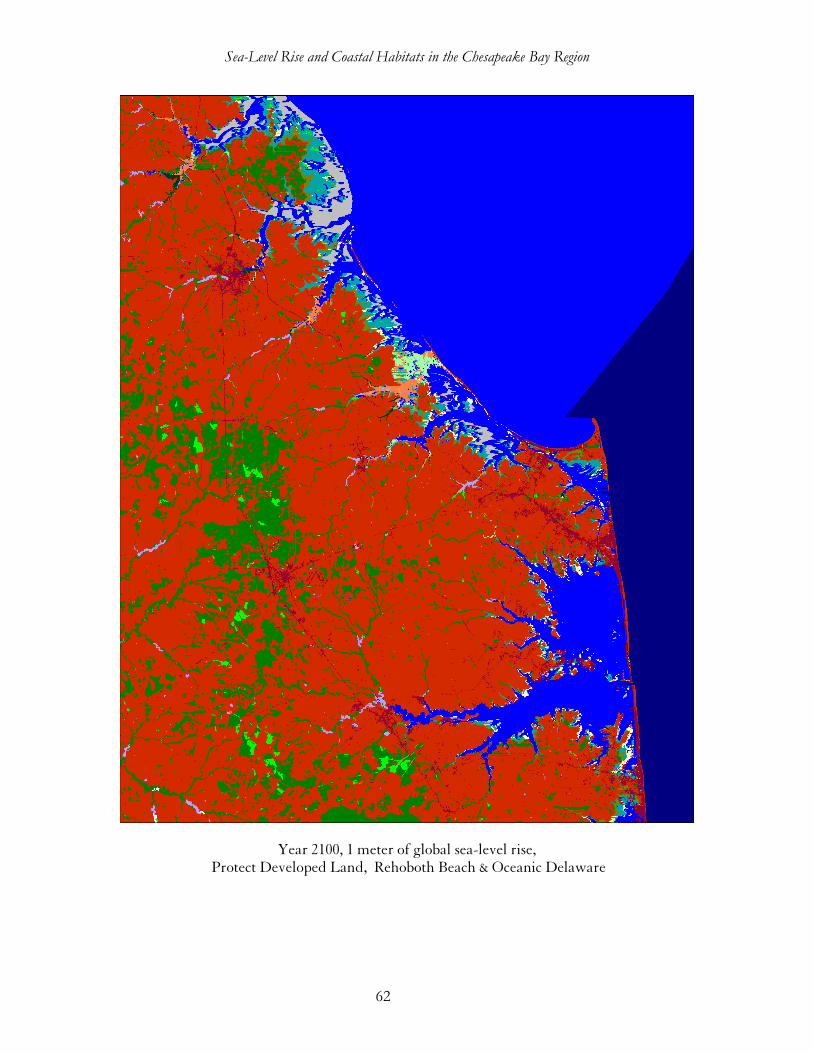
Year 2100, 1 meter of global sea-level rise, Protect Developed Land, Rehoboth Beach & Oceanic Delaware
Sea-Level Rise and Coastal Habitats in the Chesapeake Bay Region
63
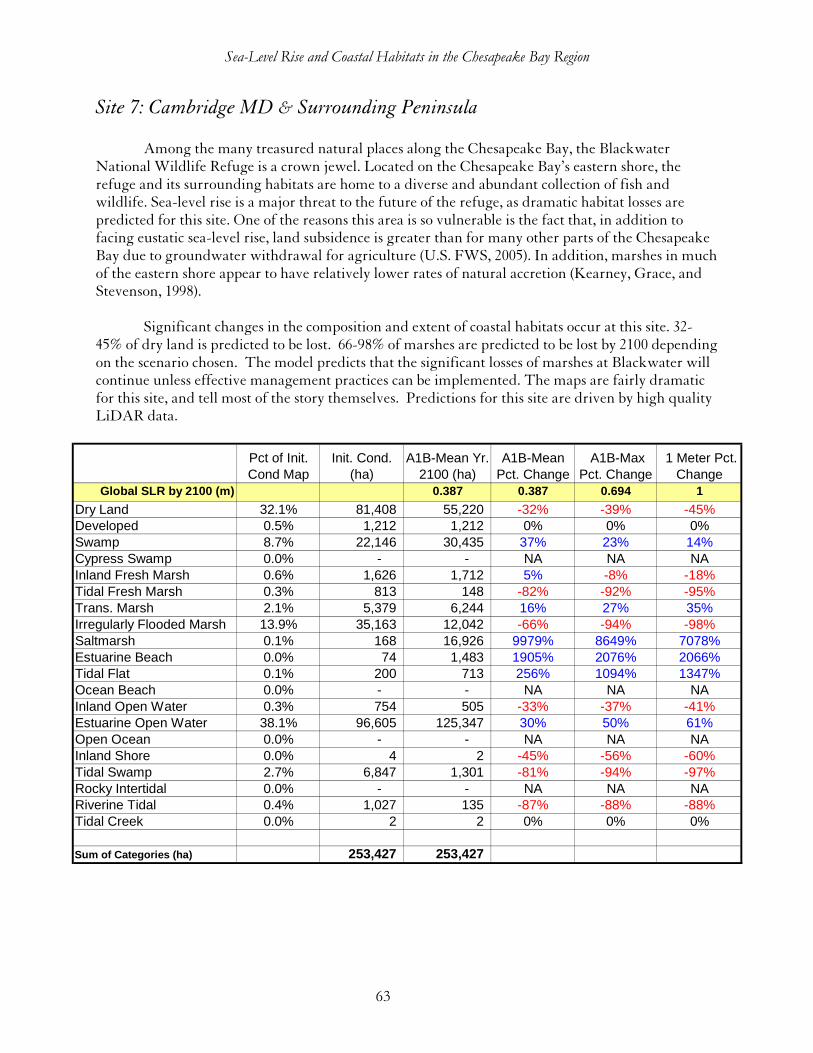
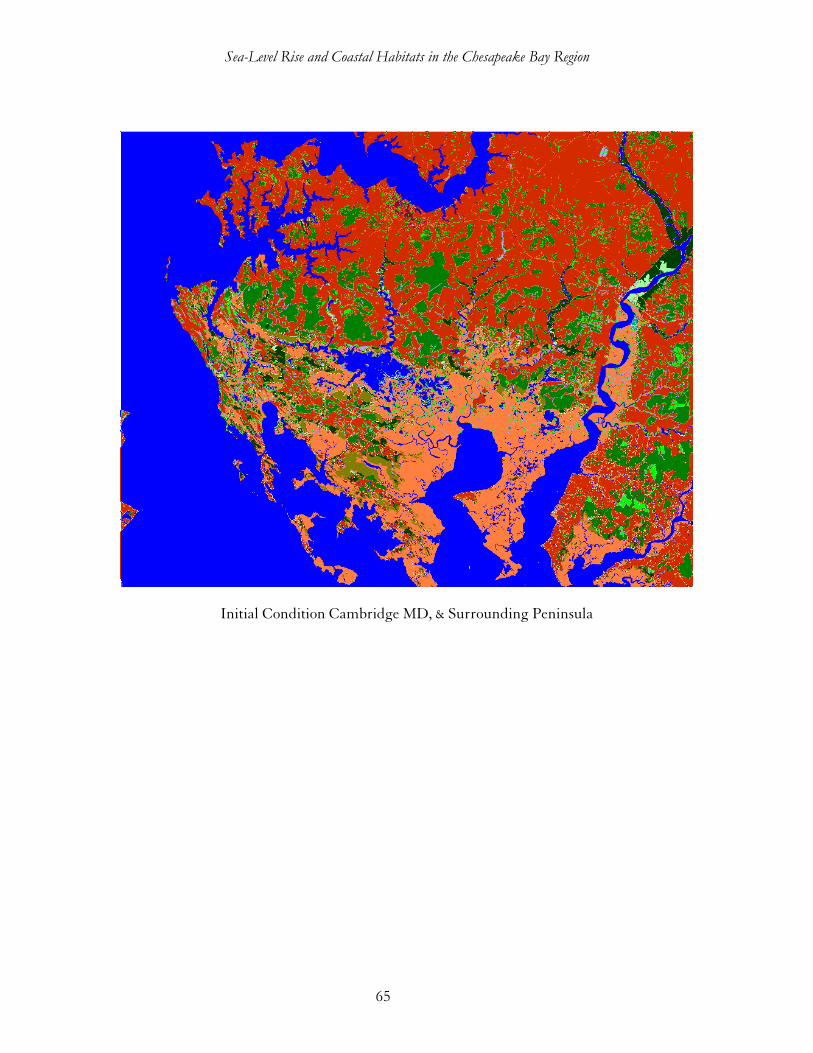
Site 7: Cambridge MD & Surrounding Peninsula
Among the many treasured natural places along the Chesapeake Bay, the Blackwater National Wildlife Refuge is a crown jewel. Located on the Chesapeake Bay’s eastern shore, the refuge and its surrounding habitats are home to a diverse and abundant collection of fish and wildlife. Sea-level rise is a major threat to the future of the refuge, as dramatic habitat losses are predicted for this site. One of the reasons this area is so vulnerable is the fact that, in addition to facing eustatic sea-level rise, land subsidence is greater than for many other parts of the Chesapeake Bay due to groundwater withdrawal for agriculture (U.S. FWS, 2005). In addition, marshes in much of the eastern shore appear to have relatively lower rates of natural accretion (Kearney, Grace, and Stevenson, 1998).
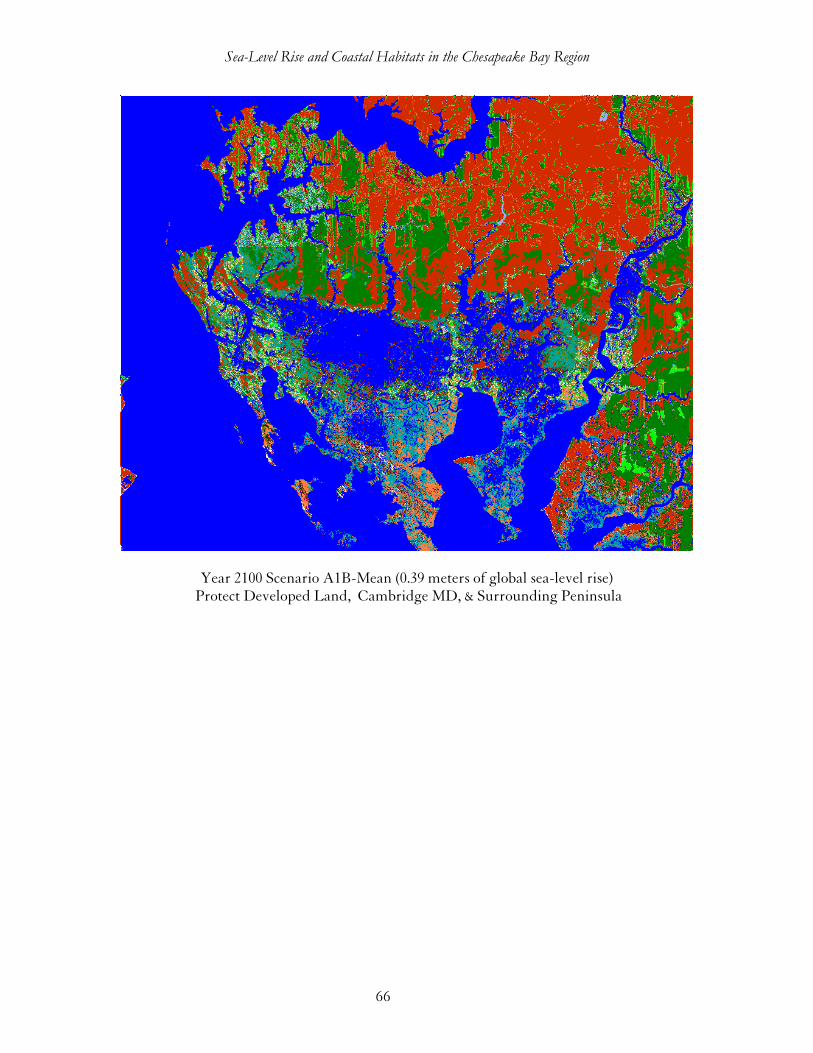
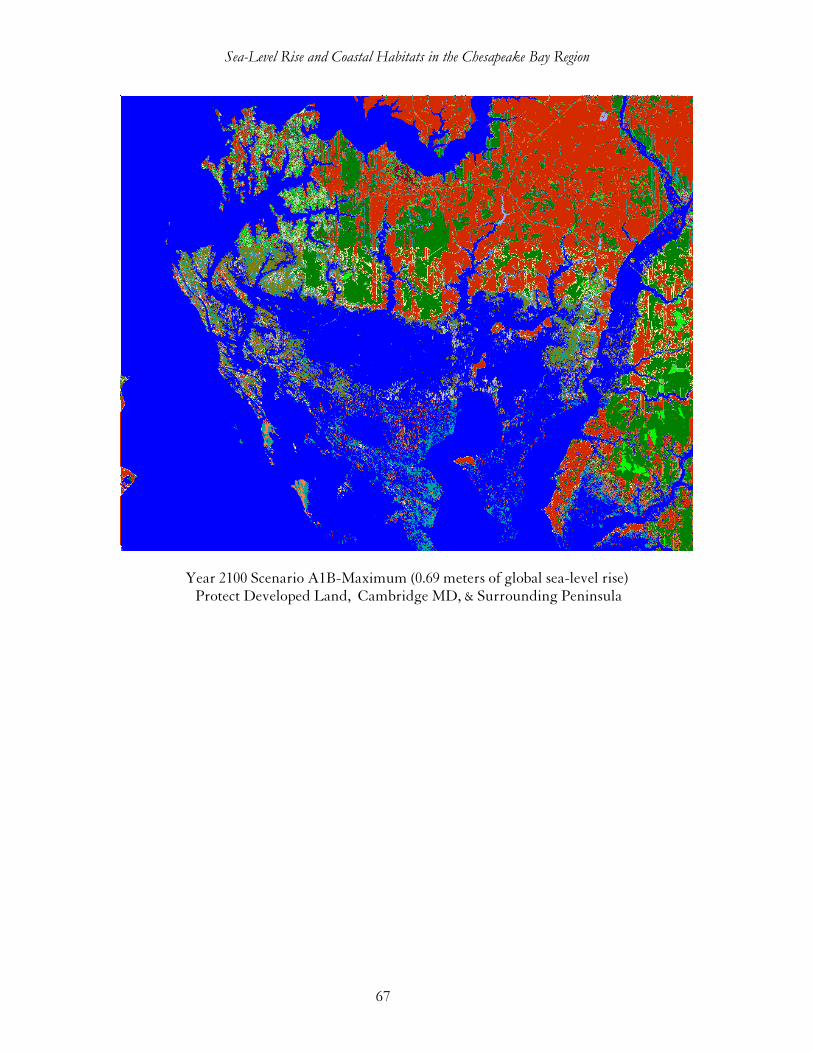
Significant changes in the composition and extent of coastal habitats occur at this site. 32-
45% of dry land is predicted to be lost. 66-98% of marshes are predicted to be lost by 2100 depending on the scenario chosen. The model predicts that the significant losses of marshes at Blackwater will continue unless effective management practices can be implemented. The maps are fairly dramatic for this site, and tell most of the story themselves. Predictions for this site are driven by high quality LiDAR data.
Pct of Init. Cond Map
Init. Cond. (ha)
A1B-Mean Yr. 2100 (ha)
A1B-Mean Pct. Change
A1B-Max Pct. Change
1 Meter Pct. Change
Global SLR by 2100 (m) 0.387 0.387 0.694 1
Dry Land 32.1% 81,408 55,220 -32% -39% -45%Developed 0.5% 1,212 1,212 0% 0% 0%Swamp 8.7% 22,146 30,435 37% 23% 14%Cypress Swamp 0.0% - - NA NA NAInland Fresh Marsh 0.6% 1,626 1,712 5% -8% -18%Tidal Fresh Marsh 0.3% 813 148 -82% -92% -95%Trans. Marsh 2.1% 5,379 6,244 16% 27% 35%Irregularly Flooded Marsh 13.9% 35,163 12,042 -66% -94% -98%Saltmarsh 0.1% 168 16,926 9979% 8649% 7078%Estuarine Beach 0.0% 74 1,483 1905% 2076% 2066%Tidal Flat 0.1% 200 713 256% 1094% 1347%Ocean Beach 0.0% - - NA NA NAInland Open Water 0.3% 754 505 -33% -37% -41%Estuarine Open Water 38.1% 96,605 125,347 30% 50% 61%Open Ocean 0.0% - - NA NA NAInland Shore 0.0% 4 2 -45% -56% -60%Tidal Swamp 2.7% 6,847 1,301 -81% -94% -97%Rocky Intertidal 0.0% - - NA NA NARiverine Tidal 0.4% 1,027 135 -87% -88% -88%Tidal Creek 0.0% 2 2 0% 0% 0%
Sum of Categories (ha) 253,427 253,427
Sea-Level Rise and Coastal Habitats in the Chesapeake Bay Region
64
Cambridge MD & Surrounding Peninsula Initial Condition compared with Year 2100 Under Scenario A1B-Max (69 cm Eustatic SLR)
Initial Condition
Estuarine Open Water
Dry Land
Year 2100
Dry LandSwampCypress SwampInland Fresh MarshTidal Fresh MarshTrans. MarshSaltmarshEstuarine BeachTidal FlatOcean BeachInland Open WaterEstuarine Open WaterOpen Ocean Irregularly Flooded MarshInland ShoreTidal SwampTall SpartinaRocky IntertidalRiverine TidalOcean FlatTidal CreekDeveloped
Saltmarsh
Trans. Marsh
Inland Fresh Marsh
Tidal Flat
Irregularly Flooded
Marsh
Inland Fresh Marsh
Sw amp
Estuarine Beach
Sea-Level Rise and Coastal Habitats in the Chesapeake Bay Region
65
Initial Condition Cambridge MD, & Surrounding Peninsula
Sea-Level Rise and Coastal Habitats in the Chesapeake Bay Region
66
Year 2100 Scenario A1B-Mean (0.39 meters of global sea-level rise) Protect Developed Land, Cambridge MD, & Surrounding Peninsula
Sea-Level Rise and Coastal Habitats in the Chesapeake Bay Region
67
Year 2100 Scenario A1B-Maximum (0.69 meters of global sea-level rise) Protect Developed Land, Cambridge MD, & Surrounding Peninsula
Sea-Level Rise and Coastal Habitats in the Chesapeake Bay Region
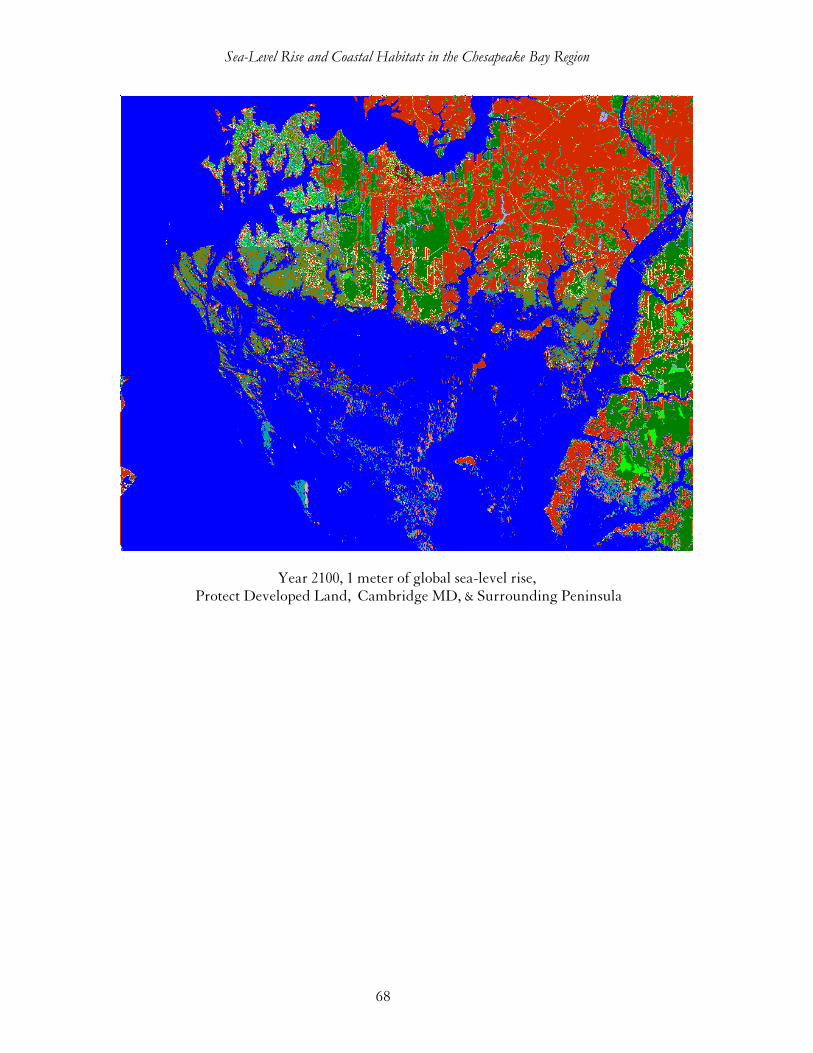
68
Year 2100, 1 meter of global sea-level rise, Protect Developed Land, Cambridge MD, & Surrounding Peninsula
Sea-Level Rise and Coastal Habitats in the Chesapeake Bay Region
69
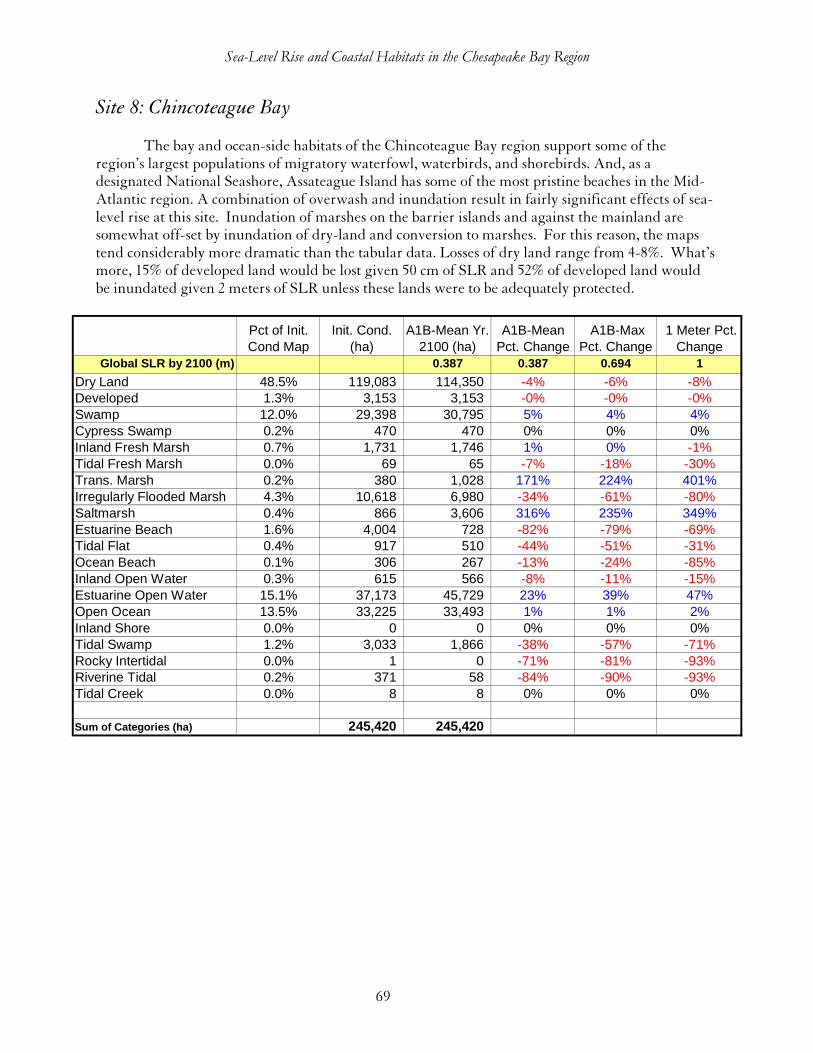
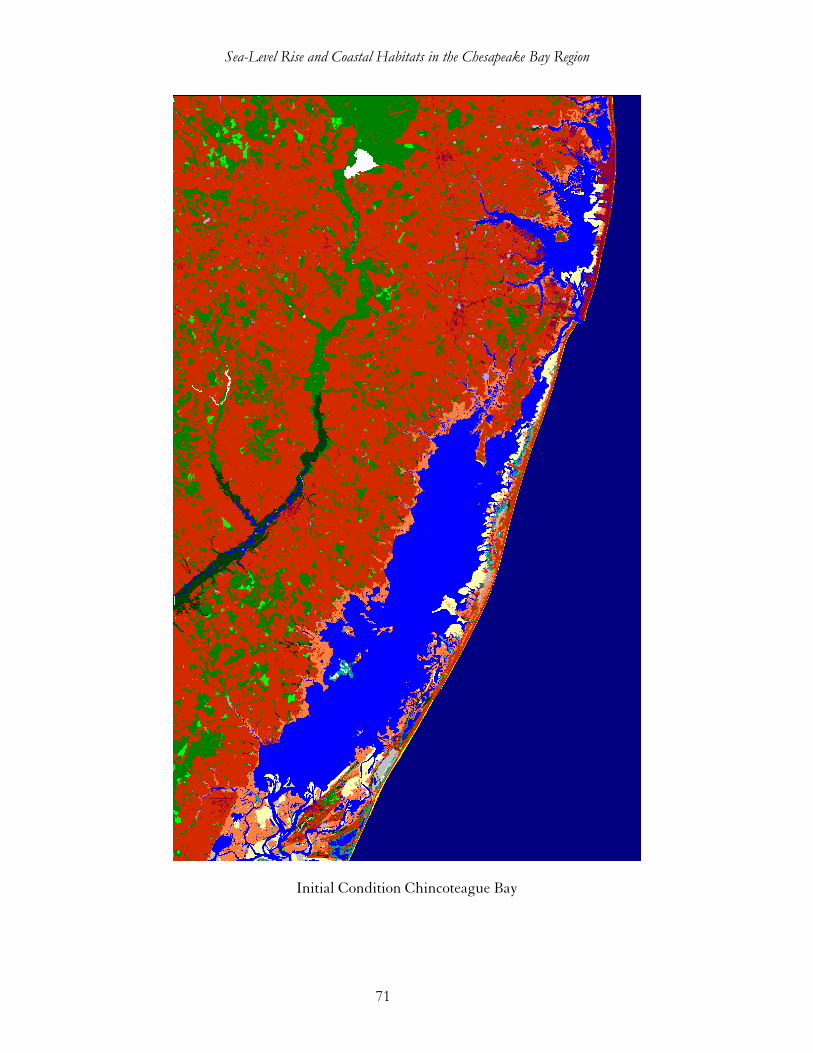
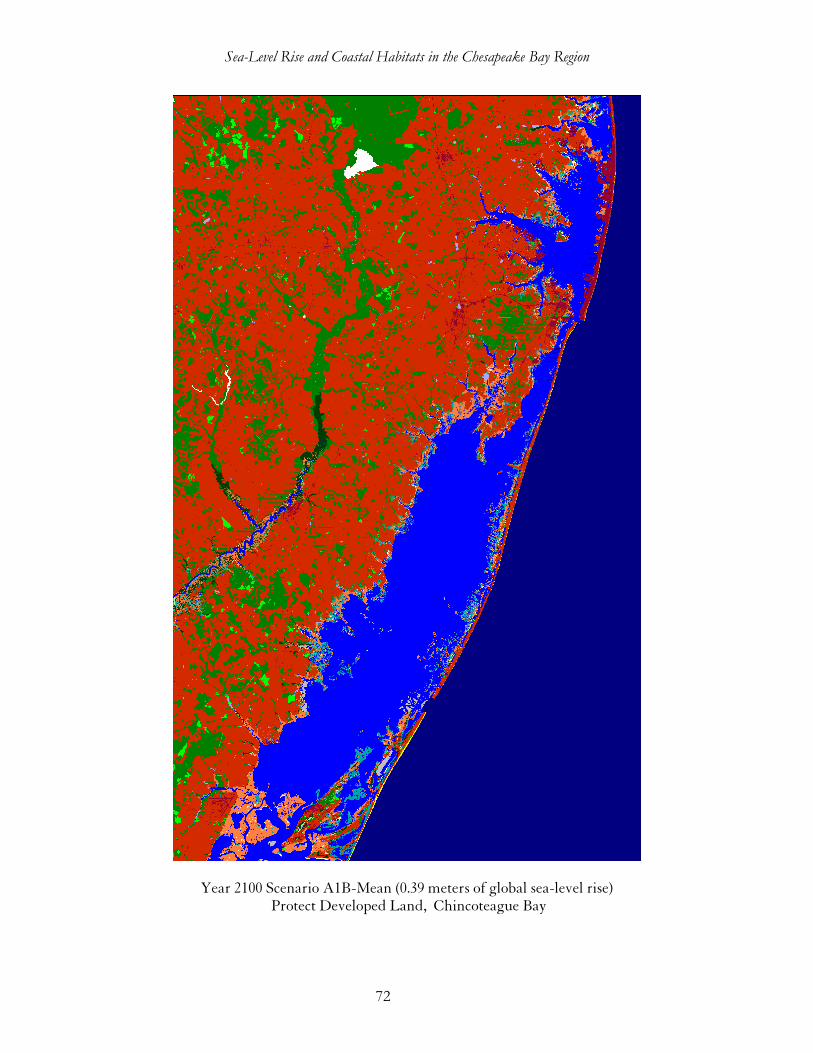
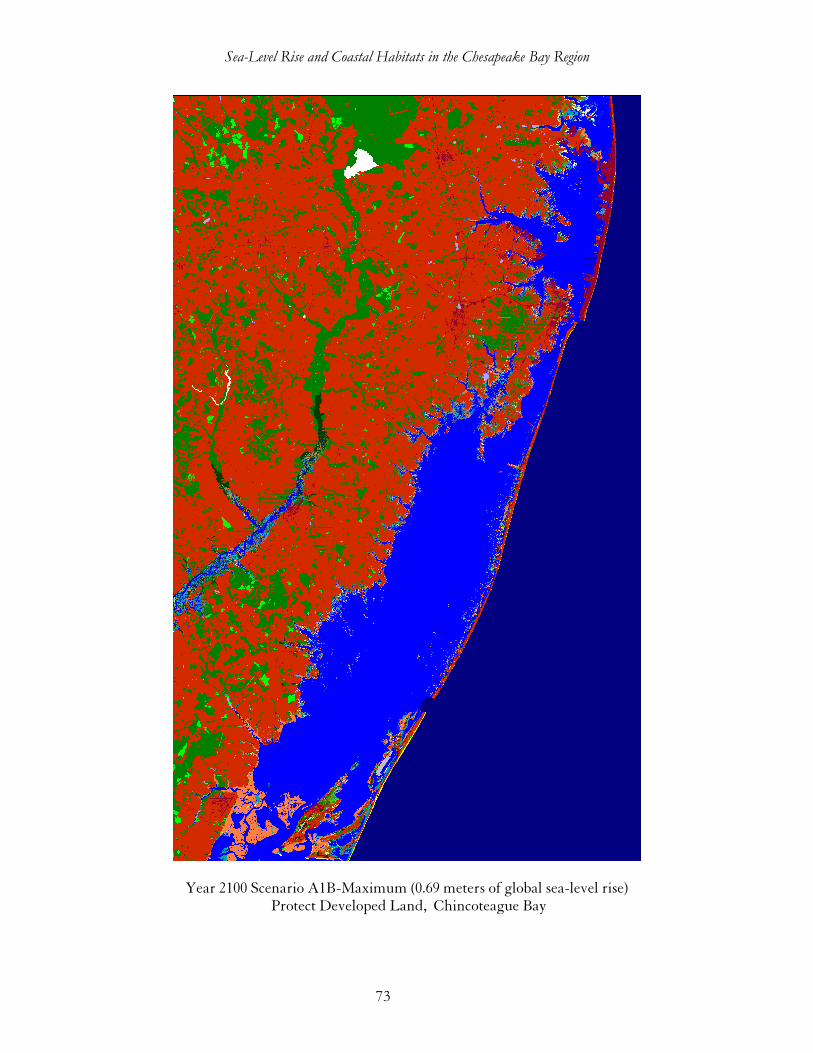
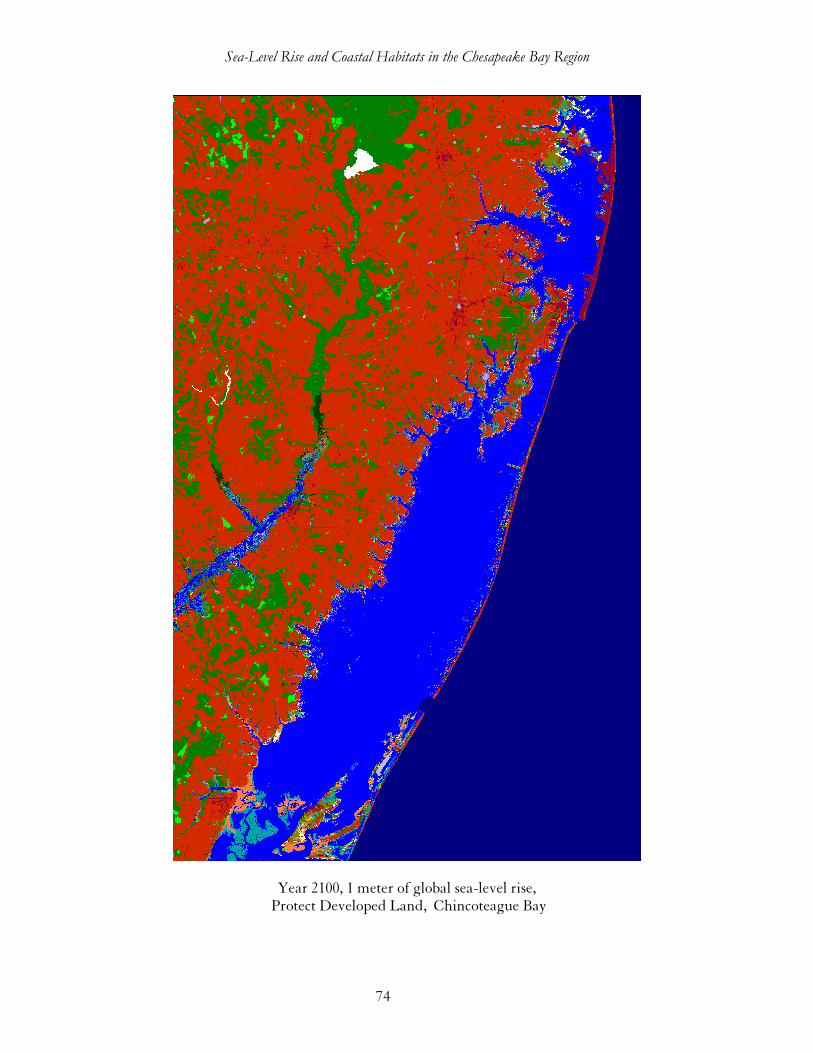
Site 8: Chincoteague Bay
The bay and ocean-side habitats of the Chincoteague Bay region support some of the region’s largest populations of migratory waterfowl, waterbirds, and shorebirds. And, as a designated National Seashore, Assateague Island has some of the most pristine beaches in the Mid-Atlantic region. A combination of overwash and inundation result in fairly significant effects of sea-level rise at this site. Inundation of marshes on the barrier islands and against the mainland are somewhat off-set by inundation of dry-land and conversion to marshes. For this reason, the maps tend considerably more dramatic than the tabular data. Losses of dry land range from 4-8%. What’s more, 15% of developed land would be lost given 50 cm of SLR and 52% of developed land would be inundated given 2 meters of SLR unless these lands were to be adequately protected.
Pct of Init. Cond Map
Init. Cond. (ha)
A1B-Mean Yr. 2100 (ha)
A1B-Mean Pct. Change
A1B-Max Pct. Change
1 Meter Pct. Change
Global SLR by 2100 (m) 0.387 0.387 0.694 1
Dry Land 48.5% 119,083 114,350 -4% -6% -8%Developed 1.3% 3,153 3,153 -0% -0% -0%Swamp 12.0% 29,398 30,795 5% 4% 4%Cypress Swamp 0.2% 470 470 0% 0% 0%Inland Fresh Marsh 0.7% 1,731 1,746 1% 0% -1%Tidal Fresh Marsh 0.0% 69 65 -7% -18% -30%Trans. Marsh 0.2% 380 1,028 171% 224% 401%Irregularly Flooded Marsh 4.3% 10,618 6,980 -34% -61% -80%Saltmarsh 0.4% 866 3,606 316% 235% 349%Estuarine Beach 1.6% 4,004 728 -82% -79% -69%Tidal Flat 0.4% 917 510 -44% -51% -31%Ocean Beach 0.1% 306 267 -13% -24% -85%Inland Open Water 0.3% 615 566 -8% -11% -15%Estuarine Open Water 15.1% 37,173 45,729 23% 39% 47%Open Ocean 13.5% 33,225 33,493 1% 1% 2%Inland Shore 0.0% 0 0 0% 0% 0%Tidal Swamp 1.2% 3,033 1,866 -38% -57% -71%Rocky Intertidal 0.0% 1 0 -71% -81% -93%Riverine Tidal 0.2% 371 58 -84% -90% -93%Tidal Creek 0.0% 8 8 0% 0% 0%
Sum of Categories (ha) 245,420 245,420
Sea-Level Rise and Coastal Habitats in the Chesapeake Bay Region
70
Chincoteague Bay Initial Condition compared with Year 2100 Under Scenario A1B-Max (69 cm Eustatic SLR)
Initial Condition
Estuarine Open Water
Dry Land
Year 2100
Dry LandSwampCypress SwampInland Fresh MarshTidal Fresh MarshTrans. MarshSaltmarshEstuarine BeachTidal FlatOcean BeachInland Open WaterEstuarine Open WaterOpen Ocean Irregularly Flooded MarshInland ShoreTidal SwampTall SpartinaRocky IntertidalRiverine TidalOcean FlatTidal CreekDeveloped
Saltmarsh
Trans. Marsh
Inland Fresh Marsh
Tidal Flat
Irregularly Flooded
Marsh
Inland Fresh Marsh
Sw amp
Estuarine Beach
Sea-Level Rise and Coastal Habitats in the Chesapeake Bay Region
71
Initial Condition Chincoteague Bay
Sea-Level Rise and Coastal Habitats in the Chesapeake Bay Region
72
Year 2100 Scenario A1B-Mean (0.39 meters of global sea-level rise) Protect Developed Land, Chincoteague Bay
Sea-Level Rise and Coastal Habitats in the Chesapeake Bay Region
73
Year 2100 Scenario A1B-Maximum (0.69 meters of global sea-level rise) Protect Developed Land, Chincoteague Bay
Sea-Level Rise and Coastal Habitats in the Chesapeake Bay Region
74
Year 2100, 1 meter of global sea-level rise, Protect Developed Land, Chincoteague Bay
Sea-Level Rise and Coastal Habitats in the Chesapeake Bay Region
75
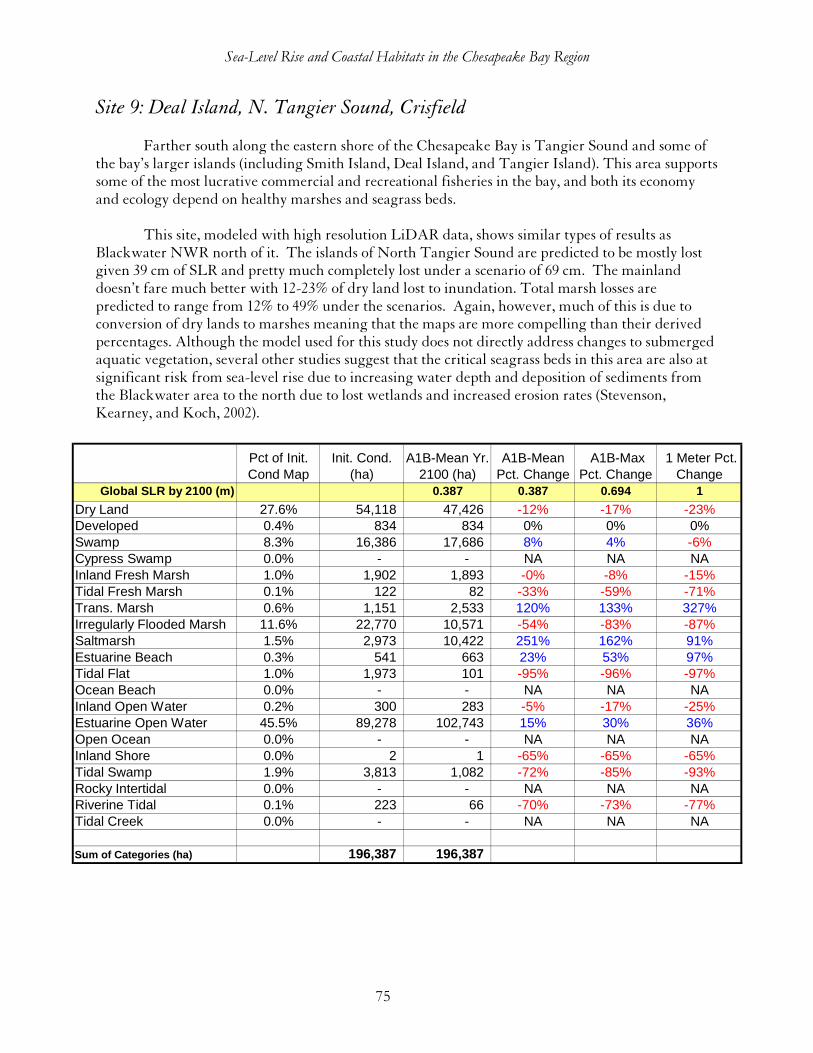
Site 9: Deal Island, N. Tangier Sound, Crisfield Farther south along the eastern shore of the Chesapeake Bay is Tangier Sound and some of
the bay’s larger islands (including Smith Island, Deal Island, and Tangier Island). This area supports some of the most lucrative commercial and recreational fisheries in the bay, and both its economy and ecology depend on healthy marshes and seagrass beds.
This site, modeled with high resolution LiDAR data, shows similar types of results as
Blackwater NWR north of it. The islands of North Tangier Sound are predicted to be mostly lost given 39 cm of SLR and pretty much completely lost under a scenario of 69 cm. The mainland doesn’t fare much better with 12-23% of dry land lost to inundation. Total marsh losses are predicted to range from 12% to 49% under the scenarios. Again, however, much of this is due to conversion of dry lands to marshes meaning that the maps are more compelling than their derived percentages. Although the model used for this study does not directly address changes to submerged aquatic vegetation, several other studies suggest that the critical seagrass beds in this area are also at significant risk from sea-level rise due to increasing water depth and deposition of sediments from the Blackwater area to the north due to lost wetlands and increased erosion rates (Stevenson, Kearney, and Koch, 2002).
Pct of Init. Cond Map
Init. Cond. (ha)
A1B-Mean Yr. 2100 (ha)
A1B-Mean Pct. Change
A1B-Max Pct. Change
1 Meter Pct. Change
Global SLR by 2100 (m) 0.387 0.387 0.694 1
Dry Land 27.6% 54,118 47,426 -12% -17% -23%Developed 0.4% 834 834 0% 0% 0%Swamp 8.3% 16,386 17,686 8% 4% -6%Cypress Swamp 0.0% - - NA NA NAInland Fresh Marsh 1.0% 1,902 1,893 -0% -8% -15%Tidal Fresh Marsh 0.1% 122 82 -33% -59% -71%Trans. Marsh 0.6% 1,151 2,533 120% 133% 327%Irregularly Flooded Marsh 11.6% 22,770 10,571 -54% -83% -87%Saltmarsh 1.5% 2,973 10,422 251% 162% 91%Estuarine Beach 0.3% 541 663 23% 53% 97%Tidal Flat 1.0% 1,973 101 -95% -96% -97%Ocean Beach 0.0% - - NA NA NAInland Open Water 0.2% 300 283 -5% -17% -25%Estuarine Open Water 45.5% 89,278 102,743 15% 30% 36%Open Ocean 0.0% - - NA NA NAInland Shore 0.0% 2 1 -65% -65% -65%Tidal Swamp 1.9% 3,813 1,082 -72% -85% -93%Rocky Intertidal 0.0% - - NA NA NARiverine Tidal 0.1% 223 66 -70% -73% -77%Tidal Creek 0.0% - - NA NA NA
Sum of Categories (ha) 196,387 196,387
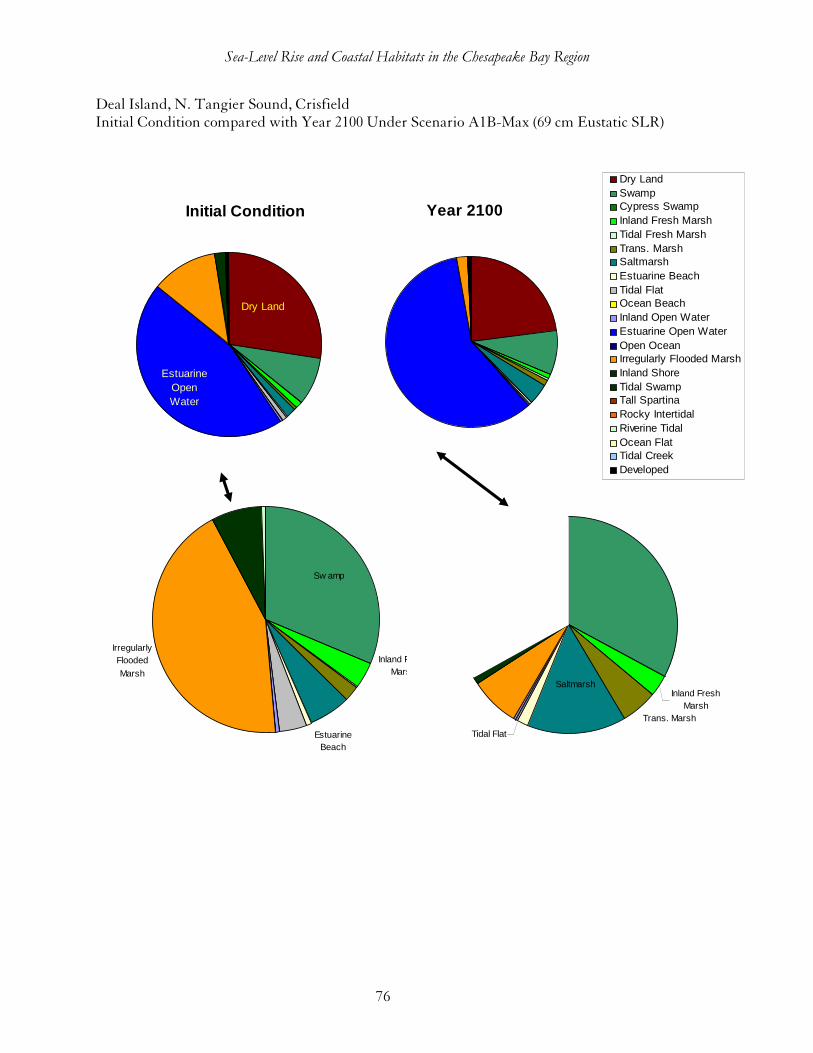
Sea-Level Rise and Coastal Habitats in the Chesapeake Bay Region
76
Deal Island, N. Tangier Sound, Crisfield Initial Condition compared with Year 2100 Under Scenario A1B-Max (69 cm Eustatic SLR)
Initial Condition
Estuarine Open Water
Dry Land
Year 2100
Dry LandSwampCypress SwampInland Fresh MarshTidal Fresh MarshTrans. MarshSaltmarshEstuarine BeachTidal FlatOcean BeachInland Open WaterEstuarine Open WaterOpen Ocean Irregularly Flooded MarshInland ShoreTidal SwampTall SpartinaRocky IntertidalRiverine TidalOcean FlatTidal CreekDeveloped
Saltmarsh
Trans. Marsh
Inland Fresh Marsh
Tidal Flat
Irregularly Flooded
Marsh
Inland Fresh Marsh
Sw amp
Estuarine Beach
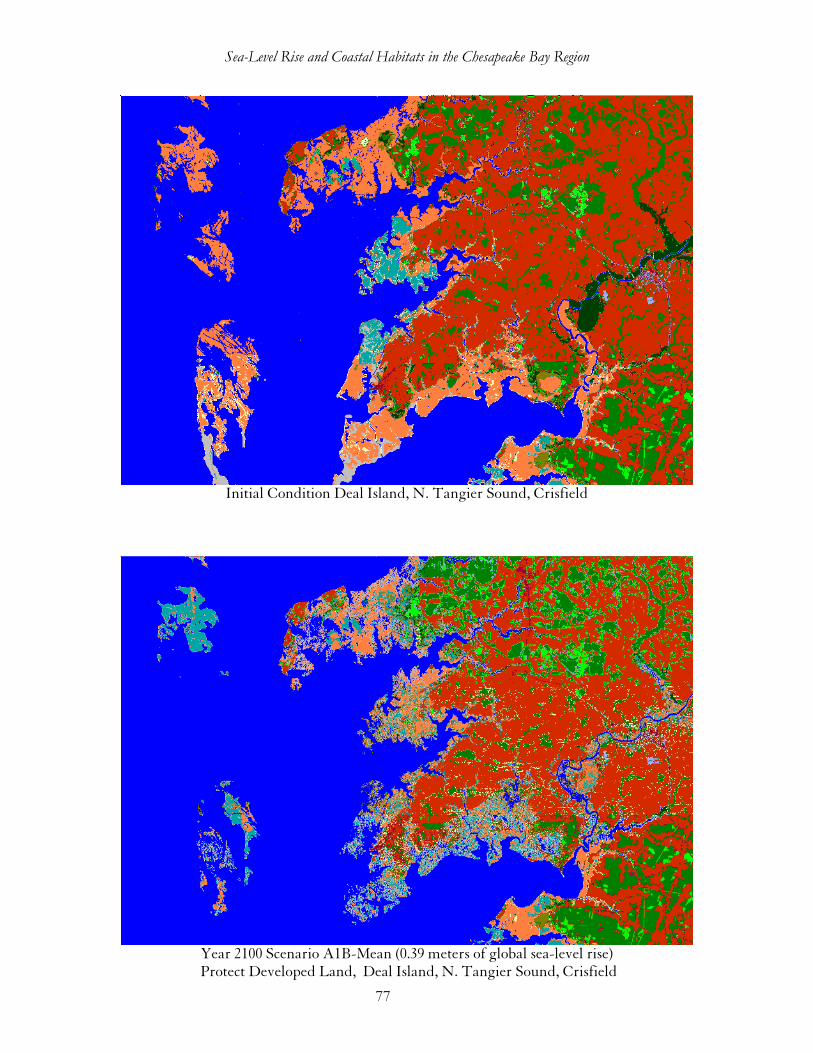
Sea-Level Rise and Coastal Habitats in the Chesapeake Bay Region
77
Initial Condition Deal Island, N. Tangier Sound, Crisfield
Year 2100 Scenario A1B-Mean (0.39 meters of global sea-level rise)
Protect Developed Land, Deal Island, N. Tangier Sound, Crisfield
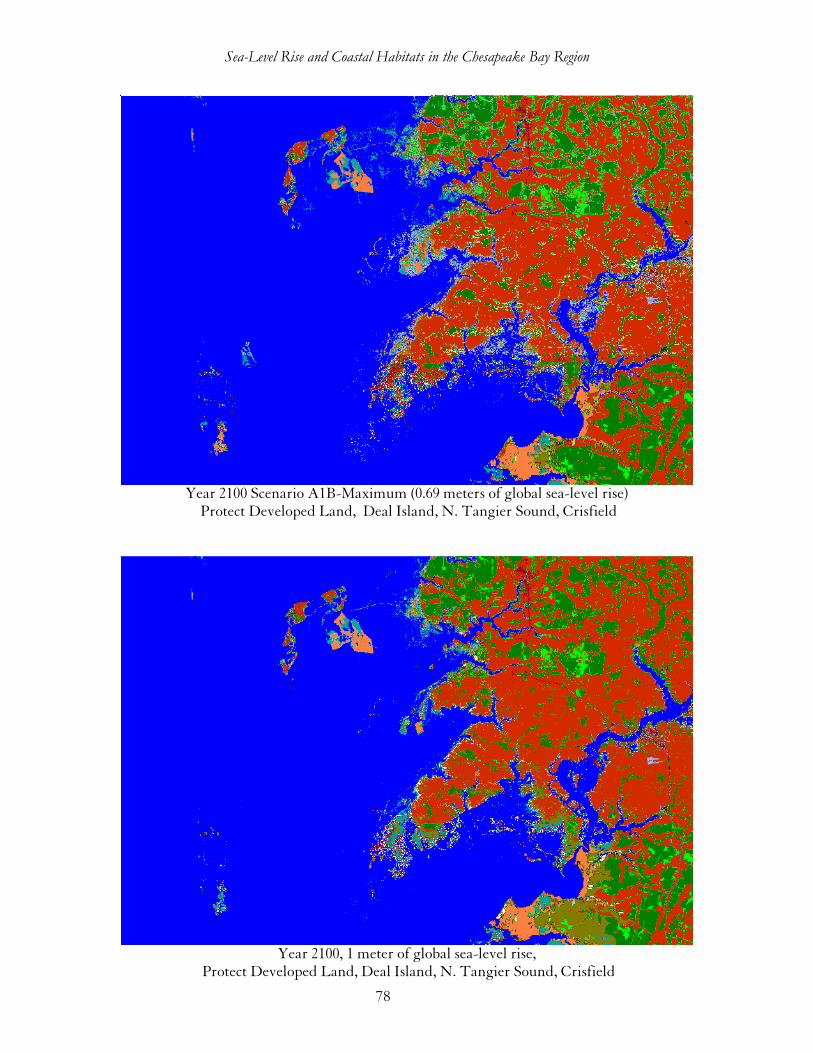
Sea-Level Rise and Coastal Habitats in the Chesapeake Bay Region
78
Year 2100 Scenario A1B-Maximum (0.69 meters of global sea-level rise)
Protect Developed Land, Deal Island, N. Tangier Sound, Crisfield
Year 2100, 1 meter of global sea-level rise,
Protect Developed Land, Deal Island, N. Tangier Sound, Crisfield
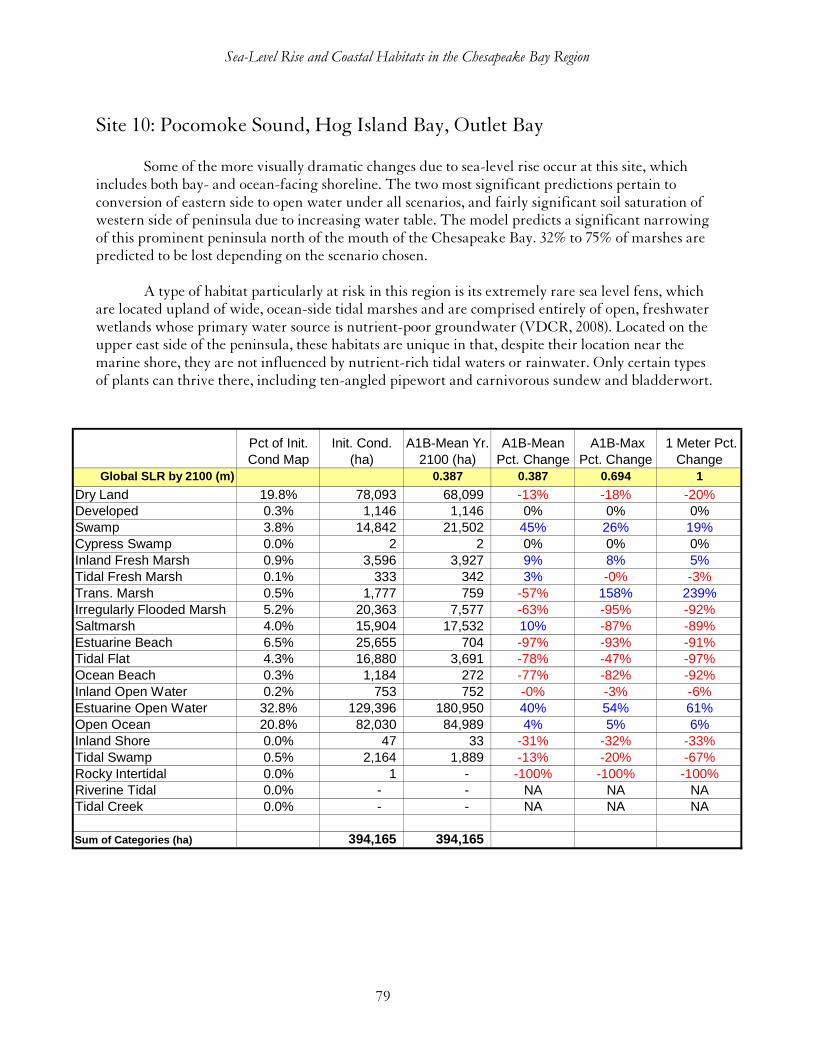
Sea-Level Rise and Coastal Habitats in the Chesapeake Bay Region
79
Site 10: Pocomoke Sound, Hog Island Bay, Outlet Bay
Some of the more visually dramatic changes due to sea-level rise occur at this site, which includes both bay- and ocean-facing shoreline. The two most significant predictions pertain to conversion of eastern side to open water under all scenarios, and fairly significant soil saturation of western side of peninsula due to increasing water table. The model predicts a significant narrowing of this prominent peninsula north of the mouth of the Chesapeake Bay. 32% to 75% of marshes are predicted to be lost depending on the scenario chosen.
A type of habitat particularly at risk in this region is its extremely rare sea level fens, which
are located upland of wide, ocean-side tidal marshes and are comprised entirely of open, freshwater wetlands whose primary water source is nutrient-poor groundwater (VDCR, 2008). Located on the upper east side of the peninsula, these habitats are unique in that, despite their location near the marine shore, they are not influenced by nutrient-rich tidal waters or rainwater. Only certain types of plants can thrive there, including ten-angled pipewort and carnivorous sundew and bladderwort.
Pct of Init. Cond Map
Init. Cond. (ha)
A1B-Mean Yr. 2100 (ha)
A1B-Mean Pct. Change
A1B-Max Pct. Change
1 Meter Pct. Change
Global SLR by 2100 (m) 0.387 0.387 0.694 1
Dry Land 19.8% 78,093 68,099 -13% -18% -20%Developed 0.3% 1,146 1,146 0% 0% 0%Swamp 3.8% 14,842 21,502 45% 26% 19%Cypress Swamp 0.0% 2 2 0% 0% 0%Inland Fresh Marsh 0.9% 3,596 3,927 9% 8% 5%Tidal Fresh Marsh 0.1% 333 342 3% -0% -3%Trans. Marsh 0.5% 1,777 759 -57% 158% 239%Irregularly Flooded Marsh 5.2% 20,363 7,577 -63% -95% -92%Saltmarsh 4.0% 15,904 17,532 10% -87% -89%Estuarine Beach 6.5% 25,655 704 -97% -93% -91%Tidal Flat 4.3% 16,880 3,691 -78% -47% -97%Ocean Beach 0.3% 1,184 272 -77% -82% -92%Inland Open Water 0.2% 753 752 -0% -3% -6%Estuarine Open Water 32.8% 129,396 180,950 40% 54% 61%Open Ocean 20.8% 82,030 84,989 4% 5% 6%Inland Shore 0.0% 47 33 -31% -32% -33%Tidal Swamp 0.5% 2,164 1,889 -13% -20% -67%Rocky Intertidal 0.0% 1 - -100% -100% -100%Riverine Tidal 0.0% - - NA NA NATidal Creek 0.0% - - NA NA NA
Sum of Categories (ha) 394,165 394,165
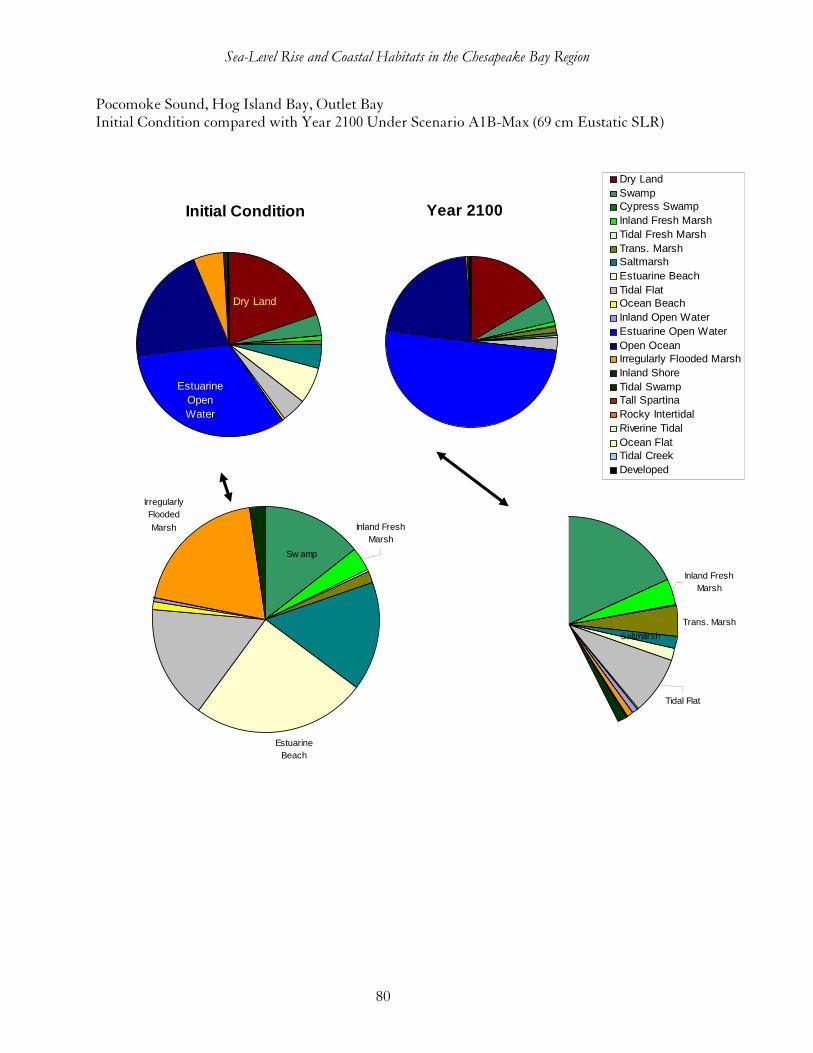
Sea-Level Rise and Coastal Habitats in the Chesapeake Bay Region
80
Pocomoke Sound, Hog Island Bay, Outlet Bay Initial Condition compared with Year 2100 Under Scenario A1B-Max (69 cm Eustatic SLR)
Initial Condition
Estuarine Open Water
Dry Land
Year 2100
Dry LandSwampCypress SwampInland Fresh MarshTidal Fresh MarshTrans. MarshSaltmarshEstuarine BeachTidal FlatOcean BeachInland Open WaterEstuarine Open WaterOpen Ocean Irregularly Flooded MarshInland ShoreTidal SwampTall SpartinaRocky IntertidalRiverine TidalOcean FlatTidal CreekDeveloped
Saltmarsh
Trans. Marsh
Inland Fresh Marsh
Tidal Flat
Irregularly Flooded
Marsh Inland Fresh Marsh
Sw amp
Estuarine Beach
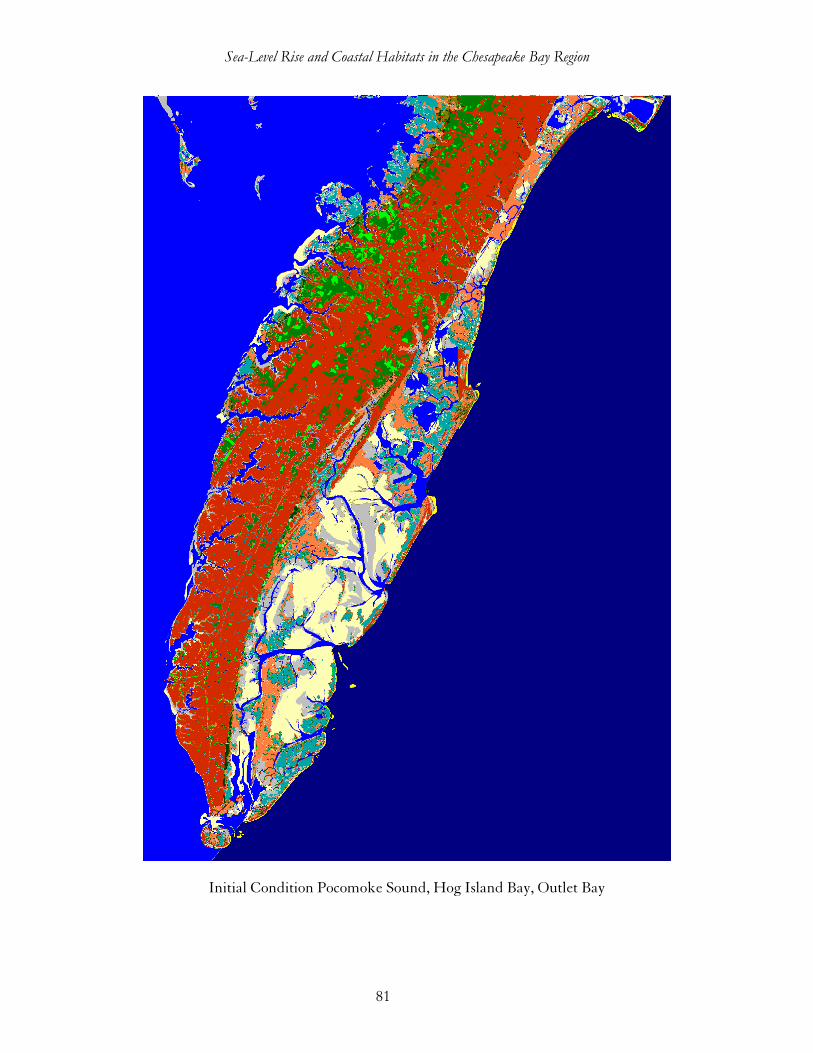
Sea-Level Rise and Coastal Habitats in the Chesapeake Bay Region
81
Initial Condition Pocomoke Sound, Hog Island Bay, Outlet Bay
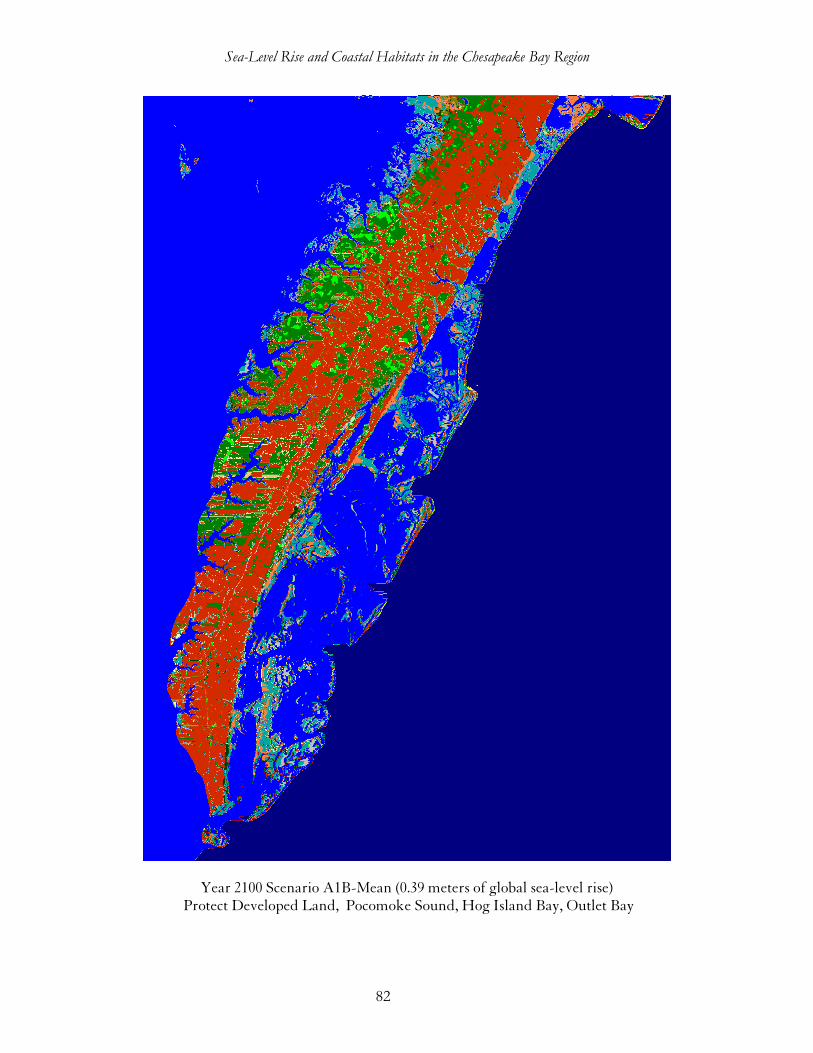
Sea-Level Rise and Coastal Habitats in the Chesapeake Bay Region
82
Year 2100 Scenario A1B-Mean (0.39 meters of global sea-level rise) Protect Developed Land, Pocomoke Sound, Hog Island Bay, Outlet Bay
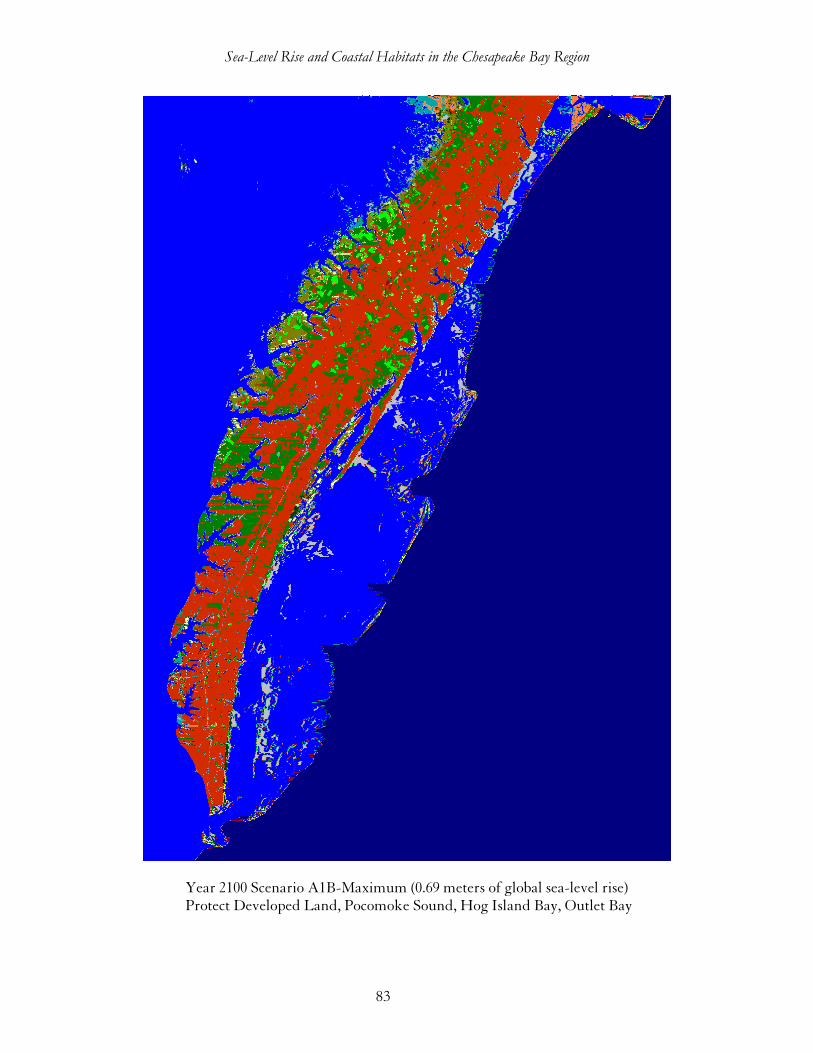
Sea-Level Rise and Coastal Habitats in the Chesapeake Bay Region
83
Year 2100 Scenario A1B-Maximum (0.69 meters of global sea-level rise) Protect Developed Land, Pocomoke Sound, Hog Island Bay, Outlet Bay
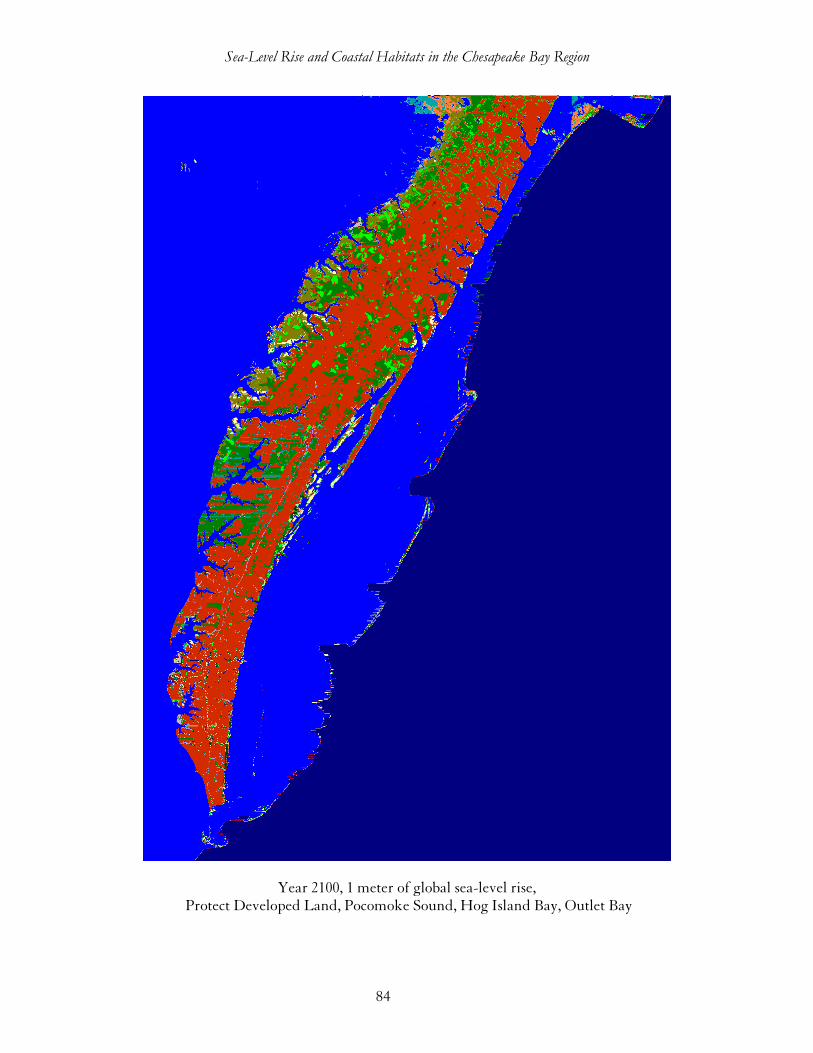
Sea-Level Rise and Coastal Habitats in the Chesapeake Bay Region
84
Year 2100, 1 meter of global sea-level rise, Protect Developed Land, Pocomoke Sound, Hog Island Bay, Outlet Bay
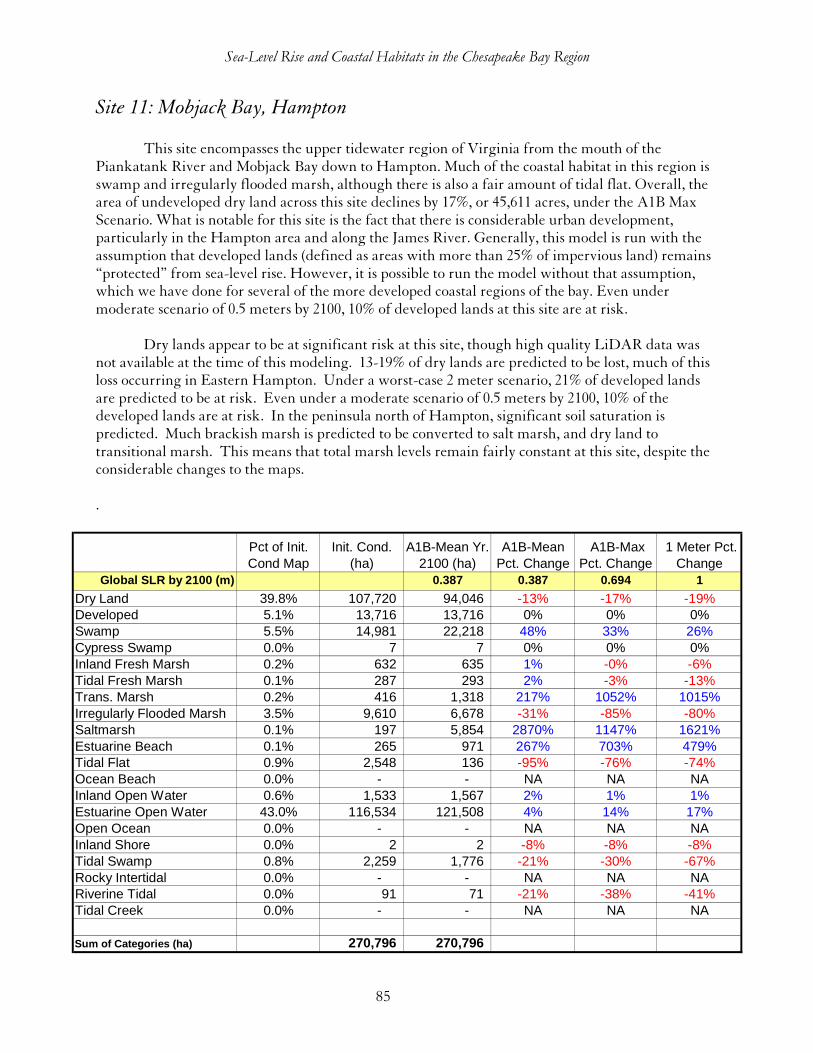
Sea-Level Rise and Coastal Habitats in the Chesapeake Bay Region
85
Site 11: Mobjack Bay, Hampton
This site encompasses the upper tidewater region of Virginia from the mouth of the Piankatank River and Mobjack Bay down to Hampton. Much of the coastal habitat in this region is swamp and irregularly flooded marsh, although there is also a fair amount of tidal flat. Overall, the area of undeveloped dry land across this site declines by 17%, or 45,611 acres, under the A1B Max Scenario. What is notable for this site is the fact that there is considerable urban development, particularly in the Hampton area and along the James River. Generally, this model is run with the assumption that developed lands (defined as areas with more than 25% of impervious land) remains “protected” from sea-level rise. However, it is possible to run the model without that assumption, which we have done for several of the more developed coastal regions of the bay. Even under moderate scenario of 0.5 meters by 2100, 10% of developed lands at this site are at risk.
Dry lands appear to be at significant risk at this site, though high quality LiDAR data was not available at the time of this modeling. 13-19% of dry lands are predicted to be lost, much of this loss occurring in Eastern Hampton. Under a worst-case 2 meter scenario, 21% of developed lands are predicted to be at risk. Even under a moderate scenario of 0.5 meters by 2100, 10% of the developed lands are at risk. In the peninsula north of Hampton, significant soil saturation is predicted. Much brackish marsh is predicted to be converted to salt marsh, and dry land to transitional marsh. This means that total marsh levels remain fairly constant at this site, despite the considerable changes to the maps.
.
Pct of Init. Cond Map
Init. Cond. (ha)
A1B-Mean Yr. 2100 (ha)
A1B-Mean Pct. Change
A1B-Max Pct. Change
1 Meter Pct. Change
Global SLR by 2100 (m) 0.387 0.387 0.694 1
Dry Land 39.8% 107,720 94,046 -13% -17% -19%Developed 5.1% 13,716 13,716 0% 0% 0%Swamp 5.5% 14,981 22,218 48% 33% 26%Cypress Swamp 0.0% 7 7 0% 0% 0%Inland Fresh Marsh 0.2% 632 635 1% -0% -6%Tidal Fresh Marsh 0.1% 287 293 2% -3% -13%Trans. Marsh 0.2% 416 1,318 217% 1052% 1015%Irregularly Flooded Marsh 3.5% 9,610 6,678 -31% -85% -80%Saltmarsh 0.1% 197 5,854 2870% 1147% 1621%Estuarine Beach 0.1% 265 971 267% 703% 479%Tidal Flat 0.9% 2,548 136 -95% -76% -74%Ocean Beach 0.0% - - NA NA NAInland Open Water 0.6% 1,533 1,567 2% 1% 1%Estuarine Open Water 43.0% 116,534 121,508 4% 14% 17%Open Ocean 0.0% - - NA NA NAInland Shore 0.0% 2 2 -8% -8% -8%Tidal Swamp 0.8% 2,259 1,776 -21% -30% -67%Rocky Intertidal 0.0% - - NA NA NARiverine Tidal 0.0% 91 71 -21% -38% -41%Tidal Creek 0.0% - - NA NA NA
Sum of Categories (ha) 270,796 270,796
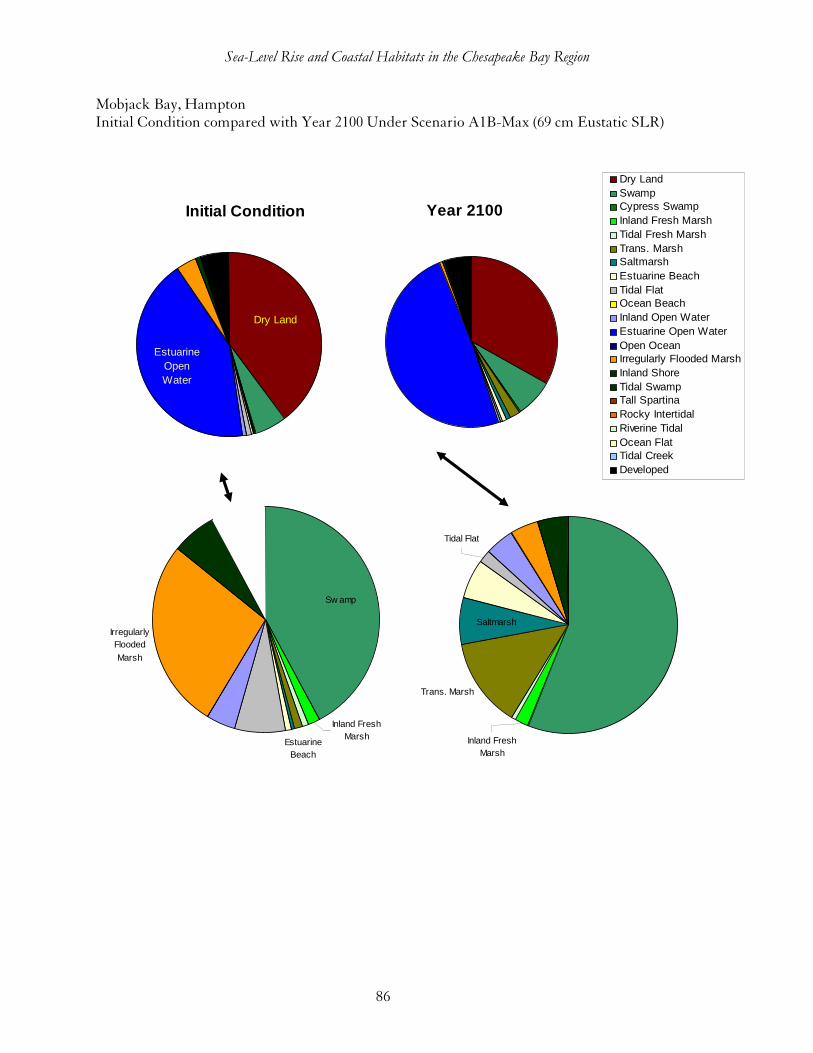
Sea-Level Rise and Coastal Habitats in the Chesapeake Bay Region
86
Mobjack Bay, Hampton Initial Condition compared with Year 2100 Under Scenario A1B-Max (69 cm Eustatic SLR)
Initial Condition
Estuarine Open Water
Dry Land
Year 2100
Dry LandSwampCypress SwampInland Fresh MarshTidal Fresh MarshTrans. MarshSaltmarshEstuarine BeachTidal FlatOcean BeachInland Open WaterEstuarine Open WaterOpen Ocean Irregularly Flooded MarshInland ShoreTidal SwampTall SpartinaRocky IntertidalRiverine TidalOcean FlatTidal CreekDeveloped
Saltmarsh
Trans. Marsh
Inland Fresh Marsh
Tidal Flat
Irregularly Flooded
Marsh
Inland Fresh Marsh
Sw amp
Estuarine Beach
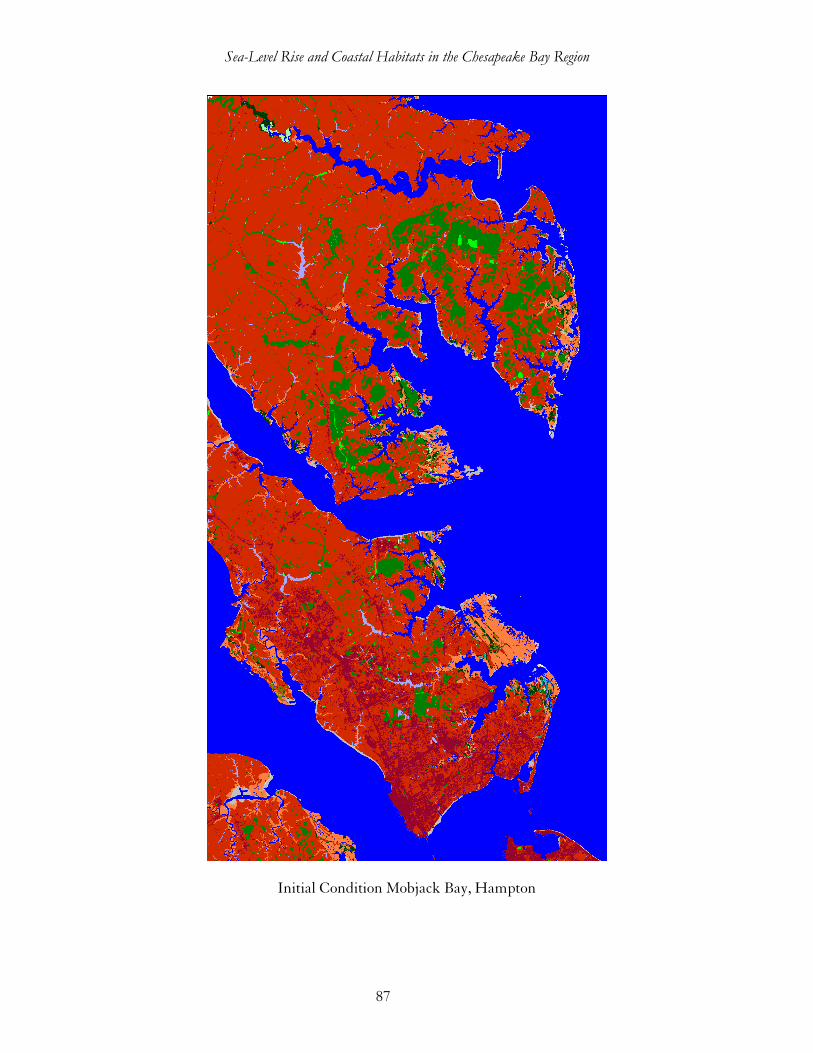
Sea-Level Rise and Coastal Habitats in the Chesapeake Bay Region
87
Initial Condition Mobjack Bay, Hampton
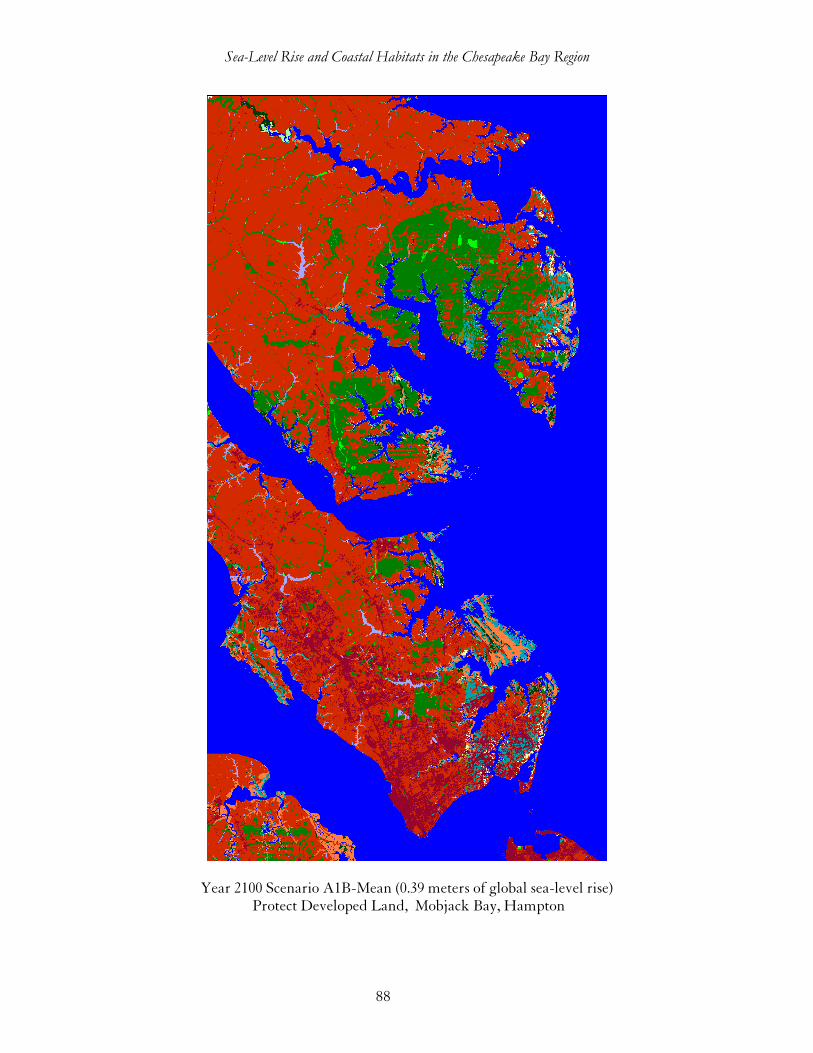
Sea-Level Rise and Coastal Habitats in the Chesapeake Bay Region
88
Year 2100 Scenario A1B-Mean (0.39 meters of global sea-level rise) Protect Developed Land, Mobjack Bay, Hampton
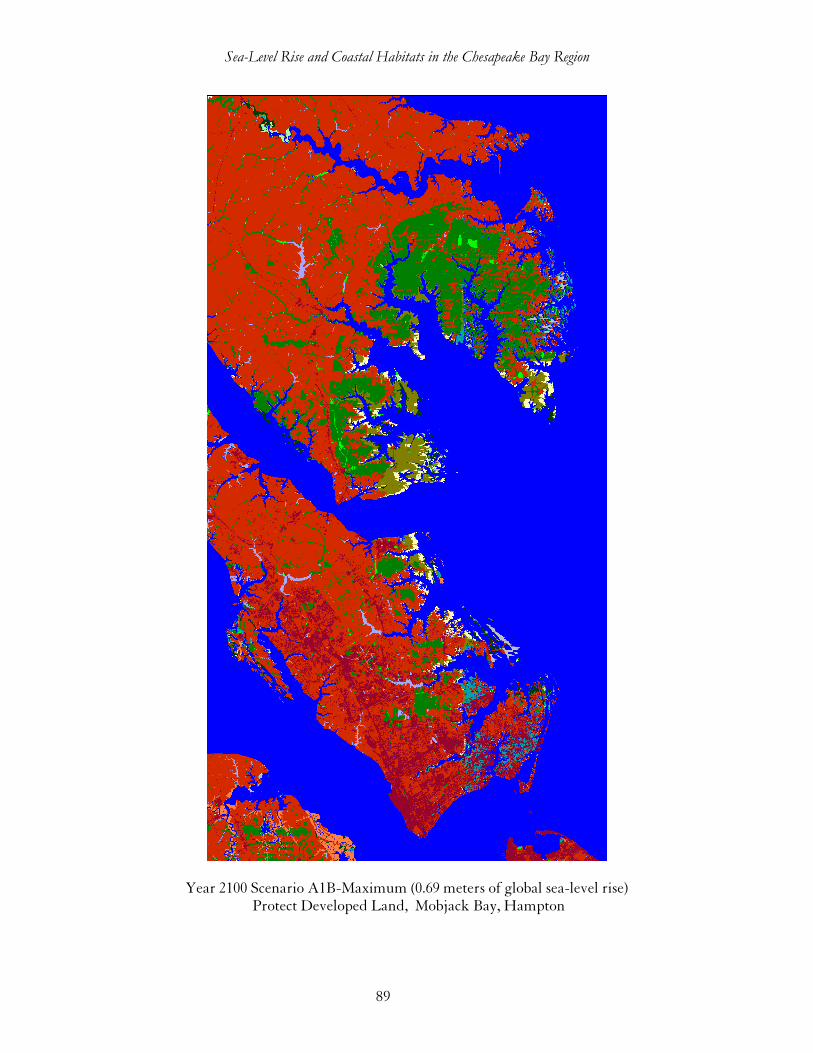
Sea-Level Rise and Coastal Habitats in the Chesapeake Bay Region
89
Year 2100 Scenario A1B-Maximum (0.69 meters of global sea-level rise) Protect Developed Land, Mobjack Bay, Hampton
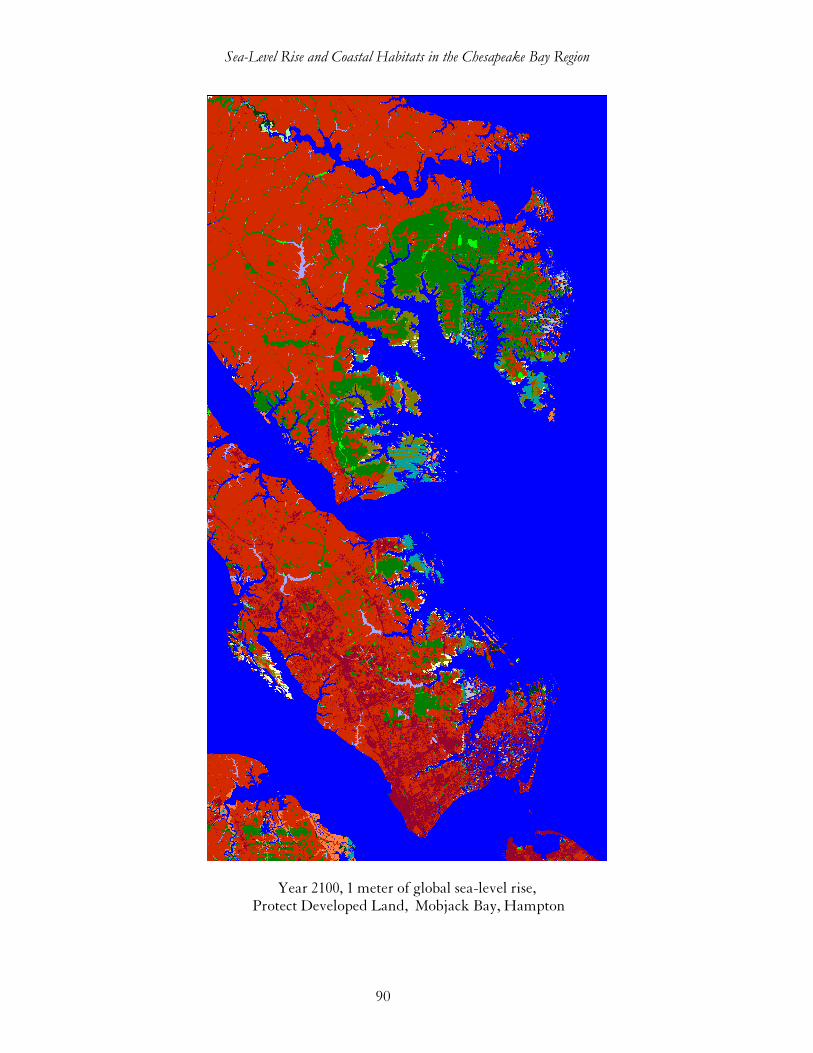
Sea-Level Rise and Coastal Habitats in the Chesapeake Bay Region
90
Year 2100, 1 meter of global sea-level rise, Protect Developed Land, Mobjack Bay, Hampton
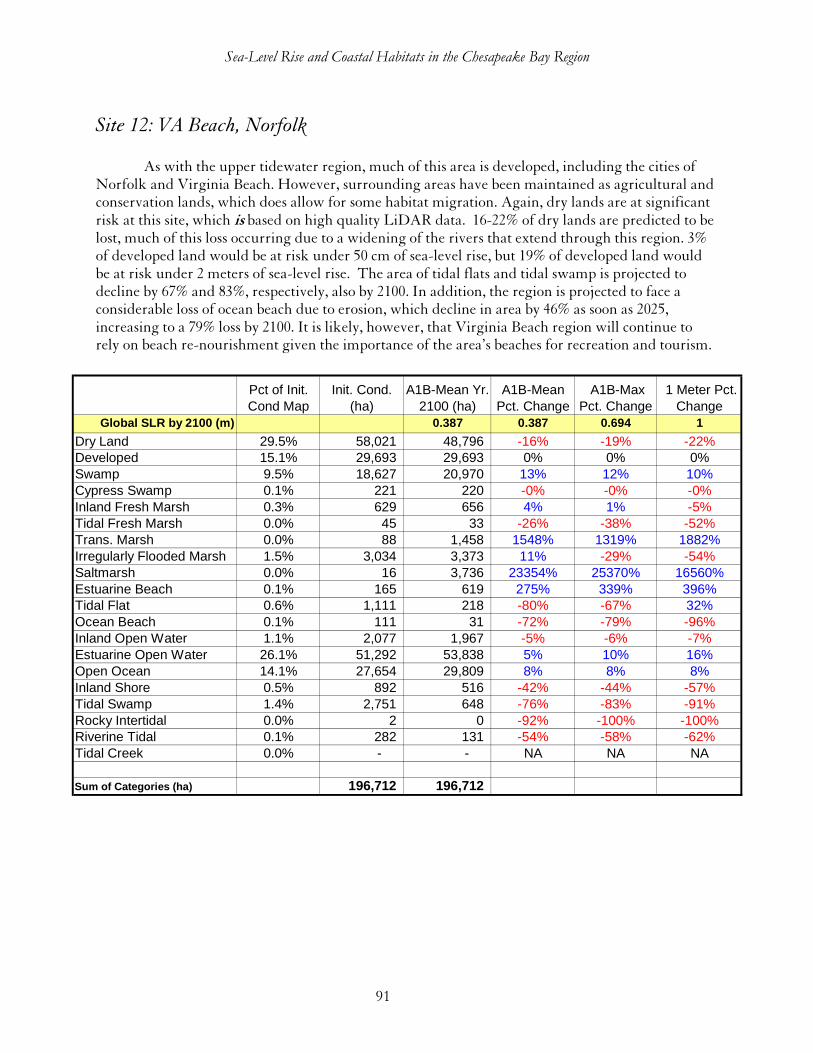
Sea-Level Rise and Coastal Habitats in the Chesapeake Bay Region
91
Site 12: VA Beach, Norfolk
As with the upper tidewater region, much of this area is developed, including the cities of Norfolk and Virginia Beach. However, surrounding areas have been maintained as agricultural and conservation lands, which does allow for some habitat migration. Again, dry lands are at significant risk at this site, which is based on high quality LiDAR data. 16-22% of dry lands are predicted to be lost, much of this loss occurring due to a widening of the rivers that extend through this region. 3% of developed land would be at risk under 50 cm of sea-level rise, but 19% of developed land would be at risk under 2 meters of sea-level rise. The area of tidal flats and tidal swamp is projected to decline by 67% and 83%, respectively, also by 2100. In addition, the region is projected to face a considerable loss of ocean beach due to erosion, which decline in area by 46% as soon as 2025, increasing to a 79% loss by 2100. It is likely, however, that Virginia Beach region will continue to rely on beach re-nourishment given the importance of the area’s beaches for recreation and tourism.
Pct of Init. Cond Map
Init. Cond. (ha)
A1B-Mean Yr. 2100 (ha)
A1B-Mean Pct. Change
A1B-Max Pct. Change
1 Meter Pct. Change
Global SLR by 2100 (m) 0.387 0.387 0.694 1
Dry Land 29.5% 58,021 48,796 -16% -19% -22%Developed 15.1% 29,693 29,693 0% 0% 0%Swamp 9.5% 18,627 20,970 13% 12% 10%Cypress Swamp 0.1% 221 220 -0% -0% -0%Inland Fresh Marsh 0.3% 629 656 4% 1% -5%Tidal Fresh Marsh 0.0% 45 33 -26% -38% -52%Trans. Marsh 0.0% 88 1,458 1548% 1319% 1882%Irregularly Flooded Marsh 1.5% 3,034 3,373 11% -29% -54%Saltmarsh 0.0% 16 3,736 23354% 25370% 16560%Estuarine Beach 0.1% 165 619 275% 339% 396%Tidal Flat 0.6% 1,111 218 -80% -67% 32%Ocean Beach 0.1% 111 31 -72% -79% -96%Inland Open Water 1.1% 2,077 1,967 -5% -6% -7%Estuarine Open Water 26.1% 51,292 53,838 5% 10% 16%Open Ocean 14.1% 27,654 29,809 8% 8% 8%Inland Shore 0.5% 892 516 -42% -44% -57%Tidal Swamp 1.4% 2,751 648 -76% -83% -91%Rocky Intertidal 0.0% 2 0 -92% -100% -100%Riverine Tidal 0.1% 282 131 -54% -58% -62%Tidal Creek 0.0% - - NA NA NA
Sum of Categories (ha) 196,712 196,712
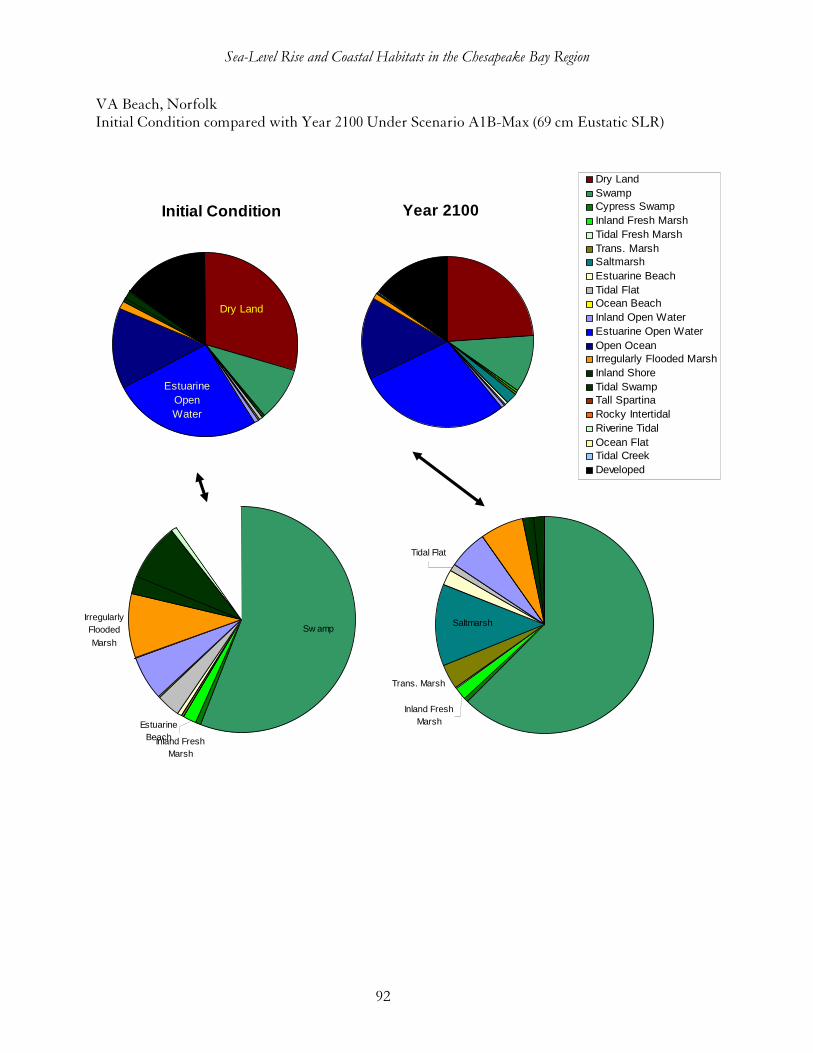
Sea-Level Rise and Coastal Habitats in the Chesapeake Bay Region
92
VA Beach, Norfolk Initial Condition compared with Year 2100 Under Scenario A1B-Max (69 cm Eustatic SLR)
Initial Condition
Estuarine Open Water
Dry Land
Year 2100
Dry LandSwampCypress SwampInland Fresh MarshTidal Fresh MarshTrans. MarshSaltmarshEstuarine BeachTidal FlatOcean BeachInland Open WaterEstuarine Open WaterOpen Ocean Irregularly Flooded MarshInland ShoreTidal SwampTall SpartinaRocky IntertidalRiverine TidalOcean FlatTidal CreekDeveloped
Saltmarsh
Trans. Marsh
Inland Fresh Marsh
Tidal Flat
Irregularly Flooded
Marsh
Inland Fresh Marsh
Sw amp
Estuarine Beach
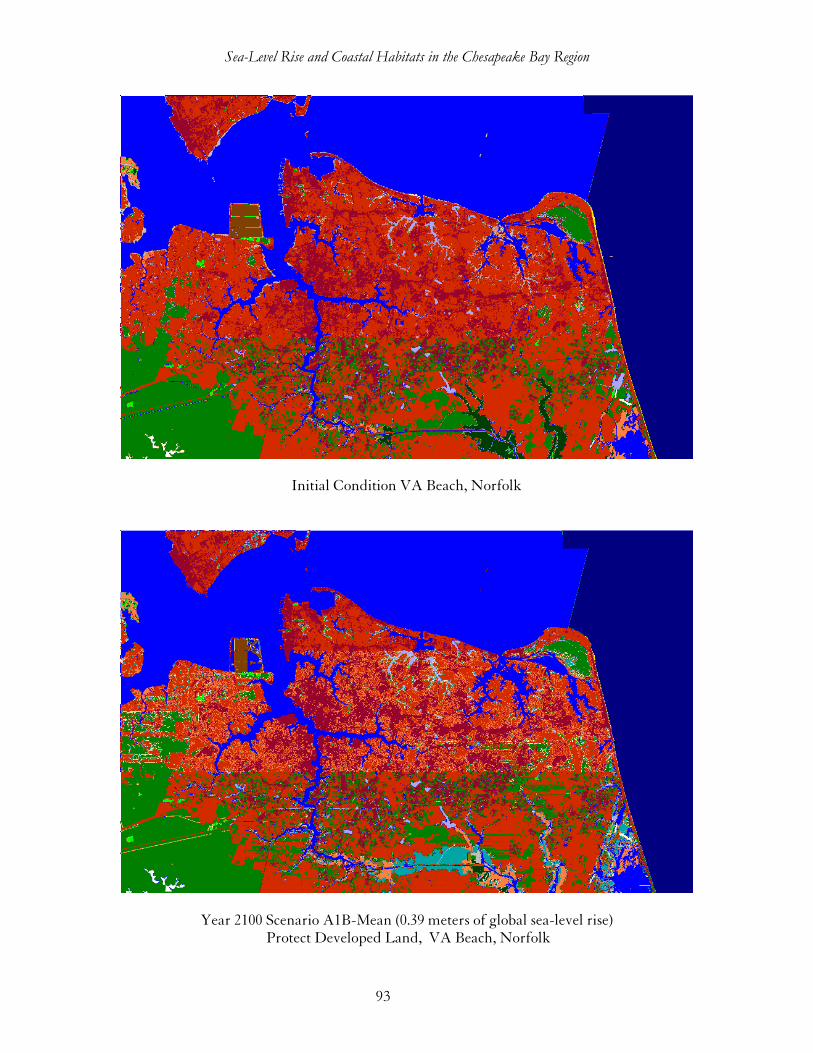
Sea-Level Rise and Coastal Habitats in the Chesapeake Bay Region
93
Initial Condition VA Beach, Norfolk
Year 2100 Scenario A1B-Mean (0.39 meters of global sea-level rise) Protect Developed Land, VA Beach, Norfolk
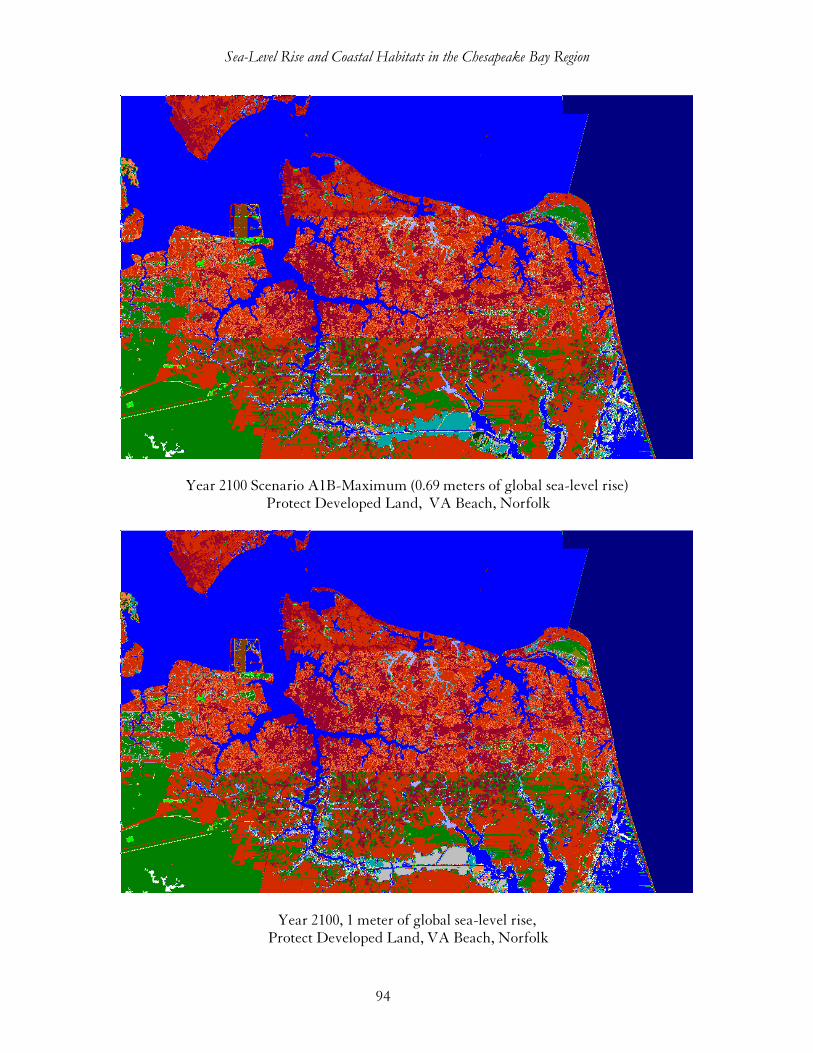
Sea-Level Rise and Coastal Habitats in the Chesapeake Bay Region
94
Year 2100 Scenario A1B-Maximum (0.69 meters of global sea-level rise) Protect Developed Land, VA Beach, Norfolk
Year 2100, 1 meter of global sea-level rise, Protect Developed Land, VA Beach, Norfolk
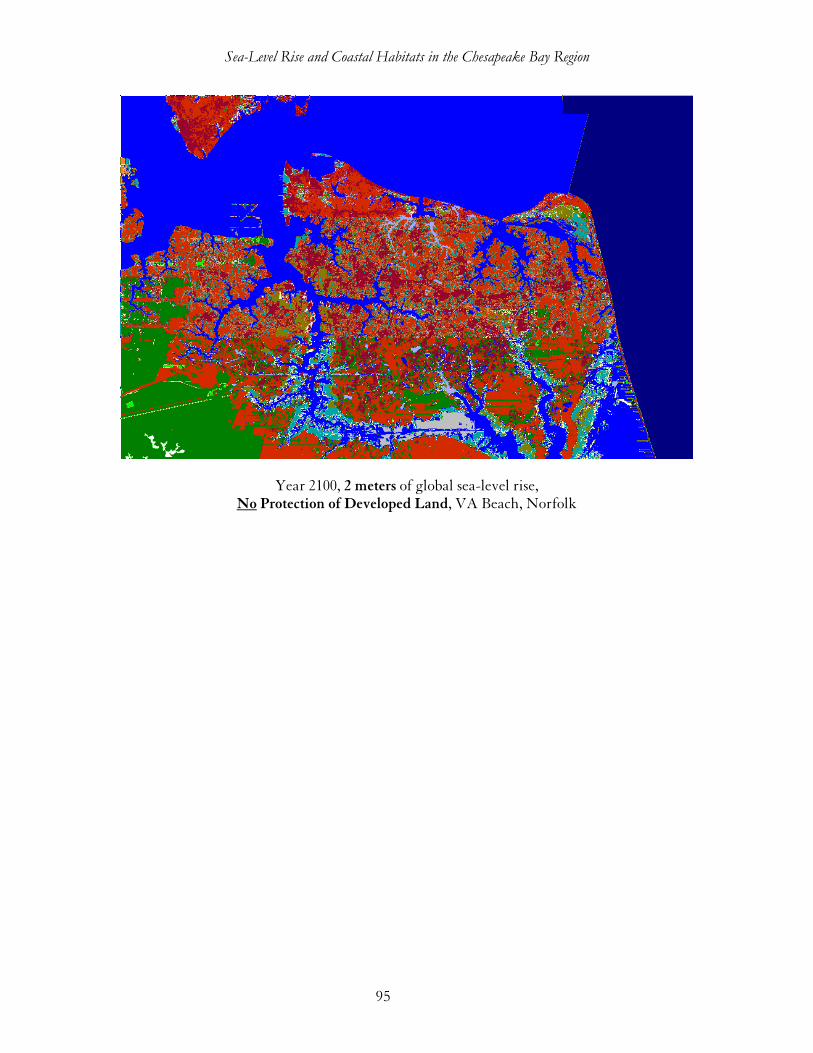
Sea-Level Rise and Coastal Habitats in the Chesapeake Bay Region
95
Year 2100, 2 meters of global sea-level rise, No Protection of Developed Land, VA Beach, Norfolk
Sea-Level Rise and Coastal Habitats in the Chesapeake Bay Region
96
Model Parameterization
Historical Sea-Level Rise
To best estimate future local sea levels, local effects must be accounted for rather than simply using projected eustatic sea levels. Normally in SLAMM modeling, this is accomplished by adding the local historic sea level rate to projected global sea levels and subtracting the historical global sea level rate.
( )( )1000
0 GlobalLocalTTModelTModelTModel
RHistoricSLRHistoricSLYearYear + GlobalSLR = SLR
−−
where: SLR
TModel = Projected sea-level rise at current model year (m);
GlobalSLRTModel
= Global average sea-level rise predicted in current model year (m); Year
TModel = Current model year;
YearT0
= Date when model started (latest NWI photo date); HistoricSLR
Local = Site specific historic trend of sea-level rise (mm/yr);
HistoricSLRGlobal
= 1.5 mm/yr global historic trend 1000 = (mm/m).
The above equation assumes that the differential between the local rate of sea-level rise and the global rate will remain constant. In the case of Chesapeake Bay, more detailed information is available from Dr. Victoria Coles of University of Maryland. Projected sea level anomalies are available through 2100 (see figure P-1 below). This indicates that adding 0.5 mm/year to eustatic trends is preferable to using an uncorrected eustatic sea-level rise. To capture this difference, the following adjusted equation is used in the application of SLAMM to Chesapeake Bay.
( )( )1000
mm/yr0.10 −− LocalTTModelTModelTModel
RHistoricSLYearYear + GlobalSLR = SLR
Historical sea-level rise is available from long-term monitoring from NOAA tide gages (Figure P-2 below). Gages that started monitoring after 1965 were removed as the long-term trend is not adequately represented in that shorter time-period.
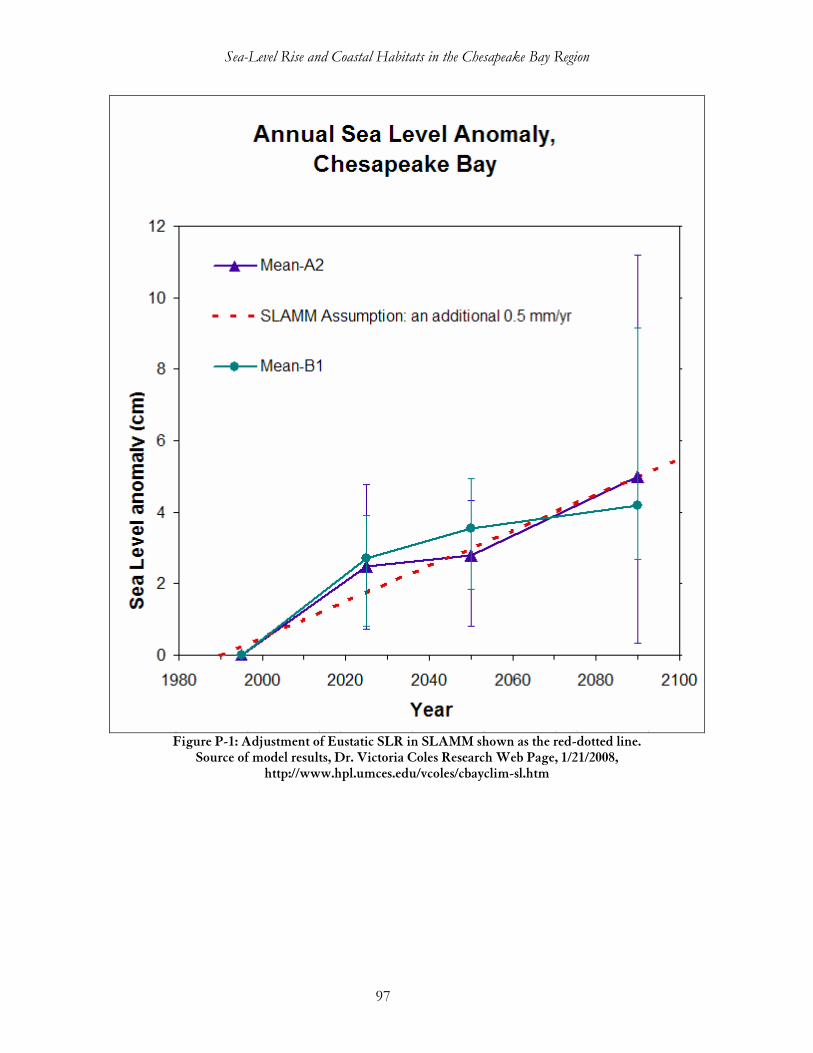
Sea-Level Rise and Coastal Habitats in the Chesapeake Bay Region
97
Figure P-1: Adjustment of Eustatic SLR in SLAMM shown as the red-dotted line.
Source of model results, Dr. Victoria Coles Research Web Page, 1/21/2008, http://www.hpl.umces.edu/vcoles/cbayclim-sl.htm
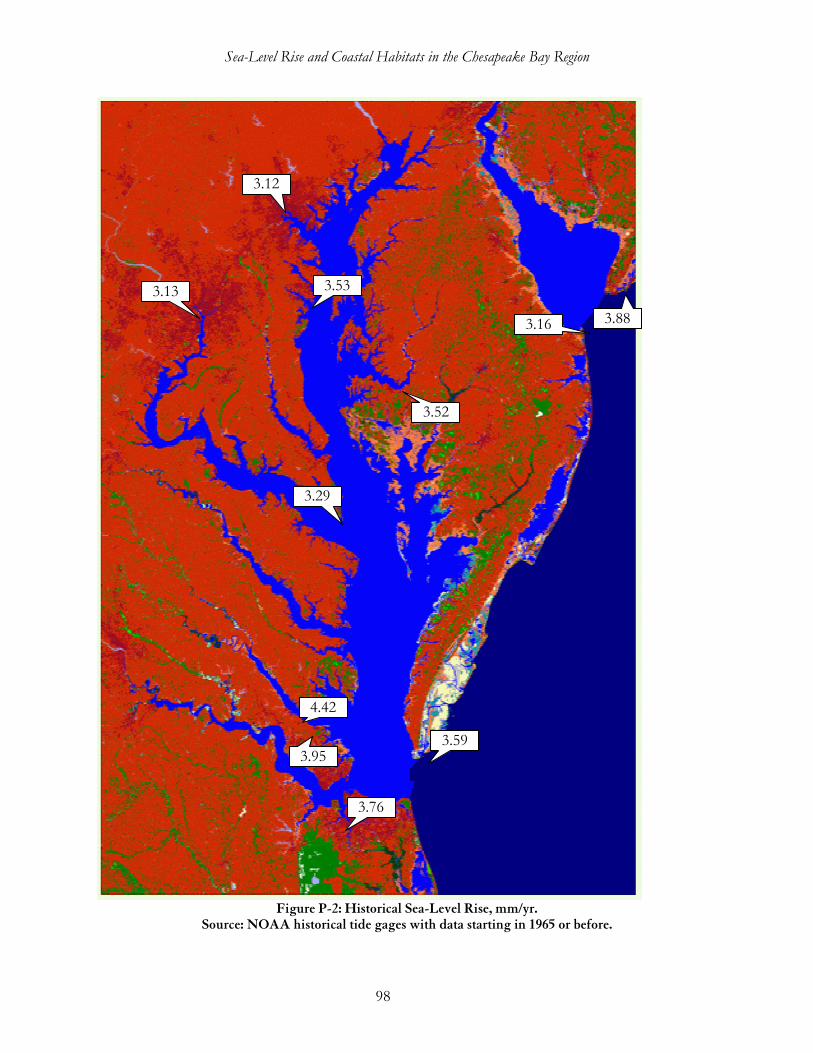
Sea-Level Rise and Coastal Habitats in the Chesapeake Bay Region
98
Figure P-2: Historical Sea-Level Rise, mm/yr.
Source: NOAA historical tide gages with data starting in 1965 or before.
4.42
3.95
3.88
3.76
3.59
3.53
3.52
3.29
3.16
3.13
3.12
Sea-Level Rise and Coastal Habitats in the Chesapeake Bay Region
99
Historical sea-level rise was distributed throughout the modeling sub-sites as shown at the end of this document (Figure P-11 and parameter tables.) For the most part, historical trends were based on direct gage readings or interpolated between gages. For Cambridge, MD and the Blackwater NWR, historical trends were slightly adjusted upward from the gage at that location. The gage indicates a historical trend of 3.52 mm/year and for this modeling effort we used 4 mm/year for sub-site nine (which includes the Blackwater NWR).
There are several lines of evidence that suggest that this slight adjustment is warranted, and may, in fact, be conservative.
• Many scientists attribute dramatic losses of marshes at Blackwater to be due to more rapid subsidence due to groundwater withdrawals to support the surrounding agriculture. (Scientific Review of the Prescribed Fire Program at Blackwater National Wildlife Refuge, 2005) There was not consensus about this at the conference, however.
3
• Stevenson, Rooth, Sundberg, and Kearney (2002) have the following observation: "Analysis using digitized photography has revealed that marshes are being lost more rapidly in the northern than southern sections of Blackwater. The former is closest to the center of a large cone of depression in the most important underlying aquifer in the region. The groundwater withdrawals at Cambridge correspond to a rapid rise in sea level which appears to be two to three times the present global rate of 1 to 2 mm yr"
• Some papers in the literature suggest a historical sea-level rise of 9mm/year in Cambridge, MD (Nerem & Schenewerk, 1997) (Boesch, D.R., Greer, J., Eds., 2003, p 33)
• Based on a short time-period, GPS readings at Cambridge MD have suggested a land subsidence of 5.2 mm/year (Nerem & Schenewerk, 1997). This would be additive to the eustatic sea level trend to get an overall historic rate of sea-level rise in Cambridge.
USGS investigations of subsidence rates are currently in progress in and around the Blackwater NWR (http://www.ngs.noaa.gov/PROJECTS/INSTRUCTIONS/restoration/MD-Blackwater.pdf). Estimates of historical sea-level rise will undoubtedly be improved when these results become available. If spatial trends become clear from these data, historical sea-level rises can be distributed on a finer spatial scale as well.
In the meantime, given the likelihood of additional subsidence, but also the uncertainty surrounding the amount of such subsidence, a small upward adjustment of sea level rates from 3.52 to 4 mm/year in this region seems warranted and fairly conservative.
3 “The effects of subsidence induced by groundwater withdrawals was disputed by Curt Larson (NOAA) who presented evidence to the Panel that relative sea-level rise rates were similar at Solomons and Cambridge." Scientific Review . . ., 2005)
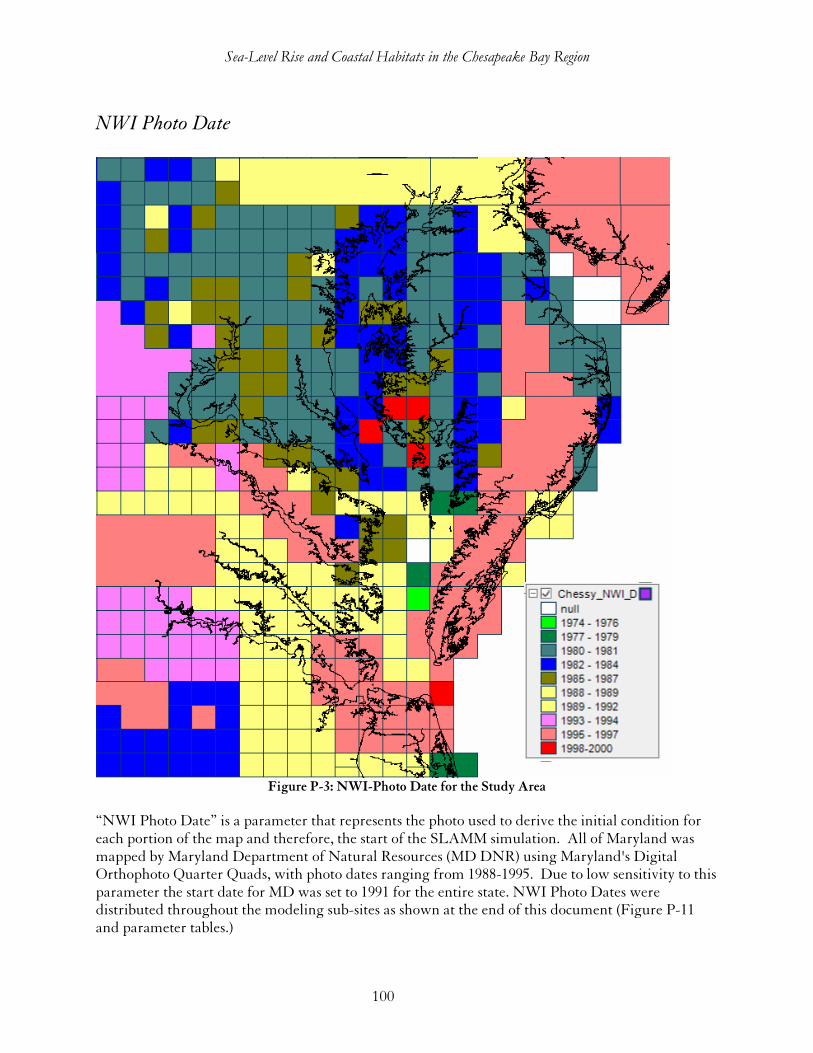
Sea-Level Rise and Coastal Habitats in the Chesapeake Bay Region
100
NWI Photo Date
Figure P-3: NWI-Photo Date for the Study Area
“NWI Photo Date” is a parameter that represents the photo used to derive the initial condition for each portion of the map and therefore, the start of the SLAMM simulation. All of Maryland was mapped by Maryland Department of Natural Resources (MD DNR) using Maryland's Digital Orthophoto Quarter Quads, with photo dates ranging from 1988-1995. Due to low sensitivity to this parameter the start date for MD was set to 1991 for the entire state. NWI Photo Dates were distributed throughout the modeling sub-sites as shown at the end of this document (Figure P-11 and parameter tables.)
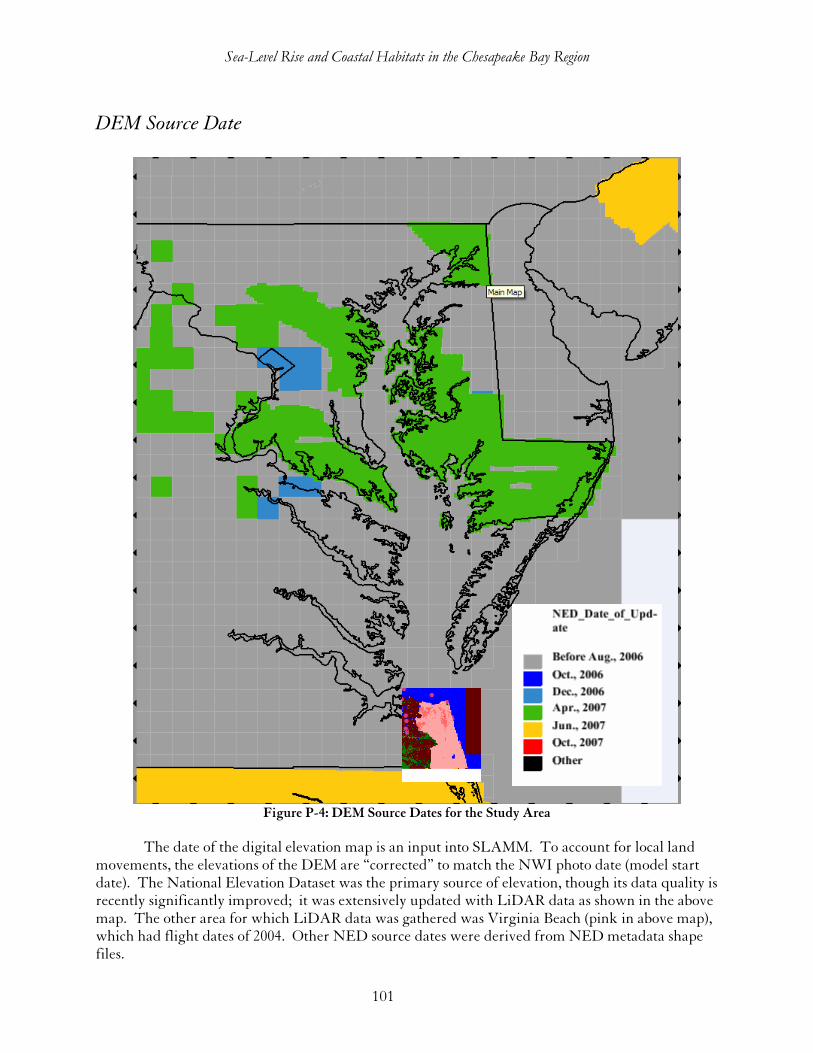
Sea-Level Rise and Coastal Habitats in the Chesapeake Bay Region
101
DEM Source Date
Figure P-4: DEM Source Dates for the Study Area
The date of the digital elevation map is an input into SLAMM. To account for local land
movements, the elevations of the DEM are “corrected” to match the NWI photo date (model start date). The National Elevation Dataset was the primary source of elevation, though its data quality is recently significantly improved; it was extensively updated with LiDAR data as shown in the above map. The other area for which LiDAR data was gathered was Virginia Beach (pink in above map), which had flight dates of 2004. Other NED source dates were derived from NED metadata shape files.
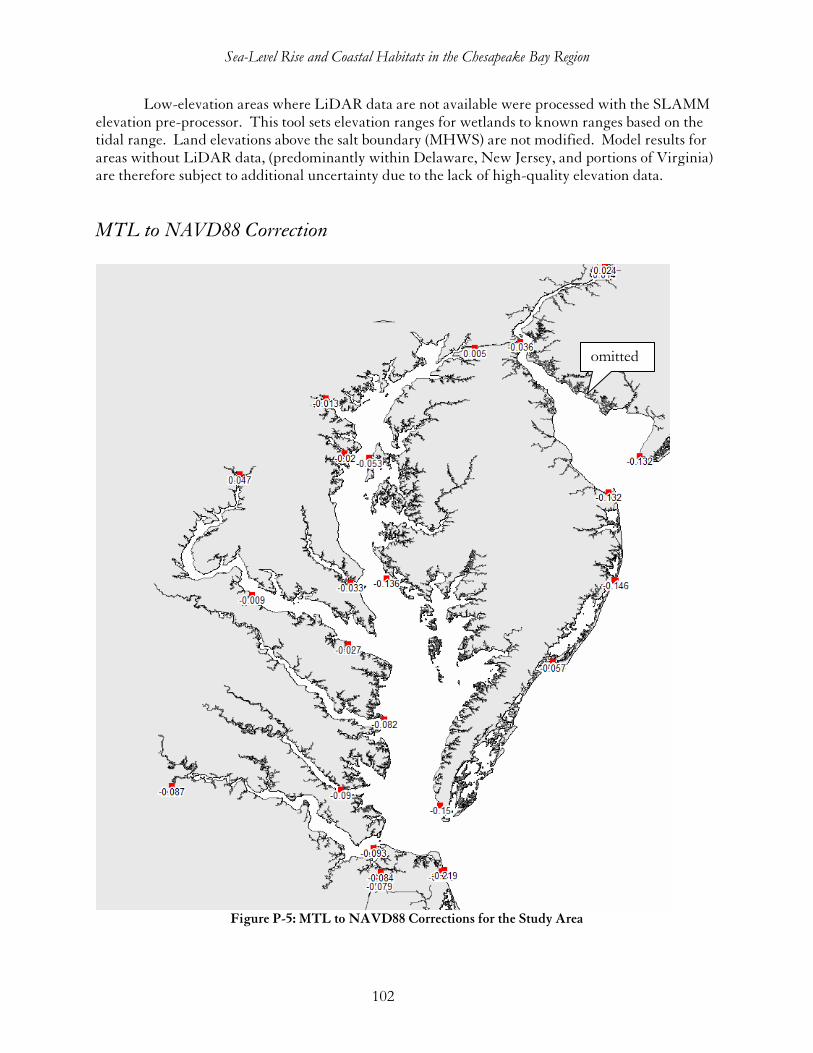
Sea-Level Rise and Coastal Habitats in the Chesapeake Bay Region
102
Low-elevation areas where LiDAR data are not available were processed with the SLAMM elevation pre-processor. This tool sets elevation ranges for wetlands to known ranges based on the tidal range. Land elevations above the salt boundary (MHWS) are not modified. Model results for areas without LiDAR data, (predominantly within Delaware, New Jersey, and portions of Virginia) are therefore subject to additional uncertainty due to the lack of high-quality elevation data.
MTL to NAVD88 Correction
Figure P-5: MTL to NAVD88 Corrections for the Study Area
omitted
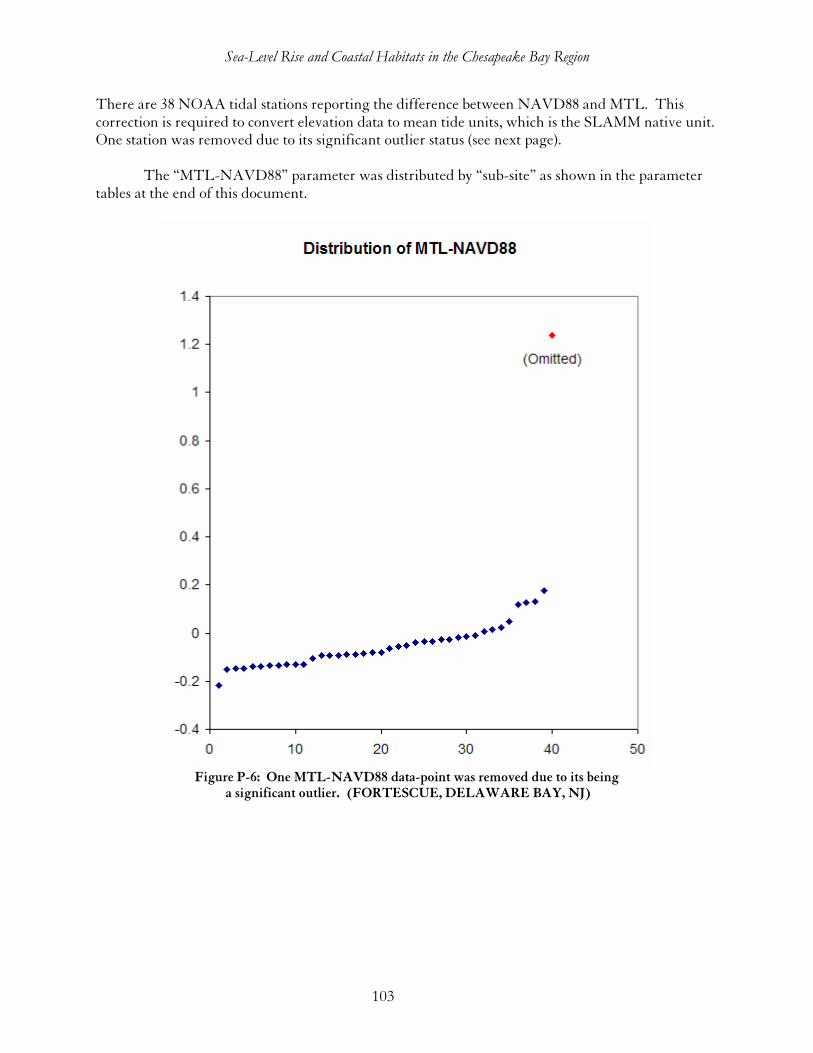
Sea-Level Rise and Coastal Habitats in the Chesapeake Bay Region
103
There are 38 NOAA tidal stations reporting the difference between NAVD88 and MTL. This correction is required to convert elevation data to mean tide units, which is the SLAMM native unit. One station was removed due to its significant outlier status (see next page).
The “MTL-NAVD88” parameter was distributed by “sub-site” as shown in the parameter tables at the end of this document.
Figure P-6: One MTL-NAVD88 data-point was removed due to its being
a significant outlier. (FORTESCUE, DELAWARE BAY, NJ)
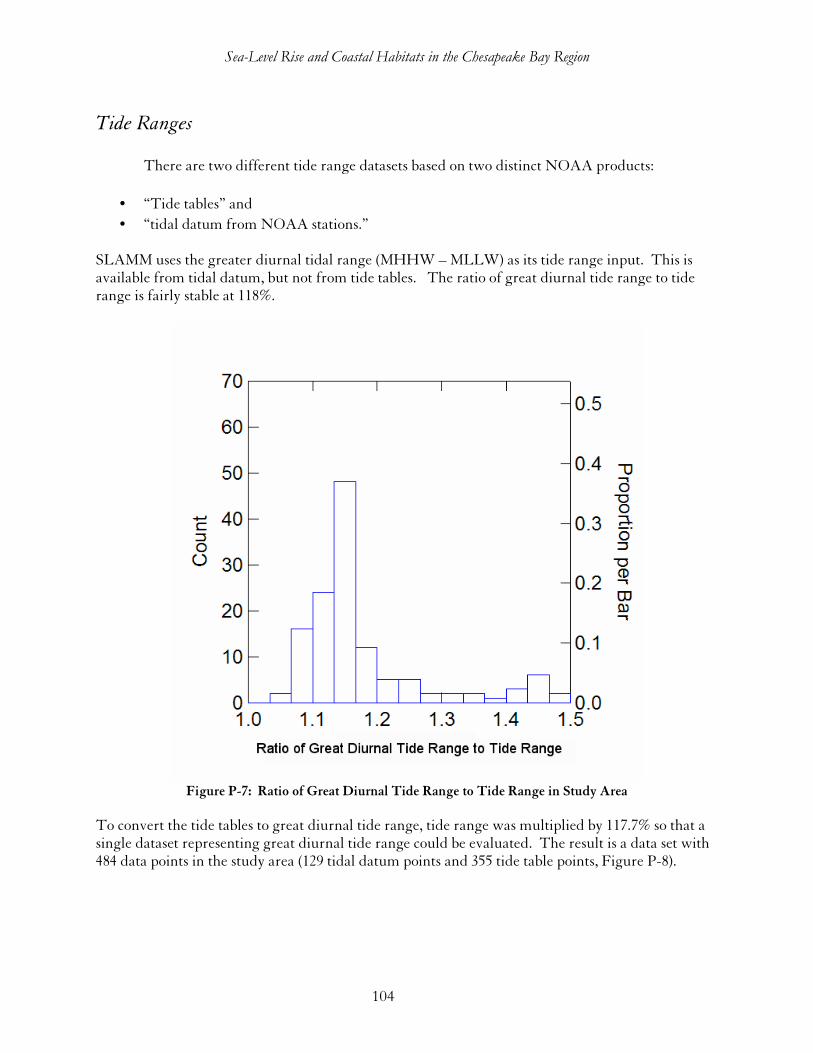
Sea-Level Rise and Coastal Habitats in the Chesapeake Bay Region
104
Tide Ranges
There are two different tide range datasets based on two distinct NOAA products:
• “Tide tables” and
• “tidal datum from NOAA stations.” SLAMM uses the greater diurnal tidal range (MHHW – MLLW) as its tide range input. This is available from tidal datum, but not from tide tables. The ratio of great diurnal tide range to tide range is fairly stable at 118%.
Figure P-7: Ratio of Great Diurnal Tide Range to Tide Range in Study Area
To convert the tide tables to great diurnal tide range, tide range was multiplied by 117.7% so that a single dataset representing great diurnal tide range could be evaluated. The result is a data set with 484 data points in the study area (129 tidal datum points and 355 tide table points, Figure P-8).
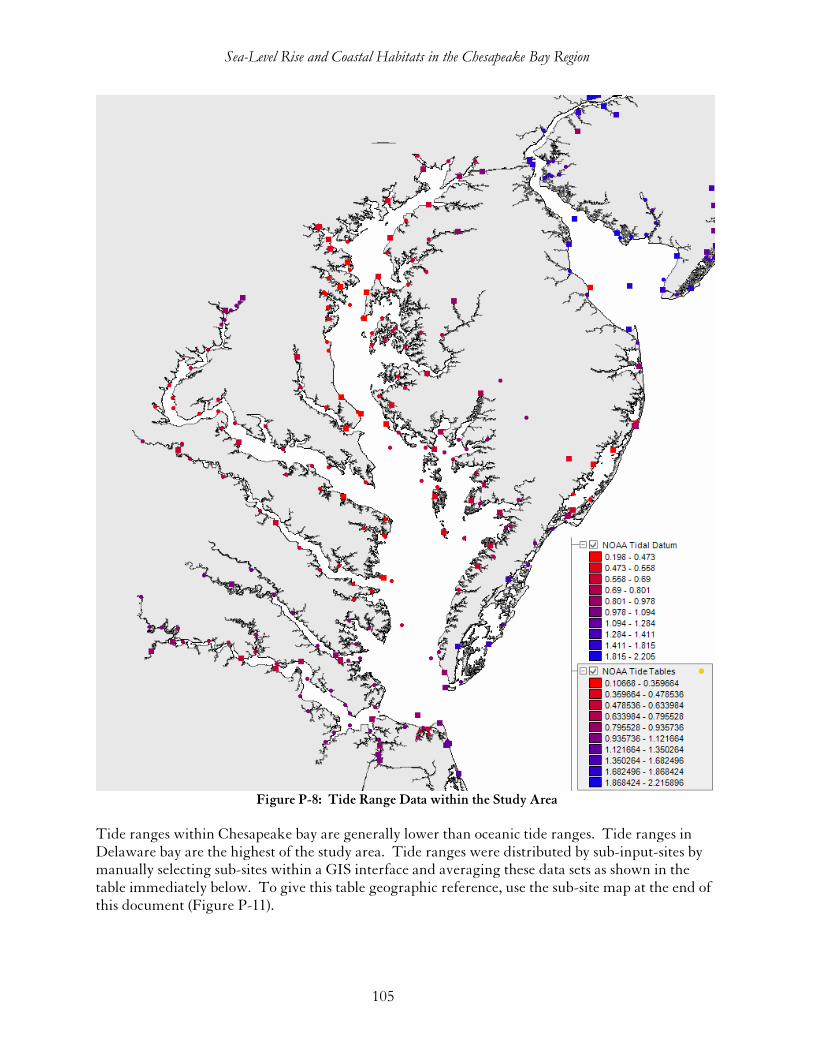
Sea-Level Rise and Coastal Habitats in the Chesapeake Bay Region
105
Figure P-8: Tide Range Data within the Study Area
Tide ranges within Chesapeake bay are generally lower than oceanic tide ranges. Tide ranges in Delaware bay are the highest of the study area. Tide ranges were distributed by sub-input-sites by manually selecting sub-sites within a GIS interface and averaging these data sets as shown in the table immediately below. To give this table geographic reference, use the sub-site map at the end of this document (Figure P-11).
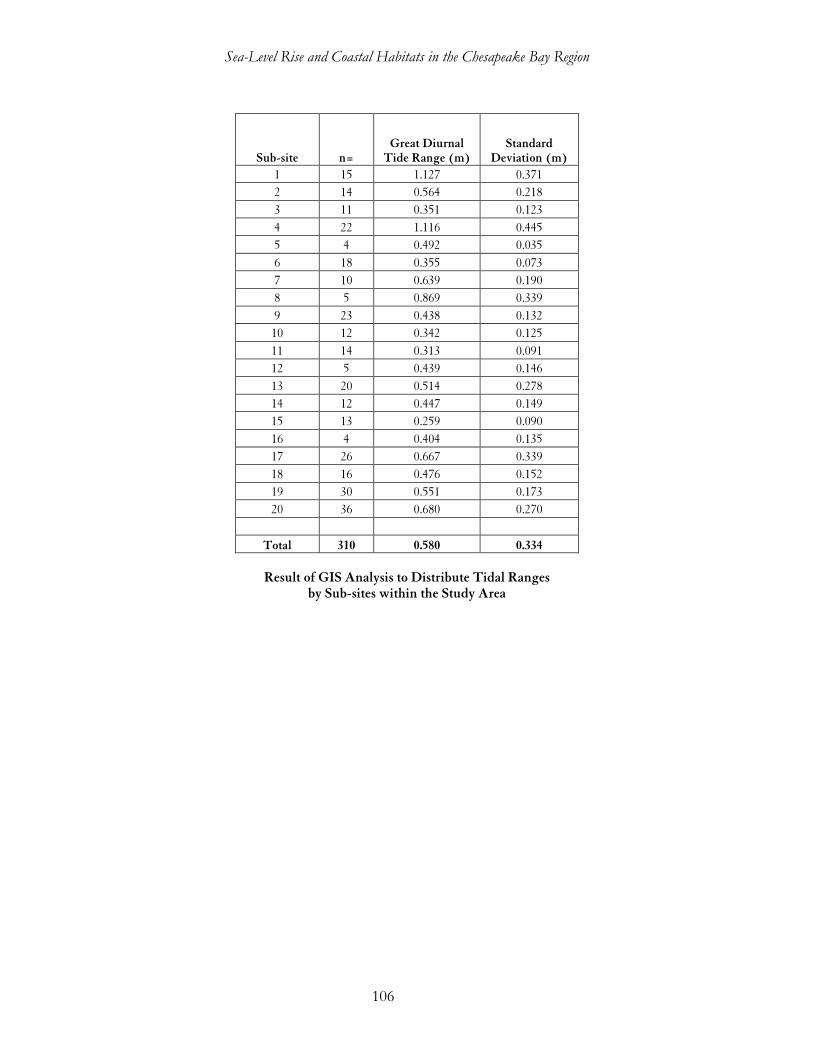
Sea-Level Rise and Coastal Habitats in the Chesapeake Bay Region
106
Sub-site n= Great Diurnal
Tide Range (m) Standard
Deviation (m)
1 15 1.127 0.371
2 14 0.564 0.218
3 11 0.351 0.123
4 22 1.116 0.445
5 4 0.492 0.035
6 18 0.355 0.073
7 10 0.639 0.190
8 5 0.869 0.339
9 23 0.438 0.132
10 12 0.342 0.125
11 14 0.313 0.091
12 5 0.439 0.146
13 20 0.514 0.278
14 12 0.447 0.149
15 13 0.259 0.090
16 4 0.404 0.135
17 26 0.667 0.339
18 16 0.476 0.152
19 30 0.551 0.173
20 36 0.680 0.270
Total 310 0.580 0.334
Result of GIS Analysis to Distribute Tidal Ranges
by Sub-sites within the Study Area
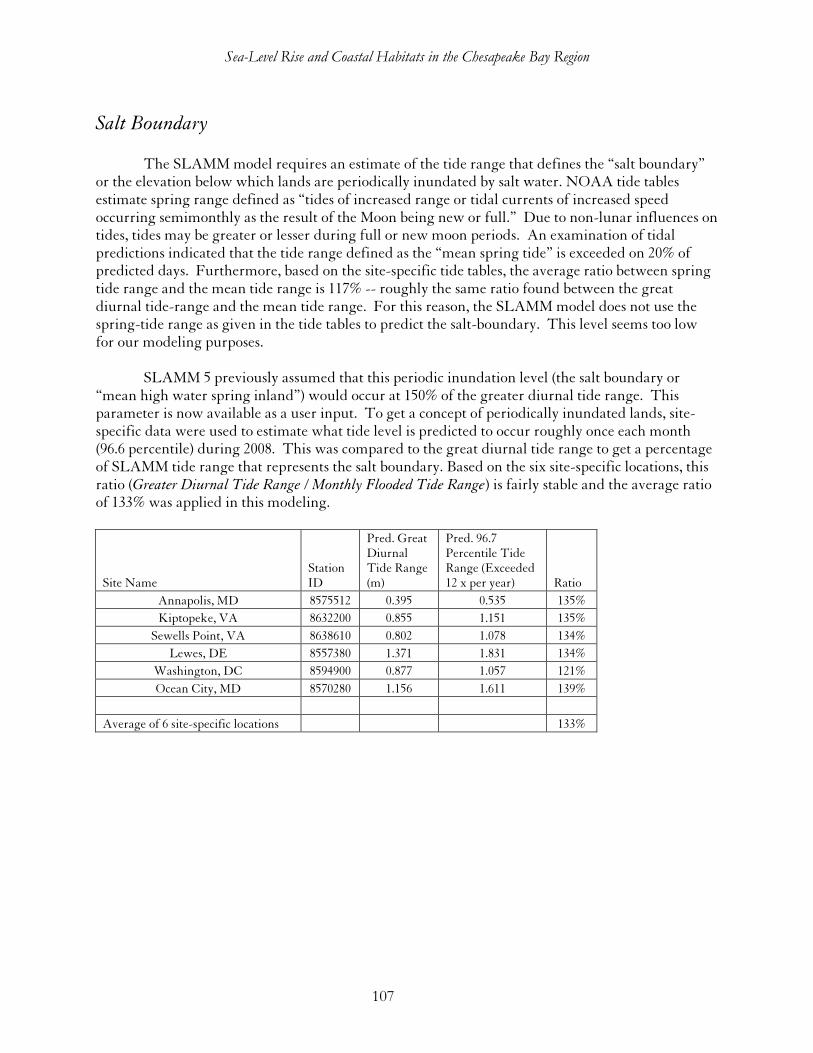
Sea-Level Rise and Coastal Habitats in the Chesapeake Bay Region
107
Salt Boundary
The SLAMM model requires an estimate of the tide range that defines the “salt boundary” or the elevation below which lands are periodically inundated by salt water. NOAA tide tables estimate spring range defined as “tides of increased range or tidal currents of increased speed occurring semimonthly as the result of the Moon being new or full.” Due to non-lunar influences on tides, tides may be greater or lesser during full or new moon periods. An examination of tidal predictions indicated that the tide range defined as the “mean spring tide” is exceeded on 20% of predicted days. Furthermore, based on the site-specific tide tables, the average ratio between spring tide range and the mean tide range is 117% -- roughly the same ratio found between the great diurnal tide-range and the mean tide range. For this reason, the SLAMM model does not use the spring-tide range as given in the tide tables to predict the salt-boundary. This level seems too low for our modeling purposes.
SLAMM 5 previously assumed that this periodic inundation level (the salt boundary or “mean high water spring inland”) would occur at 150% of the greater diurnal tide range. This parameter is now available as a user input. To get a concept of periodically inundated lands, site-specific data were used to estimate what tide level is predicted to occur roughly once each month (96.6 percentile) during 2008. This was compared to the great diurnal tide range to get a percentage of SLAMM tide range that represents the salt boundary. Based on the six site-specific locations, this ratio (Greater Diurnal Tide Range / Monthly Flooded Tide Range) is fairly stable and the average ratio of 133% was applied in this modeling.
Site Name Station ID
Pred. Great Diurnal Tide Range (m)
Pred. 96.7 Percentile Tide Range (Exceeded 12 x per year) Ratio
Annapolis, MD 8575512 0.395 0.535 135%
Kiptopeke, VA 8632200 0.855 1.151 135%
Sewells Point, VA 8638610 0.802 1.078 134%
Lewes, DE 8557380 1.371 1.831 134%
Washington, DC 8594900 0.877 1.057 121%
Ocean City, MD 8570280 1.156 1.611 139%
Average of 6 site-specific locations 133%
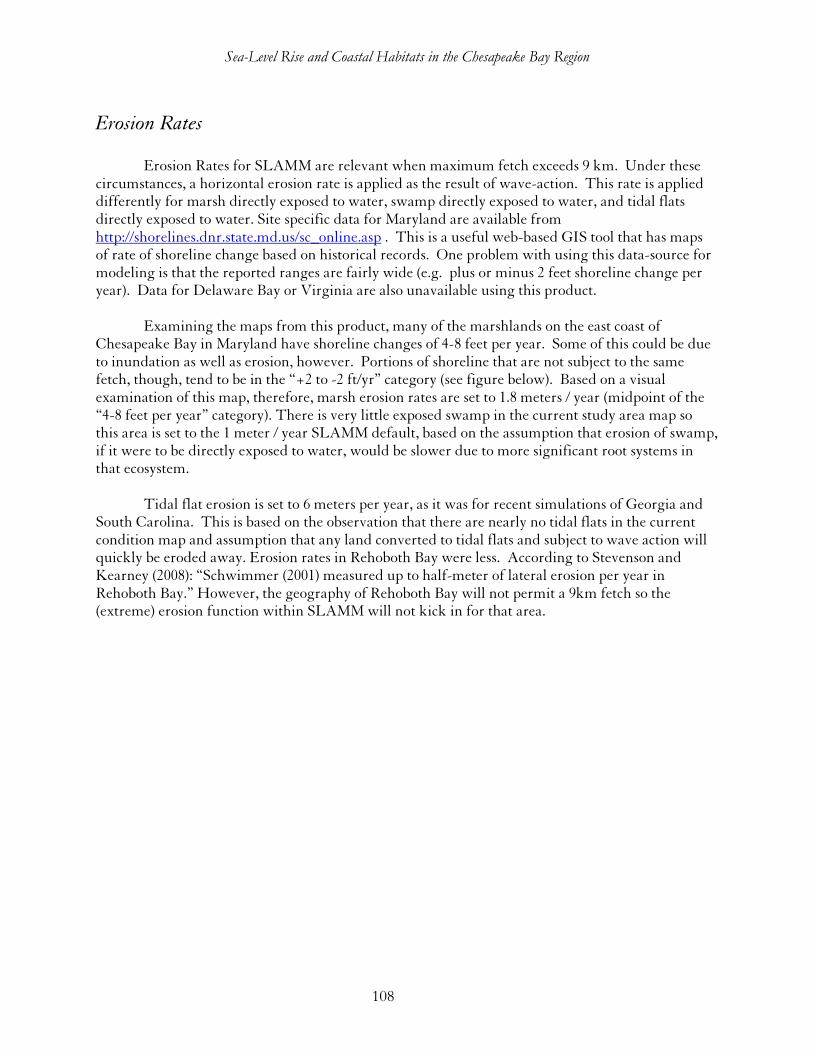
Sea-Level Rise and Coastal Habitats in the Chesapeake Bay Region
108
Erosion Rates
Erosion Rates for SLAMM are relevant when maximum fetch exceeds 9 km. Under these circumstances, a horizontal erosion rate is applied as the result of wave-action. This rate is applied differently for marsh directly exposed to water, swamp directly exposed to water, and tidal flats directly exposed to water. Site specific data for Maryland are available from http://shorelines.dnr.state.md.us/sc_online.asp . This is a useful web-based GIS tool that has maps of rate of shoreline change based on historical records. One problem with using this data-source for modeling is that the reported ranges are fairly wide (e.g. plus or minus 2 feet shoreline change per year). Data for Delaware Bay or Virginia are also unavailable using this product.
Examining the maps from this product, many of the marshlands on the east coast of Chesapeake Bay in Maryland have shoreline changes of 4-8 feet per year. Some of this could be due to inundation as well as erosion, however. Portions of shoreline that are not subject to the same fetch, though, tend to be in the “+2 to -2 ft/yr” category (see figure below). Based on a visual examination of this map, therefore, marsh erosion rates are set to 1.8 meters / year (midpoint of the “4-8 feet per year” category). There is very little exposed swamp in the current study area map so this area is set to the 1 meter / year SLAMM default, based on the assumption that erosion of swamp, if it were to be directly exposed to water, would be slower due to more significant root systems in that ecosystem.
Tidal flat erosion is set to 6 meters per year, as it was for recent simulations of Georgia and South Carolina. This is based on the observation that there are nearly no tidal flats in the current condition map and assumption that any land converted to tidal flats and subject to wave action will quickly be eroded away. Erosion rates in Rehoboth Bay were less. According to Stevenson and Kearney (2008): “Schwimmer (2001) measured up to half-meter of lateral erosion per year in Rehoboth Bay.” However, the geography of Rehoboth Bay will not permit a 9km fetch so the (extreme) erosion function within SLAMM will not kick in for that area.
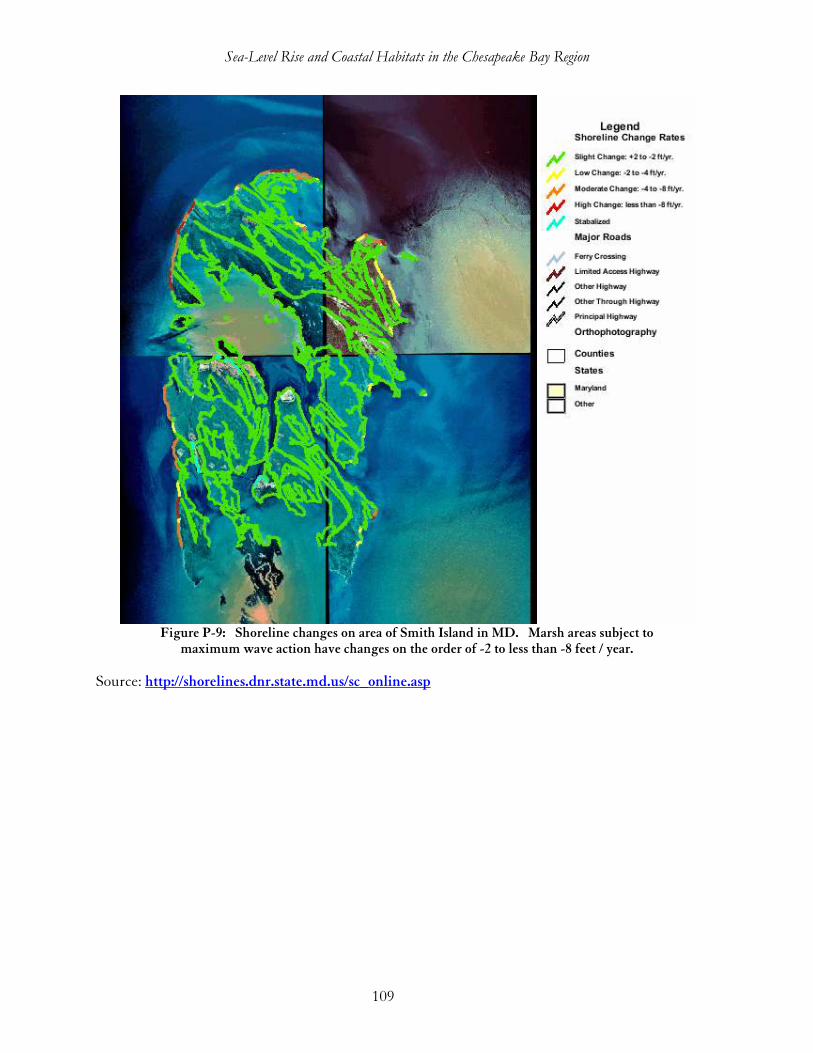
Sea-Level Rise and Coastal Habitats in the Chesapeake Bay Region
109
Figure P-9: Shoreline changes on area of Smith Island in MD. Marsh areas subject to
maximum wave action have changes on the order of -2 to less than -8 feet / year.
Source: http://shorelines.dnr.state.md.us/sc_online.asp
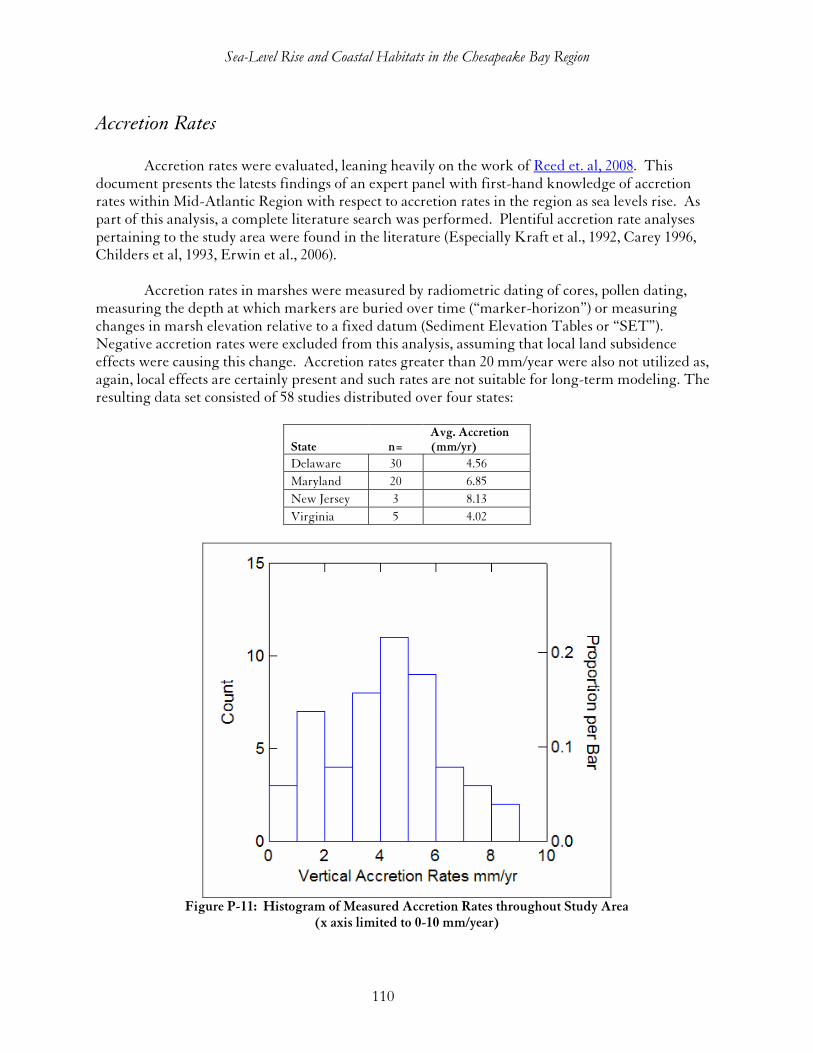
Sea-Level Rise and Coastal Habitats in the Chesapeake Bay Region
110
Accretion Rates
Accretion rates were evaluated, leaning heavily on the work of Reed et. al, 2008. This document presents the latests findings of an expert panel with first-hand knowledge of accretion rates within Mid-Atlantic Region with respect to accretion rates in the region as sea levels rise. As part of this analysis, a complete literature search was performed. Plentiful accretion rate analyses pertaining to the study area were found in the literature (Especially Kraft et al., 1992, Carey 1996, Childers et al, 1993, Erwin et al., 2006).
Accretion rates in marshes were measured by radiometric dating of cores, pollen dating, measuring the depth at which markers are buried over time (“marker-horizon”) or measuring changes in marsh elevation relative to a fixed datum (Sediment Elevation Tables or “SET”). Negative accretion rates were excluded from this analysis, assuming that local land subsidence effects were causing this change. Accretion rates greater than 20 mm/year were also not utilized as, again, local effects are certainly present and such rates are not suitable for long-term modeling. The resulting data set consisted of 58 studies distributed over four states:
State n= Avg. Accretion (mm/yr)
Delaware 30 4.56
Maryland 20 6.85
New Jersey 3 8.13
Virginia 5 4.02
Figure P-11: Histogram of Measured Accretion Rates throughout Study Area
(x axis limited to 0-10 mm/year)
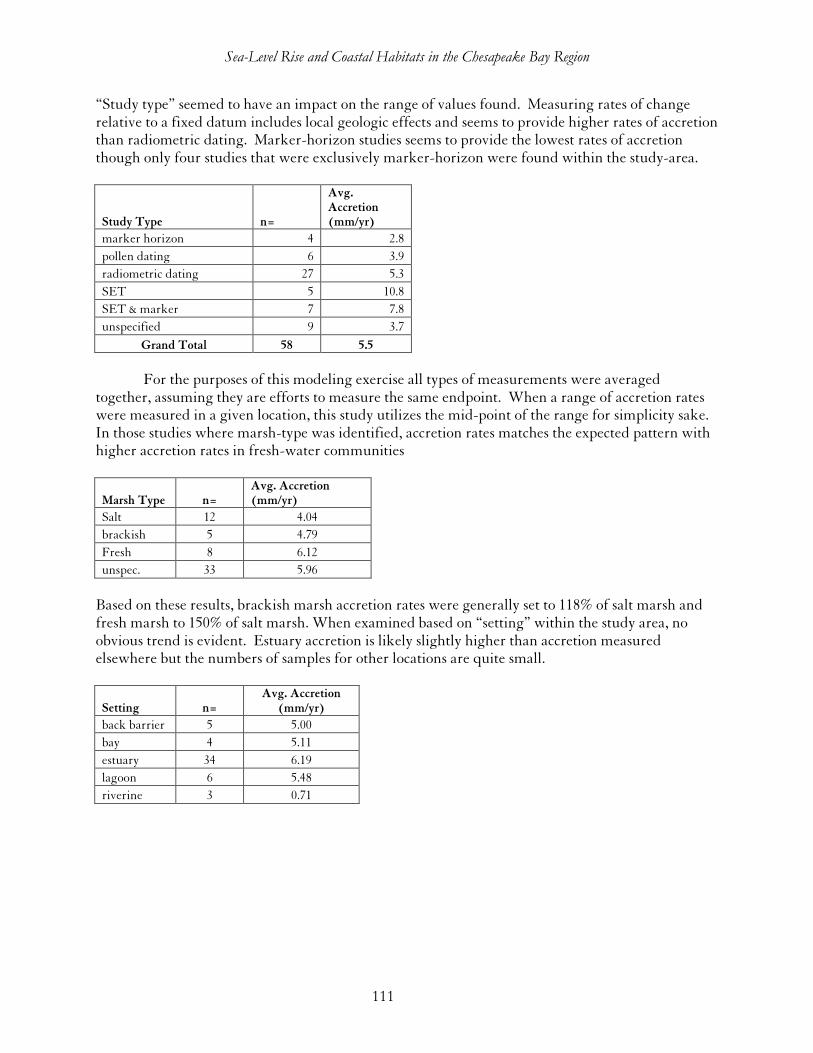
Sea-Level Rise and Coastal Habitats in the Chesapeake Bay Region
111
“Study type” seemed to have an impact on the range of values found. Measuring rates of change relative to a fixed datum includes local geologic effects and seems to provide higher rates of accretion than radiometric dating. Marker-horizon studies seems to provide the lowest rates of accretion though only four studies that were exclusively marker-horizon were found within the study-area.
Study Type n=
Avg. Accretion (mm/yr)
marker horizon 4 2.8
pollen dating 6 3.9
radiometric dating 27 5.3
SET 5 10.8
SET & marker 7 7.8
unspecified 9 3.7
Grand Total 58 5.5
For the purposes of this modeling exercise all types of measurements were averaged
together, assuming they are efforts to measure the same endpoint. When a range of accretion rates were measured in a given location, this study utilizes the mid-point of the range for simplicity sake. In those studies where marsh-type was identified, accretion rates matches the expected pattern with higher accretion rates in fresh-water communities
Marsh Type n= Avg. Accretion (mm/yr)
Salt 12 4.04
brackish 5 4.79
Fresh 8 6.12
unspec. 33 5.96
Based on these results, brackish marsh accretion rates were generally set to 118% of salt marsh and fresh marsh to 150% of salt marsh. When examined based on “setting” within the study area, no obvious trend is evident. Estuary accretion is likely slightly higher than accretion measured elsewhere but the numbers of samples for other locations are quite small.
Setting n= Avg. Accretion
(mm/yr)
back barrier 5 5.00
bay 4 5.11
estuary 34 6.19
lagoon 6 5.48
riverine 3 0.71
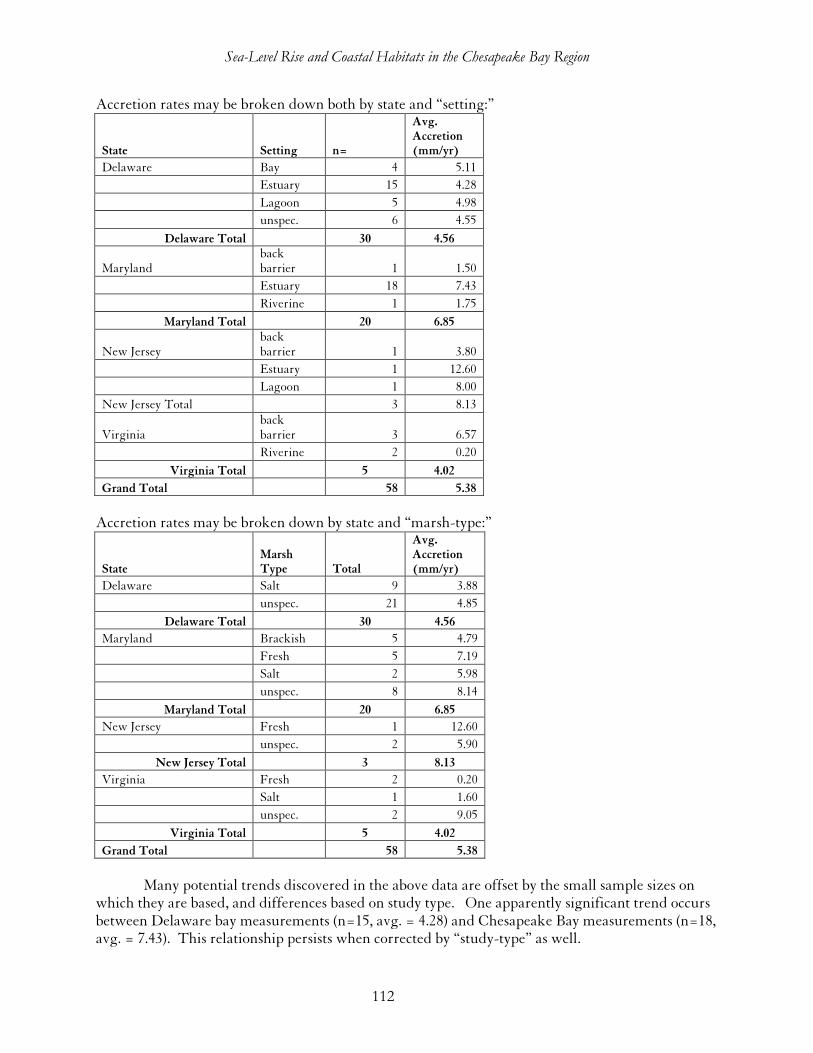
Sea-Level Rise and Coastal Habitats in the Chesapeake Bay Region
112
Accretion rates may be broken down both by state and “setting:”
State Setting n=
Avg. Accretion (mm/yr)
Delaware Bay 4 5.11
Estuary 15 4.28
Lagoon 5 4.98
unspec. 6 4.55
Delaware Total 30 4.56
Maryland back barrier 1 1.50
Estuary 18 7.43
Riverine 1 1.75
Maryland Total 20 6.85
New Jersey back barrier 1 3.80
Estuary 1 12.60
Lagoon 1 8.00
New Jersey Total 3 8.13
Virginia back barrier 3 6.57
Riverine 2 0.20
Virginia Total 5 4.02
Grand Total 58 5.38
Accretion rates may be broken down by state and “marsh-type:”
State Marsh Type Total
Avg. Accretion (mm/yr)
Delaware Salt 9 3.88
unspec. 21 4.85
Delaware Total 30 4.56
Maryland Brackish 5 4.79
Fresh 5 7.19
Salt 2 5.98
unspec. 8 8.14
Maryland Total 20 6.85
New Jersey Fresh 1 12.60
unspec. 2 5.90
New Jersey Total 3 8.13
Virginia Fresh 2 0.20
Salt 1 1.60
unspec. 2 9.05
Virginia Total 5 4.02
Grand Total 58 5.38
Many potential trends discovered in the above data are offset by the small sample sizes on
which they are based, and differences based on study type. One apparently significant trend occurs between Delaware bay measurements (n=15, avg. = 4.28) and Chesapeake Bay measurements (n=18, avg. = 7.43). This relationship persists when corrected by “study-type” as well.
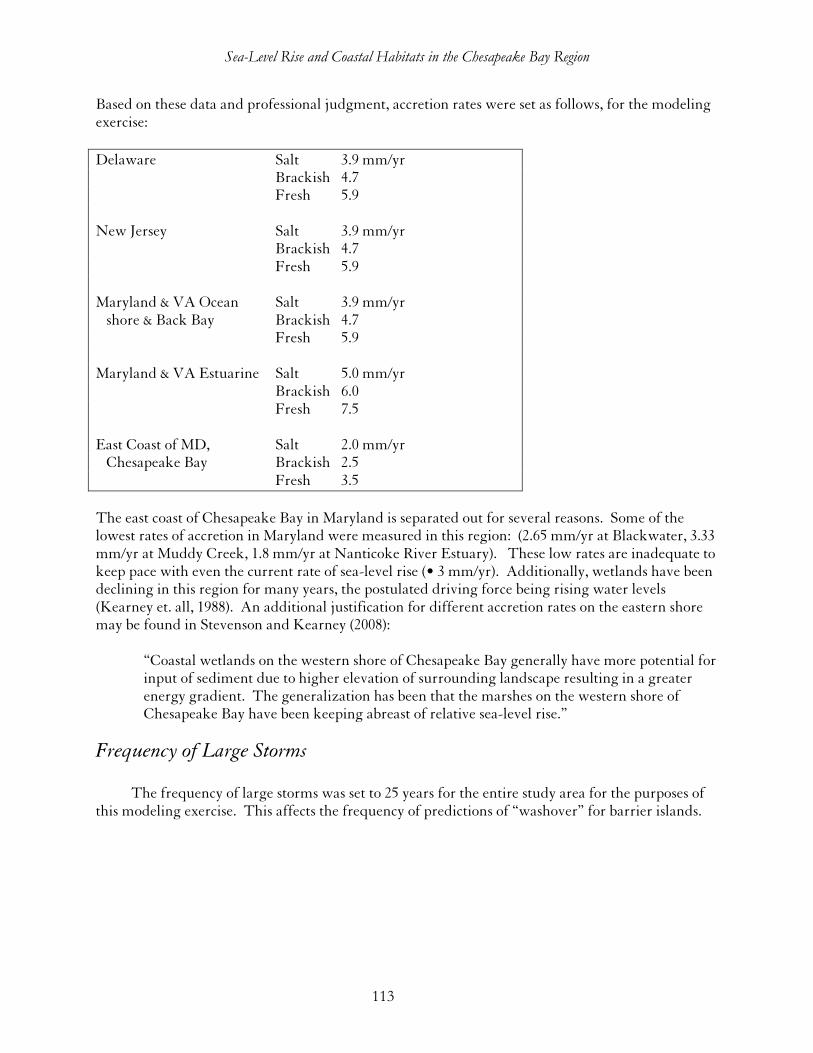
Sea-Level Rise and Coastal Habitats in the Chesapeake Bay Region
113
Based on these data and professional judgment, accretion rates were set as follows, for the modeling exercise:
Delaware Salt 3.9 mm/yr Brackish 4.7 Fresh 5.9 New Jersey Salt 3.9 mm/yr Brackish 4.7 Fresh 5.9 Maryland & VA Ocean Salt 3.9 mm/yr shore & Back Bay Brackish 4.7 Fresh 5.9 Maryland & VA Estuarine Salt 5.0 mm/yr Brackish 6.0 Fresh 7.5 East Coast of MD, Salt 2.0 mm/yr Chesapeake Bay Brackish 2.5 Fresh 3.5
The east coast of Chesapeake Bay in Maryland is separated out for several reasons. Some of the lowest rates of accretion in Maryland were measured in this region: (2.65 mm/yr at Blackwater, 3.33 mm/yr at Muddy Creek, 1.8 mm/yr at Nanticoke River Estuary). These low rates are inadequate to keep pace with even the current rate of sea-level rise (• 3 mm/yr). Additionally, wetlands have been declining in this region for many years, the postulated driving force being rising water levels (Kearney et. all, 1988). An additional justification for different accretion rates on the eastern shore may be found in Stevenson and Kearney (2008):
“Coastal wetlands on the western shore of Chesapeake Bay generally have more potential for input of sediment due to higher elevation of surrounding landscape resulting in a greater energy gradient. The generalization has been that the marshes on the western shore of Chesapeake Bay have been keeping abreast of relative sea-level rise.”
Frequency of Large Storms The frequency of large storms was set to 25 years for the entire study area for the purposes of this modeling exercise. This affects the frequency of predictions of “washover” for barrier islands.
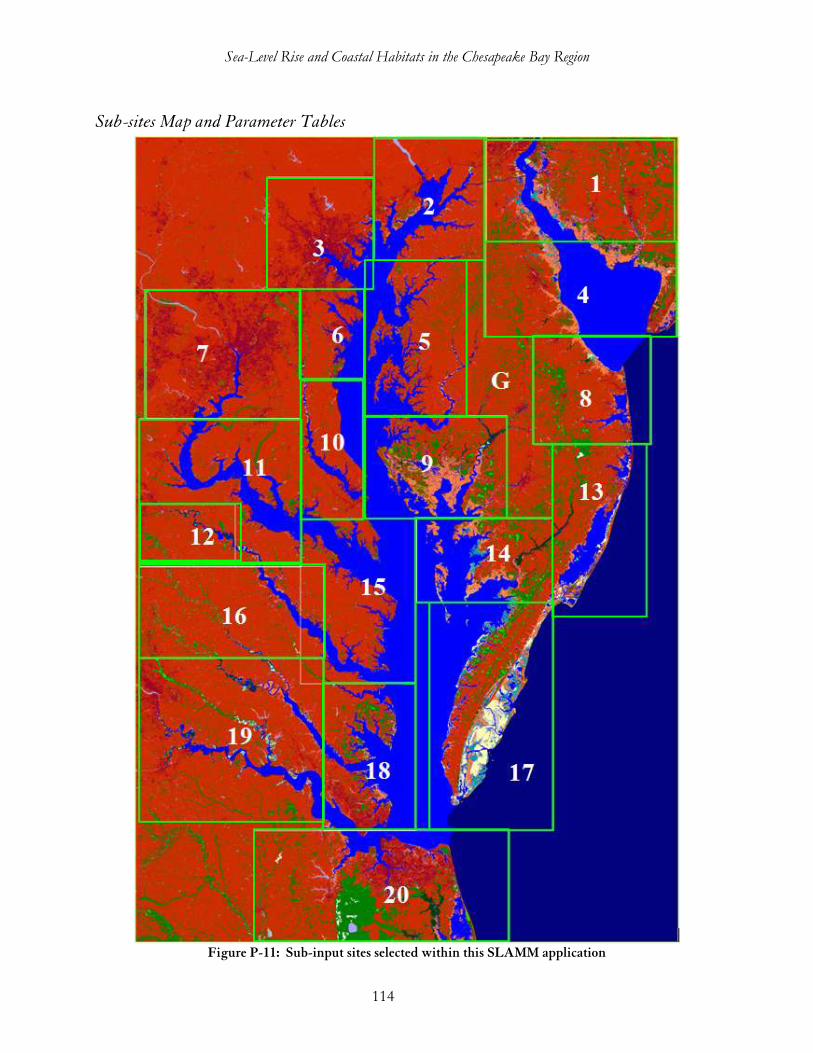
Sea-Level Rise and Coastal Habitats in the Chesapeake Bay Region
114
Sub-sites Map and Parameter Tables
Figure P-11: Sub-input sites selected within this SLAMM application
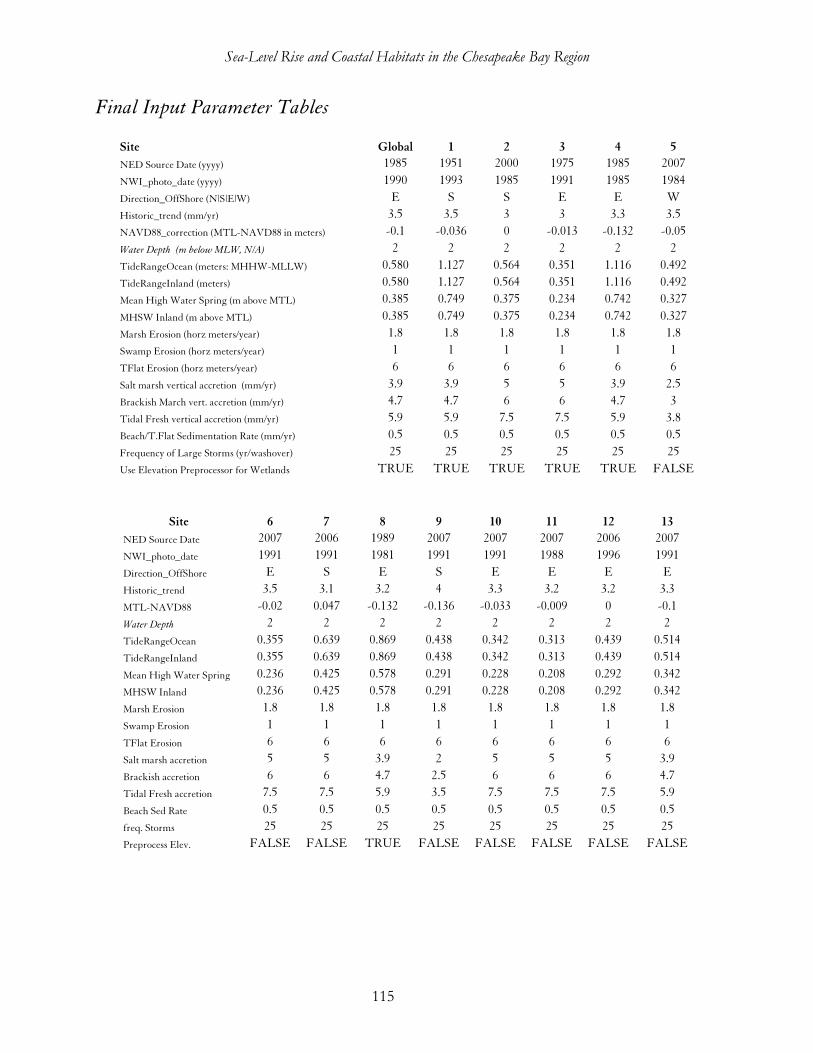
Sea-Level Rise and Coastal Habitats in the Chesapeake Bay Region
115
Final Input Parameter Tables
Site Global 1 2 3 4 5
NED Source Date (yyyy) 1985 1951 2000 1975 1985 2007
NWI_photo_date (yyyy) 1990 1993 1985 1991 1985 1984
Direction_OffShore (N|S|E|W) E S S E E W
Historic_trend (mm/yr) 3.5 3.5 3 3 3.3 3.5
NAVD88_correction (MTL-NAVD88 in meters) -0.1 -0.036 0 -0.013 -0.132 -0.05
Water Depth (m below MLW, N/A) 2 2 2 2 2 2
TideRangeOcean (meters: MHHW-MLLW) 0.580 1.127 0.564 0.351 1.116 0.492
TideRangeInland (meters) 0.580 1.127 0.564 0.351 1.116 0.492
Mean High Water Spring (m above MTL) 0.385 0.749 0.375 0.234 0.742 0.327
MHSW Inland (m above MTL) 0.385 0.749 0.375 0.234 0.742 0.327
Marsh Erosion (horz meters/year) 1.8 1.8 1.8 1.8 1.8 1.8
Swamp Erosion (horz meters/year) 1 1 1 1 1 1
TFlat Erosion (horz meters/year) 6 6 6 6 6 6
Salt marsh vertical accretion (mm/yr) 3.9 3.9 5 5 3.9 2.5
Brackish March vert. accretion (mm/yr) 4.7 4.7 6 6 4.7 3
Tidal Fresh vertical accretion (mm/yr) 5.9 5.9 7.5 7.5 5.9 3.8
Beach/T.Flat Sedimentation Rate (mm/yr) 0.5 0.5 0.5 0.5 0.5 0.5
Frequency of Large Storms (yr/washover) 25 25 25 25 25 25
Use Elevation Preprocessor for Wetlands TRUE TRUE TRUE TRUE TRUE FALSE
Site 6 7 8 9 10 11 12 13
NED Source Date 2007 2006 1989 2007 2007 2007 2006 2007
NWI_photo_date 1991 1991 1981 1991 1991 1988 1996 1991
Direction_OffShore E S E S E E E E
Historic_trend 3.5 3.1 3.2 4 3.3 3.2 3.2 3.3
MTL-NAVD88 -0.02 0.047 -0.132 -0.136 -0.033 -0.009 0 -0.1
Water Depth 2 2 2 2 2 2 2 2
TideRangeOcean 0.355 0.639 0.869 0.438 0.342 0.313 0.439 0.514
TideRangeInland 0.355 0.639 0.869 0.438 0.342 0.313 0.439 0.514
Mean High Water Spring 0.236 0.425 0.578 0.291 0.228 0.208 0.292 0.342
MHSW Inland 0.236 0.425 0.578 0.291 0.228 0.208 0.292 0.342
Marsh Erosion 1.8 1.8 1.8 1.8 1.8 1.8 1.8 1.8
Swamp Erosion 1 1 1 1 1 1 1 1
TFlat Erosion 6 6 6 6 6 6 6 6
Salt marsh accretion 5 5 3.9 2 5 5 5 3.9
Brackish accretion 6 6 4.7 2.5 6 6 6 4.7
Tidal Fresh accretion 7.5 7.5 5.9 3.5 7.5 7.5 7.5 5.9
Beach Sed Rate 0.5 0.5 0.5 0.5 0.5 0.5 0.5 0.5
freq. Storms 25 25 25 25 25 25 25 25
Preprocess Elev. FALSE FALSE TRUE FALSE FALSE FALSE FALSE FALSE
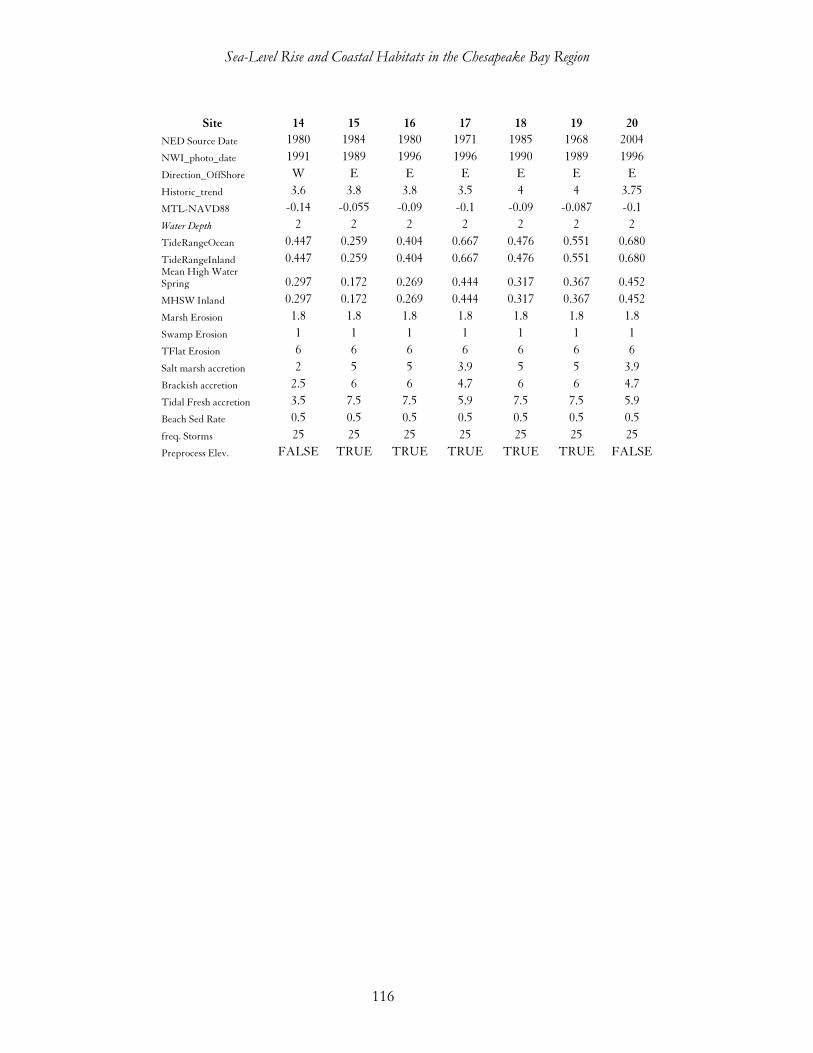
Sea-Level Rise and Coastal Habitats in the Chesapeake Bay Region
116
Site 14 15 16 17 18 19 20
NED Source Date 1980 1984 1980 1971 1985 1968 2004
NWI_photo_date 1991 1989 1996 1996 1990 1989 1996
Direction_OffShore W E E E E E E
Historic_trend 3.6 3.8 3.8 3.5 4 4 3.75
MTL-NAVD88 -0.14 -0.055 -0.09 -0.1 -0.09 -0.087 -0.1
Water Depth 2 2 2 2 2 2 2
TideRangeOcean 0.447 0.259 0.404 0.667 0.476 0.551 0.680
TideRangeInland 0.447 0.259 0.404 0.667 0.476 0.551 0.680 Mean High Water Spring 0.297 0.172 0.269 0.444 0.317 0.367 0.452
MHSW Inland 0.297 0.172 0.269 0.444 0.317 0.367 0.452
Marsh Erosion 1.8 1.8 1.8 1.8 1.8 1.8 1.8
Swamp Erosion 1 1 1 1 1 1 1
TFlat Erosion 6 6 6 6 6 6 6
Salt marsh accretion 2 5 5 3.9 5 5 3.9
Brackish accretion 2.5 6 6 4.7 6 6 4.7
Tidal Fresh accretion 3.5 7.5 7.5 5.9 7.5 7.5 5.9
Beach Sed Rate 0.5 0.5 0.5 0.5 0.5 0.5 0.5
freq. Storms 25 25 25 25 25 25 25
Preprocess Elev. FALSE TRUE TRUE TRUE TRUE TRUE FALSE
Sea-Level Rise and Coastal Habitats in the Chesapeake Bay Region
117
References Boesch, D.R., Greer, J., (Eds.), 2003. Chesapeake Futures, Choices for the 21st Century. Scientific and
Technical Advisory Committee publ. no. 03-001, Chesapeake Research Consortium, Edgewater, Maryland, USA.
Burton, K. “In a Benchmark Restoration Effort in Chesapeake Bay, the Island That Almost
Vanished is Slowly Reappearing.” http://www.outdoorcentral.com/mc/pr/05/07/06ala.asp (accessed March 11, 2008).
Cahoon, D.R. 2008. “Factors Affecting Coastal Wetland Loss and Restoration.” Chapter 12 in
Synthesis of U.S. Geological Survey Science for the Chesapeake Bay Ecosystem and Implications for Environmental Management (Washington, D.C.: U.S. Geological Survey).
Cahoon, D.R., J. W. Day, Jr., and D. J. Reed, 1999. “The influence of surface and shallow subsurface
soil processes on wetland elevation: A synthesis.” Current Topics in Wetland Biogeochemistry, 3, 72-88.
Cahoon, D.R., et al. 1998. “Global Climate Change and Sea-Level Rise: Estimating the Potential for Submergence of Coastal Wetlands.” Chapter 3 in Vulnerability of Coastal Wetlands in the Southeastern United States (Washington, D.C.: U.S. Geological Survey).
Callaway, J.C., et al. 2007. “Emerging Issues for the Restoration of Tidal Marsh Ecosystems in the Context of Predicted Climate Change.” Madroño 54: 234-248.
Carey 1996, Transgression of Delaware’s fringing tidal marshes: surficial morphology, subsurface stratigraphy, vertical accretion rates and geometry of adjacent and antecedent surfaces. Ph.D. dissertation, University of Delaware. Lewes, Delaware.
Chen, J. L., Wilson, C. R., Tapley, B. D., 2006 “Satellite Gravity Measurements Confirm Accelerated Melting of Greenland Ice Sheet” Science 2006 0: 1129007.
Chesapeake Bay Program, “About the Bay: Mammals.” http://www.chesapeakebay.net/baybio.htm (accessed March 14, 2008).
Childers et al, 1993, Seasonal measurements of sediment elevation in three Mid-Atlantic estuaries. Journal of Coastal Research 9(4): 986-1003.
Church, J.A. and White, N.J. 2006. “A 20th Century Acceleration in Global Sea-Level Rise.”
Geophysical Research Letters 33: 1-4.
Clough, J.S. and R.A. Park, 2007, Technical Documentation for SLAMM 5.0 January 2007, Jonathan S. Clough, Warren Pinnacle Consulting, Inc, Richard A. Park, Eco Modeling. Available on request.
Cowardin, L.M., et al. 1979. Classification of Wetlands and Deepwater Habitats of the United States (Washington, D.C.: U.S. Fish & Wildlife Service);
Sea-Level Rise and Coastal Habitats in the Chesapeake Bay Region
118
Craft C, Clough J, Ehman J, Guo H, Joye S, Machmuller M, Park R, and Pennings S. Effects of Accelerated Sea Level Rise on Delivery of Ecosystem Services Provided by Tidal Marshes: A Simulation of the Georgia (USA) Coast. In review for Frontiers in Ecology and the Environment.
Crockett, D. 1998. “Shorebird Crisis: The Horseshoe Crabs of Delaware Bay.” Real Birds. http://www.virtualbirder.com/vbirder/realbirds/dbhsc/index.html (accessed 4/8/2008).
Erwin, R.M., et al. 2006. “High Tides and Rising Seas: Potential Effects on Estuarine Waterbirds.” In R. Greenberg, et al., eds. Terrestrial Vertebrates of Tidal Marshes: Evolution, Ecology, and Conservation. Studies in Avian Biology No. 32 (Riverside, CA: Cooper Ornithological Society).
Erwin et al. 2006. “Surface elevation dynamics in vegetates Spartina marshes versus unvegetated tidal ponds along the Mid-Atlantic coast, USA, with implications to waterbirds.” Estuaries and Coasts 29(1): 96-106.
Fisher, A., et al. 2000. Preparing for a Changing Climate: The Potential Consequences of Climate Variability and Change: Mid-Atlantic Foundations, Chapter 7: Coastal Zones (University Park, PA: Pennsylvania State University Press).
Fleming, G.P., P.P. Coulling, K.D. Patterson, and K. Taverna. 2006. The Natural Communities of Virginia: Classification of Ecological Community Groups. Second Approximation. Version 2.2 (Richmond, VA: Virginia Department of Conservation and Recreation, Division of Natural Heritage).
Galbraith, H., et al. 2005. “Global Climate Change and Sea Level Rise: Potential Losses of Intertidal Habitat for Shorebirds.” USDA Forest Service General Technical Report. PSW-GTR-191: 1119-1122.
Galbraith, H., R. Jones, R.A. Park, J.S. Clough, S. Herrod-Julius, B. Harrington, and G. Page. 2002. Global Climate Change and Sea Level Rise: Potential Losses of Intertidal Habitat for Shorebirds. Waterbirds 25:173-183.
Glick, P., Clough, J. and Nunley, B. 2007. Sea-Level Rise and Coastal Habitats in the Pacific Northwest (Seattle, WA: National Wildlife Federation).
Glick, P. 2006. An Unfavorable Tide: Global Warming, Coastal Habitats and Sportfishing in Florida (Reston, VA: National Wildlife Federation and Tallahassee, FL: Florida Wildlife Federation).
Groisman, P.Y., et al. 2004. “Contemporary Changes of the Hydrological Cycle over the Contiguous United States: Trends Derived from In Situ Observations.” Journal of Hydrometeorology 5: 64-84.
Hagy, J.D., et al. 2004. “Hypoxia in Chesapeake Bay, 1950-2001: Long-Term Change in Relation to
Nutrient Loading and River Flow.” Estuaries 27: 634-658.
Hansen, J.E. 2007. “Scientific Reticence and Sea-Level Rise.” Geophysical Research Letters 2 doi: 10.1088/1748-9326/2/2/024002.
Sea-Level Rise and Coastal Habitats in the Chesapeake Bay Region
119
Hardaway, C.S., et al. 2005. Shoreline Evolution, Chesapeake Bay Shoreline, City of Virginia Beach, Virginia (Gloucester Point, VA: Virginia Institute of Marine Sciences, College of William and Mary).
Hayhoe, K., et al. 2007. “Past and Future Changes in Climate and Hydrological Indicators in the U.S. Northeast.” Climate Dynamics 28: 381-407; and Groisman, P.Y., et al. 2004. “Contemporary Changes of the Hydrological Cycle over the Contiguous United States: Trends Derived from In Situ Observations.” Journal of Hydrometeorology 5: 64-84.
IPCC, 2001: Climate Change 2001: The Scientific Basis. Contribution of Working Group I to the Third Assessment Report of the Intergovernmental Panel on Climate Change [Houghton, J.T.,Y. Ding, D.J. Griggs, M. Noguer, P.J. van der Linden, X. Dai, K.Maskell, and C.A. Johnson (eds.)]. Cambridge University Press, Cambridge, United Kingdom and New York, NY, USA, 881pp.
IPCC, 2007a: Climate Change 2007: The Physical Science Basis, Summary for Policymakers Fourth Assessment report, Intergovernmental Panel on Climactic Change, Geneva Switzerland.
Johnson, Z.P. 2000. A Sea-Level Rise Response Strategy for the State of Maryland (Annapolis, MD: Maryland Department of Natural Resources).
Kearney, M.S. 2006. “The Potential for Significant Impacts on Chesapeake Bay.” Scientific Symposium Presentation Abstracts, Washington Summit on Climate Stabilization, September 18-21, 2006 (Washington, D.C.: Climate Institute).
Kearney, M.S., Grace, R.E., and Stevenson, J.C. 1998. “Marsh Loss in Nanticoke Estuary, Chesapeake Bay” Geographical Review, Vol. 78, No. 2, Thematic Issue: Coastal Geomorphology (Apr., 1988), pp. 205-220.
Kraft et al, 1992. Geologic and human factors in the decline of the tidal salt marsh lithosome: the Delaware estuary and Atlantic coastal zone. Sedimentary Geology 80: 233-246.
Lee, J.K., R.A. Park, and P.W. Mausel. 1992. Application of Geoprocessing and Simulation Modeling to Estimate Impacts of Sea Level Rise on the Northeast Coast of Florida. Photogrammetric Engineering and Remote Sensing 58:11:1579-1586.
Monaghan, A. J. et al, 2006 “Insignificant Change in Antarctic Snowfall Since the International Geophysical Year” Science 2006 313: 827-831.
Moorhead, K.K. and Brinson, M.M. 1995. Response of Wetlands to Rising Sea Level in the Lower Coastal Plain of North Carolina.” Ecological Applications 5: 261-271.
Najjar, R.G., et al. 2000. “The Potential Impacts of Climate Change on the Mid-Atlantic Coastal Region.” Climate Research 14: 219-233.
Nerem, R. S., T. M. vanDam, and M. S. Schenewerk, “BAYONET: The Chesapeake Bay GPS Network,” Proceedings of the IGS/PSMSL Sea Level Workshop, Jet Propulsion Laboratory, pp. 107-115, March 17-18, 1997.
Otto-Bliesner, B.L., et al. 2006. “Simulating Arctic Climate Warmth and Icefield Retreat in the Last Interglaciation.” Science 311: 1751-1753.
Sea-Level Rise and Coastal Habitats in the Chesapeake Bay Region
120
Overpeck, J.T., et al. 2006. “Paleoclimatic Evidence for Future Ice-Sheet Instability and Rapid Sea-Level Rise.” Science 311: 1747-1750
Park, R.A., J.K. Lee, and D. Canning. 1993. Potential Effects of Sea Level Rise on Puget Sound Wetlands. Geocarto International 8(4):99-110.
Park, R.A., M.S. Trehan, P.W. Mausel, and R.C. Howe. 1989a. The Effects of Sea Level Rise on U.S. Coastal Wetlands. In The Potential Effects of Global Climate Change on the United States: Appendix B - Sea Level Rise, edited by J.B. Smith and D.A. Tirpak, 1-1 to 1-55. EPA-230-05-89-052. Washington, D.C.: U.S. Environmental Protection Agency.
Perry, M.C. 2008. “Changes in Food and Habitats of Waterbirds,” Chapter 14 in Synthesis of U.S. Geological Survey Science for the Chesapeake Bay Ecosystem and Implications for Environmental Management (Washington, D.C: U.S. Geological Survey).
Perry, M.C. and Deller, A.S. 1995. “Waterfowl Population Trends in the Chesapeake Bay Area,” in P. Hill and S. Nelson, eds., Toward a Sustainable Coastal Watershed: The Chesapeake Experiment. Proceedings of a Conference. Chesapeake Research Consortium Publication No. 149 (Edgewater, MD: Chesapeake Research Consortium): 490-500.
Rahmstorf, Stefan 2007, “A Semi-Empirical Approach to Projecting Future Sea-Level Rise,” Science 2007 315: 368-370.
Reed, D.J., D.A. Bishara, D.R. Cahoon, J. Donnelly, M. Kearney, A.S. Kolker, L.L. Leonard, R.A. Orson, and J.C. Stevenson, 2008: “Site-Specific Scenarios for Wetlands Accretion in the Mid-Atlantic Region. Section 2.1” in Background Documents Supporting Climate Change Science Program Synthesis and Assessment Product 4.1: Coastal Elevations and Sensitivity to Sea Level Rise, J.G. Titus and E.M. Strange (eds.), EPA430R07004, Washington, DC: U.S. EPA. http://www.epa.gov/climatechange/effects/downloads/section2_1.pdf
Rignot, E. and Kanagaratnam, P. 2006. “Changes in the Velocity Structure of the Greenland Ice Sheet.” Science 311: 986-990.
Rogers, C.E. and McCarty, J.P. 2000. “Climate Change and Ecosystems of the Mid-Atlantic
Region,” Climate Research 14: 235-244. Schwimmer, R.A. 2001. Rates and Processes of Marsh Shoreline Erosion in Rehoboth Bay,
Delaware, USA. Journal of Coastal Research 17:672-683.
Scientific Review of the Prescribed Fire Program at Blackwater National Wildlife Refuge (Chesapeake Marshlands NWR Complex) and Fishing Bay Wildlife Management Area, February 22, 2005, http://www.fws.gov/blackwater/pdf/scientificreviewfire.pdf
The Scientific and Technical Advisory Committee (STAC). 2003. Chesapeake Futures: Choices for the 21
st Century (Annapolis, MD: Chesapeake Bay Program).
Short, F.T., and Wyllie-Echeverria, S. 2000. “Global Seagrass Declines and Effects of Climate Change,” in C.R.C. Sheppard, ed., Seas at the Millennium: An Environmental Evaluation, Vol III (Amsterdam: Pergamon, Elsevier): 10-11.
Sea-Level Rise and Coastal Habitats in the Chesapeake Bay Region
121
Stevenson and Kearney, 2008, “Impacts of Global Climate Change and Sea-Level Rise on Tidal Wetlands” Pending chapter of manuscript by University of California Press.
Stevenson, Rooth, Sundberg, and Kearney, 2002, “The Health and Long Term Stability of Natural and Restored Marshes in Chesapeake Bay” in Concepts and Controversies in Tidal Marsh Ecology, Springer Netherlands.
Strange, E.M., et al. 2008. “Mid-Atlantic Coastal Habitats and Environmental Implications of Sea Level Rise. Section 3 in J.G. Titus and E.M. Strange, eds. Background Documents Supporting Climate Change Science Program Synthesis and Assessment Product 4.1 EPA 430R07004 (Washington, D.C.: U.S. EPA).
The Nature Conservancy (TNC), “Virginia Coast Reserve.” http://www.nature.org/wherewework/northamerica/states/virginia/preserves/art1244.html (accessed March 12, 2008).
Titus, J.G. 1998. “Rising Seas, Coastal Erosion, and the Takings Clause: How to Save Wetlands Without Hurting Property Owners.” Maryland Law Review 57: 1281-1399.
Titus, J.G., R.A. Park, S.P. Leatherman, J.R. Weggel, M.S. Greene, P.W. Mausel, M.S. Trehan, S. Brown, C. Grant, and G.W. Yohe. 1991. Greenhouse Effect and Sea Level Rise: Loss of Land and the Cost of Holding Back the Sea. Coastal Management 19:2:171-204.
U.S. EPA, National Park Service, and the U.S. Fish & Wildlife Service (FWS). “Climate Change, Wildlife, and Wildlands Case Study: Chesapeake Bay and Assateague Island.” Climate Change, Wildlife, and Wildlands: A Toolkit for Teachers and Interpreters http://www.epa.gov/climatechange/wycd/ORWKit.html (accessed March 11, 2008).
U.S. FWS. 2005. Scientific Review of the Prescribed Fire Program at Blackwater National Wildlife Refuge (Chesapeake Marshlands NWR Complex) and Fishing Bay Wildlife Management Area, February 22, 2005, http://www.fws.gov/blackwater/pdf/scientificreviewfire (accessed February 2008).
Virginia Department of Conservation and Recreation (VDCR), “Virginia’s Rare Natural Environments,” Natural Heritage Resources Fact Sheet, http://www.dcr.virginia.gov/natural_heritage/documents/fsslfen.pdf (accessed March 14, 2008).
VDCR, “Natural Resources Fact Sheet: Migratory Songbird Habitat in Virginia’s Coastal Plain”
WRC 4. “About Watersheds – Wetlands.” Watersheds: Where the Atmosphere Meets the Earth. http://wrc.iewatershed.com/index.php?pagename=education_about_14b (accessed March 10, 2008).
Zervas, C..E., 2001, Sea Level Variations of the United States 1954-1999, NOAA Technical Report NOS CO-OPS 36 (Silver Spring, MD: National Oceanic and Atmospheric Administration).