Embed Size (px)
Citation preview

SEA LEVEL CHANGE, LAST 250 MILLION YEARS
IntroductionOne of the most fundamental geological observations has beenthat the seas once inundated large areas of the Earth’s surfacethat are now exposed on land. Early observers attributed thesemarine incursions to one or multiple “Noachian” floods, butempirical science prevailed as uniformitarian concepts wereapplied to the stratigraphic record. Charles Lyell (1830) recog-nized that changes in sea level due to volcanic activity wereresponsible for the submergence and subsequent emergenceof the temple at Serapis near Naples, Italy (see discussion byGould, 1999). Observing cycles of shallow-water sedimenta-tion across Europe, Lyell reasoned that apparent rises in sealevel could explain the flooding of the continents (geologistscall these “transgressions”) and the subsequent retreat of theseas (called “regressions”). For over a century after Lyell’swork, geologists mapped these advances and retreats of thesea, noting that during intervals such as the middle Cretaceous(ca. 80 MyBP), much of the continents were inundated, whereasat other times, such as today, sea level was much lower. Geol-ogists have equated these transgressions and regressions withglobal sea level (or “eustatic”) changes.
Transgressions and regressions may be related to eustaticsea level changes, but they also are caused by processes of sub-sidence or uplift, and changes in sediment supply. These pro-cesses are revealed by 20th century tide gauge data thatindicate a global sea-level rise of �1.5–2 mm yr�1 (Churchet al., 2001), due to the effects of ocean warming and meltingof glaciers. However, tide gauge data for the mid-Atlantic Uni-ted States uniformly show a rise of greater than 3 mm yr�1, inpart due to regional subsidence (Psuty and Collins, 1986).Although sea level is rising globally, relative sea level (in thisregion a term encompassing both the effects of subsidence/uplift and eustatic change) is rising much faster. High sedimentsupply can cause regression even during a relative sea levelrise. For example, relative sea level is rising rapidly in the Mis-sissippi Delta region due to the effects of global sea-level riseand rapid regional subsidence. Consequently, this region is gen-erally experiencing a rapid transgression. However, near themouth of the Mississippi, the high supply of sediments resultsin regression as the delta builds upward and into the Gulf. Thesemodern examples illustrate the differences between a eustaticrise, a relative rise in sea level, and a marine transgression.
Global sea level has risen and fallen many times in responseto growth and decay of the Northern Hemisphere Ice Sheetsthat have dominated the last 2.5 Myr (“the Ice Ages”). Drillingof submerged reef terrace records off Barbados (Figure S3)and Tahiti provided Rosetta Stone, which showed a 120 mlower sea level than present during the Last Glacial Maximum(Fairbanks, 1989; Bard et al., 1996). Uplifted reef terracerecords (corrected for long-term uplift) have extended globalsea-level estimates back to 130,000 years ago (Fairbanks andMatthews, 1978; Chappell et al., 1996); however, it has provendifficult to firmly extend reef terrace records further back intime due to dating problems.
Pre-Quaternary sea level changeOxygen isotope ratios (d18O) provide a potential means forreconstructing sea-level change over the past 100 Myr. d18O
SEA LEVEL CHANGE, LAST 250 MILLION YEARS 879
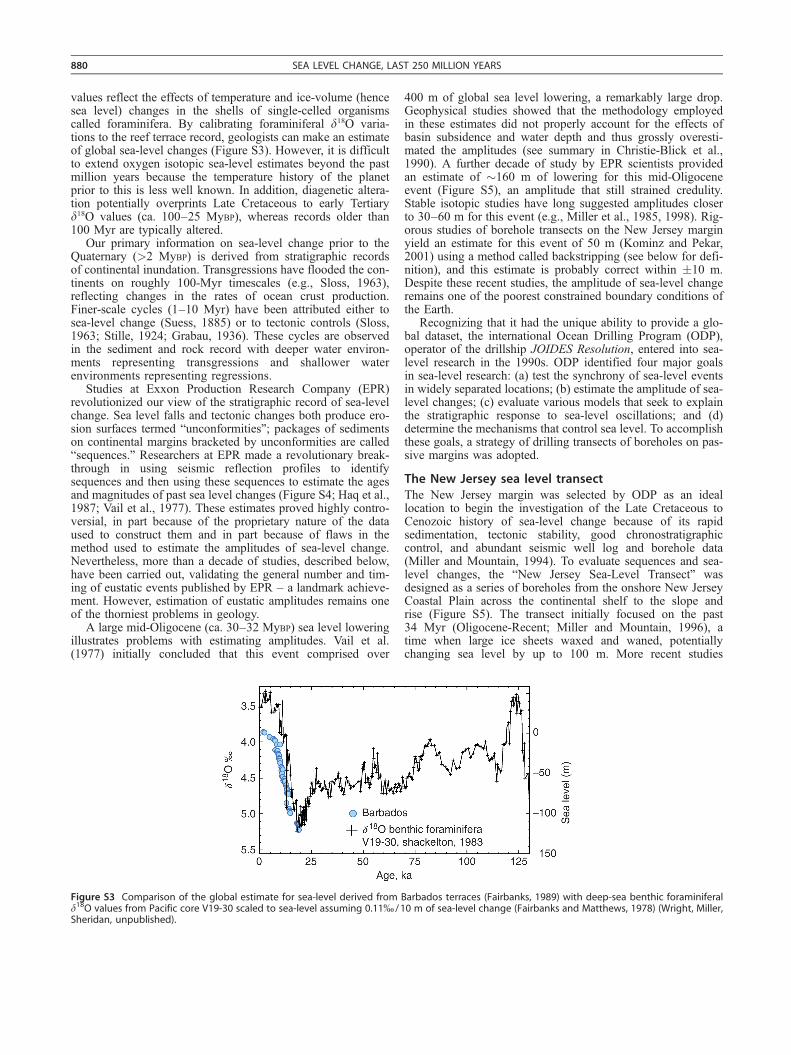
values reflect the effects of temperature and ice-volume (hencesea level) changes in the shells of single-celled organismscalled foraminifera. By calibrating foraminiferal d18O varia-tions to the reef terrace record, geologists can make an estimateof global sea-level changes (Figure S3). However, it is difficultto extend oxygen isotopic sea-level estimates beyond the pastmillion years because the temperature history of the planetprior to this is less well known. In addition, diagenetic altera-tion potentially overprints Late Cretaceous to early Tertiaryd18O values (ca. 100–25 MyBP), whereas records older than100 Myr are typically altered.
Our primary information on sea-level change prior to theQuaternary (>2 MyBP) is derived from stratigraphic recordsof continental inundation. Transgressions have flooded the con-tinents on roughly 100-Myr timescales (e.g., Sloss, 1963),reflecting changes in the rates of ocean crust production.Finer-scale cycles (1–10 Myr) have been attributed either tosea-level change (Suess, 1885) or to tectonic controls (Sloss,1963; Stille, 1924; Grabau, 1936). These cycles are observedin the sediment and rock record with deeper water environ-ments representing transgressions and shallower waterenvironments representing regressions.
Studies at Exxon Production Research Company (EPR)revolutionized our view of the stratigraphic record of sea-levelchange. Sea level falls and tectonic changes both produce ero-sion surfaces termed “unconformities”; packages of sedimentson continental margins bracketed by unconformities are called“sequences.” Researchers at EPR made a revolutionary break-through in using seismic reflection profiles to identifysequences and then using these sequences to estimate the agesand magnitudes of past sea level changes (Figure S4; Haq et al.,1987; Vail et al., 1977). These estimates proved highly contro-versial, in part because of the proprietary nature of the dataused to construct them and in part because of flaws in themethod used to estimate the amplitudes of sea-level change.Nevertheless, more than a decade of studies, described below,have been carried out, validating the general number and tim-ing of eustatic events published by EPR – a landmark achieve-ment. However, estimation of eustatic amplitudes remains oneof the thorniest problems in geology.
A large mid-Oligocene (ca. 30–32 MyBP) sea level loweringillustrates problems with estimating amplitudes. Vail et al.(1977) initially concluded that this event comprised over
400 m of global sea level lowering, a remarkably large drop.Geophysical studies showed that the methodology employedin these estimates did not properly account for the effects ofbasin subsidence and water depth and thus grossly overesti-mated the amplitudes (see summary in Christie-Blick et al.,1990). A further decade of study by EPR scientists providedan estimate of �160 m of lowering for this mid-Oligoceneevent (Figure S5), an amplitude that still strained credulity.Stable isotopic studies have long suggested amplitudes closerto 30–60 m for this event (e.g., Miller et al., 1985, 1998). Rig-orous studies of borehole transects on the New Jersey marginyield an estimate for this event of 50 m (Kominz and Pekar,2001) using a method called backstripping (see below for defi-nition), and this estimate is probably correct within �10 m.Despite these recent studies, the amplitude of sea-level changeremains one of the poorest constrained boundary conditions ofthe Earth.
Recognizing that it had the unique ability to provide a glo-bal dataset, the international Ocean Drilling Program (ODP),operator of the drillship JOIDES Resolution, entered into sea-level research in the 1990s. ODP identified four major goalsin sea-level research: (a) test the synchrony of sea-level eventsin widely separated locations; (b) estimate the amplitude of sea-level changes; (c) evaluate various models that seek to explainthe stratigraphic response to sea-level oscillations; and (d)determine the mechanisms that control sea level. To accomplishthese goals, a strategy of drilling transects of boreholes on pas-sive margins was adopted.
The New Jersey sea level transectThe New Jersey margin was selected by ODP as an ideallocation to begin the investigation of the Late Cretaceous toCenozoic history of sea-level change because of its rapidsedimentation, tectonic stability, good chronostratigraphiccontrol, and abundant seismic well log and borehole data(Miller and Mountain, 1994). To evaluate sequences and sea-level changes, the “New Jersey Sea-Level Transect” wasdesigned as a series of boreholes from the onshore New JerseyCoastal Plain across the continental shelf to the slope andrise (Figure S5). The transect initially focused on the past34 Myr (Oligocene-Recent; Miller and Mountain, 1996), atime when large ice sheets waxed and waned, potentiallychanging sea level by up to 100 m. More recent studies
Figure S3 Comparison of the global estimate for sea-level derived from Barbados terraces (Fairbanks, 1989) with deep-sea benthic foraminiferald18O values from Pacific core V19-30 scaled to sea-level assuming 0.11% /10 m of sea-level change (Fairbanks and Matthews, 1978) (Wright, Miller,Sheridan, unpublished).
880 SEA LEVEL CHANGE, LAST 250 MILLION YEARS

Figure S4 Cenozoic portion of the Haq et al. (1987) sea-level record.
SEA LEVEL CHANGE, LAST 250 MILLION YEARS 881
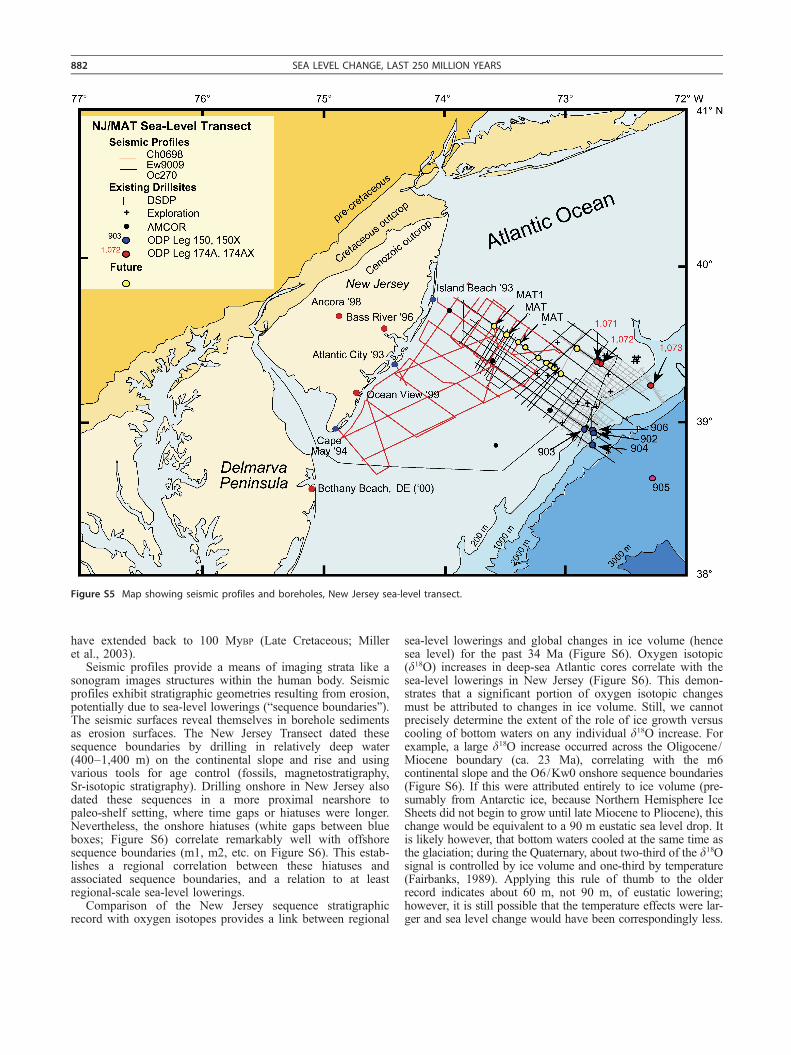
have extended back to 100 MyBP (Late Cretaceous; Milleret al., 2003).
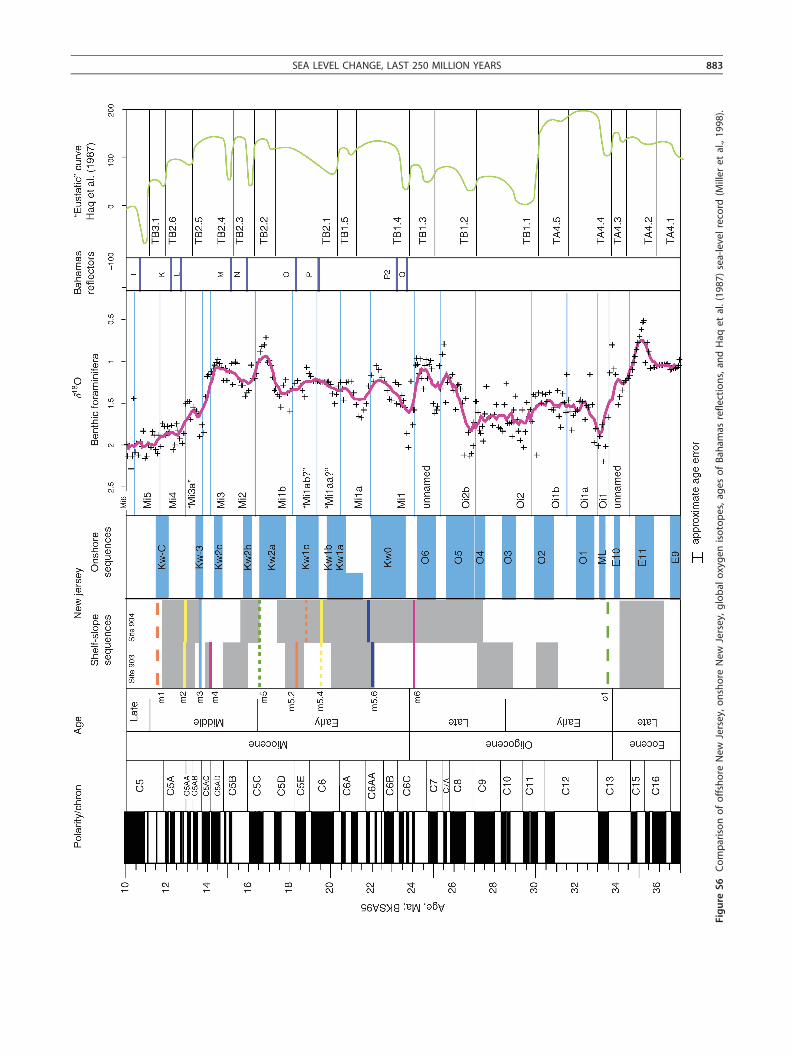
Seismic profiles provide a means of imaging strata like asonogram images structures within the human body. Seismicprofiles exhibit stratigraphic geometries resulting from erosion,potentially due to sea-level lowerings (“sequence boundaries”).The seismic surfaces reveal themselves in borehole sedimentsas erosion surfaces. The New Jersey Transect dated thesesequence boundaries by drilling in relatively deep water(400–1,400 m) on the continental slope and rise and usingvarious tools for age control (fossils, magnetostratigraphy,Sr-isotopic stratigraphy). Drilling onshore in New Jersey alsodated these sequences in a more proximal nearshore topaleo-shelf setting, where time gaps or hiatuses were longer.Nevertheless, the onshore hiatuses (white gaps between blueboxes; Figure S6) correlate remarkably well with offshoresequence boundaries (m1, m2, etc. on Figure S6). This estab-lishes a regional correlation between these hiatuses andassociated sequence boundaries, and a relation to at leastregional-scale sea-level lowerings.
Comparison of the New Jersey sequence stratigraphicrecord with oxygen isotopes provides a link between regional
sea-level lowerings and global changes in ice volume (hencesea level) for the past 34 Ma (Figure S6). Oxygen isotopic(d18O) increases in deep-sea Atlantic cores correlate with thesea-level lowerings in New Jersey (Figure S6). This demon-strates that a significant portion of oxygen isotopic changesmust be attributed to changes in ice volume. Still, we cannotprecisely determine the extent of the role of ice growth versuscooling of bottom waters on any individual d18O increase. Forexample, a large d18O increase occurred across the Oligocene/Miocene boundary (ca. 23 Ma), correlating with the m6continental slope and the O6/Kw0 onshore sequence boundaries(Figure S6). If this were attributed entirely to ice volume (pre-sumably from Antarctic ice, because Northern Hemisphere IceSheets did not begin to grow until late Miocene to Pliocene), thischange would be equivalent to a 90 m eustatic sea level drop. Itis likely however, that bottom waters cooled at the same time asthe glaciation; during the Quaternary, about two-third of the d18Osignal is controlled by ice volume and one-third by temperature(Fairbanks, 1989). Applying this rule of thumb to the olderrecord indicates about 60 m, not 90 m, of eustatic lowering;however, it is still possible that the temperature effects were lar-ger and sea level change would have been correspondingly less.
Figure S5 Map showing seismic profiles and boreholes, New Jersey sea-level transect.
882 SEA LEVEL CHANGE, LAST 250 MILLION YEARS
Figure
S6
Comparisonofoffshore
New
Jersey,
onshore
New
Jersey,
global
oxygenisotopes,ag
esofBah
amas
reflections,an
dHaq
etal.(1987)sea-levelrecord
(Miller
etal.,1998).
SEA LEVEL CHANGE, LAST 250 MILLION YEARS 883

The above example illustrates the hazards of trying to estimateeustatic amplitudes from oxygen isotopic records. Though conti-nental margin stratigraphic records are complicated by changesin subsidence, it is possible to evaluate subsidence histories usinga method called backstripping. This method progressivelyremoves the effects of compaction, sediment loading, and ther-mal subsidence; the residual provides an estimate of eustaticsea level (e.g., Kominz et al., 1998; Watts and Steckler, 1979).Backstripping requires estimates of age, sediment type (fordecompaction), and paleowater depth; the latter is obtained frombenthic foraminifera and lithologic data and is the greatest sourceof uncertainty. Kominz et al. (1998) and Van Sickel et al.(2004) backstripped individual onshore New Jersey boreholes(“1-dimensional” backstripping) and found amplitudes of 20–40 m. Two-dimensional backstripping (backstripping an entireprofile using several boreholes) of ten latest Eocene to earliestMiocene sequences provided estimates of �20–60 m eustaticlowerings (Kominz and Pekar, 2001). Both one and two dimen-sional backstripping yielded Oligocene-Miocene eustatic esti-mates that are lower than those published by the EPR group(e.g., Haq et al., 1987) by a factor of two or more (Kominz andPekar, 2001; Van Sickel et al., 2004).
Studies of sea-level change must be global in scope andODP has drilled on the Australian margin (Legs 133, 182,and 194) and the Bahamas (Leg 166). Despite the fundamentaldifference in sedimentation style between carbonate and silici-clastic margins, ODP drilling documented similar-Mioceneunconformities in these diverse settings (Figure S6). Drillingin the Bahamas showed that the flanks of a carbonate bankenvironment develop sequences that are remarkably similar incharacter to those of siliciclastic margins (Eberli et al., 1997).Though tectonic effects (e.g., rapid subsidence) influence muchof the northeast Australian region (Davies et al., 1993), conse-quences of global sea-level change on the evolution of the Mar-ion Plateau and the Great Barrier Reef were evaluated. Drillingon the Australian margin by Leg 194 (Isern et al., 2002) pro-vided an estimate of a major late middle Miocene eustatic low-ering of 33 � 12 m based on Airy (point) loading to 85 � 30assuming rigid crust (flexural loading). These wide rangesagain illustrate the difficulty in estimating global sea-levelamplitudes.
Causes of sea level changeDrilling on the New Jersey, Bahamas, and Australian marginshave firmly demonstrated that ice-volume changes have beenone of the primary controls on sea-level change during the Ice-house world of the past 34 Myr. It is not surprising that this istrue because ice-volume changes are the only known mechan-ism for causing the large (>10s m), rapid changes in sea levelreported for this time interval. The close correspondencebetween the oxygen isotopic and continental margin recordsis testament to this linkage (Figure S6). However, what aboutthe vast amounts of geologic time in which the Earth was pre-sumably ice-free?
Sea level during the Cretaceous (144–65 Ma) was muchhigher than at present because of long-term changes in sealevel. These long-term (10–100 Myr scale) sea-level changeshave been largely controlled by tectonics. For example, duringthe warm interval of the middle Cretaceous (ca. 80–90 Ma),global sea level was between 100 (Miller et al., 2005) and170 m (Müller et al., 2008) higher than today. However, suchhigh sea levels cannot be explained by a warmer planet and
the absence of ice sheets: even if all of the modern ice sheetswere melted (an “ice-free Greenhouse world”), then sea-levelwould be only 73 m higher than today. Although the Cretac-eous oceans were 10–12 �C warmer than today, thermal expan-sion could only account for another 10–13 m of rise. Thegenerally accepted explanation for the high mid-Cretaceous sealevels is high sea-floor spreading rates; higher rates mean hottercrust, which expands, displacing seawater and causing long-term flooding of the continents (Hays and Pitman, 1973;Kominz, 1984). This pulse of mid-Cretaceous high seafloorspreading has been recently disputed (Rowley, 2002), thoughvarious stratigraphic data unequivocally show that relativeto the continents, sea level was 100–250 m higher, based onbackstripping in the former case (Watts and Steckler, 1979)and continental flooding in the latter (Sahagian et al., 1996).If not caused by high-sea floor spreading rates, the long-termflooding and subsequent retreat of the sea over the past 180Myr could have been the result of the breakup of the supercon-tinent Pangea, beginning at 180 Ma, which may have led tooverall subsidence of continents relative to the oceans duringthe Jurassic to mid-Cretaceous.
Even more puzzling than the long-term record is the obser-vation that large (10s to 100 m), rapid (less than 1 Myr) sea-level changes occurred during the Triassic to middle Eocene(ca. 250–50 Ma), a time considered to be an ice-free Green-house (Haq et al., 1987; Hallam, 1992). Ice-volume changes(glacioeustasy) are the only known mechanism for producinglarge, rapid sea-level change (Pitman and Golovchenko,1983). Although it has been believed in general that there wereno significant ice sheets prior to the middle Eocene, Haq et al.(1987) delineated numerous Cretaceous to early Eocenesequence boundaries with associated large (>50 m), rapid(<1 Myr) sea-level lowerings. There are four explanations forthis apparent paradox (Browning et al., 1996): (a) the Cretac-eous to early Eocene sequences summarized by Haq et al.(1987) were restricted to local basin(s) and do not reflect eus-tasy (this is unlikely considering that many have been widelyrecognized; e.g., Aubry, 1985; Mancini and Tew, 1991, 1995;Olsson, 1991); (b) the sequences were controlled by low-amplitude sea-level changes (e.g., 10 m of lowering in 1 Myrcan be explained by numerous mechanisms; Donovan andJones, 1979); (c) mechanisms of sea-level change are not fullyunderstood; and (d) there were ice sheets throughout much ofthe Cretaceous to early Eocene (e.g., Stoll and Schrag, 1996).
Drilling in New Jersey has recently provided a record ofsea-level changes during the warm Late Cretaceous. These stu-dies firmly document that large (>25 m), rapid (�1 Myr)eustatic variations occurred in the Late Cretaceous, hinting atthe presence of ice sheets in this supposedly ice-free Green-house world (Figure S7). Continuous coring recovered 11–14Upper Cretaceous sequences at Bass River and Ancora, NewJersey that were dated by integrating Sr-isotopic and biostrati-graphic data (age resolution �0.5 Myr) and subsequently back-stripped taking into account sediment loading, compaction,paleodepth, and thermo-flexural subsidence, providing a newsea-level estimate. The timing of Late Cretaceous sequenceboundaries in New Jersey is similar to sea-level loweringsfound by EPR (Haq et al., 1987), NW European sections(Hancock, 1993), and Russian sections (Sahagian et al.,1996), indicating a global cause (Figure S7). However, NewJersey and Russian Platform eustatic estimates are half of theEPR amplitude; the EPR record also differs in shape from thebackstripped estimates. The use of the EPR record for the Late
884 SEA LEVEL CHANGE, LAST 250 MILLION YEARS

Figure
S7
ComparisonofLate
Cretaceousdeep-seabenthicforaminiferald
18Orecords,NewJerseycomposite
sequences,relative
sealevelfrom
NW
Europe(Han
cock,1993),backstripped
Russianplatform
record
(Sah
agianetal.,1996),theEP
Reustatic
estim
ate(Haq
etal.,1987),backstrippedR2eustatic
estim
atesforBassRiver
(black)an
dAncora
(gray)
andourbest
estim
ateofeustatic
chan
ges(heavy
black
lineconstrainedbydata,
dashed
inferred).Pinkarrowsindicatepositive
d18O
inflections(inferredcoolin
gan
d/o
ricevo
lumeincreases)
(after
Milleretal.,2004).
SEA LEVEL CHANGE, LAST 250 MILLION YEARS 885
Cretaceous should be abandoned; the New Jersey backstrippedrecords provide the best substitute at this time.
The firm documentation of large (>25 m), rapid (<Myr) sea-level changes (Figure S7) indicates some glacioeustatic controlduring the Late Cretaceous. The apparent inconsistency with evi-dence for warm high latitudes during the Late Cretaceous can beexplained by ephemeral (i.e., lasting �1 Myr) ice sheets (pre-sumably in East Antarctica (EAIS)) with volumes approachingone-third to one-half of the modern EAIS (Miller et al., 1999)and intervening warm, ice-free intervals (Miller et al., 2003).
Oxygen isotopic comparisons with Late Cretaceoussequence boundaries have not attained the resolution neededto link the two datasets unequivocally, as has been done forthe past 42 Myr (Miller et al., 1998a). Nevertheless, compari-sons between Late Cretaceous sequence stratigraphy and d18Orecords are intriguing (Figure S7), further suggesting smallice sheets in this alleged Greenhouse World: (a) a major mid-Cenomanian sequence boundary (hiatus ca. 96–97 Myr ago)(see also Gale et al., 2002) correlates with a major (>1%)d18O increase; (b) two minor d18O increases spanning theCenomanian/Turonian boundary may correlate with sequenceboundaries; (c) a mid-Turonian sea-level lowering (91.5–92 Ma) may correlate with a major increase in benthic forami-niferal d18O values (�1.0%), although additional data areneeded to determine the precise timing of the increase (Fig-ure S7). Several other Coniacian-Campanian d18O increa-ses (dashed arrows, Figure S7) may be related to sequenceboundaries, but the data are too sparse to provide a firmcorrelation.
The EPR sea-level records (Vail et al., 1977; Haq et al.,1987) are major achievements for the Earth sciences. However,it is not surprising after 15–25 years, that we conclude thatthese previous sea-level estimates are not entirely correct intheir shape and amplitudes. Methods for extracting sea levelfrom stratigraphic data have advanced during this period andthe scientific community has begun to document amplitudesof sea-level change with increased precision. Despite their lim-itations, the EPR curves stand the test of time as an approxi-mate chronology (�1 Myr) of eustatic lowerings. Studies onthe New Jersey and other continental margins have generallyconfirmed the number and approximate ages of sea-level low-erings of Haq et al. (1987) for the past 100 Myr (Figures S6,S7). In the absence of other datasets for the Triassic-Early Cre-taceous, the Haq et al. (1987) record still provides the best esti-mate for the timing of eustatic lowerings. Although the timingcan be estimated, the amplitudes of sea-level change during theTriassic-Early Cretaceous remain poorly constrained and thecausal mechanisms for the large, rapid sea-level changes forthis interval can only be explained by glacioeustasy. Is ourunderstanding of causal mechanisms for global sea-levelchange flawed, or is our interpretation of a largely ice-free pla-net prior to 42 Ma incorrect?
ODP drilling has determined ages of sequence boundarieson continental margins to better than �0.5 Myr and provideda chronology of eustatic lowering for the past 42 Myr(Figure S6). ODP has also validated the transect approach ofdrilling passive continental margins and carbonate platforms(onshore, shelf, slope). Additional integrated geological andgeophysical studies of transects of margins are needed toaddress the history magnitude, and mechanisms of global sealevel change over the past 250 Myr.
Kenneth G. Miller
BibliographyAubry, M.-P., 1985. Northern European Paleogene magnetostratigraphy,
biostratigraphy and paleogeography: Calcareous nannofossil evidence.Geology, 13, 198–202.
Bard, E., Hamelin, B., Arnold, M., Montaggioni, L.F., Cabioch, G., Faure, G.,and Rougerie, F., 1996. Deglacial sea-level record from Tahiti coralsand the timing of global meltwater discharge. Nature, 382, 1996.
Browning, J.V., Miller, K.G., and Pak, D.K., 1996. Global implications ofEocene greenhouse and doubthouse sequences on the New Jerseycoastal plain – The icehouse cometh. Geology, 24, 639–642.
Chappell, J., Omura, A., Esat, T., McMulloch, M., Pandelfi, J., Ota, Y., andPillans, B., 1996. Reconciliation of late Quaternary sea levels derivedfrom coral terraces at Huon Peninsula with deep sea oxygen isotoperecords. Earth Planet. Sci. Lett., 141, 227–236.
Christie-Blick, N., Mountain, G.S., and Miller, K.G., 1990. Seismic strati-graphic record of sea-level change. In Sea-level Change. Washington,D.C.: National Academy Press, pp. 116–140.
Church, J.A., Gregory, J.M., Huybrechts, P., et al., 2001. Changes in sealevel. In Houghton, J.T., Ding, Y., Griggs, D.J., et al. (eds), ClimateChange 2001: The Scientific Basis. Cambridge: Cambridge UniversityPress, pp. 639–693.
Davies, K.A., McKenzie, P.J., Palmer-Julson, A., et al., 1993. In Proceed-ings of the Ocean Drilling Program, Scientific Results, vol. 133: Col-lege Station, TX.
Donovan, D.T., and Jones, E.J.W., 1979. Causes of world-wide changes insea level. J. Geol. Soc. Lond., 136, 187–192.
Eberli, G.P., Swart, P.K., Malone, M.J., et al., 1997. In Proceedings of theOcean Drilling Program, Initial Reports, vol. 166, College Station, TX.
Fairbanks, R.G., 1989. A 17,000-year glacio-eustatic sea level record:Influence of glacial melting rates on the Younger Dryas event anddeep-ocean circulation. Nature, 342, 637–642.
Fairbanks, R.G., and Matthews, R.K., 1978. The marine oxygen isotopicrecord in Pleistocene coral, Barbados, West Indies. Quaternary Res.,10, 181–196.
Gale, A.S., Hardenbol, J., Hathaway, B., Kennedy, W.J., Young, J.R., andPhansalkar, V., 2002. Global correlation of Cenomanian (Upper Cretac-eous) sequences: Evidence for Milankovitch control on sea level. Geol-ogy, 30, 291–294.
Grabau, A.W., 1936. Oscillation of pulsation. Report of the XVI session,International Geological Congress, Washington, 1933, vol. 1, pp.539–553.
Gould, S.J., 1999. Pozzuoli’s pillars revisited. Nat. Hist., 24, 81–91.Hallam, A., 1992. Phanerozoic Sea-level Changes. New York: Columbia
University Press, 266pp.Hancock, J.M., 1993. Transatlantic correlations in the Campanian-
Maastrichtian stages by eustatic changes of sea-level. In Hailwood, E.A.,and Kidd, R.B. (eds.), High resolution stratigraphy. London: GeologicalSociety, pp. 241–256.
Haq, B.U., Hardenbol, J., and Vail, P.R., 1987. Chronology of fluctuatingsea levels since the Triassic (250 million years ago to present). Science,235, 1156–1167.
Hays, J.D., and Pitman, W.C. III., 1973. Lithospheric plate motion, sea levelchanges, and climatic and ecological consequences. Nature, 246, 18–22.
Isern, A.R., Anselmetti, F.S., Blum, P., et al., 2002. Proceedings of theOcean Drilling Program, Initial Reports, vol. 194, College Station,TX. Available at: http: / /www-odp.tamu.edu /publications / 194_IR/194ir.htm.
Kominz, M.A., 1984. Oceanic ridge volumes and sea-level change – Anerror analysis. In Schlee, J.S. (ed.), Interregional Unconformities andHydrocarbon Accumulation. Am. Assoc. Petrol. Geol., Memoir, 36,pp. 108–127.
Kominz, M.A., and Pekar, S.F., 2001. Oligocene eustasy from two-dimensional sequence stratigraphic backstripping. Geol. Soc. Am. Bull.,113, 291–304.
Kominz, M.A., Miller, K.G., and Browning, J.V., 1998. Long-term andshort-term global Cenozoic sea-level estimates. Geology, 26, 311–314.
Lyell, C., 1830. Principles of Geology: Being an attempt to explain the for-mer changes of the Earth’s surface, by reference to causes now inoperation, London: John Murray.
Mancini, E.A., and Tew, B.H., 1991. Relationships of Paleogene stages andplanktonic foraminiferal zone boundaries to lithostratigraphic and allos-tratigraphic contacts in the eastern Gulf Coastal Plain. J. ForaminiferalRes., 21, 48–66.
886 SEA LEVEL CHANGE, LAST 250 MILLION YEARS
Mancini, E.A., and Tew, B.H., 1995. Geochronology, biostratigraphy andsequence stratigraphy of a marginal marine to marine shelf stratigraphicsuccession: Upper Paleocene and lower Eocene, Wilcox Group, easternGulf Coastal Plain, USA. In Berggren, W.A., Kent, D.V., Aubry, M.-P.,Hard Enbol, J. (eds.), Geochronology, Time Scales and Global Strati-graphic Correlation. Society of Economic Paleontology and Mineral-ogy (SEPM) Special publication 54, pp. 281–293.
Miller, K.G., and Mountain, G.S., 1994. Global sea-level change and theNew Jersey margin. Proceedings of the Ocean Drilling Program, InitialReports, vol. 150, College Station, TX, pp. 11–20.
Miller, K.G., Mountain, G.S., the Leg 150 Shipboard Party, and Membersof the New Jersey Coastal Plain Drilling Project, 1996, drilling and dat-ing New Jersey Oligocene-Miocene sequences: Ice volume, global sealevel, and Exxon records. Science, 271, 1092–1094.
Miller, K.G., Mountain, G.S., and Tucholke, B.E., 1985. Oligocene glacio-eustasy and erosion on the margins of the North Atlantic. Geology, 13,1–13.
Miller, K.G., Mountain, G.S., Browning, J.V., Kominz, M., Sugarman, P.J.,Christie-Blick, N., Katz, M.E., and Wright, J.D., 1998. Cenozoic globalsea level, sequences, and the New Jersey transect: Results from coastalplain and continental slope drilling. Rev. Geophys., 36, 569–601.
Miller, K.G., Barrera, E., Olsson, R.K., Sugarman, P.J., and Savin, S.M.,1999. Does ice drive early Maastrichtian eustasy? Global d18O andNew Jersey sequences. Geology, 27, 783–786.
Miller, K.G., Sugarman, P.J., Browning, J.V., Kominz, M.A., Hernández,J.C., Olsson, R.K., Wright, J.D., Feigenson, M.D., and VanSickel, W., 2003. A Late Cretaceous chronology of large, rapid sea-level changes: Glacioeustasy during the greenhouse world. Geology,585–588.
Miller, K.G., Sugarman, P.J., Browning, J.V., Kominz, M.A., Olsson, R.K.,Feigenson, M.D., and Hernandez, J.C., 2004. Upper Cretaceoussequences and sea level history, New Jersey coastal plain: Chronology,facies, and sea level. GSA Bull., 116, 368–393.
Miller, K.G., Kominz, M.A., Browning, J.V., Wright, J.D., Mountain, G.S.,Katz, M.E., Sugarman, P.J., Cramer, B.S., Christie-Blick, N., and Pekar,S.F., 2005, The Phanerozoic record of global sea-level change: Science,v. 310, p. 1293–1298.
Olsson, R.K., 1991. Cretaceous to Eocene sea-level fluctuations on theNew Jersey margin. Sediment. Geol., 70, 195–208.
Pitman, W.C. III, and Golovchenko, X., 1983. The effect of sea-level changeon the shelf edge and slope of passive margins. Society of EconomicPaleontology and Mineralogy (SEPM) Special publication 33, pp. 41–58.
Psuty, N.P., and Collins, M., 1986. Holocene sea level in New Jersey. Phys.Geogr., 7, 156–167.
Rowley, D.B., 2002. Rate of plate creation and destruction: 180 Ma to pre-sent. Geol. Soc. Am. Bull., 114(8), 927–933.
Sahagian, D., Pinous, O., Olferiev, A., Zakaharov, V., and Beisel, A., 1996.Eustatic curve for the middle Jurassic-Cretaceous based on Russianplatform and Siberian stratigraphy: Zonal resolution. Am. Assoc. Petrol.Geol. Bull., 80, 1433–1458.
Sloss, L.L., 1963. Sequences in the cratonic interior of North America.Geol. Soc. Am. Bull., 74, 93–114.
Stille, H., 1924. Grundfragen der Vergleichenden Tektonik. Berlin:Borntraeger.
Stoll, H.M., and Schrag, D.P., 1996. Evidence for glacial control of rapidsea level changes in the early Cretaceous. Science, 272, 1771–1774.
Suess, E., 1885. Da Antlitz de Erde, 1. Prague: F. Tempsky.Vail, P.R., Mitchum, R.M. Jr., Todd, R.G., Widmier, J.M., Thompson, S.
III., Sangree, J.B., Bubb, J.N., and Hatlelid, W.G., 1977. Seismic strati-graphy and global changes of sea level. In Payton, C.E. (ed.), SeismicStratigraphy – Applications to Hydrocarbon Exploration. Am. Assoc.Petrol. Geol. Mem., 26, 49–212.
Van Sickel, W.A, Kominz, M.A., Miller, K.G., and Browning, J.V., 2004.Late Cretaceous and Cenozoic sea-level estimates backstripping analy-sis of borehole data, onshore New Jersey. Basin Res., 16, 451–465.
Watts, A.B., and Steckler, M.S., 1979. Subsidence and eustasy at the con-tinental margin of eastern North America. AGU Maurice Ewing Ser.,3, 218–234.
Cross-referencesCenozoic Climate ChangeForaminiferaGlacial Eustasy
Greenhouse (Warm) ClimatesIcehouse (Cold) ClimatesOcean Drilling Program (ODP)Oxygen IsotopesSea Level Change, Post-GlacialSea Level Change, QuaternarySea Level Rise, in Encyclopedia of World Climatology
SEA LEVEL CHANGE, POST-GLACIAL 887


![Waste no more? Emerging bio -energy business models in … · 2019-05-13 · [XS] Micro: < 1 million USS small: 1-25 million US$ Medium: 25-250 million US$ [L] Large: > 250](https://img.pdfslide.us/doc/110x75/5f10187e7e708231d4476c8c/waste-no-more-emerging-bio-energy-business-models-in-2019-05-13-xs-micro.jpg)