Embed Size (px)
Citation preview
Sea Level Change in Western Australia
Application to Coastal Planning
Department of Transport Coastal Infrastructure, Coastal Engineering Group
Version Description Author Date 0 Final Report Charlie Bicknell 2/02/2010

Sea Level Change in Western Australia
TABLE OF CONTENTS
1 INTRODUCTION.........................................................................................................11.1 State Coastal Planning Policy ........................................................................ 1
1.2 Projecting Future Change .............................................................................. 2
1.3 The Intergovernmental Panel on Climate Change (IPCC) ............................. 2
1.4 Commonwealth Scientific and Industrial Research Organisation (CSIRO).... 2
2 HISTORICAL CHANGES............................................................................................32.1 Global sea level change................................................................................. 3
2.2 Regional sea level change ............................................................................. 5
2.3 Vertical land movements................................................................................ 6
3 SHORT TERM CHANGES IN SEA LEVEL.................................................................84 LONG TERM CHANGES IN SEA LEVEL .................................................................10
4.1 Emission Scenarios...................................................................................... 10
4.2 Global Projections for Sea Level Rise.......................................................... 12
4.3 Regional Variations in Sea Level Projections .............................................. 14
4.4 Recent comparisons of sea level projections against records ..................... 15
5 SUMMARY & RECOMMENDATIONS ......................................................................17
TABLES
Table 1 - Estimated rates of historic global mean sea level rise.............................................. 3
Table 2 - Major processes influencing sea level variability along the southwest WA coastline (Pattaratchi & Eliot, 2005)................................................................................................. 8
Table 3 - IPCC Description (IPCC, 2000) .............................................................................. 10
FIGURES
Figure 1 - Reconstruction of global mean sea level (GMSL) from tide gauge recordings 1870 to 2004. One (dark shading) and two (light shading) standard deviation error estimates shown. .............................................................................................................................. 4
Figure 2 - Global mean sea level from October 1992 from satellite altimetry.......................... 4
Figure 4 - Mean sea level trends from satellite altimetry (Oct 1992 to Jul 2009)..................... 5
Figure 5 - Time series of annual mean tide gauge recordings at Fremantle with linear trend superimposed (red line).................................................................................................... 5
Figure 5 - Location of tide gauges managed by DoT............................................................... 6
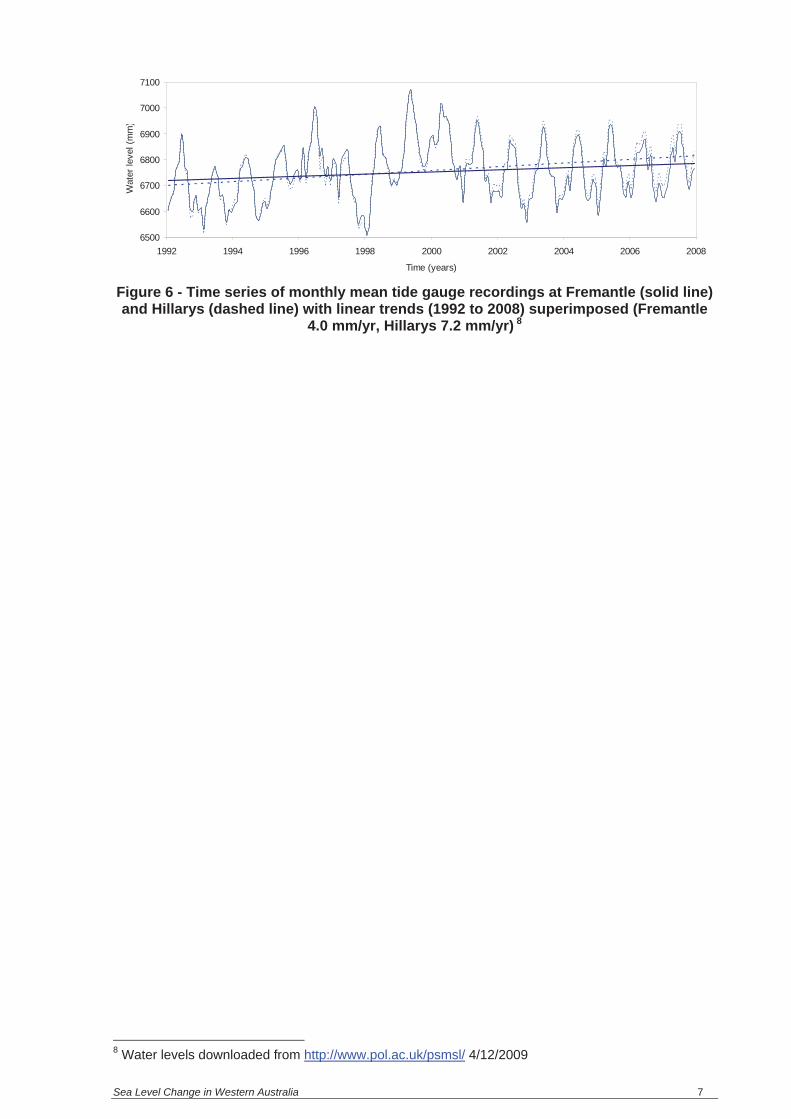
Figure 6 - Time series of monthly mean tide gauge recordings at Fremantle (solid line) and Hillarys (dashed line) with linear trends (1992 to 2008) superimposed (Fremantle 4.0mm/yr, Hillarys 7.2 mm/yr)........................................................................................... 7
Figure 7 - Fremantle average annual sea level variation (1930 to 2008) ................................ 8
Figure 8 - Fremantle monthly mean water level with sea level rise and seasonal trends removed (dark blue) SOI Index scaled by 10 (light blue) ................................................. 9

Sea Level Change in Western Australia
Figure 9 - IPCC storyline and scenario families (IPCC, 2000)............................................... 10
Figure 10 - Global carbon dioxide emissions......................................................................... 11
Figure 11 - IPCC AR4 sea level rise projections through the 21st century including scaled-up ice sheet discharge (dashed lines for 5th percentile and solid lines for 95th percentile) 12
Figure 12 - Inertia in the climate system (Garnaut 2008 after IPCC 2001b: Figure 5.2) ....... 13
Figure 13 - Plausible upper bound estimates of sea level rise .............................................. 14
Figure 14 - Multi-model mean IPCC SRES scenario A1B projected sea level departure from the global mean for 2070 (mm) ...................................................................................... 15
Figure 15 - Global mean sea level, comparison of satellite recording against IPCC AR4 projections ...................................................................................................................... 16
Figure 16 - Recommended allowance for sea level rise in coastal planning for WA (red line SRES scenario A1FI 95th percentile after Hunter (2009), normalised to 2010, blue line continuation of scenario to 2010) ................................................................................... 19
LIST OF ABBREVIATIONS
ACE CRC Antarctic Climate and Ecosystems Corporative Research Centre CSIRO Commonwealth Scientific and Industrial Research Organisation CDIAC Carbon Dioxide Information Analysis Center DoT Department of Transport ENSO El Niño – southern oscillation IPCC Intergovernmental Panel on Climate Change IPCC AR4 Intergovernmental Panel on Climate Change Fourth Assessment Report IPCC TAR Intergovernmental Panel on Climate Change Third Assessment Report IPCC SRES Intergovernmental Panel on Climate Change Special Report on Emissions
scenariosPSMSL Permanent Service for Mean Sea Level SOI Southern oscillation index SPP 2.6 Statement of Planning Policy No. 2.6: State Coastal Planning Policy UNEP United Nations Environment Programme WA Western Australia WBGU German Advisory Council on Global Change (Wissenschaftlicher Beirat der
Bundesregierung Globale Umweltveränderungen) WMO World Meteorological Organization

Sea Level Change in Western Australia 1
1 INTRODUCTION
This report has been prepared to review the current information on mean sea level variation along the Western Australian (WA) coastline, and to provided recommendations on an appropriate allowance for mean sea change to be used in coastal planning. It draws extensively from the existing work undertaken by the Intergovernmental Panel on Climate Change (IPCC), Commonwealth Scientific and Industrial Research Organisation (CSIRO), and the Antarctic Climate and Ecosystems Corporative Research Centre (ACE CRC).
In reading this report it should be understood that mean sea level change, although in many instances a dominant factor, is only one of the key environmental variables that may be effected by climate change. These key environmental variables include:
� mean sea level;
� ocean currents and temperature;
� wind climate;
� wave climate;
� rainfall / runoff; and
� air temperature.
The combined coastal impact of these variables will vary across the state and requires consideration on a local scale and case by case basis.
This report focuses only on mean sea level and does not consider the changes to extreme water levels which will occur as a result of the rise in mean sea level and possibly through changes in storminess. Further information on estimating extreme water levels can be gained from viewing the ACE CRC website www.sealevelrise.info.
1.1 State Coastal Planning Policy The WA Planning Commission Statement of Planning Policy No. 2.6: State Coastal Planning Policy provides guidance for the incorporation of mean sea level change in the determination of a coastal setback for new development. The policy is currently based on:
� A 100-year planning time frame and ocean forces and coastal processes which have a statistical recurrence of once per one hundred years.
� The mean of the median model of the latest Assessment Report of the IPCC Working Group. At the time of gazettal (10 June 2003) this was the Third Assessment Report of the IPCC (January 2001), which corresponded to a sea level rise prediction of 0.38 m between 2000 and 2100.
The IPCC has now provided revised projections (IPCC AR4, 2007) for global mean sea level and some additional work has also been undertaken by CSIRO to determine local variations around the Australian coastline.

Sea Level Change in Western Australia 2
1.2 Projecting Future Change Estimating future changes in sea level is a complex process. Our understanding of future projections is greatly improved by our review of historical change and our assessment of natural variability. The basis of this approach is:
1. estimation of historical change;
2. estimation of (short term) natural variability; and
3. projection of long term change.
1.3 The Intergovernmental Panel on Climate Change (IPCC) The IPCC is a scientific intergovernmental body set up by the World Meteorological Organization (WMO) and the United Nations Environment Programme (UNEP) in 1988. The IPCC's mandate is as follows:
The IPCC was established to provide the decision-makers and others interested in climate change with an objective source of information about climate change. The IPCC does not conduct any research nor does it monitor climate related data or parameters. Its role is to assess on a comprehensive, objective, open and transparent basis the latest scientific, technical and socio-economic literature produced worldwide relevant to the understanding of the risk of human-induced climate change, its observed and projected impacts and options for adaptation and mitigation. IPCC reports should be neutral with respect to policy, although they need to deal objectively with policy relevant scientific, technical and socio economic factors. They should be of high scientific and technical standards, and aim to reflect a range of views, expertise and wide geographical coverage.
The Fourth Assessment Report (IPCC AR4) of the IPCC was published in early 2007 and consists of a number of volumes under the umbrella title Climate Change 20071. An assessment of historical sea level change and projections for future change are contained within the Physical Science Basis, contributions of Working Group I to the Fourth Assessment Report. The work of the IPCC is focused on global climatic variations with some reference to regional variations.
1.4 Commonwealth Scientific and Industrial Research Organisation (CSIRO) In 2007 the CSIRO released the technical report Climate Change in Australia2. The purpose of this report was to provide an assessment of observed climate change around Australia, the likely causes, and projections of future changes to Australia’s climate. It provides an assessment of the regional variation in the IPCC global climate change projections. The report discusses global rise in mean sea level over the period 1980-1999 to 2090-2099, and regional rise in mean sea level at 2070. In addition, it discusses the possible changes in extreme high sea levels at various sites around Australia at 2030, 2050 and 2070.
Continued research has been undertaken by the CSIRO's Wealth from Oceans National Research Flagship Programme in partnership with the Antarctic Climate and Ecosystems Corporative Research Centre (ACE CRC). Estimates of global and regional sea level change and associated publications are available from the website www.cmar.csiro.au/sealevel/.
1 Copies of IPPC reports are available from Cambridge University Press or can be downloaded for the website www.ipcc.ch2 Climate Change in Australia can be downloaded from http://www.climatechangeinaustralia.gov.au/

Sea Level Change in Western Australia 3
2 HISTORICAL CHANGES
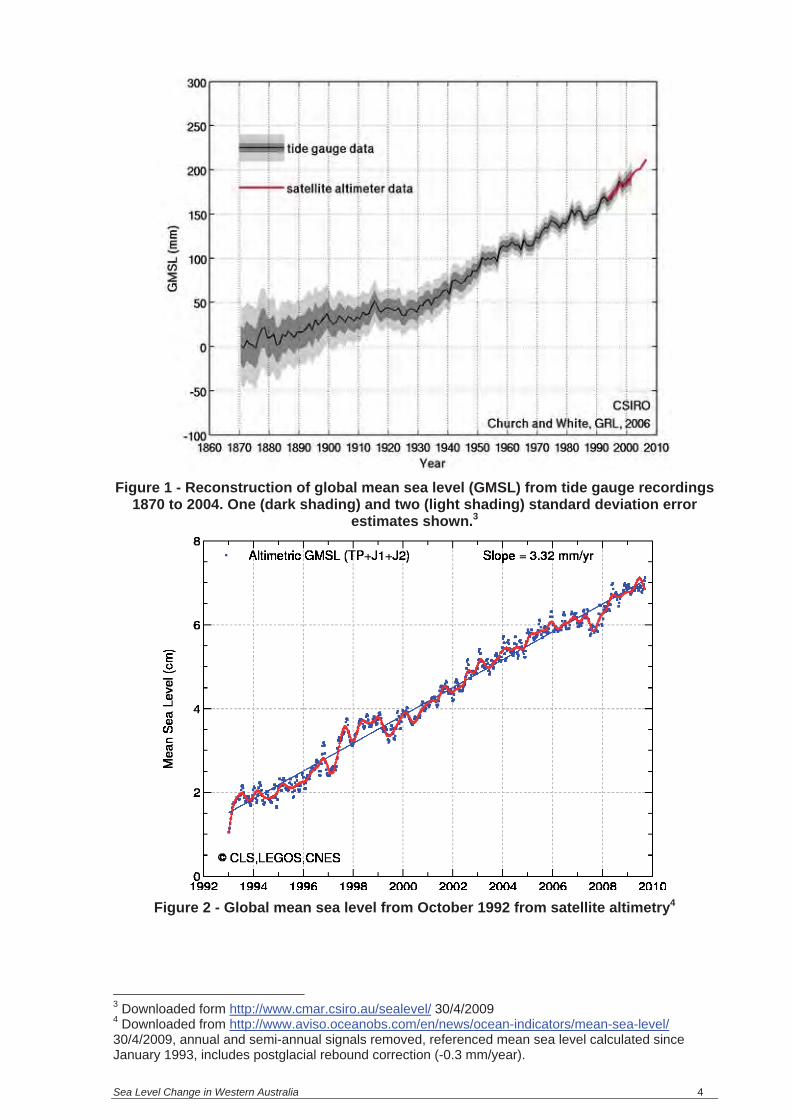
2.1 Global sea level change Historic global sea level variation can be estimated from the analysis of tide gauge recordings around the world. Church & White (2006) used monthly mean sea level recordings from the database of the Permanent Service for Mean Sea Level (PSMSL; http://www.pol.ac.uk/psmsl/) to reconstruct the global sea level from 1870 to 2004, refer to Figure 1. This included corrections for vertical land movement due to glacial isostatic adjustment (refer to Section 2.3). The error range in these estimates increases for earlier recordings due to the uncertainty of datum adjustments, vertical land movement and the paucity of tide gauges.
Estimates of recent global sea level change have been significantly improved following the introduction of satellite altimeters in late 1992, refer to Figure 2.
It is now accepted that global sea level has risen over the past two centuries. Following a period (about 2000 years) of little change, global sea level began to rise at the start of the 19th century (CSIRO 2009) and has continued through the 20th century. The rate of rise over the 20th century was an order of magnitude larger than the rate of rise over the two millennia prior to the 18th century (Church et al. 2007). In addition, reconstruction of historic recordings indicates that there has been a statistically significant increase in the rate of rise from 1870 to 2004 (CSIRO 2009).
More recent observations from satellite altimetry since late 1992 indicate that the rate of rise over the past two decades has been significantly greater than the average rate over the 20th century. Estimates of historic global mean sea level rise are provided in Table 1.
Table 1 - Estimated rates of historic global mean sea level rise
Period Global sea level rise Reference
Jan 1870 to Dec 2004 1.44 mm/yr Church et al. (2006)
20th century 1.7 � 0.5 mm/yr. IPCC AR4
1961 to 2003 1.8 � 0.5 mm/yr IPCC AR4
Jan 1993 to Jul 2009 3.32 ± 0.6 mm/yr Aviso (2009)
Sea Level Change in Western Australia 4
Figure 1 - Reconstruction of global mean sea level (GMSL) from tide gauge recordings 1870 to 2004. One (dark shading) and two (light shading) standard deviation error
estimates shown.3
Figure 2 - Global mean sea level from October 1992 from satellite altimetry4
3 Downloaded form http://www.cmar.csiro.au/sealevel/ 30/4/2009 4 Downloaded from http://www.aviso.oceanobs.com/en/news/ocean-indicators/mean-sea-level/30/4/2009, annual and semi-annual signals removed, referenced mean sea level calculated since January 1993, includes postglacial rebound correction (-0.3 mm/year).

Sea Level Change in Western Australia 5
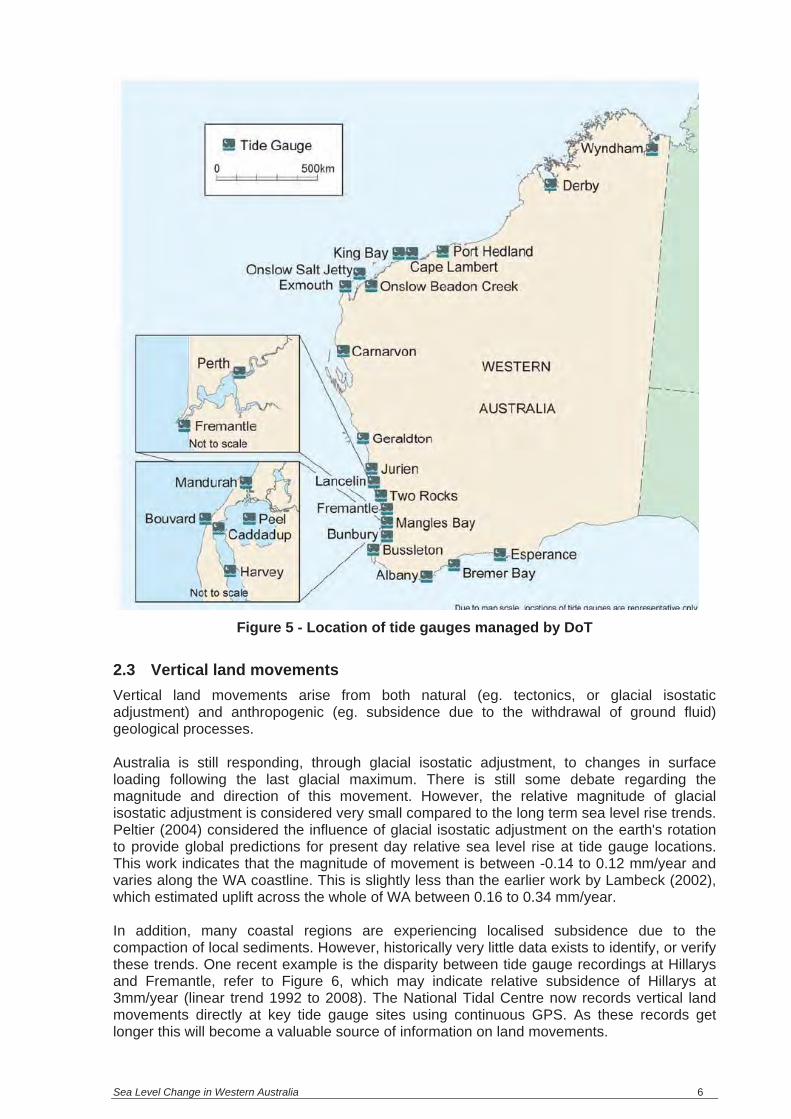
2.2 Regional sea level change The recent introduction of satellite altimetry has provided improved observations of global sea level, and shown that sea level change has not been uniform across the globe, refer to Figure 3. Local variations in sea level along the WA coast, over the past century, have been recorded using tide gauges. The Department of Transport (DoT) collects data from 28 tide gauges from Esperance to Wyndham, refer to Figure 5. This includes recordings from the Fremantle tide gauge which date back to 1897, one of the world's longest recordings.
Regional trends can noticeably differ from the global average. However, the relative5 mean sea level rise at Fremantle, estimated from tidal record from 1897 to 2004 is approximately 1.54 mm/yr (Pattaratchi & Eliot, 2005), refer to Figure 4. Although the standard error has not been calculated, this estimates is considered similar to the global mean.
Figure 3 - Mean sea level trends from satellite altimetry (Oct 1992 to Jul 2009)6
6500
6550
6600
6650
6700
6750
6800
6850
6900
1890 1900 1910 1920 1930 1940 1950 1960 1970 1980 1990 2000 2010
Time (years)
Frem
antle
wat
er le
vel (
mm
)
Figure 4 - Time series of annual mean tide gauge recordings at Fremantle with linear trend superimposed (red line)7
5Without correction for vertical land movement, refer to Section 2.3 6Downloaded from http://www.aviso.oceanobs.com/en/news/ocean-indicators/mean-sea-level/4/12/2009 7 Water levels downloaded from http://www.pol.ac.uk/psmsl/ 4/12/2009
Sea Level Change in Western Australia 6
Figure 5 - Location of tide gauges managed by DoT
2.3 Vertical land movements Vertical land movements arise from both natural (eg. tectonics, or glacial isostatic adjustment) and anthropogenic (eg. subsidence due to the withdrawal of ground fluid) geological processes.
Australia is still responding, through glacial isostatic adjustment, to changes in surface loading following the last glacial maximum. There is still some debate regarding the magnitude and direction of this movement. However, the relative magnitude of glacial isostatic adjustment is considered very small compared to the long term sea level rise trends. Peltier (2004) considered the influence of glacial isostatic adjustment on the earth's rotation to provide global predictions for present day relative sea level rise at tide gauge locations. This work indicates that the magnitude of movement is between -0.14 to 0.12 mm/year and varies along the WA coastline. This is slightly less than the earlier work by Lambeck (2002), which estimated uplift across the whole of WA between 0.16 to 0.34 mm/year.
In addition, many coastal regions are experiencing localised subsidence due to the compaction of local sediments. However, historically very little data exists to identify, or verify these trends. One recent example is the disparity between tide gauge recordings at Hillarys and Fremantle, refer to Figure 6, which may indicate relative subsidence of Hillarys at 3mm/year (linear trend 1992 to 2008). The National Tidal Centre now records vertical land movements directly at key tide gauge sites using continuous GPS. As these records get longer this will become a valuable source of information on land movements.
Sea Level Change in Western Australia 7
6500
6600
6700
6800
6900
7000
7100
1992 1994 1996 1998 2000 2002 2004 2006 2008
Time (years)
Wat
er le
vel (
mm
)
Figure 6 - Time series of monthly mean tide gauge recordings at Fremantle (solid line) and Hillarys (dashed line) with linear trends (1992 to 2008) superimposed (Fremantle
4.0 mm/yr, Hillarys 7.2 mm/yr) 8
8 Water levels downloaded from http://www.pol.ac.uk/psmsl/ 4/12/2009

Sea Level Change in Western Australia 8
3 SHORT TERM CHANGES IN SEA LEVEL
There are a number of shorter term fluctuations in sea level, which superimpose the gradual long term trends. Research by Pattaratchi & Eliot (2005) identified the major processes influencing sea level variability along the southwest WA coastline, refer to Table 2.
Table 2 - Major processes influencing sea level variability along the southwest WA coastline (Pattaratchi & Eliot, 2005)
Time scale Dominant Processes Maximum range
12-24 hours Astronomical tide 0.80 m
1-10 days Storm surge 0.80 m
Seasonal Leeuwin Current 0.30 m
Inter-annual ENSO 0.30 m
There is a strong seasonal variation in mean sea level, influenced mainly by the seasonal patterns of the Leeuwin Current. This results in an increased mean sea level during winter and a decreased mean sea level during summer. The winter peak occurs around March-April in the north of WA and gradually gets later towards the south, peaking around May-July at Fremantle, refer to Figure 7.
-100-50
050
100150
Jan Feb Mar Apr May Jun Jul Aug Sep Oct Nov Dec
Month
Frem
antle
wat
er le
vel
varia
tion
(mm
)
Figure 7 - Fremantle average annual sea level variation (1930 to 2008)9
There is also a strong inter-annual relationship between the El Niño - Southern Oscillation (ENSO) and mean sea level (Pattaratchi & Eliot 2005, Provis & Radok 1979; Aubrey & Emery 1986; Pariwono et al. 1986; Pattiaratchi & Buchan 1991; Feng et al. 2004, BOM 2006). Comparing the Southern Oscillation Index (SOI) as an indicator of ENSO, it has been found that a positive SOI, which generally represents La Niña conditions, relates to a stronger Leeuwin Current and increased mean sea level. Correspondingly, a negative SOI, which generally represents El Niño conditions, relates to a weaker Leeuwin Current and decreased mean sea level along the most part of the WA coastline (Allan et al. 2003, Feng et al. 2004). The maximum annual variation in mean sea level at Fremantle since 1930 is approximately 0.3 m (Pattaratchi & Eliot, 2005), and the average annual variation is approximately 0.1 m, refer to Figure 8.
The time scale of ENSO variation is between four and seven years. Geological evidence indicates that the Leeuwin Current has been influential and fluctuating at least since the last interglacial period (McGowran et al. 1997), and there is no indication of decreases in the sea level variation associated with the Leeuwin Current along the WA coastline.
9 Water levels downloaded from http://www.pol.ac.uk/psmsl/ 30/4/2009

Sea Level Change in Western Australia 9
-300
-200
-100
0
100
200
300
1930 1940 1950 1960 1970 1980 1990 2000
Time (years)
Frem
antle
wat
er le
vel (
mm
)S
OI s
cale
d by
10
Figure 8 - Fremantle monthly mean water level with sea level rise and seasonal trends removed (dark blue) SOI Index scaled by 10 (light blue)10
10Water levels downloaded from http://www.pol.ac.uk/psmsl/ 30/4/2009. SOI downloaded from ftp://ftp.bom.gov.au/anon/home/ncc/www/sco/soi/soiplaintext.html 30/4/2009. Sea level rise trends removed using the values estimated in Table 1, seasonal variation removed using the values presented in Figure 7.
Sea Level Change in Western Australia 10
4 LONG TERM CHANGES IN SEA LEVEL
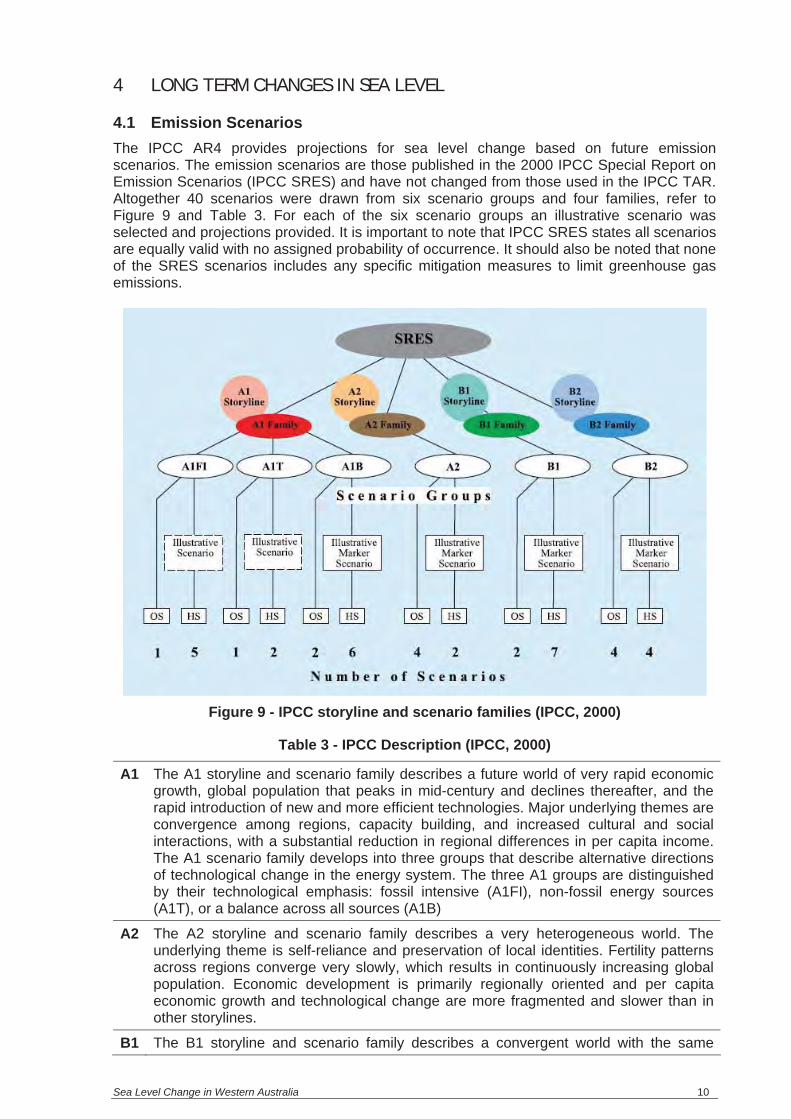
4.1 Emission Scenarios The IPCC AR4 provides projections for sea level change based on future emission scenarios. The emission scenarios are those published in the 2000 IPCC Special Report on Emission Scenarios (IPCC SRES) and have not changed from those used in the IPCC TAR. Altogether 40 scenarios were drawn from six scenario groups and four families, refer to Figure 9 and Table 3. For each of the six scenario groups an illustrative scenario was selected and projections provided. It is important to note that IPCC SRES states all scenarios are equally valid with no assigned probability of occurrence. It should also be noted that none of the SRES scenarios includes any specific mitigation measures to limit greenhouse gas emissions.
Figure 9 - IPCC storyline and scenario families (IPCC, 2000)
Table 3 - IPCC Description (IPCC, 2000)
A1 The A1 storyline and scenario family describes a future world of very rapid economic growth, global population that peaks in mid-century and declines thereafter, and the rapid introduction of new and more efficient technologies. Major underlying themes are convergence among regions, capacity building, and increased cultural and social interactions, with a substantial reduction in regional differences in per capita income. The A1 scenario family develops into three groups that describe alternative directions of technological change in the energy system. The three A1 groups are distinguished by their technological emphasis: fossil intensive (A1FI), non-fossil energy sources (A1T), or a balance across all sources (A1B)
A2 The A2 storyline and scenario family describes a very heterogeneous world. The underlying theme is self-reliance and preservation of local identities. Fertility patterns across regions converge very slowly, which results in continuously increasing global population. Economic development is primarily regionally oriented and per capita economic growth and technological change are more fragmented and slower than in other storylines.
B1 The B1 storyline and scenario family describes a convergent world with the same

Sea Level Change in Western Australia 11
global population that peaks in mid century and declines thereafter, as in the A1 storyline, but with rapid changes in economic structures toward a service and information economy, with reductions in material intensity, and the introduction of clean and resource-efficient technologies. The emphasis is on global solutions to economic, social, and environmental sustainability, including improved equity, but without additional climate initiatives.
B2 The B2 storyline and scenario family describes a world in which the emphasis is on local solutions to economic, social, and environmental sustainability. It is a world with continuously increasing global population at a rate lower than A2, intermediate levels of economic development, and less rapid and more diverse technological change than in the B1 and A1 storylines. While the scenario is also oriented toward environmental protection and social equity, it focuses on local and regional levels.
In comparison the Garnaut Report (2008) developed two new sets of emissions projections: the Platinum Age for the period out to 2030; and the reference case for the period out to 2100. Both projections are based on constant policy scenarios where no further policies are put in place to mitigate climate change. Over the course of the 21st century, emissions in the reference case are comparable with or above those of the IPCC SRES highest emission scenario (A1FI).
Estimates of global greenhouse gas emissions by the Carbon Dioxide Information Analysis Center (CDIAC) indicate that global carbon dioxide emissions are now approximately following the fossil fuel intense A1FI scenario from 2004 to 2008, refer to Figure 10.
5.0
5.5
6.0
6.5
7.0
7.5
8.0
8.5
9.0
9.5
10.0
1990 1992 1994 1996 1998 2000 2002 2004 2006 2008 2010
Time (years)
Glo
bal c
arbo
n di
oxid
e em
issi
ons
(GtC
/yr)
A1FI A1T A1B A2
B1 B2 Platinum Age CDIAC
Figure 10 - Global carbon dioxide emissions11
11IPCC illustrative scenarios downloaded from http://sres.ciesin.org/final_data.html 23/12/2009,Platinum Age 3.1% annual growth 2005-30 (Garnaut, 2008), CDIAC (Carbon Dioxide Information Analysis Center) downloaded from http://cdiac.ornl.gov/trends/emis/meth_reg.html 23/12/2009
0
10
20
30
2000 2050 2100

Sea Level Change in Western Australia 12
4.2 Global Projections for Sea Level Rise The IPCC AR4 provides maximum (95th percentile) and minimum (5th percentile) projections of sea level rise at the end of the 21st century for the six SRES illustrative scenarios. To provide a time series of projections between 1990 to 2100 Hunter (2009) scaled the equivalent IPCC TAR projections, refer to Figure 11.
Thermal expansion is responsible for approximately 50-70% of the global sea level rise projections (IPCC 2007, Table 10.7). The remainder comprises melt waters from: glaciers, ice caps, Greenland Ice Sheet and Antarctic Ice Sheet. Changes in terrestrial water storage also influence future sea levels, but these processes are poorly understood and future estimates of these changes were not included in the IPCC AR4 sea level rise projections.
0
100
200
300
400
500
600
700
800
900
1000
1990 2000 2010 2020 2030 2040 2050 2060 2070 2080 2090 2100
Time (years)
Glo
bal m
ean
sea
leve
l (m
m)
A1FI A1FI A1T A1T A1B
A1B MEAN A1B A2 A2 B1B1 B2 B2
Figure 11 - IPCC AR4 sea level rise projections through the 21st century including scaled-up ice sheet discharge (dashed lines for 5th percentile and solid lines for 95th
percentile)12
Current models under estimate the global average sea level rise observed between 1961 to 2003. It is considered likely that this is because they do not include the processes responsible for the observed rapid marginal thinning of ice sheets in the Antarctic Peninsula, West Antarctic and Greenland (IPCC, 2007). To account for this imbalance the IPCC AR4 assumed that the projections might scale up with the global average surface temperature change, which is taken as a measure of the magnitude of climate change. This assumption added 0.1 to 0.2 m to the estimated upper bound depending on the scenario, which is referred to as the 'scaled-up ice sheet discharge'. The projected global sea level rise by 2100, including 'scaled-up ice sheet discharge', is between approximately 0.2 to 0.8 m.
The level of understanding about the magnitude and timing of contributions to sea level rise from ice melt is low (Garnaut, 2008), which has lead to much of the publicised debate on projections. When considering higher projections the IPCC AR4 states that "larger values cannot be excluded, but understanding of these effects is too limited to assess their likelihood or provide a best estimate or an upper bound for sea-level rise."
12 Time series derived by Hunter (2009) by scaling equivalent IPCC TAR projections

Sea Level Change in Western Australia 13
The IPCC AR4 climate models poorly represented the decadal trends evident within the observations of global average ocean temperatures and associated thermal expansion. The post IPPC AR4 work by Domingues et al. (2008) has significantly improved global sea level budget estimates over the last century by including the impacts of volcanic forcing. Major volcanic eruptions have significant short term cooling impacts on global average ocean temperatures. The model trends with volcanic forcing are closer to the observations but are on average about 30 % smaller in the upper 300 m and about 10 % smaller in the upper 700 m.
The highest overall projection of the IPCC AR4 is from the A1FI SRES scenario, which has the highest emissions projections over the 21st century. The equivalent mean projection of the middle-range SRES scenario (A1B) is 0.4 m by 2100. For all scenarios the projected rate of sea level rise is greater than the average rates recorded over the 20th century and accelerates over the 21st century. The projections only significantly diverge after 2050, with little variation in the average or range of each scenario in the earlier part of this century.
The central projections for sea level rise are smaller than the IPCC TAR model means by between 0.03 m to 0.07 m depending on the scenario, and the upper and lower bounds are slightly closer (IPCC, 2007).
If emissions are reduced, the concentrations within the atmosphere should stabilise in around a hundred years, however atmospheric temperatures are not expected to significantly decrease for at least 1,000 years (Solomon et al. 2008). The lag between atmospheric and ocean warming, and the time required for ice sheets to melt, means that sea level is likely to continue to rise for many centuries to come (DCC, 2009), refer to Figure 12.
Figure 12 - Inertia in the climate system (Garnaut 2008 after IPCC 2001b: Figure 5.2)
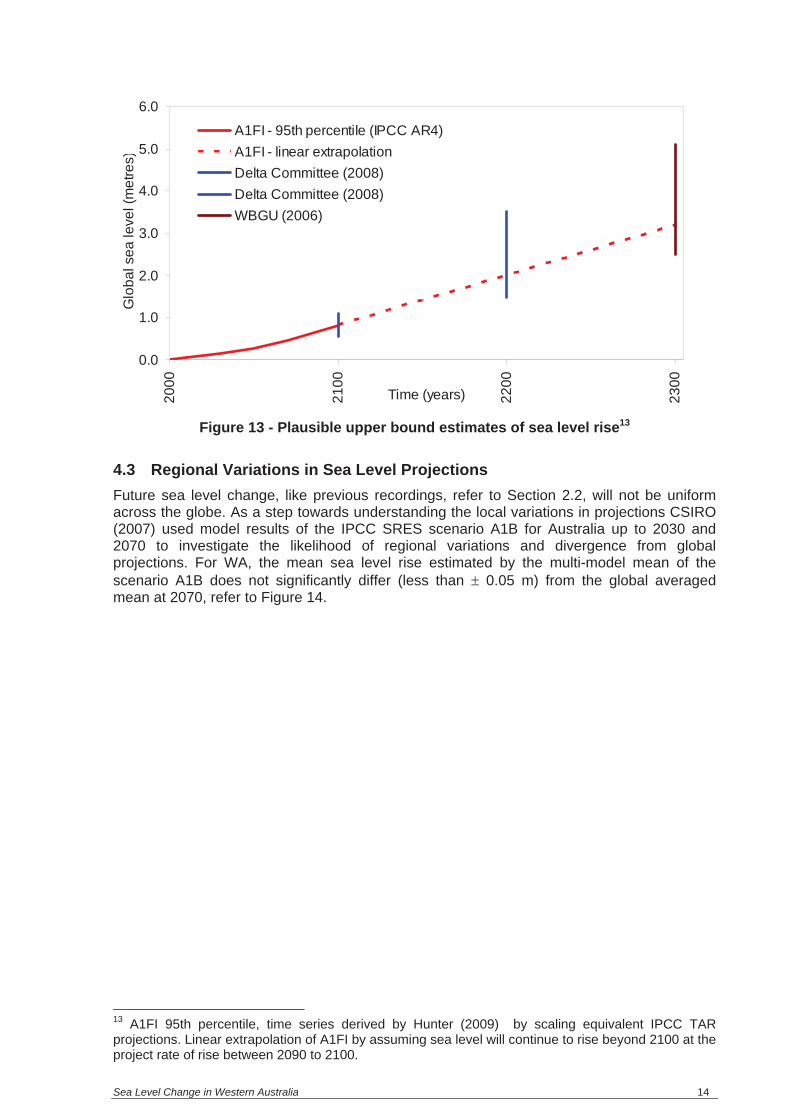
Longer term upper limit projections for sea level rise beyond 2100 have been considered by the Delta Committee (2008) for the Netherlands government, and the WBGU (2006) for the German government. Both estimates are based on the extrapolation of simple relationships similar to Rahmstorf (2007) and the assumption of continued acceleration in ice melt. The long term estimates of global sea level rise are between 1.5 to 3.5 m by 2200, and between 2.5 to 5.1 m by 2300, refer to Figure 13. The IPCC AR4 only includes an assessment of global mean sea level rise due to thermal expansion alone (ie. excluding ice melt) for SRES scenario A1B, to 3000. The estimates suggest that the rate of global sea level rise due to thermal expansion over the 22nd century will be similar to that in the 21st century, with only a slight reduction in the following centuries.
Sea Level Change in Western Australia 14
0.0
1.0
2.0
3.0
4.0
5.0
6.0
2000
2100
2200
2300
Time (years)
Glo
bal s
ea le
vel (
met
res)
A1FI - 95th percentile (IPCC AR4)A1FI - linear extrapolationDelta Committee (2008)Delta Committee (2008)WBGU (2006)
Figure 13 - Plausible upper bound estimates of sea level rise13
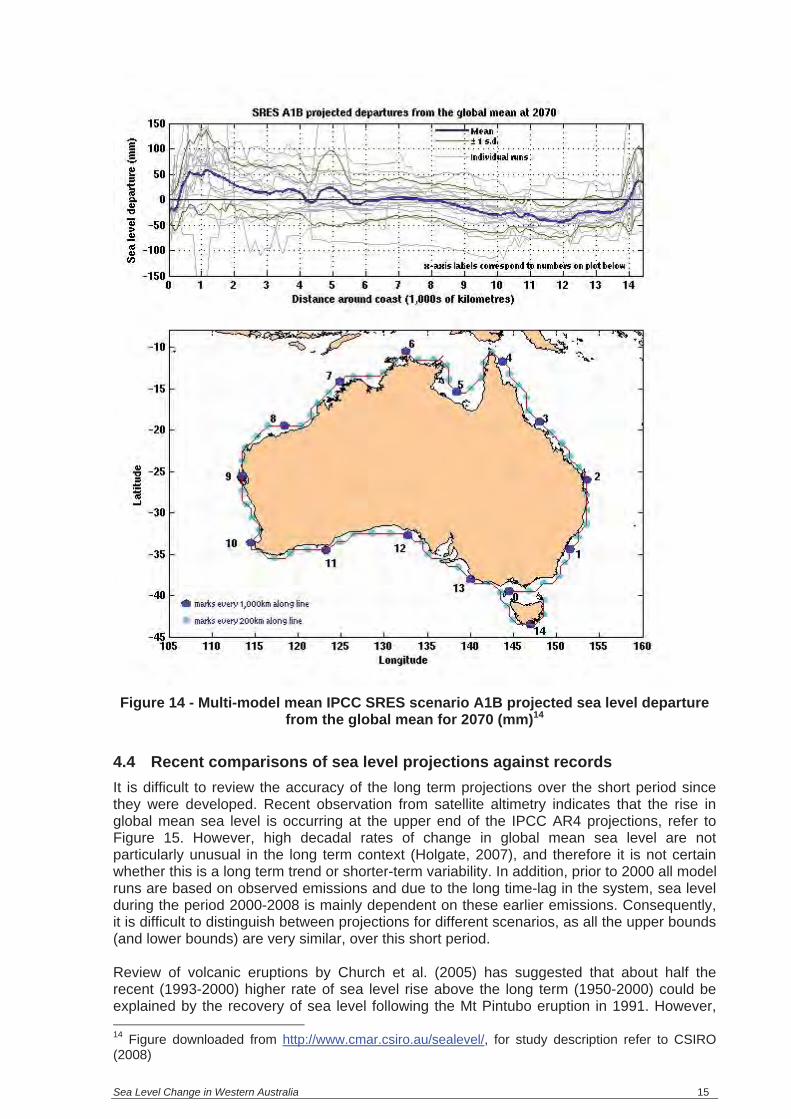
4.3 Regional Variations in Sea Level Projections Future sea level change, like previous recordings, refer to Section 2.2, will not be uniform across the globe. As a step towards understanding the local variations in projections CSIRO (2007) used model results of the IPCC SRES scenario A1B for Australia up to 2030 and 2070 to investigate the likelihood of regional variations and divergence from global projections. For WA, the mean sea level rise estimated by the multi-model mean of the scenario A1B does not significantly differ (less than � 0.05 m) from the global averaged mean at 2070, refer to Figure 14.
13 A1FI 95th percentile, time series derived by Hunter (2009) by scaling equivalent IPCC TAR projections. Linear extrapolation of A1FI by assuming sea level will continue to rise beyond 2100 at the project rate of rise between 2090 to 2100.
Sea Level Change in Western Australia 15
Figure 14 - Multi-model mean IPCC SRES scenario A1B projected sea level departure from the global mean for 2070 (mm)14
4.4 Recent comparisons of sea level projections against records It is difficult to review the accuracy of the long term projections over the short period since they were developed. Recent observation from satellite altimetry indicates that the rise in global mean sea level is occurring at the upper end of the IPCC AR4 projections, refer to Figure 15. However, high decadal rates of change in global mean sea level are not particularly unusual in the long term context (Holgate, 2007), and therefore it is not certain whether this is a long term trend or shorter-term variability. In addition, prior to 2000 all model runs are based on observed emissions and due to the long time-lag in the system, sea level during the period 2000-2008 is mainly dependent on these earlier emissions. Consequently, it is difficult to distinguish between projections for different scenarios, as all the upper bounds (and lower bounds) are very similar, over this short period.
Review of volcanic eruptions by Church et al. (2005) has suggested that about half the recent (1993-2000) higher rate of sea level rise above the long term (1950-2000) could be explained by the recovery of sea level following the Mt Pintubo eruption in 1991. However, 14 Figure downloaded from http://www.cmar.csiro.au/sealevel/, for study description refer to CSIRO (2008)

Sea Level Change in Western Australia 16
there is still great uncertainty regarding the future contribution to sea level rise from the melting of Greenland and Antarctic ice sheets. Observations since the IPCC AR4 have confirmed that the loss of ice mass from both Greenland and Antarctic ice sheets is contributing to sea level rise (Allison et al. 2009). There is also evidence that the mass loss from Greenland since 2003 may be increasing rapidly and all recent estimates exceed the IPCC AR4 values (Allison et al. 2009). However, again, it is not certain whether this is a long term trend or shorter-term variability.
0
10
20
30
40
50
60
1993 1994 1995 1996 1997 1998 1999 2000 2001 2002 2003 2004 2005 2006 2007 2008 2009Time (years)
Glo
bal m
ean
sea
leve
l (m
m)
A1FI 95th percentileA1FI 5th percentileAIB meanSatellite altimeters
Figure 15 - Global mean sea level, comparison of satellite recording against IPCC AR4 projections15
15 Satellite data downloaded from http://www.aviso.oceanobs.com/en/news/ocean-indicators/mean-sea-level/ 30/4/2009, postglacial rebound correction (-0.3 mm/year) added. Rise 1990 to 1993 assumed linear trend 3.3 mm/yr. IPCC AR4 projections taken from Hunter (2009).

Sea Level Change in Western Australia 17
5 SUMMARY & RECOMMENDATIONS
There is undisputable evidence that global mean sea level will continue to rise over the 21st century as a direct result of anthropogenic climate change, and the regional projections indicate that the rate of sea level rise along the WA coastline will be similar to the global mean (CSIRO, 2007).
Over the first half of the 21st century the IPCC AR4 sea level rise projections are very similar for all emissions scenarios. Recent observation from satellite altimetry indicate that the rise in global mean sea level is occurring at the upper end of these projections (Rahmstorf, 2009). However, it is not certain whether this is a long term trend or shorter-term variability.
It is considered likely that the climate change induced rise in mean sea level over the first half of the 21st century will be of a smaller magnitude than short-term non-climate change induced fluctuations. It is therefore especially important to consider these additional non-climate change induced fluctuations over the first half of the 21st century.
The IPCC projections for long term rates of sea level rise through the latter part of the 21st century are closely linked to the emission scenarios. The IPCC TAR and AR4 projections are based on the same SRES 2000 emissions scenarios and consequently there is only a small variation between their mean projections (IPCC, 2007).
There is still great uncertainty regarding the future contribution to sea level rise from the melting of Greenland and Antarctic ice sheets. There is also evidence that the mass loss from Greenland since 2003 may be increasing rapidly and all recent estimates exceed the IPCC AR4 values (Allison et al. 2009). However, again, it is not certain whether this is a long term trend or shorter-term variability.
There is also great uncertainly in the long term predictions of global greenhouse emissions. Recent estimates of global current carbon dioxide emissions from fossil fuels and industry are now approximately following the IPCC A1FI SRES scenario, refer to Figure 10. It is uncertain what success future emissions regulations will have on limiting global emissions through the 21st century.
The allowance for sea level change within the State Coastal Planning Policy is currently based on the prediction of the mean of the median model of the IPCC TAR between the years of 2000 and 2100. The policy gives the following guidance under Section D, Factors to be considered in calculating coastal processes setback:
"The value given for each factor has been based upon the best available data, a conservative estimate of that factor and includes allowance for uncertainty."
It is no longer considered that the current factor for sea level rise of 0.38 m fulfils this guidance.
It is considered that the global sea level projections of the IPCC AR4 currently provide the best basis for statutory decision-making. It is considered appropriate to apply these projections directly to WA as the regional projections do not indicate any significant deviation from the global mean.
Given that estimates of global carbon dioxide emissions since 2004 have approximately following the fossil fuel intense A1FI scenario, and that there is currently uncertainty regarding what global agreements will be implemented to limit emissions, it is considered that the A1FI scenario currently provides the best available precautionary representation of likely future trends in global emissions through the 21st century. This is consistent with the scenarios adopted by the Garnaut Report (2008) over the first half of this century.

Sea Level Change in Western Australia 18
To account for the high level of uncertainty regarding the future contributions to sea level rise from the Antarctic and Greenland ice sheets, and recent observations which suggest the rate of ice mass loss from Greenland may be rapidly increasing above the IPCC AR4 estimates (Allison et al. 2009), it is recommended that the IPCC AR4 upper bound (or 95th percentile) projections including allowance for scaled-up ice sheet discharge be used in preference to the mean as a precautionary approach.
As the rate of sea level rise is projected to increase through the 21st century, it is recommended that the IPCC AR4 projections for sea level rise up to 2100 be extended to 2110 to provide an estimate for a 100 year planning time frame. As a simple estimate it is recommended that this be done by assuming that the rate of global average sea level rise beyond 2100 will be a continuation of the rate of rise between 2090 to 2100, refer to Figure 16.
This report does not consider the changes to extreme water levels which will occur as a result of sea level rise. However, future sea level rise will increase the frequency, and potentially severity, of existing storm inundation events and these impacts will need to be considered for new and existing development.
Key Recommendations:
� It is recommended that the upper bound of the IPCC AR4 global average sea level rise projections be adopted when considering the setback to protect development from coastal processes. The upper bound projection of the IPCC AR4 is considered that of the 95th percentile of the SRES scenario A1FI, including the allowance for 'scaled-up ice sheet discharge'.
� It is recommended that the A1FI projections be extended by assuming that the rate of global average sea level rise beyond 2100 will be a continuation of the rate of rise between 2090 to 2100.
� It is recommended that a vertical sea level rise of 0.9 m be adopted when considering the setback distance and elevation to allow for the impact of coastal processes over a 100 year planning timeframe (2010 to 2110).
� It is recommended for planning timeframes beyond 100 years that a vertical sea level rise of 0.01 m/year be added to 0.9 m for every year beyond 2110.
� It is recommended that this advice be reviewed when the IPCC Working Group I contribution to the Fifth Assessment Report is finalised (currently scheduled for 2013).

Sea Level Change in Western Australia 19
0.00.10.20.30.40.50.60.70.80.91.0
2010
2020
2030
2040
2050
2060
2070
2080
2090
2100
2110
Years
Sea
leve
l ris
e (m
etre
s)
Figure 16 - Recommended allowance for sea level rise in coastal planning for WA (redline SRES scenario A1FI 95th percentile after Hunter (2009), normalised to 2010, blue line
continuation of scenario to 2010)

Sea Level Change in Western Australia 20
REFERENCES
Allison, I, Warner, R, Haward, M, Hilkemeijer, A & Sandford, R, 2009, Position analysis: polar ice sheets and climate change: global impacts, Antarctic Climate & Ecosystems Cooperative Research Centre, www.acecrc.org.au/.
Allan J, Komar, P, & Priest, G, 2003, 'Shoreline variability on the high-energy Oregon coast and its usefulness in erosion-hazard assessments', Journal of Coastal Research,special issue no. 38, pp. 83-105.
Aubrey, DG, & Emery, KO, 1986 'Australia – an unstable platform for tide-gauge measurements of changing sea levels' Journal of Geology, vol. 94, pp. 699-712.
Aviso, 2009, Collecte Localisation Satellites, Centre National d’Etudes Spatiales, viewed 4/12/2009, http://www.aviso.oceanobs.com/en/news/ocean-indicators/mean-sea-level/
BOM (Bureau of Meteorology), 2009, http://www.bom.gov.au/climate/enso/.BOM (Bureau of Meteorology), 2007, The Australian baseline sea level monitoring project
annual sea level data summary report July 2006 - June 2007, National Tidal Centre, Bureau of Meteorology.
BOM (Bureau of Meteorology), 2006, Australian mean sea level survey 2006, National Tidal Centre, Bureau of Meteorology.
Canadell, P, 2009, 'Recent carbon trends and the global carbon budget', Presentation to the Climate Change: Global Risks, Challenges and Decisions Congress, Copenhagen, 10-12 March 2009, http://www.globalcarbonproject.org/products/presentations.htm.
Canadell, JG, Le Quéré, C, Raupach, MR, Field, CB, Buitehuis, ET, Ciais, P,. Conway, TJ, Gillett, NP, Houghton, RA, & Marland, G, 2007, 'Contributions to accelerating atmospheric CO2 growth from economic activity, carbon intensity, and efficiency of natural sinks', Proceedings National Academy of Sciences, vol.104, pp. 18866-18870.
Church, JA, & Hunter, J, 2009. Plausible upper estimates of sea-level rise, Antarctic Climate & Ecosystems Cooperative Research Centre, Technical Report TR SLR006 090506, prepared for Melbourne Water.
Church, JA, White, NJ, Hunter, JR & Lambeck, K, 2008, Briefing: a post-IPCC AR4 update on sea-level rise. Antarctic Climate & Ecosystems Cooperative Research Centre.
Church, JA, Nicholls, RJ, Hay, JE, Gornitz, V, 2007, 'Ice and sea-level change', in J Eamer (ed), A global outlook of ice and snow, United Nations Environment Programme, chapter 6C, pp. 153-180.
Church, JA, & White, NJ, 2006, 'A 20th century acceleration in global sea-level rise' Geophysical Research Letters, vol. 33, L01602.
Church, JA, White, NJ, & Arblaster, JM, 2005, 'Significant decadal-scale impact of volcanic eruptions on sea level and ocean heat content', Nature, vol. 438, pp. 74-77.
Church, JA, White, NJ, Coleman, R, Lambeck, K, & Mitrovica, JX, 2004, 'Estimates of the regional distribution of sea level rise over the 1950–2000 period', Journal of Climate,vol. 17, no. 13, pp. 2609–2625.
CSIRO (Australia Commonwealth Scientific and Industrial Research Organisation), 2007, Climate change in Australia, Commonwealth Scientific and Industrial Research Organisation, Canberra.
CSIRO (Australia Commonwealth Scientific and Industrial Research Organisation), 2009, viewed 30/4/2009, http://www.cmar.csiro.au/sealevel/
DCC (Department of Climate Change), 2009, Climate change risks to Australia's coast,Australian Department of Climate Change, Canberra, ACT
Delta Committee, 2008, Working together with water, findings of the Delta Commisse 2008, Delta Committee The Netherlands.
Domingues, C, Church, J, White, N, Glekler, PJ, Wijffels, SE, Barker, PM, & Dunn JR, 2008, 'Improved estimates of upper-ocean warming and multi-decadal sea-level rise', Nature,vol. 453, pp. 1090-1093, DOI:10.1038.
Douglas, BC, 2001, 'Sea level change in the era of the recording tide gauge', in BC Douglas MS Kearney & SP Leatherman (eds), Sea level rise: history and consequences, Academic Press, San Diego, pp. 37–64.
Engineers Australia, 2009, Submission to the NSW department of environment and climate change on draft policy statement on sea level rise,
Sea Level Change in Western Australia 21
http://www.engineersaustralia.org.au/shadomx/apps/fms/fmsdownload.cfm?file_uuid=89BE9E62-A56B-4DBB-1C3E-F41E3E153CDA&siteName=ieaust
Feng, M, Li, Y, & Meyers, G, 2004, 'Multidecadal variations of Fremantle sea level: footprint of climate variability in the tropical Pacific', Geophysical Research Letters, vol. 31, L16302, doi:10.1029/2004GL019947.
Garnaut, R, 2008, The Garnaut climate change review, Australian National University, Canberra.
Gornitz, V, 1993, 'Mean sea level change in the recent past' In: R Warrick, E Barrow & T Wigley (eds), Climate and sea level change: observations, projections and implications,Cambridge University Press, UK.
Holgate, SJ, 2007, 'On the decadal rates of sea level change during the twentieth century', Geophysical Research Letters, vol. 34, L01602, DOI:10.1029/2006GL028492.
Hunter, J, 2009, 'Estimating sea-level extremes under conditions of uncertain sea-level rise'. Climatic Change, DOI:10.1007/s10584-009-9671-6, published online at www.springerlink.com.
Hunter, J, ,2008, 'Ways of estimating changes in sea-level extremes under conditions of rising sea level', IPWEA National Conference on Climate Change Response, Coffs Harbour, Australia, 3-5 August 2008.
Hunter, J, 2007, 'Estimating sea-level extremes in a world of uncertain sea-level rise' 5th Flood Management Conference, Warrnambool, Australia, 9-12 October 2007.
IPCC (Intergovernmental Panel on Climate Change), 2007, 'Climate change 2007: the physical science basis', Contribution of Working Group I to the Fourth Assessment Report of the Intergovernmental Panel on Climate Change, S Solomon, D Qin, M Manning, Z Chen, M Marquis, KB Averyt, M Tignor & HL Miller (eds), Cambridge University Press, Cambridge, United Kingdom &d New York, USA.
IPCC (Intergovernmental Panel on Climate Change), 2001, 'Climate change 2001: the scientific basis' Contribution of Working Group I to the Third Assessment Report of the Intergovernmental Panel on Climate Change, JT Houghton, Y Ding, DJ Griggs, M Noguer, PJ. van der Linden, & D Xiaosu (eds), Cambridge University Press, UK.
IPCC (Intergovernmental Panel on Climate Change), 2000, Emissions scenarios. special report of the Intergovernmental Panel on Climate Change. N Nakicenovic & R Swart (eds), Cambridge University Press, UK.
Lambeck, K, 2002, 'Sea level change from mid Holocene to recent time: an Australian example with global implications', in: Ice Sheets, Sea Level and the Dynamic Earth,Geodynamics Series 29, pp. 33-50, American Geophysical Union, Washington DC.
McGowran, B, Li, Q, Moss, G, 1997, 'The Cenozoic neritic recording southern Australia: the biogeohistorical framework', in: NP James, J Clarke (eds), Cool-water carbonates,Society for Sedimentary geology, special publication, no. 56, pp. 185–203.
Papadopoulos, A & Tsimplis, M, 2005, 'Coherent coastal sea-level variability at interdecadal and interannual scales from tide gauges', Journal of Coastal Research, vol. 22, no. 3, pp. 625-639.
Pariwono, J, Bye, J & Lennon, G, 1986, 'Long-period variations of sea-level in Australasia', Geophysical Journal of the Royal Astronomical Society, vol 87, pp. 43-54.
Pariwono J, Bye, JAT & Lennon, GW, 1986, 'Long-period variations of sea-level in Australasia', Geophysical Journal International, vol. 87, pp. 43-54.
Pattiaratchi, C & Buchan, S, 1991, 'Implications of long-term climate change for the Leeuwin Current', Journal of the Royal Society of Western Australia, vol. 74, pp. 133-140.
Pattiaratchi, CB & Eliot, M, 2005, 'How our regional sea level has changed', Climate note Indian Ocean Climate Initiative, 9/05 (August), http://www.ioci.org.au/pdf/IOCIclimatenotes_9.pdf
Peltier, WR, 2004, 'Global glacial isostasy and the surface of the ice-age earth: the ICE-5G (VM2) model and GRACE', Annual Review Earth and Planetary Sciences, vol. 32, pp.111-149.
Provis, D & Radok, R, 1979, 'Sea-level oscillations along the Australian coast', AustralianJournal of Marine & Freshwater Research, vol. 30, pp. 295-301.
Pugh, DT, 2004, Changing sea levels: effects of tides, weather and climate. Cambridge University Press, Cambridge, United Kingdom.

Sea Level Change in Western Australia 22
Pugh, 1993, 'Improving sea level data', in: R Warrick, E Barrow & T Wigley (eds), Climate and sea level change. observations, projections and implications, Cambridge University Press, pp. 57-71.
Rahmstorf, S, 2007, 'A semi-empirical approach to projecting future sea level rise', Science,vol. 315, no. 5810, pp. 368– 370.
Rahmstorf, S, Cazenave, A, Church, JA, Hansen, JE, Keeling, RF, Parker, DE, & Somerville, RCJ, 2007, 'Recent climate observations compared to projections', Science, vol. 316, no. 5825, pp. 709, doi:10.1126/science.1136843.
Richardson, K, Steffen, W, Schellnhuber, HJ, Alcamo, J, Barker, T, Kammen, DM, Leemans, R, Liverman, D, Munasinghe, M, Osman-Elasha, B, Stern, N & Wæver, O, 2009, Synthesis Report Climate Change Global Risks, Challenges & Decisions, Copenhagen, International Alliance of Research Universities, 10-12 March 2009, www.climatecongress.ku.dk.
Solomon S, Plattner, G-K, Knutti R & Friedlingstein, P, 2009, 'Irreversible climate change due to carbon dioxide emissions', Proceedings of the National Academy of Sciences, vol. 106, no. 6, pp. 1704–1709.
Steffen, W, 2009, Climate change 2009: faster change and more serious risks, Department of Climate Change, Canberra, ACT.
Western Australian Planning Commission, 2003, State Coastal Planning Policy, statement of planning policy no. 2.6.
Woodworth, PL, White, NJ, Jevrejeva, S, Holgate, SJ, Church, JA & Gehrels, WR, 2008, 'Evidence for the accelerations of sea level on multi-decade and century timescales', International Journal of Climatology, vol. 29, pp. 777-789, DOI: 10.1002/joc.1771.
WBGU (German Advisory Council on Global Change) Schubert, R, Schellnhuber, H-J, Buchmann, N, Epiney, A, Grießhammer, R, Kulessa, M, Messner, D, Rahmstorf, S, & Schmid, J, 2006, The future oceans - warming up, rising high, turning sour, special report, Wissenschaftlicher Beirat der Bundesregierung Globale Umweltveränderungen, Berlin, ISBN 3-936191-14-X

Sea Level Change in Western Australia 23
ACKNOWLEDGEMENTS
John Hunter (Antarctic Climate & Ecosystems Cooperative Research Centre) and Ivan Haigh University of Western Australia for their invaluable technical review.

Sea Level Change in Western Australia 24
}