Embed Size (px)
Citation preview
Is the World Oil Market Unified?Regions in Quality, Risk, & Space
Project LINKUnited Nations, New YorkOctober 20, 2013
Robert K. KaufmannDepartment of Earth & EnvironmentBoston University
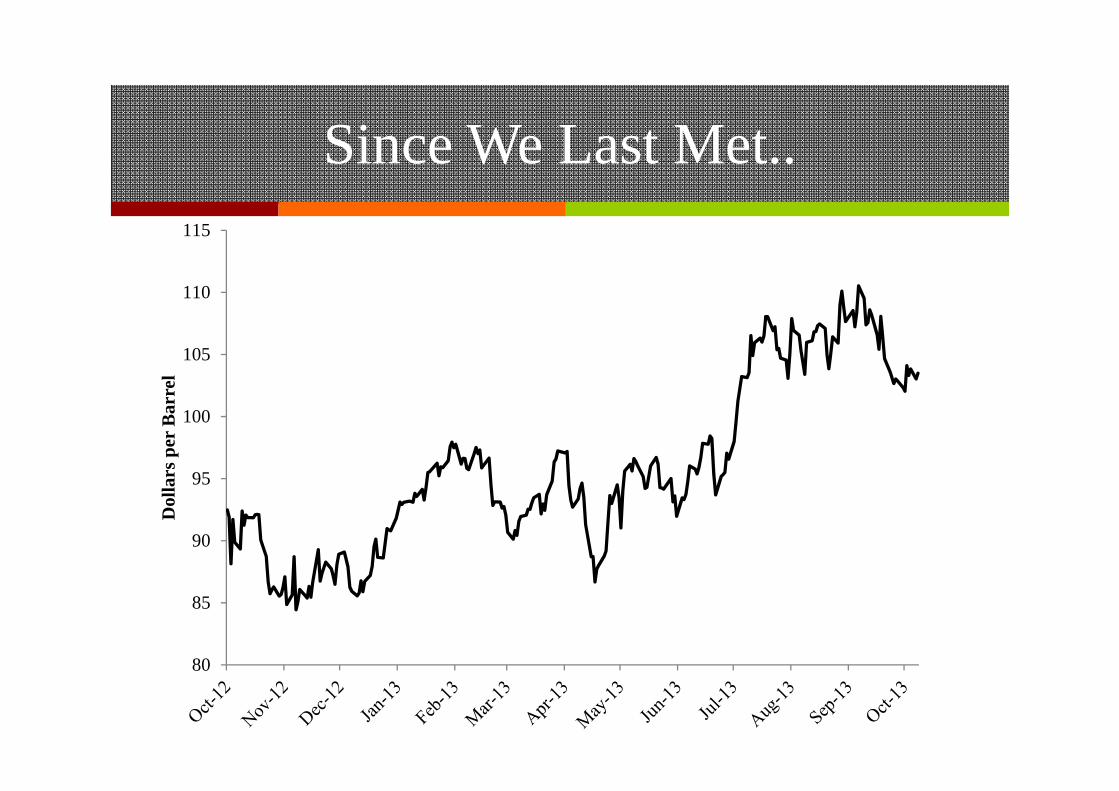
Since We Last Met..
80
85
90
95
100
105
110
115
Dol
lars
per
Bar
rel
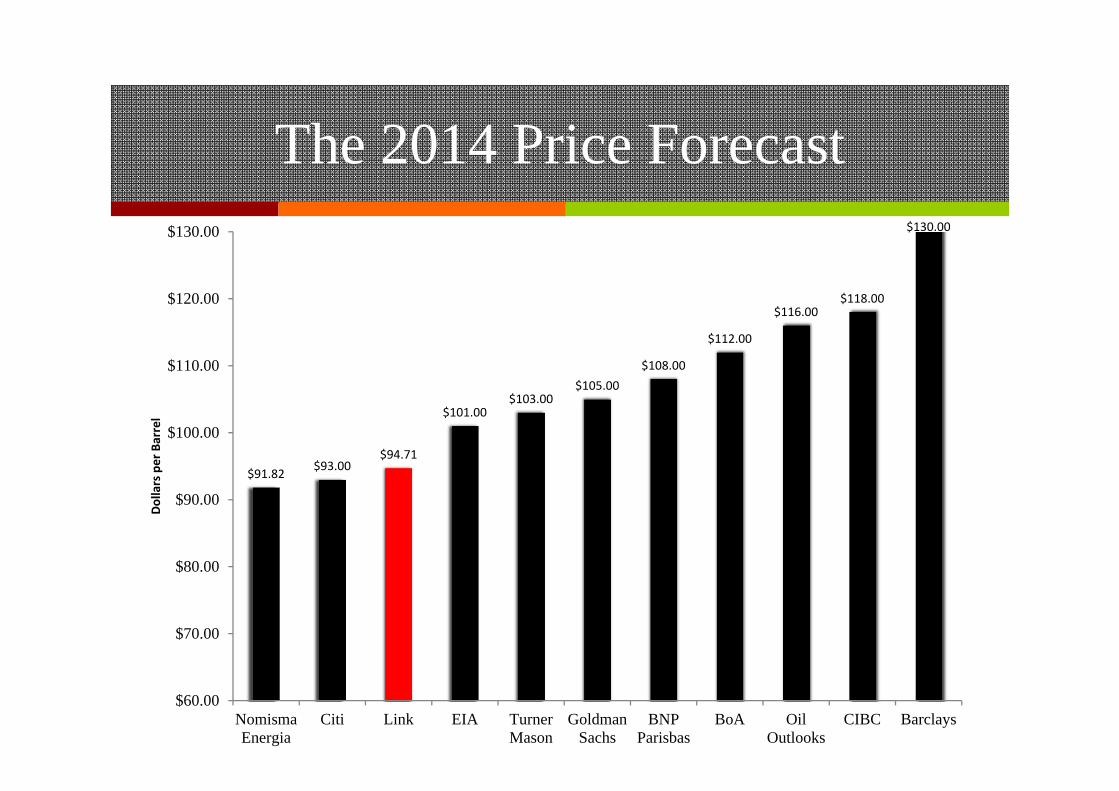
The 2014 Price Forecast
$91.82 $93.00$94.71
$101.00$103.00
$105.00$108.00
$112.00
$116.00$118.00
$130.00
$60.00
$70.00
$80.00
$90.00
$100.00
$110.00
$120.00
$130.00
NomismaEnergia
Citi Link EIA TurnerMason
GoldmanSachs
BNPParisbas
BoA OilOutlooks
CIBC Barclays
Dollars per Barrel
A Bearish Forecast?
• Steady Growth in Supply• Additions to OPEC capacity (mainly Africa)• Increases in non-OPEC crude oil production (US)• Increases in natural gas production
• Slow grow in consumption• Slow economic growth• Increasing efficiency
A Unified World Oil Market?
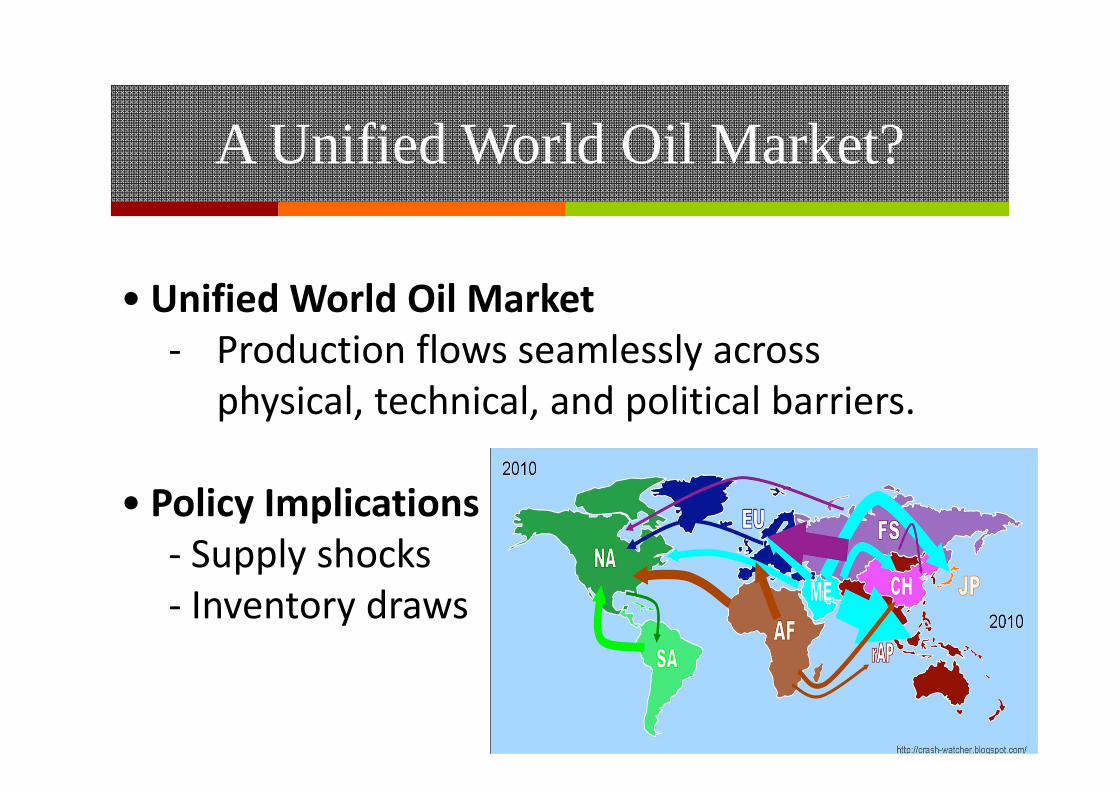
• Unified World Oil Market‐ Production flows seamlessly across
physical, technical, and political barriers.
• Policy Implications‐ Supply shocks ‐ Inventory draws
Existing Results
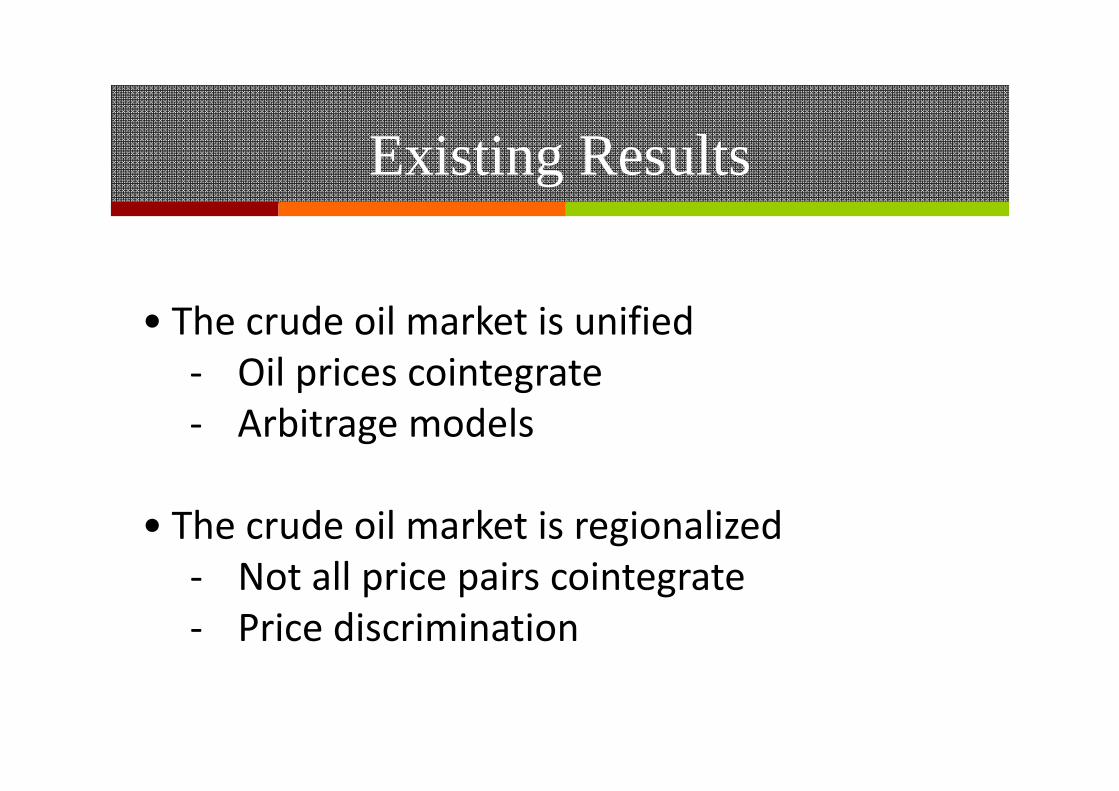
• The crude oil market is unified‐ Oil prices cointegrate‐ Arbitrage models
• The crude oil market is regionalized‐ Not all price pairs cointegrate‐ Price discrimination
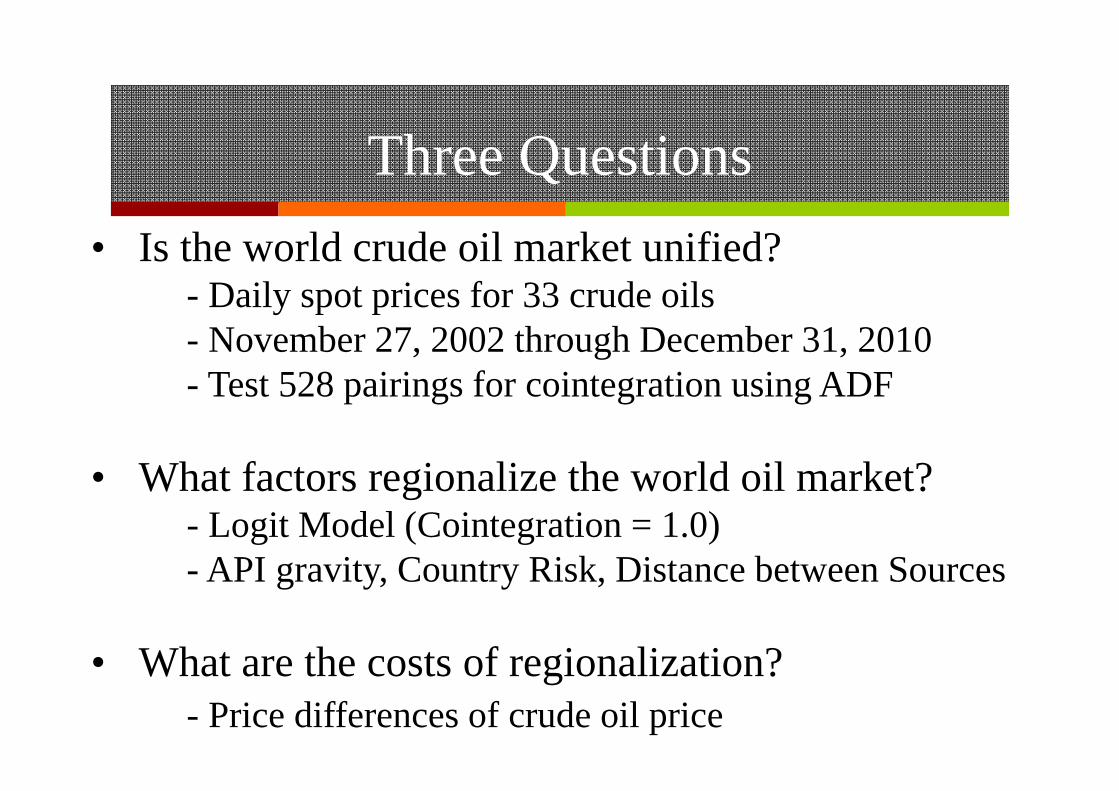
Three Questions• Is the world crude oil market unified?
- Daily spot prices for 33 crude oils- November 27, 2002 through December 31, 2010- Test 528 pairings for cointegration using ADF
• What factors regionalize the world oil market?- Logit Model (Cointegration = 1.0)- API gravity, Country Risk, Distance between Sources
• What are the costs of regionalization?- Price differences of crude oil price
Unified vs. RegionalizedADF Results
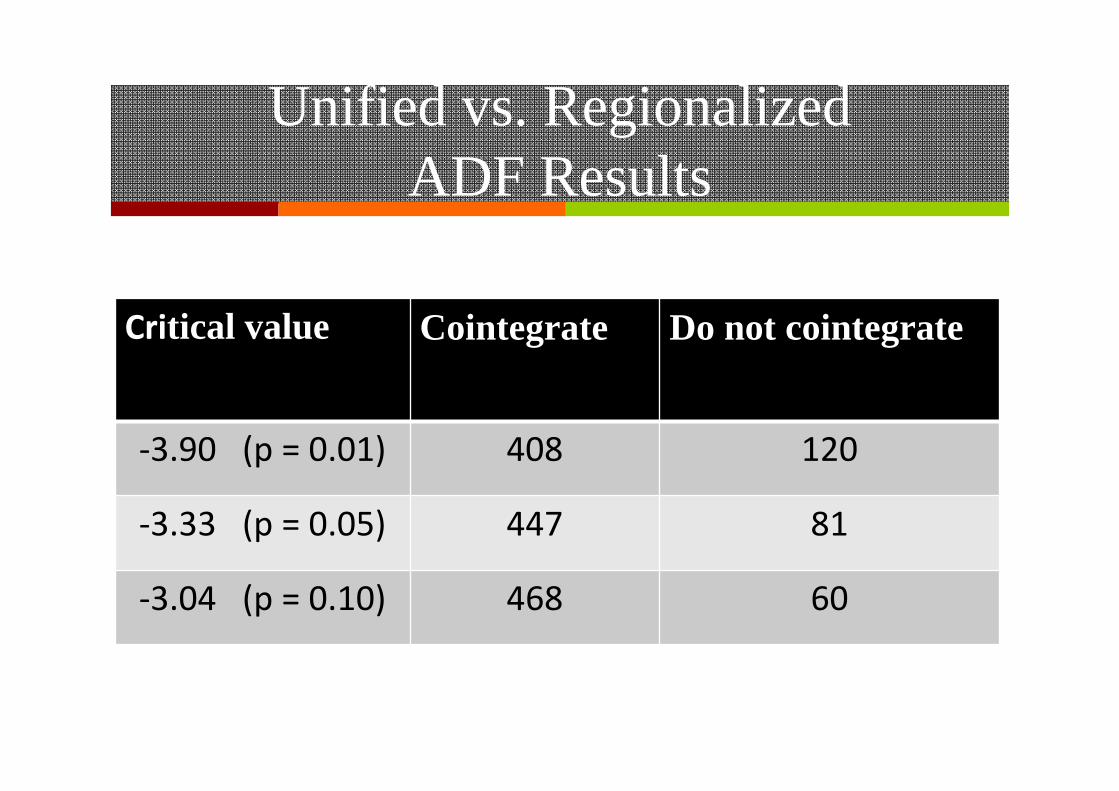
Critical value Cointegrate Do not cointegrate
‐3.90 (p = 0.01) 408 120
‐3.33 (p = 0.05) 447 81
‐3.04 (p = 0.10) 468 60
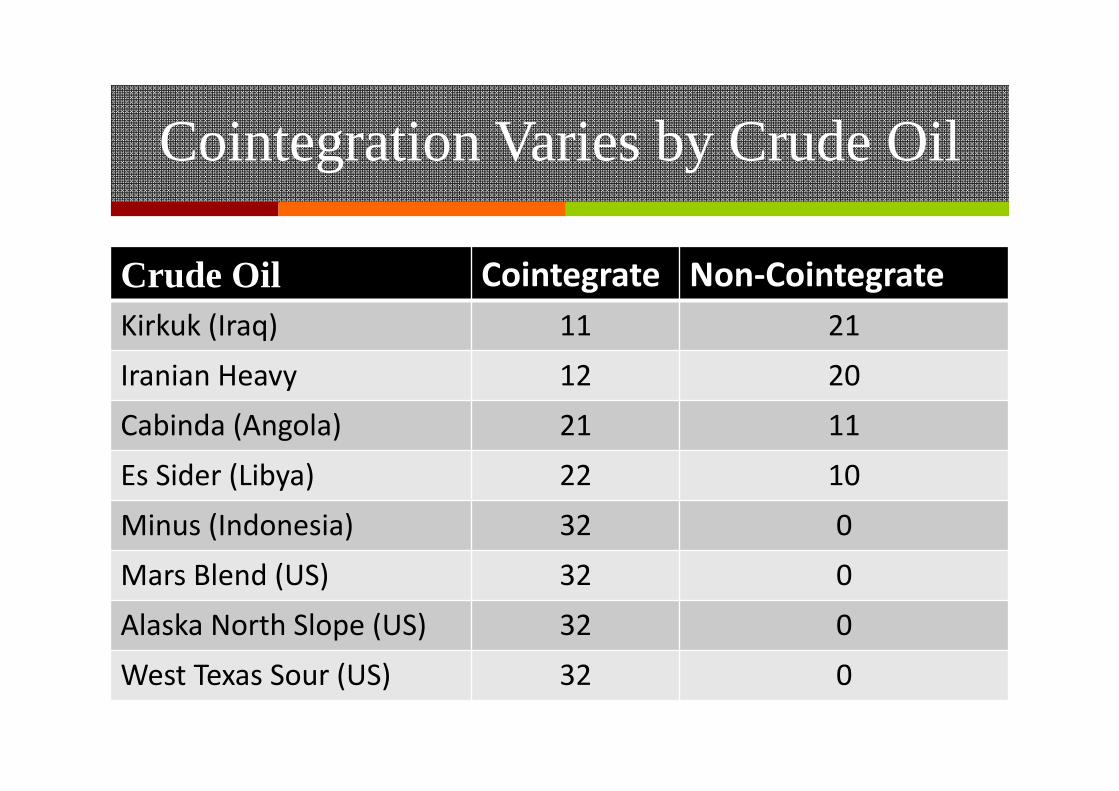
Cointegration Varies by Crude Oil
Crude Oil Cointegrate Non‐CointegrateKirkuk (Iraq) 11 21
Iranian Heavy 12 20Cabinda (Angola) 21 11
Es Sider (Libya) 22 10
Minus (Indonesia) 32 0Mars Blend (US) 32 0
Alaska North Slope (US) 32 0
West Texas Sour (US) 32 0
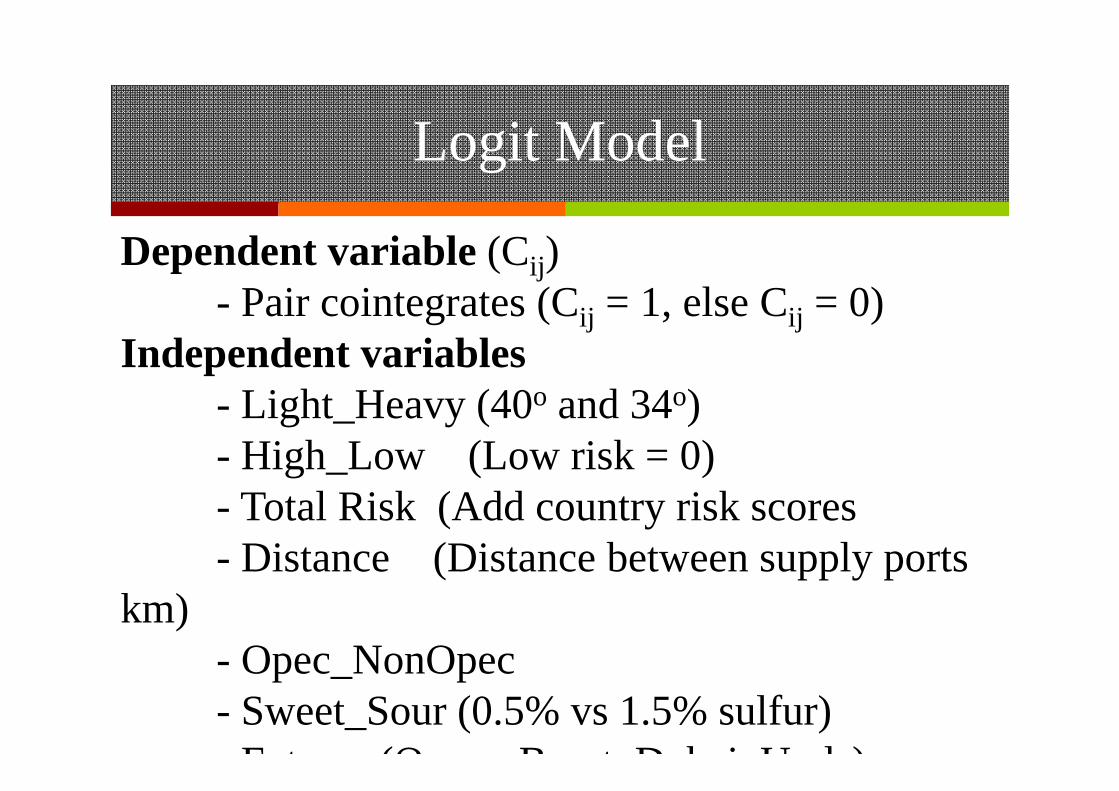
Logit Model
Dependent variable (Cij)- Pair cointegrates (Cij = 1, else Cij = 0)
Independent variables- Light_Heavy (40o and 34o)- High_Low (Low risk = 0) - Total Risk (Add country risk scores- Distance (Distance between supply ports
km)- Opec_NonOpec- Sweet_Sour (0.5% vs 1.5% sulfur)
F t (O B t D b i U l )
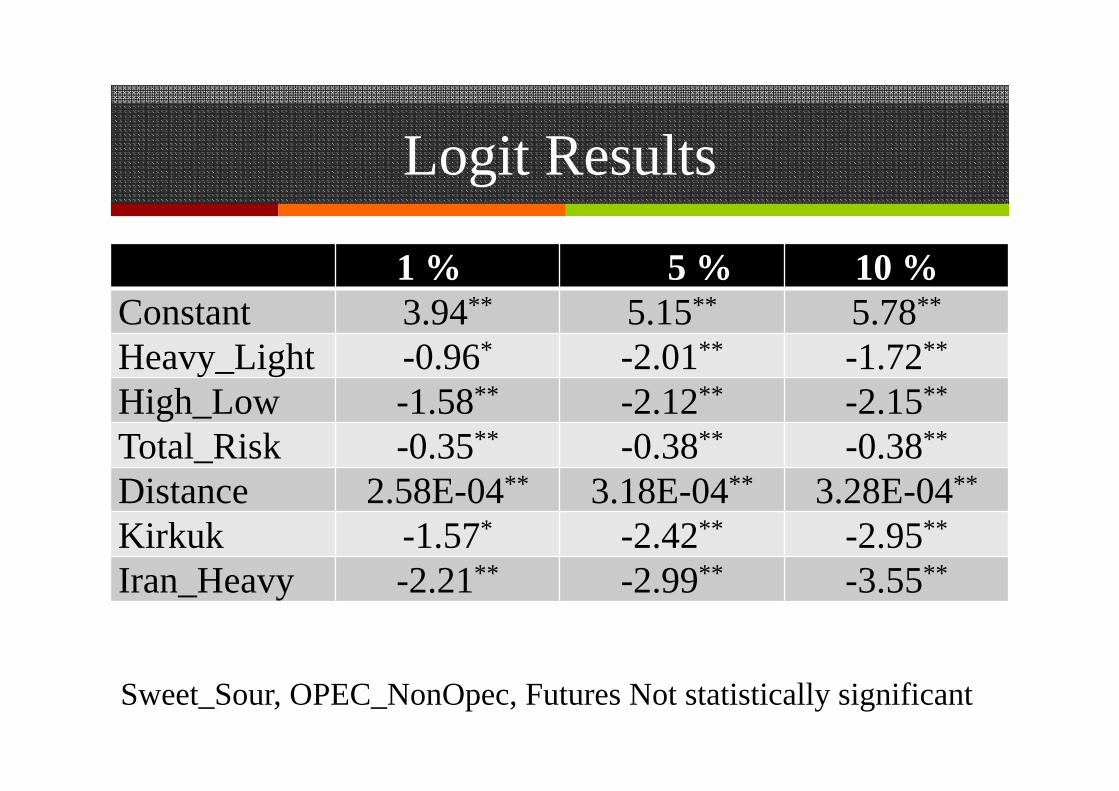
Logit Results
1 %% 5%5 % 1010 %%Constant 3.94** 5.15** 5.78**
Heavy_Light -0.96* -2.01** -1.72**
High_Low -1.58** -2.12** -2.15**
Total_Risk -0.35** -0.38** -0.38**
Distance 2.58E-04** 3.18E-04** 3.28E-04**
Kirkuk -1.57* -2.42** -2.95**
Iran_Heavy -2.21** -2.99** -3.55**
Sweet_Sour, OPEC_NonOpec, Futures Not statistically significant
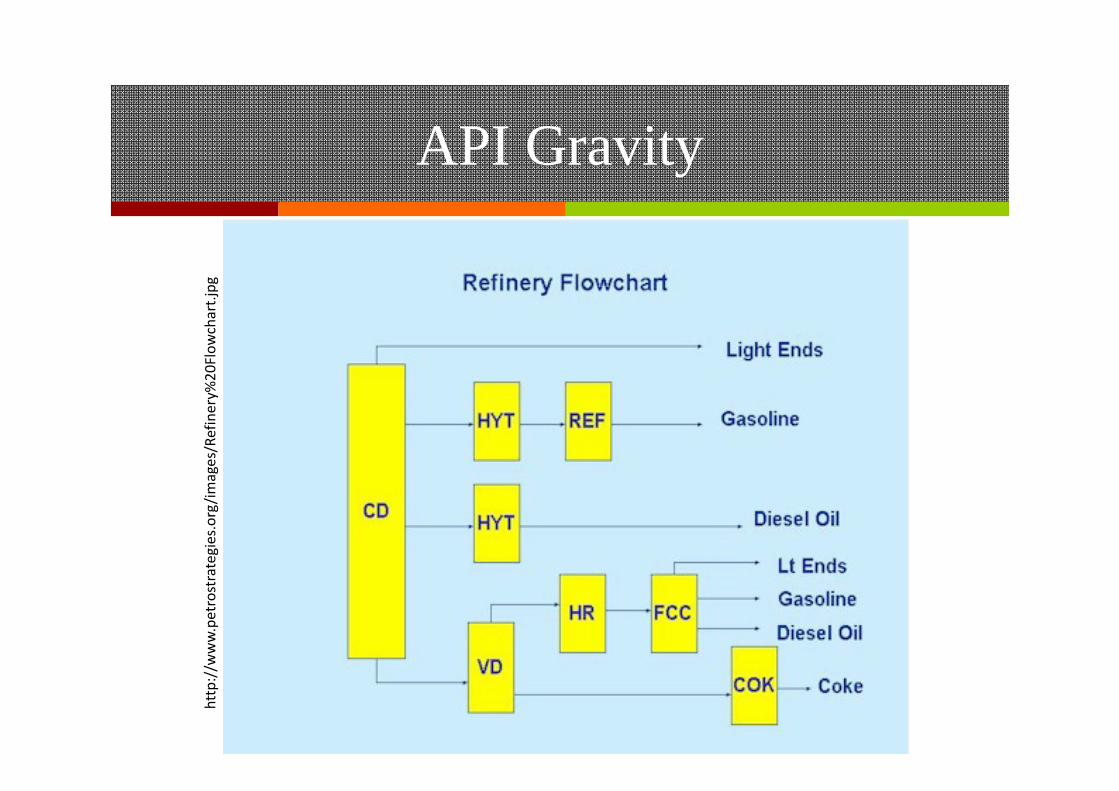
API Gravityhttp://w
ww.petrostrategies.org/im
ages/Refinery%
20Flow
chart.jpg
Regionlized 2002 Venezuela Strike
• U.S. imports of crude oil from Venezuela fell by 24.6million barrels between November and December2002
• Total US monthly imports fell by 23.9 million barrels• Replacements available from Middle East (Saudi
Arabia, Kuwait, and Iraq) but 30 day shipping• US drew down crude oil inventories by about 10.5
million barrels.
Country Risk
• Risk of investing in a country; value depends on the overall stability of the business environment.
- Regulatory changes through government action- Political events such as riots or civil wars- natural events such as earthquakes and hurricanes
• Ability of suppliers to deliver crude oil- Revolutionary Armed Forces of Columbia (FARC)- Attacks on Caño Limon pipeline interrupted supply
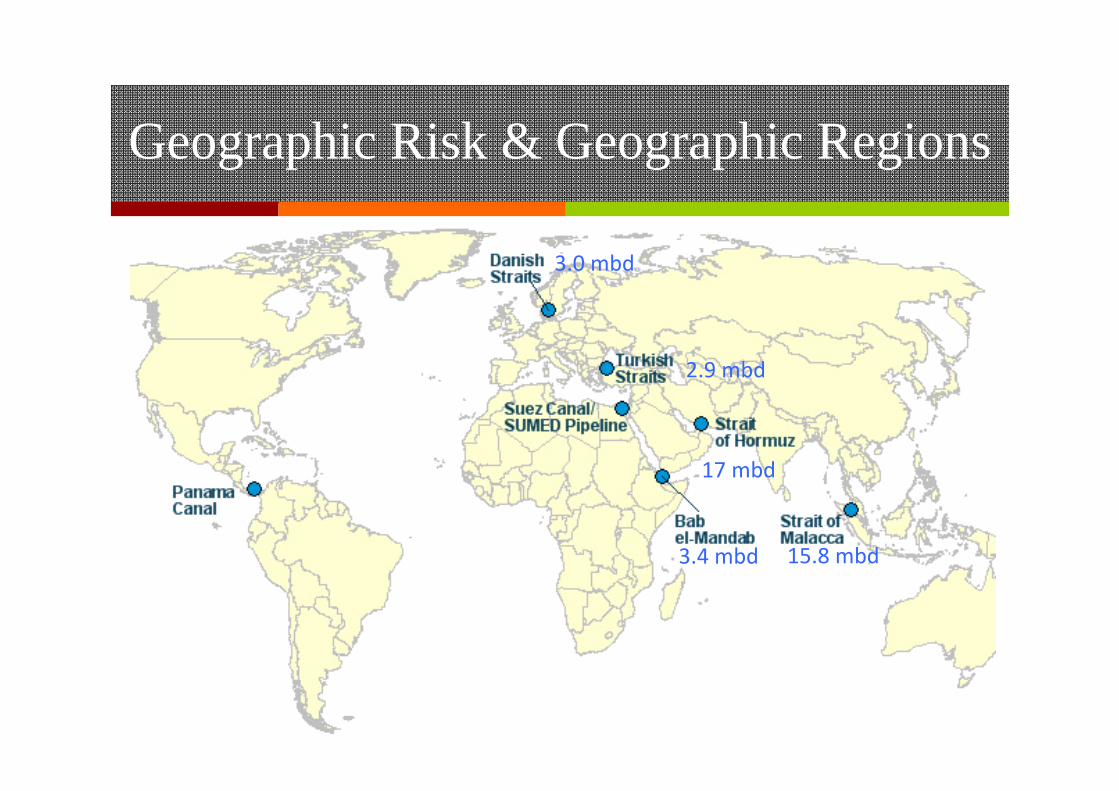
Geographic Risk & Geographic Regions
17 mbd
3.4 mbd
2.9 mbd
3.0 mbd
15.8 mbd
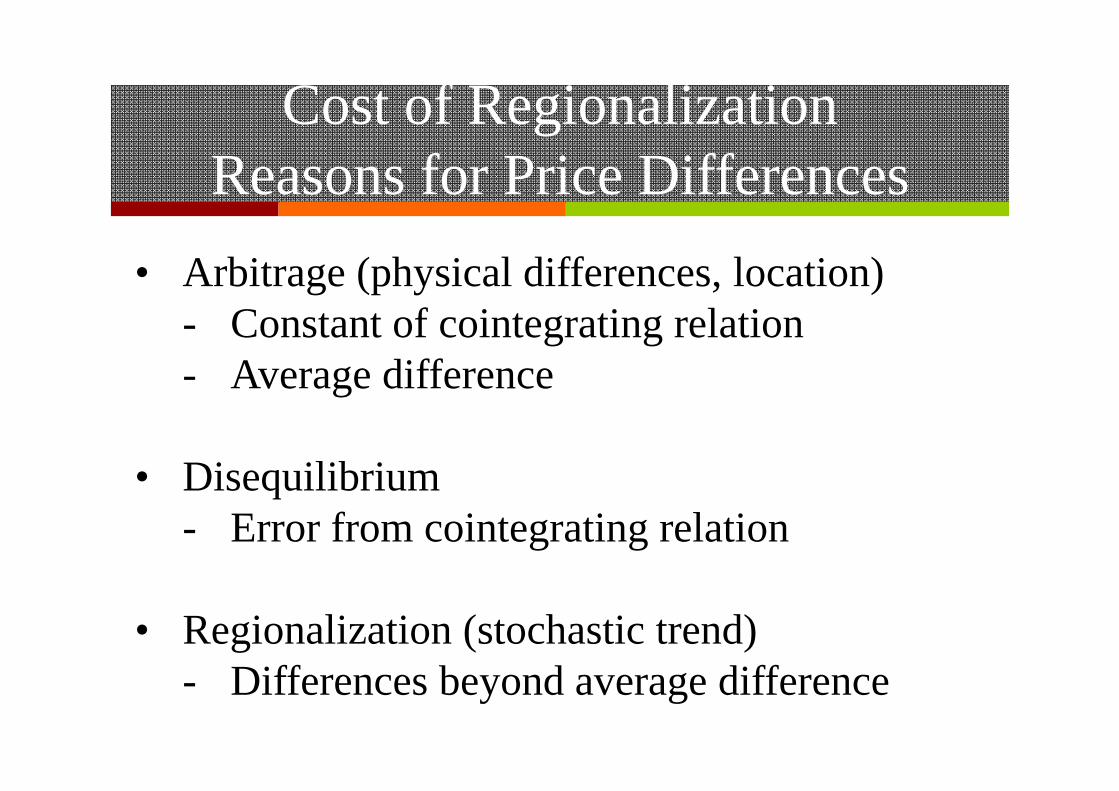
Cost of RegionalizationReasons for Price Differences
• Arbitrage (physical differences, location)- Constant of cointegrating relation- Average difference
• Disequilibrium- Error from cointegrating relation
• Regionalization (stochastic trend)- Differences beyond average difference
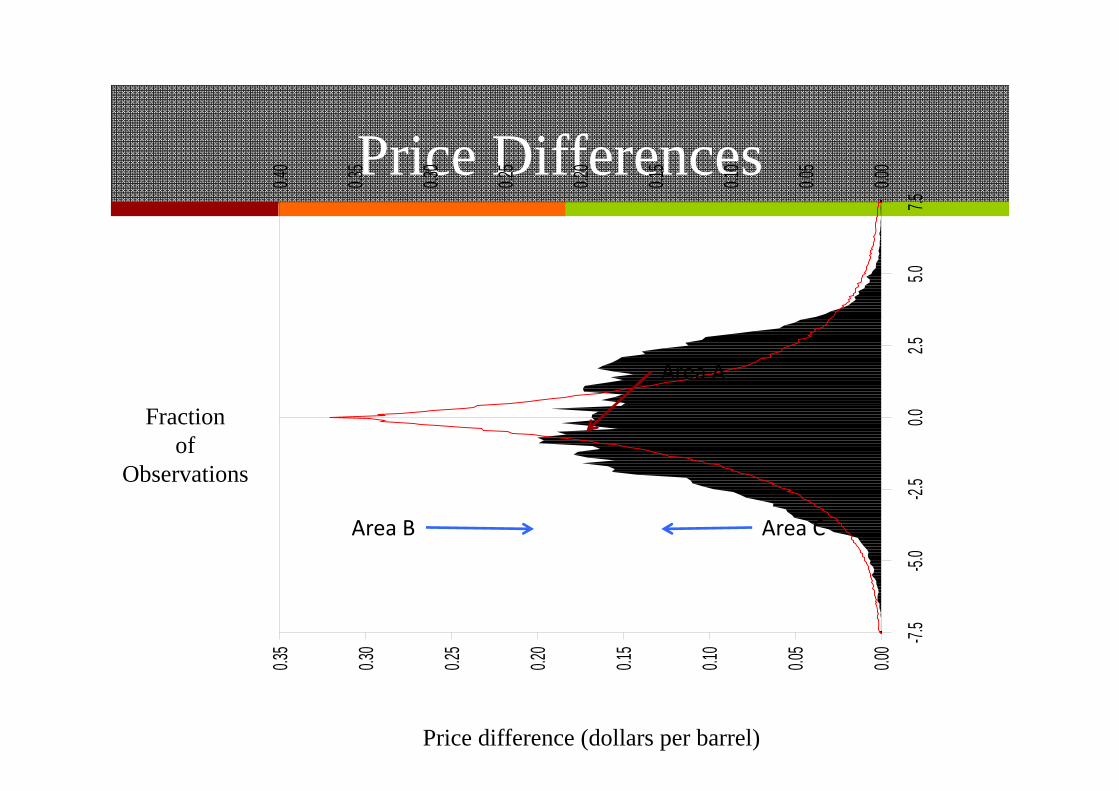
Price Differences
-7.5
-5.0
-2.5
0.02.5
5.07.5
0.00
0.05
0.10
0.15
0.20
0.25
0.30
0.35
0.00
0.05
0.10
0.15
0.20
0.25
0.30
0.35
0.40
Area A
Area CArea B
Fractionof
Observations
Price difference (dollars per barrel)
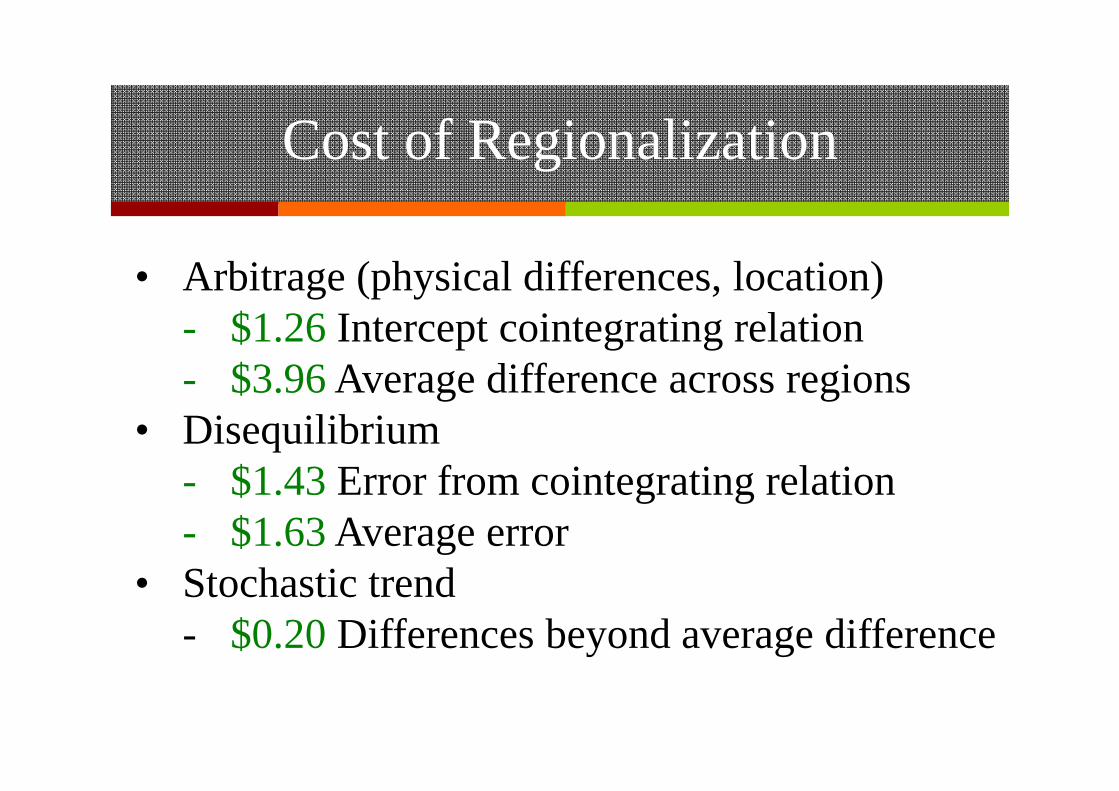
Cost of Regionalization
• Arbitrage (physical differences, location)- $1.26 Intercept cointegrating relation - $3.96 Average difference across regions
• Disequilibrium- $1.43 Error from cointegrating relation- $1.63 Average error
• Stochastic trend- $0.20 Differences beyond average difference
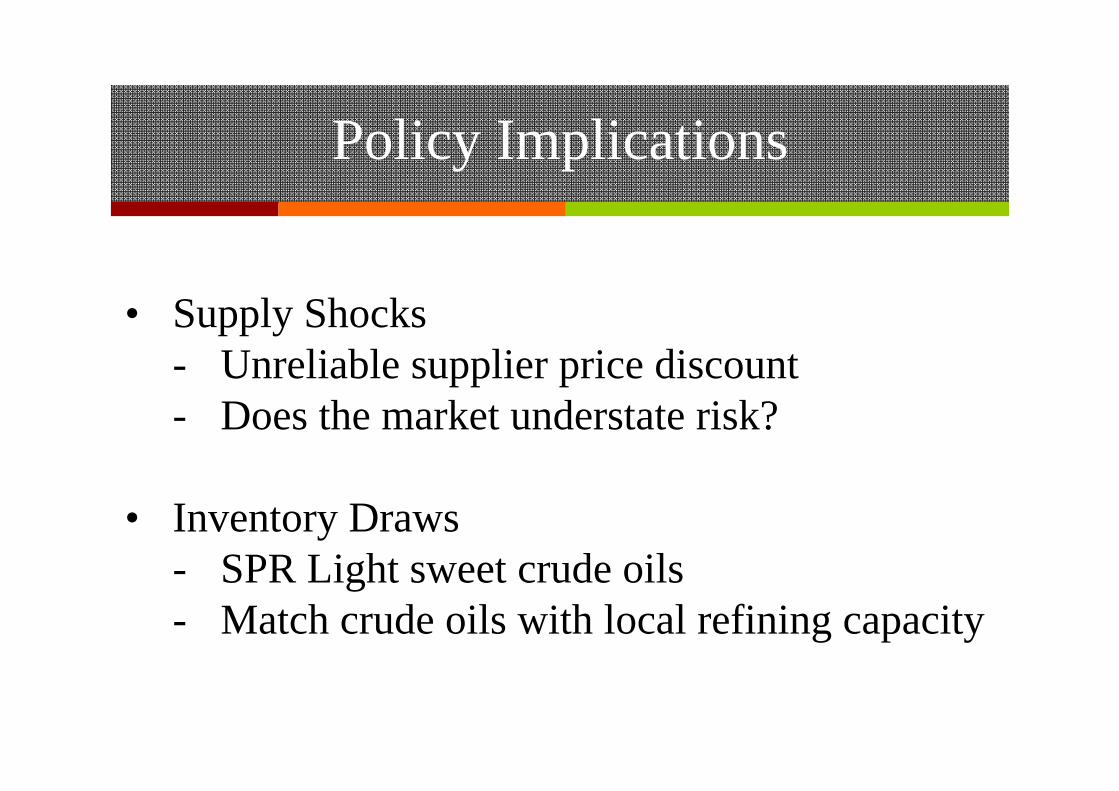
Policy Implications
• Supply Shocks- Unreliable supplier price discount- Does the market understate risk?
• Inventory Draws- SPR Light sweet crude oils - Match crude oils with local refining capacity
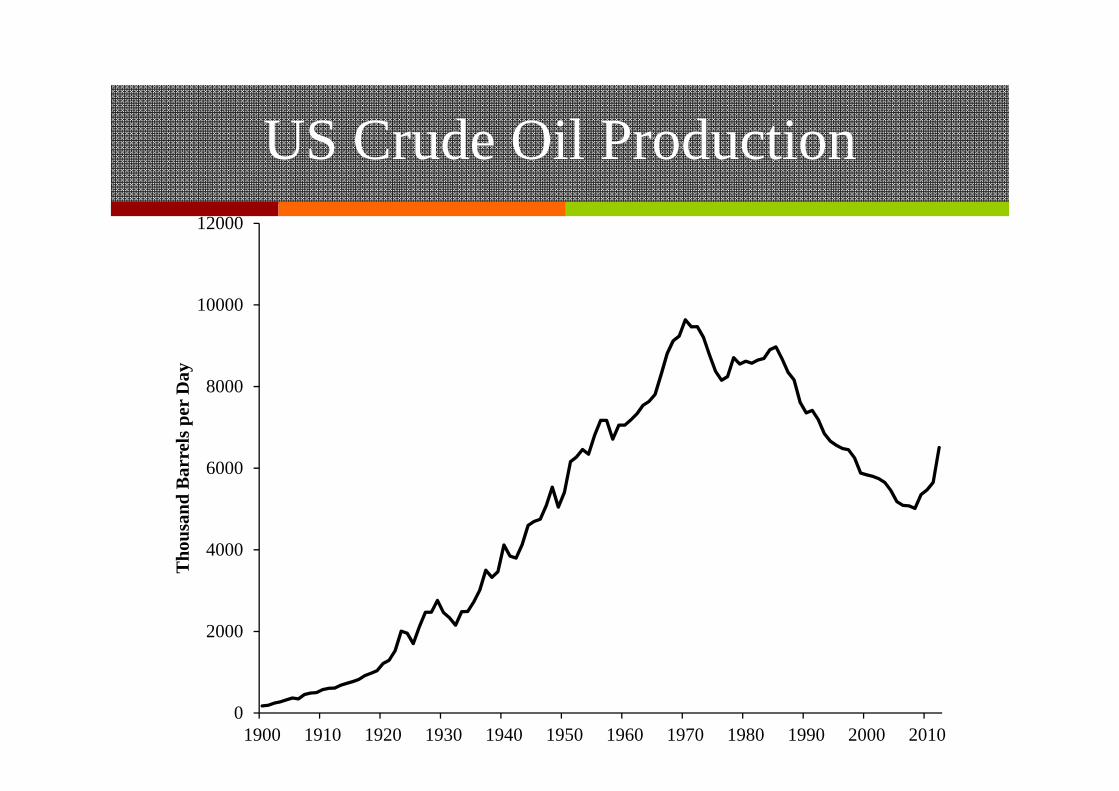
US Crude Oil Production
0
2000
4000
6000
8000
10000
12000
1900 1910 1920 1930 1940 1950 1960 1970 1980 1990 2000 2010
Tho
usan
d B
arre
ls p
er D
ay