Embed Size (px)
Citation preview

POLAND
Overseas Market Introduction Service
on seafood sector in Poland
for
Sea Fish Industry Authority
Originally Produced by:
Ewa van Veenendaal-Rawicz, Deputy Head, UKTI Sylwia Piwowar, Trade Officer
Updated and Edited by:
Malgorzata Kaczmarek, Business Consultant, BPCC Trade
Date of Report Edition: 29/09/2015
The Overseas Market Introduction Service (‘OMIS’) is provided by the Commercial Departments of Diplomatic Service Posts overseas as part of the joint trade development operation, UK Trade & Investment (‘UKTI’), of the Foreign and Commonwealth Office (‘the FCO’) and the Department for Business, Innovation and Skills (‘BIS’). Whereas every effort has been made to ensure that information provided through OMIS is accurate, these Commercial Departments, UKTI, the FCO and BIS accept no liability for any errors, omissions or misleading statements in such information and accept no responsibility as to the standing of any firm, company or individual mentioned. Any party interested in the goods and services provided by any company referred to in OMIS material should undertake their own research and should not consider a reference in OMIS material to be an endorsement of any goods, services or companies mentioned.
2
CONTENTS Page
1. Summary of the enquiry ....................................................................... 3
2. Workplan .............................................................................................. 4
3. Matching profile ................................................................................... 5
3.1 The trade environment ....................................................................... 5
3.2 The seafood sector ............................................................................. 6
3.3 Ports ................................................................................................ 13
3.4 Consumer trends .............................................................................. 15
3.5 UK share and export opportunities ................................................... 19
4. Doing business profile ........................................................................ 20
4.1 The supply structure ........................................................................ 20
4.2 The retail channel............................................................................. 21
4.3 The foodservice channel ................................................................... 22
4.4 Key regulations and tariffs ............................................................... 26
4.5 Tips and useful links ......................................................................... 28
5. Poland – General Info ........................................................................ 29
6. Next activity ....................................................................................... 33

3
1. Summary of the enquiry
The commissioning brief supplied online by Seafish via UKTI North West was to update
existing market report on seafood sector.
www.seafish.org
Mr Malcolm Large, Head of International Trade & Regions, Seafish
4
2. Workplan
METHODOLOGY During our research we were using various sources such as trade and industry
catalogues and magazines, internet pages (including GUS, NBP, PAIiIZ, Eurostat,
Euromonitor, MIR, ARR, BIS, Portal Spozywczy) and other relevant materials.
We have also contacted some Polish organisations, such as the Ministry of Agriculture
and Rural Development, relevant ports, representatives of fish importers, retail chains
and many others.
In Chapter 3, we have provided general information about Poland, trade environment,
ports, consumer trends as well as export opportunities for UK companies.
In Chapter 4, we have provided information about supply structure, retail and
foodservice channel. This chapter includes information on key regulations and tariffs on
fish products.
Chapter 5 provides additional basic information about Poland and its economic
performance. It also includes brief information on business etiquette in Poland. The
information in that Chapter is provided free of charge.
5
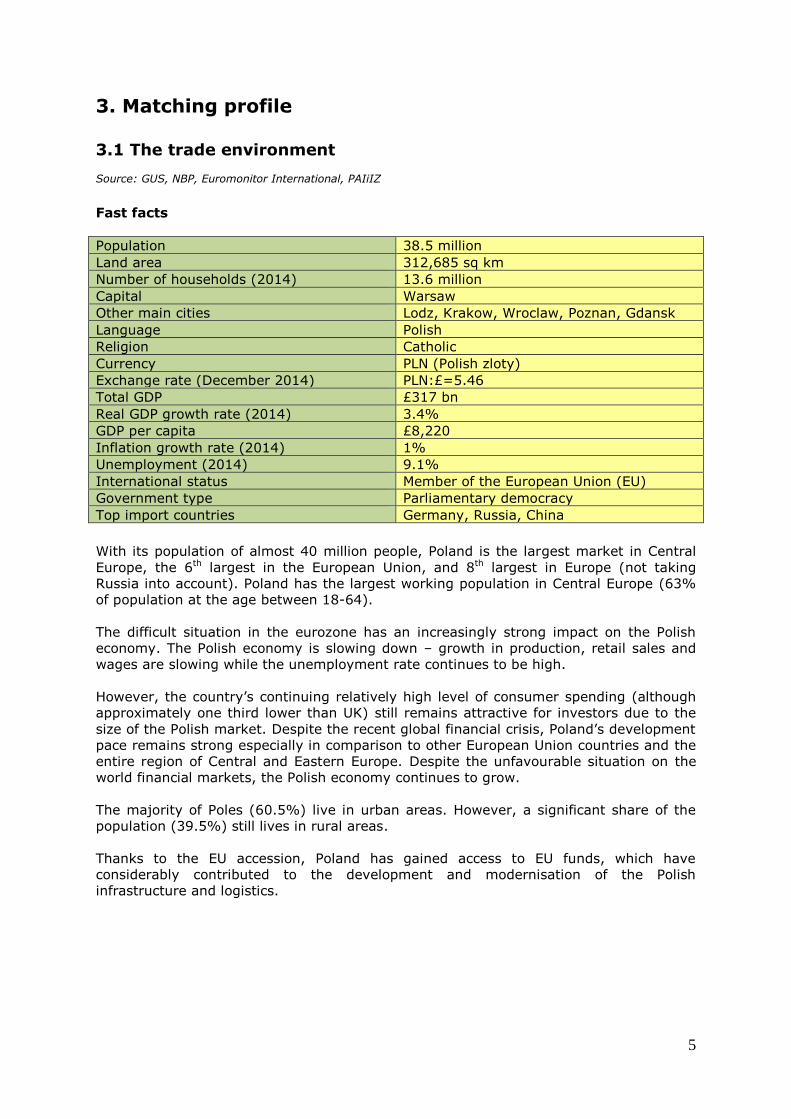
3. Matching profile
3.1 The trade environment Source: GUS, NBP, Euromonitor International, PAIiIZ
Fast facts
Population 38.5 million
Land area 312,685 sq km
Number of households (2014) 13.6 million
Capital Warsaw
Other main cities Lodz, Krakow, Wroclaw, Poznan, Gdansk
Language Polish
Religion Catholic
Currency PLN (Polish zloty)
Exchange rate (December 2014) PLN:£=5.46
Total GDP £317 bn
Real GDP growth rate (2014) 3.4%
GDP per capita £8,220
Inflation growth rate (2014) 1%
Unemployment (2014) 9.1%
International status Member of the European Union (EU)
Government type Parliamentary democracy
Top import countries Germany, Russia, China
With its population of almost 40 million people, Poland is the largest market in Central
Europe, the 6th largest in the European Union, and 8th largest in Europe (not taking
Russia into account). Poland has the largest working population in Central Europe (63%
of population at the age between 18-64).
The difficult situation in the eurozone has an increasingly strong impact on the Polish
economy. The Polish economy is slowing down – growth in production, retail sales and
wages are slowing while the unemployment rate continues to be high.
However, the country’s continuing relatively high level of consumer spending (although
approximately one third lower than UK) still remains attractive for investors due to the
size of the Polish market. Despite the recent global financial crisis, Poland’s development
pace remains strong especially in comparison to other European Union countries and the
entire region of Central and Eastern Europe. Despite the unfavourable situation on the
world financial markets, the Polish economy continues to grow.
The majority of Poles (60.5%) live in urban areas. However, a significant share of the
population (39.5%) still lives in rural areas.
Thanks to the EU accession, Poland has gained access to EU funds, which have
considerably contributed to the development and modernisation of the Polish
infrastructure and logistics.
6
3.2 The seafood sector
Source: GUS, Instytut Ekonomiki Rolnictwa i Gospodarki Zywnosciowej, Morski Instytut Rybacki, BIS Analysis
of HMRC Overseas Trade Statistics, Seremak-Bulge J., Market and fish consumption in the years 2010-2011,
Fish Industry Conference, Gdansk 2011
In Poland the level of seafood consumption remains low. Only 6% of household spending
on food is devoted to purchasing seafood and freshwater fish. Average annual
consumption of fish in Poland in 2014 stood at 13.12 kg per capita (European average -
20+ kg, Norwegian average – 46 kg, Portuguese average - 60 kg) resulting in a 7.8%
increase against 2013.
According to statistics an average annual consumption of seafood (including crustaceans,
molluscs, invertebrates) in Poland in 2014 amounted merely to ¼ kg per capita.
The most frequently imported fish in Poland is salmon and the greatest demand is for
herring, yet cod is slowly gaining popularity too.
Sales revenues in Poland for 2014 constituted PLN 3.5 billion, a 3.8% increase in
comparison to the previous year.
It has been estimated that the supply of fish, fish products and seafood to the national
market amounted to 504,8 thousand tonnes in 2014 and was 7.8% higher than in 2013.
It was mainly due to the import increase (by 5.2%). At the same time, export was
restricted and fell (by 10.1%), the prices inflated which resulted in positive income of
3.9%.
In 2014, fish, fish products and seafood were among the foods whose prices rose the
fastest. On average, retail prices grew by 1.1% compared to the previous year.
The most popular species in 2014, regarding consumption, was pollock, which was
among a few of those that recorded an increase compared to the year before. The
consumption of herring, which was the most often consumed fish in recent years,
increased by 8.2% (2014).
The drop in the internal demand resulted in limiting the import level by 2% (giving 510
thousand tonnes). However, Poland still remains a major net importer of fish, fish
products and seafood. In terms of quantity, salmon (28%) and herring (17%) dominated
the Polish import of seafish in 2014. Panga import fell by 12% in terms of quantity,
whereas pollock import grew by 2.5%. Poland is also a notable exporter of processed
salmon and herring.
The value of the Polish fish market has been estimated to be worth more than PLN 8.5
billion (£ 1.6 billion) in 2014, which indicates 2% growth in comparison to the previous
years. In 2014, domestic catches accounted for 220-250 thousand tonnes.
The Polish fish processing industry plays a major role in supplying Western and Central
Europe with fish products such as smoked fish (mainly smoked salmon and trout),
canned fish (herring, sprat and mackerel), herring marinades and salads. Among
processed products there are fresh and frozen (also breaded) cod fillets, freshwater and
diadromous fish (i.e. pikeperch, trout, salmon) and fresh and frozen whole fish (trout,
sprat). Polish fish processing industry produces 42-450 thousand tonnes annually,
bringing PLN 2.11 billion of income. Over 59% of production is exported to Germany, the
United Kingdom, France and Denmark, and other European and non-European countries.
7
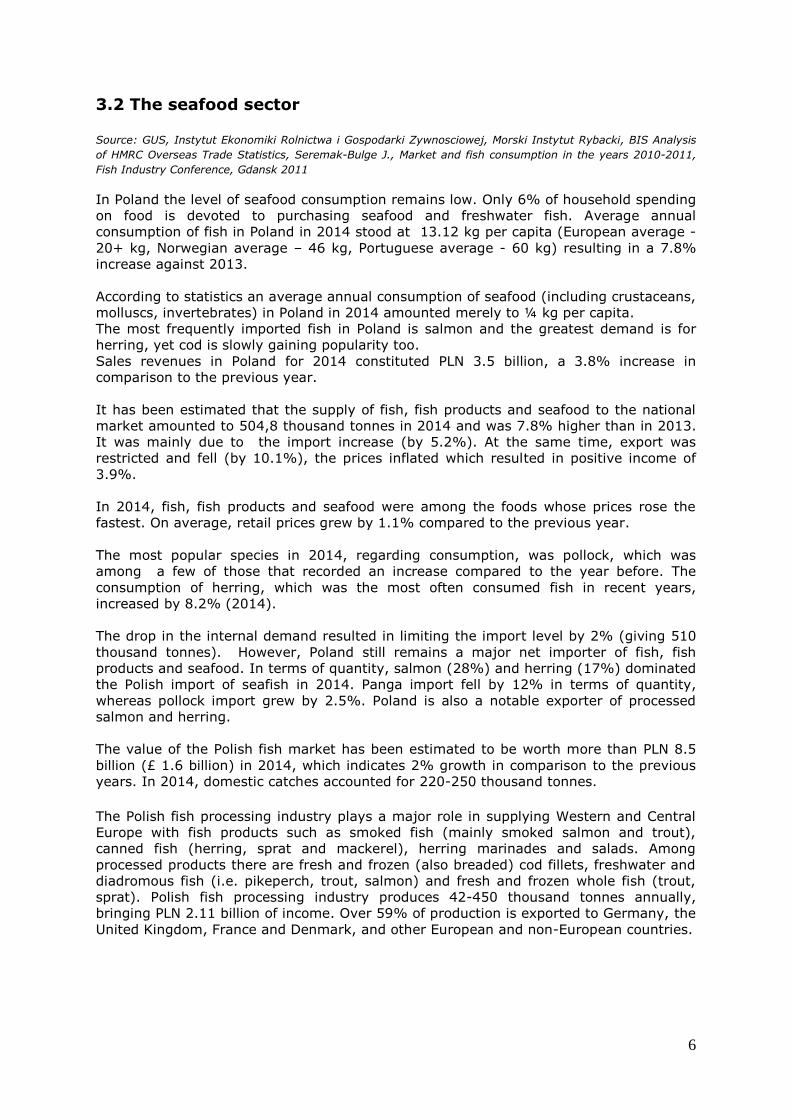
Diagram 1. Structure (by percentage) of Polish fish product exports in 2014
– according to groups of products
Source: Hryszko K., Foreign trade of fish sector tendencies, prices and predictions, 2014
Due to its limited access to fisheries, Poland is an attractive market for raw fish material
suppliers. Currently, the most important suppliers of raw fish material for Polish fish
processing plants are producers from the following countries: Norway, Iceland, the UK
and Spain. Finished products (frozen fillets, canned fish) are mainly imported from
Vietnam, China and Thailand.
Polish fish processing plants import significant amounts of pelagic fish (herring fillets and
mackerel – usually frozen) which are used for smoking and production of marinated fish,
salads and cans. Another important raw material is imported salmon (fresh and gutted,
to be filleted and smoked in Poland, mainly for re-export). Due to its great processing
potential Poland also imports white fish which are filleted as well as breaded and frozen.
Among finished products, the import of frozen white fish fillets (pollock, panga, cod,
salmon, herring) and canned tuna play major role.
8
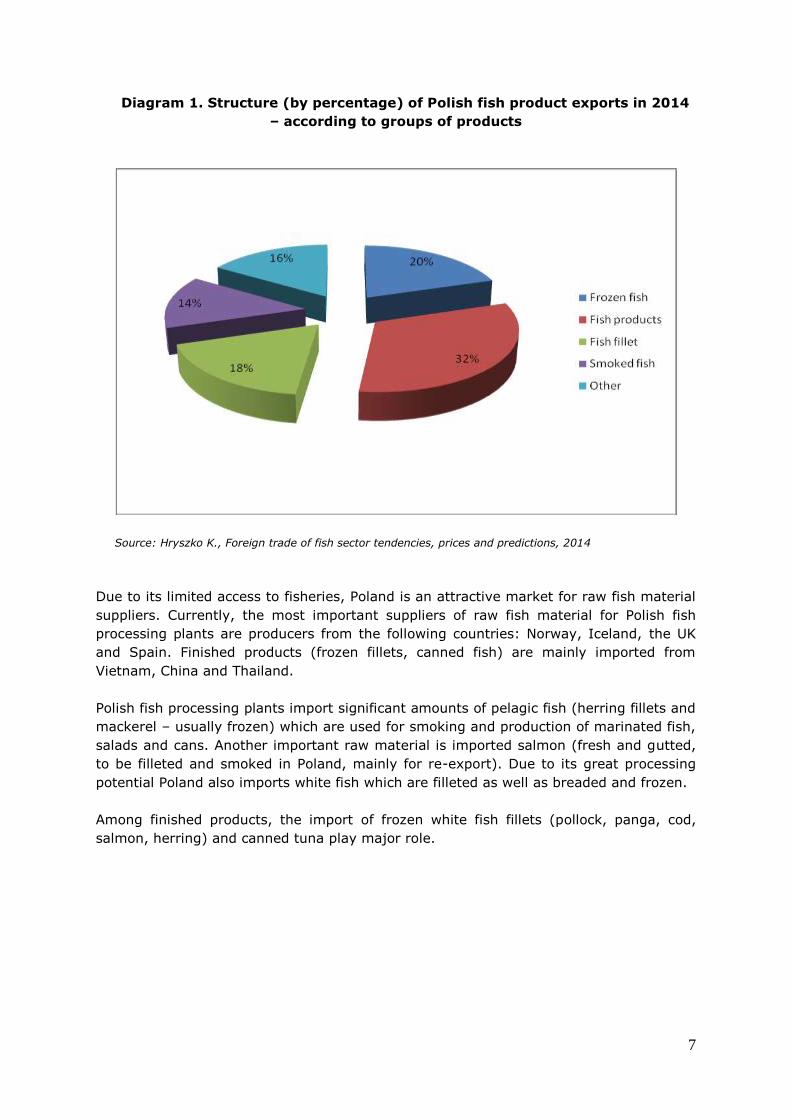
Diagram 2. Fish Product Types Import in Poland 2015 January-June Forecast
(in thousand tonnes)
Source: MIR, ARR, MRiRW, IERiGZ
According to the forecasts for 2015 there is a strong tendency to import mostly fish
fillets and fresh fish. The expected import of seafood products for 2015 is estimated to
reach merely 3.7 thousand tonnes.
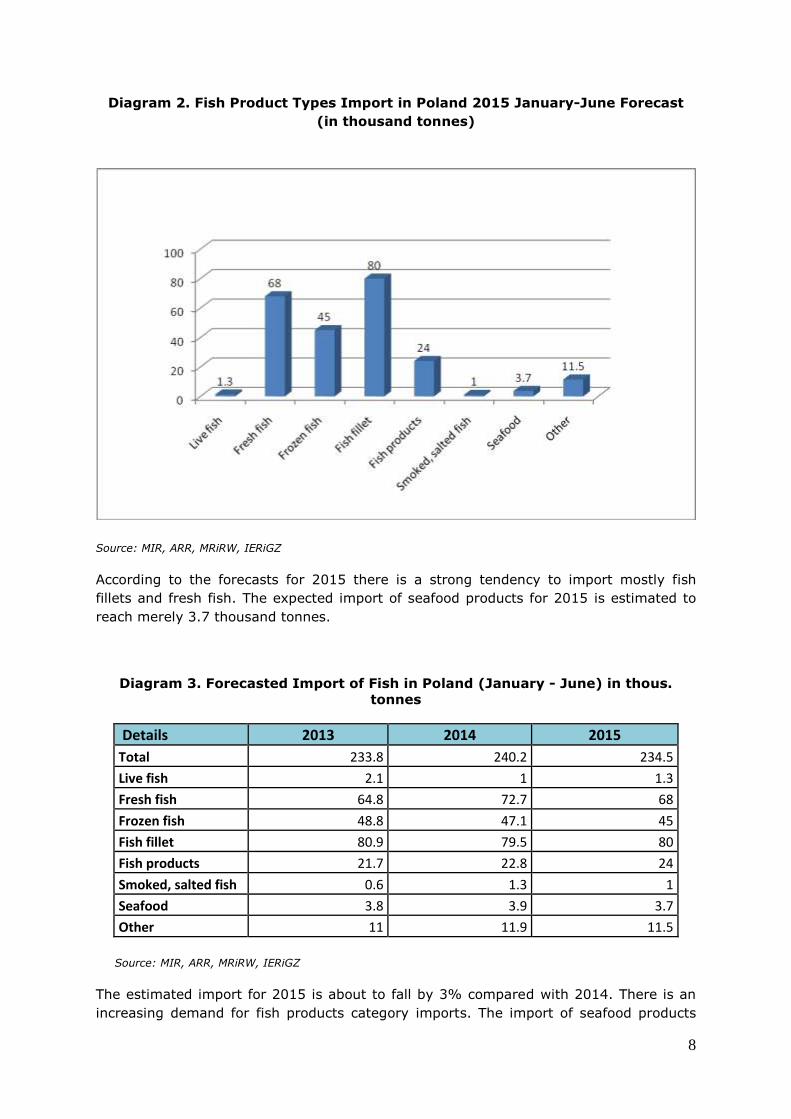
Diagram 3. Forecasted Import of Fish in Poland (January - June) in thous.
tonnes
Details 2013 2014 2015
Total 233.8 240.2 234.5
Live fish 2.1 1 1.3
Fresh fish 64.8 72.7 68
Frozen fish 48.8 47.1 45
Fish fillet 80.9 79.5 80
Fish products 21.7 22.8 24
Smoked, salted fish 0.6 1.3 1
Seafood 3.8 3.9 3.7
Other 11 11.9 11.5
Source: MIR, ARR, MRiRW, IERiGZ
The estimated import for 2015 is about to fall by 3% compared with 2014. There is an
increasing demand for fish products category imports. The import of seafood products
9
slightly changed from 3.8 thousand tonnes in 2013 to 3.9 in 2014 and is expected to be
at 3.7 level in 2015.
Diagram 4. Forecasted Export of Fish in Poland (January - June)
Details 2013 2014 2015
Total 232 183.3 196
Live fish 0.5 0.5 0.5
Fresh fish 38.3 10.7 15
Frozen fish 58.3 35.9 40
Fish fillet 34.2 32.8 35
Fish products 58.2 59.5 61.1
Smoked, salted fish
25 24.2 25
Seafood 1 0.6 0.9
Other 16.5 19.1 18.5
Source: MIR, ARR, MRiRW, IERiGZ
In general, 2015 export forecasts are more optimistic than in 2014, with a stable
tendency for constant growth of fish product export. Live fish export has been the same
since 2013 and will remain stable.
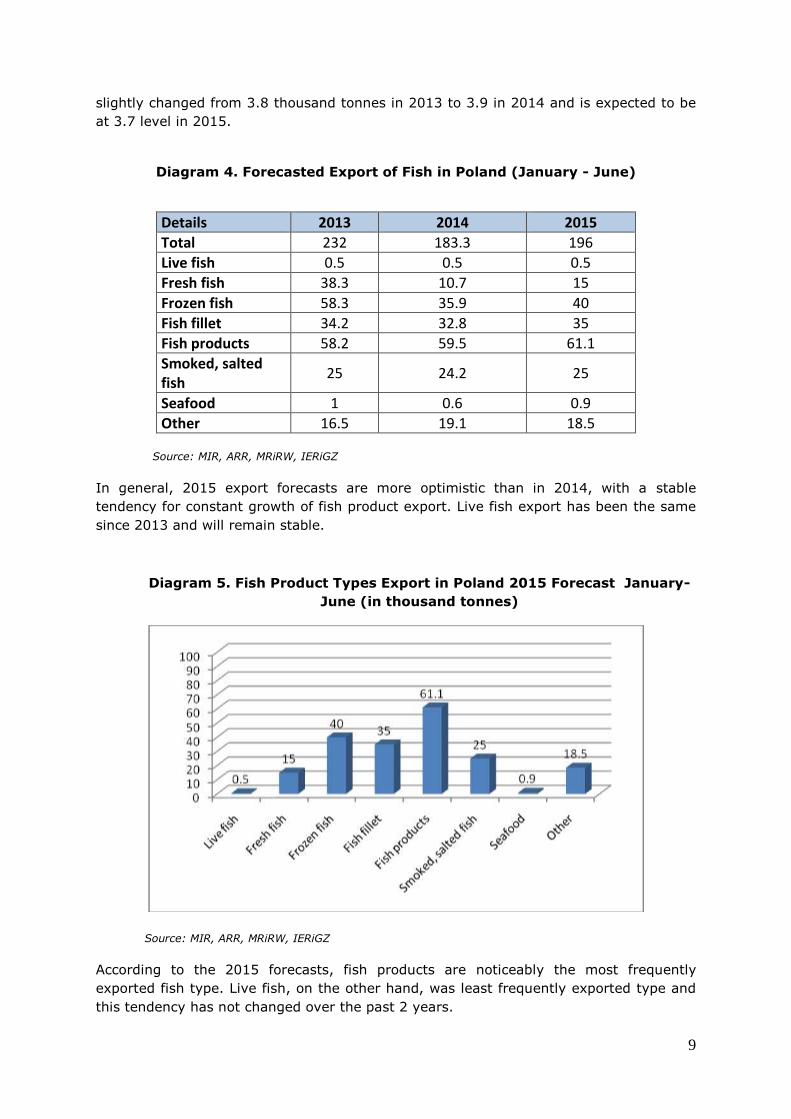
Diagram 5. Fish Product Types Export in Poland 2015 Forecast January-
June (in thousand tonnes)
Source: MIR, ARR, MRiRW, IERiGZ
According to the 2015 forecasts, fish products are noticeably the most frequently
exported fish type. Live fish, on the other hand, was least frequently exported type and
this tendency has not changed over the past 2 years.
10
Diagram 6. Fish/seafood balance in Poland (thousand tonnes of live weight)
Details 2011 2012 2013 2014 (F)
Sea fishing 179.9 179.7 195.4 165.7
Including: Baltic Sea catches 110.8 120.6 134.0 120.7
Deep-sea catches 69.1 59.1 61.4 45.0
Freshwater catches and aquaculture 48.3 50.4 49.8 52.5
Total domestic catches 228.2 230.1 245.2 218.2
Import 774.0 770.6 836.2 840.0
Export 520.7 552.5 613.5 580.0
Supply of consumption fish for the
domestic market a 472.7 448.2 468.4 478.2
a the market demand for fish does not include the part of deep-sea catches that has been processed into fishmeal and not
intended for consumption purposes F – forecast
Source: MIR-PIB (National Fishery Institute – National Research Institute) and IAFE-NRI in the basis of IRS (Inland Fishery Institute) data
According to the diagram 6. import of fish and seafood products had significantly
increased in 2013 along with the export. The supply of fish for the domestic market is
gradually increasing which is driven by increasing levels of fish and seafood consumption
in Poland.
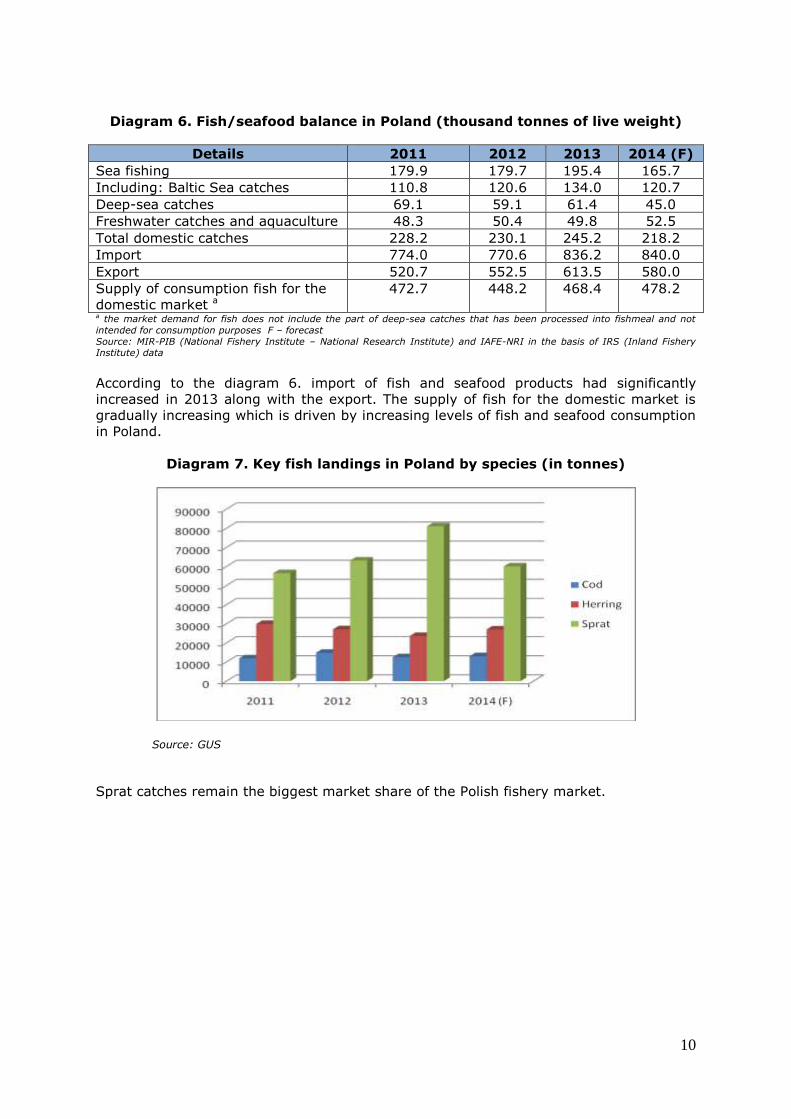
Diagram 7. Key fish landings in Poland by species (in tonnes)
Source: GUS
Sprat catches remain the biggest market share of the Polish fishery market.
11
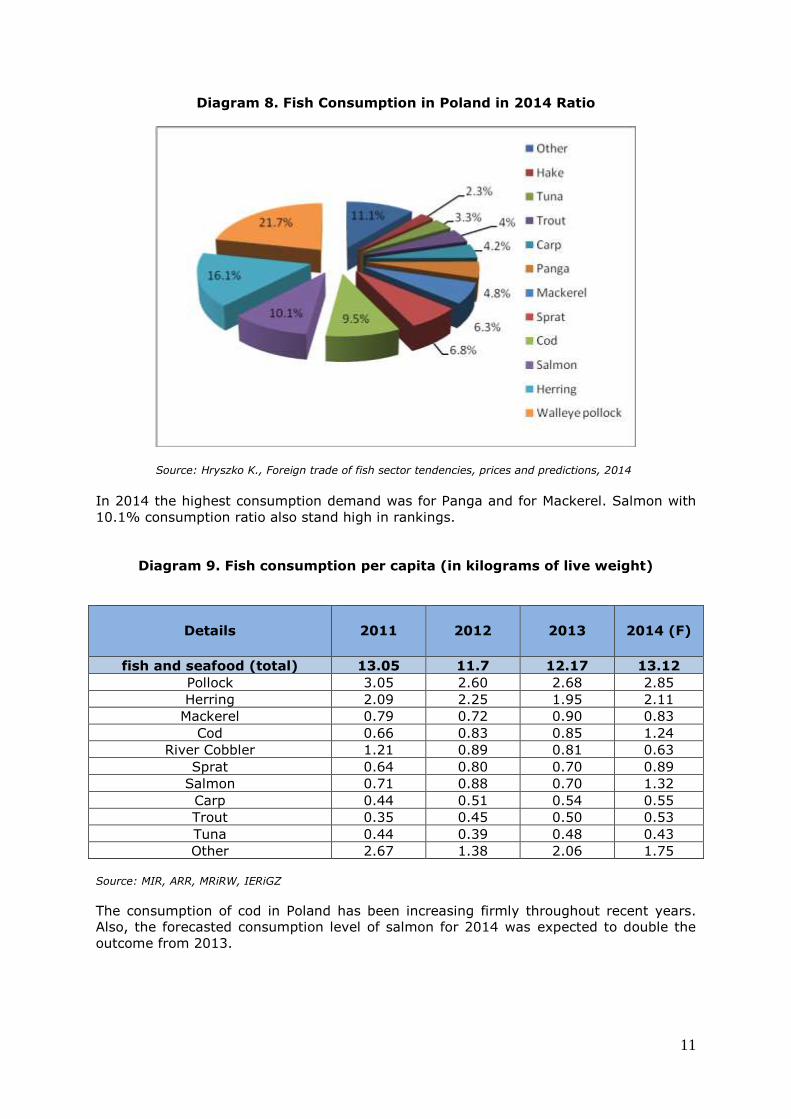
Diagram 8. Fish Consumption in Poland in 2014 Ratio
Source: Hryszko K., Foreign trade of fish sector tendencies, prices and predictions, 2014
In 2014 the highest consumption demand was for Panga and for Mackerel. Salmon with
10.1% consumption ratio also stand high in rankings.
Diagram 9. Fish consumption per capita (in kilograms of live weight)
Source: MIR, ARR, MRiRW, IERiGZ
The consumption of cod in Poland has been increasing firmly throughout recent years.
Also, the forecasted consumption level of salmon for 2014 was expected to double the
outcome from 2013.
Details
2011
2012
2013
2014 (F)
fish and seafood (total) 13.05 11.7 12.17 13.12
Pollock 3.05 2.60 2.68 2.85
Herring 2.09 2.25 1.95 2.11
Mackerel 0.79 0.72 0.90 0.83
Cod 0.66 0.83 0.85 1.24
River Cobbler 1.21 0.89 0.81 0.63
Sprat 0.64 0.80 0.70 0.89
Salmon 0.71 0.88 0.70 1.32
Carp 0.44 0.51 0.54 0.55
Trout 0.35 0.45 0.50 0.53
Tuna 0.44 0.39 0.48 0.43
Other 2.67 1.38 2.06 1.75
12
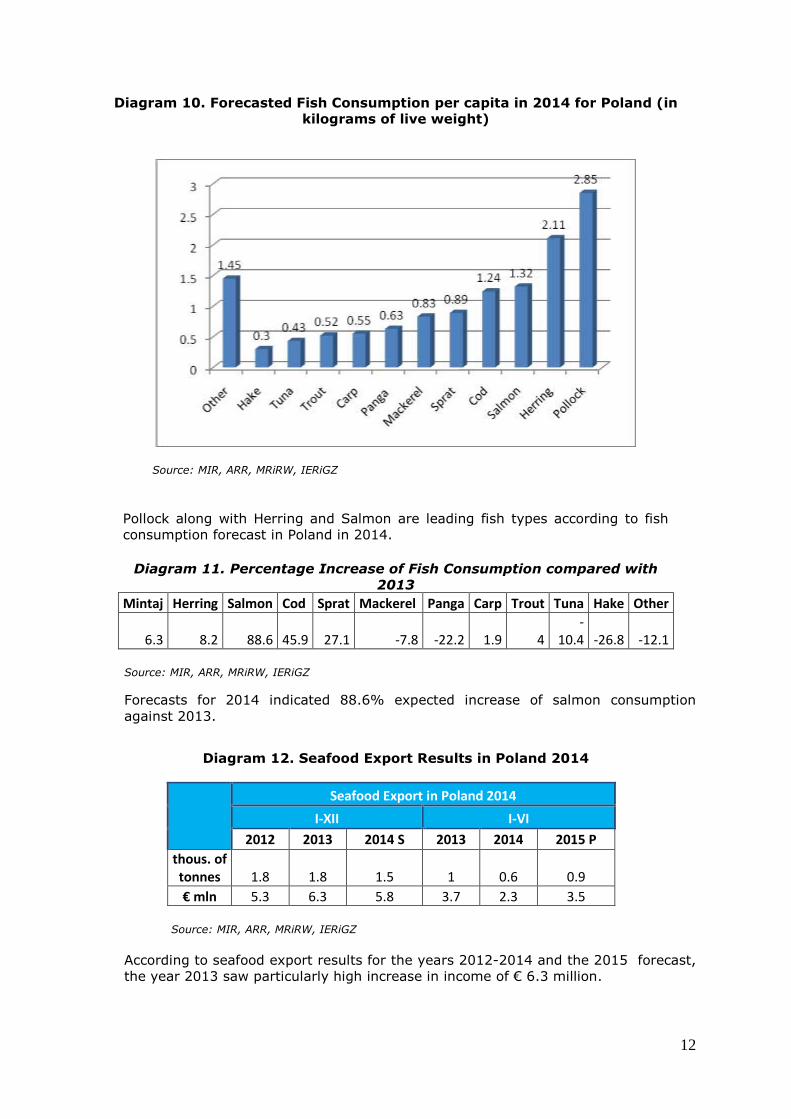
Diagram 10. Forecasted Fish Consumption per capita in 2014 for Poland (in
kilograms of live weight)
Source: MIR, ARR, MRiRW, IERiGZ
Pollock along with Herring and Salmon are leading fish types according to fish
consumption forecast in Poland in 2014.
Diagram 11. Percentage Increase of Fish Consumption compared with
2013
Mintaj Herring Salmon Cod Sprat Mackerel Panga Carp Trout Tuna Hake Other
6.3 8.2 88.6 45.9 27.1 -7.8 -22.2 1.9 4 -
10.4 -26.8 -12.1
Source: MIR, ARR, MRiRW, IERiGZ
Forecasts for 2014 indicated 88.6% expected increase of salmon consumption
against 2013.
Diagram 12. Seafood Export Results in Poland 2014
Seafood Export in Poland 2014
I-XII I-VI
2012 2013 2014 S 2013 2014 2015 P
thous. of tonnes 1.8 1.8 1.5 1 0.6 0.9
€ mln 5.3 6.3 5.8 3.7 2.3 3.5
Source: MIR, ARR, MRiRW, IERiGZ
According to seafood export results for the years 2012-2014 and the 2015 forecast,
the year 2013 saw particularly high increase in income of € 6.3 million.

13
Diagram 13. Seafood Import Results in Poland
Seafood Import in Poland 2014
I-XII I-VI
2012 2013 2014 S 2013 2014 2015 P
thous. of tonnes 7 7.3 7.5 3.8 3.9 3.7
€ mln 26.5 29.2 36 14.5 19.7 17
Source: MIR, ARR, MRiRW, IERiGZ
Seafood import results for the years 2012-2014 and the forecast for 2015 look more
optimistic. The income in 2013 and 2014 rose gradually reaching 36 million euro in
2014. Also, the first half of 2015 is expected to provide export income of € 17 million.
The hotel, restaurants and catering (HORECA) sector continues to lead the way in
introducing new products and using less popular fish species such as butter fish,
grenadier, sole, tuna and various types of seafood. More affluent consumers, as well as
those who are younger and better educated purchase these types of species. This trend
is fuelled by the fact that an increasing number of Poles travel abroad and are ready to
try new eating experiences. This tendency prompted some fish andseafood suppliers to
prepare a special offer dedicated to HORECA sector. There are companies which
specialise in delivering products strictly to HORECA.
Due to the fast pace of life in urban areas there is a growing interest in ready meals,
including frozen fish fingers and burgers. There is also a continuous increase in the
volume of the canned fish market.
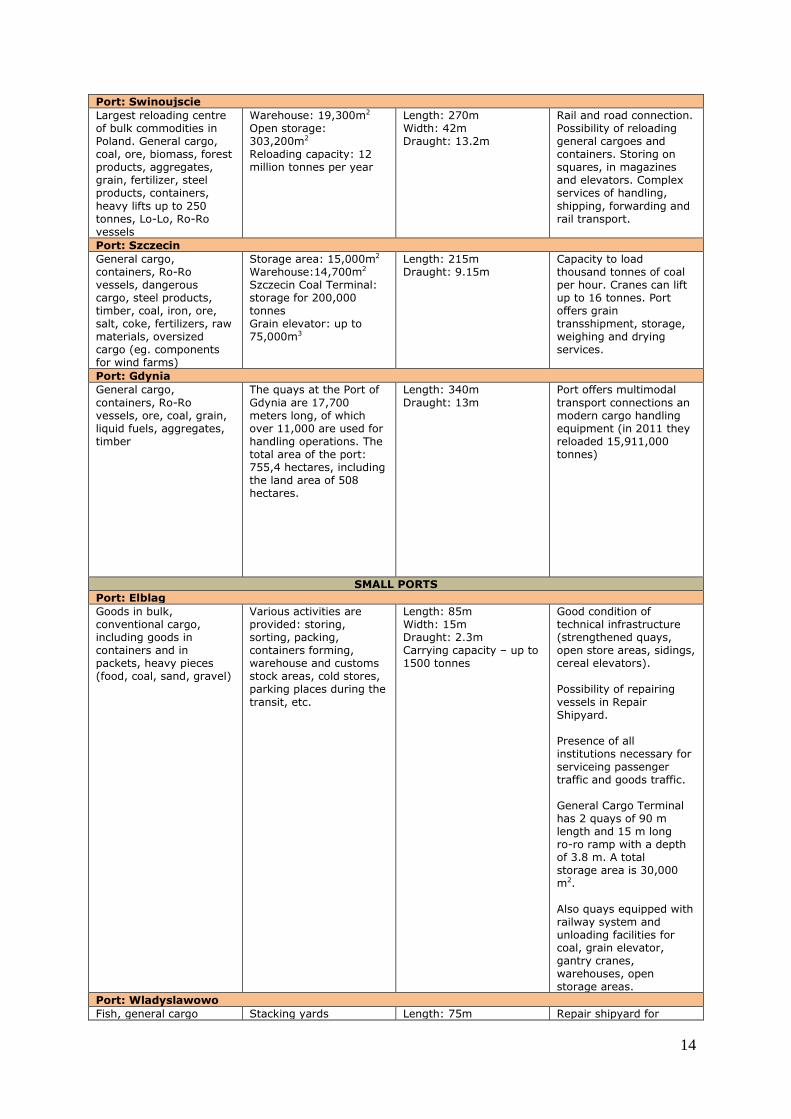
3.3 Ports
Type of commodity
handled Storage Maximum size of
vessel Specified facilities
MAIN PORTS
Port: Gdansk
The inner port: containerised cargo, passenger ferries, Ro-Ro vessels, passenger cars, citrus fruit, sulphur, phosphorites, other bulk cargo, rolled steel products, oversize and heavy lifts, grains, fertilizers, ore and coal. The outer port: Raw materials, such as liquid fuels, coal, liquefied gas. The outer port also accommodates
modern Deepwater Container Terminal (DCT)
Warehousing area: 107,022m2
Open store area: 549,525m2
Cargo handling capacity: Inner port - 11.5 million tonnes Outer port – 43.5 million tonnes
Inner port Length: 225m Draught: 10.2m Outer port Length: 220-765m Draught: 15m
A variety of integrated terminal and holder depot operations: a full range of container handling and services, stuffing and stripping, repairs and cleaning, reefer plugs for refrigerated containers. Universal quays are well-situated to handling every type of general cargo eg. packed in pallets, as well as heavy lifts, steel products and hazardous cargoes.
Border veterinary inspection in provided in the Port of Gdansk for all animal products according to the EU standards.
14
Port: Swinoujscie
Largest reloading centre of bulk commodities in Poland. General cargo, coal, ore, biomass, forest products, aggregates, grain, fertilizer, steel products, containers,
heavy lifts up to 250 tonnes, Lo-Lo, Ro-Ro vessels
Warehouse: 19,300m2
Open storage: 303,200m2
Reloading capacity: 12 million tonnes per year
Length: 270m Width: 42m Draught: 13.2m
Rail and road connection. Possibility of reloading general cargoes and containers. Storing on squares, in magazines and elevators. Complex services of handling,
shipping, forwarding and rail transport.
Port: Szczecin
General cargo, containers, Ro-Ro vessels, dangerous cargo, steel products, timber, coal, iron, ore, salt, coke, fertilizers, raw materials, oversized cargo (eg. components for wind farms)
Storage area: 15,000m2
Warehouse:14,700m2
Szczecin Coal Terminal: storage for 200,000 tonnes Grain elevator: up to 75,000m3
Length: 215m Draught: 9.15m
Capacity to load thousand tonnes of coal per hour. Cranes can lift up to 16 tonnes. Port offers grain transshipment, storage, weighing and drying services.
Port: Gdynia
General cargo,
containers, Ro-Ro vessels, ore, coal, grain, liquid fuels, aggregates, timber
The quays at the Port of
Gdynia are 17,700 meters long, of which over 11,000 are used for handling operations. The total area of the port: 755,4 hectares, including the land area of 508 hectares.
Length: 340m
Draught: 13m
Port offers multimodal
transport connections an modern cargo handling equipment (in 2011 they reloaded 15,911,000 tonnes)
SMALL PORTS
Port: Elblag
Goods in bulk, conventional cargo, including goods in containers and in packets, heavy pieces (food, coal, sand, gravel)
Various activities are provided: storing, sorting, packing, containers forming, warehouse and customs stock areas, cold stores, parking places during the
transit, etc.
Length: 85m Width: 15m Draught: 2.3m Carrying capacity – up to 1500 tonnes
Good condition of technical infrastructure (strengthened quays, open store areas, sidings, cereal elevators). Possibility of repairing
vessels in Repair Shipyard. Presence of all institutions necessary for serviceing passenger traffic and goods traffic. General Cargo Terminal has 2 quays of 90 m length and 15 m long ro-ro ramp with a depth of 3.8 m. A total storage area is 30,000 m2. Also quays equipped with railway system and unloading facilities for coal, grain elevator, gantry cranes, warehouses, open storage areas.
Port: Wladyslawowo
Fish, general cargo Stacking yards Length: 75m Repair shipyard for
15
Draught: 5m fishing vessels, well-developed fish-processing infrastructure, railway siding, travelling crane, slipway for yachts of up to 12m long
Port: Darlowo
Fish, general cargo Storage area: 15,000m2
Grain elevator capacity: 8,000t
Length: 75m Draught: 4m
Fish reloading, storing, processing, sales, vessel maintenance and renovation
Port: Ustka
Fish, general cargo, coal, slate
Open storage area: 1000m2
Length: 58m Width: 11.5m Draught: 4.5m
Equipped in grain elevators, connected to general railway system. Workshops and support facilities for fishing vessels.
Port: Kolobrzeg
Fish, grain, general cargo, break-stone, fertilisers
Warehouse: 6,000m2
Open storage: 55,000m2
Grain elevator capacity: 6,000t
Length: 85m Draught:4.7m Up to 2000t
Equipped with cranes – lifting capacity up to 16t
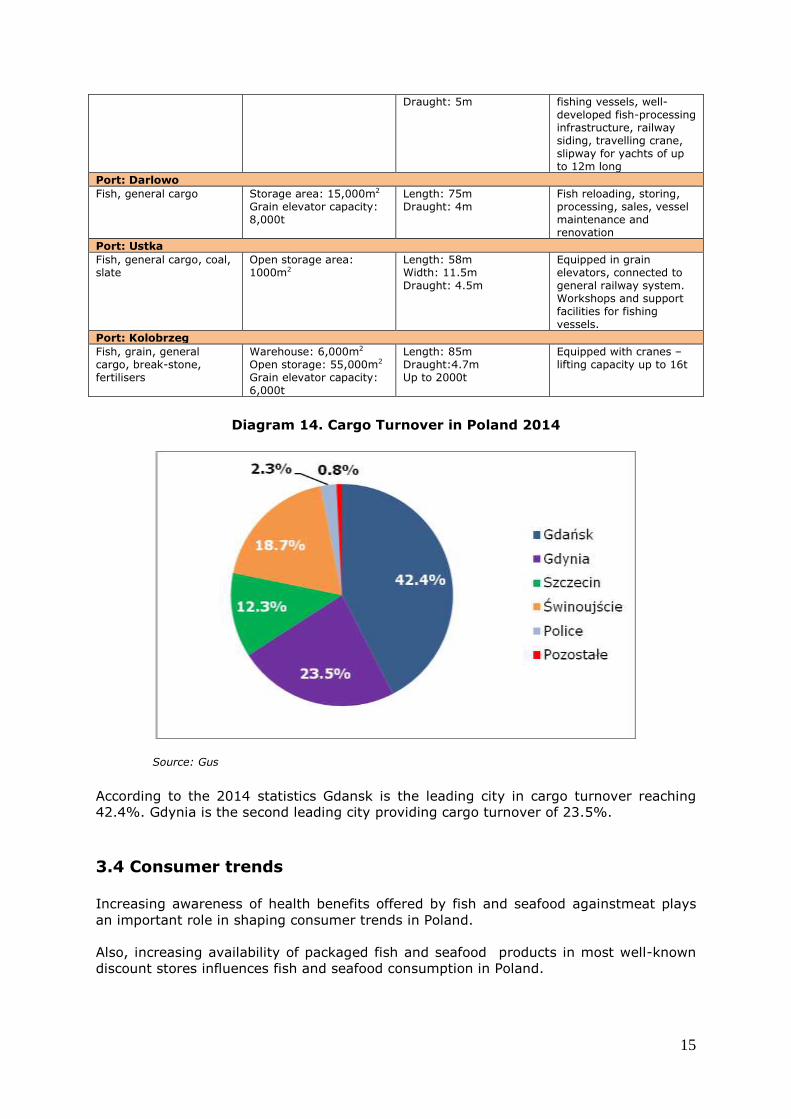
Diagram 14. Cargo Turnover in Poland 2014
Source: Gus According to the 2014 statistics Gdansk is the leading city in cargo turnover reaching
42.4%. Gdynia is the second leading city providing cargo turnover of 23.5%.
3.4 Consumer trends
Increasing awareness of health benefits offered by fish and seafood againstmeat plays
an important role in shaping consumer trends in Poland.
Also, increasing availability of packaged fish and seafood products in most well-known
discount stores influences fish and seafood consumption in Poland.
16
Fresh seafood tends to be purchased by people with higher education and with a higher
income. Fish preserves and frozen fish are purchased more often by consumers with
lower education and living in smaller towns (the exceptions are small towns and villages
on the Baltic Coast).
In the last few years, there were many public campaigns (also a big TV campaign
organised by the Ministry of Agriculture and Rural Development) aimed at increasing fish
consumption. The campaign promoted health benefits related to eating fish.
Seafood consumption in Poland is characterised by seasonality. Habits related to the
strong Christian tradition boost fish consumption during the Christmas period and the
pre-Easter season. Many Poles (usually older people living in small towns and those who
are devout) tend to have fish on Fridays, when meat should not be consumed according
to the tradition.
71% of Polish consumers admit consuming fish and seafood at least once per year,
whereas 43% admit consuming seafood and fish two times per week or more often. Men
tend to consume fish and seafood products more often than women (46% vs 40%)
whereas 1.6% of Polish consumers do not eat fish at all.
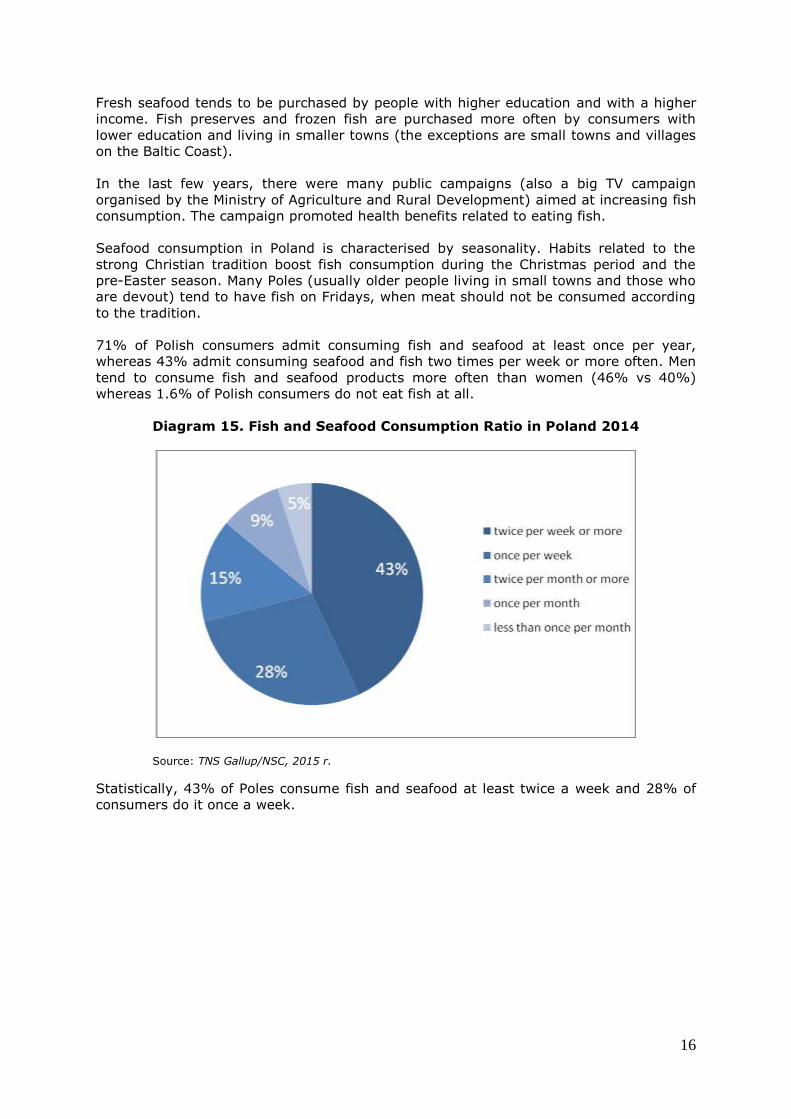
Diagram 15. Fish and Seafood Consumption Ratio in Poland 2014
Source: TNS Gallup/NSC, 2015 r.
Statistically, 43% of Poles consume fish and seafood at least twice a week and 28% of
consumers do it once a week.
17
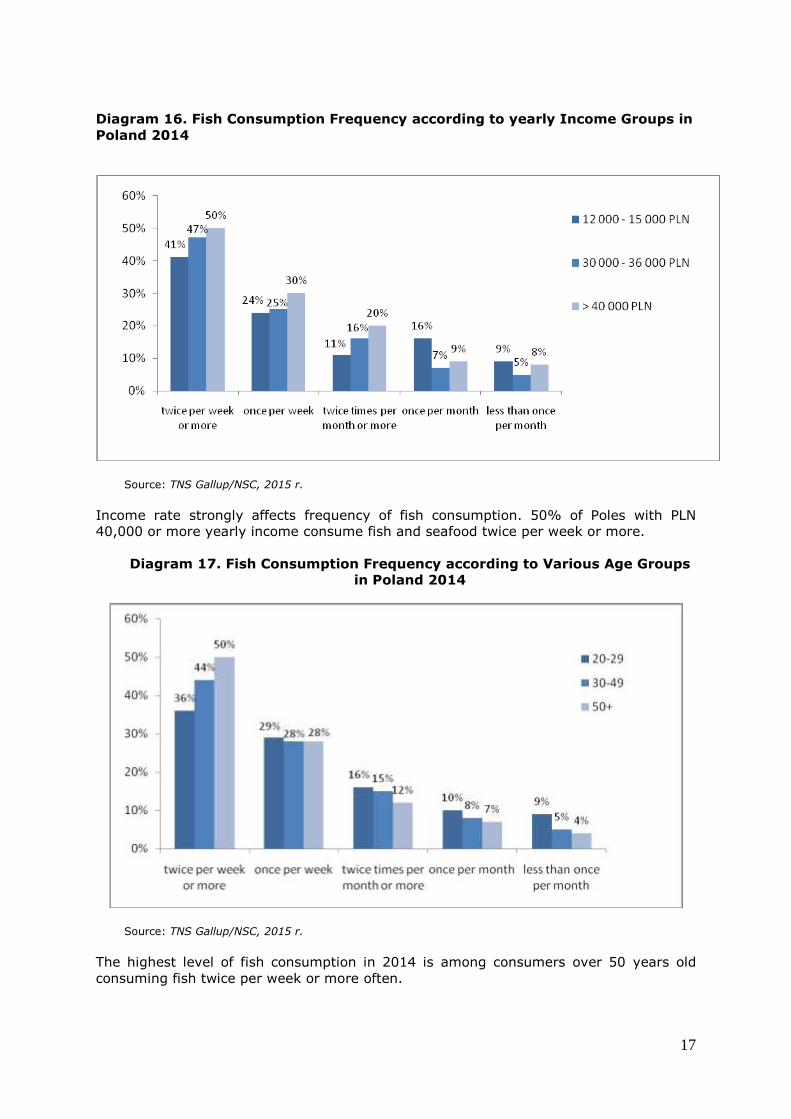
Diagram 16. Fish Consumption Frequency according to yearly Income Groups in
Poland 2014
Source: TNS Gallup/NSC, 2015 r.
Income rate strongly affects frequency of fish consumption. 50% of Poles with PLN
40,000 or more yearly income consume fish and seafood twice per week or more.
Diagram 17. Fish Consumption Frequency according to Various Age Groups
in Poland 2014
Source: TNS Gallup/NSC, 2015 r.
The highest level of fish consumption in 2014 is among consumers over 50 years old
consuming fish twice per week or more often.
18
Polish customer strongly prefers salt-water fish (78%) over the freshwater fish
consumption (7.2%). Sea food such as crustaceans, molluscs and invertebrates stands
for 14.8% of Pole consumption.
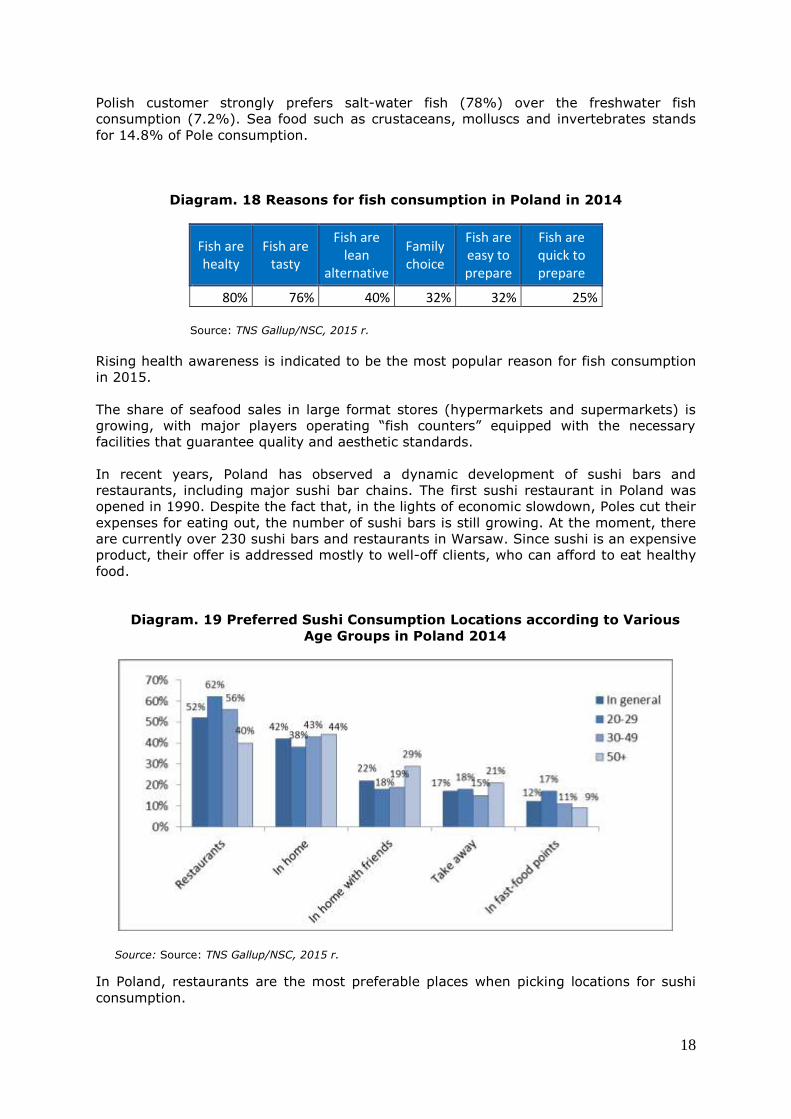
Diagram. 18 Reasons for fish consumption in Poland in 2014
Fish are healty
Fish are tasty
Fish are lean
alternative
Family choice
Fish are easy to prepare
Fish are quick to prepare
80% 76% 40% 32% 32% 25% Source: TNS Gallup/NSC, 2015 r.
Rising health awareness is indicated to be the most popular reason for fish consumption
in 2015.
The share of seafood sales in large format stores (hypermarkets and supermarkets) is
growing, with major players operating “fish counters” equipped with the necessary
facilities that guarantee quality and aesthetic standards.
In recent years, Poland has observed a dynamic development of sushi bars and
restaurants, including major sushi bar chains. The first sushi restaurant in Poland was
opened in 1990. Despite the fact that, in the lights of economic slowdown, Poles cut their
expenses for eating out, the number of sushi bars is still growing. At the moment, there
are currently over 230 sushi bars and restaurants in Warsaw. Since sushi is an expensive
product, their offer is addressed mostly to well-off clients, who can afford to eat healthy
food.
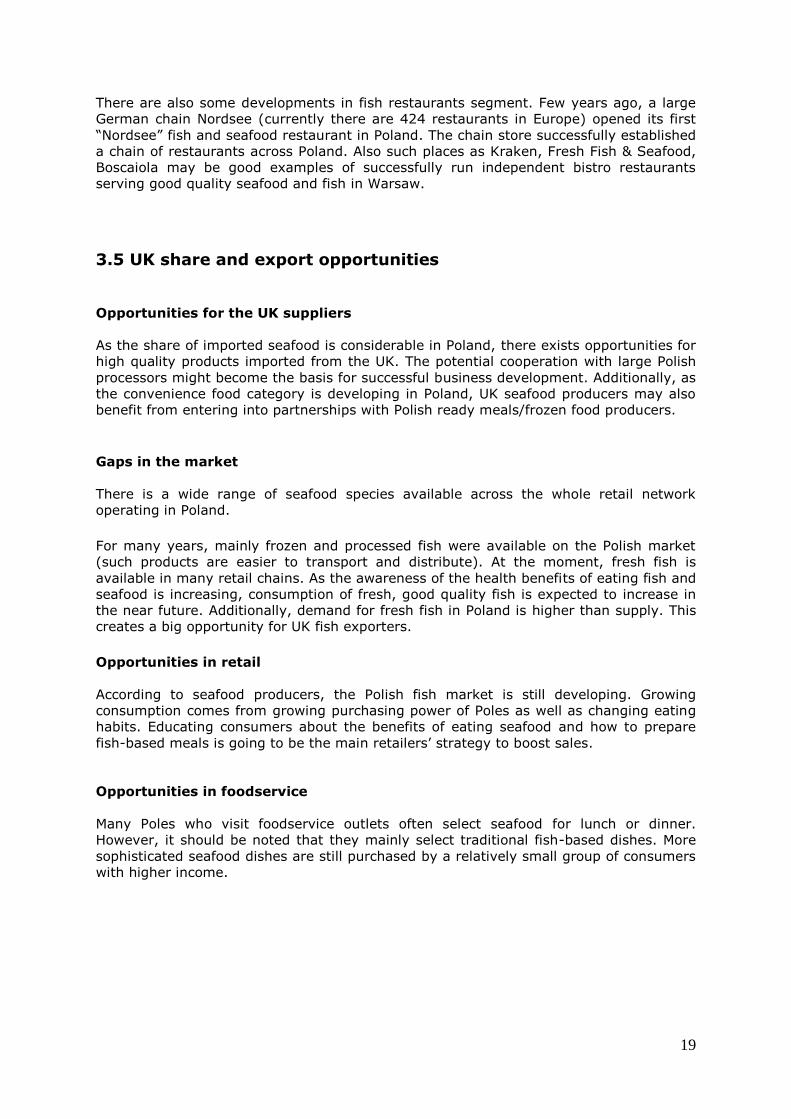
Diagram. 19 Preferred Sushi Consumption Locations according to Various
Age Groups in Poland 2014
Source: Source: TNS Gallup/NSC, 2015 r.
In Poland, restaurants are the most preferable places when picking locations for sushi
consumption.
19
There are also some developments in fish restaurants segment. Few years ago, a large
German chain Nordsee (currently there are 424 restaurants in Europe) opened its first
“Nordsee” fish and seafood restaurant in Poland. The chain store successfully established
a chain of restaurants across Poland. Also such places as Kraken, Fresh Fish & Seafood,
Boscaiola may be good examples of successfully run independent bistro restaurants
serving good quality seafood and fish in Warsaw.
3.5 UK share and export opportunities
Opportunities for the UK suppliers
As the share of imported seafood is considerable in Poland, there exists opportunities for
high quality products imported from the UK. The potential cooperation with large Polish
processors might become the basis for successful business development. Additionally, as
the convenience food category is developing in Poland, UK seafood producers may also
benefit from entering into partnerships with Polish ready meals/frozen food producers.
Gaps in the market
There is a wide range of seafood species available across the whole retail network
operating in Poland.
For many years, mainly frozen and processed fish were available on the Polish market
(such products are easier to transport and distribute). At the moment, fresh fish is
available in many retail chains. As the awareness of the health benefits of eating fish and
seafood is increasing, consumption of fresh, good quality fish is expected to increase in
the near future. Additionally, demand for fresh fish in Poland is higher than supply. This
creates a big opportunity for UK fish exporters.
Opportunities in retail
According to seafood producers, the Polish fish market is still developing. Growing
consumption comes from growing purchasing power of Poles as well as changing eating
habits. Educating consumers about the benefits of eating seafood and how to prepare
fish-based meals is going to be the main retailers’ strategy to boost sales.
Opportunities in foodservice
Many Poles who visit foodservice outlets often select seafood for lunch or dinner.
However, it should be noted that they mainly select traditional fish-based dishes. More
sophisticated seafood dishes are still purchased by a relatively small group of consumers
with higher income.
20
4. Doing business profile 4.1 The supply structure
We have checked a structure of a supply network (included in Seafish’s market
report) with the leading fish importers. A diagram “The seafood supply
structure for imported products in Poland” is still valid.
Before the accession to the European Union in 2004, hygienic and veterinary standards
for food processing industry were raised. The Polish fish industry had to embrace intense
modernisation. Plants which failed to meet the highest veterinary standards were closed.
However, most plants managed to adjust to the EU regulations.
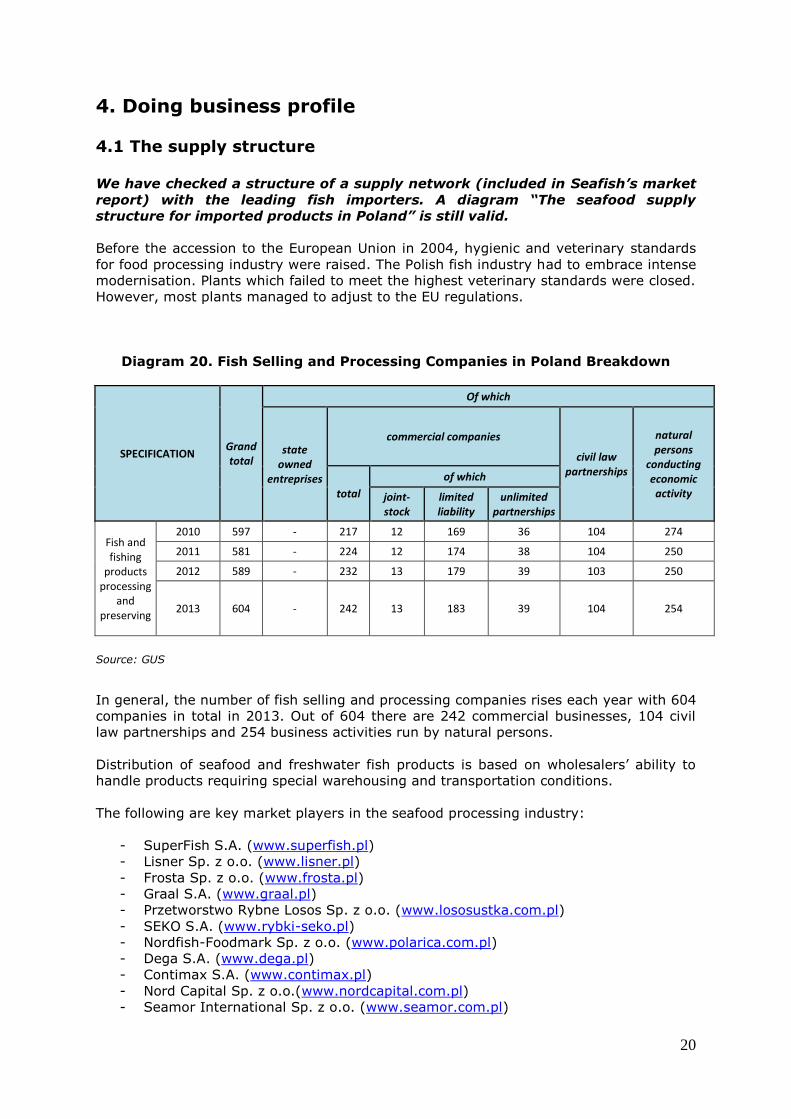
Diagram 20. Fish Selling and Processing Companies in Poland Breakdown
SPECIFICATION Grand total
Of which
state owned
entreprises
commercial companies
civil law partnerships
natural persons
conducting economic activity total
of which
joint-stock
limited liability
unlimited partnerships
Fish and fishing
products processing
and preserving
2010 597 - 217 12 169 36 104 274
2011 581 - 224 12 174 38 104 250
2012 589 - 232 13 179 39 103 250
2013 604 - 242 13 183 39 104 254
Source: GUS
In general, the number of fish selling and processing companies rises each year with 604
companies in total in 2013. Out of 604 there are 242 commercial businesses, 104 civil
law partnerships and 254 business activities run by natural persons.
Distribution of seafood and freshwater fish products is based on wholesalers’ ability to
handle products requiring special warehousing and transportation conditions.
The following are key market players in the seafood processing industry:
- SuperFish S.A. (www.superfish.pl)
- Lisner Sp. z o.o. (www.lisner.pl)
- Frosta Sp. z o.o. (www.frosta.pl)
- Graal S.A. (www.graal.pl)
- Przetworstwo Rybne Losos Sp. z o.o. (www.lososustka.com.pl)
- SEKO S.A. (www.rybki-seko.pl)
- Nordfish-Foodmark Sp. z o.o. (www.polarica.com.pl)
- Dega S.A. (www.dega.pl)
- Contimax S.A. (www.contimax.pl)
- Nord Capital Sp. z o.o.(www.nordcapital.com.pl)
- Seamor International Sp. z o.o. (www.seamor.com.pl)
21
- Morpol S.A (www.morpol.com)
- Suempol Sp. Z o.o. (www.suempol.pl)
- Royal Greenland Seafood Sp. z o.o. (www.royalgreenland.com)
- Wilbo S.A. (www.wilbo.pl)
- Koral S.A. (www.koral.pl)
- Kind Oscar Sp. z o.o. (pl.kingoscar.com)
The main seafood importers/distributors are listed below:
- Abramczyk Sp. z o.o. (www.abramczyk.pl)
- Nord Capital Sp. z o.o.(www.nordcapital.com.pl)
- DNHS Poland Sp.z o.o. (www.dnhs.pl)
- Morex Sp. z o.o. (www.morex.pl)
- Lux Fish (www.luxfish.pl)
- Castelmar (www.castelmar.pl)
- Seamor International Sp. z o.o. (www.seamor.com.pl)
- Kuchnie Swiata S.A. (www.kuchnieswiata.com.pl
- Eurofish Sp. z o.o. (www.eurofishpoland.pl)
- Espresen Polska Sp z o.o. (www.pspr.pl)
- Frosalfish Marek Kawka (www.frosal.pl)
- Aja Sp. z o.o. (aja-seafood.pl)
In Poland there are a few major logistic centres for frozen products in Poland, which are
modern, well equipped and offering full range of services (storage, transport,
completion) for the biggest retail networks:
- Frigo Logistics Sp. z o.o. (www.frigologistics.pl)
- Jago S.A. (www.jago.com.pl)
- Pago Sp. z o.o. (www.pago.net.pl)
- Nagel Polska Sp. z o.o. (www.nagel-group.com)
- Solstor (www.solstor.co.uk)
Specialised distribution network is still developing in Poland. The largest retail chains
have got their central logistics (however fresh and frozen fish and seafood is provided by
specialised logistic centres for frozen food products - see above list). Small retailers
source products from wholesalers.
In 2009, six distribution companies established a new consortium “Polskie Centrum
Dystrybucji Ryb” (Polish Centre of Fish Distribution). The Centre’ s activity covers almost
whole Poland. The aim of that relatively new initiative is to achieve effective methods
and integration of fish distribution process across the country. The consortium is open
for new members among distributors and wholesalers of fish, processed fish and
preserves.
4.2 The retail channel In 2014, fish and seafood products became more widely offered since they have been
introduced in major discount stores. Big chains of hypermarkets and supermarkets keep
also strong position at that market and are still very competitive in terms of prices. On
the other hand, sale of fish and fish products straight from mobile shops or from
provisional stalls remains popular.
The widest assortment is offered by small format seafood stores. Large format outlets
operated by key retail chains have all seafood counters, but the product assortment is
relatively limited to the most popular species and products. However, due to the
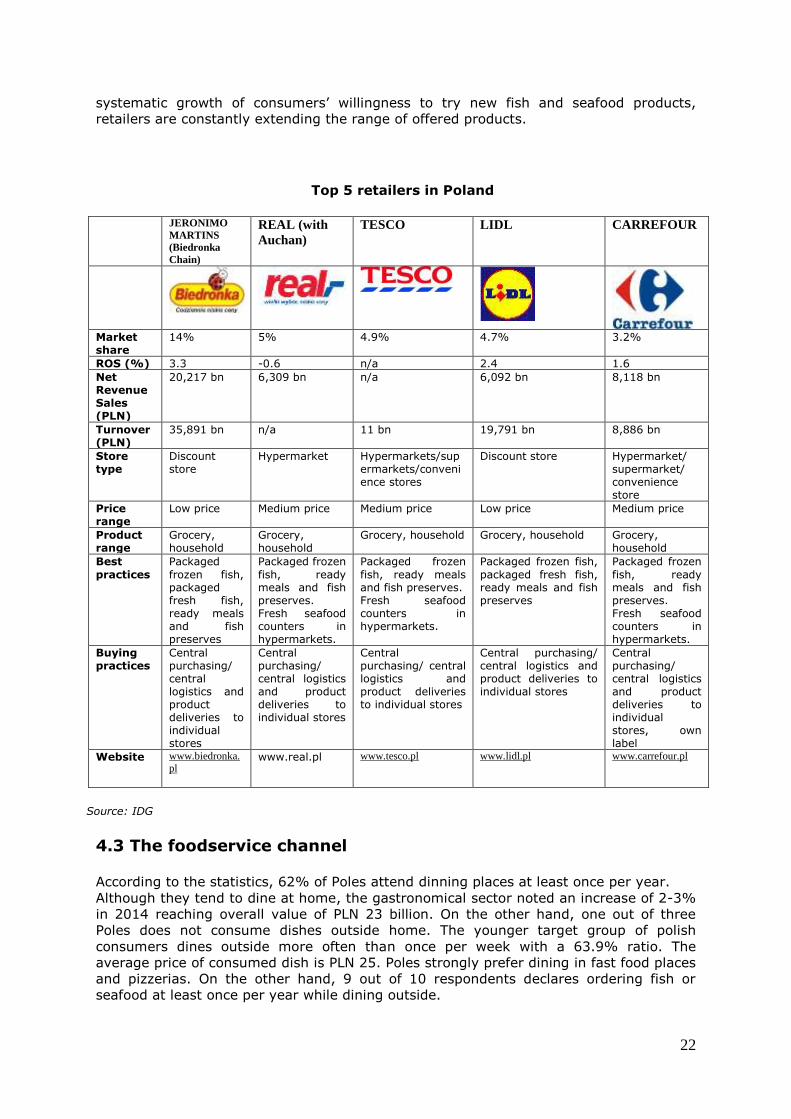
22
systematic growth of consumers’ willingness to try new fish and seafood products,
retailers are constantly extending the range of offered products.
Top 5 retailers in Poland
JERONIMO
MARTINS
(Biedronka
Chain)
REAL (with
Auchan) TESCO LIDL CARREFOUR
Market share
14% 5% 4.9% 4.7% 3.2%
ROS (%) 3.3 -0.6 n/a 2.4 1.6
Net Revenue Sales (PLN)
20,217 bn 6,309 bn n/a 6,092 bn 8,118 bn
Turnover (PLN)
35,891 bn n/a 11 bn 19,791 bn 8,886 bn
Store type
Discount store
Hypermarket
Hypermarkets/supermarkets/convenience stores
Discount store Hypermarket/ supermarket/ convenience store
Price range
Low price Medium price Medium price Low price Medium price
Product range
Grocery, household
Grocery, household
Grocery, household Grocery, household Grocery, household
Best
practices
Packaged
frozen fish, packaged fresh fish, ready meals and fish preserves
Packaged frozen
fish, ready meals and fish preserves. Fresh seafood counters in hypermarkets.
Packaged frozen
fish, ready meals and fish preserves. Fresh seafood counters in hypermarkets.
Packaged frozen fish,
packaged fresh fish, ready meals and fish preserves
Packaged frozen
fish, ready meals and fish preserves. Fresh seafood counters in hypermarkets.
Buying practices
Central purchasing/ central logistics and product deliveries to individual stores
Central purchasing/ central logistics and product deliveries to individual stores
Central purchasing/ central logistics and product deliveries to individual stores
Central purchasing/ central logistics and product deliveries to individual stores
Central purchasing/ central logistics and product deliveries to individual stores, own label
Website www.biedronka.
pl
www.real.pl www.tesco.pl www.lidl.pl www.carrefour.pl
Source: IDG
4.3 The foodservice channel According to the statistics, 62% of Poles attend dinning places at least once per year.
Although they tend to dine at home, the gastronomical sector noted an increase of 2-3%
in 2014 reaching overall value of PLN 23 billion. On the other hand, one out of three
Poles does not consume dishes outside home. The younger target group of polish
consumers dines outside more often than once per week with a 63.9% ratio. The
average price of consumed dish is PLN 25. Poles strongly prefer dining in fast food places
and pizzerias. On the other hand, 9 out of 10 respondents declares ordering fish or
seafood at least once per year while dining outside.

23
37% of Poles declared ordering fish and seafood at least once per month while 12% of
respondents declared they never order fish or seafood. These figures seem low in
comparison to the real fish and seafood home consumption (90% of Poles declares fish
and seafood consumption once per month or more often). Relatively low level of fish and
seafood consumption in bars and restaurants may be affected by the tendency to order
traditional regional Polish dishes and by the price of served fish and seafood which tends
to be higher. 5% of Poles declares ordering traditional Polish cuisine and 47% chooses
such dishes as pizzas. On the other hand, 26% of respondents prefers fast food services,
Asian dishes or kebabs.
Diagram 20. The Frequency Ratio of Fish Consumption in Horeca Sector
Poland 2014
Source: TNS Gallup/NSC, 2015 r.
7% of Poles tend to consume fish more than once per week via Horeca and almost 30%
of Poles consume fish 1-3 times a year. 12% had never ordered fish from Horeca.
24
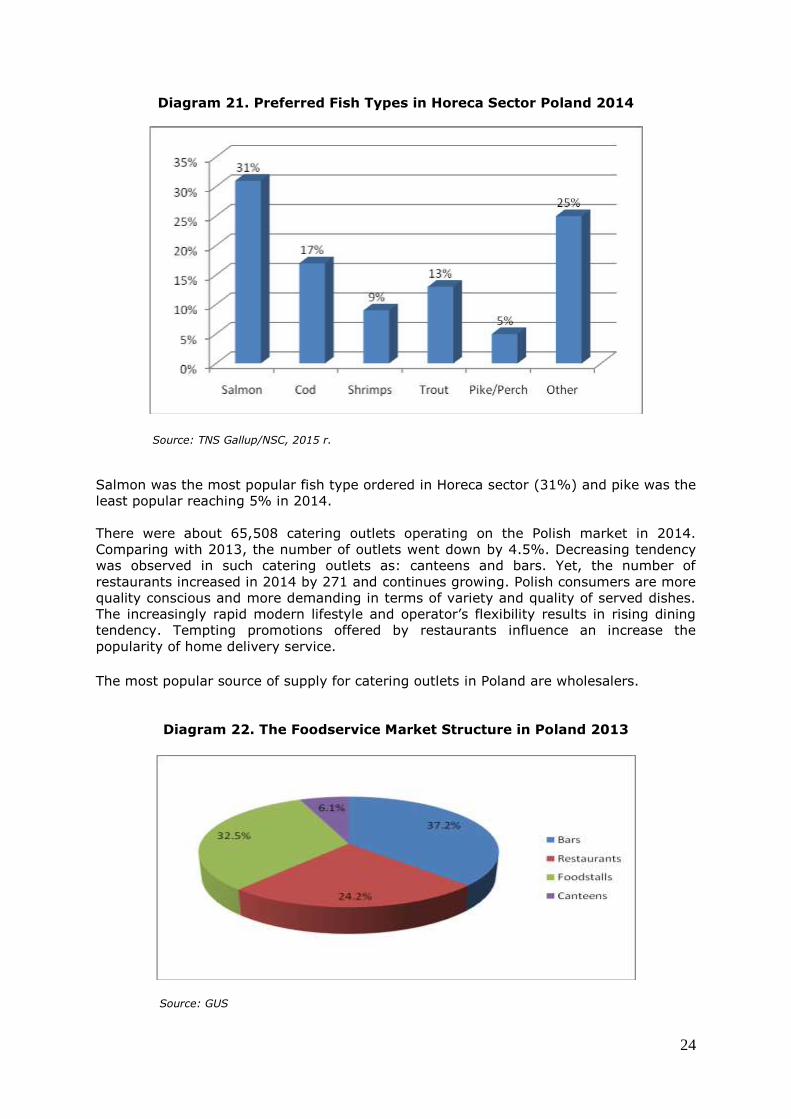
Diagram 21. Preferred Fish Types in Horeca Sector Poland 2014
Source: TNS Gallup/NSC, 2015 r.
Salmon was the most popular fish type ordered in Horeca sector (31%) and pike was the
least popular reaching 5% in 2014.
There were about 65,508 catering outlets operating on the Polish market in 2014.
Comparing with 2013, the number of outlets went down by 4.5%. Decreasing tendency
was observed in such catering outlets as: canteens and bars. Yet, the number of
restaurants increased in 2014 by 271 and continues growing. Polish consumers are more
quality conscious and more demanding in terms of variety and quality of served dishes.
The increasingly rapid modern lifestyle and operator’s flexibility results in rising dining
tendency. Tempting promotions offered by restaurants influence an increase the
popularity of home delivery service.
The most popular source of supply for catering outlets in Poland are wholesalers.
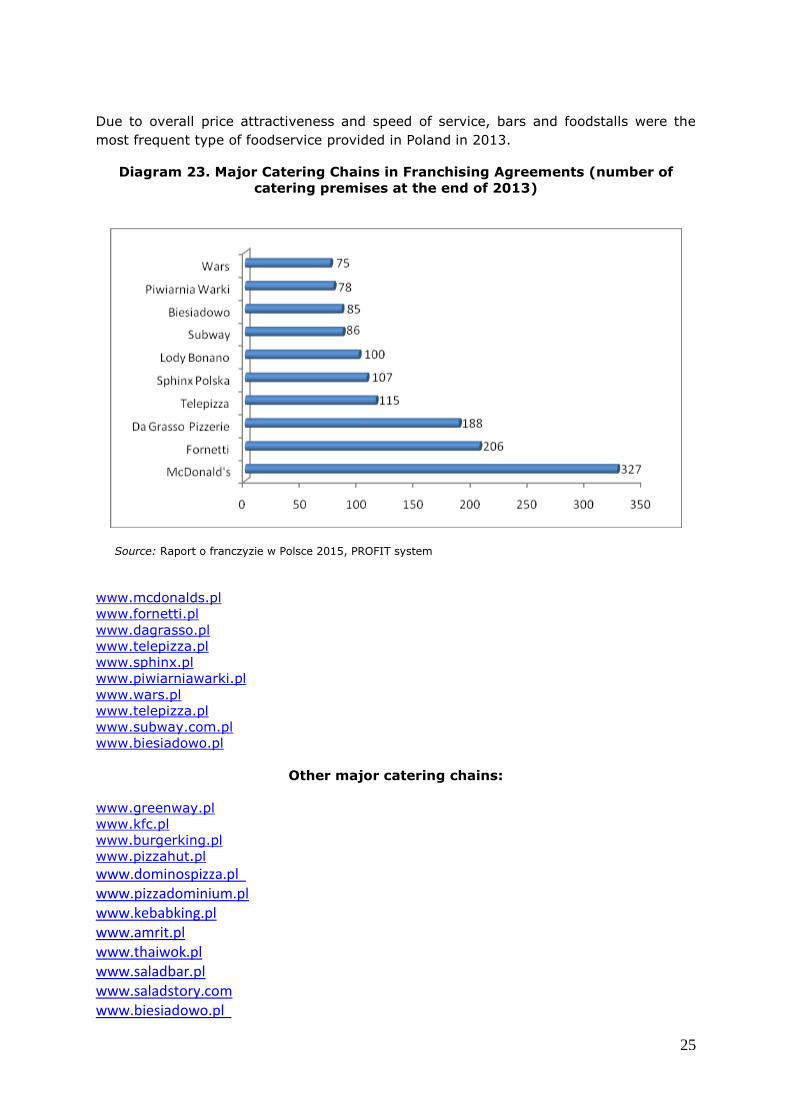
Diagram 22. The Foodservice Market Structure in Poland 2013
Source: GUS
25
Due to overall price attractiveness and speed of service, bars and foodstalls were the
most frequent type of foodservice provided in Poland in 2013.
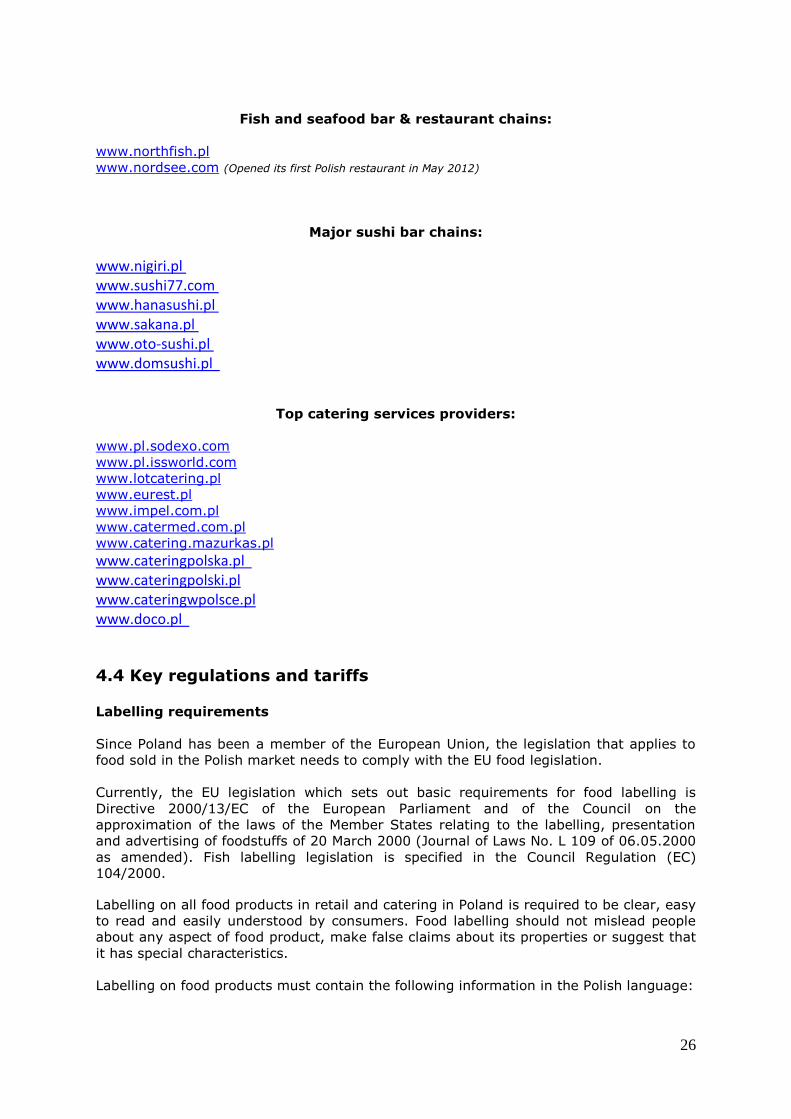
Diagram 23. Major Catering Chains in Franchising Agreements (number of
catering premises at the end of 2013)
Source: Raport o franczyzie w Polsce 2015, PROFIT system
www.mcdonalds.pl
www.fornetti.pl
www.dagrasso.pl
www.telepizza.pl
www.sphinx.pl
www.piwiarniawarki.pl
www.wars.pl
www.telepizza.pl
www.subway.com.pl
www.biesiadowo.pl
Other major catering chains:
www.greenway.pl
www.kfc.pl
www.burgerking.pl
www.pizzahut.pl
www.dominospizza.pl www.pizzadominium.pl www.kebabking.pl www.amrit.pl www.thaiwok.pl www.saladbar.pl www.saladstory.com www.biesiadowo.pl
26
Fish and seafood bar & restaurant chains:
www.northfish.pl
www.nordsee.com (Opened its first Polish restaurant in May 2012)
Major sushi bar chains:
www.nigiri.pl www.sushi77.com www.hanasushi.pl www.sakana.pl www.oto-sushi.pl www.domsushi.pl
Top catering services providers:
www.pl.sodexo.com
www.pl.issworld.com
www.lotcatering.pl
www.eurest.pl
www.impel.com.pl
www.catermed.com.pl
www.catering.mazurkas.pl
www.cateringpolska.pl www.cateringpolski.pl www.cateringwpolsce.pl www.doco.pl
4.4 Key regulations and tariffs Labelling requirements
Since Poland has been a member of the European Union, the legislation that applies to
food sold in the Polish market needs to comply with the EU food legislation.
Currently, the EU legislation which sets out basic requirements for food labelling is
Directive 2000/13/EC of the European Parliament and of the Council on the
approximation of the laws of the Member States relating to the labelling, presentation
and advertising of foodstuffs of 20 March 2000 (Journal of Laws No. L 109 of 06.05.2000
as amended). Fish labelling legislation is specified in the Council Regulation (EC)
104/2000.
Labelling on all food products in retail and catering in Poland is required to be clear, easy
to read and easily understood by consumers. Food labelling should not mislead people
about any aspect of food product, make false claims about its properties or suggest that
it has special characteristics.
Labelling on food products must contain the following information in the Polish language:
27
The name and address of the manufacturer or packer and the country of origin.
The name of the food that clearly explains what the product is.
A list of ingredients (in descending order of weight).
Information whether a food product contains any of the following allergens:
cereals containing gluten, crustaceans, molluscs, eggs, fish, peanuts, soybeans,
milk, nuts, celery, mustard, sesame seeds, sulphur dioxide and sulphites.
Shelf-life indication. (“Use by” date for highly perishable foods and “the best
before” date for other food products).
Net weight or the number of pieces.
Lot marking.
Any special storage conditions and instructions for use.
Additional requirements apply to seafood:
Species commercial name.
Production method used: “caught in…” for wild fish, “farmed” or “cultivated” for
aquaculture products.
Catch area.
Nutrition labelling is voluntary, unless a manufacturer is making a nutritional or health
claim about the food.
Regulation (EU) No 1169/2011 of the European Parliament and of the Council of 25
October 2011 on the provision of food information to consumers will replace the current
requirements for the labelling of foodstuffs set out in the Directive 2000/13/EC and the
nutrition labelling requirements of the Directive 90/496/EEC. Some of the new
requirements of this Regulation include the introduction of a minimum font size for
mandatory information, allergen labelling for foods sold unpackaged, labelling
requirements regarding foodstuffs sold via the internet, country of origin labelling and
mandatory nutrition labelling for many prepackaged foodstuffs.
The Regulation came into force on 13 December 2011. It is to be applied from 13
December 2014, with the exception of point (l) of Article 9(1) (mandatory nutrition
declaration), which shall apply from 13 December 2016, and Part B of Annex VI (specific
requirements regarding the designation of minced meat), which will apply from 1
January 2014.
A health certificate issued by a government-approved veterinarian from the UK must
accompany all seafood shipments to Poland.
Organic farming
The Regulation on organic aquaculture animal (fish, molluscs, crustaceans) and seaweed
production (Commission Regulation (EC) No 710/2009 laying down detailed rules on
organic aquaculture animal and seaweed production) entered into force on 1 July 2010.
Certification in the Member States used to be based on private standards or national
specifications, but the new Regulation imposes minimum criteria to be used in all
countries of the European Union. The new EU logo for organic products, the “Euro-leaf”
(see picture below), must be affixed to pre-packaged organic aquaculture products
produced in the EU.

28
Tax on food
As a member of the EU, UK suppliers will not be subject to import tariffs.
Since 1 January 2011, 5% VAT is paid on fresh, processed and preserved fish as well as
on seafood.
4.5 Tips and useful links Central Statistical Office:
www.stat.gov.pl
Polish Information and Foreign Investment Agency
www.paiz.gov.pl
Ministry of Economy
www.mg.gov.pl
Ministry of Agriculture and Rural Development
www.minrol.gov.pl
Polish Association of Fish Processors:
www.psppr.pl
Information about Polish ports:
www.portalmorski.pl
Miedzynarodowe Targi Poznanskie: Organiser of Polagra-Food Fair
(www.polagra-food.pl), one of the leading international trade fairs for food products and
catering in Central and Eastern Europe:
www.mtp.pl
Miedzynarodowe Targi Gdanskie: Organiser of Polfish Fair (www.polfishtargi.pl),
International Fair of Fish Processing and Fish Products:
www.mtgsa.pl
Information about food sector:
www.portalspozywczy.pl
www.gospodarkamorska.pl/Rybolowstwo/
www.rynkometr.pl/pkd/10.2/ranking-firm
Information abour HoReCa sector:
www.horeca.pl
Polish Chamber of Fish Producers:
www.kipr.org.pl
Polish Chamber of Commerce
www.kig.pl
Institute of Agricultural and Food Economics
www.ierigz.waw.pl
29
Sea Fisheries Institute
www.mir.gdynia.pl
National Bank of Poland
www.nbp.pl
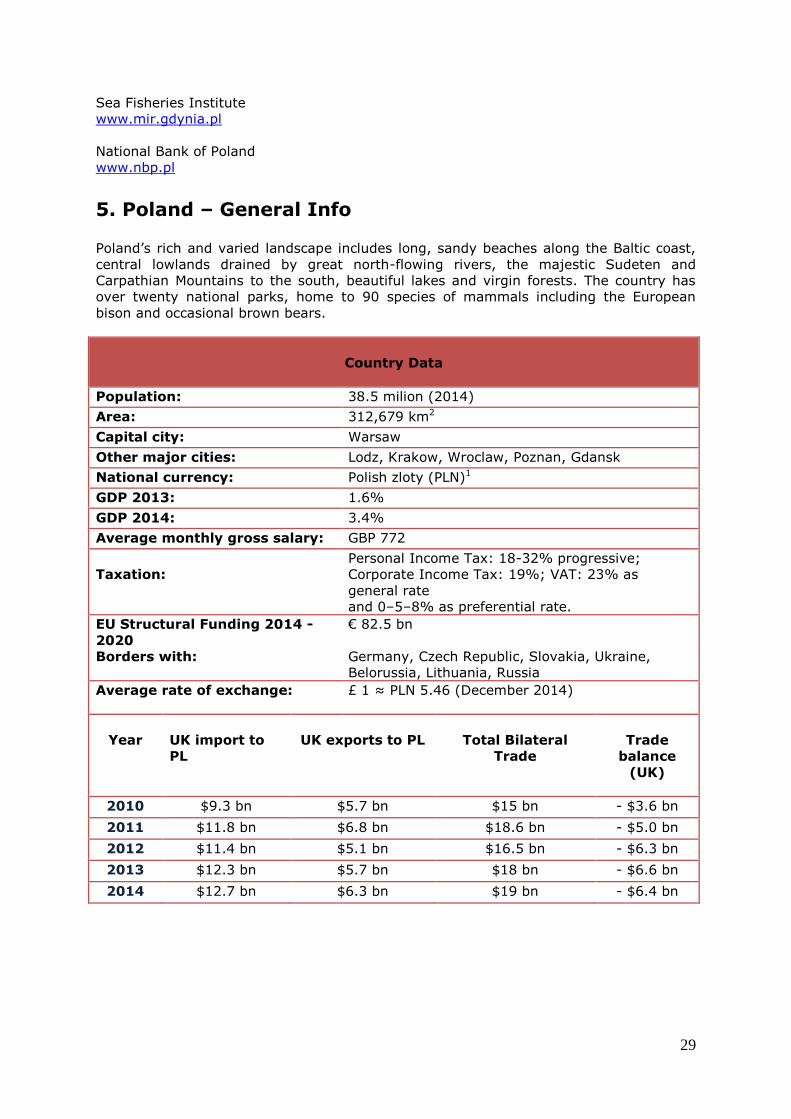
5. Poland – General Info Poland’s rich and varied landscape includes long, sandy beaches along the Baltic coast,
central lowlands drained by great north-flowing rivers, the majestic Sudeten and
Carpathian Mountains to the south, beautiful lakes and virgin forests. The country has
over twenty national parks, home to 90 species of mammals including the European
bison and occasional brown bears.
Country Data
Population: 38.5 milion (2014)
Area: 312,679 km2
Capital city: Warsaw
Other major cities: Lodz, Krakow, Wroclaw, Poznan, Gdansk
National currency: Polish zloty (PLN)1
GDP 2013: 1.6%
GDP 2014: 3.4%
Average monthly gross salary: GBP 772
Taxation:
Personal Income Tax: 18-32% progressive;
Corporate Income Tax: 19%; VAT: 23% as
general rate
and 0–5–8% as preferential rate.
EU Structural Funding 2014 -
2020
€ 82.5 bn
Borders with:
Germany, Czech Republic, Slovakia, Ukraine,
Belorussia, Lithuania, Russia
Average rate of exchange:
£ 1 ≈ PLN 5.46 (December 2014)
Year
UK import to
PL
UK exports to PL
Total Bilateral
Trade
Trade
balance
(UK)
2010 $9.3 bn $5.7 bn $15 bn - $3.6 bn
2011 $11.8 bn $6.8 bn $18.6 bn - $5.0 bn
2012 $11.4 bn $5.1 bn $16.5 bn - $6.3 bn
2013 $12.3 bn $5.7 bn $18 bn - $6.6 bn
2014 $12.7 bn $6.3 bn $19 bn - $6.4 bn

30
Why Poland?
In brief...
6th largest economy in Europe, central location making it an ideal springboard to
the Eastern markets.
38.5 million consumers, (largest consumer market in Central and Eastern Europe)
with resilient spending (up 12.6% y-o-y in November 2011).
Positive GDP growth throughout the recession with GDP growth of 3.4% in 2014.
Strong UK-Polish trade growth – total bilateral trade in 2014 up 5.5% on 2013.
Economy and market
The Polish economy grew throughout the financial crisis: the only EU member
state to see positive GDP growth.
Poland's allocation of €67 billion EU Structural and Cohesion Funds has driven
investment in Polish infrastructure, environmental and technology projects, as
well as supporting human and regional development.
Euro 2012 championships have driven huge improvements in infrastructure.
Pro-business Government and stable political environment.
Growing market for Foreign Direct Investment.
One of the best-educated societies in Europe, English is widely spoken especially
amongst the younger population.
Key opportunities
Poland’s retail & hospitality sector is booming – luxury goods; high quality
food; drink and clothing – opportunities abound.
Poland is going through an infrastructure metamorphosis – design, project
management and services are in high demand.
Poland is making fundamental changes to its energy supply strategy – optimising
current sources; renewable; nuclear and shale gas.
Poland is a regional manufacturing centre – this brings big opportunities in
supply chain.
Poland has a nascent and rapidly growing security market – national and civil
security are high on the agenda.
But the UK represents just 2.5% of Polish imports of goods – so plenty of
opportunity for the UK.
DID YOU KNOW..?
Poland’s first Constitution of 3 May 1791 was the first written constitution in Europe.
Esperanto, the international language, was created in Poland.
Polish mathematicians helped crack the Enigma code during the Second World War.
During the last three decades the Nobel Prize for literature has been awarded to two
Polish poets Czeslaw Milosz and Wislawa Szymborska.
Famous Poles include astronomer Copernicus, composer Chopin, writer Conrad and
scientist Maria Sklodowska-Curie, the discoverer of radium and the first ever woman to
receive a Nobel Prize.

31
DOING BUSINESS
Economic Climate
Poland’s membership of the EU, WTO and NATO make the country a safe and viable
market to conduct business in.
The private sector in Poland generates some 80% of GDP and is now the main driver of
economic activity.
Positive attitude towards foreign investment and trade.
The Polish market is already quite competitive and quality oriented. However, the price
level of a product is still an extremely important factor on the market.
PPL – Public Procurement Law
Public procurement law is a challenge for foreign companies when entering the Polish
market. State-owned companies and government administration are obliged to follow
Public Procurement Act rules and therefore announce tenders when purchasing goods
and services. Therefore, in the public sector most contracts result from tenders. Only for
relatively low value purchases or projects on extreme national security matters
negotiated contracts procedure is implemented.
Although the Polish Public Procurement Act is entirely in line with the relevant EU
legislation, each EU member state is allowed to introduce some minor local regulations
on e.g. specific documentation required. This makes the procurement procedure
challenging for foreign suppliers and therefore, it is advisable that UK companies bid in
consortia with local partners or through them.
According to Public Procurement Act purchasing bodies can decide on the language in
which they expect bids to be submitted and they most often decide on Polish. Therefore,
Polish partner is best placed to bid for opportunities.
Best Route
The best route into the Polish market for UK companies is to identify suitable local
business partners interested in launching their products. Having local partners simplifies
arrangements with potential customers and limits any difficulties with language, business
environment and contacts. UK firms should also bear in mind that local clearance is
required for some specific, security based projects.
The Polish market and vast majority of local companies are already well established.
Therefore, local companies are typically interested in long-term co-operation and, in
some cases, in acquiring exclusivity rights. British companies should therefore consider
entering the Polish market only as part of a long-term strategy.
Western management methods: many Polish businesspeople have studied in Western
Europe or the USA, and knowledge of Western models is widespread.
Making initial contact: this is most successfully done in writing, in Polish.
How to deal with local partners
32
Written contract: it is recommended to have written contracts with local partners.
Support from British companies: it is essential that local companies provide their
customers with after sales service and maintenance of supplied products. Therefore,
service and support from British companies is important and highly appreciated by their
local partners.
Keep in touch: it is also important that when the relationship with the local partner is
developed, British companies continue to maintain regular contact with them.
Building a successful working relationship: In meetings, formal business attire is
the norm; it is customary to shake hands with all present and exchange business cards.
A few words of Polish go a long way.
Below are some commonly-used phrases.
BASIC POLISH PHRASES
Polish Pronunciation
Hello Cześć Cheshch
Good day/morning Dzień dobry Dzyen dobri
Good evening Dobry wieczór Dobri vyechoor
Goodbye Do widzenia Do veedzenyah
Yes/no Tak/nie Tahk/nye
Please/thank you Proszę/dziękuję Prosheh/dzyenkooyeh
That’s all right W porządku Fpozhontku
Excuse me Przepraszam Psheprasham
My name is… Nazywam się… Nazivam shyeh…
Business Etiquette in Poland
Many Polish managers and directors are familiar with general West European business
etiquette and culture, negotiation techniques, etc. A lot of Polish businesspeople are
young, well educated, and fluent in English and with a very flexible business style.
However, there is also a group of "old style" senior managers who started their business
careers in the communist era. Often long serving employees of state owned companies
like those in the mining sector, they tend not to speak foreign languages and can find
the modern business environment a challenge.
In general, there is no much difference between business meetings in Poland and
elsewhere in Europe. Coffee and tea are immediately offered at the beginning of a
meeting. Protocol at meetings is usually relaxed, but this also depends on the size of an
organisation you are visiting and the seniority of the people you are meeting.
The only major difference is that the formality level in Poland is higher than in the UK.
When meeting someone for the first time in a business environment you should
introduce yourself using both first and last name. When addressing senior management
in Polish companies in writing you should use "Dear Mr Last name" or "Dear Mr
President" rather than "Dear First name". When your relationships with local contacts
develop, you can take a less formal approach in this respect.
Poles can be voluble and gesticulation is an integral part of conversation here. However,
little significance is placed on specific gestures and you do not need to worry about
inadvertently causing offence. Polish business people wear suits for business meetings.

33
Dressing well for a meeting is expected as it shows your counterparts that you value the
opportunity to meet them.
Lunch or dinner meetings are becoming increasingly common, but they are used more as
a way to cement good relations than to hammer out details. As in many other countries,
the person who proposes such a meeting will pay the bill.
No negotiating style can be said to be specifically Polish. As with other aspects of
business in Poland, much depends on the age and amount of international experience of
the person you are dealing with. The key to success in negotiation is clear
communication and language understanding. It is important to be very well prepared for
the first meeting. Technical data and prices are very often discussed right from the
outset and you should be ready to talk about the terms of any proposed collaboration
from the word go. Polish partners are usually reluctant to provide information about
turnover, competition, share of the market etc before they meet you in person but they
are more open to release information of this kind face to face. In general the exporter
would be expected to share in cost of any promotional campaign to enter into the Polish
market.
6. Next activity
You are welcome to communicate with the post in Warsaw to discuss any part of the
report.
Should you wish us to provide any further assistance in conducting research, we will be
happy to do this under a separate OMIS order.
We also encourage you to register on the UKTI portal www.ukti.gov.uk. This will allow
you to set up your user profile to ensure that you receive automatic updates about
opportunities in your sector in markets of interest to you. This service is free of charge.
The portal also has a great deal of background information on priority business sectors in
Poland and on doing business here.
Additionally, we encourage interested parties to check information about current tenders
in Poland. Such information is available on our UKTI Portal: www.ukti.gov.uk - Business
Opportunities.

34
A helping hand from the British Polish Chamber of
Commerce...
The BPCC's executive team works with you to support your business growth. Partnership
and networking is at the very heart of what we do. Whether you are a large global
corporate or a small company employing a few people – if you’re doing business
between Poland and the UK – we want to speak with you. In recent years we have been
recognised as the best British chamber in continental Europe no fewer than four times by
COBCOE, a network of over 10,000 businesses in over 30 European countries. Joining us
enables you to network and grow your business in Poland, one of Europe’s highest
growth potential economies.
With nearly 500 members, the BPCC is also in a unique position to put you in touch with
contacts you may need in Poland - recruitment, real estate, lawyers, financial services, health and safety, supply chain, consultants and so on.
For further information about the BPCC (www.bpcc.org.pl) and how we can help you to
set up on the Polish market. Please do not hesitate to contact us at: [email protected]