Embed Size (px)
Citation preview

S&D Coffee and TeaInvestor Day
June 8, 2017

1
Forward Looking Statements: This presentation contains forward-looking statements within the meaning of Section 27A of the Securities Act of 1933, Section 21E of the Securities Exchange Act of 1934 and applicable Canadian securities laws conveying management's expectations as to the future based on plans, estimates and projections at the time the Company makes the statements. Forward-looking statements involve inherent risks and uncertainties and the Company cautions you that a number of important factors could cause actual results to differ materially from those contained in any such forward-looking statement. The forward-looking statements contained in this presentation include, but are not limited to, statements related to expected future operating results of the Company, anticipated market trends, and the execution of the Company’s strategy. The forward-looking statements are based on assumptions regarding management's current plans and estimates. Management believes these assumptions to be reasonable but there is no assurance that they will prove to be accurate. Factors that could cause actual results to differ materially from those described in this presentation include, among others: (1) changes in estimates of future earnings; (2) expected synergies and cost savings are notachieved or achieved at a slower pace than expected; (3) integration problems, delays or other related costs; and (4) unanticipated changes in laws, regulations, or other industry standards affecting the companies. The foregoing list of factors is not exhaustive. Readers are cautioned not to place undue reliance on these forward-looking statements, which speak only as of the date hereof. Readers are urged to carefully review and consider the various disclosures, including but not limited to risk factors contained in the Company's Annual Report in the Form 10-K for the year ended December 31, 2016. The Company does not, except as expressly required by applicable law, undertake to update or revise any of these statements in light of new information or future events.
Non-GAAP Measures: The Company routinely supplements its reporting of GAAP measures by utilizing certain non-GAAP measures to separate the impact of certain items from its underlying business results. In this presentation, we use non-GAAP measures such as EBITDA, adjusted EBITDA, and adjusted free cash flow and certain ratios using these measures. Since the Company uses these non-GAAP measures in the management of its business, management believes this supplemental information, including on a pro forma basis, is useful to investors for their independent evaluation and understanding of the business. Any non-GAAP financial measures used by the Company are in addition to, and not meant to be considered superior to, or a substitute for, the Company's financial statements prepared in accordance with GAAP. In addition, the non-GAAP financial measures included in this presentation reflect management's judgment of particular items, and may be different from, and therefore may not be comparable to, similarly titled measures reported by other companies. A reconciliation of these non-GAAP measures may be found on www.cott.com.
Safe Harbor Statements

3
Our ModelHOW S&D COFFEE & TEA WINS WITH CUSTOMERS
4
Tenured, Experienced ManagementRon Hinson
President, Chief Executive Officer
Jack RobinsonExecutive Vice President & Chief Financial Officer
Carlos LopezExecutive Vice President-Sales & Marketing
Brian BradleyExecutive Vice President-Corporate Operations
Ron Hinson has been with theCompany for almost 39 years,having joined as a route salesrepresentative in 1979.
Mr. Hinson has been S&D’sPresident and CEO since 2000.
Jack Robinson has been with theCompany for over 15 years, having joinedas Controller in 2001.
Mr. Robinson is responsible forAccounting, Contract Management, Fleet,Beverage, Equipment, Global Sourcing,and the Sustainability functions of theorganization.
Carlos Lopez joined the Company in 2010and has led national sales, corporateplanning, and strategy efforts.
Mr. Lopez maintains oversight of all SalesDivisions and Marketing, and ProductInnovation Departments.
Brian Bradley has been with the Companyfor 29 years, beginning as a plant engineerand manufacturing supervisor.
Mr. Bradley is responsible for Operations,Manufacturing, Engineering, Maintenance,Facilities, Quality Assurance, OTR,Logistics, Warehousing & Inventory Control,and IT.
Tracy Ging previously served as VP ofSustainability & Strategic Initiatives from2012-2016.
With nearly 20 years of coffee experience,Ms. Ging leads the Marketing and ProductInnovation organizations, as well asStrategic Initiatives with the CEO.
Tracy GingSenior Vice President & Chief Commercial Officer

5
History of Sustained Growth
The S&D Story…
1970S&D relocated to a new facility in Concord, NC
(present day site), quadrupling capacity.
2000Facility expansion in
warehousing and packaging lines, establishing direct
sourcing of tea.
1979Current CEO, Ron Hinson, joins the
Company as a route sales representative
in Asheville, NC.
2007S&D adds a new
state-of-the-art tea blending facility to expand capacity.
2009S&D acquired licensing and
intellectual property rights to the Toddy Company, gaining access
to cold-brew extraction techniques and exclusive rights to
produce at commercial scale.
2016Acquired by Cott
Corporation
1927S&D Coffee, Inc. is
founded by Roy Davis, Sr. and Lawrence Switzer as a provider of
fresh roasted coffee to regional grocers.
2017 & BeyondS&D is
well positioned to capitalize on
recent investments to sustain growth.
For 90 years, S&D has proactively invested in capabilities and capacity to stay at the leading edge of the coffee and tea industry, and has made significant investments to position the Company for rapid growth.
1960’sRoy Davis, Jr. succeeds his
father as President and CEO, and refocuses the Company’s
strategy from a grocery-based business to a broader, route-based foodservice and OCS
provider. 1990’sS&D continues its rapid
growth, focusing on national chain restaurants and
convenience retailers while de-prioritizing OCS.
2012S&D finishes the renovation of its headquarters and acquires new
facility to position for further growth, adding the potential to
double capacity.
2011Roy Davis Jr. passes away
and Ron Hinson becomes
Chairman of the Board, President
& CEO.
1995Major expansion and
investment in roasting capacity to support growth with large-scale, national
chain accounts
Roy Davis, Jr. assumes Chairman of the Board, retiring previous posts, appointing Ron Hinson as President & CEO.
2010Despite national recession, S&D
continues to enjoy record-setting
growth.
6
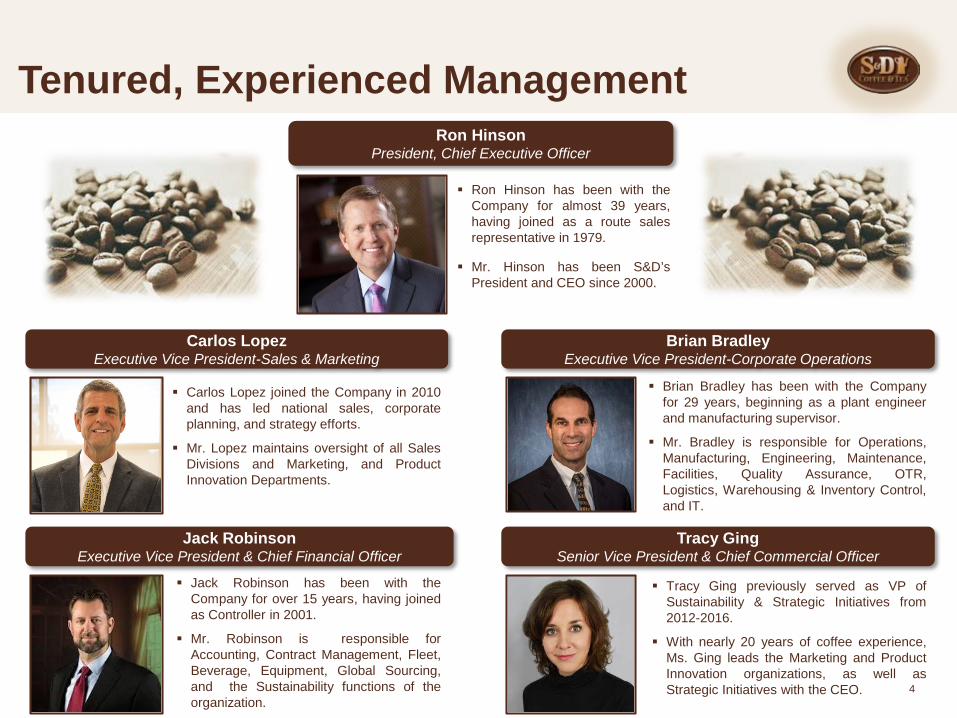
National Distribution Platform S&D’s National Footprint
Direct Route & Third-Party Distribution
S&D combines 3 distribution operations to achieve national coverage:
1. National Accounts (Commissary Sales)
− Higher Volume & Lower Gross Margin
2. Direct Store Delivery (“DSD”) (Route Sales)
− Lower Volume & Higher Gross Margin
3. Fulfillment
− Convenient and cost effective for low
volume
Sales Breakdown by Distribution
(in Millions $)S&D Warehouse Locations
Top S&D Customers’ Distribution Centers Sysco OpCo Embedded AEs
For Calendar Year 2016Net Sales
Commissary $446Route $110Fulfillment $2Total $558

7
Strong Partnerships with Blue-Chip Customers
S&D maintains longstanding relationships with blue-chip customers across a variety of end-markets, including restaurants, hospitality, and convenience stores (“C-Stores”).
The Company sells its products to more than 24,000blue-chip customers nationwide.
Largest supplier to key national foodservice andconvenience store chains.
S&D’s top customers have purchased from theCompany for more than 11 years on average.

8
Dominant in QSR & C-Store Channels
QSR and Fast Casual, 49%
C-Store, 24%
Distributor, 10%
Casual Dining, 6%
Non-Commercial, 8%
Food & Bev. Manufacturers,
3%
S&D has significant opportunity to expand in existing & new channels.
Sales by Customer Groups-2016

9
Strategic Process to Drive GrowthS&D is well positioned to strategically pursue key growth opportunities that leverage the Company’s
industry-leading reputation and capabilities and have the potential to drive significant long-term growth.
Further Penetration of CurrentEnd-Markets
Growing segments of food and beverage manufacturing
and distribution
Pursue Strategic Acquisitions
Potential to expand the Company’s product set and
market reach.
Expansion of Product Offerings
Increased demand for specialty drinks and coffee
extracts
Capitalize on Current Pipeline
Robust pipeline of potential new business
1
Expand Strategic Partnerships
S&D aligned with the largest quick-service restaurants (“QSR”),C-Stores, and foodservice distribution customers
in the US
5
4
2
3

10
Continued Growth in Core Coffee & Tea
2016 Sales Mix Historical Mix by Product Category
Diversified mix of coffee and tea products, Including specialty (higher quality)and sustainable products that appeal to current consumer interest
Coffee and tea are also driving new beverage innovation, including Toddy®Cold Brew Coffee and Specialty Hot Teas (Pyramid Bags)
Coffee & Tea remain growth categories and the basis for new beverage innovation.
Coffee, 69%
Tea , 11%
Liquid, 5% All
Other, 14%
72% 69% 71% 69% 71%
12%13% 12% 11% 11%
2% 3% 3% 5% 5%
14% 15% 14% 14% 13%
0%
10%
20%
30%
40%
50%
60%
70%
80%
90%
100%
2013 (A) 2014 (A) 2015 (A) 2016 (A) 2017 (P)
Coffee Tea Liquid All Other

11
Diverse Portfolio of Products
Coffee Tea
Equipment InnovationsExtracts

12
Track Record of Successful New Product Launches
Fast entrant into new packaging/ product types
Hundreds of new products launched since 2012
Continuous investment in product pipeline

13
High awareness among coffee drinkers Attractive to younger consumers Expands coffee day parts Premium product = Premium margin S&D proprietary cold brew technology
Cold Brew Coffee Emerging
14
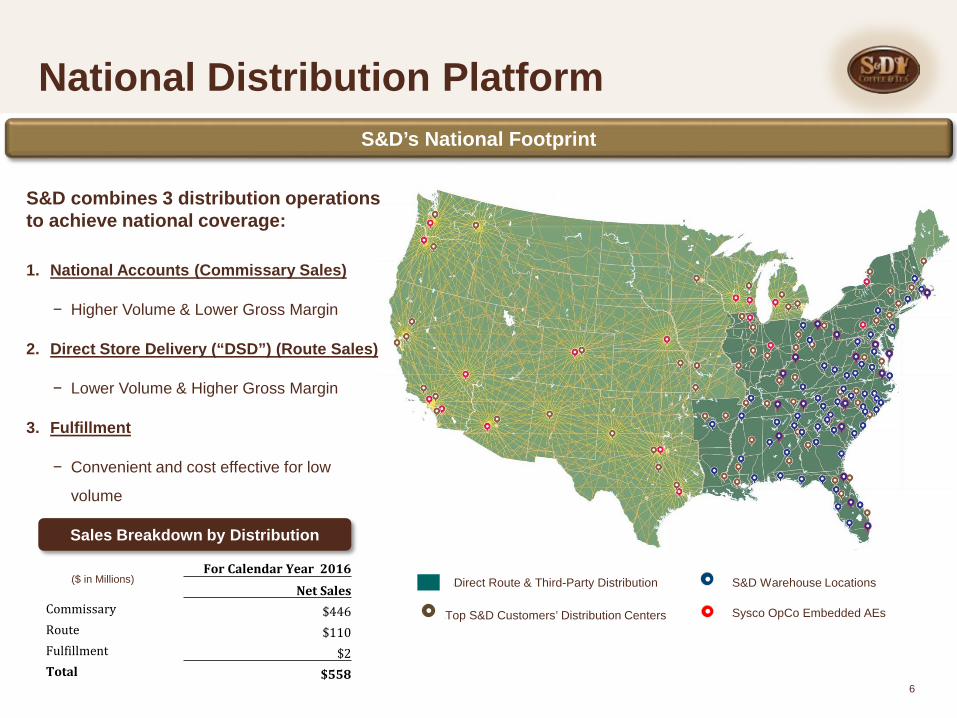
Growth in Specialty Teas
The U.S. tea market is projected to experience a 4% CAGR over the next 5 years*.
Redesigned flavored tea program with four new flavors
Launched pyramid tea in 2017 with national QSR customer; in discussions with national C-Store customer
Introduced clear tea urn dispenser to showcase premium tea
.Source: Mintel Group, Ltd*

15
S&D has experienced strong and consistent growth since 1927, and achieved over $550 million ofrevenue and $40 million of adjusted EBITDA in 2016.
From 2013 to 2016, the Company expanded net revenue from $500 million to over $550 million,representing a CAGR of 4%, and expects to continue its strong growth of 3+% annually.
S&D has grown its roast and ground coffee volume from 106 million in 2013 to 117 million in 2016, andis installing an additional roaster in 2017 with the capacity to add 20 million pounds annually.
Financial Summary
Sustained Growth in Core Products
S&D continues with strong & consistent growth.
50
70
90
110
130
150
170
190
2013 2014 2015 2016 2017 P
Cof
fee
Poun
ds in
Mill
ions

16
Route & National Foodservice 5 Year Growth Revenue Trend
28% 28% 26% 26% 23%
72%72%
74% 74%
77%
$0
$100
$200
$300
$400
$500
$600
$700
2013 (A) 2014 (A) 2015 (A) 2016 (A) 2017 (P)
Route Distributor
Route based business is consistent and stable while growth is focused on distributed customers.
Coffee volume growth was greater than 3.5% annually from 2013 to 2016. Revenue volatility reflectsmovement in the coffee market as the commodity cost varies over time.
By managing the price to cost formula, gross profit is consistent over a range of the coffee market.(in Millions $)

17
Financial Update Dramatic Growth in Innovative Products
Liquid Gallons
200
300
400
500
600
700
800
900
1,000
1,100
1,200
2013 2014 2015 2016 2017 P
Tho
usan
ds
Liquid concentrates and liquid coffees and teas, including cold brew concentrates, aretaking off, generating 5% of sales in 2016.

18
Facilities & Capacities S&D’s corporate campus is comprised of
four facilities with
two dedicated coffee facilities & a tea facility
one extract & ingredient facility
And nearly 750,000 sf of operations & admin. facilities.
.All run by 750 non-union, well-tenured labor force
Coffee Roasting
Tea Blending
Liquid Extract
135-145 million lbs.
40-45 million lbs.
Current Capacity
1.8-2 million gallons(16-19 million lbs.)
Summary of S&D Facilities
Main Facility Commercial Pk. West Winds Ramdin Court
255,850 SF 160,000 SF 85,000 SF65,000 SF 175,000 SF

19
Investments in GrowthIn 2017, the Company is investing capital to increase productive capacity in core coffee.
Projected Capital Expenditures ($15-20 million annually in 2017-2020)
Installation of a new roaster in the existing main plant, with a potential additional roaster in 2018 at the WestWinds facility, together increasing roasting capacity by 40 million annual pounds.
Investments in liquid production are also planned to expand our cold brew production capacity.
* 2017 Growth Expenditures increased due to installation of new roaster and liquid productive capacity.
*69%
82% 48%
31%
18%
52%
2015 (A) 2016 (A) 2017 (P)
Growth Capital Expenditures
Maintenance Capital Expenditures
Coffee Roasting and Processing-Packaging Production-Liquid Plant Production-Facilities Improvements-
IT and Infrastructure-
Manufacturing Equipment-Facilities Infrastructure-Customer Beverage Equipment-
*
(as a percent of annual total)
20
S&D has the right model to continue to grow
The future is extremely exciting
Closing Remarks