Embed Size (px)
Citation preview

Scyld Insight v1.6.1 - User Guide
June 17, 2014
www.penguincomputing.com 45800 Northport Loop West Fremont, CA 94538 Scyld Insight v1.6.1 User Guide

Published June 17, 2014
Copyright © 1998 2014 Penguin Computing, Inc.
All rights reserved. No part of this publication may be reproduced, stored in a retrieval system, or transmitted in any form or by any means (electronic, mechanical, photocopying, recording or otherwise) without the prior written permission of Penguin Computing, Inc.
The software described in this document is "commercial computer software" provided with restricted rights (except as to included open/free source). Use beyond license provisions is a violation of worldwide intellectual property laws, treaties, and conventions.
Scyld ClusterWare, the Highly Scyld logo, and the Penguin Computing logo are trademarks of Penguin Computing, Inc.. Intel is a registered trademark of Intel Corporation or its subsidiaries in the United States and other countries. Infiniband is a trademark of the InfiniBand Trade Association. Linux is a registered trademark of Linus Torvalds. Red Hat and all Red Hatbased trademarks are trademarks or registered trademarks of Red Hat, Inc. in the United States and other countries. All other trademarks and copyrights referred to are the property of their respective owners.

Table of Contents 1 Overview 2 Installation
2.1 Prerequisites 3 RPM Installation (for ClusterWare installs ONLY) 4 Install TAR.GZ Distribution
4.1 Prerequisites for TAR.GZ Package 4.2 Installation for TAR.GZ Package
5 Setup and Start beoweb.ini 6 Setup and Start insight.ini 7 Getting Started
7.1 Prerequisites 7.2 Configure Scyld Insight to Talk to My Clusters 7.3 Navigate Scyld Insight 7.4 Modify a Cluster's Configuration 7.5 Scyld Insight Event Log 7.6 Technical Support 7.7 Customer Feedback
8 Manage My Account 8.1 Creating a New Account 8.2 Resetting Lost Passwords
9 Configure Scyld Insight 9.1 Connecting to Beoweb 9.2 Connecting to Ganglia
10 Cluster Overview 10.1 Cluster Overview Page Components 10.2 Cluster Overview Reports
11 Cluster Configuration 11.1 Saving and Applying Changes 11.2 Cluster Configuration 11.3 Cluster Network 11.4 Services 11.5 Libraries and Prestage Files 11.6 Restarting Beowulf
12 Cluster Node Classes 12.1 Classes
13 Master Node 13.1 Master Node Overview Page Components 13.2 Master Node Overview Reports
14 Compute Node Grid 14.1 Node Cells 14.2 Compute Node Metrics 14.3 Select Compute Nodes for Actions 14.4 Perform Actions

14.5 Saving Nodesets 14.6 Grid Layout Types
15 Compute Node Core View 15.1 Interpret the "Show Nodes" Box Plots 15.2 Enable the "Show CPUs" Bar Plots 15.3 Show Jobs on a Compute Node 15.4 Search for a Particular Node or Job 15.5 Refresh and Replay Graphs
16 Compute Node Setup 16.1 Configured, Unknown, and Ignored Addresses 16.2 Changing Node IDs 16.3 Changing Node Classes
16.3.1 Selecting a new Class, Boot Sequence, and Boot Stage 17 Compute Node Detail
17.1 Compute Node Detail Page Components 17.2 Compute Node Detail Reports
18 Workload 18.1 Summarize the Workload 18.2 Filter for Jobs 18.3 View Jobs 18.4 Create New Job 18.5 Hold / Release Jobs 18.6 Delete Jobs
19 File List 19.1 Open and Download Files 19.2 Search Files 19.3 Attach and Unattach Highlight Groups to Files
20 File Subscriptions 20.1 Subscribing to Additional Files 20.2 Summarizing Subscribed Files
21 File Display 21.1 AutoRefresh a File 21.2 Highlight a Word or Phrase 21.3 Find a Word or Pattern 21.4 Filter for Lines Containing a Word or Pattern 21.5 Hide Lines Containing a Word or Pattern 21.6 Saving and Applying Previous Highlight Groups

1 Overview
Scyld Insight is a webbased cluster management GUI. With Scyld Insight cluster administrators can:
monitor system metrics that provide insight into a cluster’s health, activity and utilization in real time
quickly analyze any set of log files taking advantage of Insight’s unique ‘file viewer’ feature
configure Scyld ClusterWare, without needing a high level of HPC cluster expertise
Scyld Insight accesses its information by making web service calls to Beoweb, a middleware component that lives on the master nodes of the clusters being monitored. If you are trying to monitor a generic set of linux servers, you must designate one server to be the master node.
This document covers the installation of Scyld Insight and Beoweb for users who wish to monitor Scyld ClusterWare systems, generic Linux cluster systems, and generic Linux enterprise systems.

2 Installation
Scyld Insight is distributed in two flavors:
RPM Distribution (for Scyld Clusterware systems ONLY)
TAR.GZ Distribution (for generic Linux installations)
Scyld Insight is a frontend GUI that requires Beoweb server to be running on the master node of your system.
If you are integrating Beoweb with a Scyld ClusterWare system, it is recommended you use Scyld RPMs for installation (see "Install RPM Distribution" below).
If you are integrating with a generic Linux cluster, you should use the TAR.GZ distribution (see "Install TAR.GZ Distribution" below). This type of installation can support clusters with resource managers or generic linux enterprise servers.
2.1 Prerequisites
Clusters: If you are running a Scyld ClusterWare cluster or a generic Linux cluster, you must have one of the following resource managers:
PBS Torque 2.32.5, 4.0+
Sun Grid Engine 6.2+
Other versions of these may work, but have not been tested. We will add support for additional resource managers in the future.
Operating Systems: All systems must be running x86_64 bit versions of Linux. Beoweb has been tested on master node's featuring:
CentOS 5.x, 6.x
Fedora 15
Ubuntu 10.10, 12.04.1 LTS
Web Browsers:
Mozilla Firefox 3.5+, Firefox 19
Google Chrome 9.0+, 18.0
Safari 4.0+
Opera 10.6+
Python 2.6 or 2.7
SELinux: SELinux must be disabled or set to permissive. IPMI: If you are installing Beoweb, you must have ipmitool configured and installed to support local and remote IPMI commands. NVidia GPU Monitoring: Each node that you wish to monitor NVidia GPU metrics must have recent libnvidiaml.so (version 285+) installed. PAM Authentication: Beoweb currently does not have support for LDAP. There is a workaround for these systems that involves maintaining a false /etc/shadow file. For more information, please contact Penguin Support. MySQL Server: Beoweb and ScyldInsight both require the ability to create, read, and write to the MySQL database defined by beaker.session.url, beowebdb.url, and sqlalchemy.url in beoweb.ini and insight.ini, respectively. Please ensure that MySQLserver 5.0+ is accessible from the Beoweb and ScyldInsight host.
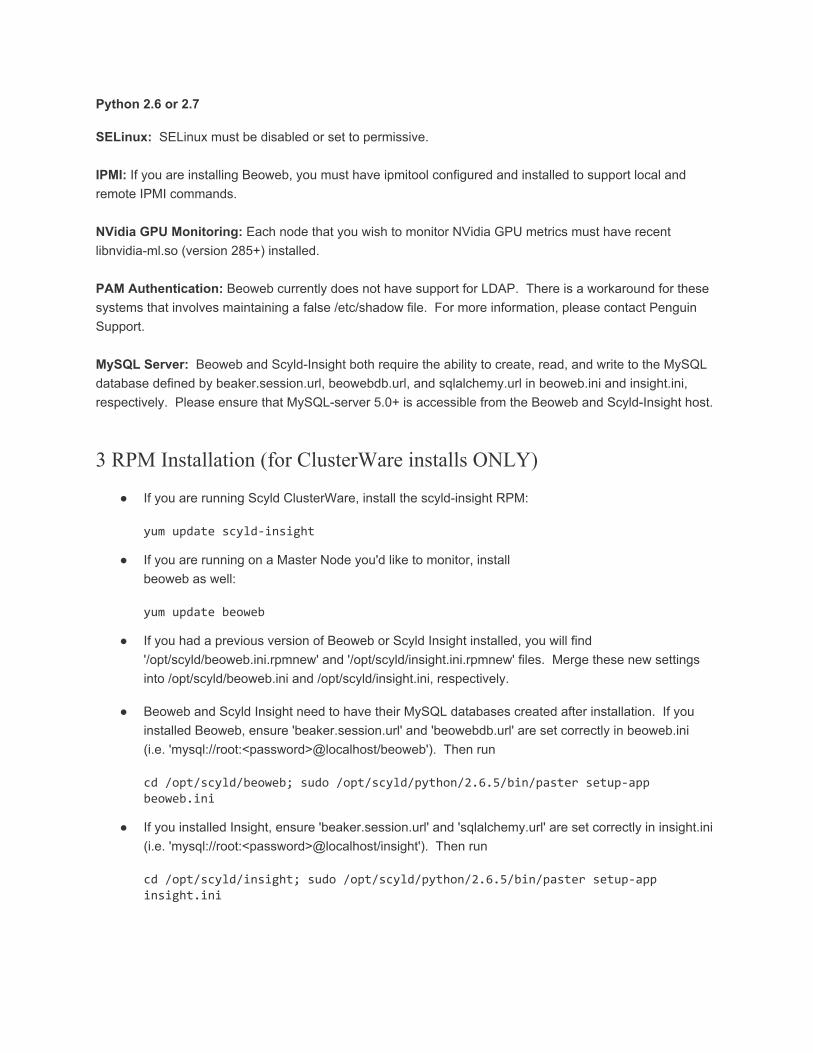
3 RPM Installation (for ClusterWare installs ONLY)
If you are running Scyld ClusterWare, install the scyldinsight RPM:
yum update scyld-insight
If you are running on a Master Node you'd like to monitor, install beoweb as well:
yum update beoweb
If you had a previous version of Beoweb or Scyld Insight installed, you will find '/opt/scyld/beoweb.ini.rpmnew' and '/opt/scyld/insight.ini.rpmnew' files. Merge these new settings into /opt/scyld/beoweb.ini and /opt/scyld/insight.ini, respectively.
Beoweb and Scyld Insight need to have their MySQL databases created after installation. If you installed Beoweb, ensure 'beaker.session.url' and 'beowebdb.url' are set correctly in beoweb.ini (i.e. 'mysql://root:<password>@localhost/beoweb'). Then run
cd /opt/scyld/beoweb; sudo /opt/scyld/python/2.6.5/bin/paster setup-app beoweb.ini
If you installed Insight, ensure 'beaker.session.url' and 'sqlalchemy.url' are set correctly in insight.ini (i.e. 'mysql://root:<password>@localhost/insight'). Then run
cd /opt/scyld/insight; sudo /opt/scyld/python/2.6.5/bin/paster setup-app insight.ini

If you installed Beoweb, jump to "Setup and Start beoweb.ini". If you ONLY installed Scyld Insight, jump to "Setup and Start insight.ini"
4 Install TAR.GZ Distribution
The TAR.GZ installer consists of a single tar file. Included are all the files necessary to install Insight and/or Beoweb.
Beoweb must be installed on your cluster's master node as root and you will need a license file from Penguin Computing to use it. Insight may be installed on any machine as any user.
4.1 Prerequisites for TAR.GZ Package
In addition to having Python 2.6 or Python 2.7, the following packages must be installed on your Linux system before installing the Scyld Insight TAR.GZ distribution:
Debian/Ubuntu: `sudo aptget install pythondev openssl libssldev gcc g++ libpango1.0dev libxml2dev perlmodules libcairo2dev apache2 php5 libapache2modphp5 mysql mysqlserver libmysqlclientdev rrdtool make`
RedHat/CentOS/Fedora: `sudo yum install pythondevel openssl openssldevel gcc gccc++ pangodevel libxml2devel perlExtUtilsMakeMaker cairodevel httpd php phpgd phpmysql mysql mysqlserver mysqldevel rrdtool rsync make`
4.2 Installation for TAR.GZ Package
Unzip and untar the distribution:
tar xzf Insight-1.6.1.linux_x86-64.tar.gz
Start MySQL server as root:
sudo /etc/init.d/mysqld restart
Change to the 'scyld' directory:
cd scyld
Run the scyld_insight_setup.py script and accept the EULA.
---------------------------------------------------------------- If you are installing Beoweb, you must perform this as root. Insight users can install as a normal user. ---------------------------------------------------------------- sudo ./scyld_insight_setup.py
If you installed Beoweb, jump to "Setup and Start beoweb.ini". If you ONLY installed Scyld Insight, jump to "Setup and Start insight.ini"

5 Setup and Start beoweb.ini
In beoweb.ini:
Beoweb must be configured to run on an externally accessible IP address and port. If you wish to change the default host or port used by Beoweb:
host = 0.0.0.0 port = 5000
To have access to the full feature set of Beoweb, usernames must be listed as 'superusers'. We recommend this over using the 'root' login with Beoweb:
superusers = user1, user2, user3, …
Set 'beoarchive = True'
If you are not using Torque or SGE change the following:
From:
#sched.torque.enable = True #sched.sge.enable = True
To:
sched.torque.enable = False sched.sge.enable = False
Beoweb assumes that the BMCs of each node uses the same username and password to perform ipmitool commands. To set the user name and password, change the ipmi.user and ipmi.password.
By default, the RPM installer sets the metric_collector variable to "clusterware". The TAR.GZ installer sets the metric_collector variable to "scyld_ganglia". In the later case, you will need to populate the beoweb/data/nodes file with the hostnames of monitored nodes and (optionally) the IP addresses of the BMC. This file does NOT include the node hosting beoweb. For example, the following will set up two nodes, one with an IPMI interface, and the other without.
n0 ipmi=192.168.1.1
n1
Only if you are using the ScyldGanglia backend:
You must deploy scyld_gmond.tgz to your nonmaster nodes by unzipping it as root into the / directory. This daemon is used to collect and transmit usage metrics to the master node.

The scyld_gmond daemon can then be set to autostart using chkconfig if you are using RHEL/CentOS or updaterc.d in Debian/Ubuntu.
You can start scyld_gmond using:
sudo /etc/init.d/scyld_gmond restart
On the master node, you must also start the scyld_gmetad daemon, which aggregates the collected data:
sudo /etc/init.d/scyld_gmetad restart
Start the ScyldLMX license server and point it at the license file issued to you by Penguin Computing:
sudo /etc/init.d/scyld-lmx restart
Start the Beoweb web server.
sudo /etc/init.d/beoweb restart
Proceed to Setup and Start insight.ini

6 Setup and Start insight.ini
Insight must be configured to run on an externally accessible IP address and port. If you wish to change the default host or port used by Insight:
host = 0.0.0.0 port = 5001
Start the Syld Insight web server.
sudo /etc/init.d/insight restart
Starting subprocess with file monitor Starting server in PID 30111. serving on <hostname>:<port> view at https://<hostname>:<port>
If the web server has started then you can visit your Scyld Insight login page at:
https://<HOSTNAME>:<PORT>/
NOTE: You may get a warning in your web browser about the web server's Certificate being untrusted. You may ignore this warning or place your own trusted SSL certificates in scyld/python/insight/data/insight.pem and scyld/python/beoweb/data/beoweb.pem.

7 Getting Started
Scyld Insight is an HTML5 web GUI that provides tools for the administration and monitoring of your cluster, master node, compute nodes, log files, and job scheduler. It features intuitive interfaces that make system tools more accessible and new visualizations that make it easy to watch your cluster in action.
This document goes over some prerequisites for running Scyld Insight and helps with postinstallation setup.
7.1 Prerequisites
Scyld Insight is supported on modern browsers that support the HTML5 standard and has been tested on the following browsers:
Firefox 3.5+
Google Chrome 9.0+
Safari 4.0+
Opera 10.6+
Scyld Insight requires that Javascript be enabled to support the dynamic HTML functionality. It uses cookies to provide user sessions.
7.2 Configure Scyld Insight to Talk to My Clusters
Scyld Insight must connect to beoweb web services (version 2.0.0+) on your cluster's master node. These can typically be started by SSHing into your master node and running this command as root:
[root@iserver]# /etc/init.d/beoweb restart
Starting server in PID 23338.
serving on https://127.0.0.1:5000
For more information about running beoweb on the cluster, see the Scyld ClusterWare Administration Guide.
Scyld Insight is multiuser and multicluster. Once you have created an account and are logged in, the next step is to connect your cluster to Scyld Insight. Your first login should have walked you through that step.
7.3 Navigate Scyld Insight
If you need to edit or add clusters to manage, you can click on the "My Clusters" link in the upper right corner (#1 in the screenshot) and then "Add Cluster" or "Edit Settings". The clusters that you have configured are not exposed to other users; these are specific to your Scyld Insight account. For more information on adding a cluster step, see: Configure Scyld Insight
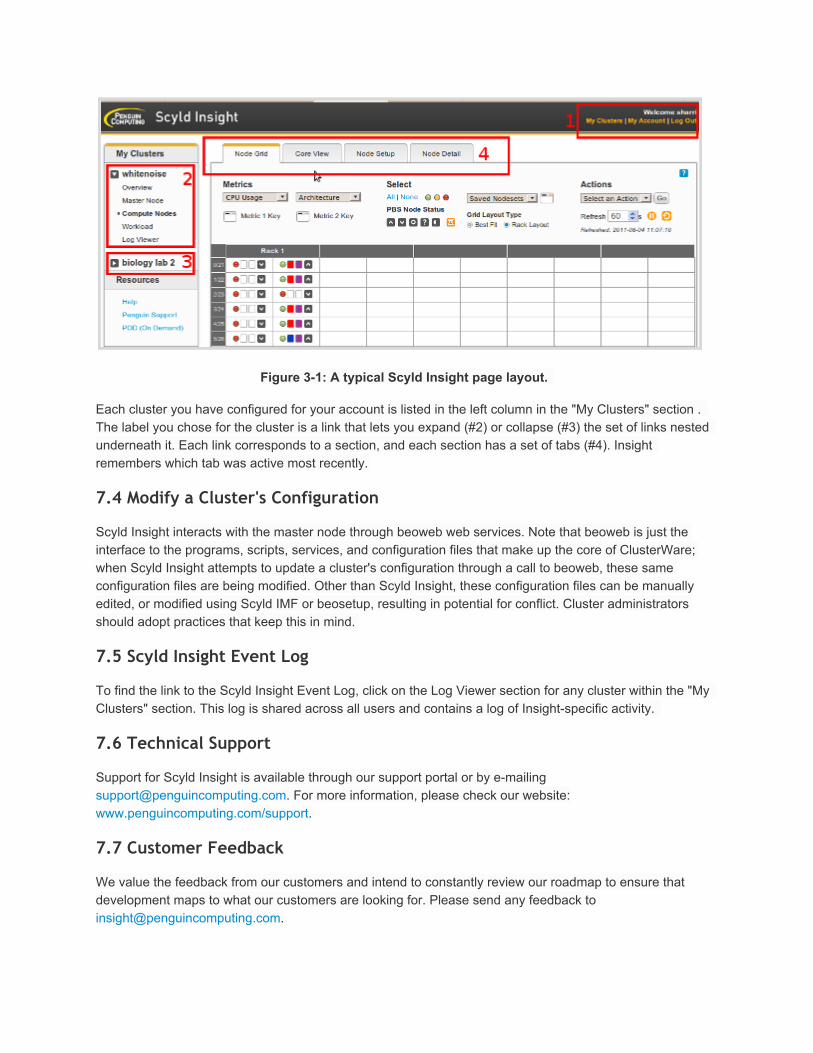
Figure 31: A typical Scyld Insight page layout.
Each cluster you have configured for your account is listed in the left column in the "My Clusters" section . The label you chose for the cluster is a link that lets you expand (#2) or collapse (#3) the set of links nested underneath it. Each link corresponds to a section, and each section has a set of tabs (#4). Insight remembers which tab was active most recently.
7.4 Modify a Cluster's Configuration
Scyld Insight interacts with the master node through beoweb web services. Note that beoweb is just the interface to the programs, scripts, services, and configuration files that make up the core of ClusterWare; when Scyld Insight attempts to update a cluster's configuration through a call to beoweb, these same configuration files are being modified. Other than Scyld Insight, these configuration files can be manually edited, or modified using Scyld IMF or beosetup, resulting in potential for conflict. Cluster administrators should adopt practices that keep this in mind.
7.5 Scyld Insight Event Log
To find the link to the Scyld Insight Event Log, click on the Log Viewer section for any cluster within the "My Clusters" section. This log is shared across all users and contains a log of Insightspecific activity.
7.6 Technical Support
Support for Scyld Insight is available through our support portal or by emailing [email protected]. For more information, please check our website: www.penguincomputing.com/support.
7.7 Customer Feedback
We value the feedback from our customers and intend to constantly review our roadmap to ensure that development maps to what our customers are looking for. Please send any feedback to [email protected].

8 Manage My Account
Scyld Insight periodically saves settings and changes you make to the interface so that each user can customize it to their preference. This section explains how to manage user accounts.
8.1 Creating a New Account
To create a new account, click on the "Create an account" link from the login screen. Trying to access any Insight URL will redirect you to the login screen if you are not logged in.
Figure 11: The Scyld Insight login screen.
To create your account, enter a username and password. Both the username and email address must be unique to this instance of Scyld Insight; an error message will be displayed if either already exists.

Figure 12: The create account screen.
Entering an email address will enable you to reset a lost password provided the host where Insight lives is capable of sending outbound mail. Once you choose a username, it cannot be changed but passwords and email addresses can be updated.
8.2 Resetting Lost Passwords
There are two methods for resetting lost passwords:
Method One: Selfservice email link
This method is only available if you have entered an email address for your account and the host where Insight runs will send outbound email. Follow the "I lost my password" link from the login screen, and you will be presented with a screen to enter your username or email address. The system will then send you a onetime link in an email which you can use to reset your account password.
Method Two: Commandline tool
Using this method, the server superuser runs a script which sets a new password for any Insight user. Once logged in to the Insight host, become the superuser/root user. Change your working directory to the Insight installation root (default: /opt/scyld/insight). insight_passwd.py is a script you'll want to run to set a user's password. Here is a usage example:

[root@iserver]# cd /opt/scyld/insight
[root@iserver]# ./insight_passwd.py --force jsmith
[User(id: '2', username: 'jsmith')]
Changing Insight password for user jsmith
Enter new Insight password: xxxxxxxxxx
Retype new Insight password: xxxxxxxxxx
Password successfully changed.

9 Configure Scyld Insight
Scyld Insight must connect to beoweb web services (version 2.0.0+) and ganglia on your cluster's master node. Beoweb can typically be started by SSHing into your master node and running this command as root:
[root@iserver]# /etc/init.d/beoweb restart
Starting server in PID 23338.
serving on https://127.0.0.1:5000
For more information about running beoweb or ganglia on the cluster, see the Scyld ClusterWare Administration Guide.
We now walk through the steps for adding or editing a cluster connection.
9.1 Connecting to Beoweb
The form shown below appears when you try to add or edit a cluster to your Scyld Insight account. We describe each field below.
Figure 11: Connecting Scyld Insight to a beoweb cluster running on your master node.

Cluster Display Name This field is the label or identifier for this cluster in the navigation. It must be unique.
Master Node Hostname Enter the hostname or IP address of the cluster's master node where the beoweb web services are running.
Beoweb Port Enter the beoweb server port number. The default is 5000.
Beoweb URI This field contains the URI or the web address prefix of the beoweb installation. By default, there is no path prefix and the field should be left blank. If a URI is necessary, it must begin with a slash.
Beoweb SSL Check this box if beoweb is using an SSL connection (i.e. https rather than http).
Beoweb Username and Password Enter login information for beoweb. Generally this will be your system account information on the cluster. Beoweb provides an additional mechanism for authentication and authorization using its own password file. See the "Beoweb Guide" for more details. By checking the checkbox to "Stay logged in for 2 weeks", your beoweb credentials will continually be verified by the Insight server, even if you close your browser.
Note that the current version of Insight has limited functionality for users who are not root or beoweb superusers.
Clicking the "Continue" button attempts to verify the cluster connection settings by connecting to and authenticating against beoweb and displays any errors encountered.
Problems at this stage are most likely related to connectivity to the cluster from the Insight host, the beoweb server not running or user authentication error. Verify each of these conditions, and if further assistance is needed, contact support by emailing [email protected] or by visiting the support section on our website at www.penguincomputng.com/support.
9.2 Connecting to Ganglia
In order to access the usage graphs that ganglia creates, you need to supply the value that ganglia uses to identify a cluster or grid.
Ganglia Data Source Name This is the "data_source" value from ganglia's configuration file. The pulldown list has been populated with any such values that beoweb found in the configuration file; alternatively, select "Manual Entry" to enter a value manually.
Ganglia Port Number and URI If ganglia has been configured and setup for typical Scyld ClusterWare installations, these values will be populated. Clicking on the "Verify" button will attempt to connect to ganglia and retrieve a graph. Any errors encountered will be displayed.

10 Cluster Overview
By clicking on the "Overview" link for a particular cluster link in the "My Clusters" navigation menu, you'll navigate to the Cluster Overview section. This section has 3 tabbed views, the first of which is an overview of the cluster's state and health.
10.1 Cluster Overview Page Components
Figure 11: Layout of the Cluster Overview page
1. This section shows the cluster's hostname/IP, the total number of compute nodes. Also shown are the total installed CPUs and memory for reporting compute nodes. The "System Log" links bring up a File Viewer window displaying the system log (/var/log/messages). The first link "tail 5000" will launch the File Viewer in a popup window with the last 5000 lines written to the file, while the "View all" link will display the file in its entirety.
2. This section displays the compute node status summary. Throughout the application, the green, gray, amber, and red "LED" icons represent up, boot, unavailable, and down states respectively. These three states are a subset of the all of the possible statuses reported by "beostat". The unavailable state represents Scyld ClusterWare nodes that are in an error state or unavailable.
The status of the compute nodes as reported by the PBS server is also reported. PBS nodes can be in multiple states and the display on the Cluster Overview page summarizes these into either up (running jobs or available to run jobs) or down. A more finegrained PBS node status is reported in the Node Grid and on the Node Detail pages.
3. This section contains controls for the the page's main panel (#4 in the screenshot). When you make a selection from the "Add Block" menu, a block containing a graph or report will be added to the panel, at the top of either the left or right column, depending on which column has fewer blocks.

Clicking on the "Clear" link will clear all blocks from the panel, and clicking "Load Defaults" will first clear the panel and then populate the panel with a set of default blocks.
4. The main panel on the page is a customizable container for reports and graphs contained in units called blocks. Individual blocks are added to the panel by using the "Add Block" pulldown menu. Block order can be changed by dragging and dropping individual blocks. To drag a block to a different position, use your mouse to grab the block header (#5 in the screenshot) and move the block to its new position.
The icons on the block header (#5 in the figure above), in order from left to right, are as follows:
Refresh. Clicking this icon will refresh the block contents.
Zoom (present only on graphs). Clicking this icon will fetch a page overlay with an enlarged version of the graph.
Close. Clicking this icon will remove that block from the panel.
The layout of the blocks on the panel becomes part of your saved profile. Next time you return to this page, during this session or in a future session, your last layout is reloaded.
10.2 Cluster Overview Reports
These reports show a historical view of your cluster's resource utilization. All graphs are available across four time resolutions: hour, day, week, and month. Below is a description of each available graph type.
Scheduled Cores Shows the percentage of CPUs that have been scheduled by your job scheduler out of all the CPUs that are not in a 'down' or 'offline' state (i.e., PBS Torque/SGE).
Scheduled Jobs Shows the number of jobs running and queued as reported by your job scheduler (i.e., PBS Torque/SGE).
Load Average Based only on nodes currently reporting to ganglia. Shows the 1minute load, the number nodes, the number of CPUs, and the number of running processes.
CPU Usage Shows the percentage of CPU time spent in different CPU states (i.e., User, Nice, System, Idle).
Memory Usage Shows the amount of memory that is used, shared, buffered, and swapped in bytes. Also shows the total amount of memory. This will not match the total installed memory in #1 of the figure above since that only shows the memory for the compute nodes.
Network Usage Shows the network usage in bytes per second across all network interfaces.

11 Cluster Configuration The Cluster Configuration tab within the "Overview" section allows you to view and modify some basic cluster network settings, manage running services, and customize libraries and prestage files for compute nodes.
11.1 Saving and Applying Changes
Any changes on this form can only be applied after restarting beowulf. Note that restarting beowulf will cause compute nodes to reboot and any running jobs to be aborted.
When you click on any of the 'Save ...' or 'Update ...' buttons on this page, Scyld Insight will ask whether you would like to "Cancel", "Save", or "Save and Restart". Clicking "Save" will write your changes to disk, but not apply them to your system. To apply your changes you must either click on "Save and Restart" or "Save" and then manually restart the service using the "Restart Beowulf" button at the bottom.
11.2 Cluster Configuration
Displays the path of the primary configuration file on the master node and the list of network interfaces for the master node.
11.3 Cluster Network
Master Node Network This network interface is the internal or cluster network interface. Here you can configure the number of nodes and IP range of the compute nodes. Editing the node count automatically adjusts the IP range, by adjusting the end of the range address. Alternatively, changing the start of the range IP address will adjust the node count.
Note that your changes are not saved until you click the "Save Number of Nodes & IP range" button.
Node Assignment Policy The node assignment policy dictates how new nodes are added to the cluster. Descriptions for each of the options are provided. For more information, please refer to the Scyld ClusterWare Administrator's Guide.
11.4 Services
This section enables you to control which of various system services are automatically started when the compute node boots. The "Status" reports the current state of the service, use the "Action" links to change the current status.
In order to activate either enabling or disabling any of these services, the compute nodes may need to reboot and/or the beowulf service on the master node may require a restart. Once you click on an "Action" link for a particular service, a confirmation dialog will provide specific information giving you a chance to "Save", "Cancel", and "Save and Restart...". Clicking "Save" alone will not activate your changes immediately; instead you must manually restart the service using the "Restart Beowulf" button.
11.5 Libraries and Prestage Files
This section is where you can view and edit the list of shared library directories to cache on the compute nodes and the list of files to prestage on the compute nodes.
To add a shared library to the list of libraries cached on the compute nodes, specify the pathname of the individual file or the pathname of the entire directory in which the file resides in the first edit box. Files will be pulled from the master node to the compute node and saved in the local RAM filesystem on an asneeded basis (when an open() syscall is executed).
Files listed in the second edit box are specific files to be pulled onto each compute node at node boot time, with directories created as needed.
11.6 Restarting Beowulf
This button restarts the beowulf system service. Note that this will restart all compute nodes and kill any jobs that may be running on them.

12 Cluster Node Classes Scyld ClusterWare lets you provision compute nodes using different kernel images and commandline arguments using node classes. This gives you the ability to include nonScyld nodes into your Scyld cluster.
This tab in the Overview section is for managing node class definitions, the default scyld class as well as nonScyld node classes. A node class is defined by an image file, a kernel image path, and kernel command line options. Specifying which nodes should be associated to a particular class is done in the "Compute Nodes" section, in the "Node Setup" tab.
12.1 Classes The first section of the screen lists any existing classes with their parameters and allows for editing/deleting. The default node class, "scyld", is shown for reference but is not editable. The last section, titled "Add a new class", provides a form for defining a new class along with its parameters.
Click here for information on assigning nodes to different classes using the Compute Node Setup page.

13 Master Node By clicking on the "Master Node" link for a particular cluster link in the "My Clusters" navigation menu, you'll be taken to this page which shows metrics, hardware, and health information for the cluster's master node.
13.1 Master Node Overview Page Components
Figure 11: Layout of the master node overview page.
1. The top section of the page, labeled "Master Node" shows the uptime of the server.
2. The "Add Block" menu allow you to customize the page's main panel. When you make a selection from the "Add Block" menu, a block containing a graph or report will be added to the panel, at the top of either the left or right column, depending on which column has fewer blocks. Clicking on the "Clear" link will clear all blocks from the panel, and clicking "Load Defaults" will first clear the panels and then populate the panel with a set of default blocks.
3. The main panel on the page is a customizable container for reports and graphs contained in units called blocks (See #4 in the figure). Individual blocks are added to the panel by using the "Add Block" pulldown menu. Block order can be changed by dragging and dropping individual blocks. To drag a block to a different position, use your mouse to grab the block header and move the block to its new position.
The icons on the block header, in order from left to right, are as follows:
Refresh. Clicking this icon will refresh the block contents.
Zoom (present only on graphs). Clicking this icon will fetch a page overlay with an enlarged version of the graph.

Close. Clicking this icon will remove that block from the panel.
The layout of the blocks on the panel becomes part of your saved profile. Next time you return to this page, during this session or in a future session, your last layout is reloaded.
13.2 Master Node Overview Reports
These reports show a historical view of your cluster's resource utilization. All graphs are available across several time resolutions: hour, day, week, month, and year. Below is a description of each available graph type.
Load Average Based only on nodes currently reporting to ganglia. Shows the 1minute load, the number nodes, the number of CPUs, and the number of running processes.
CPU Usage Shows the percentage of CPU time spent in different CPU states (i.e., User, Nice, System, Idle).
Memory Usage Shows the amount of memory that is used, shared, buffered, and swapped in bytes. Also shows the total amount of memory. This will not match the total installed memory in #1 of the figure above since that only shows the memory for the compute nodes.
Network Usage Shows the network usage in bytes per second across all network interfaces.
Processes Run Shows the number of processes that have have been running.
IPMI Alarms Shows when the CPU temperature or the fan speed alarms were raised.
IPMI Fans Shows fan speed over time as monitored by the BMC.
IPMI Temperatures Shows CPU temperature over time as monitored by the BMC.
SMART Errors Shows the number of SMART attribute errors, SMART selftest errors, and predicted disk failures over time. Some attribute errors and selftest errors are used to predict disk failures while others are indicative of oldage. To get more SMART information, create a SMART report using the Add Block dropdown.
SMART Margins SMART monitors diskspecific attributes and thresholds that can be used to determine if a disk is old ("oldage") or is at risk of failure ("prefail"). The SMART Margins graph shows the difference between the threshold and the actual read value. Once the difference is zero, an attribute error is triggered.
Reports Reports give a detailed snapshot of the current state of the system. These reports make heavy use of status icons to make it easier to find anomalies. Hovering over these status icons will typically show additional information. These status icons include:
Status OK
Warning

Error
Currently there are two reports: the SMART report and the IPMI report.
SMART Report Shows detailed SMART information for each disk directly attached to the current node. You can switch between disks by clicking on the disk name at the top of the report. NOTE: Your output may differ depending on whether it is a SCSI or SATA disk. In this documentation we cover the SATA disk case.
The SMART Attributes section, which shows all of the monitored attributes, values, historical worsts, and threshold values for a particular disk. These values are normalized. Attributes that are highlighted in yellow are used to predict disk failures while attributes that are blue determine if a node has reached old age.
Status icons are used to quickly indicate whether the normalized value of an attribute has reached or fallen below the tolerated threshold.
SMART tests are initiated by system administrators using commandline tools like smartctl. The results of these tests can also be used to determine the health of a disk.
IPMI Report Shows a table of current sensor values as reported by the BMC. Status indicators indicate whether the value has breached safety thresholds.

14 Compute Node Grid Clicking on the first tab in the "Compute Nodes" section will bring you to the Compute Node Grid. This view allows you to see all of the individual compute nodes as table cells and to see metrics and state information in a way that is easy to visually process for both small and large clusters. The other main purpose of this view is to provide the ability to perform various actions, such as rebooting, in "batch" mode, by selecting nodes or groups of nodes.
14.1 Node Cells
Each cell in the table represents a single compute node. The table cells are populated in order of the node id. The screenshot highlights a single node, #1, and its associated tooltip, #2, that appears when you hover over a cell.
Figure 11: A compute node grid cell for node n20.
Each node cell contains 4 persistent elements:
a node state icon
metric 1 icon
metric 2 icon
a job scheduler node status icon
A 5th icon, indicating that a "worker" is running on that node may also be present; these are explained in more detail below.
Node state icons
The first icon present on each cell indicates the node's state. These icons are used throughout Scyld Insight to convey node state information.

Up: A node in an "up" state is the only state where the node is functional and available to nonadministrative users.
Boot: This icon represents the transitional "boot" state, during which the node is in the process of booting and is still being configured for normal operations.
Unavailable / Error: This icon indicates nodes that are responding, but are in need of maintenance by an administrator. The node is either in an error state or unavailable to nonadministrative users.
Down: There is no communication with the compute node. A node is down when it is powered off, has been halted, has been rebooted, has a network link problem, or has some other hardware problem that prevents communication.
Scheduler node status icons
In the node's tooltip (#2 in the screenshot) and on the Node Detail screen, all of the node's statuses are listed. NonTorque users: All states are translated to the closest PBS Torque state.
Up: This status indicates that the node is fully available to run jobs. The node may be free and/or running jobs.
Down: This node is failing to report, is detecting local failures with node configuration or resources, or is marked down by an administrator.
Offline: This status indicates that the administrator has instructed this node to not accept jobs.
Unknown: The job scheduler is unable to detect the node.
Marked Offline: A node that has been marked offline (by an administrator) but that has not completed its current job load. It will not accept any more jobs until the offline status is cleared. The complete job scheduler status will show a combination of job scheduler statuses, such as "offline, jobexclusive".
Beoweb Worker icon
This indicates that there is a multistep operation in progress on that node (e.g., graceful rebooting). Scyld Insight refers to these types of operations as "beoweb worker". The tooltip for the node (exposed by hovering on the node cell) provides more information such as the name of the operation and the progress.
14.2 Compute Node Metrics
The node grid view allows you to select two different metrics for the compute nodes. Each node's metric value is displayed on its corresponding cell in the grid as a colorcoded value and the metric's legend is

displayed in a draggable palette. The metrics continually refresh, every few seconds, according to the current refresh rate.
Figure 21: The compute node grid provides colorcoded metrics for each node.
1. Metric Selection Menu The screenshot shows the 2 pulldown menus where you select which metric to view on the node grid.
2. Node Metric Indicators This area of the screenshot highlights the 2 metric indicators present on each node cell. The left and right indicators correspond to selected metrics 1 and 2, correspondingly. In the example of this screenshot, metric 1 has been set to "CPU Usage". The highlighted node's left indicator, corresponding to metric 1, is orange; referring to the legend we see that orange indicates a value of "6180%".
3. Metric Legend The metric legend provides the key for colors in the node metric indicators. The "nodes" column indicates how many nodes fall into that range on the key. Clicking on any row in

the legend will "select" the nodes in the grid with that metric indicator color. See the "Selecting Nodes" section below for more.
4. The legends are independent palettes that can be opened, closed, or dragged around the screen. Close a palette by clicking in the "X" icon in the upperright hand corner. Open a palette by clicking
the palette icon below the pulldown menu. Drag a palette to a different position on the screen using the grey title area ("1: CPU Usage") as a handle. The last state and position of the palettes are saved in your profile.
14.3 Select Compute Nodes for Actions
The node grid provides several different ways to select a single node or a group of nodes on the grid. The benefit of this is to be able to perform batch operations or to highlight a set of nodes for observation. A current selection of nodes can saved as a "nodeset" for later recall. Nodes that are currently selected are shaded with a light blue background (#2 in the screenshot).
Clicking on any node directly in the grid will toggle the node's selected state. Shift and Ctrl keyboard shortcuts (or Shift and Cmd, depending on some OSes) are supported for multiple selections.
In the "Select" section (#1 in the screenshot) of the page, there are links and icons for selecting groups of nodes. The node state icons, the PBS node status icons, the beoweb worker icon, and the "All/None" links are all clickable and will select those nodes on the grid that correspond to what was clicked. As mentioned above, the color keys in the metric legend are also clickable and will select corresponding nodes on the grid.
Figure 31: Selecting compute nodes and performing actions.
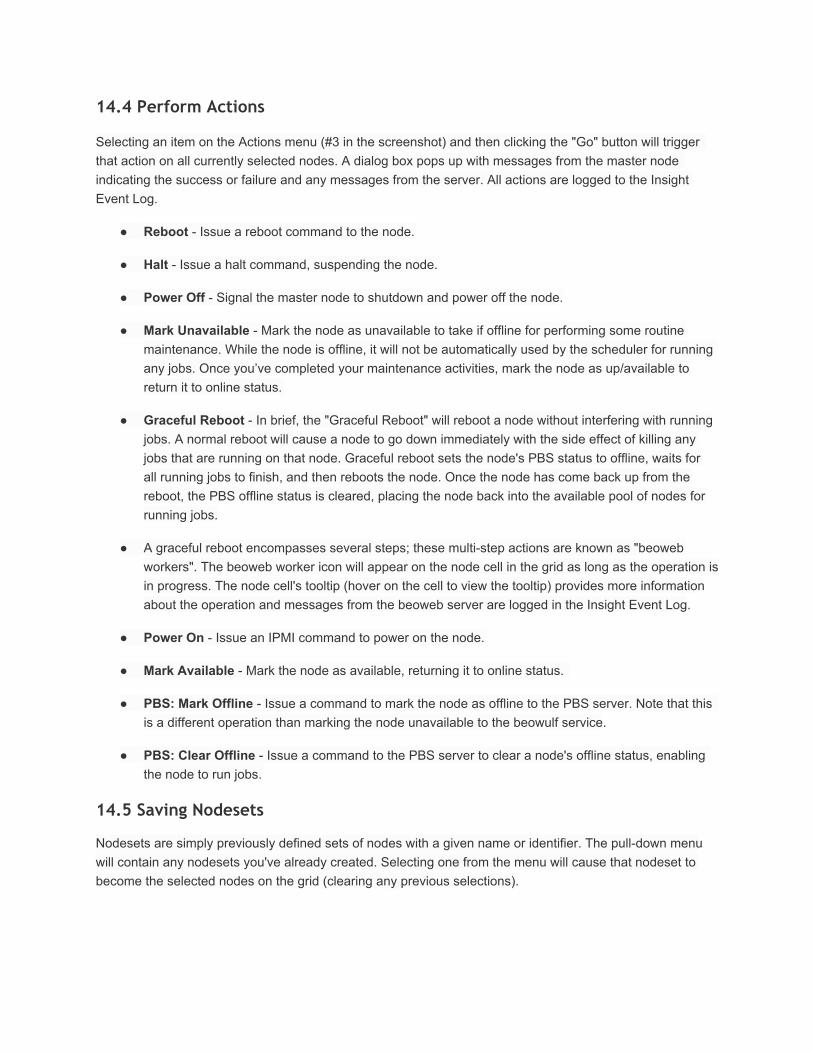
14.4 Perform Actions
Selecting an item on the Actions menu (#3 in the screenshot) and then clicking the "Go" button will trigger that action on all currently selected nodes. A dialog box pops up with messages from the master node indicating the success or failure and any messages from the server. All actions are logged to the Insight Event Log.
Reboot Issue a reboot command to the node.
Halt Issue a halt command, suspending the node.
Power Off Signal the master node to shutdown and power off the node.
Mark Unavailable Mark the node as unavailable to take if offline for performing some routine maintenance. While the node is offline, it will not be automatically used by the scheduler for running any jobs. Once you’ve completed your maintenance activities, mark the node as up/available to return it to online status.
Graceful Reboot In brief, the "Graceful Reboot" will reboot a node without interfering with running jobs. A normal reboot will cause a node to go down immediately with the side effect of killing any jobs that are running on that node. Graceful reboot sets the node's PBS status to offline, waits for all running jobs to finish, and then reboots the node. Once the node has come back up from the reboot, the PBS offline status is cleared, placing the node back into the available pool of nodes for running jobs.
A graceful reboot encompasses several steps; these multistep actions are known as "beoweb workers". The beoweb worker icon will appear on the node cell in the grid as long as the operation is in progress. The node cell's tooltip (hover on the cell to view the tooltip) provides more information about the operation and messages from the beoweb server are logged in the Insight Event Log.
Power On Issue an IPMI command to power on the node.
Mark Available Mark the node as available, returning it to online status.
PBS: Mark Offline Issue a command to mark the node as offline to the PBS server. Note that this is a different operation than marking the node unavailable to the beowulf service.
PBS: Clear Offline Issue a command to the PBS server to clear a node's offline status, enabling the node to run jobs.
14.5 Saving Nodesets
Nodesets are simply previously defined sets of nodes with a given name or identifier. The pulldown menu will contain any nodesets you've already created. Selecting one from the menu will cause that nodeset to become the selected nodes on the grid (clearing any previous selections).

To define a new nodeset, click on the palette icon to open the "Saved Nodesets" dialog. The currently selected node ids are listed, along with a button to "Save". Clicking on "Save" will then ask you to enter a name for your nodeset. Once saved, the nodeset will be available until you delete it.
Clicking on the "Manage" button will allow you to view and edit all of your current nodesets.
14.6 Grid Layout Types
There are two types of grid layouts:
Rack Layout Compute nodes are inserted from top to bottom, left to right in the order of their node ids. Note: This version of Scyld Insight's Rack Layout does not necessarily reflect the realworld layout of compute nodes.
Figure 61: Rack Layout
Best Fit Layout Compute nodes are inserted from left to right, top to bottom, in the order of their node ids. Node cells are larger compared to those in the Rack Layout.
Figure 62: Best Fit Layout

15 Compute Node Core View The Core View page can be found by clicking on the Compute Node link for a given cluster in the "My Clusters" bar. The Core View page (see Figure 01) lets you graphically view CPU utilization at a perCPU level and Memory utilization at a perNode level in realtime. This information can be combined with information about running jobs to perform application diagnostics.
Figure 01: Default Core View of a cluster with 19 compute nodes and 1 master node.
15.1 Interpret the "Show Nodes" Box Plots
By default you will see the "Show Nodes" view that is composed of box plots. This view can be enabled or disabled by clicking on the "Show Nodes" checkbox in the "View Options" menu. Each box plot gives a summary of CPU utilization by providing the minimum, 25% quartile, median, 75% quartile, and maximum CPU usage values. Memory utilization is also as a percentage and represented by the icon.
Box plots can quickly help answer two interesting questions about a compute node's CPU utilization:
Are utilization levels similar between all CPUs on this node? Are CPUs (on average) busy or not busy?
The first question is analogous to asking about the spread, while the second question asks about the average magnitude of the utilization values.
For example, Figure 11 shows each of these five values for a node with 8 CPUs. Table 11 provides an explanation for each of these marker points. From the box plot we can see that the spread of values is large, while the average magnitude (in this case, the median) is around 50%. When we enable the "Show CPUs" option for this graph, we get Figure 12.

Figure 11: A box plot for a single node showing a summary of CPU utilization. The memory icon is removed for clarity.
Marker Value Meaning
Min 0% There is at least one CPU at 0% utilization
25% Quartile 20% Two (i.e. 25%) of the CPUs are below 20% utilization and the remaining six (i.e. 75%) of the CPUs are above 20%
Median 49% Half of the CPUs are below 49% utilization and the other half of the CPUs are above 49%
75% Quartile 72% Six of the CPUs are below 72% utilization and the remaining two of the CPUs are above 72%.
Max 100% There is at least one CPU at 100% utilization
Table 11: Explanation of the five points in Figure 11.
Figure 12: A box plot for a single node showing CPU utilization with individual CPU values shown. The memory icon has been removed for clarity.

Figures 13 through 111 provide additional examples of what the box plots will look like on a compute node with 8 CPUs when 0 to 8 CPUs are being used at near 100% utilization. As more CPUs become active, the box plot leans to the right.
Figure 13: Zero fully active CPUs.
Figure 14: One fully active CPU.
Figure 15: Two fully active CPUs.
Figure 16: Three fully active CPUs.
Figure 17: Four fully active CPUs.
Figure 18: Five fully active CPUs.
Figure 19: Six fully active CPUs.
Figure 110: Seven fully active CPUs.
Figure 111: Eight fully active CPUs.

15.2 Enable the "Show CPUs" Bar Plots
Individual CPU utilization values are not displayed by default for simplicity. You can enable them by clicking on the Show CPUs value in the View Options menu. Figure 21 gives an example of a graph where "Show CPUs" is enabled and "Show Nodes" is disabled.
Figure 21: Core View featuring only CPUs for Node 1.
15.3 Show Jobs on a Compute Node
One of the main features of Core View is being able to correlate utilization values with a specific job. To view what job is running on a given node, hover over any icon to get a Workload popup as shown in Figure 31.
In this example, we see that on Node 22, a job named "imb_ompi8x432" is being run by "user3". Clicking on any of the job's links in this popup will take us directly to the Workload Jobs page with the appropriate filters set.
Figure 31: Hovering over a jobs icon makes the Workload popup appear.

15.4 Search for a Particular Node or Job
Core View allows you to limit the number of nodes shown by searching for a particular node or job. To list one or more nodes you would like to see, input a range of Node IDs in the Node IDs text box and hit 'Enter'. The Node IDs text box is located in the View Options menu (see Figure 41).
To search for a job, enter any part of the job owner's user ID, the job name, or the job ID in the Job Search text box and press 'Enter'. By listing multiple, spaceseparated strings, only jobs that match each string will be shown.
The Job Search also supports the use of 'OR' and 'NOT' keywords for more advanced searches. For example, if we only want to show nodes that have jobs being run by "Jack" and "Diane", then our Job Search input would be "Jack OR Diane". To ignore nodes that have jobs run by Jack, we can use the Job Search input "NOT Jack".
Figure 41: Core View's View Options menu.
15.5 Refresh and Replay Graphs
Core View allows you to control how rapidly you download updates from the cluster through the Refresh
controls shown in Figure 51. You can use the or buttons to stop and start autorefreshing. You can
also use the button to force an immediate refresh.
Core View also lets you look at CPU utilization numbers that have been downloaded since the page loaded through the Replay controls (see Figure 51). The or buttons are used to go backwards one or forwards one time step. To go jump back to a specific time step, click on the pulldown menu and choose from the available times. Core View stores the 1000 most recent updates from the cluster.
It is important to note that Core View always uses the current View Options values to draw graphs. This means you can look at previous data using a new Job Search query or Node IDs list.
Figure 51: Core View's refresh and replay controls.

16 Compute Node Setup This page describes the Compute Node Setup tab that can be found by clicking on the "Compute Nodes" link for a given cluster in the "My Clusters" bar. The Compute Node Setup page (see Figure 11) is used to determine compute node numbers and compute node classifications (Configured, Ignored, or Unknown). Note: Changes to this page require a restart of beowulf to take effect. Restarting beowulf will terminate any running jobs and reboot all compute nodes.
Assuming that the Node Assignment Policy is either Append or Insert (see the Cluster Configuration page), node numbers are assigned to the compute nodes in the order that their node entries appear in the Configured Addresses table. IP addresses are calculated based on the node number and the first IP address specified by the IP range that is also specified on the Cluster Configuration page.
16.1 Configured, Unknown, and Ignored Addresses
The three compute node classifications are Configured, Ignored, and Unknown. These are described below, followed by a description of how to change node numbers, node classifications, and node class options.
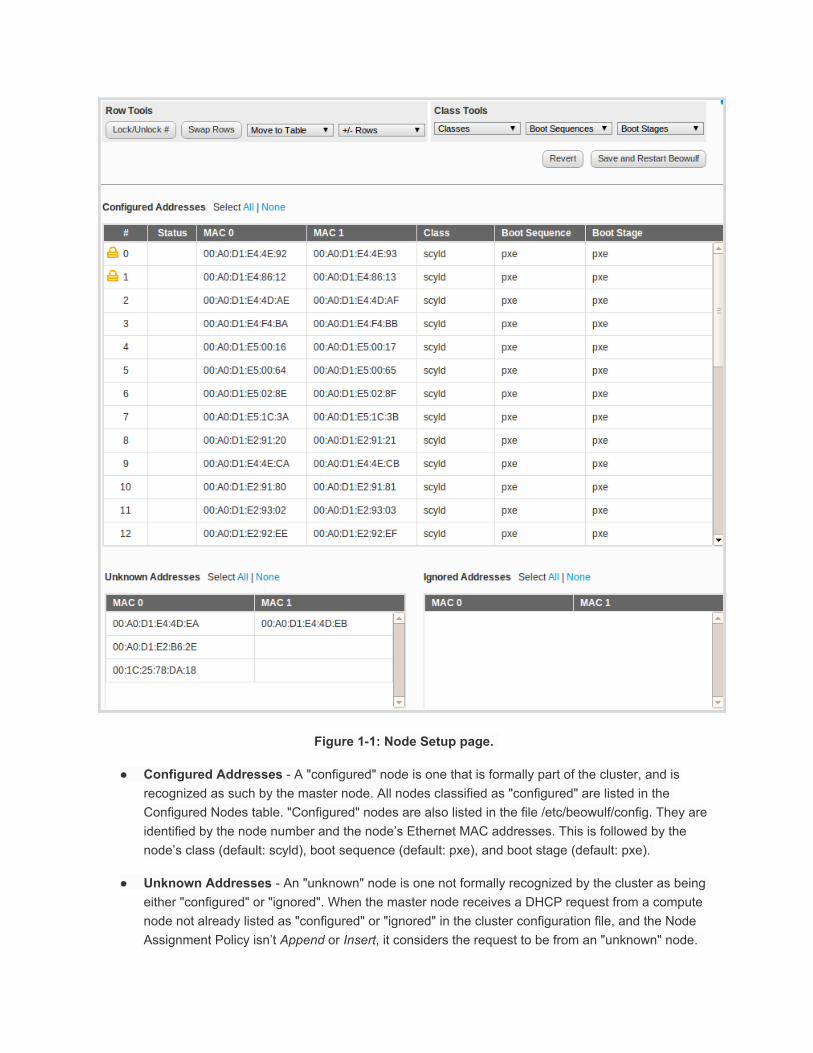
Figure 11: Node Setup page.
Configured Addresses A "configured" node is one that is formally part of the cluster, and is recognized as such by the master node. All nodes classified as "configured" are listed in the Configured Nodes table. "Configured" nodes are also listed in the file /etc/beowulf/config. They are identified by the node number and the node’s Ethernet MAC addresses. This is followed by the node’s class (default: scyld), boot sequence (default: pxe), and boot stage (default: pxe).
Unknown Addresses An "unknown" node is one not formally recognized by the cluster as being either "configured" or "ignored". When the master node receives a DHCP request from a compute node not already listed as "configured" or "ignored" in the cluster configuration file, and the Node Assignment Policy isn’t Append or Insert, it considers the request to be from an "unknown" node.
The node is then listed in the Unknown Addresses table. "Unknown" nodes are listed in the file /var/beowulf/unknown_addresses. They are identified by Ethernet MAC addresses.
Ignored Addresses An "ignored" node is one that you would like the master node to simply ignore for any reason. For example, you may choose to temporarily classify a node as "ignored" while performing hardware maintenance activities that require the node to be rebooted frequently. These nodes are not considered part of the cluster, and will not receive the appropriate responses from the master during their boot process. All nodes classified as "ignored" are listed in the Ignored Addresses table. "Ignored" nodes are listed in the file /etc/beowulf/config. They are identified by by the node’s Ethernet hardware (MAC) addresses.
16.2 Changing Node IDs
Row Tools (see Figure 31) can be used to manipulate row numbers. To use any of the tools, first click on one or multiple rows (using a Ctrl + Click or Shift + Click) and then click one of the following tools:
Lock/Unlock #: A Locked node will prevent a node from being renumbered or moved from its current position by any other operation. When you are done making all of your changes, click on "Save and Restart Beowulf".
Swap Rows: You can swap pairs of rows either within a single table or between two tables using this option. When you are done making all of your changes, click on "Save and Restart Beowulf".
+/ Rows: One way to increment node numbers is by inserting / removing blank rows in the Configured Addresses table. When you are done making all of your changes, click on "Save and Restart Beowulf".
16.3 Changing Node Classes
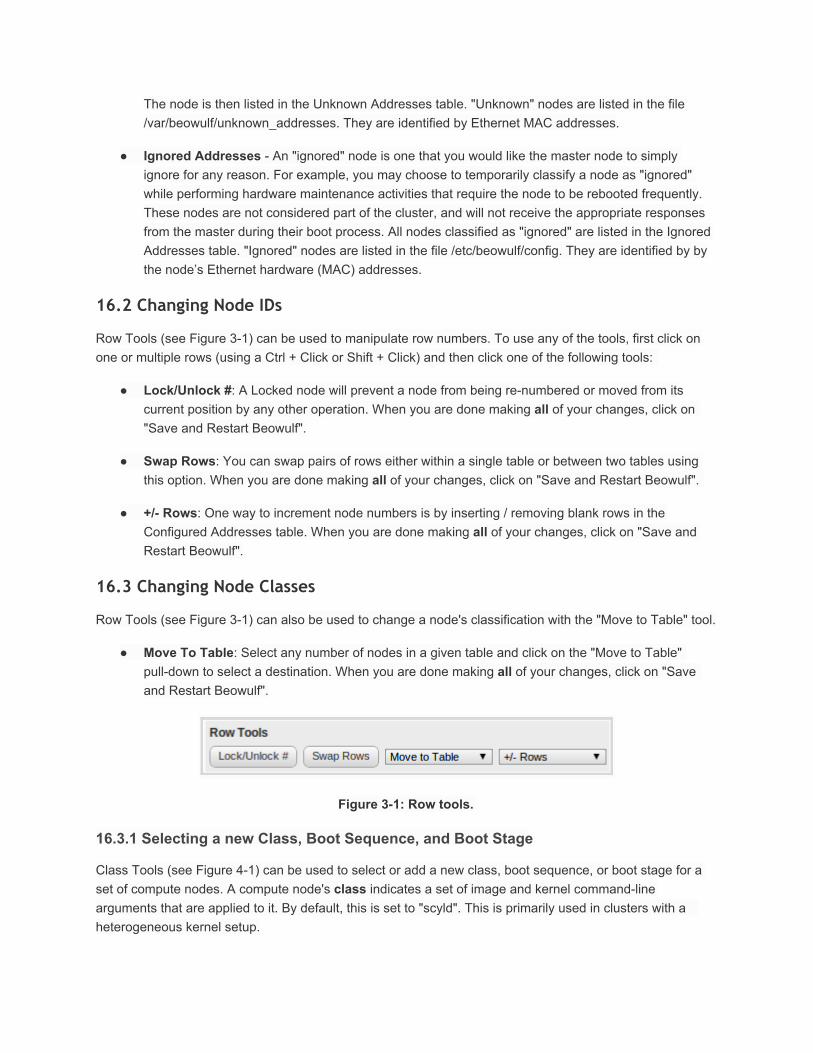
Row Tools (see Figure 31) can also be used to change a node's classification with the "Move to Table" tool.
Move To Table: Select any number of nodes in a given table and click on the "Move to Table" pulldown to select a destination. When you are done making all of your changes, click on "Save and Restart Beowulf".
Figure 31: Row tools.
16.3.1 Selecting a new Class, Boot Sequence, and Boot Stage
Class Tools (see Figure 41) can be used to select or add a new class, boot sequence, or boot stage for a set of compute nodes. A compute node's class indicates a set of image and kernel commandline arguments that are applied to it. By default, this is set to "scyld". This is primarily used in clusters with a heterogeneous kernel setup.

A node's boot sequence is an ordered list of devices from which to boot. A node's boot stage defines a step in the boot sequence that is to be used by beoserv to respond to the compute node's PXE requests. Beoserv will sometimes modify the boot stage to reflect a different step in the boot sequence.
To change a node's class, boot sequence, or boot stage, select one or more nodes from the Configured Addresses table. Next, click on either the "Classes", "Boot Sequences", or "Boot Stages" pulldown and select the appropriate Class.
The Class Tools pulldowns also provide options to specify new classes, boot sequences, and boot stages. To add a new class, for example, click on the "Classes" pulldown and select "(Add New)".
When you are done making all of your changes, click on "Save and Restart Beowulf".
Figure 41: Class tools.

17 Compute Node Detail The last tab in the Compute Node section is the Node Detail view displaying more detailed information about a single compute node.
17.1 Compute Node Detail Page Components
Figure 11: Layout of the Compute Node Detail page
1. This section shows the Host menu, a pulldown menu for choosing which compute node to display. Changing the selection will load the new host's information. The node state, uptime, and the list of PBS node states are displayed in the left half.
2. The "Actions" section contains links for common actions taken for compute nodes. The particular actions available depend on the compute node's state. Clicking on one of the action links will change the state of the compute node, so a dialog will always appear, asking you to confirm before proceeding.
Clicking on either of the "View Log" links will launch the log viewer in a new popup window or within an existing file viewer popup window. The first link "Node Entries in Syslog" uses the File Viewer's filtering capabilities to display the syslog (/var/log/messages) with only the lines relevant to this particular node displayed. The second link, "Boot Log", opens the node's dedicated log (/var/log/beowulf/node.x).
3. This section contains controls for the the page's main panel (#4 in the screenshot). When you make a selection from the "Add Block" menu, a block containing a graph or report will be added to the panel, at the top of either the left or right column, depending on which column has fewer blocks. Clicking on the "Clear" link will clear all blocks from the panel, and clicking "Load Defaults" will first clear the panel and then populate the panel with a set of default blocks.
4. The main panel on the page is a customizable container for reports and graphs contained in units called blocks. Individual blocks are added to the panel by using the "Add Block" pulldown menu. Block order can be changed by dragging and dropping individual blocks. To drag a block to a

different position, use your mouse to grab the block header (#5 in the screenshot) and move the block to its new position.
The icons on the block header (#5 in the screenshot), in order from left to right, are as follows:
Refresh. Clicking this icon will refresh the block contents.
Zoom (present only on graphs). Clicking this icon will fetch a page overlay with an enlarged version of the graph.
Close. Clicking this icon will remove that block from the panel.
The layout of the blocks on the panel becomes part of your saved profile. Next time you return to this page, during this session or in a future session, your last layout is reloaded.
17.2 Compute Node Detail Reports
These reports show the resource utilization of your cluster. All graphs are available across several time resolutions: hour, day, week, month, and year. Below is a description of each available graph type.
Load Average Based only on nodes currently reporting to ganglia. Shows the 1minute load, the number nodes, the number of CPUs, and the number of running processes.
CPU Usage Shows the percentage of CPU time spent in different CPU states (i.e., User, Nice, System, Idle).
Memory Usage Shows the amount of memory that is used, shared, buffered, and swapped in bytes. Also shows the total amount of memory. This will not match the total installed memory in #1 of the figure above since that only shows the memory for the compute nodes.
Network Usage Shows the network usage in bytes per second across all network interfaces.
Processes Run Shows the number of processes that have have been running.
Running Jobs Shows the list of jobs running on this node.
IPMI Alarms Shows when the CPU temperature or the fan speed alarms were raised.
IPMI Fans Shows fan speed over time as monitored by the BMC.
IPMI Temperatures Shows CPU temperature over time as monitored by the BMC.
SMART Errors Shows the number of SMART attribute errors, SMART selftest errors, and predicted disk failures over time. Some attribute errors and selftest errors are used to predict disk failures while others are indicative of oldage. To get more SMART information, create a SMART report using the Add Block dropdown.
SMART Margins SMART monitors diskspecific attributes and thresholds that can be used to determine if a disk is old ("oldage") or is at risk of failure ("prefail"). The SMART Margins graph
shows the difference between the threshold and the actual read value. Once the difference is zero, an attribute error is triggered.
Reports Reports give a detailed snapshot of the current state of the system. These reports make heavy use of status icons to make it easier to find anomalies. Hovering over these status icons will typically show additional information. These status icons include:
Status OK
Warning
Error
Currently there are two reports: the SMART report and the IPMI report.
SMART Report Shows detailed SMART information for each disk directly attached to the current node. You can switch between disks by clicking on the disk name at the top of the report. NOTE: Your output may differ depending on whether it is a SCSI or SATA disk. In this documentation we cover the SATA disk case.
The SMART Attributes section, which shows all of the monitored attributes, values, historical worsts, and threshold values for a particular disk. These values are normalized. Attributes that are highlighted in yellow are used to predict disk failures while attributes that are blue determine if a node has reached old age.
Status icons are used to quickly indicate whether the normalized value of an attribute has reached or fallen below the tolerated threshold.
SMART tests are initiated by system administrators using commandline tools like smartctl. The results of these tests can also be used to determine the health of a disk.
IPMI Report Shows a table of current sensor values as reported by the BMC. Status indicators indicate whether the value has breached safety thresholds.

18 Workload The Workload page provides information about the cluster's jobs and queues. Job information is dynamically refreshed to keep the view close to realtime. Clusters with a large number of jobs, as reported by qstat.
18.1 Summarize the Workload
The summary graphs all share a color key and are designed to give you a quick summary of the job activity on your cluster.
Figure 11: The workload summary panel.
Workload Summary A pie chart showing the percentage of jobs in each job state.
User Summary A bar chart of peruser jobs in each state.
Queue Summary A bar chart of perqueue jobs in each state.
18.2 Filter for Jobs
As indicated by the expand/collapse arrow icon to the right of the title, the Filters section can be expanded or collapsed. The items within each filter can be clicked to toggle it as active or inactive. An active selection appears as red on a blue background.
Figure 21: The workload filters.
Job State The job states listed do not change; instead the four states listed are always present. The default selection is Running(R) and Queued(Q) jobs. The Other(O) state is not an actual job

state it acts as a catchall for all other job states. The actual job state as reported by the job scheduler will be shown in the table.
Owner, Queue, and Job Name The selections within each of these are dynamically updated to match the possible values returned in the jobs list. For example, only users who have jobs present in the job queue will be listed in the "Owner" filter.
To immediately activate your new filter selections, click the Apply button. To the right of this button, it is possible to see how many jobs match the filter criteria out of the total number of jobs in the queue.
18.3 View Jobs
The job table lists all of the jobs in the job queue as reported by the job scheduler, similar to the output of the qstat command, with any additional filters from the Filter section applied.
Figure 31: The jobs table.
The table limits its display to 5000 rows for performance reasons. The listing is being redrawn every refresh rate seconds when the updated job list arrives from the server; if more rows are redrawn, browser performance can become noticeably slower.
Clicking on the column titles let you sort the table by that column; the arrow icons indicate the sort column and sort order. The sort state will persist as the listing is refreshed with new data. Most column headers are selfexplanatory; listed below are notes on some of the table headers.
Job ID The unique job identifier.
St Job state:
C Job is completed after having run.
E Job is exiting after having run.
H Job is held.
Q Job is queued, eligible to run or routed.
R Job is running.
T Job is being moved to new location.

W Job is waiting for its execution time (a option) to be reached.
S (Unicos only) job is suspended.
N/P Applicable to running jobs only, this column reports the number of nodes (N) and number of processors (P) on which the job are running.
Walltime If a job is Queued, the walltime indicates the maximum amount of time a job has to complete. If a job is Running or Completed, walltime, indicates how long a job has taken to run so far.
Refresh controls are located above the job table to the right. From left to right, you'll find the refresh rate textbox, the pause or play icon (depending on the current refresh state), the refresh icon, and a timestamp of the last update of job data from the server.
18.4 Create New Job
Submitting jobs to your cluster's resource manager is now possible through Scyld Insight for GridEngine and PBS Torque users. Clicking on the "New Job" button shows a UI that makes specifying commonly used options (i.e. node resources, time constraints, etc) easily accessible. More advanced options can still be specified directly in the 'Additional Scripting' box.
Files can be uploaded to the remote head node by using the "StageIn Files" section of the form.
You can load a previously saved script from either your local hard drive, or your home directory on the master node by clicking on either of the folder icons.
You can preview and save the raw text output form below by clicking on the magnifying glass icon and then the save button.
When you are ready to upload and submit your job to the resource manager, specify a destination in the 'Upload Job Script As' box and click on Submit.
18.5 Hold / Release Jobs
Hold / Release one or more jobs by selecting the jobs in the table. At this point the Job Actions dropdown menu will appear above the jobs table. Select the "Hold" or "Release" option from the dropdown. A dialog will appear asking for confirmation to prevent any potential errors.
18.6 Delete Jobs
Delete one or more jobs by selecting the jobs in the table. At this point the Job Actions dropdown menu will appear above the jobs table. Select the "Delete" option from the dropdown. A dialog will appear asking for confirmation to prevent any potential errors. NOTE: This action can not be undone.

19 File List This page describes the File List tab that can be found by clicking on the File Viewer link for a given cluster in the "My Clusters" bar.
The File List (shown in Figure 11) shows you what files you are currently subscribed to on the beoweb cluster. You can read text files or download files from this page. To subscribe to more files, use the File Subscriptions page. NOTE: Files do not need to be text files to be accessible for download.
19.1 Open and Download Files
The file list is shown in Figure 11. By default, all files are sorted by their modification date. Open a file by clicking on the magnify glass icon. Download a file by clicking on the filename link.
Figure 11: The file list.
By default, Insight downloads and displays the entire file. Insight also lets you open the last part of a file in order to minimize download times for large files. To specify how many lines from the end of a file you would like to open, select one of the options in the dropdown menu shown in Figure 12. Insight will check this value every time you open a file.
Figure 12: Set the number of lines of text from the end of a file to read when it is opened.
To open multiple files at a time, you can highlight rows by holding the "Ctrl" key, clicking on several rows, and then clicking on "Open In a New Window".
19.2 Search Files
You can narrow down the list of files via the Search bar shown in Figure 21. Any string you enter will be compared to the filenames, file contents, file size, and modification date for matches. Searches are

casesensitive. Advanced search options (shown in Figure 22) can be shown by clicking on the "Search Options" link.
For Advanced Users: Advanced search strings can be made using the following string flags:
Log filename
Has keyword
Omit keyword
After date
Before date
Figure 21: Search for a file.
Search options lets you specify what to apply your search arguments against. You can specify part of a filename, words that are present or not present in the file, and a modification date range. Clicking on cancel will close the Search Options and return you to the simple search bar.
Figure 22: Advanced search options.
19.3 Attach and Unattach Highlight Groups to Files
Files viewed through the File Display can be highlighted, filtered, and have lines hidden based upon regular expression pattern matching. Several of these markups can be saved into Highlight Groups that can be later applied to files.
If you would like a file to be open using one or more saved highlight groups, you can attach them to the file by first clicking on the row (not on the link) so that the row highlights and then selecting a group from "Attach Highlight Group" (see Figure 31). A black label will be prepended to the file's snippet, indicating the highlight group is attached.
You can unattach highlight groups by either clicking on the highlight group's black label in the file snippet or selecting the row again and picking the highlight group from "Unattach Highlight Group" (see Figure 31).

Figure 31: Attach and Unattach Highlight Group menus.

20 File Subscriptions This page describes the File Subscriptions tab that can be found by clicking on the File Viewer link for a given cluster in the "My Clusters" bar. The File Subscriptions page lets you set the list of files available in the File List.
20.1 Subscribing to Additional Files
File paths are listed in the text box and are delimited by semicolons. Each path represents zero or more files that the File List will have access to. You can specify additional file paths in one of three ways:
Exact file paths Specifying an absolute path to a file makes it available to the File List (Example: "/var/log/boot.log").
File paths with wildcards Unix shell wildcards can be used to find all the pathnames matching a specified pattern. No tilde expansion is done, but *, ?, and character ranges expressed with [] will be correctly matched (Example: "/tmp/file*.txt").
Exact directory paths Specifying an absolute path to a directory makes available all files contained directly within it. This does not recursively search the directory for files. For example, "/tmp" is equivalent to "/tmp/*".
Remote file paths If you have rsync and passwordless SSH configured between your beoweb server and a remote server you can connect to files on remote filesystems with one of the following patterns:
Syntax Description Examples
@<hostname>:<path> Specify a complete hostname or IP address to access pathon that single node.
@n1:/var/log/messages
@<node id range>:<path> Specify node ids using dashes to indicate a series and commas to indicate the beginning of another range.
@03,57:/var/log/messages
@master:<path> Specify '@master' to get access to path on the master node.
@master:/var/log/messages
@compute:<path> Specify '@compute' to get access to path on all compute nodes.
@compute:/var/log/messages
@all:<path> Specify '@all' to get access path on the compute and master nodes.
@all:/var/log/messages

Any file path can be specified, but you must have read access in order to open them. Note that there are two exceptions to this rule: "/etc/passwd" and "/etc/shadow" are always unreadable.
When you are finished making changes to the file paths, click on "Save" to apply your changes.
20.2 Summarizing Subscribed Files
The File Subscriptions page provides a count of files that matched each file path specified above. NOTE: The count includes files that you do not have read access to and files that are also unreadable.

21 File Display This page describes the File Display that can be found by opening a file from the File List page.
Insight's File Display (see Figure 0) shows text files located on the beoweb host. The File Display comes with a Highlights Menu (see Figure 01) that helps you take large, complicated text files and reduce them down to show / highlight only sections that you care about.
The Highlights Menu lets you specify regular expressions and formatting actions for phrases or lines that match. Regular expressions can be enabled or disabled using the checkbox on the left and deleted using the button on the right. The formatting actions are described in greater detail in sections 2 through 5.
Figure 01: An empty Highlights Menu
Note that certain files, such as "/etc/passwd" and "/etc/shadow" are not readable by Insight.

Figure 02: The File Display showing file /var/log/beowulf/node.8
The File Display supports the following features:
1. Follow / autorefresh a file
2. Highlight a word or pattern
3. Find / seek a highlighted word or pattern
4. Filter for / show only lines containing a word or pattern
5. Hide lines containing a word or pattern
6. Saving and applying previous Highlight Groups
21.1 Auto-Refresh a File
The file display is capable of updating the file if it changes on the cluster. Enable this feature by clicking on the "AutoRefresh" checkbox located on the topright and shown in Figure 11.
Figure 11: "AutoRefresh" checkbox.
21.2 Highlight a Word or Phrase
You can highlight a word or phrase by typing it into the text input and hitting Enter. Any number of regular expressions can be specified. In Figure 21, the user has specified two phrases to highlight: "setup" and

"nfs". Insight's File Display uses the colors specified under BG and FG to set the background and foreground color of all matching strings.
Figure 21: A Highlights Menu with two Highlight expressions
21.3 Find a Word or Pattern
If you have specified "Highlight" as your format action, you will be able to quickly scroll to the previous / next matching phrase by clicking on the and buttons.
If you need to seek forward or backwards multiple times in a row, you can click on a button once and hit enter to repeat that action.
The "Seek" buttons located to the right of the "Save As" button in the Highlights Menu acts will scroll to the previous / next matching phrase of any regular expression that is marked with the Highlight formatting.
21.4 Filter for Lines Containing a Word or Pattern
The File Display can take a regular expression and filter the file such that only lines that match are shown. In Figure 42, for example, the user has chosen to only show lines that have the word "nfs". All lines not containing "nfs" are then hidden from view.
When multiple Filters are activated they are are applied one after another. In other words, lines will be displayed only if they match all the specified Filter expressions.

Figure 41: A Highlights Menu with one Filter expression.
21.5 Hide Lines Containing a Word or Pattern
One way of finding "interesting" lines of text is by removing lines that are not interesting. This can be done by selecting the "Hide" option in the "Format" pulldown menu. NOTE: Hides only work on simple strings and not regular expressions.
In Figure 51, the user has hidden all lines that contain the word "starting", all the lines that contain "setup", and all the lines that contain "node". The user can now find interesting lines of text, such as error messages.
Figure 51: A Highlights Menu with three Hide expressions.

21.6 Saving and Applying Previous Highlight Groups
Insight lets you save any regular expressions and formatting choices you have entered as a "Highlight Group". Saved Highlight Groups are located at the bottom of the Highlights Menu in the Highlight Groups Clipboard.
Each of the examples from Sections 2, 4, and 5 were independently saved as "HighlightExample",
"FilterExample", and "HideExample" using the button.
In Figure 61, we see these highlight groups have the following actions:
View: Click on the Highlight Group's name to see all of the expressions and formatting options associated with it (See Figure 62).
Attach: The "Attach" checkbox being selected indicates that this highlight group will be pasted into the Highlights Menu when this file is opened from the File List.
Paste: Clicking on "Paste" will copy and paste this highlight group into the upper portion of the Highlights menu, thus making it available for activation.
Delete: Click on "Delete" to delete this highlight group. You will be asked to confirm this action.
You can not direclty modify a saved highlight group through the Highlights Group Clipboard. Instead, you can overwrite a previously saved group by using a name that's already in use when you save a new group.
Figure 61: The Highlight Groups Clipboard at the bottom of the Highlights Menu (Groups Closed).

Figure 62: The Highlight Groups Clipboard at the bottom of the Highlights Menu (Groups Opened).