Embed Size (px)
Citation preview
Copyright © 2007 by the Association for Computing Machinery, Inc.
Permission to make digital or hard copies of part or all of this work for personal or classroom use is granted without fee provided that copies are not made or distributed for commercial
advantage and that copies bear this notice and the full citation on the first page. Copyrights for components of this work owned by others than ACM must be honored. Abstracting with credit
is permitted. To copy otherwise, to republish, to post on servers, or to redistribute to lists, requires prior specific permission and/or a fee. Request permissions from Permissions Dept, ACM
Inc., fax +1 (212) 869-0481 or e-mail [email protected].
Sketch-Based Interfaces and Modeling 2007, Riverside, CA, August 02-03, 2007.
© 2007 ACM 978-1-59593-913-5/07/0008 $5.00
EUROGRAPHICS Workshop on Sketch-Based Interfaces and Modeling (2007)
M. van de Panne, E. Saund (Editors)
Scribbles to Vectors: Preparation of Scribble Drawings for
CAD Interpretation
A. Bartolo, K. P. Camilleri, S. G. Fabri, J. C. Borg and P. J. Farrugia
Faculty of Engineering, University of Malta, Malta
Abstract
This paper describes the work carried out on off-line paper based scribbles such that they can be incorporated
into a sketch-based interface without forcing designers to change their natural drawing habits. In this work, the
scribbled drawings are converted into a vectorial format which can be recognized by a CAD system. This is
achieved by using pattern analysis techniques, namely the Gabor filter to simplify the scribbled drawing. Vector
line are then extracted from the resulting drawing by means of Kalman filtering.
Categories and Subject Descriptors (according to ACM CCS): I.4.3 [Image Processing and Computer Vision]: Fil-
tering I.4.7 [Image Processing and Computer Vision]: Texture
1. Introduction
Unconstrained sketching in early design is important. This
fact is evident by the number of researchers that strive to
create sketch-based interfaces that give the user the maxi-
mum freedom possible, aiming at obtaining a transparent,
easy to use interface. The trend in these interfaces is to give
the designer the impression that the drawing is made using
traditional pen and paper, possibly through the use of dig-
ital pens and Tablet PCs. However, the freedom and flexi-
bility available to designers when using traditional pen and
paper remains unparalleled and this is evident in the lower
adoption rates of Tablet PCs [NM04]. Using pen-and-paper,
designers may benefit from quick, uninterrupted sketching,
allowing the designer to focus on the design of the object
rather than the interactions required with the interface sys-
tem. This in turn makes the designers more likely to explore
different design solutions, hence increasing the creativity of
their designs [SL97].
This flexibility has a price. Paper is a passive medium and
through paper alone, the designer cannot obtain the 3D ren-
dered models that may be obtained through CAD systems.
To obtain such models, the designer must redraw the sketch,
either using the CAD tool directly, or by using an interme-
diary sketch based interface. Hence the need of an interpre-
tation technique that may integrate the paper-based draw-
ing with CAD systems. In our previous work [FBCG06],
[BCFB06], we have demonstrated a possible solution, using
a prescribed sketching language to facilitate the interpreta-
tion of paper-based drawings. This work further improves
our previous interface by allowing the designer to sketch the
object profile using multiple strokes or scribbles; thereby in-
creasing the designer’s drawing freedom. This paper focuses
on the simplification of the scribbled profile such that the
scribble may be represented by vector data which may be im-
ported into a CAD system. The designer is limited to draw-
ing the profile of the object since this paper does not tackle
the issues involved in shading strokes.
The rest of the paper is organized as follows: Section 2
gives a brief review of the methods used to interpret scrib-
bled drawings, Section 3 describes the use of Gabor filtering
techniques for perceptual simplification, Section 4 describes
how the Kalman filter framework may be used to extract a
vectorial representation of the simplified scribble whilst Sec-
tion 5 concludes the paper with a discussion on the work.
2. Background
Given drawing freedom, designers would draw initial
sketches using over-traced scribbles. Interpretation of these
scribbles requires the grouping of the over-traced line
strokes into a single line vector. Vectorization of neat
sketches and technical drawings is a well researched
area, with robust algorithms such as SPV [LD99] and
OOPSV [SSC∗02] being well established in literature. These
A. Bartolo et al. / Scribbles to Vectors: Preparation of Scribble Drawings for CAD Interpretation
techniques however consider each line stroke in the image as
an intended distinct line, such that should these algorithms
be applied to scribbled drawings, the vectorization technique
would attempt to represent all over0traced line strokes as
separate vectors. Since the over-traced strokes intersect each
other, such techniques would be required to treat as junction
points a number of ‘false junctions’, that is, intersections
of the scribbled over-strokes which are not intended to be
perceived as junctions. These ‘false junctions’ are problem-
atic in that they increase the computational complexity of the
algorithms considerably. For example, in graph-based tech-
niques such as [HT06], junctions are represented as graph
nodes hence increasing the size of the graph structure repre-
senting the drawing.
The problem of selecting an intended shape amongst a
clutter of line fragments has been tackled through percep-
tual grouping techniques rather than through vectorization.
In these methods, the Gestalt laws are applied in order to
select paths that are more salient than others. Thus authors
such as Saund [Sau03] and Estrada and Jepson [EJ04] search
for long paths that form convex closed contours, giving pref-
erence to smooth paths that form object profiles rather than
to meandering paths. However, these techniques have a ma-
jor flaw, namely, the assumption that the clutter of line seg-
ments is due to some unrelated background rather than to
supporting line strokes. In fact, using the criteria described
in [Sau03] and [EJ04] to identify preferred paths results in a
number of equally salient line paths.
Simplification of paper-based scribbles has, as yet, been
unchallenged. However, scribbled drawings are being tack-
led by on-line based systems such as those described in
[KS06] and [KQW06]. In these systems, the interpretation
process has access to the sequence with which the strokes
are drawn. Thus simplification of the scribbled drawing is
carried out in real-time by comparing each new stroke to a
bank of existing strokes. Such a simplification cannot how-
ever be applied to paper-based sketches since the sequence
of line strokes is unknown, Furthermore, in on-line systems,
each line stroke is extracted as a whole entity irrespective of
the number of line strokes that are intersected when draw-
ing the stroke. The same cannot be applied to off-line paper-
based drawings where the vectorization process would split
the line strokes into smaller fragments at line junctions.
An alternative simplification procedure is that described
in [SD04]. This uses a point cloud thinning approach to clus-
ter foreground pixel locations to some best fitting line. The
disadvantage of this technique, as with other thinning-based
vectorization methods is the poor performance at the junc-
tion regions. At junctions, the foreground pixels from differ-
ent line directions cause the medial axis to deviate from the
true intersection point of the two lines.
In view of the difficulties that exist in the simplification of
paper-based scribbles, Saund [Sau03] suggests that the per-
ceptual grouping techniques used to identify salient paths
(a) (b) (c)
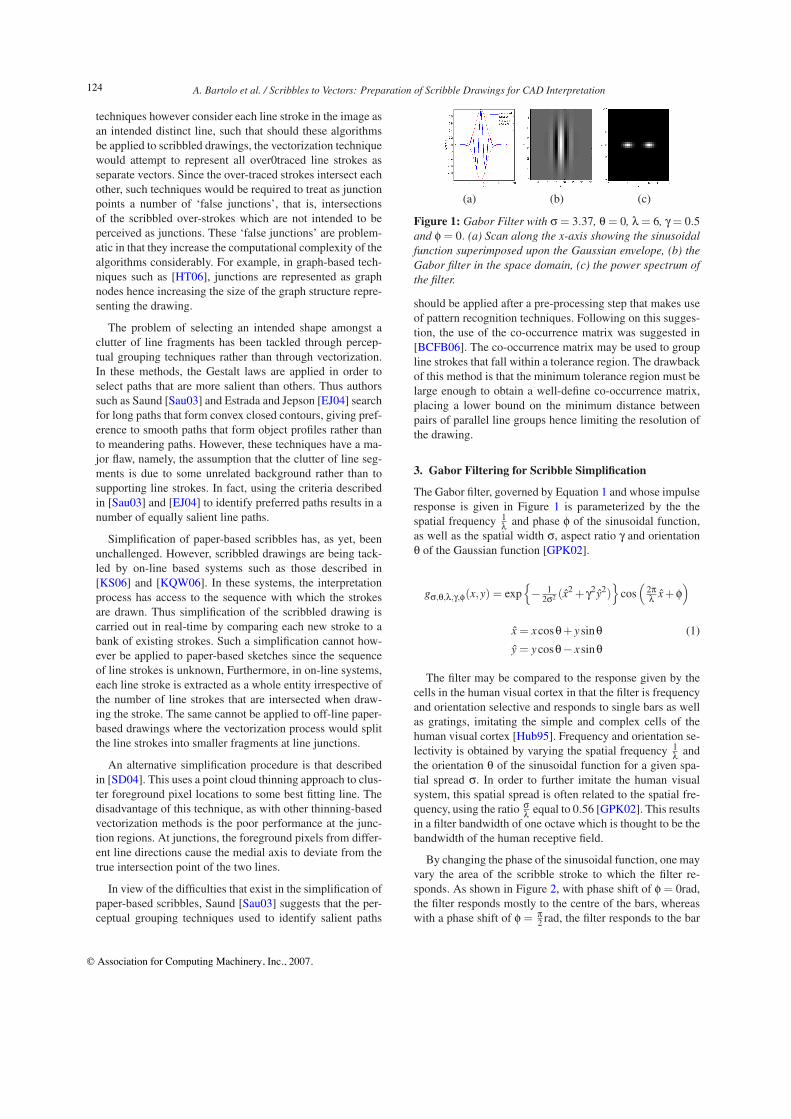
Figure 1: Gabor Filter with σ = 3.37, θ = 0, λ = 6, γ = 0.5
and φ = 0. (a) Scan along the x-axis showing the sinusoidal
function superimposed upon the Gaussian envelope, (b) the
Gabor filter in the space domain, (c) the power spectrum of
the filter.
should be applied after a pre-processing step that makes use
of pattern recognition techniques. Following on this sugges-
tion, the use of the co-occurrence matrix was suggested in
[BCFB06]. The co-occurrence matrix may be used to group
line strokes that fall within a tolerance region. The drawback
of this method is that the minimum tolerance region must be
large enough to obtain a well-define co-occurrence matrix,
placing a lower bound on the minimum distance between
pairs of parallel line groups hence limiting the resolution of
the drawing.
3. Gabor Filtering for Scribble Simplification
The Gabor filter, governed by Equation 1 and whose impulse
response is given in Figure 1 is parameterized by the the
spatial frequency 1λ
and phase φ of the sinusoidal function,
as well as the spatial width σ, aspect ratio γ and orientation
θ of the Gaussian function [GPK02].
gσ,θ,λ,γ,φ(x,y) = exp{
− 12σ2 (x2 + γ2y2)
}
cos(
2πλ
x +φ)
x = xcosθ+ ysinθ (1)
y = ycosθ− x sinθ
The filter may be compared to the response given by the
cells in the human visual cortex in that the filter is frequency
and orientation selective and responds to single bars as well
as gratings, imitating the simple and complex cells of the
human visual cortex [Hub95]. Frequency and orientation se-
lectivity is obtained by varying the spatial frequency 1λ
and
the orientation θ of the sinusoidal function for a given spa-
tial spread σ. In order to further imitate the human visual
system, this spatial spread is often related to the spatial fre-
quency, using the ratio σλ
equal to 0.56 [GPK02]. This results
in a filter bandwidth of one octave which is thought to be the
bandwidth of the human receptive field.
By changing the phase of the sinusoidal function, one may
vary the area of the scribble stroke to which the filter re-
sponds. As shown in Figure 2, with phase shift of φ = 0rad,
the filter responds mostly to the centre of the bars, whereas
with a phase shift of φ = π2 rad, the filter responds to the bar
124
© Association for Computing Machinery, Inc., 2007.
A. Bartolo et al. / Scribbles to Vectors: Preparation of Scribble Drawings for CAD Interpretation
(a)
(b)
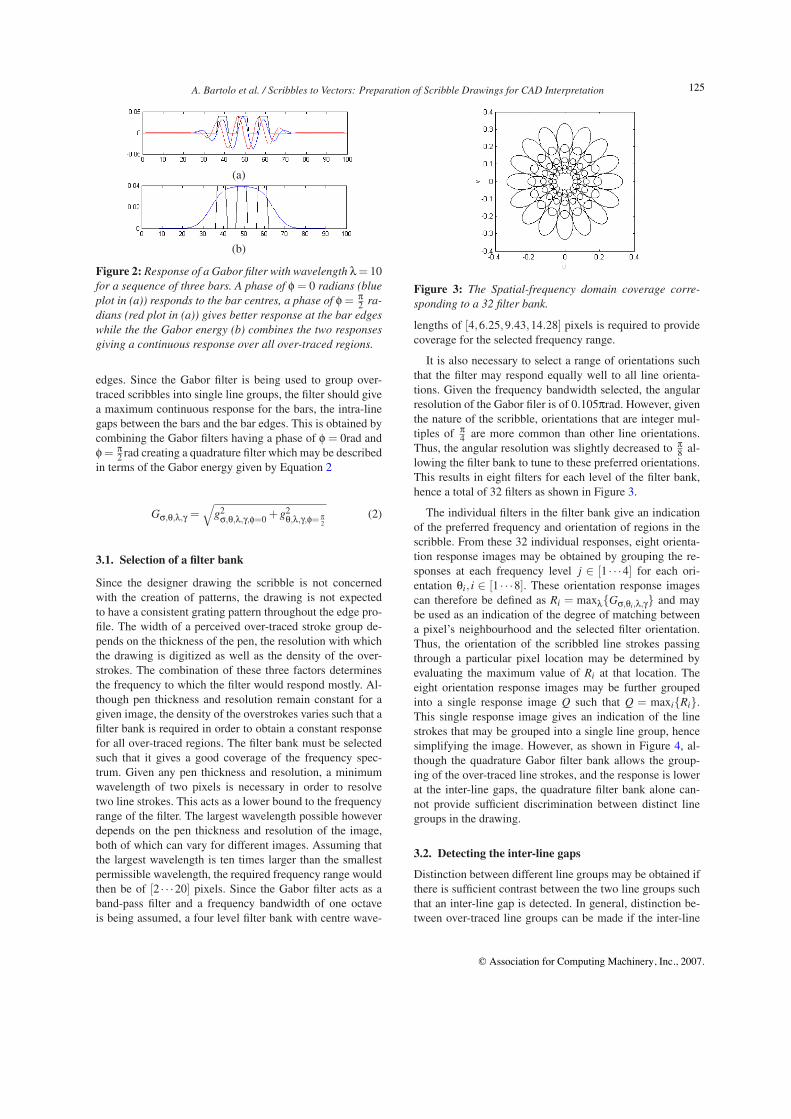
Figure 2: Response of a Gabor filter with wavelength λ = 10
for a sequence of three bars. A phase of φ = 0 radians (blue
plot in (a)) responds to the bar centres, a phase of φ = π2 ra-
dians (red plot in (a)) gives better response at the bar edges
while the the Gabor energy (b) combines the two responses
giving a continuous response over all over-traced regions.
edges. Since the Gabor filter is being used to group over-
traced scribbles into single line groups, the filter should give
a maximum continuous response for the bars, the intra-line
gaps between the bars and the bar edges. This is obtained by
combining the Gabor filters having a phase of φ = 0rad and
φ = π2 rad creating a quadrature filter which may be described
in terms of the Gabor energy given by Equation 2
Gσ,θ,λ,γ =√
g2σ,θ,λ,γ,φ=0
+g2θ,λ,γ,φ= π
2
(2)
3.1. Selection of a filter bank
Since the designer drawing the scribble is not concerned
with the creation of patterns, the drawing is not expected
to have a consistent grating pattern throughout the edge pro-
file. The width of a perceived over-traced stroke group de-
pends on the thickness of the pen, the resolution with which
the drawing is digitized as well as the density of the over-
strokes. The combination of these three factors determines
the frequency to which the filter would respond mostly. Al-
though pen thickness and resolution remain constant for a
given image, the density of the overstrokes varies such that a
filter bank is required in order to obtain a constant response
for all over-traced regions. The filter bank must be selected
such that it gives a good coverage of the frequency spec-
trum. Given any pen thickness and resolution, a minimum
wavelength of two pixels is necessary in order to resolve
two line strokes. This acts as a lower bound to the frequency
range of the filter. The largest wavelength possible however
depends on the pen thickness and resolution of the image,
both of which can vary for different images. Assuming that
the largest wavelength is ten times larger than the smallest
permissible wavelength, the required frequency range would
then be of [2 · · ·20] pixels. Since the Gabor filter acts as a
band-pass filter and a frequency bandwidth of one octave
is being assumed, a four level filter bank with centre wave-
Figure 3: The Spatial-frequency domain coverage corre-
sponding to a 32 filter bank.
lengths of [4,6.25,9.43,14.28] pixels is required to provide
coverage for the selected frequency range.
It is also necessary to select a range of orientations such
that the filter may respond equally well to all line orienta-
tions. Given the frequency bandwidth selected, the angular
resolution of the Gabor filer is of 0.105πrad. However, given
the nature of the scribble, orientations that are integer mul-
tiples of π4 are more common than other line orientations.
Thus, the angular resolution was slightly decreased to π8 al-
lowing the filter bank to tune to these preferred orientations.
This results in eight filters for each level of the filter bank,
hence a total of 32 filters as shown in Figure 3.
The individual filters in the filter bank give an indication
of the preferred frequency and orientation of regions in the
scribble. From these 32 individual responses, eight orienta-
tion response images may be obtained by grouping the re-
sponses at each frequency level j ∈ [1 · · ·4] for each ori-
entation θi, i ∈ [1 · · ·8]. These orientation response images
can therefore be defined as Ri = maxλ{Gσ,θi,λ,γ} and may
be used as an indication of the degree of matching between
a pixel’s neighbourhood and the selected filter orientation.
Thus, the orientation of the scribbled line strokes passing
through a particular pixel location may be determined by
evaluating the maximum value of Ri at that location. The
eight orientation response images may be further grouped
into a single response image Q such that Q = maxi{Ri}.
This single response image gives an indication of the line
strokes that may be grouped into a single line group, hence
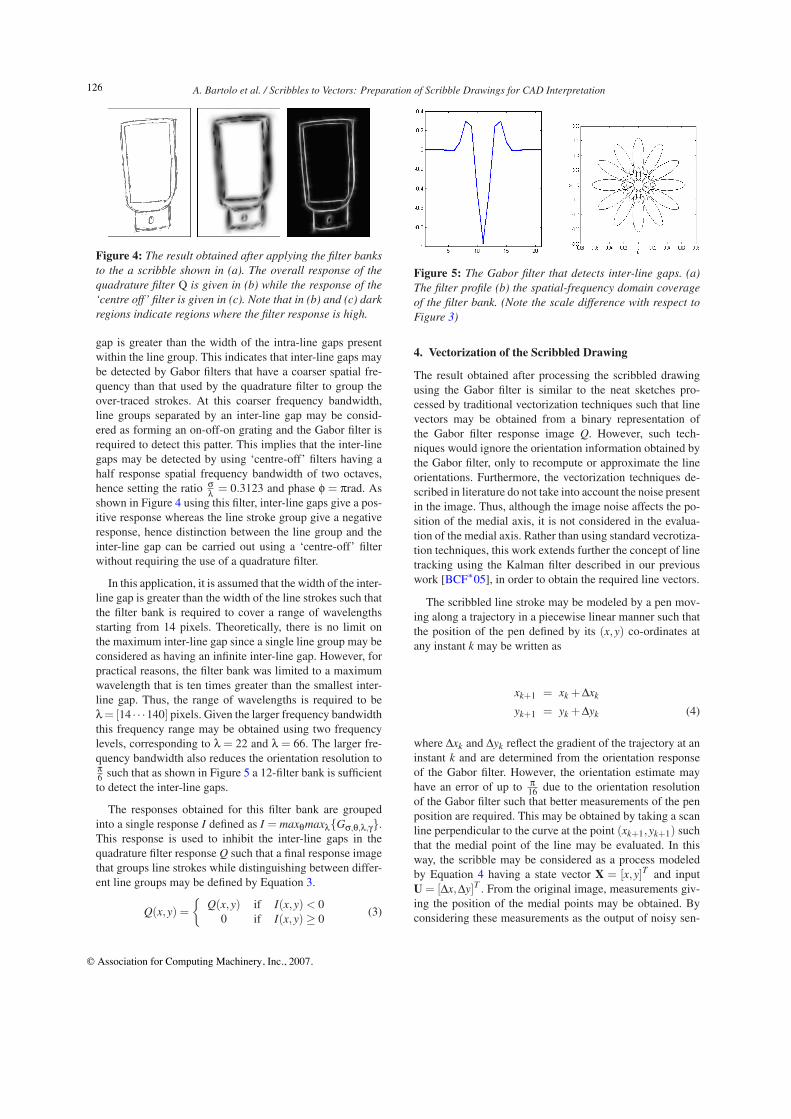
simplifying the image. However, as shown in Figure 4, al-
though the quadrature Gabor filter bank allows the group-
ing of the over-traced line strokes, and the response is lower
at the inter-line gaps, the quadrature filter bank alone can-
not provide sufficient discrimination between distinct line
groups in the drawing.
3.2. Detecting the inter-line gaps
Distinction between different line groups may be obtained if
there is sufficient contrast between the two line groups such
that an inter-line gap is detected. In general, distinction be-
tween over-traced line groups can be made if the inter-line
125
© Association for Computing Machinery, Inc., 2007.
A. Bartolo et al. / Scribbles to Vectors: Preparation of Scribble Drawings for CAD Interpretation
Figure 4: The result obtained after applying the filter banks
to the a scribble shown in (a). The overall response of the
quadrature filter Q is given in (b) while the response of the
‘centre off’ filter is given in (c). Note that in (b) and (c) dark
regions indicate regions where the filter response is high.
gap is greater than the width of the intra-line gaps present
within the line group. This indicates that inter-line gaps may
be detected by Gabor filters that have a coarser spatial fre-
quency than that used by the quadrature filter to group the
over-traced strokes. At this coarser frequency bandwidth,
line groups separated by an inter-line gap may be consid-
ered as forming an on-off-on grating and the Gabor filter is
required to detect this patter. This implies that the inter-line
gaps may be detected by using ‘centre-off’ filters having a
half response spatial frequency bandwidth of two octaves,
hence setting the ratio σλ
= 0.3123 and phase φ = πrad. As
shown in Figure 4 using this filter, inter-line gaps give a pos-
itive response whereas the line stroke group give a negative
response, hence distinction between the line group and the
inter-line gap can be carried out using a ‘centre-off’ filter
without requiring the use of a quadrature filter.
In this application, it is assumed that the width of the inter-
line gap is greater than the width of the line strokes such that
the filter bank is required to cover a range of wavelengths
starting from 14 pixels. Theoretically, there is no limit on
the maximum inter-line gap since a single line group may be
considered as having an infinite inter-line gap. However, for
practical reasons, the filter bank was limited to a maximum
wavelength that is ten times greater than the smallest inter-
line gap. Thus, the range of wavelengths is required to be
λ = [14 · · ·140] pixels. Given the larger frequency bandwidth
this frequency range may be obtained using two frequency
levels, corresponding to λ = 22 and λ = 66. The larger fre-
quency bandwidth also reduces the orientation resolution toπ6 such that as shown in Figure 5 a 12-filter bank is sufficient
to detect the inter-line gaps.
The responses obtained for this filter bank are grouped
into a single response I defined as I = maxθmaxλ{Gσ,θ,λ,γ}.
This response is used to inhibit the inter-line gaps in the
quadrature filter response Q such that a final response image
that groups line strokes while distinguishing between differ-
ent line groups may be defined by Equation 3.
Q(x,y) =
{
Q(x,y) if I(x,y) < 0
0 if I(x,y) ≥ 0(3)
Figure 5: The Gabor filter that detects inter-line gaps. (a)
The filter profile (b) the spatial-frequency domain coverage
of the filter bank. (Note the scale difference with respect to
Figure 3)
4. Vectorization of the Scribbled Drawing
The result obtained after processing the scribbled drawing
using the Gabor filter is similar to the neat sketches pro-
cessed by traditional vectorization techniques such that line
vectors may be obtained from a binary representation of
the Gabor filter response image Q. However, such tech-
niques would ignore the orientation information obtained by
the Gabor filter, only to recompute or approximate the line
orientations. Furthermore, the vectorization techniques de-
scribed in literature do not take into account the noise present
in the image. Thus, although the image noise affects the po-
sition of the medial axis, it is not considered in the evalua-
tion of the medial axis. Rather than using standard vecrotiza-
tion techniques, this work extends further the concept of line
tracking using the Kalman filter described in our previous
work [BCF∗05], in order to obtain the required line vectors.
The scribbled line stroke may be modeled by a pen mov-
ing along a trajectory in a piecewise linear manner such that
the position of the pen defined by its (x,y) co-ordinates at
any instant k may be written as
xk+1 = xk +∆xk
yk+1 = yk +∆yk (4)
where ∆xk and ∆yk reflect the gradient of the trajectory at an
instant k and are determined from the orientation response
of the Gabor filter. However, the orientation estimate may
have an error of up to π16 due to the orientation resolution
of the Gabor filter such that better measurements of the pen
position are required. This may be obtained by taking a scan
line perpendicular to the curve at the point (xk+1,yk+1) such
that the medial point of the line may be evaluated. In this
way, the scribble may be considered as a process modeled
by Equation 4 having a state vector X = [x,y]T and input
U = [∆x,∆y]T . From the original image, measurements giv-
ing the position of the medial points may be obtained. By
considering these measurements as the output of noisy sen-
126
© Association for Computing Machinery, Inc., 2007.
A. Bartolo et al. / Scribbles to Vectors: Preparation of Scribble Drawings for CAD Interpretation
sors, the Kalman filter may be used to estimate the system
states, hence obtain better estimates of the medial axis.
The Kalman filter assumes that a system is governed by a
discrete time process modeled by the linear stochastic equa-
tion given by Equation 5 for which a measurement Z may be
related to its state X using Equation 6 [May79].
Xk = AXk−1 +BU+Wk−1 (5)
Zk = HXk +Vk (6)
where W and V are random variables representing the pro-
cess and measurement noise respectively which are assumed
to be white gaussian noise processes having zero mean and
co-variance of Q and R respectively. Comparison between
Equations 4 and 5 indicates that A and B are identity matri-
ces of size 2×2. Furthermore, the measurements of the me-
dial axis points are directly related to the system states such
that the function H in Equation 6 can also be represented by
a 2×2 identity matrix. In this application, the process noise
models the deviations of the true trajectory from the esti-
mated trajectory obtained through the process model. This
deviation is due to the resolution error of the Gabor filter
orientation estimate. In the worst case, an error of π16 rad is
obtained and this error is used to model the process noise
covariance. The measurement noise represents the error in
the measurements of the medial axis points. This is due to
the changes in line width which displace the medial axis
point from its true location. Thus an estimate of the mea-
surement noise is obtained by observing the changes in line
width along the trajectory.
The Kalman filter performs the state estimation in two
steps, denoted as the time update and measurement update
steps such that feedback obtained from the measurements
Z are used to obtain better estimates of the states X. In the
time update step given by Equations 7 the a priori state es-
timate Xk|k and the error covariance, Pk|k is obtained using
the process model and the a posteriori state Xk|k−1 and error
covariance Pk|k−1. These are then updated in the measure-
ment update step give by Equations 8, using the actual mea-
surement Mk and the gain matrix K which minimizes the a
posteriori error covariance
Xk|k−1 = AXk−1|k−1 +BUk−1|k−1
Pk|k−1 = APk−1|k−1AT +Q (7)
Kk = Pk|k−1HT (HPk|k−1H
T +R)−1
Xk|k = Xk|k−1 +Kk(Mk −HXk|k−1)
Pk|k = (I −KkH)Pk|k−1 (8)
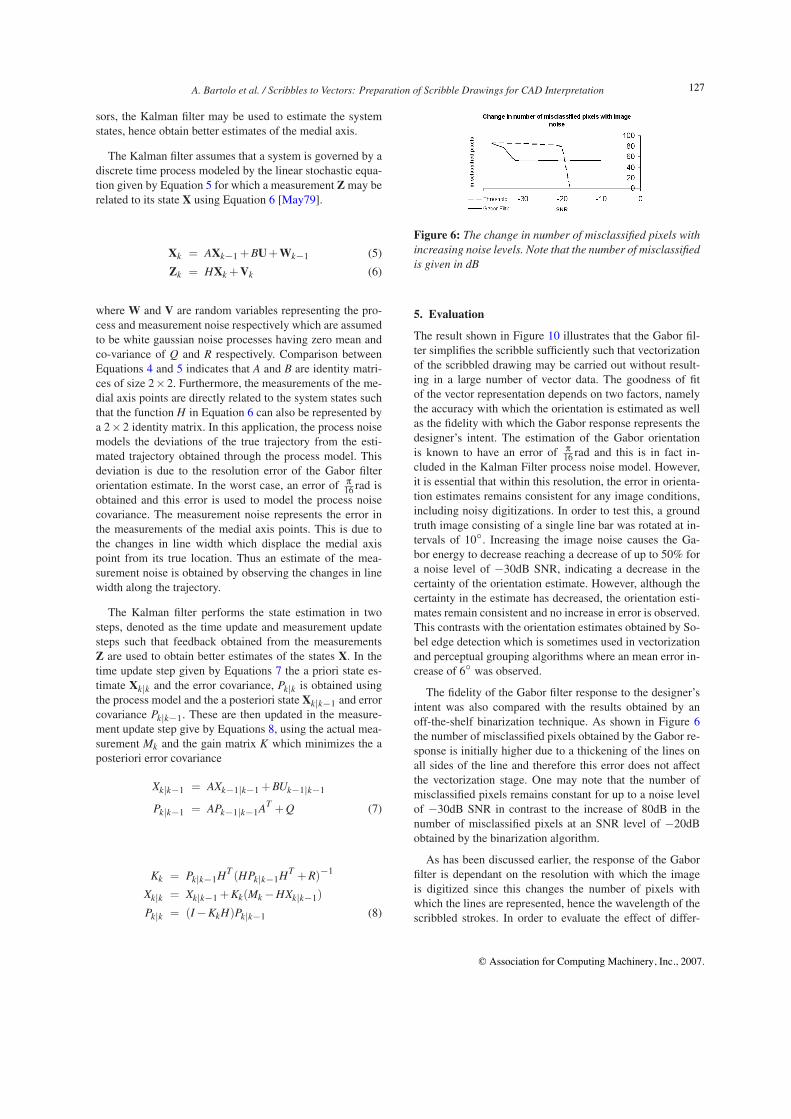
Figure 6: The change in number of misclassified pixels with
increasing noise levels. Note that the number of misclassified
is given in dB
5. Evaluation
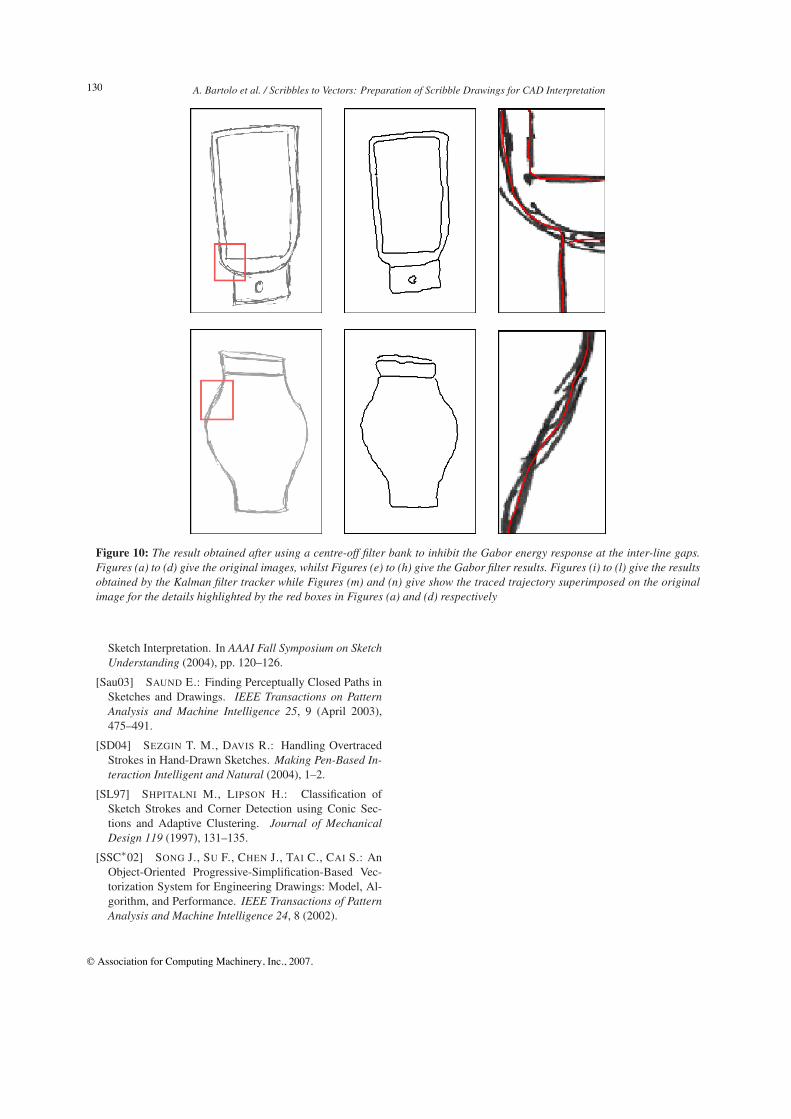
The result shown in Figure 10 illustrates that the Gabor fil-
ter simplifies the scribble sufficiently such that vectorization
of the scribbled drawing may be carried out without result-
ing in a large number of vector data. The goodness of fit
of the vector representation depends on two factors, namely
the accuracy with which the orientation is estimated as well
as the fidelity with which the Gabor response represents the
designer’s intent. The estimation of the Gabor orientation
is known to have an error of π16 rad and this is in fact in-
cluded in the Kalman Filter process noise model. However,
it is essential that within this resolution, the error in orienta-
tion estimates remains consistent for any image conditions,
including noisy digitizations. In order to test this, a ground
truth image consisting of a single line bar was rotated at in-
tervals of 10◦. Increasing the image noise causes the Ga-
bor energy to decrease reaching a decrease of up to 50% for
a noise level of −30dB SNR, indicating a decrease in the
certainty of the orientation estimate. However, although the
certainty in the estimate has decreased, the orientation esti-
mates remain consistent and no increase in error is observed.
This contrasts with the orientation estimates obtained by So-
bel edge detection which is sometimes used in vectorization
and perceptual grouping algorithms where an mean error in-
crease of 6◦ was observed.
The fidelity of the Gabor filter response to the designer’s
intent was also compared with the results obtained by an
off-the-shelf binarization technique. As shown in Figure 6
the number of misclassified pixels obtained by the Gabor re-
sponse is initially higher due to a thickening of the lines on
all sides of the line and therefore this error does not affect
the vectorization stage. One may note that the number of
misclassified pixels remains constant for up to a noise level
of −30dB SNR in contrast to the increase of 80dB in the
number of misclassified pixels at an SNR level of −20dB
obtained by the binarization algorithm.
As has been discussed earlier, the response of the Gabor
filter is dependant on the resolution with which the image
is digitized since this changes the number of pixels with
which the lines are represented, hence the wavelength of the
scribbled strokes. In order to evaluate the effect of differ-
127
© Association for Computing Machinery, Inc., 2007.
A. Bartolo et al. / Scribbles to Vectors: Preparation of Scribble Drawings for CAD Interpretation
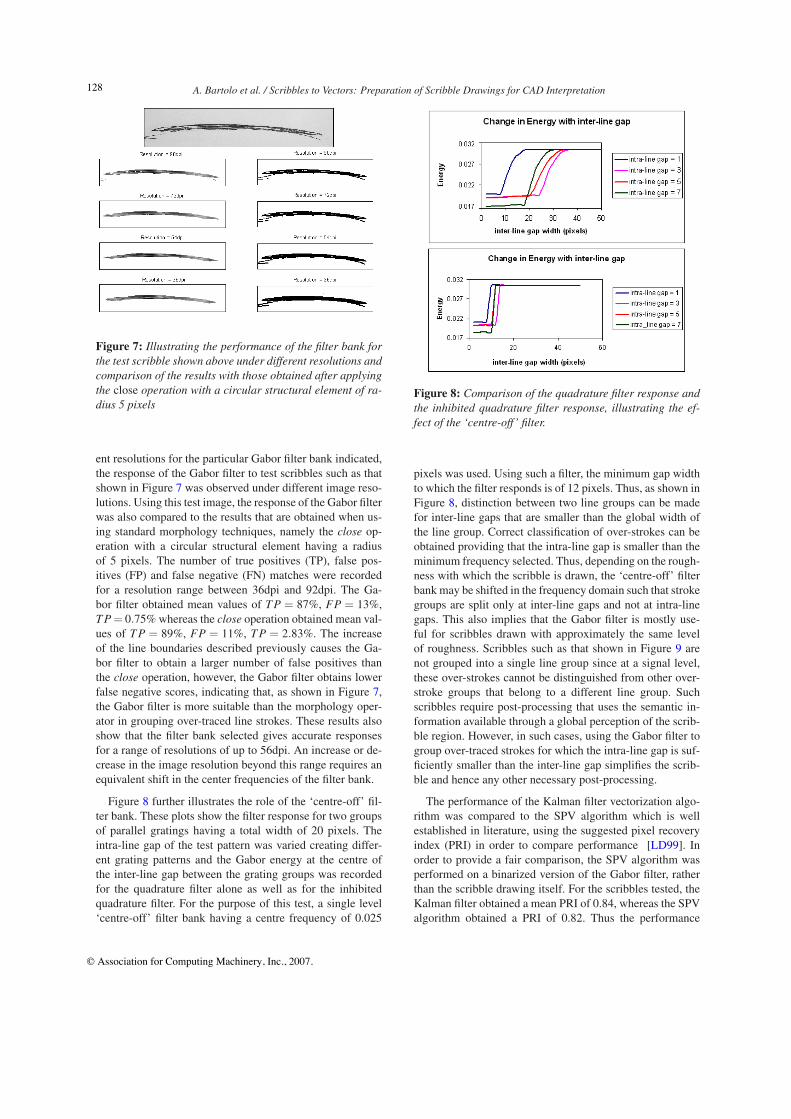
Figure 7: Illustrating the performance of the filter bank for
the test scribble shown above under different resolutions and
comparison of the results with those obtained after applying
the close operation with a circular structural element of ra-
dius 5 pixels
ent resolutions for the particular Gabor filter bank indicated,
the response of the Gabor filter to test scribbles such as that
shown in Figure 7 was observed under different image reso-
lutions. Using this test image, the response of the Gabor filter
was also compared to the results that are obtained when us-
ing standard morphology techniques, namely the close op-
eration with a circular structural element having a radius
of 5 pixels. The number of true positives (TP), false pos-
itives (FP) and false negative (FN) matches were recorded
for a resolution range between 36dpi and 92dpi. The Ga-
bor filter obtained mean values of T P = 87%, FP = 13%,
T P = 0.75% whereas the close operation obtained mean val-
ues of T P = 89%, FP = 11%, T P = 2.83%. The increase
of the line boundaries described previously causes the Ga-
bor filter to obtain a larger number of false positives than
the close operation, however, the Gabor filter obtains lower
false negative scores, indicating that, as shown in Figure 7,
the Gabor filter is more suitable than the morphology oper-
ator in grouping over-traced line strokes. These results also
show that the filter bank selected gives accurate responses
for a range of resolutions of up to 56dpi. An increase or de-
crease in the image resolution beyond this range requires an
equivalent shift in the center frequencies of the filter bank.
Figure 8 further illustrates the role of the ‘centre-off’ fil-
ter bank. These plots show the filter response for two groups
of parallel gratings having a total width of 20 pixels. The
intra-line gap of the test pattern was varied creating differ-
ent grating patterns and the Gabor energy at the centre of
the inter-line gap between the grating groups was recorded
for the quadrature filter alone as well as for the inhibited
quadrature filter. For the purpose of this test, a single level
‘centre-off’ filter bank having a centre frequency of 0.025
Figure 8: Comparison of the quadrature filter response and
the inhibited quadrature filter response, illustrating the ef-
fect of the ‘centre-off’ filter.
pixels was used. Using such a filter, the minimum gap width
to which the filter responds is of 12 pixels. Thus, as shown in
Figure 8, distinction between two line groups can be made
for inter-line gaps that are smaller than the global width of
the line group. Correct classification of over-strokes can be
obtained providing that the intra-line gap is smaller than the
minimum frequency selected. Thus, depending on the rough-
ness with which the scribble is drawn, the ‘centre-off’ filter
bank may be shifted in the frequency domain such that stroke
groups are split only at inter-line gaps and not at intra-line
gaps. This also implies that the Gabor filter is mostly use-
ful for scribbles drawn with approximately the same level
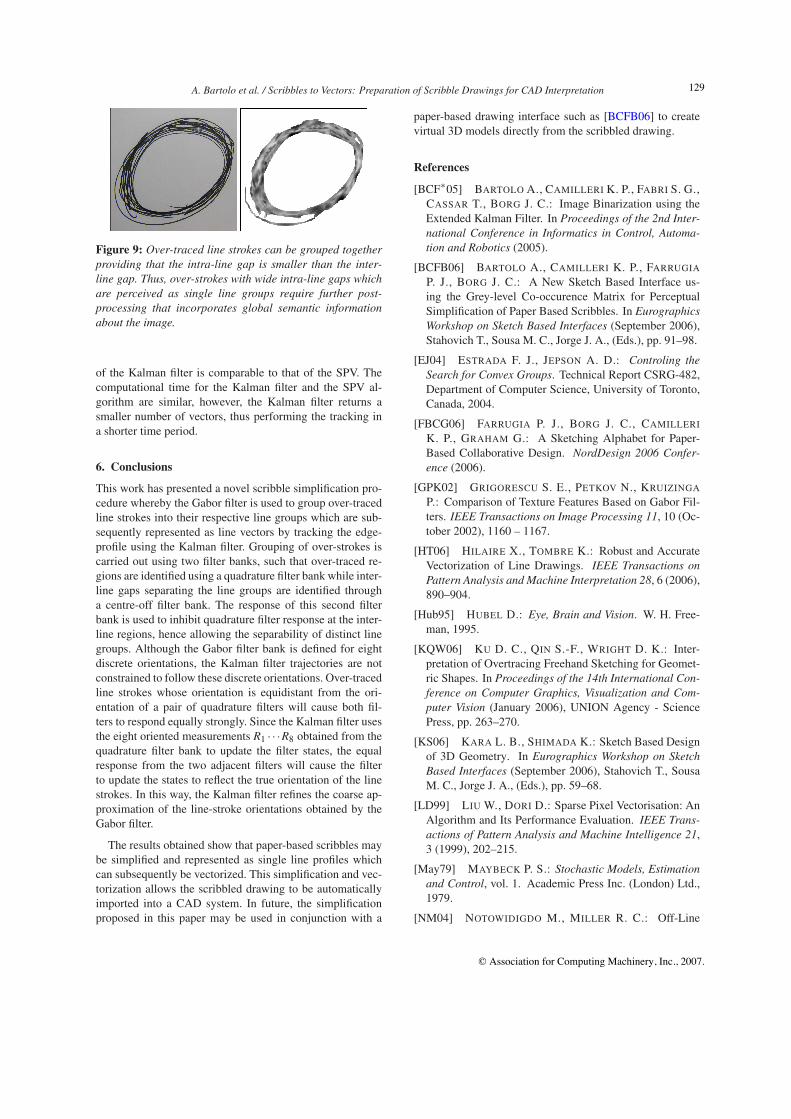
of roughness. Scribbles such as that shown in Figure 9 are
not grouped into a single line group since at a signal level,
these over-strokes cannot be distinguished from other over-
stroke groups that belong to a different line group. Such
scribbles require post-processing that uses the semantic in-
formation available through a global perception of the scrib-
ble region. However, in such cases, using the Gabor filter to
group over-traced strokes for which the intra-line gap is suf-
ficiently smaller than the inter-line gap simplifies the scrib-
ble and hence any other necessary post-processing.
The performance of the Kalman filter vectorization algo-
rithm was compared to the SPV algorithm which is well
established in literature, using the suggested pixel recovery
index (PRI) in order to compare performance [LD99]. In
order to provide a fair comparison, the SPV algorithm was
performed on a binarized version of the Gabor filter, rather
than the scribble drawing itself. For the scribbles tested, the
Kalman filter obtained a mean PRI of 0.84, whereas the SPV
algorithm obtained a PRI of 0.82. Thus the performance
128
© Association for Computing Machinery, Inc., 2007.
A. Bartolo et al. / Scribbles to Vectors: Preparation of Scribble Drawings for CAD Interpretation
Figure 9: Over-traced line strokes can be grouped together
providing that the intra-line gap is smaller than the inter-
line gap. Thus, over-strokes with wide intra-line gaps which
are perceived as single line groups require further post-
processing that incorporates global semantic information
about the image.
of the Kalman filter is comparable to that of the SPV. The
computational time for the Kalman filter and the SPV al-
gorithm are similar, however, the Kalman filter returns a
smaller number of vectors, thus performing the tracking in
a shorter time period.
6. Conclusions
This work has presented a novel scribble simplification pro-
cedure whereby the Gabor filter is used to group over-traced
line strokes into their respective line groups which are sub-
sequently represented as line vectors by tracking the edge-
profile using the Kalman filter. Grouping of over-strokes is
carried out using two filter banks, such that over-traced re-
gions are identified using a quadrature filter bank while inter-
line gaps separating the line groups are identified through
a centre-off filter bank. The response of this second filter
bank is used to inhibit quadrature filter response at the inter-
line regions, hence allowing the separability of distinct line
groups. Although the Gabor filter bank is defined for eight
discrete orientations, the Kalman filter trajectories are not
constrained to follow these discrete orientations. Over-traced
line strokes whose orientation is equidistant from the ori-
entation of a pair of quadrature filters will cause both fil-
ters to respond equally strongly. Since the Kalman filter uses
the eight oriented measurements R1 · · ·R8 obtained from the
quadrature filter bank to update the filter states, the equal
response from the two adjacent filters will cause the filter
to update the states to reflect the true orientation of the line
strokes. In this way, the Kalman filter refines the coarse ap-
proximation of the line-stroke orientations obtained by the
Gabor filter.
The results obtained show that paper-based scribbles may
be simplified and represented as single line profiles which
can subsequently be vectorized. This simplification and vec-
torization allows the scribbled drawing to be automatically
imported into a CAD system. In future, the simplification
proposed in this paper may be used in conjunction with a
paper-based drawing interface such as [BCFB06] to create
virtual 3D models directly from the scribbled drawing.
References
[BCF∗05] BARTOLO A., CAMILLERI K. P., FABRI S. G.,
CASSAR T., BORG J. C.: Image Binarization using the
Extended Kalman Filter. In Proceedings of the 2nd Inter-
national Conference in Informatics in Control, Automa-
tion and Robotics (2005).
[BCFB06] BARTOLO A., CAMILLERI K. P., FARRUGIA
P. J., BORG J. C.: A New Sketch Based Interface us-
ing the Grey-level Co-occurence Matrix for Perceptual
Simplification of Paper Based Scribbles. In Eurographics
Workshop on Sketch Based Interfaces (September 2006),
Stahovich T., Sousa M. C., Jorge J. A., (Eds.), pp. 91–98.
[EJ04] ESTRADA F. J., JEPSON A. D.: Controling the
Search for Convex Groups. Technical Report CSRG-482,
Department of Computer Science, University of Toronto,
Canada, 2004.
[FBCG06] FARRUGIA P. J., BORG J. C., CAMILLERI
K. P., GRAHAM G.: A Sketching Alphabet for Paper-
Based Collaborative Design. NordDesign 2006 Confer-
ence (2006).
[GPK02] GRIGORESCU S. E., PETKOV N., KRUIZINGA
P.: Comparison of Texture Features Based on Gabor Fil-
ters. IEEE Transactions on Image Processing 11, 10 (Oc-
tober 2002), 1160 – 1167.
[HT06] HILAIRE X., TOMBRE K.: Robust and Accurate
Vectorization of Line Drawings. IEEE Transactions on
Pattern Analysis and Machine Interpretation 28, 6 (2006),
890–904.
[Hub95] HUBEL D.: Eye, Brain and Vision. W. H. Free-
man, 1995.
[KQW06] KU D. C., QIN S.-F., WRIGHT D. K.: Inter-
pretation of Overtracing Freehand Sketching for Geomet-
ric Shapes. In Proceedings of the 14th International Con-
ference on Computer Graphics, Visualization and Com-
puter Vision (January 2006), UNION Agency - Science
Press, pp. 263–270.
[KS06] KARA L. B., SHIMADA K.: Sketch Based Design
of 3D Geometry. In Eurographics Workshop on Sketch
Based Interfaces (September 2006), Stahovich T., Sousa
M. C., Jorge J. A., (Eds.), pp. 59–68.
[LD99] LIU W., DORI D.: Sparse Pixel Vectorisation: An
Algorithm and Its Performance Evaluation. IEEE Trans-
actions of Pattern Analysis and Machine Intelligence 21,
3 (1999), 202–215.
[May79] MAYBECK P. S.: Stochastic Models, Estimation
and Control, vol. 1. Academic Press Inc. (London) Ltd.,
1979.
[NM04] NOTOWIDIGDO M., MILLER R. C.: Off-Line
129
© Association for Computing Machinery, Inc., 2007.
A. Bartolo et al. / Scribbles to Vectors: Preparation of Scribble Drawings for CAD Interpretation
Figure 10: The result obtained after using a centre-off filter bank to inhibit the Gabor energy response at the inter-line gaps.
Figures (a) to (d) give the original images, whilst Figures (e) to (h) give the Gabor filter results. Figures (i) to (l) give the results
obtained by the Kalman filter tracker while Figures (m) and (n) give show the traced trajectory superimposed on the original
image for the details highlighted by the red boxes in Figures (a) and (d) respectively
Sketch Interpretation. In AAAI Fall Symposium on Sketch
Understanding (2004), pp. 120–126.
[Sau03] SAUND E.: Finding Perceptually Closed Paths in
Sketches and Drawings. IEEE Transactions on Pattern
Analysis and Machine Intelligence 25, 9 (April 2003),
475–491.
[SD04] SEZGIN T. M., DAVIS R.: Handling Overtraced
Strokes in Hand-Drawn Sketches. Making Pen-Based In-
teraction Intelligent and Natural (2004), 1–2.
[SL97] SHPITALNI M., LIPSON H.: Classification of
Sketch Strokes and Corner Detection using Conic Sec-
tions and Adaptive Clustering. Journal of Mechanical
Design 119 (1997), 131–135.
[SSC∗02] SONG J., SU F., CHEN J., TAI C., CAI S.: An
Object-Oriented Progressive-Simplification-Based Vec-
torization System for Engineering Drawings: Model, Al-
gorithm, and Performance. IEEE Transactions of Pattern
Analysis and Machine Intelligence 24, 8 (2002).
130
© Association for Computing Machinery, Inc., 2007.
![Automatic Matting Using Edge Feature-Based Scribbles · manual scribbles. The red box is the current feature for automatic scribbles building. al. [7] use depth information from a](https://img.pdfslide.us/doc/110x75/5fd3a7e6bfc66961d250a029/automatic-matting-using-edge-feature-based-manual-scribbles-the-red-box-is-the.jpg)